a taxonomy of manufacturing and service firms in luxembourg ... · a taxonomy of manufacturing and...
TRANSCRIPT
Munich Personal RePEc Archive
A taxonomy of manufacturing and
service firms in Luxembourg according to
technological skills
El Joueidi, Sarah
1 September 2013
Online at https://mpra.ub.uni-muenchen.de/49532/
MPRA Paper No. 49532, posted 05 Sep 2013 14:00 UTC
Les articles publiés dans la série "Économie et statistiques" n'engagent que leurs auteurs. Ils ne reflètent pas forcément les vues du STATEC et n'engagent en rien sa responsabilité.
68 Economie et Statistiques Working papers du STATEC
Septembre 2013
Auteur: Sarah El Joueidi, University of Luxembourg and Statec
A taxonomy of manufacturing and service firms in Luxembourg according to technological skills
Abstract This study uses data on Luxembourg manufacturing and service firms, sourced from CIS, to illustrate empirical methods of firms’ classification according to pattern and intensity of innovation and the use of technology. This topic is of relevance to Luxembourg, as to date no such specific classification exists for this country. Existing classifications are industry-based rather than firm-based which appears inappropriate given the heterogeneity within Luxembourgish industries. Moreover, they neglect the financial services, of primary importance to Luxembourg.
Results show that cluster methods are well suited to classify firms for the case at hand. The analysis identifies four clusters exploiting information on the firms' innovation competencies, the technology used, and the human skills. Firms in the sample are classified into 4 groups, named respectively as i) high-technology, ii) medium-high-technology, iii) medium-low-technology, iv) low-technology. Characteristics of each group are discussed.
KEY WORDS: Innovation, classification, taxonomy, innovation surveys, cluster analysis.

Economie et Statistiques Working papers du STATEC N° 68 Septembre 2013
A taxonomy of manufacturing and service firms in Luxembourg according to technological skills
2
Acknowledgements
This working paper presents results from my master thesis, which was carried out in Statec in the unit EPR2.
I would like to take this opportunity to thank all the people who have contributed in some way to this paper. Firstly, Dr Chiara PERONI who supervised and mentored my work, for her attention, and for all the time she awarded to me, her advice was really useful and appreciated.
Secondly, Dr Pierre PICARD who helped me realizing this work and who gave me all his attention.
Finally, I would like to thank the STATEC who gave me the opportunity to realize this thesis, especially Mr Guy SCHULLER and Dr Anne DUBROCARD. I am also grateful to all the members of STATEC/ANEC, especially Leila BEN AOUN, Dr Wladimir RAYMOND and Dr Charles-Henri DIMARIA who were always ready to help me.
Economie et Statistique
Working Papers du STATEC N 68Septembre 2013
A taxonomy of manufacturing and service firmsin Luxembourg according to technological skills
Innovation is an important determinant of economic growth [Solow, 1956, Romer, 1991].
Developed economies are evolving into “knowledge economies where skills, human capital, and
innovativeness are prerequisites for success" (Baldwin and Gellatly [2000]). Thus, governments
are interested in adopting policy measures to foster innovation and growth. Although techno-
logical and innovation activities are decided and controlled by the firms, availability of public
funding and new regulations can provide incentives for firms to innovate, and thus to enhance
efficiency and technical progress.
The innovation process, however, is not uniform across industries/firms. As a result, the
impact of innovation policies may vary across group of firms. (For example, firms in certain
industries might be more likely to innovate due to spillover effects or increased competition
within that industry.) To account for this heterogeneity, studies on the relation between inno-
vation and economic performance (as measured by productivity, competitiveness, growth) often
classify firms or industries according to the technological skills and content of their activities.
Popular classifications are those proposed by Pavitt [1984] and Hatzichronoglou [1997]. Studies
on the relation between economic performance and innovation have been carried out also for
Luxembourg [Asikainen, 2008, Peroni and Ferreira, 2012]. These studies use industry dummies
or existing classifications. Existing classifications, however, have drawbacks. All available clas-
sifications are industry-based rather than firm-based, that is, they assign a technological content
to firms according to the industry they belong, which in turn is determined by internationally-
agreed classifications of economic activities (NACE coding). This is inappropriate whenever
industries are heterogeneous, as it is the case for Luxembourg. Moreover, existing classifica-
tions are mostly concerned with manufacturing industries; they neglect the rapidly growing
service industries, which account for a large share of value added in western economies. Lux-
embourg is a small very open economy which is characterised by a rate of exports of goods and
services equal to 165% of GDP in comparison to an average of 40.6% for the Euro area in 20101.
Furthermore, 46.1% of firms report to sell more goods and services in international market than
in national market2. Luxembourg economy is also highly specialised and dominated by banking
activities, insurances and investment funds; the financial industries account for about 30% of
value added (OECD [2008]). According to Peroni [2012] who analyses the productivity and
competitiveness in Luxembourg from 1995-2010, Luxembourg is on the frontier that measures
productive efficiency (the country uses inputs in a fully efficient way since 1995). As a result, the
sole manner to improve competitiveness is to achieve a sustained rate of technological progress
which implies a high innovation effort.
Thus, this article develops a specific classification of the technological intensity of Luxem-
1Net exports of goods and services for Luxembourg are 7.73% of GDP and -0.3% of GDP for the Euro area.Data are from The World Bank for 2010.
2Source : Data are from Community Innovation Survey for 2004-2006.
1
Economie et Statistique
Working Papers du STATEC N 68Septembre 2013
A taxonomy of manufacturing and service firmsin Luxembourg according to technological skills
bourgish economic activities which covers both service and manufacturing industries and is firm-
rather than industry based. The goal is to provide an empirical tool which better accounts for
the characteristics of Luxembourg’s economy recalled above (heterogeneity within industries
and relevance of services). This is achieved by applying data-driven statistical techniques to
innovation survey data. In particular, we apply cluster analysis to the data. Cluster analysis
is an exploratory data analysis technique which seeks to uncover groups (or "clusters") in data
(Everitt and Rabe-Hesketh [2007]). The idea is, by and large, to minimise some measure of
"distance" within a group and maximise the distance between the groups, using some formal
statistical criteria.
The article shows that this statistical technique is useful to develop and adapt existing firms
classifications to service-oriented small open economies. The tool could be useful in evaluating
firms characteristics and could also be applied in studies of the relation between innovation and
economic outcomes.
The classification method presented in this article is based on a multidimensional approach
due to Baldwin and Gellatly [2000]. The main idea is to view technological skills/contents as
the results of several activities/processes, rather than summarising it with a single variable (for
example, the widely used R&D intensity). In contrast, the relevant variables in this analysis
are chosen to measure the following dimensions:
1. Innovation competencies; the ability to improve or introduce new products or processes.
2. Technology used; the capacity to apply advanced technologies.
3. Human capital development; the ability to develop human capital strategies such as hiring
skilled workers or developing training programs to allow employees to work with the new
technology developed or used.
After a concise review of the literature (section 1) and a data overview (section 2), section 3
gives details of the method used to achieve the classification of Luxembourgish firms. Section 4
gives the classification of Luxembourgish firms. Finally, section 5 gives concluding remarks and
discusses possible application of the tool developed by this research.
1 Taxonomies in the economic literature
The economic literature propose different methods to achieve classifications of firms or industries
based on technological skills. Peneder [2003] argues that there are two reasons for the creation
2
Economie et Statistique
Working Papers du STATEC N 68Septembre 2013
A taxonomy of manufacturing and service firmsin Luxembourg according to technological skills
and use of industry taxonomies: first, "industrial taxonomies facilitate investigations into the
impact of specific characteristics of the market environment on the economic activity" (Peneder
[2003]). So, classifications are interesting "per-se", they condense all information about techno-
logical skills of industries and they allow to identify similarities and differences between indus-
tries. Taxonomies are also useful to compare data with different format across countries. Despite
the benefits of taxonomies, in the field of economics, unlike in biology, psychology or sociology,
there is little methodological discussion about it. In the literature, industry classifications are
used in empirical studies on competitive performance (e.g.: Aghion et al. [2005]), technological
development (e.g.: Malerba and Orsenigo [1999]), international trade (e.g.: Lawrence [1984]),
and industrial economics (e.g.: Davies and Lyons [1996]). In competitive performance studies,
research tries to find whether there is or not a relationship between competition and innovation
using a classification of industries to control the fixed effect of the behaviour of industries to in-
novate (OECD3). Concerning, the technological development field, Malerba and Orsenigo [1999]
study the technological development of industries. Thus, they compare industries classification
based on the process of innovation during several periods. International trade studies factor
intensities such as capital, labor, or natural resource. This field classifies goods in two groups:
Ricardo goods, which needs resource intensively to be produced and Hecksher-Ohlin, goods
which use standardized production technologies. To this classification, Lawrence [1984] adds a
group of high technology goods, which is characterized by a high amount of R&D expenditures
to be produced. In industrial organisation, Davies and Lyons [1996] try to see the impact of
competitive mechanisms on concentration, integration, diversification and multi-nationality. To
do so, they created a taxonomy which groups industries according to the intensity of intangible
R&D expenditures.
The best known taxonomy is the Pavitt classification, which classifies manufacturing indus-
tries in four main categories: supplier dominated, production intensive, specialized suppliers,
and science based (the first one is the least innovative group). Pavitt [1984] argues that different
principal activities generate different technological behaviours. These differences in technologi-
cal behaviour are explained by sectoral differences in three characteristics: sources of technology,
requirement of users, and means of appropriating benefits. Archibugi [2000] first highlighted
that Pavitt’s classification presents some drawbacks. First, Pavitt’s taxonomy classifies only
innovating firms. It does not take into account non-innovative firms. Moreover, some papers
[Geroski et al., 1997, Malerba and Orsenigo, 1999] demonstrate that the intensity and persistence
of innovation varies highly during the years. Hence, excluding non-innovative firms prevents us
from analysing the change in the innovation behaviour of firms. Second, for convenience, Pavitt
[1984] groups firms into industries on the basis of their main output. However, industries’ clas-
3The project "Market incentives to innovate", OECD Working Party on Industry Analysis- OECD-WPIA.
3
Economie et Statistique
Working Papers du STATEC N 68Septembre 2013
A taxonomy of manufacturing and service firmsin Luxembourg according to technological skills
sification does not take into account the heterogeneity within the industry. Indeed, Archibugi
[2000] argues that "two firms can be in the same industry without using the same technological
base; e.g. slippers and moon-boots belong to the footwear industry". Pavitt [1984] rightly states
about his taxonomy "its weakness is the high degree of variance found within each category".
The second important classification is the OECD taxonomy revised by Hatzichronoglou
[1997] using research and development (R&D) intensity as an indicator of innovation. The aim
of this classification is to try to identify the technological intensity of manufacturing industries
to analyse the impact of technology on industrial performance. Indeed, Hatzichronoglou [1997]
argues that firms which are technology-intensive innovate more, win new markets, are more
productive and offer higher remuneration to their employees. Hence, to be able to compete on
international trade an industry should be an innovating one. Moreover, an innovating sector
could lead to an improvement in performance for other sectors by spillover effect (externalities).
The above classifications are mainly concerned with manufacturing data and group industry
rather than firms. This makes the application to Luxembourg data problematic. Indeed, Lux-
embourg’s financial sector is the main driver of the Luxembourg economy and it is characterised
by heterogeneity in structures between manufacturing and services sector and heterogeneity in
technological behavior within each industry.
The service industry accounts for two thirds of the economy’s value added with a financial
industry which represents 26,3% of value added and 11% of total employment. The financial
industry boosts not only the employment growth rate in this industry, but also in related ac-
tivities of business services such as providers of computer services and audit firms. According
to the OECD [2008], Luxembourg is an important financial center in the world. Luxembourg
is the first in Europe in terms of amount of assets managed by investment funds with 25% of
the European market. Moreover, Luxembourg ranks third among the most important financial
centers, after Switzerland and the Caribbean Islands (Cayman), in terms of market share in
the field of international wealth management. Thus, to preserve this important rank among in-
ternational financial centers, and because all inputs are already used efficiently (Peroni [2012]),
financial firms should be more innovative. The latter statement is consistent with the Commu-
nity Innovation Survey (CIS) for 2006 which highlights that more than 65% of financial firms
are engaged in innovation activities (see table 2).
The structure of manufacturing and services industries are quite different. Luxembourg’s ser-
vices industry contains a large number of small firms whereas manufacturing industries are
often dominated by few big firms alongside of several small firms (Peroni [2012]). Indeed, there
are 853 manufacturing firms which account for 3.2% of total firms opposing to 19 600 services
4
Economie et Statistique
Working Papers du STATEC N 68Septembre 2013
A taxonomy of manufacturing and service firmsin Luxembourg according to technological skills
firms which represent 73.6% of total firms. 12% of manufacturing firms employ more than
50 employees. In contrast, there are only 1.88% of services firms which employ more than 50
workers4. Moreover, an industry-based classification according to technological skills can lead
to within industries heterogeneity in technological behaviour. Indeed, due to data availability
in Luxembourg, computations are performed at NACE5 2-digit level, which means a high level
of aggregation and leads to heterogeneity. Thus, some high-tech firms can be found in branches
regarded by Pavitt’s or the OECD classification as low-innovations ones.
To overcome these difficulties, we propose a classification based on technological skills applied
at firm level for both manufacturing and services industries.
2 A first description of Luxembourg firms
This article classifies firms surveyed in Luxembourg’s Community Innovation Survey (CIS)
for the year 2006-2008. The CIS includes variables describing the effort and the output of
innovation, such as product and process innovation, innovation activity and expenditures, effects
of innovation, organisational innovation, marketing innovation, knowledge management, etc.6
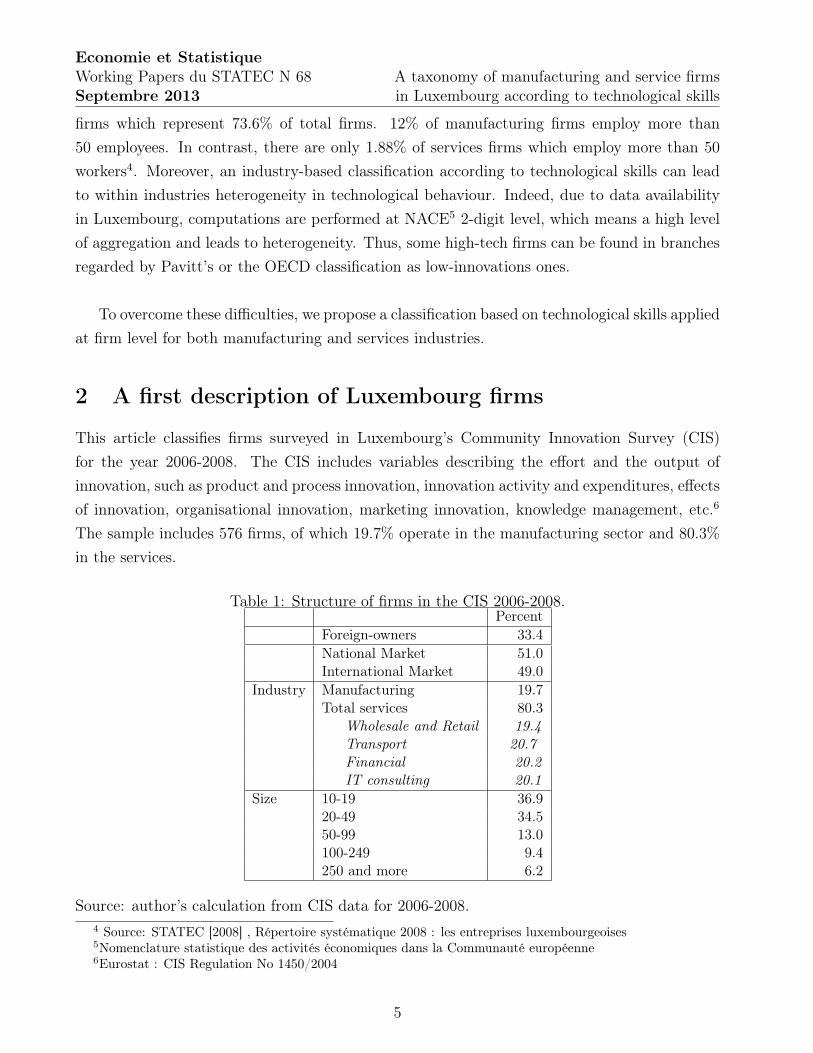
The sample includes 576 firms, of which 19.7% operate in the manufacturing sector and 80.3%
in the services.
Table 1: Structure of firms in the CIS 2006-2008.Percent
Foreign-owners 33.4
National Market 51.0International Market 49.0
Industry Manufacturing 19.7Total services 80.3
Wholesale and Retail 19.4
Transport 20.7
Financial 20.2
IT consulting 20.1
Size 10-19 36.920-49 34.550-99 13.0100-249 9.4250 and more 6.2
Source: author’s calculation from CIS data for 2006-2008.
4 Source: STATEC [2008] , Répertoire systématique 2008 : les entreprises luxembourgeoises5Nomenclature statistique des activités économiques dans la Communauté européenne6Eurostat : CIS Regulation No 1450/2004
5
Economie et Statistique
Working Papers du STATEC N 68Septembre 2013
A taxonomy of manufacturing and service firmsin Luxembourg according to technological skills
Table 1 shows that 33.4% of firms have their headquarters abroad and thus can be cate-
gorized as foreign-owned enterprises. 49.0% of firms have as primary market the international
market, whereas 51.0% of firms earn the majority of their turnover in Luxembourg. The services
industry in Luxembourg counts for 80.3% of total firms. Concerning the size of the firms in
Luxembourgish economy, 71.4% firms have between 10 and 49 employees (data are available
from the authors).
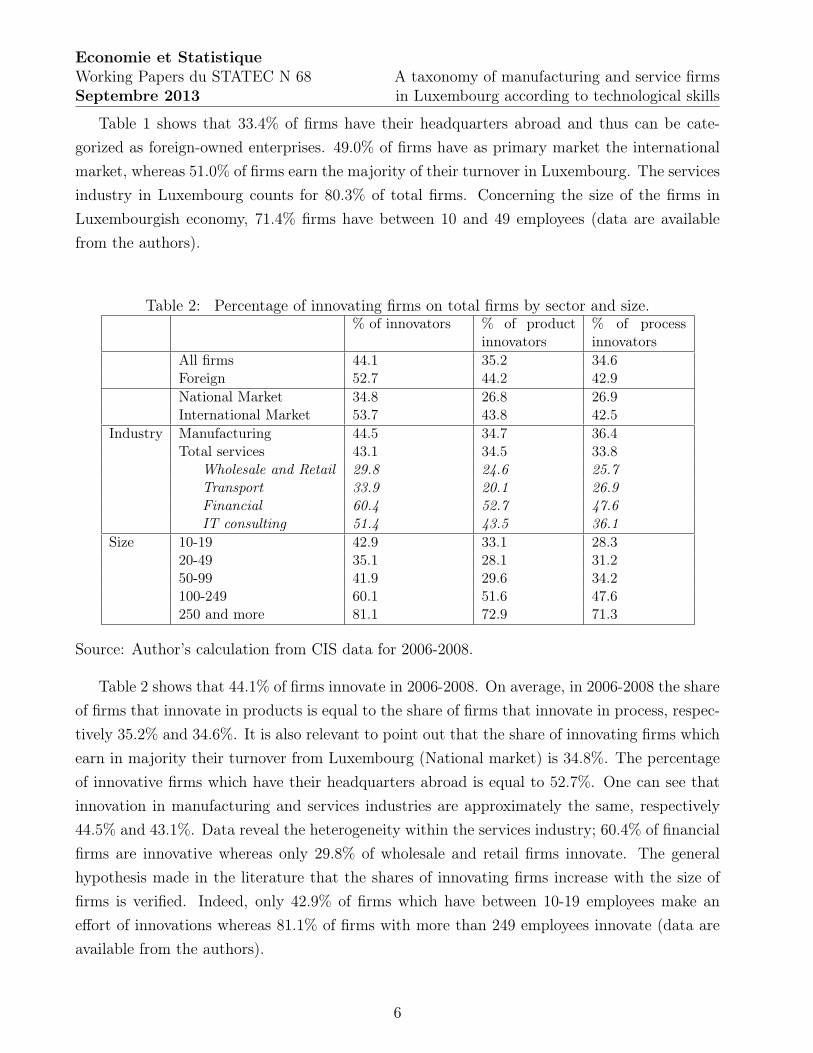
Table 2: Percentage of innovating firms on total firms by sector and size.% of innovators % of product
innovators% of processinnovators
All firms 44.1 35.2 34.6Foreign 52.7 44.2 42.9
National Market 34.8 26.8 26.9International Market 53.7 43.8 42.5
Industry Manufacturing 44.5 34.7 36.4Total services 43.1 34.5 33.8
Wholesale and Retail 29.8 24.6 25.7
Transport 33.9 20.1 26.9
Financial 60.4 52.7 47.6
IT consulting 51.4 43.5 36.1
Size 10-19 42.9 33.1 28.320-49 35.1 28.1 31.250-99 41.9 29.6 34.2100-249 60.1 51.6 47.6250 and more 81.1 72.9 71.3
Source: Author’s calculation from CIS data for 2006-2008.
Table 2 shows that 44.1% of firms innovate in 2006-2008. On average, in 2006-2008 the share
of firms that innovate in products is equal to the share of firms that innovate in process, respec-
tively 35.2% and 34.6%. It is also relevant to point out that the share of innovating firms which
earn in majority their turnover from Luxembourg (National market) is 34.8%. The percentage
of innovative firms which have their headquarters abroad is equal to 52.7%. One can see that
innovation in manufacturing and services industries are approximately the same, respectively
44.5% and 43.1%. Data reveal the heterogeneity within the services industry; 60.4% of financial
firms are innovative whereas only 29.8% of wholesale and retail firms innovate. The general
hypothesis made in the literature that the shares of innovating firms increase with the size of
firms is verified. Indeed, only 42.9% of firms which have between 10-19 employees make an
effort of innovations whereas 81.1% of firms with more than 249 employees innovate (data are
available from the authors).
6
Economie et Statistique
Working Papers du STATEC N 68Septembre 2013
A taxonomy of manufacturing and service firmsin Luxembourg according to technological skills
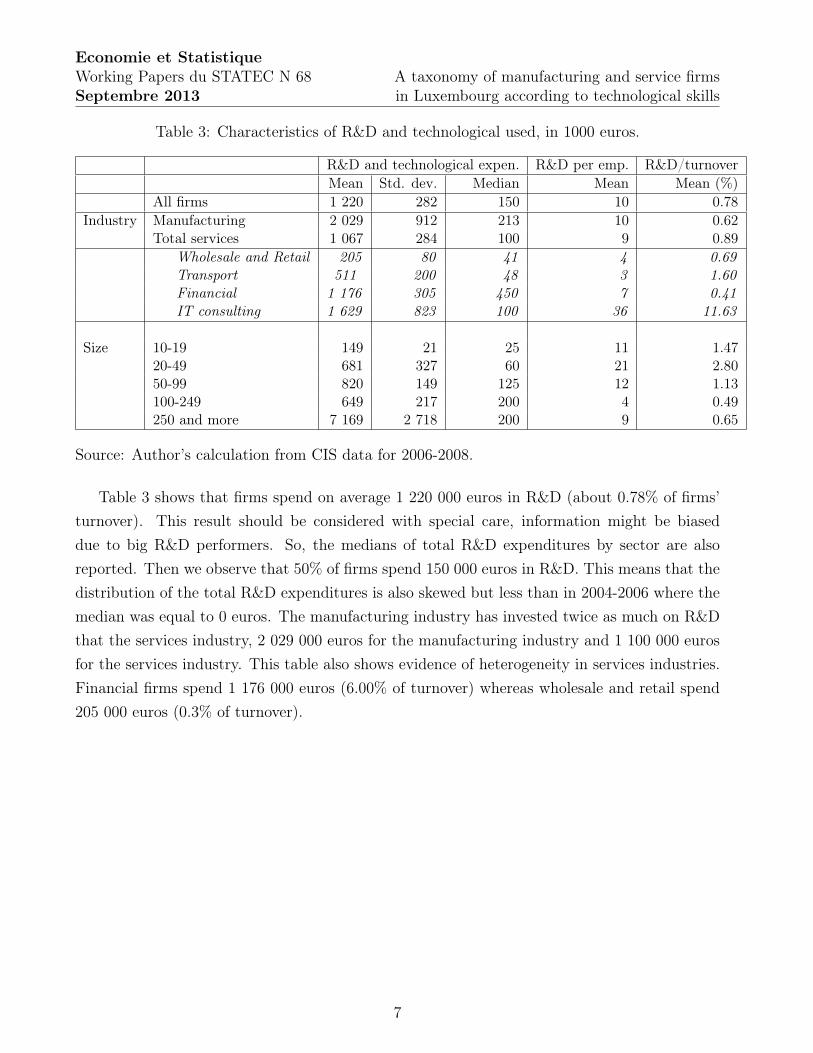
Table 3: Characteristics of R&D and technological used, in 1000 euros.
R&D and technological expen. R&D per emp. R&D/turnover
Mean Std. dev. Median Mean Mean (%)
All firms 1 220 282 150 10 0.78
Industry Manufacturing 2 029 912 213 10 0.62Total services 1 067 284 100 9 0.89
Wholesale and Retail 205 80 41 4 0.69
Transport 511 200 48 3 1.60
Financial 1 176 305 450 7 0.41
IT consulting 1 629 823 100 36 11.63
Size 10-19 149 21 25 11 1.4720-49 681 327 60 21 2.8050-99 820 149 125 12 1.13100-249 649 217 200 4 0.49250 and more 7 169 2 718 200 9 0.65
Source: Author’s calculation from CIS data for 2006-2008.
Table 3 shows that firms spend on average 1 220 000 euros in R&D (about 0.78% of firms’
turnover). This result should be considered with special care, information might be biased
due to big R&D performers. So, the medians of total R&D expenditures by sector are also
reported. Then we observe that 50% of firms spend 150 000 euros in R&D. This means that the
distribution of the total R&D expenditures is also skewed but less than in 2004-2006 where the
median was equal to 0 euros. The manufacturing industry has invested twice as much on R&D
that the services industry, 2 029 000 euros for the manufacturing industry and 1 100 000 euros
for the services industry. This table also shows evidence of heterogeneity in services industries.
Financial firms spend 1 176 000 euros (6.00% of turnover) whereas wholesale and retail spend
205 000 euros (0.3% of turnover).
7
Economie et Statistique
Working Papers du STATEC N 68Septembre 2013
A taxonomy of manufacturing and service firmsin Luxembourg according to technological skills
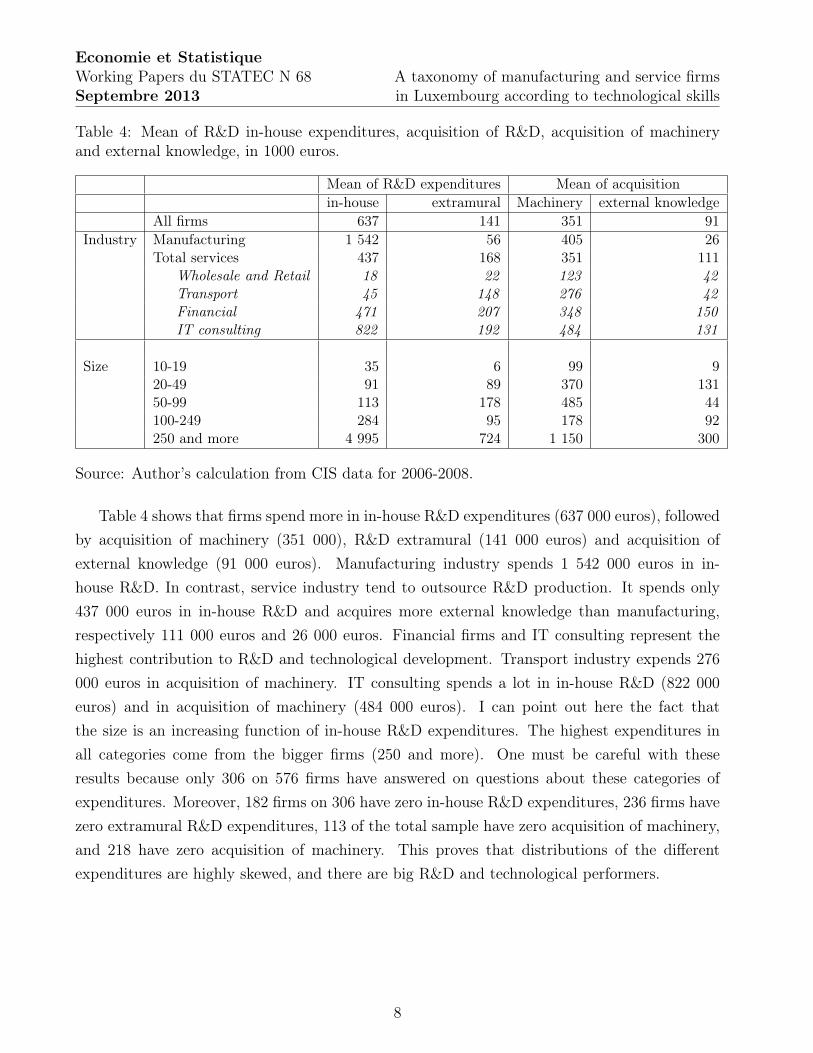
Table 4: Mean of R&D in-house expenditures, acquisition of R&D, acquisition of machineryand external knowledge, in 1000 euros.
Mean of R&D expenditures Mean of acquisition
in-house extramural Machinery external knowledge
All firms 637 141 351 91
Industry Manufacturing 1 542 56 405 26Total services 437 168 351 111
Wholesale and Retail 18 22 123 42
Transport 45 148 276 42
Financial 471 207 348 150
IT consulting 822 192 484 131
Size 10-19 35 6 99 920-49 91 89 370 13150-99 113 178 485 44100-249 284 95 178 92250 and more 4 995 724 1 150 300
Source: Author’s calculation from CIS data for 2006-2008.
Table 4 shows that firms spend more in in-house R&D expenditures (637 000 euros), followed
by acquisition of machinery (351 000), R&D extramural (141 000 euros) and acquisition of
external knowledge (91 000 euros). Manufacturing industry spends 1 542 000 euros in in-
house R&D. In contrast, service industry tend to outsource R&D production. It spends only
437 000 euros in in-house R&D and acquires more external knowledge than manufacturing,
respectively 111 000 euros and 26 000 euros. Financial firms and IT consulting represent the
highest contribution to R&D and technological development. Transport industry expends 276
000 euros in acquisition of machinery. IT consulting spends a lot in in-house R&D (822 000
euros) and in acquisition of machinery (484 000 euros). I can point out here the fact that
the size is an increasing function of in-house R&D expenditures. The highest expenditures in
all categories come from the bigger firms (250 and more). One must be careful with these
results because only 306 on 576 firms have answered on questions about these categories of
expenditures. Moreover, 182 firms on 306 have zero in-house R&D expenditures, 236 firms have
zero extramural R&D expenditures, 113 of the total sample have zero acquisition of machinery,
and 218 have zero acquisition of machinery. This proves that distributions of the different
expenditures are highly skewed, and there are big R&D and technological performers.
8
Economie et Statistique
Working Papers du STATEC N 68Septembre 2013
A taxonomy of manufacturing and service firmsin Luxembourg according to technological skills
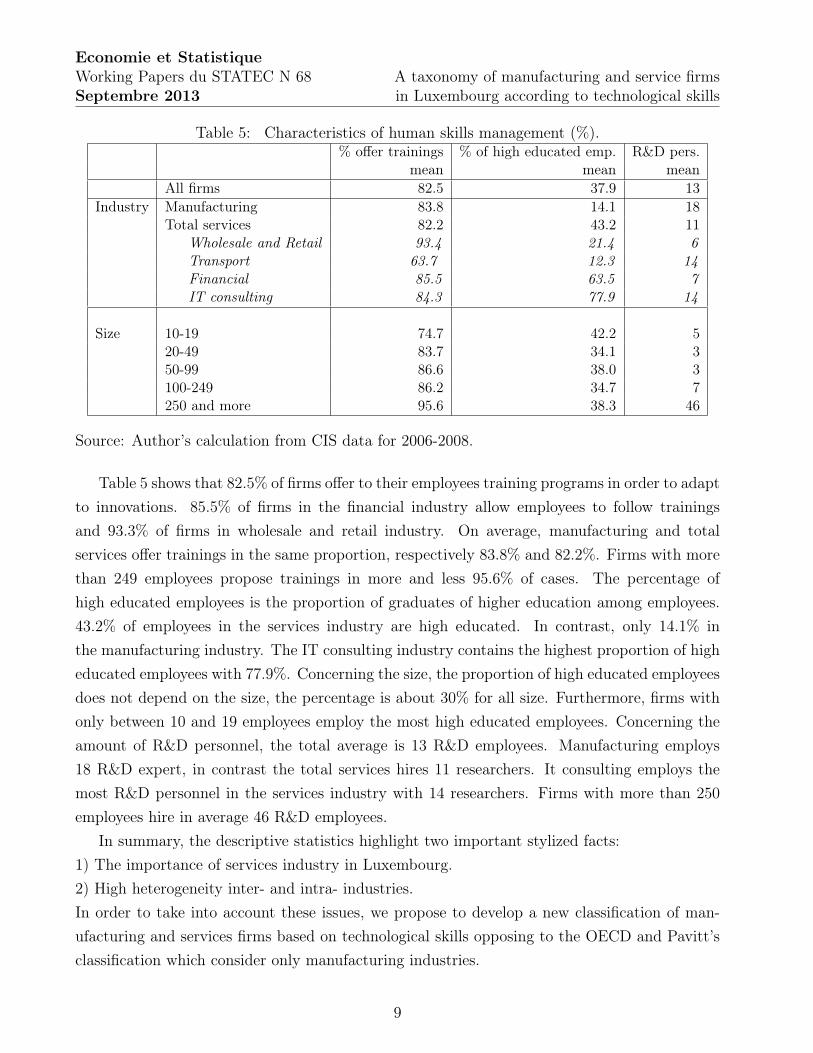
Table 5: Characteristics of human skills management (%).% offer trainings % of high educated emp. R&D pers.
mean mean mean
All firms 82.5 37.9 13
Industry Manufacturing 83.8 14.1 18Total services 82.2 43.2 11
Wholesale and Retail 93.4 21.4 6
Transport 63.7 12.3 14
Financial 85.5 63.5 7
IT consulting 84.3 77.9 14
Size 10-19 74.7 42.2 520-49 83.7 34.1 350-99 86.6 38.0 3100-249 86.2 34.7 7250 and more 95.6 38.3 46
Source: Author’s calculation from CIS data for 2006-2008.
Table 5 shows that 82.5% of firms offer to their employees training programs in order to adapt
to innovations. 85.5% of firms in the financial industry allow employees to follow trainings
and 93.3% of firms in wholesale and retail industry. On average, manufacturing and total
services offer trainings in the same proportion, respectively 83.8% and 82.2%. Firms with more
than 249 employees propose trainings in more and less 95.6% of cases. The percentage of
high educated employees is the proportion of graduates of higher education among employees.
43.2% of employees in the services industry are high educated. In contrast, only 14.1% in
the manufacturing industry. The IT consulting industry contains the highest proportion of high
educated employees with 77.9%. Concerning the size, the proportion of high educated employees
does not depend on the size, the percentage is about 30% for all size. Furthermore, firms with
only between 10 and 19 employees employ the most high educated employees. Concerning the
amount of R&D personnel, the total average is 13 R&D employees. Manufacturing employs
18 R&D expert, in contrast the total services hires 11 researchers. It consulting employs the
most R&D personnel in the services industry with 14 researchers. Firms with more than 250
employees hire in average 46 R&D employees.
In summary, the descriptive statistics highlight two important stylized facts:
1) The importance of services industry in Luxembourg.
2) High heterogeneity inter- and intra- industries.
In order to take into account these issues, we propose to develop a new classification of man-
ufacturing and services firms based on technological skills opposing to the OECD and Pavitt’s
classification which consider only manufacturing industries.
9
Economie et Statistique
Working Papers du STATEC N 68Septembre 2013
A taxonomy of manufacturing and service firmsin Luxembourg according to technological skills
3 Methodology
This paper uses a multidimensional technological skills approach. Technological skills have
different meanings in the economic literature. A classification may focus on innovation output,
measured by the amount of product or process innovations, patents or other protection methods.
It can be also based on innovation input as Research and Development expenditures. Moreover,
it could focus on the level of education of employees in a firm. One may also argue that a
firm can be considered as a technology-intensive firm if it uses advanced technology to produce
its product or services. Unidimensional classifications have several drawbacks because they
consider that there is a sole variable which is able to summarise characteristics of technological
skills. To solve this issue we suggest using the approach of Baldwin and Gellatly [2000] who
consider more than one characteristic to define a high-technology firm.
We indentify three groups of technological competencies as follows:
Innovation competencies
Innovation is also not easily determined in one variable. Innovation may be measured in term
of input or output or in terms of new products or new processes. To take into account the
diversity of innovation competencies, we consider seven variables which capture a different, but
related aspects of innovation.
The first variable in table 6 represents the input oriented measure which is the in-house R&D
amount. More the amount of R&D is high, more the firm is considered as innovative.
The second set of variables captures the output oriented measures, it describes whether a firm is
only a product innovator or process innovator, or if the firm has produced new product and new
process. The OECD (Oslo manual, 2005) defines product innovation as "a good or service that
is new or significantly improved. This includes significant improvements in technical specifica-
tions, components and materials, software in the product, user friendliness or other functional
characteristics", and process innovation as "a new or significantly improved production or de-
livery method. This includes significant changes in techniques, equipment and/or software."
Innovation competencies contain also the variable in which the firm indicates whether these in-
novations are protected by intellectual property rights as patents, registration of design patterns,
trademarks, copyright, and secrecy. Finally, the last set of variables in innovation competencies
in table 6 related to innovation are outcome measures. It includes the cost reduction generated
by process innovations and the percentage of turnover produced by product innovations. These
two measures explain the impact of an innovation on the profit of the firm.
10
Economie et Statistique
Working Papers du STATEC N 68Septembre 2013
A taxonomy of manufacturing and service firmsin Luxembourg according to technological skills
Technology used
The second advanced skill focuses on the technology used. This concept explains the impor-
tance that a firm accords to the technology. Some firms do not innovate but may use state
of art technology. To capture the technology bought by a firm, three variables are considered:
acquisition of R&D (extramural R&D), acquisition of machinery, equipment and software and
acquisition of external knowledge. A firm which spends an important amount in these different
types of acquisitions, even if it does not innovate but it uses state-of-art technology.
Human skills
The final set of variables in table 6 is related to workers skills. Here, the ability of firms to im-
prove the skills of their employees using training programs or hiring skilled workers is considered.
Indeed, the outcome of innovation is higher if the workers are skilled. Baldwin and Johnson
[1996] show that innovators in both goods and services sectors pursue more a human-capital
strategy. In the goods sector expenditures in R&D or acquisition of machinery and equipment is
often followed by an emphasis on training. In the services sector, the innovation strategy often
is human-resources strategy, firms employ more skilled workers. To capture the effort of a firm
in human skills, three variables are considered: Training for your personnel which capture the
idea whether or not a firm tries to improve the capacity of its workers, proportion of graduates
of higher education among employees and total R&D personnel.
The following table summarises the variables used to proxy technological skills. Furthermore,
to control for specific firms’ characteristics, we propose to add the size of the firm, the market
in which a firm sells more products or services (national, Greater Region, Europe, and others),
and the industry (manufacturing or service).
Thus, the table below lists the variables and their format:
11
Economie et Statistique
Working Papers du STATEC N 68Septembre 2013
A taxonomy of manufacturing and service firmsin Luxembourg according to technological skills
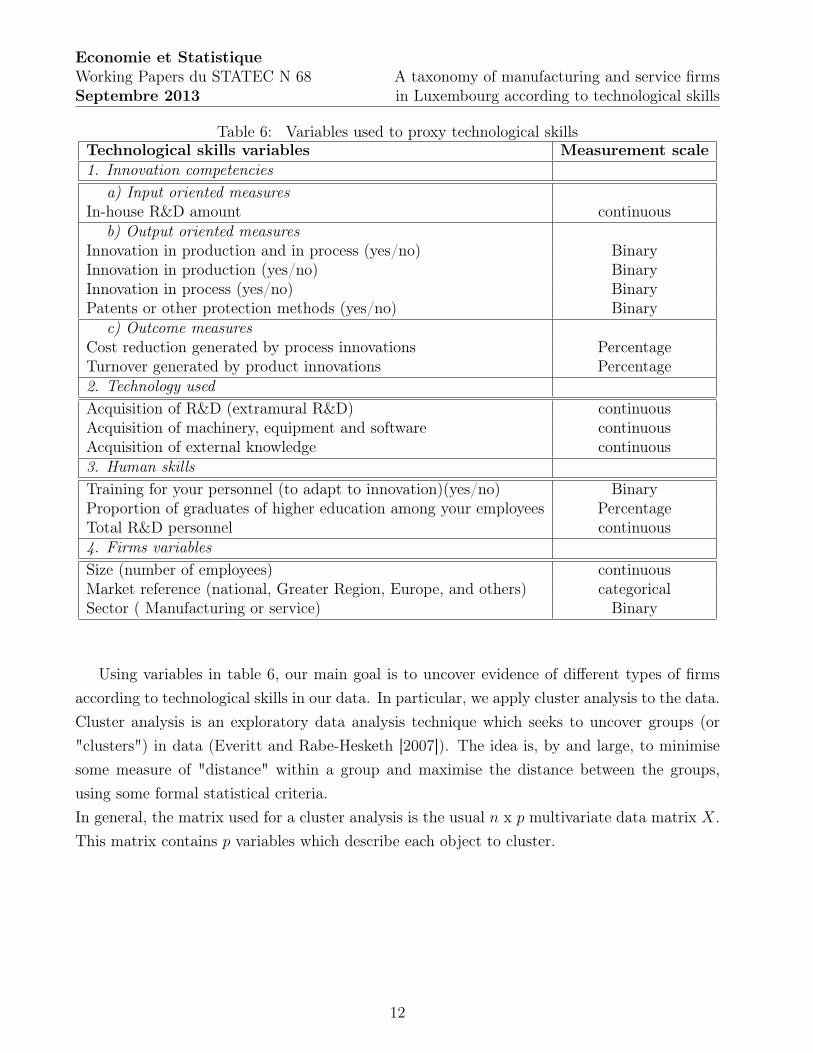
Table 6: Variables used to proxy technological skillsTechnological skills variables Measurement scale
1. Innovation competencies
a) Input oriented measuresIn-house R&D amount continuous
b) Output oriented measuresInnovation in production and in process (yes/no) BinaryInnovation in production (yes/no) BinaryInnovation in process (yes/no) BinaryPatents or other protection methods (yes/no) Binary
c) Outcome measuresCost reduction generated by process innovations PercentageTurnover generated by product innovations Percentage2. Technology used
Acquisition of R&D (extramural R&D) continuousAcquisition of machinery, equipment and software continuousAcquisition of external knowledge continuous3. Human skills
Training for your personnel (to adapt to innovation)(yes/no) BinaryProportion of graduates of higher education among your employees PercentageTotal R&D personnel continuous4. Firms variables
Size (number of employees) continuousMarket reference (national, Greater Region, Europe, and others) categoricalSector ( Manufacturing or service) Binary
Using variables in table 6, our main goal is to uncover evidence of different types of firms
according to technological skills in our data. In particular, we apply cluster analysis to the data.
Cluster analysis is an exploratory data analysis technique which seeks to uncover groups (or
"clusters") in data (Everitt and Rabe-Hesketh [2007]). The idea is, by and large, to minimise
some measure of "distance" within a group and maximise the distance between the groups,
using some formal statistical criteria.
In general, the matrix used for a cluster analysis is the usual n x p multivariate data matrix X.
This matrix contains p variables which describe each object to cluster.
12
Economie et Statistique
Working Papers du STATEC N 68Septembre 2013
A taxonomy of manufacturing and service firmsin Luxembourg according to technological skills
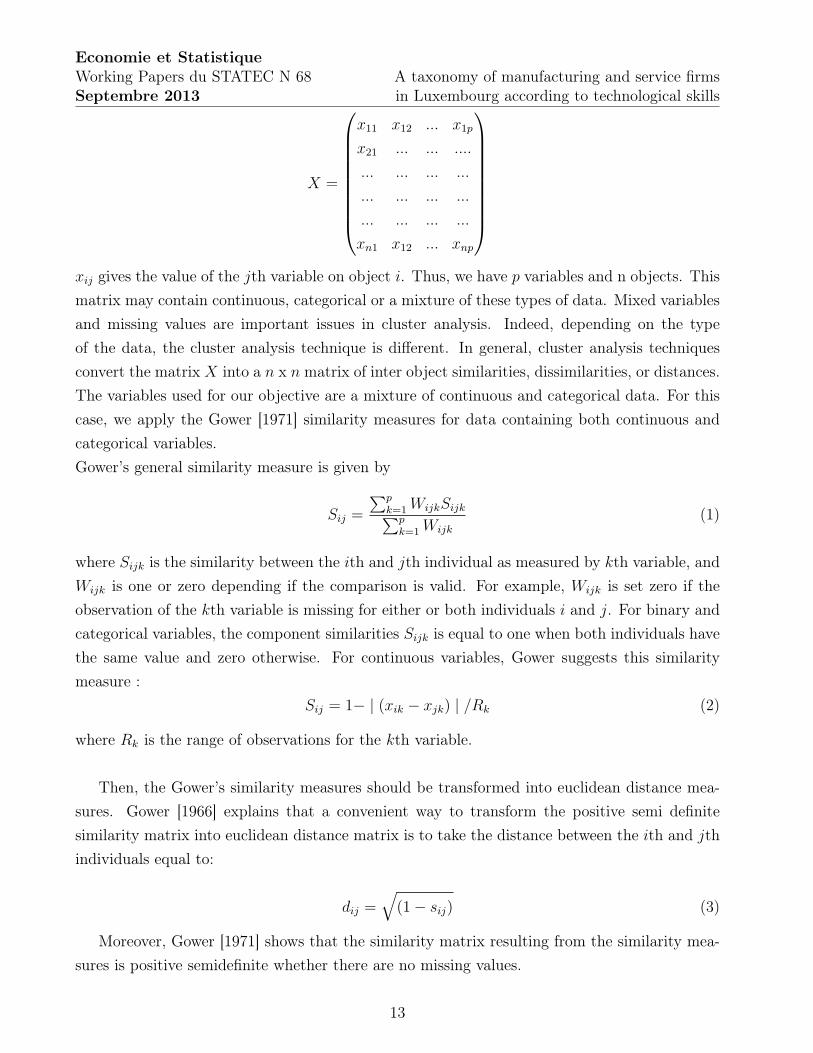
X =
x11 x12 ... x1p
x21 ... ... ....
... ... ... ...
... ... ... ...
... ... ... ...
xn1 x12 ... xnp
xij gives the value of the jth variable on object i. Thus, we have p variables and n objects. This
matrix may contain continuous, categorical or a mixture of these types of data. Mixed variables
and missing values are important issues in cluster analysis. Indeed, depending on the type
of the data, the cluster analysis technique is different. In general, cluster analysis techniques
convert the matrix X into a n x n matrix of inter object similarities, dissimilarities, or distances.
The variables used for our objective are a mixture of continuous and categorical data. For this
case, we apply the Gower [1971] similarity measures for data containing both continuous and
categorical variables.
Gower’s general similarity measure is given by
Sij =
∑p
k=1WijkSijk
∑p
k=1Wijk
(1)
where Sijk is the similarity between the ith and jth individual as measured by kth variable, and
Wijk is one or zero depending if the comparison is valid. For example, Wijk is set zero if the
observation of the kth variable is missing for either or both individuals i and j. For binary and
categorical variables, the component similarities Sijk is equal to one when both individuals have
the same value and zero otherwise. For continuous variables, Gower suggests this similarity
measure :
Sij = 1− | (xik − xjk) | /Rk (2)
where Rk is the range of observations for the kth variable.
Then, the Gower’s similarity measures should be transformed into euclidean distance mea-
sures. Gower [1966] explains that a convenient way to transform the positive semi definite
similarity matrix into euclidean distance matrix is to take the distance between the ith and jth
individuals equal to:
dij =√
(1− sij) (3)
Moreover, Gower [1971] shows that the similarity matrix resulting from the similarity mea-
sures is positive semidefinite whether there are no missing values.
13
Economie et Statistique
Working Papers du STATEC N 68Septembre 2013
A taxonomy of manufacturing and service firmsin Luxembourg according to technological skills
When the distance matrix is constructed, the cluster analysis could be run. The most known
methods of cluster are the hierarchical clustering and the k-means clustering. The difference
between the two is that the first method tries to find the better number of classes which fit
the data, whereas in the k-means method, one should specify the number of groups. Thus, for
our purpose the hierarchical clustering is more appropriate. Thus, we will apply the complete
linkage clustering
The complete linkage clustering defines the distance between groups as the most remote pair
of individuals. Complete linkage distance between clusters Ci and Cj is the maximum distance
between any object in Ci and any object in Cj.
dcl(Ci, Cj) = maxx,y[d(x, y), x ∈ Ci, y ∈ Cj] (4)
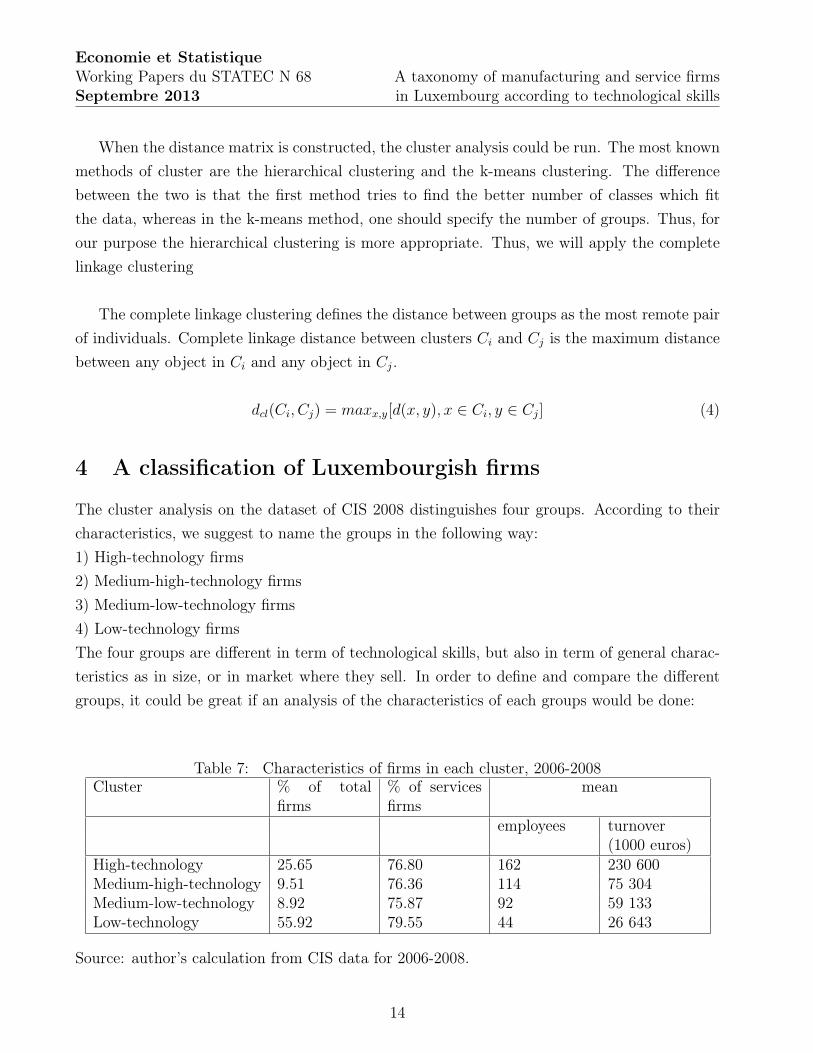
4 A classification of Luxembourgish firms
The cluster analysis on the dataset of CIS 2008 distinguishes four groups. According to their
characteristics, we suggest to name the groups in the following way:
1) High-technology firms
2) Medium-high-technology firms
3) Medium-low-technology firms
4) Low-technology firms
The four groups are different in term of technological skills, but also in term of general charac-
teristics as in size, or in market where they sell. In order to define and compare the different
groups, it could be great if an analysis of the characteristics of each groups would be done:
Table 7: Characteristics of firms in each cluster, 2006-2008Cluster % of total
firms% of servicesfirms
mean
employees turnover(1000 euros)
High-technology 25.65 76.80 162 230 600Medium-high-technology 9.51 76.36 114 75 304Medium-low-technology 8.92 75.87 92 59 133Low-technology 55.92 79.55 44 26 643
Source: author’s calculation from CIS data for 2006-2008.
14
Economie et Statistique
Working Papers du STATEC N 68Septembre 2013
A taxonomy of manufacturing and service firmsin Luxembourg according to technological skills
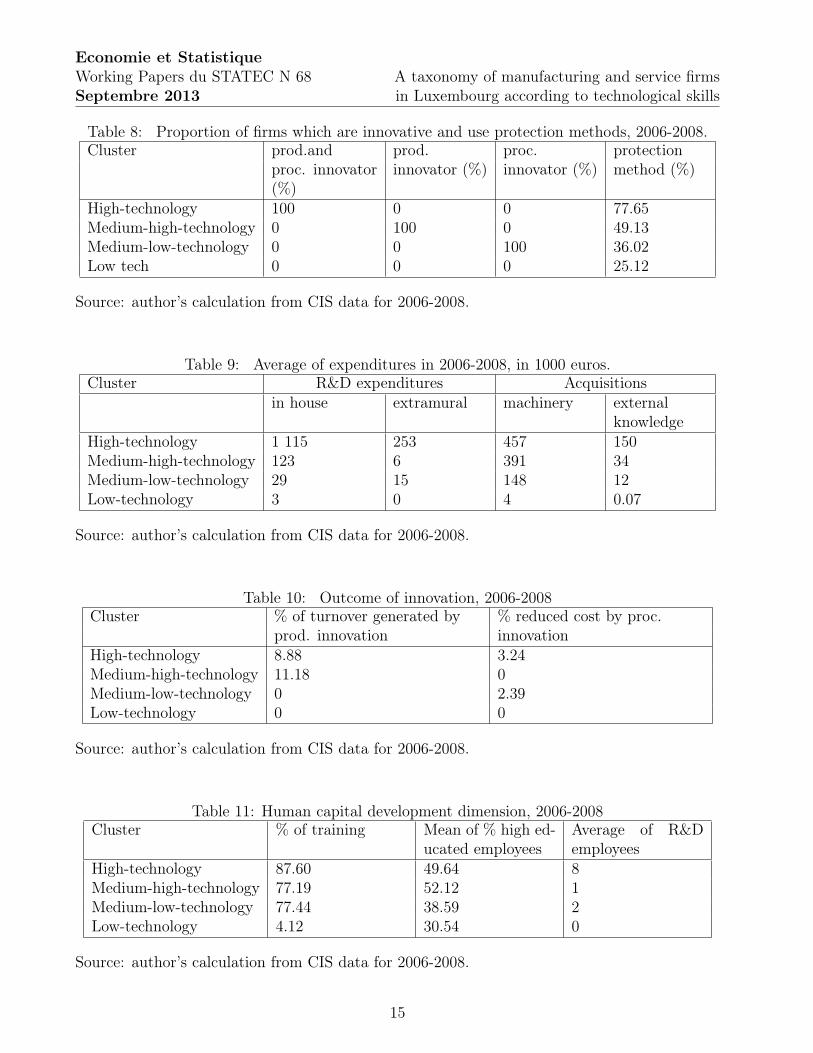
Table 8: Proportion of firms which are innovative and use protection methods, 2006-2008.Cluster prod.and prod. proc. protection
proc. innovator(%)
innovator (%) innovator (%) method (%)
High-technology 100 0 0 77.65Medium-high-technology 0 100 0 49.13Medium-low-technology 0 0 100 36.02Low tech 0 0 0 25.12
Source: author’s calculation from CIS data for 2006-2008.
Table 9: Average of expenditures in 2006-2008, in 1000 euros.Cluster R&D expenditures Acquisitions
in house extramural machinery externalknowledge
High-technology 1 115 253 457 150Medium-high-technology 123 6 391 34Medium-low-technology 29 15 148 12Low-technology 3 0 4 0.07
Source: author’s calculation from CIS data for 2006-2008.
Table 10: Outcome of innovation, 2006-2008Cluster % of turnover generated by % reduced cost by proc.
prod. innovation innovationHigh-technology 8.88 3.24Medium-high-technology 11.18 0Medium-low-technology 0 2.39Low-technology 0 0
Source: author’s calculation from CIS data for 2006-2008.
Table 11: Human capital development dimension, 2006-2008Cluster % of training Mean of % high ed-
ucated employeesAverage of R&Demployees
High-technology 87.60 49.64 8Medium-high-technology 77.19 52.12 1Medium-low-technology 77.44 38.59 2Low-technology 4.12 30.54 0
Source: author’s calculation from CIS data for 2006-2008.
15
Economie et Statistique
Working Papers du STATEC N 68Septembre 2013
A taxonomy of manufacturing and service firmsin Luxembourg according to technological skills
Table 7 highlights the following features. In 2008, the high-tech group represents 25.65%.
The Luxembourgish economy is characterized by an important number of firms which are in
low-technology group (55.92%). However medium-high-tech and medium-low-tech groups rep-
resent respectively only 9.51% and 8.92% of total firms. The services industry has more or less
the same weight in each group; 76.80% in high-tech, 76.36% in medium-high-tech, 75.87% in
medium-low-tech, and 79.55% in low-tech. As expected the average of the number of employ-
ees is higher in the high-tech group (162) and lower in low-tech (44). This is consistent with
the literature which argues that big firms are more technological intensive. Concerning the
turnover, it is also an increasing function of the level of technology. Indeed, there is a positive
relationship between the average of turnover and the technological effort. The turnover of the
high-tech group is 230 600 000 euros on average, that of the medium-high-tech group is 75 304
000 euros, that of medium-low-tech group is 59 133 000 euros, and finally that of the low-tech
group is 26 643 000 euros.
Table 8 shows the proportion of firms which innovate in product and in process, only in
products, and only in process. It also demonstrates the proportion in each group of firms which
protect themselves by patents, registration of design patterns, trademarks, copyright, and se-
crecy. The high-tech group innovates at 100% in products and process, and 77.65% of them
protect their innovation. 100% of the medium-high-tech group innovate only in products and
49.13% of them use a protection method. The medium-low-tech group contains 100% of firms
which are innovative in process. 36.02% of them use a protection method. The low-tech group
does not innovate neither in product nor in process. Although no firm has to innovate during
the period 2006-2008, 25.12% of them use a protection method. Indeed, the question in the CIS
2008 does not specify whether these protection methods are used for innovation done between
2006-2008.
Table 9 demonstrates that the high-tech group invests an important amount in in-house
R&D, 1 115 000 euros (0.48% of turnover ). The second higher expense is acquisition of ma-
chinery with 457 000 euros ( 0.20% of turnover), followed by extramural R&D expenditures with
253 000 euros (0.11%), and finally acquisition of external knowledge with 150 000 euros (0.06%).
The medium-high-tech group invests the most in acquisition of machinery afterwards in R&D
in-house , acquisition of external knowledge, and extramural R&D respectively 391 000 euros
(0.52% of turnover), 123 000 euros (0.16% of turnover), 34 000 euros (0.05% of turnover), and
6 000 euros (0.001% of turnover). The medium-low-tech group invests more in acquisition of
machinery with 148 000 euros (0.25% of turnover), it spends 29 000 in in-house R&D (0.05% of
turnover), 15 000 in extramural R&D (0.03% of turnover) and 12 000 in acquisition of external
16
Economie et Statistique
Working Papers du STATEC N 68Septembre 2013
A taxonomy of manufacturing and service firmsin Luxembourg according to technological skills
knowledge (0.02% of turnover). Concerning the low-tech group, firms invest 4 000 euros (0.02%
of turnover) in acquisition of machinery, 3 000 euros (0.01%) in in-house R&D , 70 euros ( 0.00%
of turnover) in acquisition of external knowledge , and 0 euros in R&D extramural (0.00% of
turnover).
In table 10 the percentage of turnover generated by product innovation and the percentage
of reduced cost generated by process innovation are reported. The product innovation of high-
tech group generated on average 8.88% of turnover, and the process innovation reduced the cost
in 3.24%. Because the medium-high-tech group innovates only in products, their innovations
generate 11.18% of their turnover. Concerning firms which are in the medium-low-tech group,
their process innovations reduce 2.39% of cost. Concerning firms in the low-tech group, they do
not generate profit or reduce their costs because they do not innovate. Regarding the human
capital development dimension in table 11, 87.60% of firms in high-tech group offer training
to their employees, 77.19% in medium-high-tech, 77.44% medium-low-tech, and 47.12% in low-
tech. 49.64% of employees are high educated in the high-tech group. Firms in this group have
8 R&D employees on average. Firms in the medium- high-tech group and firms in the medium-
low-tech group engage high educated employees in respectively 52.12% and 38.59% and have
on average 1 and 2 R&D employees. The low-tech group has on average only 30.54% of high
educated employees and has 0 R&D employees in average.
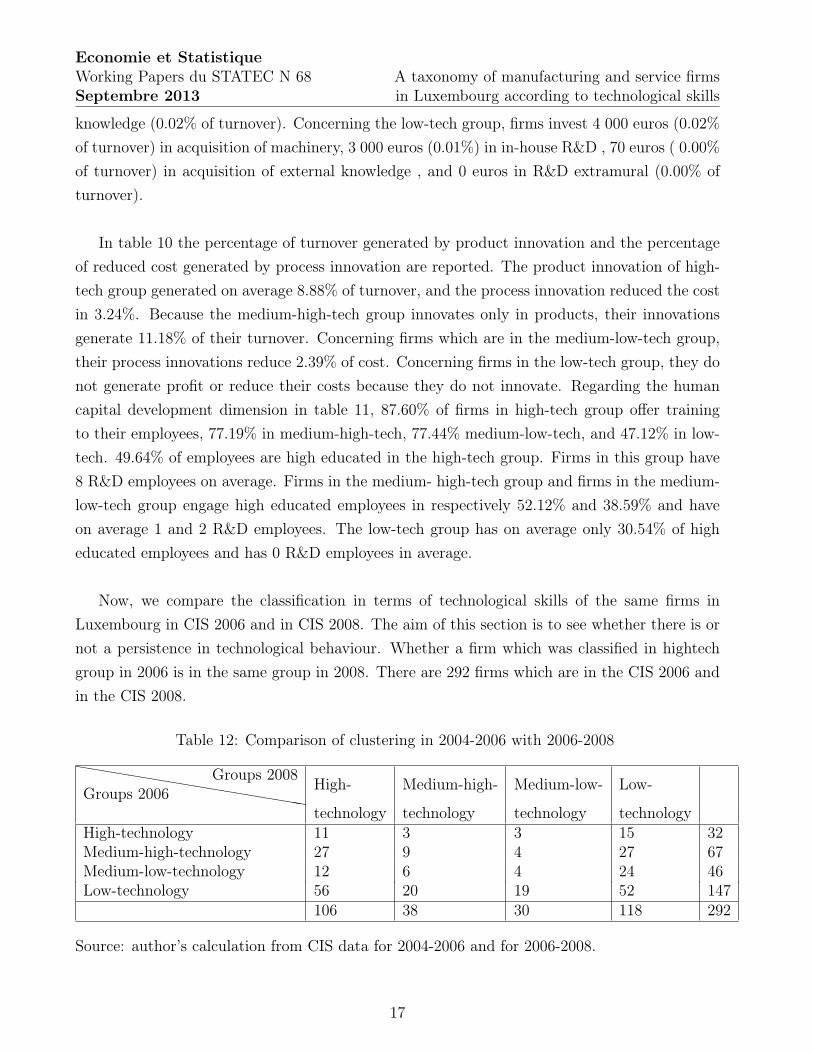
Now, we compare the classification in terms of technological skills of the same firms in
Luxembourg in CIS 2006 and in CIS 2008. The aim of this section is to see whether there is or
not a persistence in technological behaviour. Whether a firm which was classified in hightech
group in 2006 is in the same group in 2008. There are 292 firms which are in the CIS 2006 and
in the CIS 2008.
Table 12: Comparison of clustering in 2004-2006 with 2006-2008
❤❤❤
❤❤❤
❤❤
❤❤❤
❤❤❤
❤❤❤❤
Groups 2006Groups 2008
High- Medium-high- Medium-low- Low-
technology technology technology technologyHigh-technology 11 3 3 15 32Medium-high-technology 27 9 4 27 67Medium-low-technology 12 6 4 24 46Low-technology 56 20 19 52 147
106 38 30 118 292
Source: author’s calculation from CIS data for 2004-2006 and for 2006-2008.
17
Economie et Statistique
Working Papers du STATEC N 68Septembre 2013
A taxonomy of manufacturing and service firmsin Luxembourg according to technological skills
Table 12 highlights that the technological profile of a firm is not stable over time. Indeed,
only 11 firms which are in high-tech group in 2006 are still in the high-tech group in 2008; 15
firms which are in the high-tech group in 2006 are in the low-tech group in 2008. It is not
surprising, indeed, firms do not invest the same amount every year in R&D and technology
and do not innovate every year. Thus, it is unsurprising that classifications are not stable.
This problem is of difficult solution and involves the choice of the variables used for the cluster
exercise, raising further issues. Is it a robust conclusion that a firm is no longer belonging to
a high technology group simply because it has not performed further innovation in the last 2
years of the sample? Is there an "innovation" cycle for firms moving from one group to another?
5 Conclusions
This article has developed a classification of Luxembourg’s firms according to their technological
skills using clustering techniques. Luxembourg firms can be classified in four groups: i) high-
technology, ii) medium-high-technology, iii) mediumlow- technology, iv) low-technology.
The high-technology group includes firms with the largest number of employees. Firms in this
group have also the highest average turnover. This size effect has been previously found in the
literature. According to Schumpeter [1943], large corporations with monopoly power are more
likely to innovate because of better access to capital, ability to diversify risks, and economies of
scale in R&D activities. Moreover, Bound et al. [1984] find that R&D expenditures increased
with turnover and gross plant size. Firms in the high-technology group innovate in product
and in process and use protection methods as patents to protect their innovations against
imitation. They are characterised by the highest expenditures for in-house R&D and acquisition
of machinery. They are also the most efficient in terms of the human capital development
dimension, they offer to their employees trainings to develop their skills.
The firms in the medium-high-technology group are smaller than in the high-technology
group (they have the second largest size range). Firms in this group innovate only in product.
They spend considerable amounts in the acquisition of machinery and in the development of
human capital strategies. Firms in the medium-low-technology group are smaller than firms in
the medium-high-technology group. These firms are process innovators and they invest mainly
in the acquisition of machinery. They have few or none R&D personnel. Firms in the low-
technology group are the smallest in the sample. They have the lowest turnover on average.
They perform limited process innovation. Moreover, they do not invest in developing human
resources.
The empirical tool described in this article could be applied in studies of the relation between
innovation and economic performance, or in studies concerned with the impact of innovation
18
Economie et Statistique
Working Papers du STATEC N 68Septembre 2013
A taxonomy of manufacturing and service firmsin Luxembourg according to technological skills
policies. The complex relationship between innovation and competition has been the object
of many studies. Schumpeter [1943] considered that policy makers should accept less compe-
tition within industries in order to motivate innovative behaviour. Romer [1991] argued that
large market leader firms perform most of the innovations. In contrast, Griffith et al. [2006]
demonstrated a positive relationship between competition and innovation. Aghion et al. [2005]
attempted to reconcile these contrasting predictions and found evidence that the competition-
innovation relationship is non-linear, in the form of an inverted U-curve. The link between
market structure and competitiveness of industries to innovation behaviour is still very much
debated. Peroni and Ferreira [2012] found evidence of a non-linear relation between competition
and innovation in Luxembourg. Those results were obtained using business survey data. To
check whether the innovation survey data support previous results, we have regressed measures
of R&D intensity on indicators of competition in the CIS survey. (Firms’ dummies constructed
according to the classification developed in this article are used to account for groups’ effects.)
Preliminary results suggest that, among indicators of competition in CIS, only the (perceived)
degree of price competition seems to have a significant (positive) effect on the intensity of R&D.
Clearly more research is needed on this issue, possibly combining information from several data
sources, in particular from innovation and business survey data.
19
Economie et Statistique
Working Papers du STATEC N 68Septembre 2013
A taxonomy of manufacturing and service firmsin Luxembourg according to technological skills
References
P. Aghion, N. Bloom, R. Blundell, R. Griffith., and P. Howitt. Competition and innovation:
An inverted u relationship. Quarterly Journal of Economics, CXX:701–28, 2005.
D. Archibugi. Pavitt’s taxonomy sixteen years on: a review article. Econ. Innov. New Techn.,
10:415–25, 2000.
A-L. Asikainen. Innovation and productivity in luxembourg. STATEC Working papers NO 23,
2008.
J. Baldwin and G. Gellatly. A Firm-Based Approach to Industry Classification: Identifying
the Knowledge-Based Economy. L.-A. Lefebvre, E. Lefebvre and P. Mohnen (eds), Doing
Business in a Knowledge-Based Economy. Facts and Policy Challenges. Kluwer Academic,
Boston, Mass., 2000.
J. Baldwin and J. Johnson. Human Capital Development and Innovation: A Sectoral Analysis.
The Implications of Knowledge-Based Growth for Micro-Economic Policies. Calgary: Calgary
University Press., Oxford, 1996.
J. Bound, C. Cummins, B. Hall, and A. Jaffe. Who does rd and who patents? 1984.
S. Davies and B. Lyons. Industrial organization in the European Union. Clarendon Press,
Oxford, 1996.
B. Everitt and S. Rabe-Hesketh. A Handbook of Statistical Analyses Using Stata, Fourth Edition.
Chapman Hall/CRC, 2007.
P-A. Geroski, J. Van Reenen, and C-F. Walters. How persistently do firms innovate? Research
Policy, Elsevier, vol. 26(1), 1997.
J. C. Gower. A general coefficient of similarity and some of its properties. Biometrics, 27(4):
857–871, 1971.
J.C. Gower. Some distance properties of latent root and vector methods used in multivariate
analysis. Biometrika, 53:325–338, 1966.
R. Griffith, R. Harrison, and H. Simpson. Product market reform and innovation in the eu. The
institute for fiscal studies. Working papers. WP06/17, 2006.
T. Hatzichronoglou. Revision of the high-technology sector and product classification. OECD
Science, Technology and industry working papers, 02, OECD Publishing, 1997.
20
Economie et Statistique
Working Papers du STATEC N 68Septembre 2013
A taxonomy of manufacturing and service firmsin Luxembourg according to technological skills
R.Z. Lawrence. Can America compete? The brookings Institution, Whashington D.C, 1984.
F. Malerba and L. Orsenigo. Technological entry, exit and survival: an empirical analysis of
patent data. Research Policy, Elsevier, 28(6):643–660, 1999.
OECD. Oecd economis surverys. volume 2008/12, 2008.
K. Pavitt. Sectoral patterns of technical change: Towards a taxonomy and a theory. Research
policy, 113:343–73, 1984.
M. Peneder. Industry classifications: Aim, scope and techniques. Journal of Industry, Compe-
tition and Trade, 3(1):109–129, 2003.
C. Peroni. Productivity and competitiveness in luxembourg: Productivity & the crisis. Per-
spectives de Politique Economique, N 18, Ministere de l’économie et du commerce exterieur
du Grand-Duché de Luxembourg, 2012.
C. Peroni and I-G. Ferreira. Competition and innovation in luxembourg. Journal of Industry
Competition and trade, 12:93–117, 2012.
P. Romer. Endogenous technological change. Journal of Political Economy, 98:71–102, 1991.
J.A. Schumpeter. Capitalism, Socialism and Democracy. Allen and Unwin, London, 1943.
R. Solow. A contribution to the theory of economic growth. Quarterly Journal of Economics,
70(1):65–94, 1956.
STATEC. Répertoire systématique. Les entreprises luxembourgeoises, 2008.
21