a quadrupolar two-photon fluorescent probe for in vivo ... · the hplc profile of . qad1 (a) before...
TRANSCRIPT
S1
Supporting Information to Accompany
“A Quadrupolar Two-Photon Fluorescent Probe for In Vivo Imaging of Amyloid-β
Plaques”
Cheol Ho Heo,a Avik Ranjan Sarkar,a Sung Hoon Baik,b Tae Sung Jung,a Jeong Jin Kim,a Hyuk Kang,a Inhee Mook-Jung*b and Hwan Myung Kim*a
aDepartment of Chemistry and Department of Energy Systems Research, Ajou University, Suwon 443-749, Korea, bDepartment of Biochemistry and Biomedical Sciences College of Medicine, Seoul
National University, Seoul, 110-799, Korea.
Table of Contents
Page Synthesis of 1, 2 (QAD1) and 3. S3 Water Solubility. S9 Octanol-water partition coefficient (log Poct). S15 Fig. S1 (a,c,e) One-photon absorption spectra and (b,d,f) plot of intensity against probe concentration for (a,b) 1, (c,d) QAD1 and (e,f) 3 in PBS buffer (10mM, pH 7.4).
S9
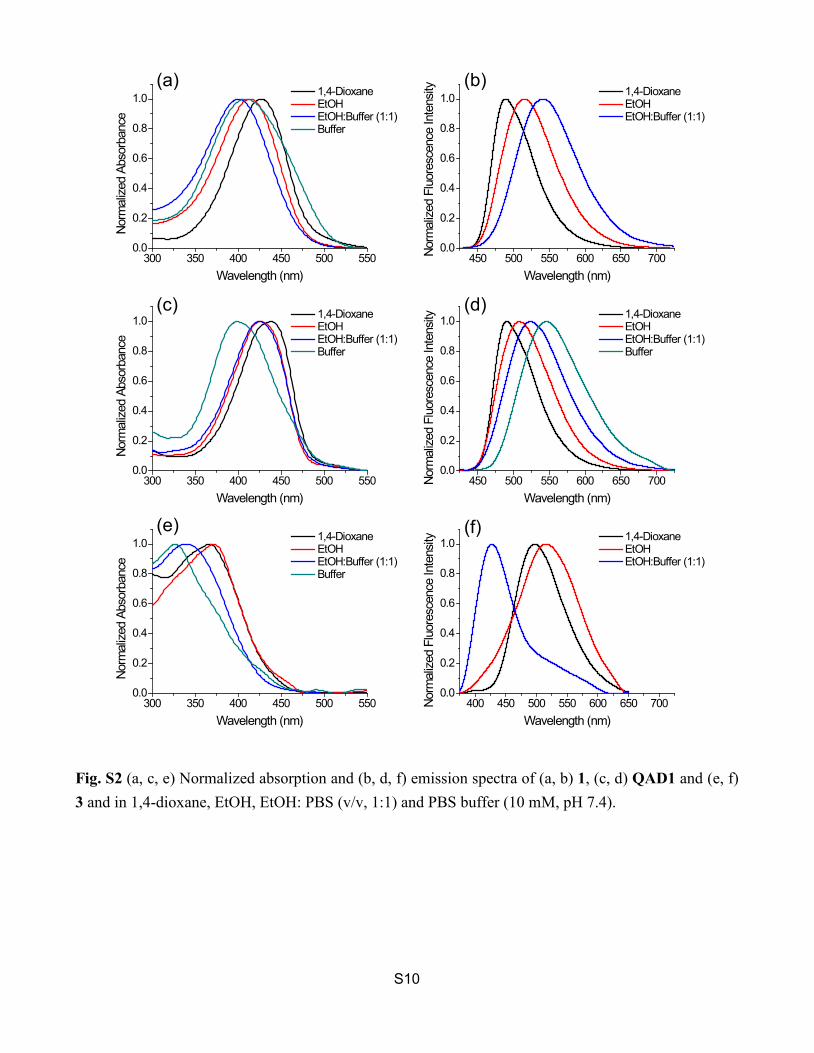
Fig. S2 (a, c, e) Normalized absorption and (b, d, f) emission spectra of (a, b) 1, (c, d) QAD1 and (e, f) 3 and in 1,4-dioxane, EtOH, EtOH: PBS (v/v, 1:1) and PBS buffer (pH 7.4).
S10
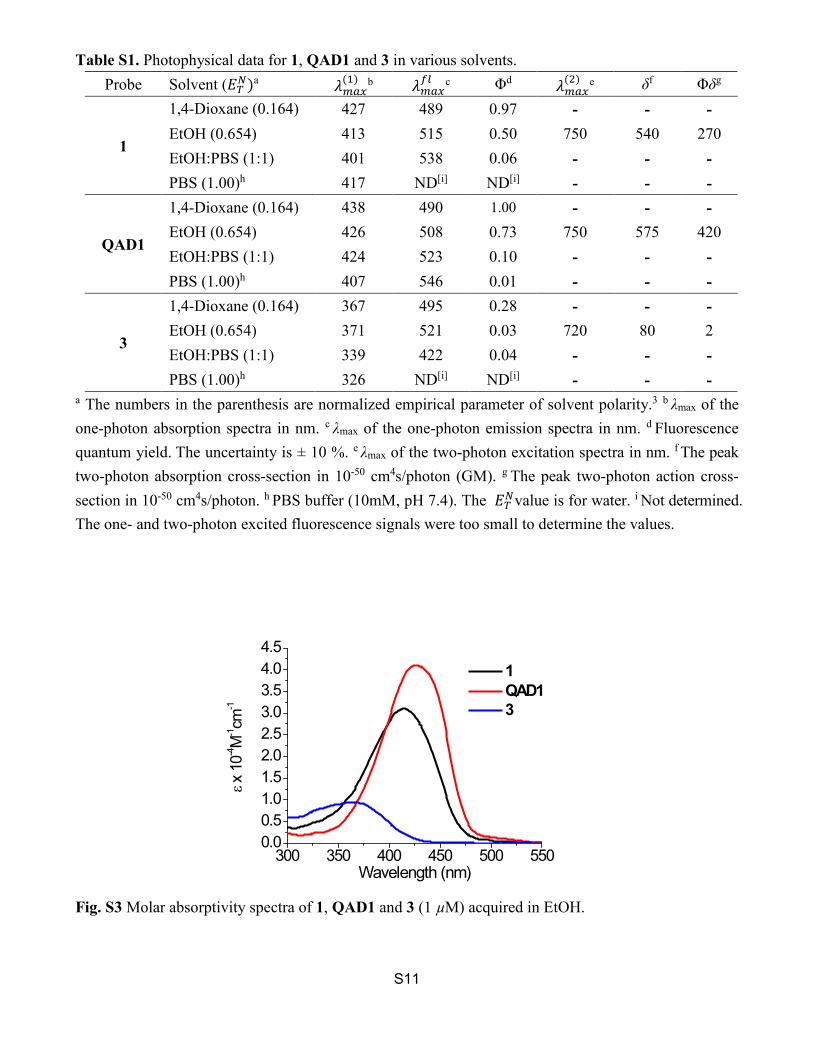
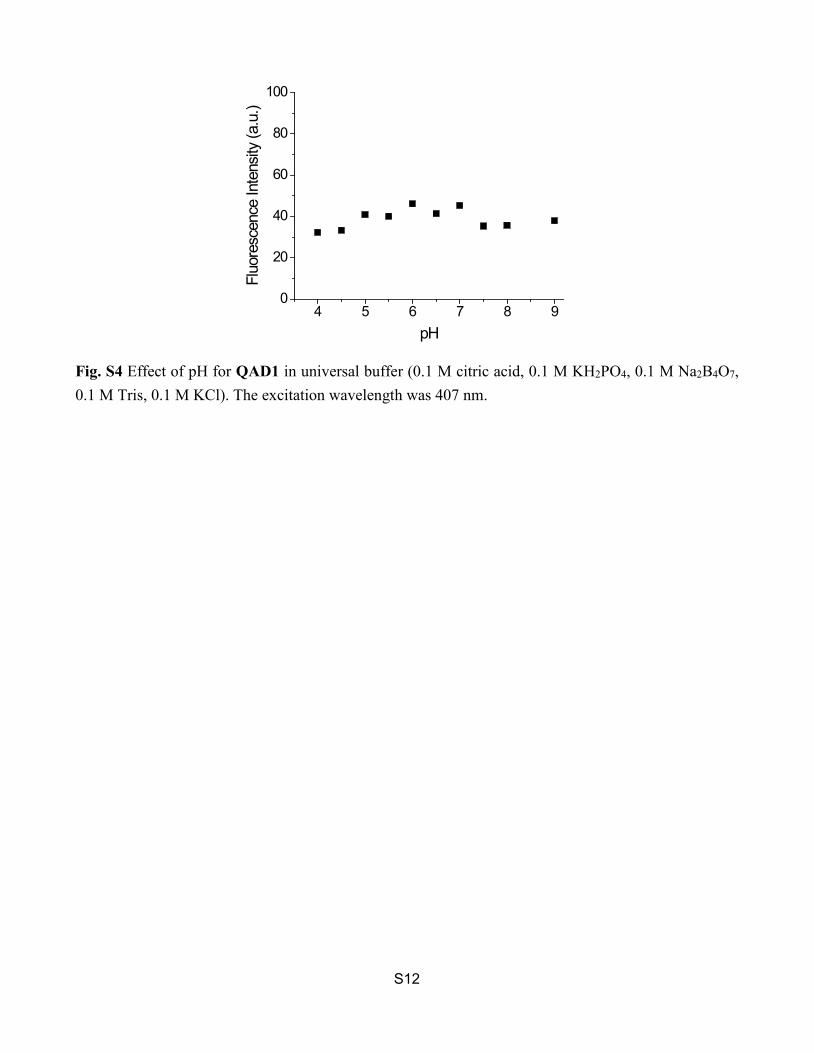
Fig. S3 Molar absorptivity spectra of 1, QAD1 and 3 (1 µM) acquired in EtOH. S11 Fig. S4 Effect of pH for QAD1 in universal buffer (0.1 M citric acid, 0.1 M KH2PO4, 0.1 M Na2B4O7, 0.1 M Tris, 0.1 M KCl). The excitation wavelength was 407 nm.
S12
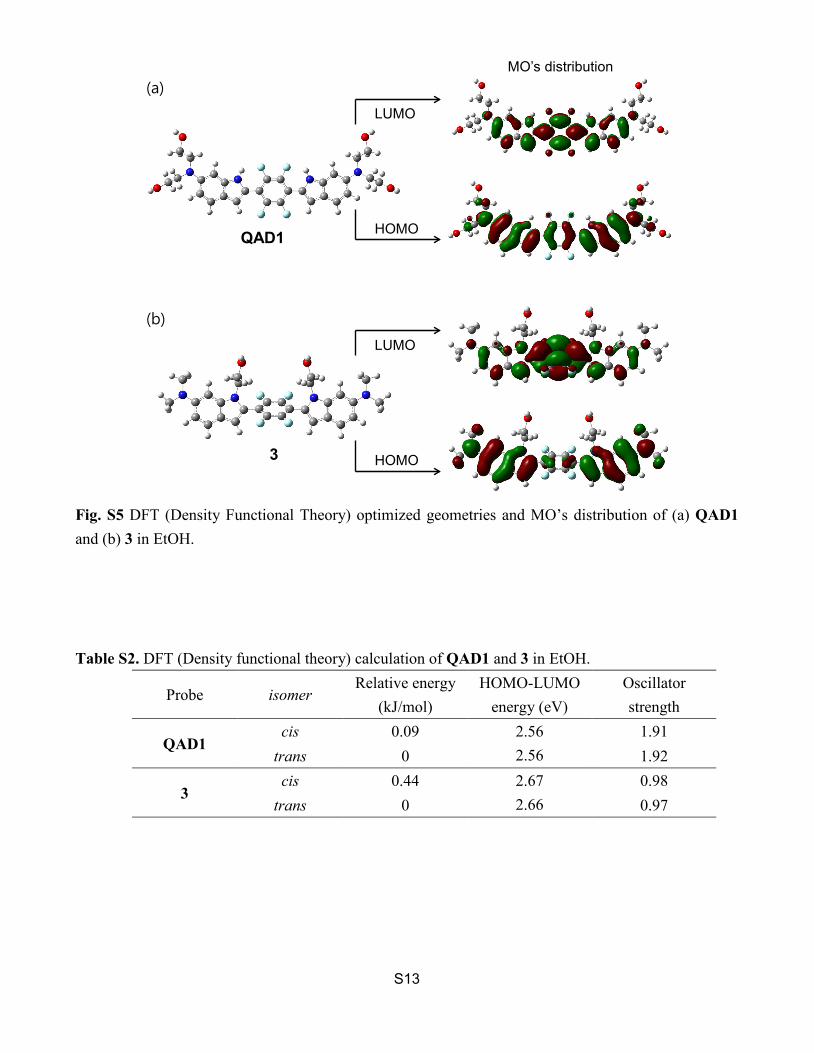
Fig. S5 DFT (Density Functional Theory) optimized geometries and MO’s distribution of (a) QAD1 and (b) 3 in EtOH.
S13
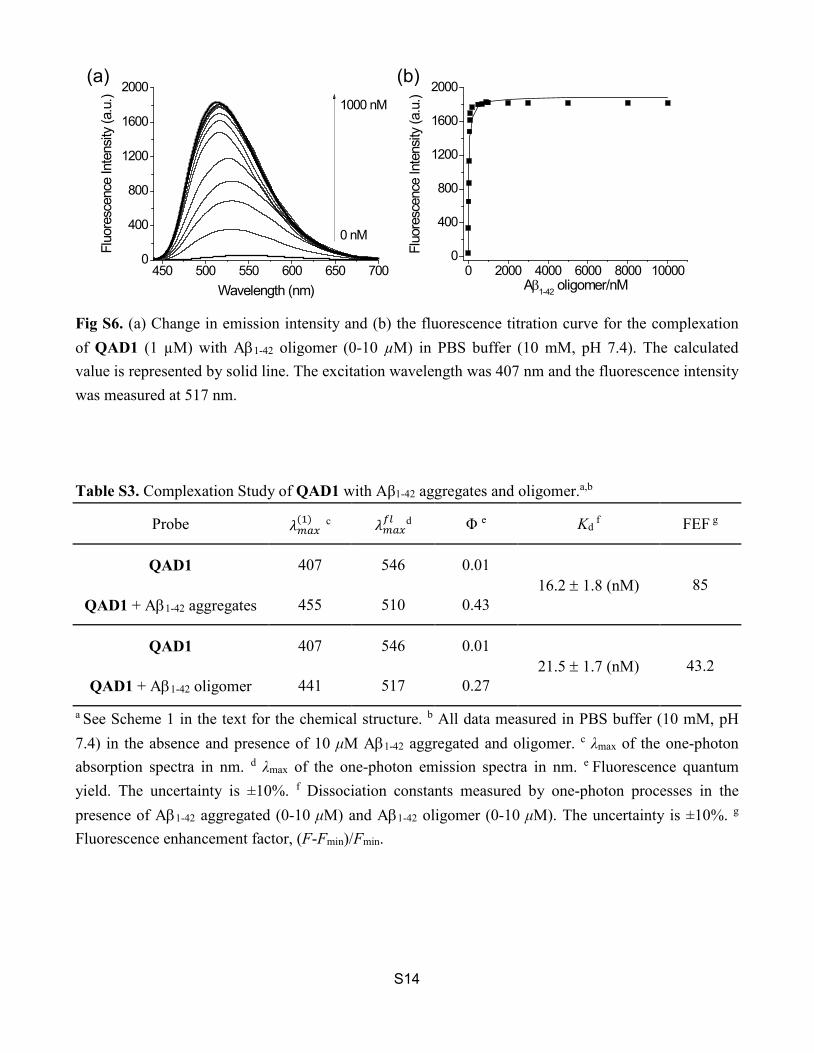
Fig S6. (a) Change in emission intensity and (b) the fluorescence titration curve for the complexation of QAD1 (1 µM) with Aβ1-42 oligomer (0-10 µM) in PBS buffer (10 mM, pH 7.4). The calculated value is represented by solid line. The excitation wavelength was 407 nm and the fluorescence intensity was measured at 517 nm.
S14
Fig. S7 The change in emission intensity (a) 1, (b) QAD1 and (c) 3 in presence of Aβ1-42 aggregated, Aβ1-42 oligomer, BSA and HSA in PBS buffer (10 mM, pH 7.4). (d) Relative fluorescence intensity upon addition of particular protein in PBS (10 mM, pH 7.4) measured at 504, 510 and 506 nm for 1, QAD1 and 3, respectively. The excitation wavelengths were 417 nm for 1, 407 nm for QAD1 and 326 nm for 3, respectively.
S16
Fig. S8 Two-photon fluorescence response of 1 μM QAD1 in the presence of Aβ1-42 oligomer S17
Electronic Supplementary Material (ESI) for Chemical Science.This journal is © The Royal Society of Chemistry 2016
S2
(10 μM) and Aβ1-42 aggregates (10 μM) in PBS buffer (10 mM, pH 7.4). The excitation wavelength was 750 nm. Fig. S9 The HPLC profile of QAD1 (a) before and (b,c) after incubation with mice plasma for (b) 30 and (c) 60 min. (d) The HPLC profile of mice plasma.
S18
Fig. S10 Viability of SH-SY5Y cells in the presence of QAD1 as measured by using MTS assay. The cells were incubated with (a) 0–20 μM QAD1 for 12 h and (b) 20 μM QAD1 for 2, 6 and 12 h. (n = 6)
S18
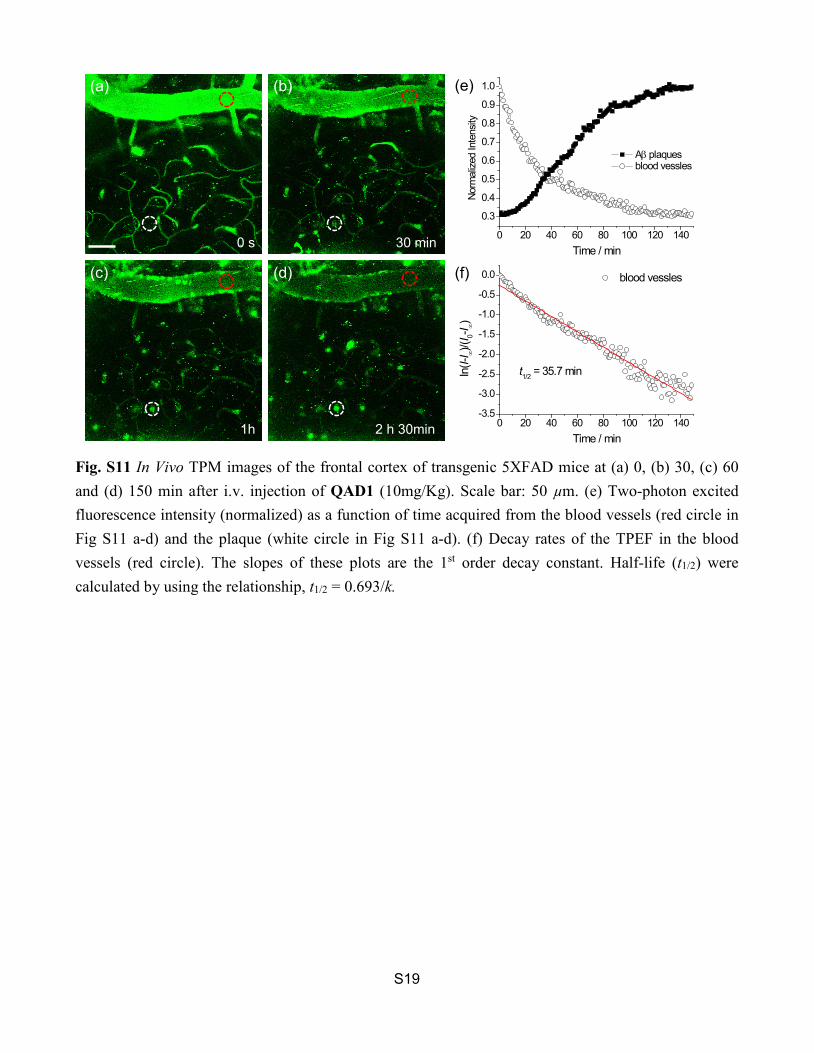
Fig. S11 In Vivo TPM images of the frontal cortex of transgenic 5XFAD mice at (a) 0, (b) 30, (c) 60 and (d) 150 min after i.v. injection of QAD1 (10mg/Kg). Scale bar: 50 µm. (e) Two-photon excited fluorescence intensity (normalized) as a function of time acquired from the blood vessels (red circle in Fig S11 a-d) and the plaque (white circle in Fig S11 a-d). (f) Decay rates of the TPEF in the blood vessels (red circle). The slopes of these plots are the 1st order decay constant. Half-life (t1/2) were calculated by using the relationship, t1/2 = 0.693/k.
S19
Fig. S12 1H-NMR spectrum (400 MHz) of 1 in CDCl3. S20 Fig. S13 13C-NMR spectrum (100 MHz) of 1 in CDCl3 containing 2 drops of d6-DMSO. S20 Fig. S14 HRMS spectrum of 1. S21 Fig. S15 1H-NMR spectrum (400 MHz) of 2 (QAD1) in d6-DMSO. S21 Fig. S16 13C-NMR spectrum (100 MHz) of 2 (QAD1) in d6-DMSO. S22 Fig. S17 HRMS spectrum of 2 (QAD1). S22 Fig. S18 1H-NMR spectrum (400 MHz) of 3 in CDCl3. S23 Fig. S19 13C-NMR spectrum (100 MHz) of 3 in CDCl3 containing 2 drops of d6-DMSO. S23 Fig. S20 HRMS spectrum of 3. S24 Table S1. Photophysical data for 1, QAD1 and 3 in various solvents. S11 Table S2. DFT (Density functional theory) calculation of QAD1 and 3 in EtOH. S13 Table S3. Complexation Study of QAD1 with Aβ1-42 aggregated and oligomer. S14 Table S4. Photophysical data of two-photon imaging probes for Aβ plaques. S15 Table S5. Molar extinction coefficients and logPoct for listed probes in n-octanol and PBS. S17
S3
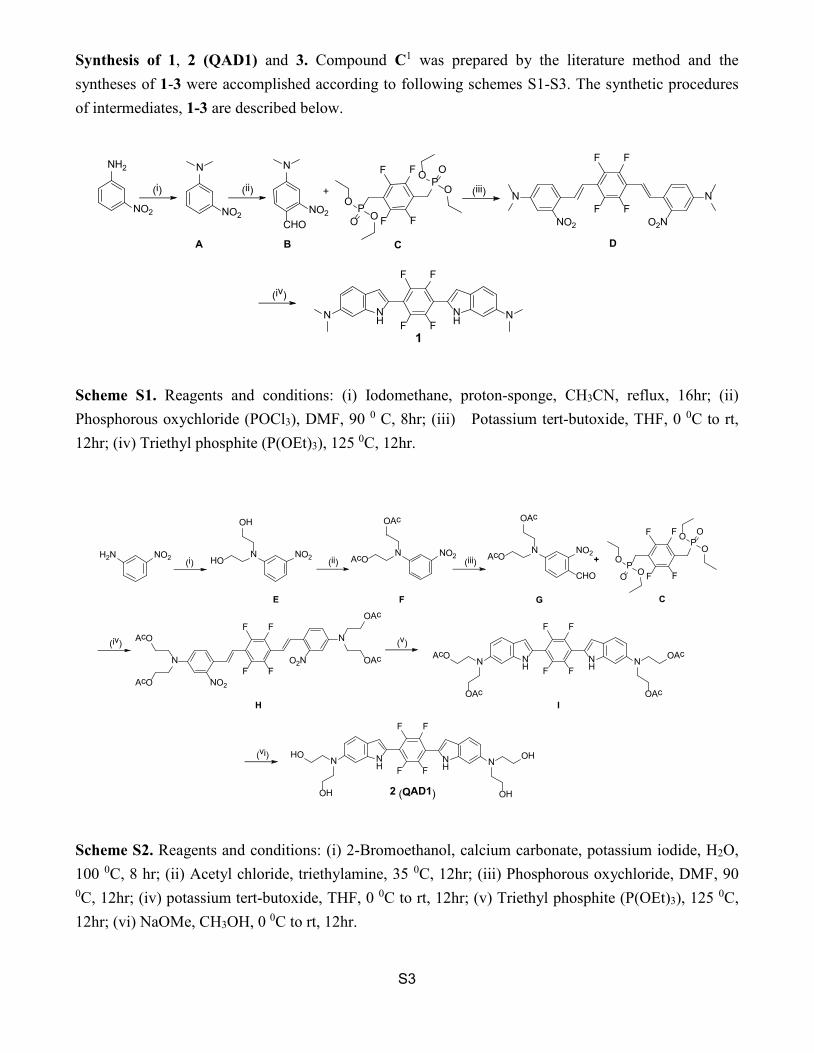
Synthesis of 1, 2 (QAD1) and 3. Compound C1 was prepared by the literature method and the syntheses of 1-3 were accomplished according to following schemes S1-S3. The synthetic procedures of intermediates, 1-3 are described below.
Scheme S1. Reagents and conditions: (i) Iodomethane, proton-sponge, CH3CN, reflux, 16hr; (ii) Phosphorous oxychloride (POCl3), DMF, 90 0 C, 8hr; (iii) Potassium tert-butoxide, THF, 0 0C to rt, 12hr; (iv) Triethyl phosphite (P(OEt)3), 125 0C, 12hr.
Scheme S2. Reagents and conditions: (i) 2-Bromoethanol, calcium carbonate, potassium iodide, H2O, 100 0C, 8 hr; (ii) Acetyl chloride, triethylamine, 35 0C, 12hr; (iii) Phosphorous oxychloride, DMF, 90 0C, 12hr; (iv) potassium tert-butoxide, THF, 0 0C to rt, 12hr; (v) Triethyl phosphite (P(OEt)3), 125 0C, 12hr; (vi) NaOMe, CH3OH, 0 0C to rt, 12hr.
NH2
NO2
N
NO2
N
NO2CHO
+ N N
NO2 O2NF F
F F
NH
NH
F F
F FN N
1
(i) (ii) (iii)
(iv)
F
F F
FP
PO
OO
O
OO
A B DC
NO2H2N NO2N
FF
FF
NO2
N
NFF
FF
NH
NHN N
HO
OAc
AcO
OAc
OAcOAc
FF
FF
NH
NHN N
2 (QAD1)
OH
OH
NO2NAcO
NO2NAcO
CHO
O2N AcO
(i)
OH
(ii) (iii)
F
F F
FP
PO
OO
O
OO
+
(iv) (v)
(vi)
OAcOAc
AcO
OAc
HO
OH
F G CE
H I

S4
Scheme S3. Reagents and conditions: (i) 2-bromoethylacetate, NaH, 18-Crown-6, THF, 80 0C to rt; (ii) NaOMe, CH3OH.
Compound A. To a stirring solution of 3-nitro aniline (2.0 g, 14.5 mmol) and proton-sponge (6.83 g,
31.86 mmol) in anhydrous CH3CN (70 mL), iodomethane (2.0 mL, 31.9 mmol) was added. The whole
reaction mass was allowed to stirring at 80 0C for 8h under nitrogen atmosphere. The solvent was
evaporated to obtain the residue which was dissolved in CHCl3 (100 mL) and washed with water (100
mL) and 1(N) H2SO4 (50 mL) subsequently. The organic portion was dried over Na2SO4 and distilled
out the organic solvent to obtain the crude which was purified by column chromatography (2:8 ethyl
acetate: hexanes as an eluent) afforded A as a red solid. Yield: 1.51 g (63 %). 1H NMR (400MHz,
CDCl3): δ (ppm) 7.52-7.47 (m, 2H), 7.32 (t, J = 8.0 Hz, 1H), 6.95 (dd, J = 8.8 Hz, J = 2.8 Hz, 1H), 3.03
(s, 6H). 13C NMR (100 MHz, CDCl3): δ (ppm) 150.4, 148.9, 129.3, 117.4, 110.2, 105.7, 40.2.
Compound B. To a solution of A (1.3 g, 7.83 mmol) in anhydrous DMF (2.17 mL, 28.27 mmol) in
two-necks round-bottomed was cooled to 0 0C in an ice bath and POCl3 (1.07 mL, 11.74 mmol) was
added dropwise. Then the reaction mixture was heated within 1 hr. to 80 0C and stirred at this
temperature for additional 6hr. The dark solution then cooled to room temperature and poured into ice
cooled water and the precipitate obtained was filtered off. The residue was recrystallized from acetone
to afford compound B as a brown solid. (1.2 g, 79%). 1H NMR (400 MHz, CDCl3): δ (ppm) 10.12 (s,
1H), 7.91 (d, J = 2.8 Hz, 1H), 7.09 (d, J = 2.4 Hz, 1 H), 6.84 (dd, J = 8.8 Hz, J = 2.0 Hz, 1H), 3.14 (s, 6
H) ppm; 13C NMR (100 MHz, CDCl3): δ (ppm) 186.5, 154.2, 150.9, 131.5, 117.3, 114.5, 105.9, 40.3.
Compound D. To a stirred solution of C (1.0 g, 2.33 mmol) in anhydrous THF (80 mL), NaOtBu
(0.654 g, 5.83 mmol) was added at 0 0C under N2 atmosphere. After 30 min, B (0.95 g, 4.89 mmol) in
NN
F F
F FN N
O O
NN
F F
F FN N
OH HOO O
(ii)
3
1 (i)
J
S5
THF (20 mL) was added to the reaction mass and stirred for overnight at rt. Water was added to quench
the reaction and red precipitate appear, collect the solid residue and washed with THF followed by
water and hexane. The residue dried in vacuo to obtain the D (0.730 g, 63%) as a red solid. 1H NMR
(400 MHz, CDCl3): δ (ppm) 7.86 (d, J =16 Hz, 1H), 7.64 (d, J =8.0 Hz, 1H), 7.19 (s, 1 H), 6.92 – 6.87
(m, 2H), 3.07 (s, 6 H).
Compound 1. A solution of D (0.05 g, 0.094 mmol) in P(OEt)3 (5 mL) was heated under reflux
overnight under nitrogen atmosphere. The solvent was removed in vacuo and the product was purified
on a silica column by using 3:7 ethyl acetate: hexane to yield the compound 1 (0.032 g, 72%) as a brick
red solid. 1H NMR (400 MHz, CDCl3): δ ppm 9.12 (s, 1H), 7.40 (d, J = 8.8 Hz, 1 H), 6.97 (s, 1H),
6.69-6.64 (m, 2H), 2.90 (s, 6 H). 13C NMR (100 MHz,CDCl3 contained 2-drops of d6-DMSO): δ (ppm)
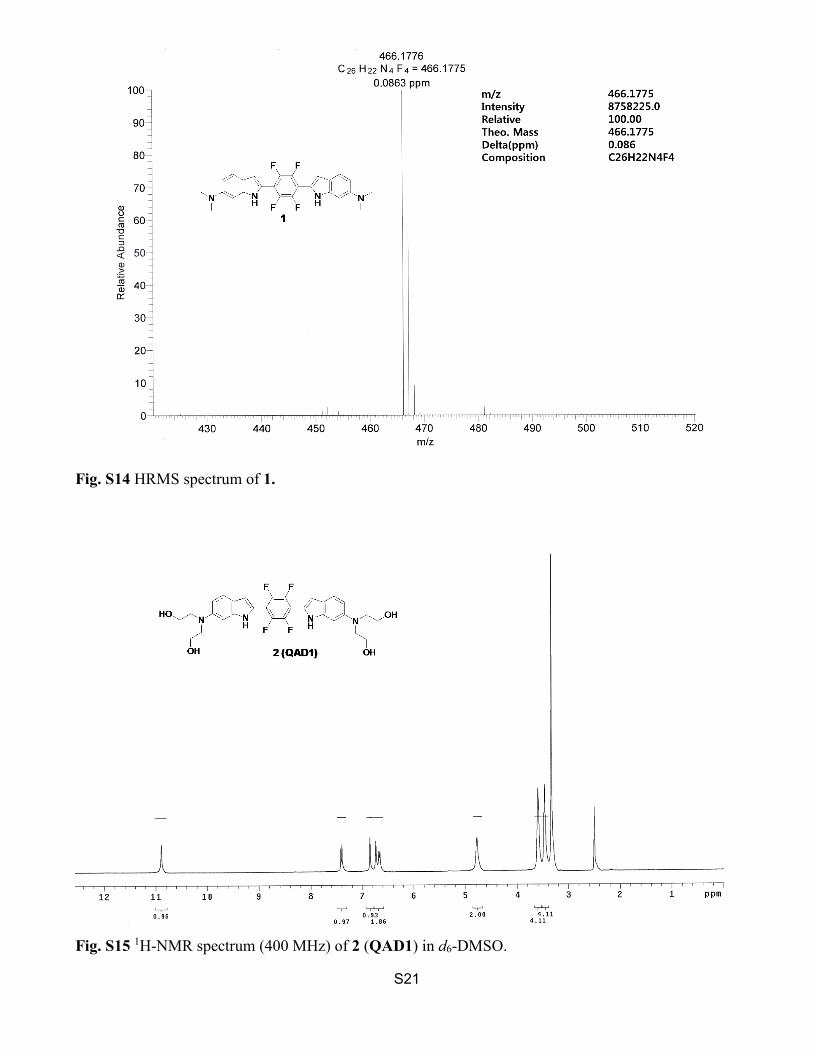
148.5, 144.7, 142.3 (d, J = 10.7Hz), 138.2, 122.2, 121.1, 119.7, 110.1, 106.8, 93.5, 41.4. HRMS
(FAB+): m/z calcd for [C26H22N4F4]: 466.1775, found: 466.1776
Compound E. 3-nitro aniline (10.0 g, 72.4 mmol), 2-bromoethanol (12.14 mL, 181.0 mmol), CaCO3
(18.11 g, 181.0 mmol) and KI (1.2 g, 7.2 mmol) were added to 150 mL water and refluxed for 16 h.
After filtration, the filtrate was extracted with EtOAc (50 mL x 3), and the combined organic layers
were further washed with saturated NaCl (50 mL x 2), dried over anhydrous Na2SO4, filtered and
concentrated to obtain the crude. The crude product was purified by silica column chromatography by
using 7:3 ethyl acetate: hexane as an eluent to afford the desired product E as a yellow solid. Yield:
6.20 g (38 %). 1H NMR (400MHz, CDCl3): δ (ppm) 7.36-7.35 (m, 2H), 7.16 (t, J = 8.0 Hz, 1H), 6.95
(dd, J = 8.4 Hz, J = 2.8 Hz, 1H), 4.68 (t, J = 4.8 Hz, 2H), 3.69-3.65 (m, 4H), 3.47 (t, J = 5.6 Hz, 4H).
13C NMR (100 MHz, CDCl3): δ (ppm) 148.9, 148.6, 129.3, 117.7, 110.2, 105.8, 59.4, 54.8.
Compound F. A solution E (5.4 g, 23.87 mmol) and triethylamine (7.33 mL, 52.52 mmol) in two
necks round-bottomed flux was cooled to 0 0C. Acetyl chloride (3.73 mL, 52.52 mmol) was then added
drop wise and the solution was stirred overnight at 35 0C. After cooling down to room temperature, the
mixture was hydrolyzed with 25 mL of water. After vigorous stirring for 1h, the THF was evaporated
S6
and saturated aqueous solution of NaHCO3 was used to neutralize. After extraction with chloroform (3
x 50 mL), the combined organic layers was dried over Na2SO4 and filtered, and the solvent was
removed under vacuum to obtained the compound F as a yellow solid (7.0 g, 95%). 1H NMR (400
MHz, CDCl3): δ (ppm) 7.45 (t, J = 2.8 Hz, 1H), 7.32 (dd, J = 8.0 Hz, J = 2.0 Hz, 1 H), 7.17 (t, J = 8 Hz,
1H), 6.94 (dd, J = 8.4 Hz, J = 6.0 Hz, 1 H), 4.12 (t, J = 6.0 Hz, 4 H), 3.56 (t, J = 6.4 Hz, 4 H), 1.88 (s, 6
H). 13C NMR (100 MHz, CDCl3): δ (ppm) 170.2, 148.9, 147.8, 129.5, 117.1, 110.7, 105.7, 60.8, 49.3,
20.4.
Compound G. Freshly distilled DMF (3.10 mL, 32.22 mmol) in two-necks round-bottomed was
cooled to 0 0C in an ice bath and POCl3 (1.62 mL, 17.72 mmol) was added dropwise. After stirring for
1h at this temperature, the solution of F (5.0 g, 16.11 mmol) in DMF was then added and the reaction
mass was stirred at 70 0C for overnight. The dark solution then cooled to room temperature and poured
into ice cooled water. A saturated solution of sodium acetate was slowly added and mixture was stirred
overnight. After overnight stirring brown precipitate was appeared and collect the precipitate and
washed with acetone to obtain the compound G (2.80 g, 52%) as a deep brown solid. 1H NMR (400
MHz, CDCl3): δ (ppm) 10.09 (s, 1H), 7.86 (d, J = 8.8 Hz, 1H), 7.28 (d, J = 5.6 Hz, 1 H), 6.98 (dd, J =
8.8, J = 2.8 Hz, 1 H), 4.27 (t, J = 5.6 Hz , 4 H), 3.74 (t, J = 5.6 Hz, 4 H), 2.03 (s, 6 H). 13C NMR (100
MHz, CDCl3): δ (ppm) 186.2, 170.6, 152.4, 151.8, 131.5, 118.4, 114.7, 106.5, 60.8, 49.8, 20.9.
Compound H. To a stirred solution of C (0.5 g, 1.11 mmol) in anhydrous THF (25 mL), NaOtBu
(0.274 g, 2.44 mmol) was added at 0 0C under N2 atmosphere. After 30 min, G (0.826 g, 2.44 mmol) in
anhydrous THF (20 mL) was added to the reaction mass and stirred for overnight at rt. Water was then
added to quenched the reaction and red precipitate appear, collect the precipitate and washed with
water followed by hexane, crude product was obtained. The crude product was purified by silica
column chromatography by using 7:3 ethyl acetate: hexane to get the compound H as a red solid (0.205
g, 25%). 1H NMR (400 MHz, CDCl3): δ (ppm) 7.83 (d, J = 16.8 Hz, 1 H), 7.64 (d, J = 9.2 Hz, 1 H),
7.34 (d, J = 2.4 Hz, 1 H), 7.02 (dd, J = 9.2, J = 5.6 Hz, 1 H), 6.88 (d, J = 16.8 Hz, 1 H), 4.28 (t, J = 5.6
S7
Hz, 4H), 3.70 (t, J = 5.6 Hz, 4H), 2.05 (s, 6 H) ppm. 13C NMR (100 MHz, CDCl3): δ (ppm) 170.7,
149.4, 147.9, 145.9, 143.3, 131.7, 128.9, 120.2, 116.3, 115.2, 107.3, 61.2, 49.8, 21.1.
Compound I. A solution of H (0.08 g, 0.098 mmol) in P(OEt)3 (5 mL) was heated under reflux at 125
0C for overnight under N2 atmosphere. The solvent was removed in vacuo and the product was purified
on a silica column chromatography using 7:3 ethyl acetate: hexane to pure ethyl acetate to yield the
compound I (0.050 g, 68%) as a red solid. 1H NMR (400 MHz,CDCl3 contained 2-drops of d6-DMSO):
δ (ppm) 9.31 (s, 1H), 7.34 (d, J = 8.8 Hz, 1 H), 6.89 (s, 1H), 6.59 (s, 1H), 6.58 (dd, J = 8.8 Hz, J = 1.6
Hz, 1 H), 4.15 (t, J = 6.0 Hz, 4H), 3.54 (t, J = 6.0 Hz, 4H), 1.93 (s, 6H). 13C NMR (100 MHz, CDCl3
contained 2-drops of d6-DMSO): δ (ppm) 170.5, 144.6, 142.2, 138.5, 138.3, 122.3, 121.5, 119.9, 108.9,
106.5, 93.3, 61.4, 50.3, 20.8.
Compound 2 (QAD1). A solution of I (0.05 g, 0.026 mmol) in methanol (10 mL) was added 20 µL of
NaOMe solution and stirred the reaction mass at 0 0C for 60 min. Then the solvent was evaporated and
the residue was dissolved in CHCl3 (25 mL, contained 2.5 mL MeOH) washed with saturated NH4Cl
solution (25 mL). The organic layer was dried over anhydrous MgSO4 and concentrated under in vacuo.
The crude product was further purified by silica column chromatography using 1:20 CH3OH:CHCl3 as
an eluent to obtain 2 as a deep brown solid (quantitative yield). 1H NMR (300 MHz, d6-DMSO): δ
(ppm) 10.89 (s, 1H), 7.41 (d, J = 9.2 Hz, 1 H), 6.85 (s, 1H), 6.73 (s, 1 H), 6.57 (d, J = 8.0 Hz, 1 H),
4.78 (bs, 2H), 3.59 (t, J = 6.0 Hz, 4H), 3.48 (t, J = 6 .4 Hz, 4H). 13C NMR (100 MHz, d6-DMSO): δ
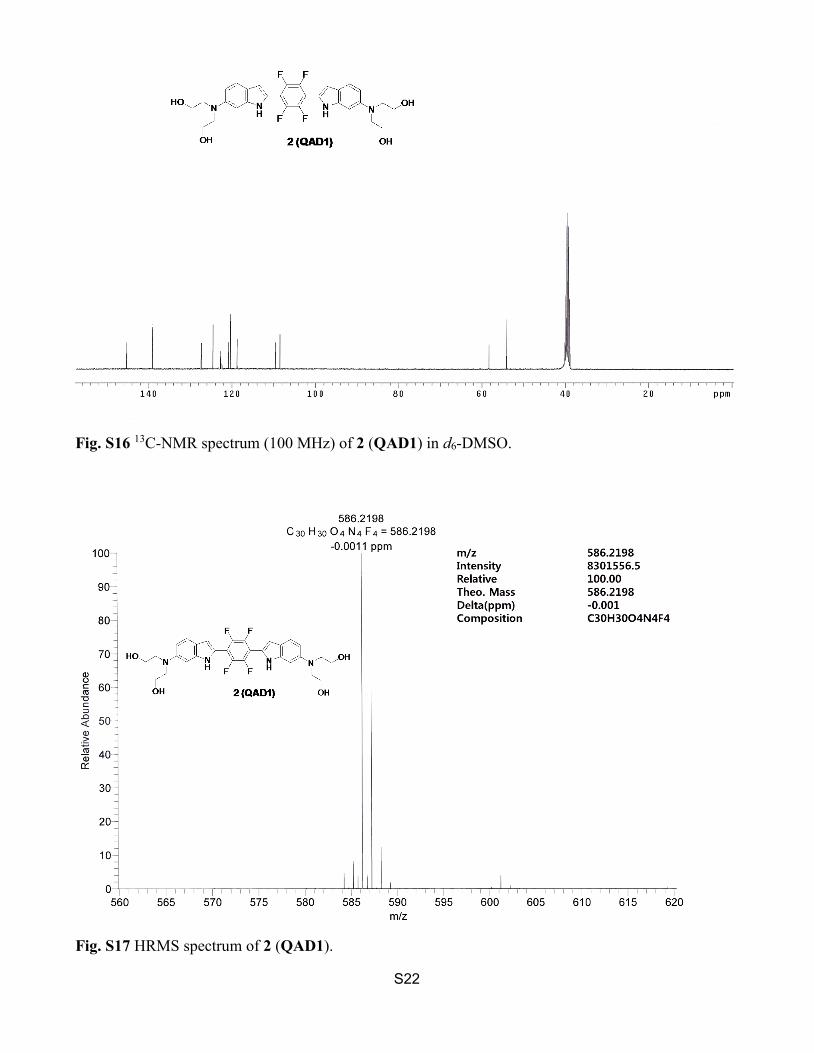
(ppm) 145.3, 139.1, 127.8, 124.5, 122.7, 120.8, 120.4, 118.7, 109.6, 108.6, 58.3, 53.9. HRMS (FAB+):
m/z calcd for [C30H30N4O4F4]: 586.2198, found: 586.2198
Compound J. NaH (0.016 g, 0.68 mmol) and 18-Crown-6 (0.011 g, 0.045 mmol) were dissolved in
anhydrous THF (10 mL) under nitrogen atmosphere and allowed to stirring for 10 min. Then a solution
of compound 2 (0.07 g, 0.15 mmol) in THF was added dropwise to the reaction mass and allowed to
reflux for 1hr at 80 0C. After 1hr the reaction mass was allowed to stirring at rt then 0 0C, at this
temperature a solution of 2-bromoethylacetate (36 µL, 0.33 mmol) in THF was added dropwise and
S8
allowed to stirring overnight at rt. After completion of the reaction THF was distilled out in vacuo and
the residue was dissolved in ethylacetate (50 mL) and washed with water (2 x 25 mL), the organic layer
dried over Na2SO4 and distilled out the organic solvent to obtain the crude which was purified by
column chromatography (3:7 ethyl acetate: hexanes as an eluent) afforded J as a yellow solid. Yield:
0.067 (71 %). 1H NMR (400MHz, CDCl3): δ (ppm) 7.55 (d, J = 8.8 Hz, 1H), 6.84 (dd, J = 8.8 Hz, J =
2.4 Hz, 1 H ), 6.70 (d, J = 1.6 Hz, 1H), 6.50 (s, 1H), 4.30-4.27 (m, 4H), 3.04 (s, 6H), 1.92 (s, 3H). 13C
NMR (100 MHz, CDCl3): δ (ppm) 170.6, 148.5, 145.9, 143.3, 139.1, 122.2, 121.7, 120.3, 113.2, 110.2,
106.7, 93.1, 64.4, 41.9, 29.9, 20.8.
Compound 3. A solution of J (0.05 g, 0.078 mmol) in methanol (10 mL) was added 20 µL of NaOMe
solution and stirred the reaction mixture at 0 0C for 60 min. Then the solvent was evaporated and the
residue was dissolved in CHCl3 (25 mL, contained 2.5 mL MeOH) washed with saturated NH4Cl
solution (25 mL). The organic layer was dried over anhydrous MgSO4 and concentrated under vacuo.
The crude was purified by silica column chromatography using 7:3 ethyl acetate: hexanes as an eluent
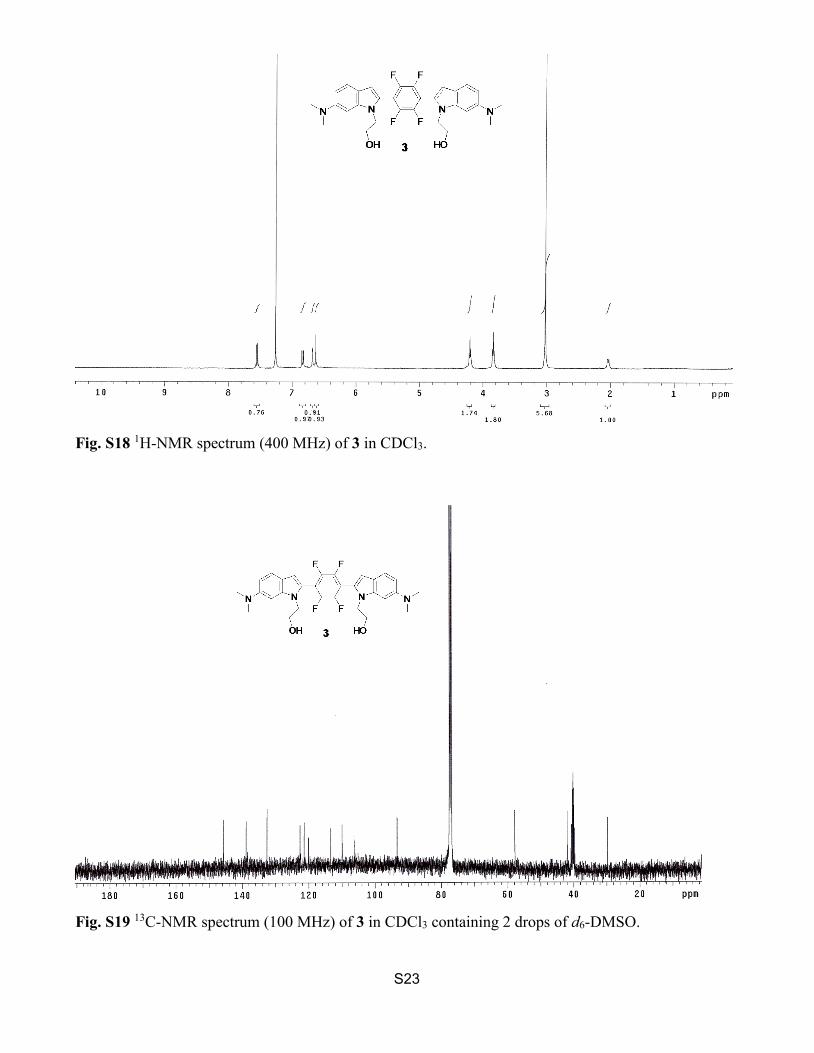
to obtain 3 as a yellow solid. Yield: 0.034 g (81 %). 1H NMR (300 MHz, CDCl3): δ (ppm) 7.55 (d, J =
8.4 Hz, 1 H), 6.83 (dd, J = 8.8 Hz, J = 2.0 Hz, 1 H), 6.68 (d, J = 2.0 Hz, 1 H), 6.63 (s, 1 H), 4.21 (t, J =
5.6 Hz, 2H), 4.84 (t, J = 5.2 Hz, 2H). 13C NMR (100 MHz, CDCl3 contained 2-drops of d6-DMSO): δ
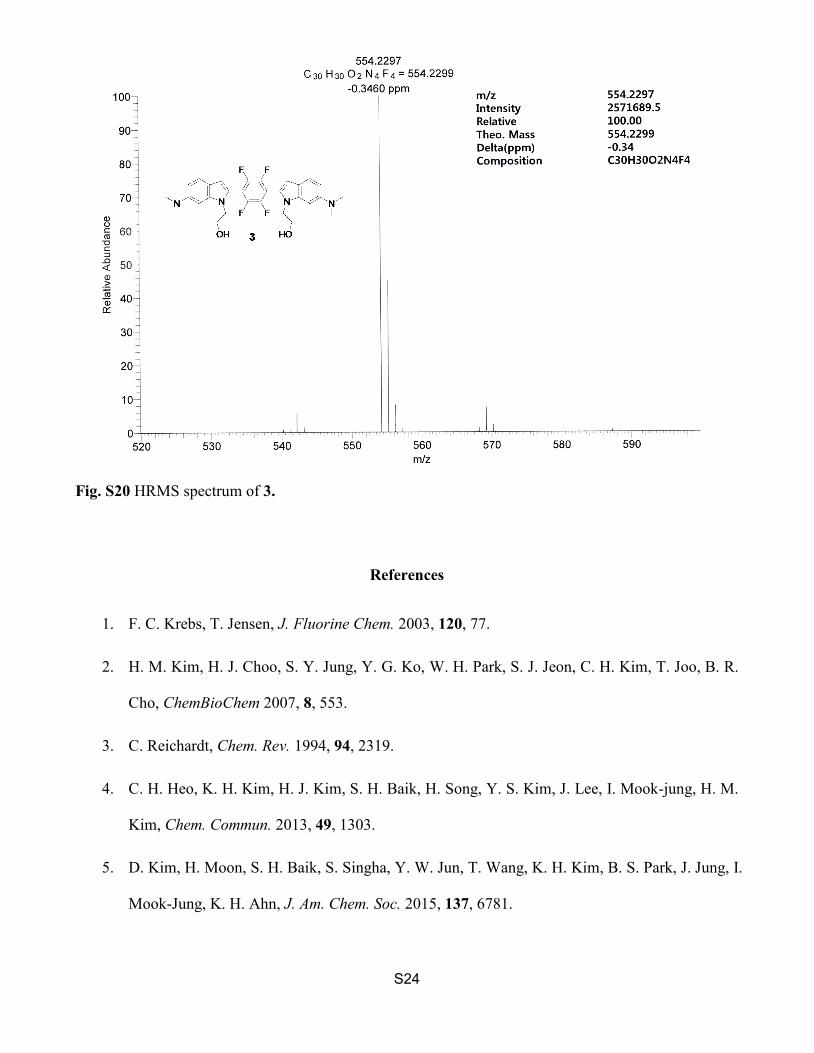
(ppm) 145.5, 138.9, 132.6, 122.6, 121.4, 120.2, 113.4, 109.9, 106.3, 93.4, 57.8, 42.8, 29.8. HRMS
(FAB+): m/z calcd for [C30H30N4O2F4]: 554.2299, found: 554.2297.

S9
Water Solubility of QAD1. Small amount of dye was dissolved in DMSO to prepare the stock solutions (1.0 × 10⁻² M). The solution was diluted to (1.0 × 10⁻⁵ ~ 1.0 × 10⁻⁷) M and added to a cuvette containing 3.0 mL of PBS buffer (10 mM, pH 7.4) by using a micro syringe. In all cases, the concentration of DMSO in H2O was maintained to be 0.1 %.2 The plot of absorption intensity against the total amount of the dye injected to the cuvette was linear at low dye content and showed curvature as more dye was added. The maximum point in the linear region was taken as the solubility. The solubility of 1, QAD1 and 3 in PBS buffer were ~1.0, ~4.0 and ~3.0 μM, respectively.
Fig. S1 (a,c,e) One-photon absorption spectra and (b,d,f) plot of intensity against probe concentration for (a,b) 1, (c,d) QAD1 and (e,f) 3 in PBS buffer (10mM, pH 7.4).
0.0 2.0x10⁻⁶ 4.0x10⁻⁶ 6.0x10⁻⁶ 8.0x10⁻⁶ 1.0x10-50.00
0.02
0.04
0.06
0.08
0.10
0.12
0.14
0.16
Abso
rban
ce (a
.u.)
[QAD1] / M300 350 400 450 500 550 600 650
0.00
0.02
0.04
0.06
0.08
0.10
0.12
0.14
0.16
Abso
rban
ce (a
.u.)
Wavelength (nm)
10.0 µM
0.05 µM
(a) (b)
(c) (d)
(e) (f)
Solubility ~1 μM
Solubility ~4 μM
Solubility ~3 μM
0.0 2.0x10⁻⁶ 4.0x10⁻⁶ 6.0x10⁻⁶ 8.0x10⁻⁶ 1.0x10-50.00
0.01
0.02
0.03
0.04
0.05
0.06
0.07
Abso
rban
ce (a
.u.)
[1] / M
0.0 2.0x10⁻⁶ 4.0x10⁻⁶ 6.0x10⁻⁶ 8.0x10⁻⁶ 1.0x10-50.000
0.005
0.010
0.015
0.020
0.025
0.030
Abso
rban
ce (a
.u.)
[3] / M300 350 400 450 500 550 600 650
0.000
0.005
0.010
0.015
0.020
0.025
0.030
Abso
rban
ce (a
.u.)
Wavelength (nm)
10.0 µM
0.05 µM
300 350 400 450 500 550 600 6500.00
0.01
0.02
0.03
0.04
0.05
0.06
0.07
Abso
rban
ce (a
.u.)
10.0 µM
0.05 µM
Wavelength (nm)
S10
Fig. S2 (a, c, e) Normalized absorption and (b, d, f) emission spectra of (a, b) 1, (c, d) QAD1 and (e, f) 3 and in 1,4-dioxane, EtOH, EtOH: PBS (v/v, 1:1) and PBS buffer (10 mM, pH 7.4).
400 450 500 550 600 650 7000.0
0.2
0.4
0.6
0.8
1.0 1,4-Dioxane EtOH EtOH:Buffer (1:1)
Norm
alize
d Fl
uore
scen
ce In
tens
ity
Wavelength (nm)300 350 400 450 500 550
0.0
0.2
0.4
0.6
0.8
1.0 1,4-Dioxane EtOH EtOH:Buffer (1:1) Buffer
Norm
alize
d Ab
sorb
ance
Wavelength (nm)
450 500 550 600 650 7000.0
0.2
0.4
0.6
0.8
1.0 1,4-Dioxane EtOH EtOH:Buffer (1:1) Buffer
Norm
alize
d Fl
uore
scen
ce In
tens
ity
Wavelength (nm)
450 500 550 600 650 7000.0
0.2
0.4
0.6
0.8
1.0 1,4-Dioxane EtOH EtOH:Buffer (1:1)
Norm
alize
d Fl
uore
scen
ce In
tens
ity
Wavelength (nm)
300 350 400 450 500 5500.0
0.2
0.4
0.6
0.8
1.0 1,4-Dioxane EtOH EtOH:Buffer (1:1) Buffer
Norm
alize
d Ab
sorb
ance
Wavelength (nm)
300 350 400 450 500 5500.0
0.2
0.4
0.6
0.8
1.0 1,4-Dioxane EtOH EtOH:Buffer (1:1) Buffer
Norm
alize
d Ab
sorb
ance
Wavelength (nm)
(a) (b)
(c) (d)
(e) (f)
S11
Table S1. Photophysical data for 1, QAD1 and 3 in various solvents. Probe Solvent (𝐸𝐸𝑇𝑇𝑁𝑁)a 𝜆𝜆𝑚𝑚𝑚𝑚𝑚𝑚
(1) b 𝜆𝜆𝑚𝑚𝑚𝑚𝑚𝑚𝑓𝑓𝑓𝑓 c Φd 𝜆𝜆𝑚𝑚𝑚𝑚𝑚𝑚
(2) e δf Φδg
1
1,4-Dioxane (0.164) 427 489 0.97 - - - EtOH (0.654) 413 515 0.50 750 540 270 EtOH:PBS (1:1) 401 538 0.06 - - - PBS (1.00)h 417 ND[i] ND[i] - - -
QAD1
1,4-Dioxane (0.164) 438 490 1.00 - - - EtOH (0.654) 426 508 0.73 750 575 420 EtOH:PBS (1:1) 424 523 0.10 - - - PBS (1.00)h 407 546 0.01 - - -
3
1,4-Dioxane (0.164) 367 495 0.28 - - - EtOH (0.654) 371 521 0.03 720 80 2 EtOH:PBS (1:1) 339 422 0.04 - - - PBS (1.00)h 326 ND[i] ND[i] - - -
a The numbers in the parenthesis are normalized empirical parameter of solvent polarity.3 b λmax of the one-photon absorption spectra in nm. c λmax of the one-photon emission spectra in nm. d Fluorescence quantum yield. The uncertainty is ± 10 %. e λmax of the two-photon excitation spectra in nm. f The peak two-photon absorption cross-section in 10-50 cm4s/photon (GM). g The peak two-photon action cross-section in 10-50 cm4s/photon. h PBS buffer (10mM, pH 7.4). The 𝐸𝐸𝑇𝑇𝑁𝑁value is for water. i Not determined. The one- and two-photon excited fluorescence signals were too small to determine the values.
Fig. S3 Molar absorptivity spectra of 1, QAD1 and 3 (1 µM) acquired in EtOH.
300 350 400 450 500 5500.00.51.01.52.02.53.03.54.04.5
ε x 1
0-4M
-1cm
-1
Wavelength (nm)
1 QAD1 3
S12
Fig. S4 Effect of pH for QAD1 in universal buffer (0.1 M citric acid, 0.1 M KH2PO4, 0.1 M Na2B4O7, 0.1 M Tris, 0.1 M KCl). The excitation wavelength was 407 nm.
4 5 6 7 8 90
20
40
60
80
100
Fluo
resc
ence
Inte
nsity
(a.u
.)
pH
S13
Fig. S5 DFT (Density Functional Theory) optimized geometries and MO’s distribution of (a) QAD1 and (b) 3 in EtOH. Table S2. DFT (Density functional theory) calculation of QAD1 and 3 in EtOH.
Probe isomer Relative energy
(kJ/mol) HOMO-LUMO
energy (eV) Oscillator strength
QAD1 cis 0.09 2.56
2.56 1.91
trans 0 1.92
3 cis 0.44 2.67
2.66 0.98
trans 0 0.97
MO’s distribution
HOMO
LUMO
(a)
(b)
QAD1
HOMO
LUMO
3
S14
Fig S6. (a) Change in emission intensity and (b) the fluorescence titration curve for the complexation of QAD1 (1 µM) with Aβ1-42 oligomer (0-10 µM) in PBS buffer (10 mM, pH 7.4). The calculated value is represented by solid line. The excitation wavelength was 407 nm and the fluorescence intensity was measured at 517 nm. Table S3. Complexation Study of QAD1 with Aβ1-42 aggregates and oligomer.a,b
Probe 𝜆𝜆𝑚𝑚𝑚𝑚𝑚𝑚(1) c 𝜆𝜆𝑚𝑚𝑚𝑚𝑚𝑚
𝑓𝑓𝑓𝑓 d Φ e Kd f FEF g
QAD1 407 546 0.01 16.2 ± 1.8 (nM) 85
QAD1 + Aβ1-42 aggregates 455 510 0.43
QAD1 407 546 0.01 21.5 ± 1.7 (nM) 43.2
QAD1 + Aβ1-42 oligomer 441 517 0.27
a See Scheme 1 in the text for the chemical structure. b All data measured in PBS buffer (10 mM, pH
7.4) in the absence and presence of 10 μM Aβ1-42 aggregated and oligomer. c λmax of the one-photon absorption spectra in nm. d λmax of the one-photon emission spectra in nm. e Fluorescence quantum yield. The uncertainty is ±10%. f Dissociation constants measured by one-photon processes in the presence of Aβ1-42 aggregated (0-10 μM) and Aβ1-42 oligomer (0-10 μM). The uncertainty is ±10%. g Fluorescence enhancement factor, (F-Fmin)/Fmin.
450 500 550 600 650 7000
400
800
1200
1600
20001000 nM
0 nM
Fluo
resc
ence
Inte
nsity
(a.u
.)
Wavelength (nm)0 2000 4000 6000 8000 10000
0
400
800
1200
1600
2000
Fluo
resc
ence
Inte
nsity
(a.u
.)
Aβ1-42 oligomer/nM
(a) (b)
S15
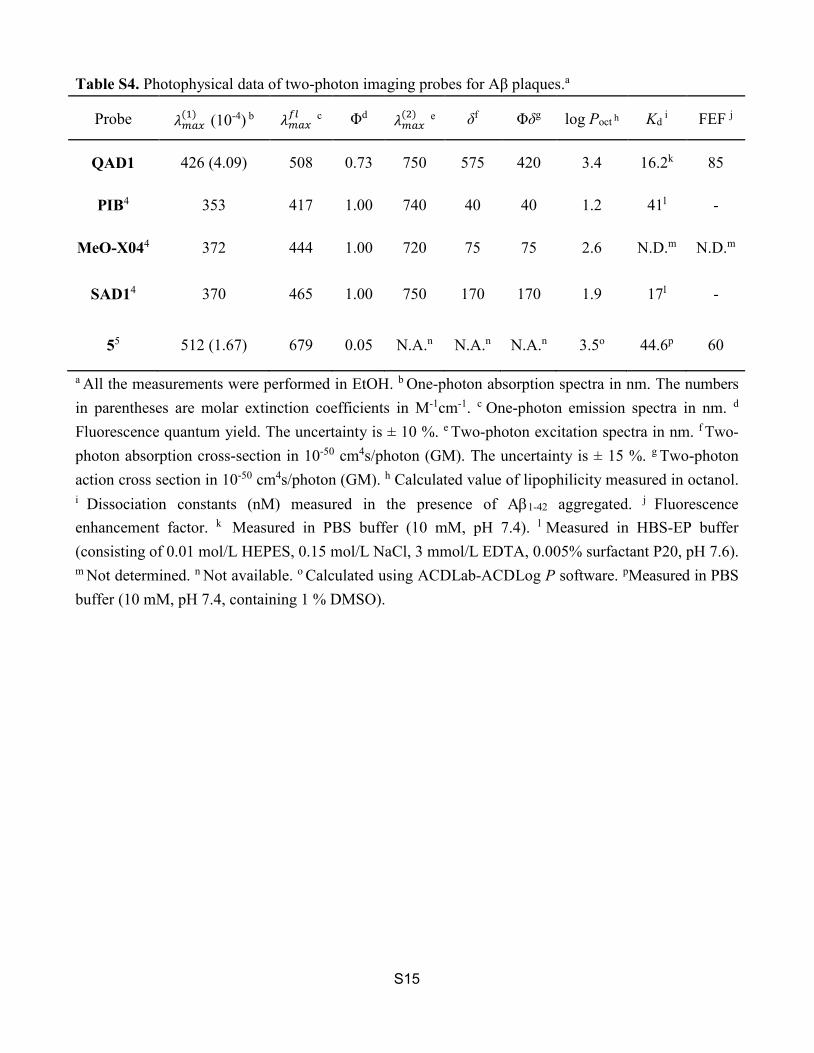
Table S4. Photophysical data of two-photon imaging probes for Aβ plaques.a
Probe 𝜆𝜆𝑚𝑚𝑚𝑚𝑚𝑚(1) (10-4) b 𝜆𝜆𝑚𝑚𝑚𝑚𝑚𝑚
𝑓𝑓𝑓𝑓 c Φd 𝜆𝜆𝑚𝑚𝑚𝑚𝑚𝑚(2) e δf Φδg log Poct h Kd
i FEF j
QAD1 426 (4.09) 508 0.73 750 575 420 3.4 16.2k 85
PIB4 353 417 1.00 740 40 40 1.2 41l -
MeO-X044 372 444 1.00 720 75 75 2.6 N.D.m N.D.m
SAD14 370 465 1.00 750 170 170 1.9 17l -
55 512 (1.67) 679 0.05 N.A.n N.A.n N.A.n 3.5o 44.6p 60
a All the measurements were performed in EtOH. b One-photon absorption spectra in nm. The numbers in parentheses are molar extinction coefficients in M-1cm-1. c One-photon emission spectra in nm. d
Fluorescence quantum yield. The uncertainty is ± 10 %. e Two-photon excitation spectra in nm. f Two-photon absorption cross-section in 10-50 cm4s/photon (GM). The uncertainty is ± 15 %. g Two-photon action cross section in 10-50 cm4s/photon (GM). h Calculated value of lipophilicity measured in octanol. i Dissociation constants (nM) measured in the presence of Aβ1-42 aggregated. j Fluorescence enhancement factor. k Measured in PBS buffer (10 mM, pH 7.4). l Measured in HBS-EP buffer (consisting of 0.01 mol/L HEPES, 0.15 mol/L NaCl, 3 mmol/L EDTA, 0.005% surfactant P20, pH 7.6). m Not determined. n Not available. o Calculated using ACDLab-ACDLog P software. pMeasured in PBS buffer (10 mM, pH 7.4, containing 1 % DMSO).
S16
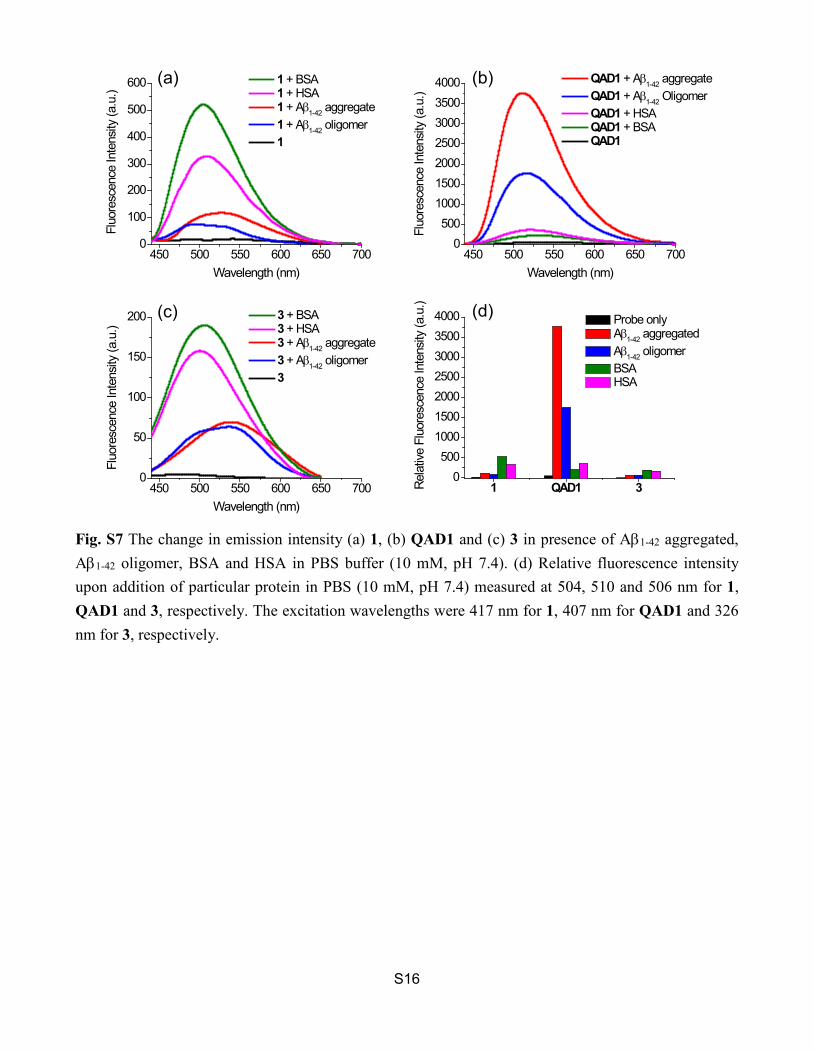
Fig. S7 The change in emission intensity (a) 1, (b) QAD1 and (c) 3 in presence of Aβ1-42 aggregated, Aβ1-42 oligomer, BSA and HSA in PBS buffer (10 mM, pH 7.4). (d) Relative fluorescence intensity upon addition of particular protein in PBS (10 mM, pH 7.4) measured at 504, 510 and 506 nm for 1, QAD1 and 3, respectively. The excitation wavelengths were 417 nm for 1, 407 nm for QAD1 and 326 nm for 3, respectively.
450 500 550 600 650 7000
50
100
150
200 3 + BSA 3 + HSA 3 + Aβ1-42 aggregate 3 + Aβ1-42 oligomer 3
Fluo
resc
ence
Inte
nsity
(a.u
.)
Wavelength (nm)
450 500 550 600 650 7000
100
200
300
400
500
600 1 + BSA 1 + HSA 1 + Aβ1-42 aggregate 1 + Aβ1-42 oligomer 1
Fluo
resc
ence
Inte
nsity
(a.u
.)
Wavelength (nm)450 500 550 600 650 700
0500
1000150020002500300035004000
Fluo
resc
ence
Inte
nsity
(a.u
.)
Wavelength (nm)
QAD1 + Aβ1-42 aggregate QAD1 + Aβ1-42 Oligomer QAD1 + HSA QAD1 + BSA QAD1
(a) (b)
(c) (d)
1 QAD1 30
5001000150020002500300035004000 Probe only
Aβ1-42 aggregated Aβ1-42 oligomer BSA HSA
Rela
tive
Fluo
resc
ence
Inte
nsity
(a.u
.)
S17
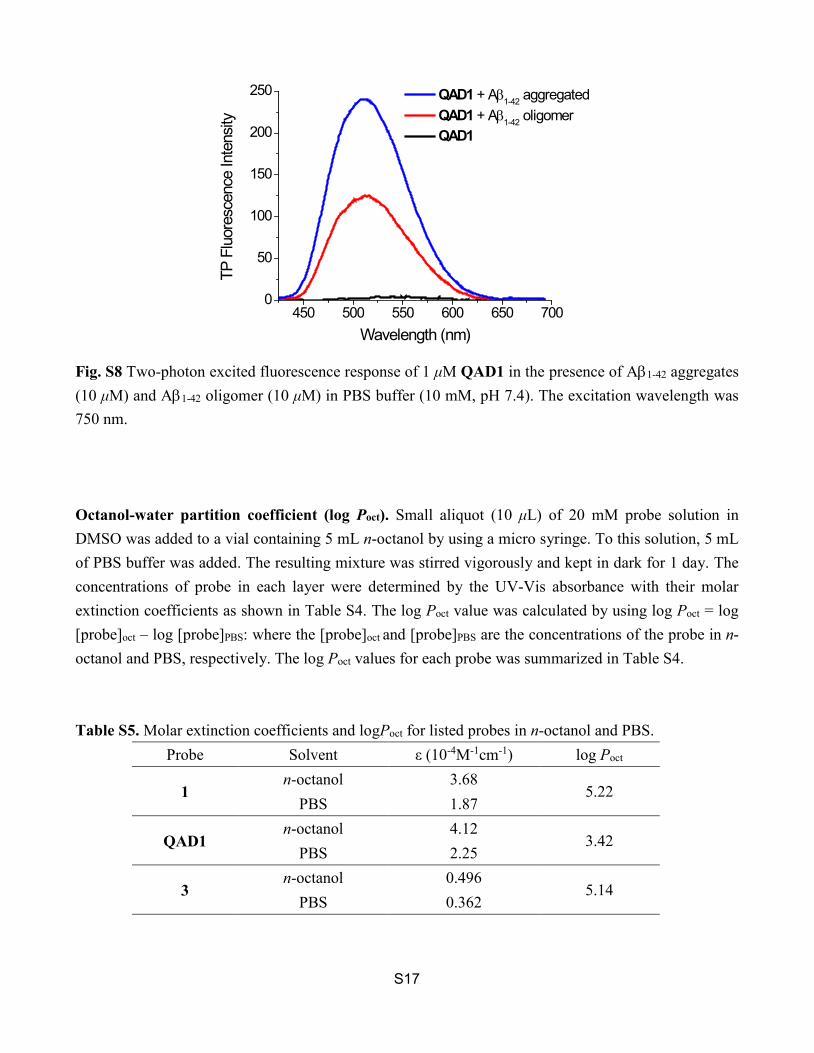
Fig. S8 Two-photon excited fluorescence response of 1 μM QAD1 in the presence of Aβ1-42 aggregates (10 μM) and Aβ1-42 oligomer (10 μM) in PBS buffer (10 mM, pH 7.4). The excitation wavelength was 750 nm. Octanol-water partition coefficient (log Poct). Small aliquot (10 μL) of 20 mM probe solution in DMSO was added to a vial containing 5 mL n-octanol by using a micro syringe. To this solution, 5 mL of PBS buffer was added. The resulting mixture was stirred vigorously and kept in dark for 1 day. The concentrations of probe in each layer were determined by the UV-Vis absorbance with their molar extinction coefficients as shown in Table S4. The log Poct value was calculated by using log Poct = log [probe]oct – log [probe]PBS: where the [probe]oct and [probe]PBS are the concentrations of the probe in n-octanol and PBS, respectively. The log Poct values for each probe was summarized in Table S4. Table S5. Molar extinction coefficients and logPoct for listed probes in n-octanol and PBS.
Probe Solvent ε (10-4M-1cm-1) log Poct
1 n-octanol 3.68
5.22 PBS 1.87
QAD1 n-octanol 4.12
3.42 PBS 2.25
3 n-octanol 0.496
5.14 PBS 0.362
450 500 550 600 650 7000
50
100
150
200
250
TP F
luor
esce
nce
Inte
nsity
Wavelength (nm)
QAD1 + Aβ1-42 aggregated QAD1 + Aβ1-42 oligomer QAD1
S18
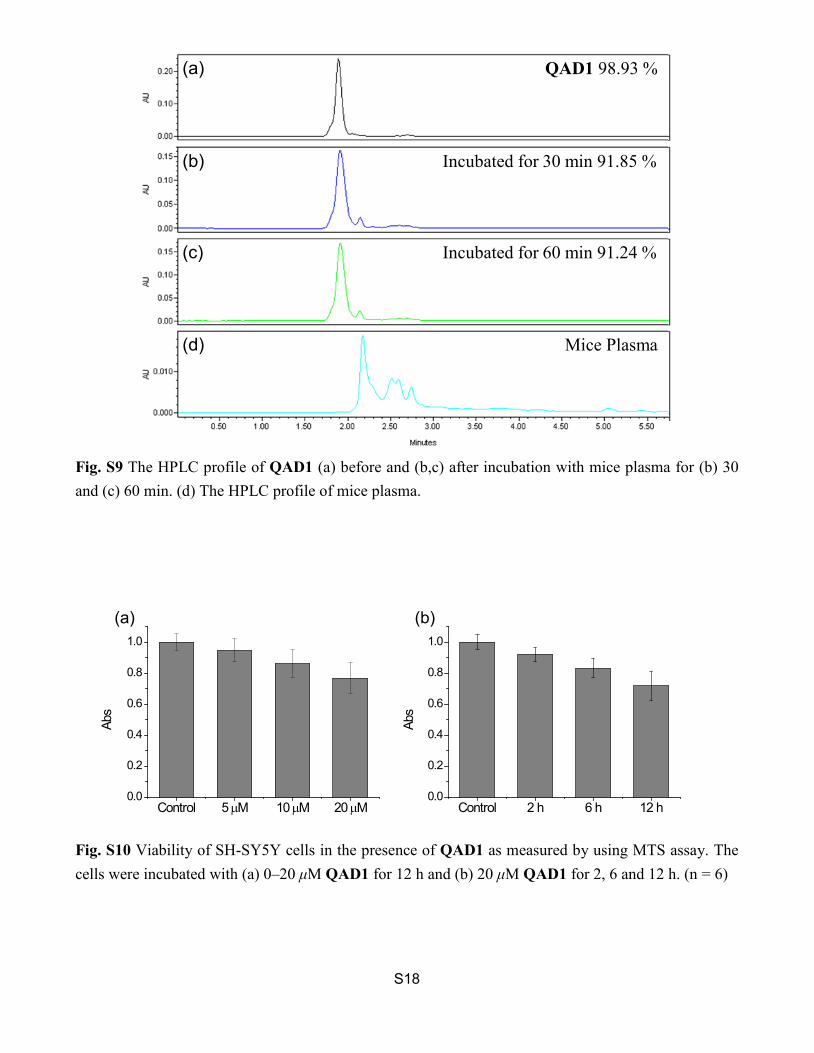
Fig. S9 The HPLC profile of QAD1 (a) before and (b,c) after incubation with mice plasma for (b) 30 and (c) 60 min. (d) The HPLC profile of mice plasma.
Fig. S10 Viability of SH-SY5Y cells in the presence of QAD1 as measured by using MTS assay. The cells were incubated with (a) 0–20 μM QAD1 for 12 h and (b) 20 μM QAD1 for 2, 6 and 12 h. (n = 6)
(a)
(b)
(c)
(d)
QAD1 98.93 %
Incubated for 30 min 91.85 %
Incubated for 60 min 91.24 %
Mice Plasma
Control 2 h 6 h 12 h0.0
0.2
0.4
0.6
0.8
1.0
Abs
Control 5 µM 10 µM 20 µM0.0
0.2
0.4
0.6
0.8
1.0
Abs
(a) (b)
S19
Fig. S11 In Vivo TPM images of the frontal cortex of transgenic 5XFAD mice at (a) 0, (b) 30, (c) 60 and (d) 150 min after i.v. injection of QAD1 (10mg/Kg). Scale bar: 50 µm. (e) Two-photon excited fluorescence intensity (normalized) as a function of time acquired from the blood vessels (red circle in Fig S11 a-d) and the plaque (white circle in Fig S11 a-d). (f) Decay rates of the TPEF in the blood vessels (red circle). The slopes of these plots are the 1st order decay constant. Half-life (t1/2) were calculated by using the relationship, t1/2 = 0.693/k.
0 s 30 min
1h 2 h 30min
(a) (b)
(c) (d)
(e)
(f)
0 20 40 60 80 100 120 140-3.5
-3.0
-2.5
-2.0
-1.5
-1.0
-0.5
0.0
ln(I-
I ∞)/(I 0-I
∞)
Time / min
blood vessles
t1/2 = 35.7 min
0 20 40 60 80 100 120 140
0.3
0.4
0.5
0.6
0.7
0.8
0.9
1.0
Aβ plaques blood vessles
Norm
alize
d In
tens
ity
Time / min
S20
1H-NMR, 13C-NMR and HRMS of 1, QAD1 and 3.
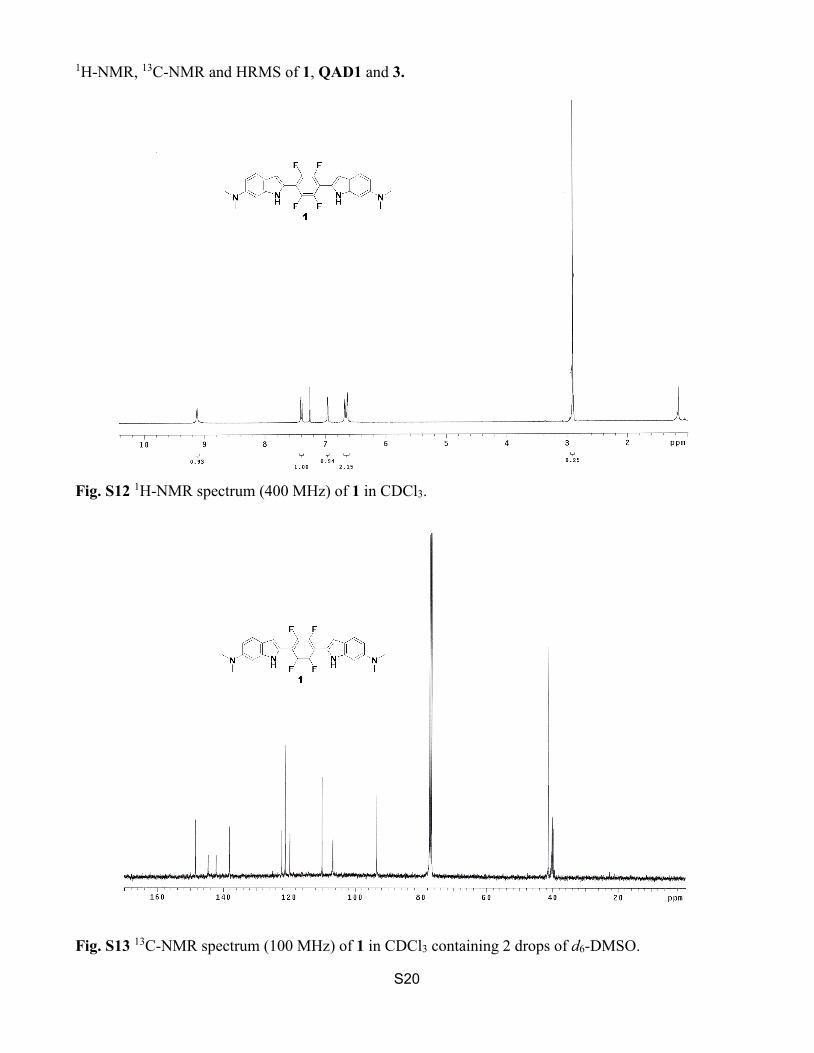
Fig. S12 1H-NMR spectrum (400 MHz) of 1 in CDCl3.
Fig. S13 13C-NMR spectrum (100 MHz) of 1 in CDCl3 containing 2 drops of d6-DMSO.
S21
Fig. S14 HRMS spectrum of 1.
Fig. S15 1H-NMR spectrum (400 MHz) of 2 (QAD1) in d6-DMSO.
S22
Fig. S16 13C-NMR spectrum (100 MHz) of 2 (QAD1) in d6-DMSO.
Fig. S17 HRMS spectrum of 2 (QAD1).
S23
Fig. S18 1H-NMR spectrum (400 MHz) of 3 in CDCl3.
Fig. S19 13C-NMR spectrum (100 MHz) of 3 in CDCl3 containing 2 drops of d6-DMSO.
S24
Fig. S20 HRMS spectrum of 3.
References
1. F. C. Krebs, T. Jensen, J. Fluorine Chem. 2003, 120, 77.
2. H. M. Kim, H. J. Choo, S. Y. Jung, Y. G. Ko, W. H. Park, S. J. Jeon, C. H. Kim, T. Joo, B. R.
Cho, ChemBioChem 2007, 8, 553.
3. C. Reichardt, Chem. Rev. 1994, 94, 2319.
4. C. H. Heo, K. H. Kim, H. J. Kim, S. H. Baik, H. Song, Y. S. Kim, J. Lee, I. Mook-jung, H. M.
Kim, Chem. Commun. 2013, 49, 1303.
5. D. Kim, H. Moon, S. H. Baik, S. Singha, Y. W. Jun, T. Wang, K. H. Kim, B. S. Park, J. Jung, I.
Mook-Jung, K. H. Ahn, J. Am. Chem. Soc. 2015, 137, 6781.