· annee 2014 thÈse / universitÉ de rennes 1 sous le sceau de l’université européenne de...
TRANSCRIPT
ANNEE 2014
THÈSE / UNIVERSITÉ DE RENNES 1
sous le sceau de l’Université Européenne de Bretagne
pour le grade de
DOCTEUR DE L’UNIVERSITÉ DE RENNES 1
Mention : Santé
Ecole doctorale Vie-Agro-Santé
présentée par
Anne Bernard Unité de recherche (UMR 1099, LTSI)
Laboratoire de Traitement du Signal et de l’Image (Université de Rennes 1)
Thèse soutenue à Rennes le 16 décembre 2014
devant le jury composé de :
Bernard COSYNS Associate Professor, Université de Bruxelles/rapporteur
Stéphane NOTTIN Maitre de conférences, Université d’Avignon/rapporteur
Jean-Claude DAUBERT PU-PH, CHU de Rennes/examinateur
Gilbert HABIB PU-PH, CHU de Marseille/examinateur
Alfredo HERNANDEZ Directeur de recherche INSERM, Université de Rennes 1/examinateur
Erwan DONAL PU-PH, CHU de Rennes /directeur de thèse
Prédiction de la Réponse à la ResynchronisationCardiaque :
Au-delà des Asynchronismes

2
SOMMAIRE
INTRODUCTION 5
PARTIE 1 : GENERALITES 8
1.1. Historique de la resynchronisation cardiaque
1.2. Problématique de la resynchronisation cardiaque
1.2.1. La réponse à la technique 1.2.2. Les complications de la technique 1.2.3. Les recommandations internationales
1.3. Prédire la réponse : nécessité et modalités
1.3.1. Problématique de la non-réponse
1.3.2. Approche électrique
1.3.3. Approche mécanique
1.4. Paramètres échocardiographiques de prédiction
1.4.1. Critères initiaux et limites
1.4.1.1. Asynchronisme atrio-ventriculaire
1.4.1.2. Asynchronisme interventriculaire
1.4.1.3. Asynchronisme intraventriculaire
1.4.2. Approche monoparamétrique vs. multiparamétrique
1.5. Nouvelles techniques d’exploration : déformations et asynchronismes
1.5.1. Déformations : histoire et bases physiques
1.5.2. Déformations et mécanique cardiaque
1.5.3. Déformations et analyse de l’asynchronisme mécanique
1.6. Asynchronismes mécaniques en échocardiographie 3D
1.7. Anomalies mécaniques ventriculaires gauches ou approche mécanistique
1.8. Asynchronismes et pronostic
1.9. Au-delà des asynchronismes et de la réponse
PARTIE 2 : HYPOTHESES ET OBJECTIFS 47
2.1. L’impact des structures connexes : le ventricule droit

3
2.2. Le concept d’évaluation à l’effort dans l’étude de la réserve contractile
2.3. Activation septale et approche multiparamétrique
2.4. Nouveaux paramètres issus des courbes de déformation myocardique : l’analyse des courbes de déformation longitudinale par les intégrales
2.4.1. Analyse de la morphologie des courbes de déformation par l’analyse des intégrales avant et après resynchronisation cardiaque
2.4.2. Association de paramètres classiques d’asynchronisme et de paramètres dérivés de l’analyse des intégrales des courbes de déformation : une approche multiparamétrique pour la prédiction de la réponse à la resynchronisation cardiaque
PARTIE 3 : METHODES 51
3.1. Population
3.1.1. Cohorte de Rennes
3.1.2. Implantation du dispositif de resynchronisation cardiaque
3.1.3. Suivi
3.1.4. Cohorte de Lille
3.2. Analyses échocardiographiques
3.3. Analyse de l’asynchronisme mécanique
3.4. Analyse Matlab des courbes de déformation
PARTIE 4 : RESULTATS 59
4.1. L’impact des structures connexes : le ventricule droit 60
4.2. Le concept d’évaluation à l’effort dans l’étude de la réserve contractile 64
4.3. Activation septale et approche multiparamétrique 69
4.4. Nouveaux paramètres issus des courbes de déformation : l’analyse des courbes de déformation longitudinale par les intégrales 74
4.4.1. Analyse de la morphologie des courbes de déformation par l’analyse des intégrales avant et après resynchronisation cardiaque
4.4.2. Association de paramètres classiques d’asynchronisme et de paramètres dérivés de l’analyse des intégrales des courbes de déformation : une approche multiparamétrique pour la prédiction de la réponse à la resynchronisation cardiaque

4
PARTIE 5 : PERSPECTIVES 89
CONCLUSION 96
BIBLIOGRAPHIE 98
ANNEXES 111
Articles publiés et articles soumis, en révision
Communications orales et affichées
5
INTRODUCTION
L’insuffisance cardiaque reste en 2014 un enjeu majeur de santé publique et
sociétal touchant plus de 15 millions d’Européens et 6 millions d’Américains, soit
une prévalence de 1 à 2%1. Les projections d’évolution de la maladie en 2030
présagent selon l’AHA une augmentation de plus de 25%. La mortalité reste
particulièrement élevée avec plus de 40% des patients qui décèdent dans l’année
suivant la première hospitalisation. Les coûts imputables à l’insuffisance cardiaque
sont majeurs, principalement générés par la répétition des hospitalisations, avec
pour exemple en 2006, 40 millions de dollars de dépenses directes aux Etats-Unis.
Les traitements de cette pathologie syndromique sont bien codifiés par les sociétés
savantes insistant sur l’optimisation de la thérapeutique médicale en première ligne.
En l’absence d’efficacité, les recommandations européennes établissent la
resynchronisation cardiaque comme une indication de niveau I chez les patients en
insuffisance cardiaque chronique avec une fraction d’éjection ventriculaire gauche ≤
35%, un rythme sinusal, un bloc de branche gauche et une durée de QRS > 120 ms
sur l’électrocardiogramme de surface qui demeurent symptomatiques (NYHA II, III
ou IV) malgré un traitement médical optimal. En l’absence de morphologie typique
de bloc de branche gauche, les recommandations sont de niveau II2.
Si de nombreux essais cliniques avec plus de 4000 patients inclus ont permis de
valider cette indication, il persiste toutefois un certain nombre de questions non
résolues dont en particulier le pourcentage non négligeable de patients non-
répondeurs à la thérapeutique, de l’ordre de 20 à 40% selon les critères de réponse
appliqués3. En raison des complications inhérentes à la technique proposée, la
question de la sélection des patients à resynchroniser est plus que jamais
d’actualité pour réduire le taux de non-réponse à la resynchronisation chez les
patients implantés et améliorer le ratio bénéfice/risque.
Depuis la fin des années 90, de multiples approches cliniques,
électrocardiographiques, ont été proposées pour définir en pré-implantation les
patients susceptibles de répondre favorablement à la resynchronisation cardiaque.

6
En tant qu’outil d’investigation de routine, l’échocardiographie s’est imposée dans
un premier temps comme méthode de prédilection pour appréhender la mécanique
cardiaque dans l’exploration des asynchronismes. De nombreux paramètres ont été
testés et, en partie, validés, exploitant toutes les ressources de la méthode en
pleine évolution. Or, dans une seconde phase, après les résultats décevants de
l’étude PROSPECT4, une réorientation s’est effectuée vers d’autres méthodes
d’investigation, comme l’IRM, mais également, vers une vision plus globale et
physiopathologique de la mécanique cardiaque.
Différentes stratégies comme l’analyse de la mécanique cardiaque, l’approche
multiparamétrique, celle de l’intégration de données tissulaires ou encore
l’association des notions de contractilité et d’asynchronismes ont émergé5. Une
volonté de dépasser les limites de la phase précédente a été clairement affichée en
revenant vers des considérations plus mécanistiques mais également en ayant le
soin de tester la robustesse des données sur des effectifs plus conséquents et de
préférence par des études multicentriques. Ces travaux ont cependant été menés
par des cardiologues ou physiologistes imageurs et non “stimulistes”.
Ce travail de thèse s’affiche dans le prolongement de ces travaux préliminaires en
étudiant la réponse à la resynchronisation au-delà des asynchronismes.
Dans un premier temps, nous nous sommes focalisés sur le rôle des structures
connexes au ventricule gauche, en particulier le rôle du ventricule droit dans ses
interférences potentielles avec les asynchronismes.
Dans un deuxième temps, nous avons exploré le rôle de la viabilité tissulaire ou
réserve contractile à l’effort comme déterminant de la réponse à la
resynchronisation.
Une troisième étape a été celle de déterminer selon l’approche multiparamétrique
un score clinique, électrocardiographique et échographique de prédiction de la
réponse positive au traitement électrique.
La dernière étape du travail a été l’exploration d’une nouvelle approche quantitative
de l’évaluation des asynchronismes mécaniques basée sur l’exploitation des

7
enveloppes des courbes des déformations myocardiques et sur la notion de perte
d’énergie.

8
PARTIE 1 : GENERALITES
9
PARTIE 1 : GENERALITES
1.1. Historique de la resynchronisation cardiaque
Le début des années 90 a été marqué par l’avènement de la resynchronisation
cardiaque comme traitement de l’insuffisance cardiaque à partir d’un faisceau
d’applications du traitement électrique à diverses cardiopathies. La stimulation
cardiaque était le traitement traditionnel des bradycardies et des troubles de
conduction. Au-delà de cette approche classique, plusieurs applications plus
marginales étaient appréhendées avec notamment, la resynchronisation bi-atriale
proposée de façon déterminante par l’équipe Rennaise pour prévenir les épisodes
de fibrillation auriculaire6 mais également la stimulation double chambre testée
dans la myocardiopathie hypertrophique obstructive7. Dans la même lignée, la
stimulation atrio-ventriculaire droite était alors proposée dans l’insuffisance
cardiaque réfractaire, sans indication usuelle de stimulation, avec comme objectif
l’augmentation du remplissage mitral. Après des résultats initiaux prometteurs dans
de petites séries, l’absence de bénéfice dans une population globale était
cependant observée8.
Concernant la resynchronisation cardiaque ou la stimulation gauche, la description
initiale de l'effet hémodynamique aigu favorable date de la fin des années 609, la
resynchronisation cardiaque définitive appliquée à l’homme n’était testée qu’à partir
des années 90. Deux phénomènes ont été précurseurs dans ce concept, avec
d’une part les travaux sur les effets mécaniques délétères du bloc de branche avec
asynchronisme ventriculaire gauche par retard d’activation de la paroi latérale,
d’autre part, l’exploration des mécanismes physiopathologiques expliquant les
réussites mais également les échecs de la stimulation ventriculaire droite10,11. Ainsi
la stimulation cardiaque autorise conceptuellement la resynchronisation atrio-
ventriculaire droite tout en favorisant la séquence d’activation ventriculaire gauche
(d’après Bordachar P, Resynchronisation cardiaque : mécanismes d’action,
optimisation de la réponse hémodynamique et clinique, nouveaux champs
d’application. Université de Bordeaux 2010).
10
1.2. Problématique de la resynchronisation cardiaque
1.2.1. La réponse à la technique
En 1994, les premiers patients insuffisants cardiaques sévères sont implantés avec
un stimulateur cardiaque sur le critère de bloc de branche gauche sur
l’électrocardiogramme de surface12,13. Suite au bénéfice clinique observé, plusieurs
hypothèses sont avancées pour expliquer les effets positifs du dispositif dont une
optimisation du délai atrio-ventriculaire, une réduction de la fuite mitrale systolique,
une réorganisation de la séquence de contraction ventriculaire gauche et une
réduction d’un asynchronisme préexistant. Plusieurs études ont démontré un
bénéfice hémodynamique significatif de la stimulation ventriculaire gauche seule ou
de la stimulation cardiaque chez des patients en classe III ou IV de la NYHA avec
bloc de branche gauche14-16.
A moyen terme, plusieurs études non contrôlées ont suggéré les bénéfices d’une
stimulation cardiaque biventriculaire ou ventriculaire gauche. Mais ce sont les
études randomisées MUSTIC, MIRACLE, COMPANION, CARE-HF qui ont
démontré, de manière irréfutable et convergente, l’efficacité à long terme de la
resynchronisation cardiaque17-20. Les critères d’inclusion de ces études étaient
relativement similaires : insuffisance cardiaque symptomatique classe III ou IV
NYHA malgré un traitement médical optimal, fraction d’éjection du ventricule
gauche altérée, QRS large, rythme sinusal. Sur des critères multiples comme
l’amélioration de la classe NYHA, du score de qualité de vie, de la distance
parcourue au test de marche des 6 minutes et du pic de VO2, ces différentes
études randomisées ont toutes montré un bénéfice significatif.
Or, un autre critère de jugement a été proposé pour étayer la démonstration des
effets de la resynchronisation cardiaque. En s’appuyant sur les effets observés sur
le ventricule gauche après initiation des traitements pharmacologiques comme les
inhibiteurs de l’enzyme de conversion ou les bétabloquants, le remodelage
ventriculaire est devenu un objectif “thérapeutique” important chez les patients
insuffisants cardiaques. Plusieurs études ont argumenté la relation étroite qui
existait entre le pronostic des patients en insuffisance cardiaque et la réduction des
volumes ventriculaires. Au sein des études sur la stimulation cardiaque, la
progression de l’insuffisance cardiaque sur le critère de remodelage ventriculaire
11
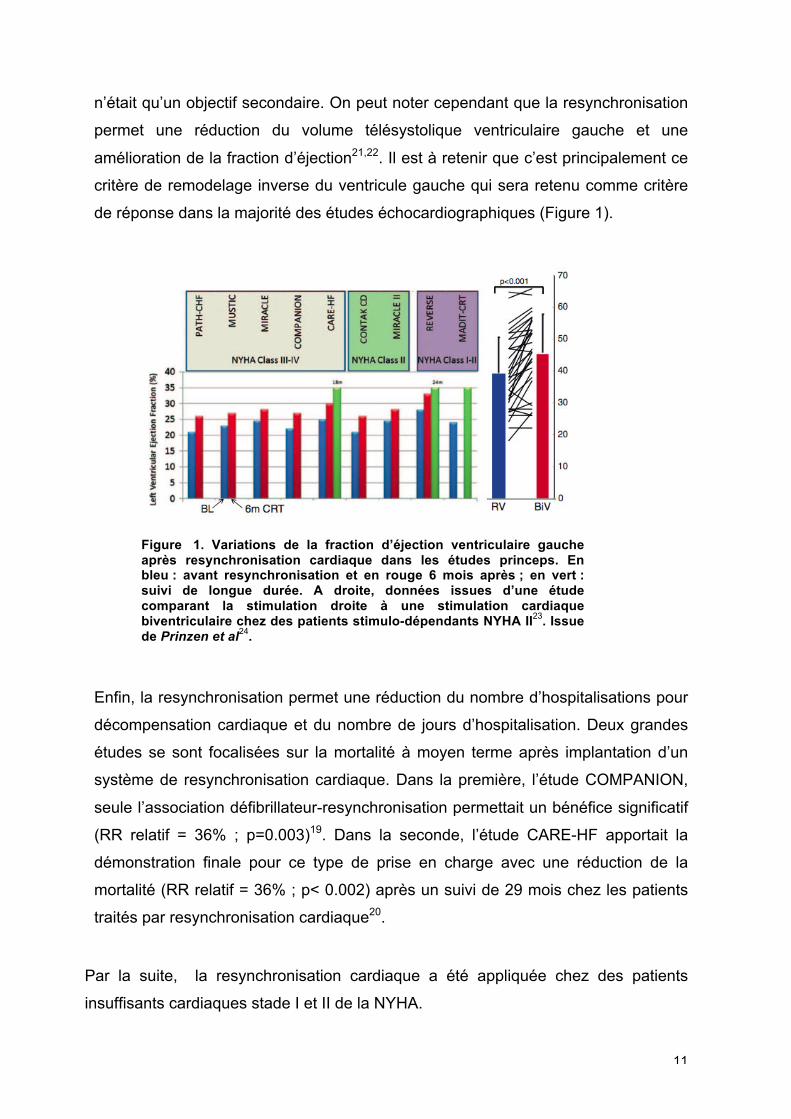
n’était qu’un objectif secondaire. On peut noter cependant que la resynchronisation
permet une réduction du volume télésystolique ventriculaire gauche et une
amélioration de la fraction d’éjection21,22. Il est à retenir que c’est principalement ce
critère de remodelage inverse du ventricule gauche qui sera retenu comme critère
de réponse dans la majorité des études échocardiographiques (Figure 1).
Figure 1. Variations de la fraction d’éjection ventriculaire gauche après resynchronisation cardiaque dans les études princeps. En bleu : avant resynchronisation et en rouge 6 mois après ; en vert : suivi de longue durée. A droite, données issues d’une étude comparant la stimulation droite à une stimulation cardiaque biventriculaire chez des patients stimulo-dépendants NYHA II23. Issue de Prinzen et al
24.
Enfin, la resynchronisation permet une réduction du nombre d’hospitalisations pour
décompensation cardiaque et du nombre de jours d’hospitalisation. Deux grandes
études se sont focalisées sur la mortalité à moyen terme après implantation d’un
système de resynchronisation cardiaque. Dans la première, l’étude COMPANION,
seule l’association défibrillateur-resynchronisation permettait un bénéfice significatif
(RR relatif = 36% ; p=0.003)19. Dans la seconde, l’étude CARE-HF apportait la
démonstration finale pour ce type de prise en charge avec une réduction de la
mortalité (RR relatif = 36% ; p< 0.002) après un suivi de 29 mois chez les patients
traités par resynchronisation cardiaque20.
Par la suite, la resynchronisation cardiaque a été appliquée chez des patients
insuffisants cardiaques stade I et II de la NYHA.

12
Les études REVERSE25, MADIT-CRT26 et RAFT27 ont ainsi montré un bénéfice chez
les patients avec des QRS larges et en classe II de la NYHA (Tableau 1).
Tableau 1. Critères d’inclusion, critères primaires et résultats des études randomisées évaluant la resynchronisation cardiaque dans le traitement de l’insuffisance cardiaque. Issu de Brignole et al
2.
13
1.2.2. Les complications de la technique
L’implantation d’un dispositif de resynchronisation cardiaque est une technique
invasive qui, de fait, est grevée d’un taux de complications estimé à court terme à
12.4% et à long terme à 9.4% dans une étude prospective récente28 (Tableau 2).
Ce taux est particulièrement sensible à l’expérience du centre implanteur ainsi
qu’au type de procédure. En effet, en cas de remplacement du dispositif ou
d’upgrading, le taux de complications atteint presque 19%.
Dans une méta-analyse récente29 regroupant 9082 patients de 25 études sur la
resynchronisation, le taux de succès d’implantation était estimé à 94.4%, avec une
mortalité peropératoire de 0.3%. Les complications peropératoires ou à court terme
sont les plus fréquentes avec des complications mécaniques dans 3.2% des cas
(dissection de sinus coronaire, épanchement péricardique ou tamponnade,
pneumothorax ou hémothorax), un mauvais positionnement de la sonde dans 6.2%
des cas, et des infections dans 1.4%. Les hématomes de loge sont fréquents (2.9 à
9.5%) et peuvent être évités par une gestion peri-opératoire prudente des
anticoagulants et antiagrégants plaquettaires.
Les complications à long terme les plus fréquentes sont représentées par la
survenue d’une stimulation diaphragmatique, le déplacement de la sonde
ventriculaire gauche et/ou un seuil de stimulation ventriculaire gauche élevé. Le
risque d’infection est la complication la plus grave avec une incidence plus élevée la
première année suivant l’implantation à 4.8%30.
14
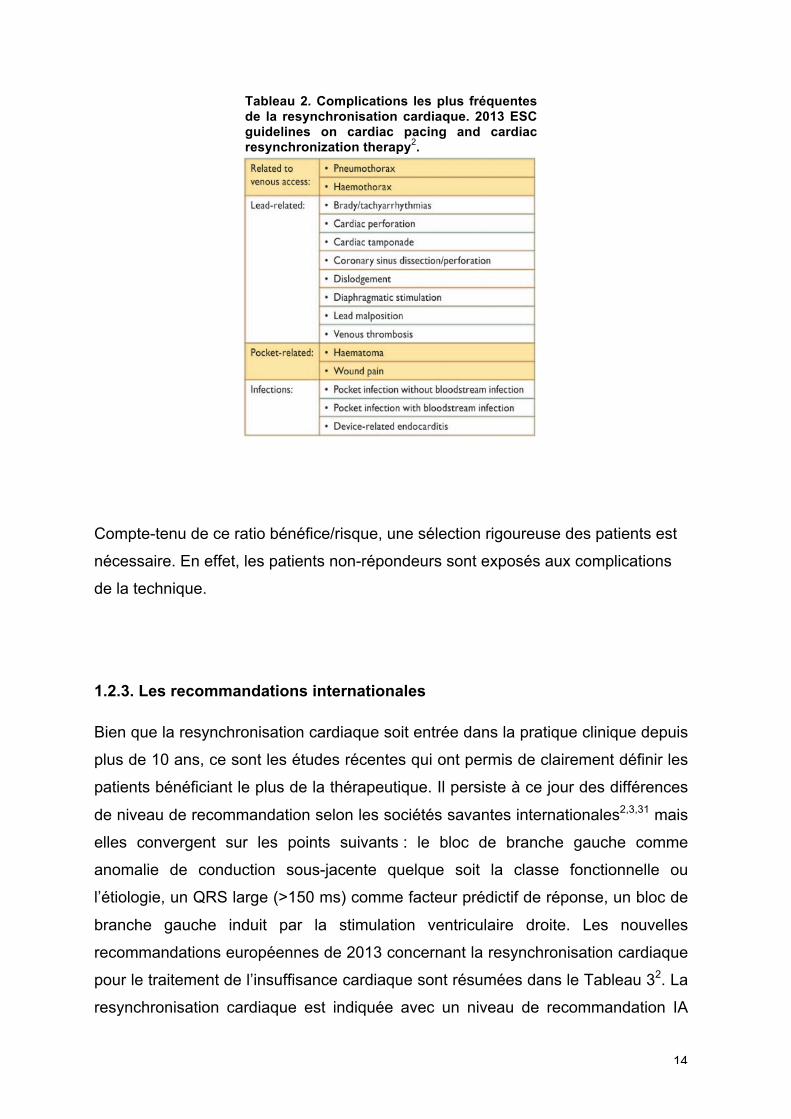
Tableau 2. Complications les plus fréquentes de la resynchronisation cardiaque. 2013 ESC guidelines on cardiac pacing and cardiac resynchronization therapy2.
Compte-tenu de ce ratio bénéfice/risque, une sélection rigoureuse des patients est
nécessaire. En effet, les patients non-répondeurs sont exposés aux complications
de la technique.
1.2.3. Les recommandations internationales
Bien que la resynchronisation cardiaque soit entrée dans la pratique clinique depuis
plus de 10 ans, ce sont les études récentes qui ont permis de clairement définir les
patients bénéficiant le plus de la thérapeutique. Il persiste à ce jour des différences
de niveau de recommandation selon les sociétés savantes internationales2,3,31 mais
elles convergent sur les points suivants : le bloc de branche gauche comme
anomalie de conduction sous-jacente quelque soit la classe fonctionnelle ou
l’étiologie, un QRS large (>150 ms) comme facteur prédictif de réponse, un bloc de
branche gauche induit par la stimulation ventriculaire droite. Les nouvelles
recommandations européennes de 2013 concernant la resynchronisation cardiaque
pour le traitement de l’insuffisance cardiaque sont résumées dans le Tableau 32. La
resynchronisation cardiaque est indiquée avec un niveau de recommandation IA
15
chez des patients en classe NYHA II, III ou IV, avec une FEVG ≥ 35 % et une durée
de QRS > 150 ms et avec un niveau de recommandation IB pour une durée de
QRS entre 120 et 150 ms. Les nouvelles recommandations intègrent les patients en
classe II de la NYHA suite aux résultats des études REVERSE25, MADIT-CRT26 et
RAFT27. Un point important de ces recommandations est l’intégration de la
morphologie du QRS dans le niveau de recommandation32. Ainsi, seuls les patients
avec une morphologie de QRS de bloc de branche gauche typique ont un niveau de
recommandation I. Les patients ayant un QRS >150 ms sans aspect de bloc de
branche gauche ont un niveau de recommandation IIA seulement. Pour les patients
ayant un QRS peu élargi entre 120 et 150 ms sans aspect de bloc de branche
gauche, le niveau de recommandation est très faible IIB.
Enfin, les études récentes33-36 ayant montré l’absence de bénéfice de la
resynchronisation cardiaque chez des patients présentant des QRS fins (< 120 ms),
et même pour certaines une augmentation de la morbi-mortalité, les
recommandations de 2013 contre-indiquent la resynchronisation cardiaque chez
ces patients.
Les recommandations de la société européenne de rythmologie (EHRA) publiées
en 20123, tout comme celles de la société européenne de cardiologie en 20132,
n’intègrent pas dans les critères de sélection des patients les données de l’imagerie
cardiaque (analyse de la viabilité, de la cicatrice myocardique en IRM, évaluation de
l’asynchronisme mécanique en échographie cardiaque issue du Doppler tissulaire,
comme du speckle tracking), en l’absence d’études randomisées de large échelle à
ce jour.
16
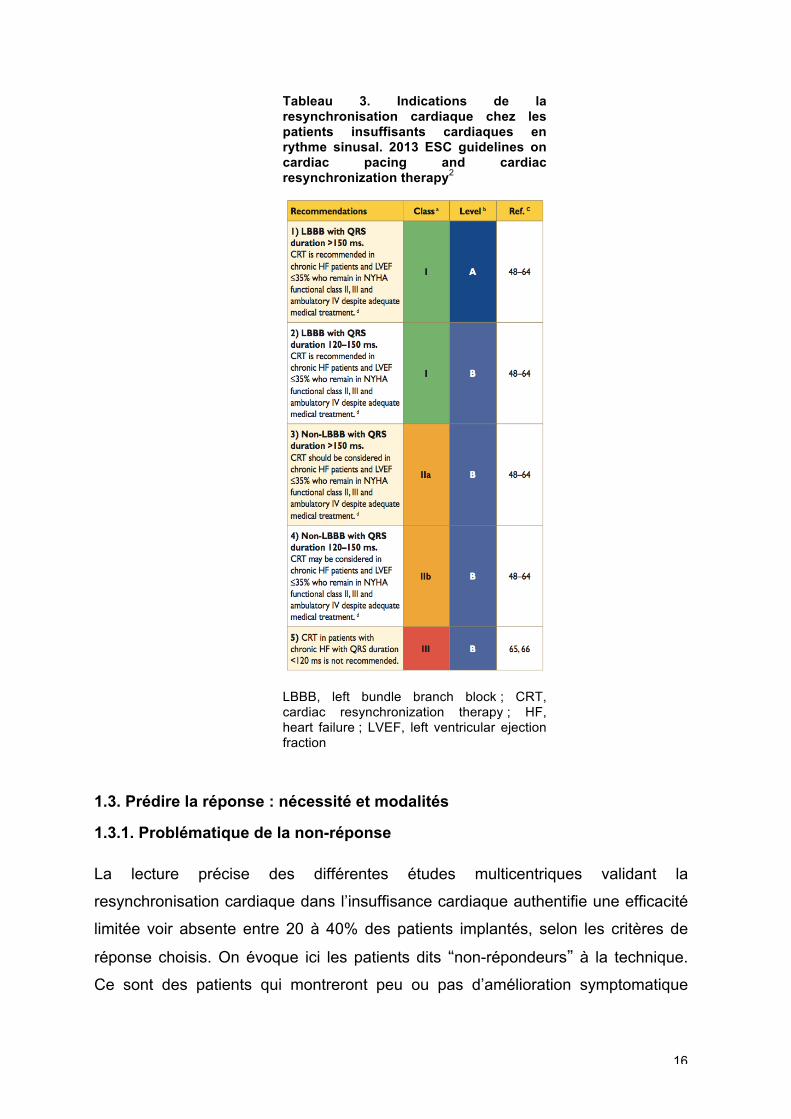
Tableau 3. Indications de la resynchronisation cardiaque chez les patients insuffisants cardiaques en rythme sinusal. 2013 ESC guidelines on cardiac pacing and cardiac resynchronization therapy2
LBBB, left bundle branch block ; CRT, cardiac resynchronization therapy ; HF, heart failure ; LVEF, left ventricular ejection fraction
1.3. Prédire la réponse : nécessité et modalités
1.3.1. Problématique de la non-réponse
La lecture précise des différentes études multicentriques validant la
resynchronisation cardiaque dans l’insuffisance cardiaque authentifie une efficacité
limitée voir absente entre 20 à 40% des patients implantés, selon les critères de
réponse choisis. On évoque ici les patients dits “non-répondeurs” à la technique.
Ce sont des patients qui montreront peu ou pas d’amélioration symptomatique
17
après resynchronisation et pour certains, il y aura une dégradation de leur état
clinique, qui peut être aussi imputée à leur pathologie.
La non-réponse devient alors un problème spécifique à chaque patient mais
également au niveau médico-économique, qui impose la réflexion de la sélection
des patients en pré-implantation. En effet, en 2009, l’HAS estimait à 7000 le
nombre de patients éligibles à la resynchronisation cardiaque. Il y aurait par voie de
conséquence 2000 patients qui seraient non-répondeurs, soit à 4000 € la fourchette
basse pour le coût d’une implantation, une somme d’un million d’Euros dépensée à
perte.
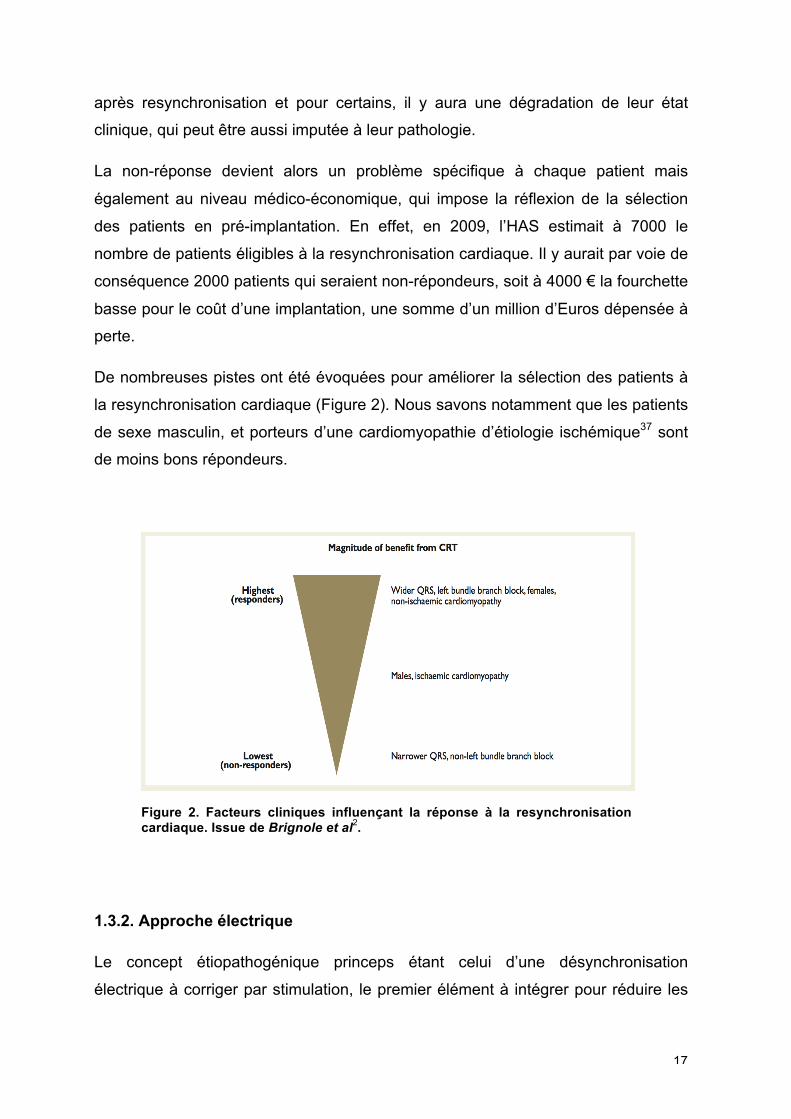
De nombreuses pistes ont été évoquées pour améliorer la sélection des patients à
la resynchronisation cardiaque (Figure 2). Nous savons notamment que les patients
de sexe masculin, et porteurs d’une cardiomyopathie d’étiologie ischémique37 sont
de moins bons répondeurs.
Figure 2. Facteurs cliniques influençant la réponse à la resynchronisation cardiaque. Issue de Brignole et al
2.
1.3.2. Approche électrique
Le concept étiopathogénique princeps étant celui d’une désynchronisation
électrique à corriger par stimulation, le premier élément à intégrer pour réduire les

18
non-répondeurs a été et reste encore la largeur du QRS. Il est à noter qu’environ
30% des patients insuffisants cardiaques gauches présentent des troubles de la
conduction intraventriculaire gauche17. L’étude MUSTIC17 affichait en 2001 un taux
de réponse de 85% pour des QRS supérieur à 150 ms contre seulement 63%
quand la largeur des QRS était limitée à 120 ms. Ce lien entre activation électrique
et réponse est encore supérieur quand il est pris en compte la morphologie du
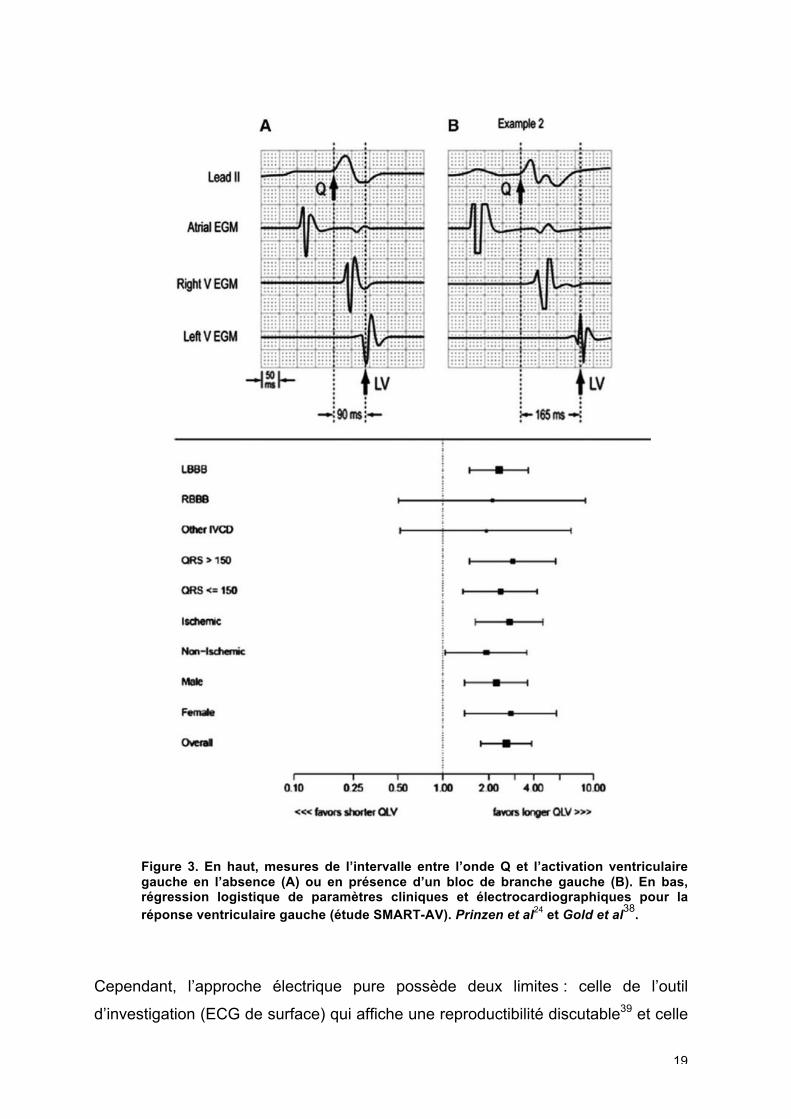
ventriculogramme en particulier devant un bloc de branche gauche32(Figure 3).
19
Figure 3. En haut, mesures de l’intervalle entre l’onde Q et l’activation ventriculaire gauche en l’absence (A) ou en présence d’un bloc de branche gauche (B). En bas, régression logistique de paramètres cliniques et électrocardiographiques pour la réponse ventriculaire gauche (étude SMART-AV). Prinzen et al
24 et Gold et al38
.
Cependant, l’approche électrique pure possède deux limites : celle de l’outil
d’investigation (ECG de surface) qui affiche une reproductibilité discutable39 et celle
20
d’une estimation de la cartographie d’activation électrique finalement assez
grossière, source d’une sous-représentation de la population qui pourrait répondre
favorablement à la technique. Des méthodes d’analyse électrocardiographiques
plus performantes sont en cours d’investigation. Par exemple, le système de la
veste avec de multiples électrodes semble prometteur40.
1.3.3. Approche mécanique
Au-delà de cette approche électrique, l’évaluation mécanique ou fonctionnelle du
retentissement de la désynchronisation a été jugée comme indispensable dès les
débuts de la technique. En effet, même si la concordance entre l’asynchronisme
électrique et l’asynchronisme mécanique n’est pas toujours démonstrative, en
particulier selon l’étiologie de la cardiopathie41, le point de départ est manifestement
un asynchronisme électrique qui va se traduire par un asynchronisme mécanique et
enfin, une perte de performance ventriculaire gauche (Figure 4)42.
21
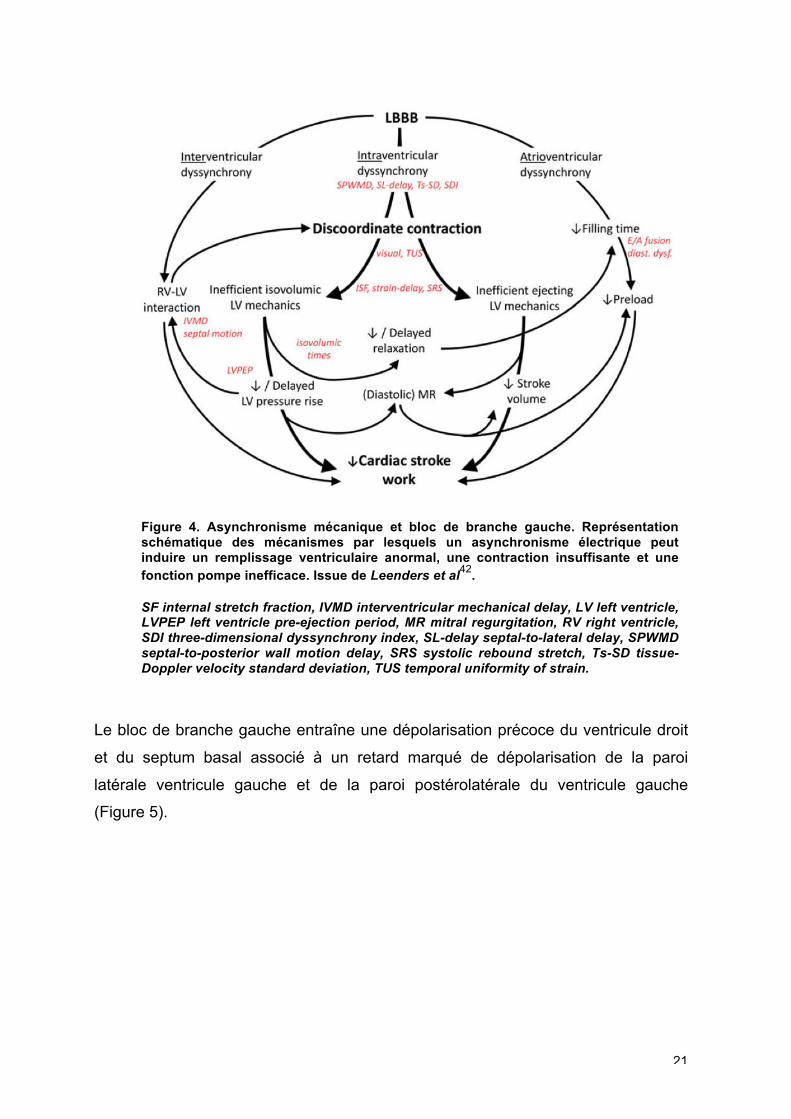
Figure 4. Asynchronisme mécanique et bloc de branche gauche. Représentation schématique des mécanismes par lesquels un asynchronisme électrique peut induire un remplissage ventriculaire anormal, une contraction insuffisante et une fonction pompe inefficace. Issue de Leenders et al
42.
SF internal stretch fraction, IVMD interventricular mechanical delay, LV left ventricle, LVPEP left ventricle pre-ejection period, MR mitral regurgitation, RV right ventricle, SDI three-dimensional dyssynchrony index, SL-delay septal-to-lateral delay, SPWMD septal-to-posterior wall motion delay, SRS systolic rebound stretch, Ts-SD tissue-Doppler velocity standard deviation, TUS temporal uniformity of strain.
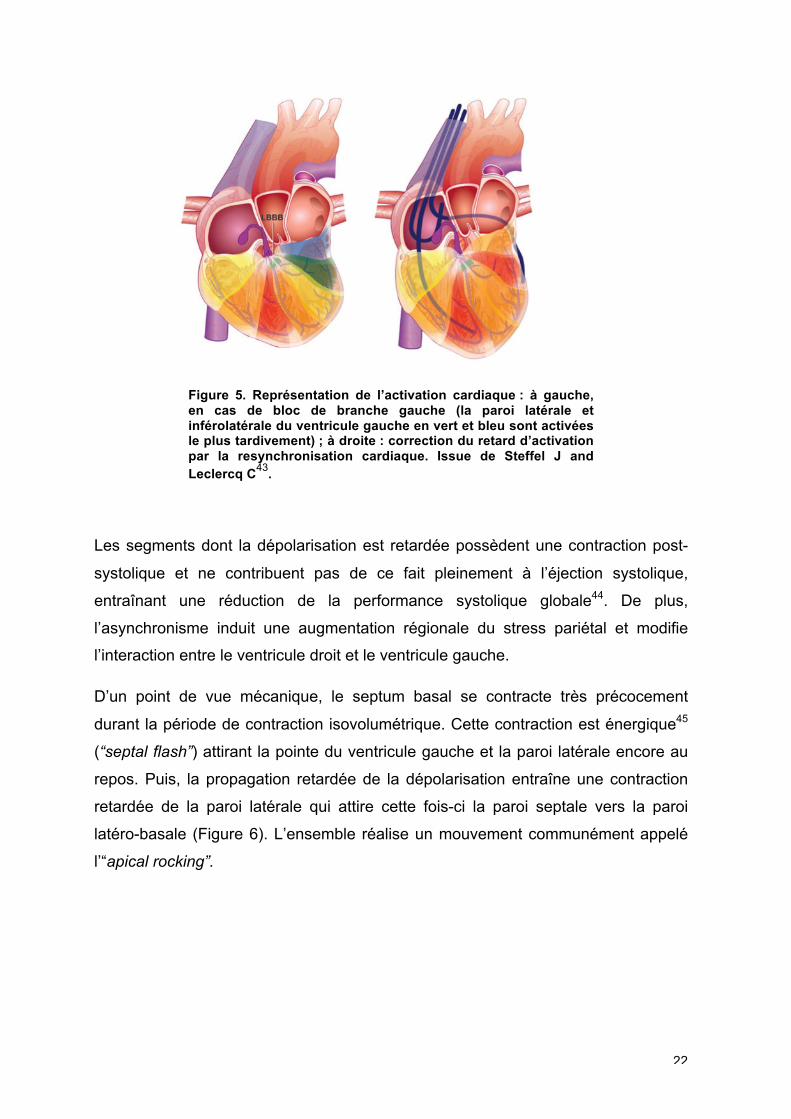
Le bloc de branche gauche entraîne une dépolarisation précoce du ventricule droit
et du septum basal associé à un retard marqué de dépolarisation de la paroi
latérale ventricule gauche et de la paroi postérolatérale du ventricule gauche
(Figure 5).
22
Figure 5. Représentation de l’activation cardiaque : à gauche, en cas de bloc de branche gauche (la paroi latérale et inférolatérale du ventricule gauche en vert et bleu sont activées le plus tardivement) ; à droite : correction du retard d’activation par la resynchronisation cardiaque. Issue de Steffel J and Leclercq C
43.
Les segments dont la dépolarisation est retardée possèdent une contraction post-
systolique et ne contribuent pas de ce fait pleinement à l’éjection systolique,
entraînant une réduction de la performance systolique globale44. De plus,
l’asynchronisme induit une augmentation régionale du stress pariétal et modifie
l’interaction entre le ventricule droit et le ventricule gauche.
D’un point de vue mécanique, le septum basal se contracte très précocement
durant la période de contraction isovolumétrique. Cette contraction est énergique45
(“septal flash”) attirant la pointe du ventricule gauche et la paroi latérale encore au
repos. Puis, la propagation retardée de la dépolarisation entraîne une contraction
retardée de la paroi latérale qui attire cette fois-ci la paroi septale vers la paroi
latéro-basale (Figure 6). L’ensemble réalise un mouvement communément appelé
l’“apical rocking”.
23
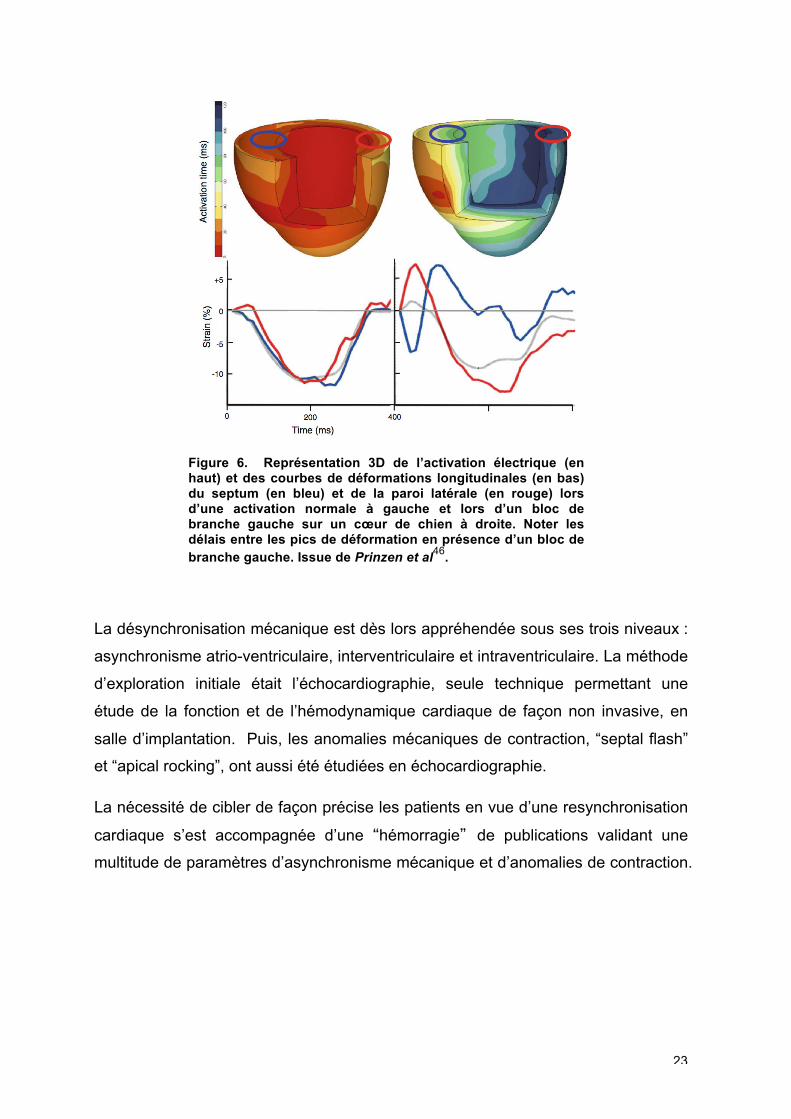
Figure 6. Représentation 3D de l’activation électrique (en haut) et des courbes de déformations longitudinales (en bas) du septum (en bleu) et de la paroi latérale (en rouge) lors d’une activation normale à gauche et lors d’un bloc de branche gauche sur un cœur de chien à droite. Noter les délais entre les pics de déformation en présence d’un bloc de branche gauche. Issue de Prinzen et al
46.
La désynchronisation mécanique est dès lors appréhendée sous ses trois niveaux :
asynchronisme atrio-ventriculaire, interventriculaire et intraventriculaire. La méthode
d’exploration initiale était l’échocardiographie, seule technique permettant une
étude de la fonction et de l’hémodynamique cardiaque de façon non invasive, en
salle d’implantation. Puis, les anomalies mécaniques de contraction, “septal flash”
et “apical rocking”, ont aussi été étudiées en échocardiographie.
La nécessité de cibler de façon précise les patients en vue d’une resynchronisation
cardiaque s’est accompagnée d’une “hémorragie” de publications validant une
multitude de paramètres d’asynchronisme mécanique et d’anomalies de contraction.
24
1.4. Paramètres échocardiographiques de prédiction
1.4.1. Critères initiaux et limites
Nous proposons ici de retracer les principaux paramètres échocardiographiques
non pas en termes chronologiques mais en les intégrant dans la classification des
différents niveaux d’asynchronisme.
1.4.1.1. Asynchronisme atrio-ventriculaire
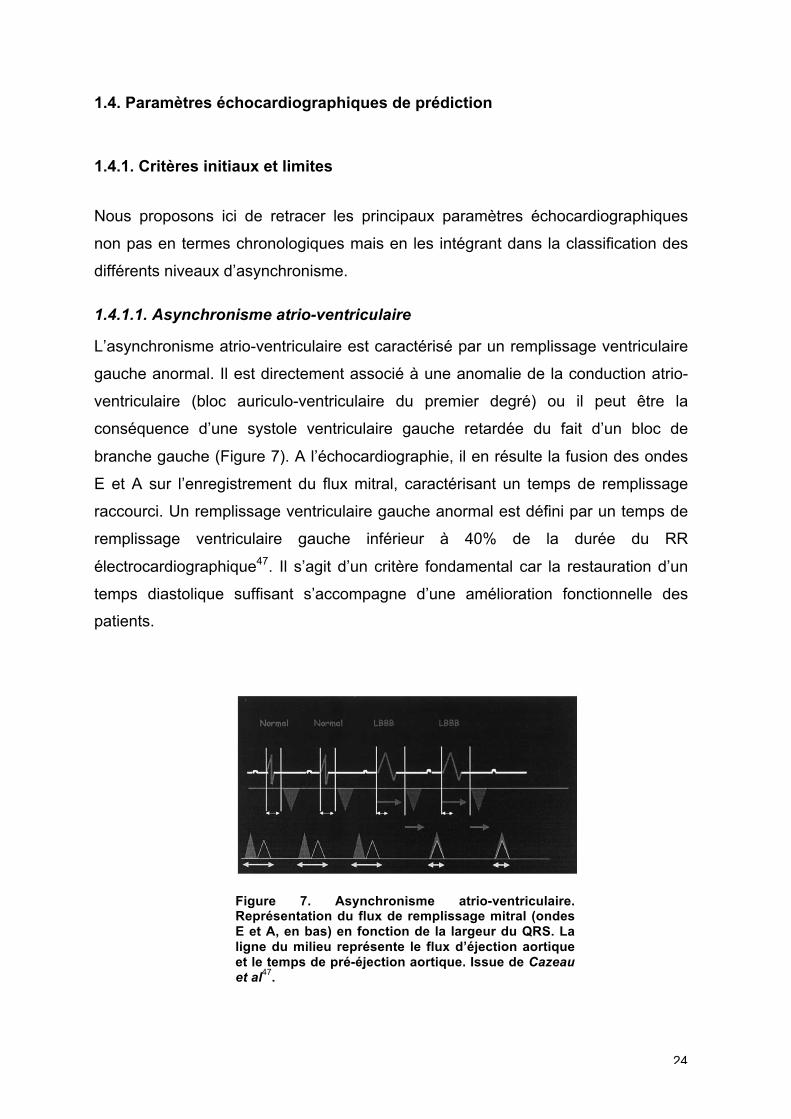
L’asynchronisme atrio-ventriculaire est caractérisé par un remplissage ventriculaire
gauche anormal. Il est directement associé à une anomalie de la conduction atrio-
ventriculaire (bloc auriculo-ventriculaire du premier degré) ou il peut être la
conséquence d’une systole ventriculaire gauche retardée du fait d’un bloc de
branche gauche (Figure 7). A l’échocardiographie, il en résulte la fusion des ondes
E et A sur l’enregistrement du flux mitral, caractérisant un temps de remplissage
raccourci. Un remplissage ventriculaire gauche anormal est défini par un temps de
remplissage ventriculaire gauche inférieur à 40% de la durée du RR
électrocardiographique47. Il s’agit d’un critère fondamental car la restauration d’un
temps diastolique suffisant s’accompagne d’une amélioration fonctionnelle des
patients.
Figure 7. Asynchronisme atrio-ventriculaire. Représentation du flux de remplissage mitral (ondes E et A, en bas) en fonction de la largeur du QRS. La ligne du milieu représente le flux d’éjection aortique et le temps de pré-éjection aortique. Issue de Cazeau et al
47.
25
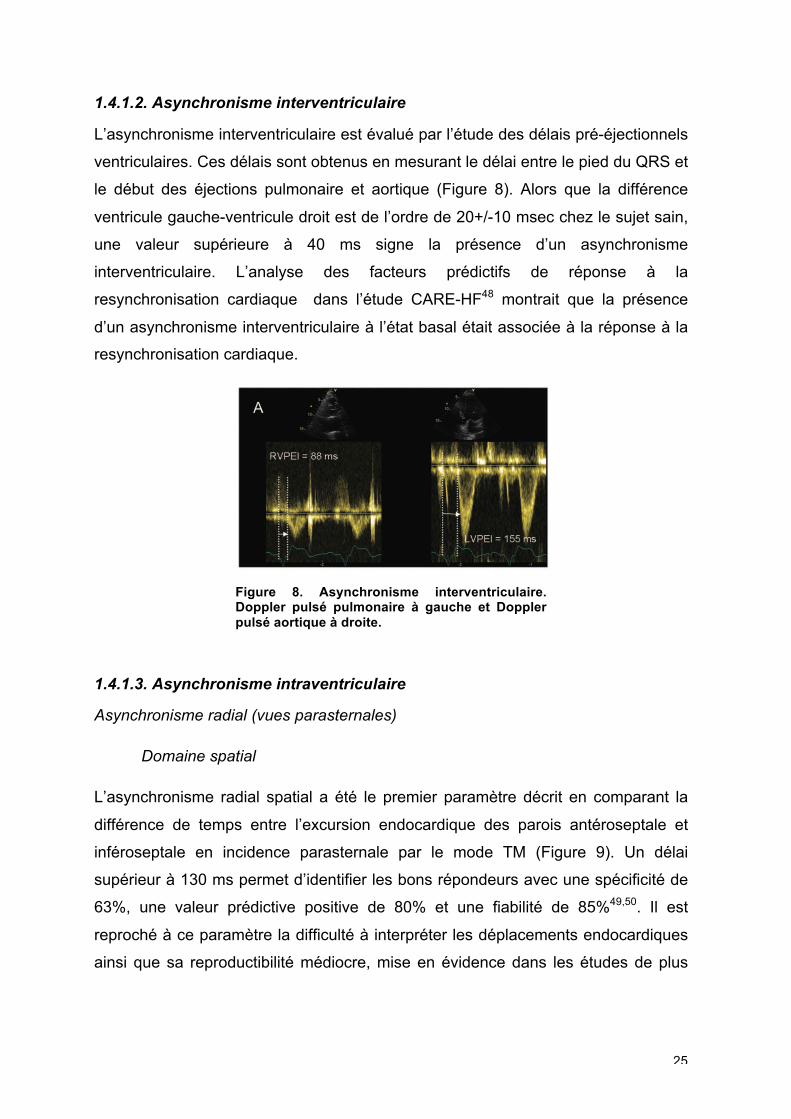
1.4.1.2. Asynchronisme interventriculaire
L’asynchronisme interventriculaire est évalué par l’étude des délais pré-éjectionnels
ventriculaires. Ces délais sont obtenus en mesurant le délai entre le pied du QRS et
le début des éjections pulmonaire et aortique (Figure 8). Alors que la différence
ventricule gauche-ventricule droit est de l’ordre de 20+/-10 msec chez le sujet sain,
une valeur supérieure à 40 ms signe la présence d’un asynchronisme
interventriculaire. L’analyse des facteurs prédictifs de réponse à la
resynchronisation cardiaque dans l’étude CARE-HF48 montrait que la présence
d’un asynchronisme interventriculaire à l’état basal était associée à la réponse à la
resynchronisation cardiaque.
Figure 8. Asynchronisme interventriculaire. Doppler pulsé pulmonaire à gauche et Doppler pulsé aortique à droite.
1.4.1.3. Asynchronisme intraventriculaire
Asynchronisme radial (vues parasternales)
Domaine spatial
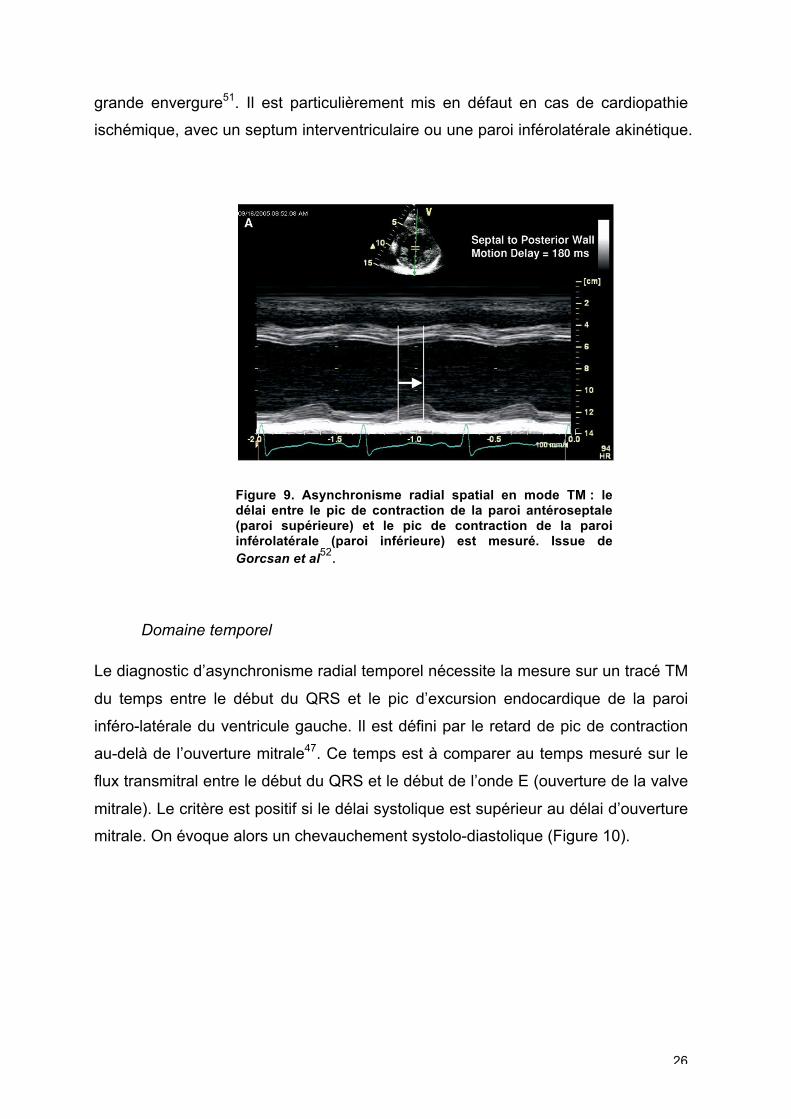
L’asynchronisme radial spatial a été le premier paramètre décrit en comparant la
différence de temps entre l’excursion endocardique des parois antéroseptale et
inféroseptale en incidence parasternale par le mode TM (Figure 9). Un délai
supérieur à 130 ms permet d’identifier les bons répondeurs avec une spécificité de
63%, une valeur prédictive positive de 80% et une fiabilité de 85%49,50. Il est
reproché à ce paramètre la difficulté à interpréter les déplacements endocardiques
ainsi que sa reproductibilité médiocre, mise en évidence dans les études de plus
26
grande envergure51. Il est particulièrement mis en défaut en cas de cardiopathie
ischémique, avec un septum interventriculaire ou une paroi inférolatérale akinétique.
Figure 9. Asynchronisme radial spatial en mode TM : le délai entre le pic de contraction de la paroi antéroseptale (paroi supérieure) et le pic de contraction de la paroi inférolatérale (paroi inférieure) est mesuré. Issue de Gorcsan et al
52.
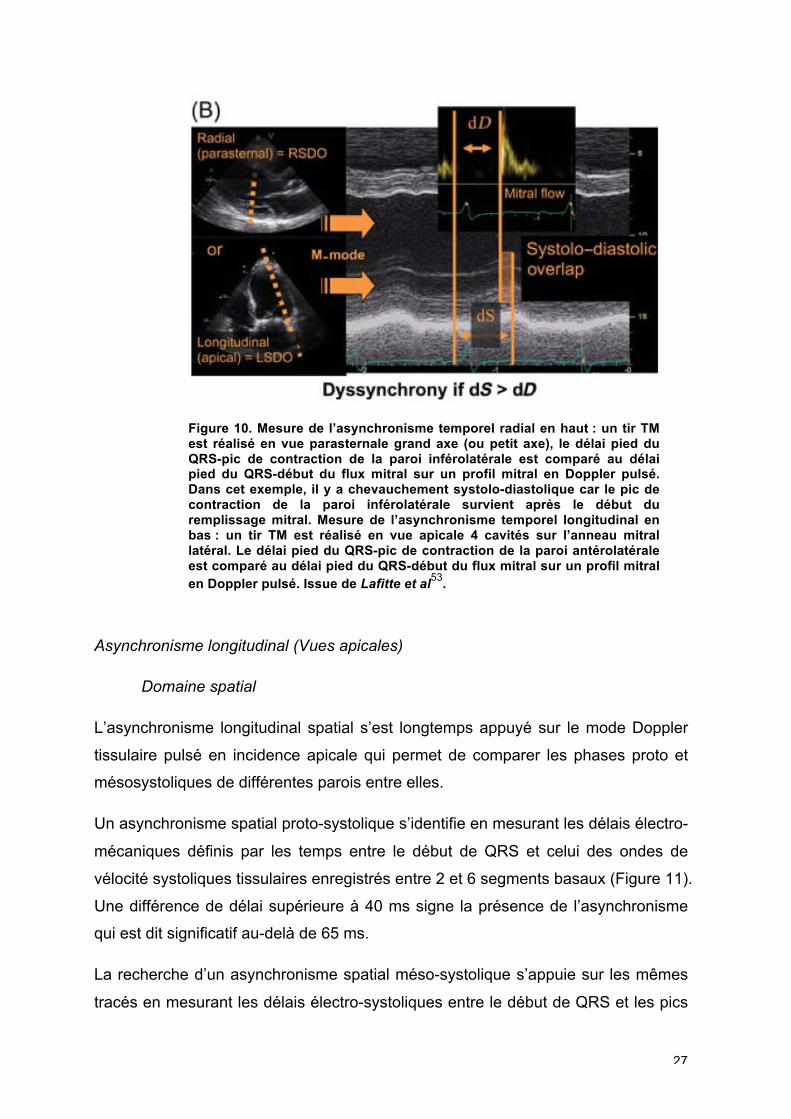
Domaine temporel
Le diagnostic d’asynchronisme radial temporel nécessite la mesure sur un tracé TM
du temps entre le début du QRS et le pic d’excursion endocardique de la paroi
inféro-latérale du ventricule gauche. Il est défini par le retard de pic de contraction
au-delà de l’ouverture mitrale47. Ce temps est à comparer au temps mesuré sur le
flux transmitral entre le début du QRS et le début de l’onde E (ouverture de la valve
mitrale). Le critère est positif si le délai systolique est supérieur au délai d’ouverture
mitrale. On évoque alors un chevauchement systolo-diastolique (Figure 10).
27
Figure 10. Mesure de l’asynchronisme temporel radial en haut : un tir TM est réalisé en vue parasternale grand axe (ou petit axe), le délai pied du QRS-pic de contraction de la paroi inférolatérale est comparé au délai pied du QRS-début du flux mitral sur un profil mitral en Doppler pulsé. Dans cet exemple, il y a chevauchement systolo-diastolique car le pic de contraction de la paroi inférolatérale survient après le début du remplissage mitral. Mesure de l’asynchronisme temporel longitudinal en bas : un tir TM est réalisé en vue apicale 4 cavités sur l’anneau mitral latéral. Le délai pied du QRS-pic de contraction de la paroi antérolatérale est comparé au délai pied du QRS-début du flux mitral sur un profil mitral en Doppler pulsé. Issue de Lafitte et al
53.
Asynchronisme longitudinal (Vues apicales)
Domaine spatial
L’asynchronisme longitudinal spatial s’est longtemps appuyé sur le mode Doppler
tissulaire pulsé en incidence apicale qui permet de comparer les phases proto et
mésosystoliques de différentes parois entre elles.
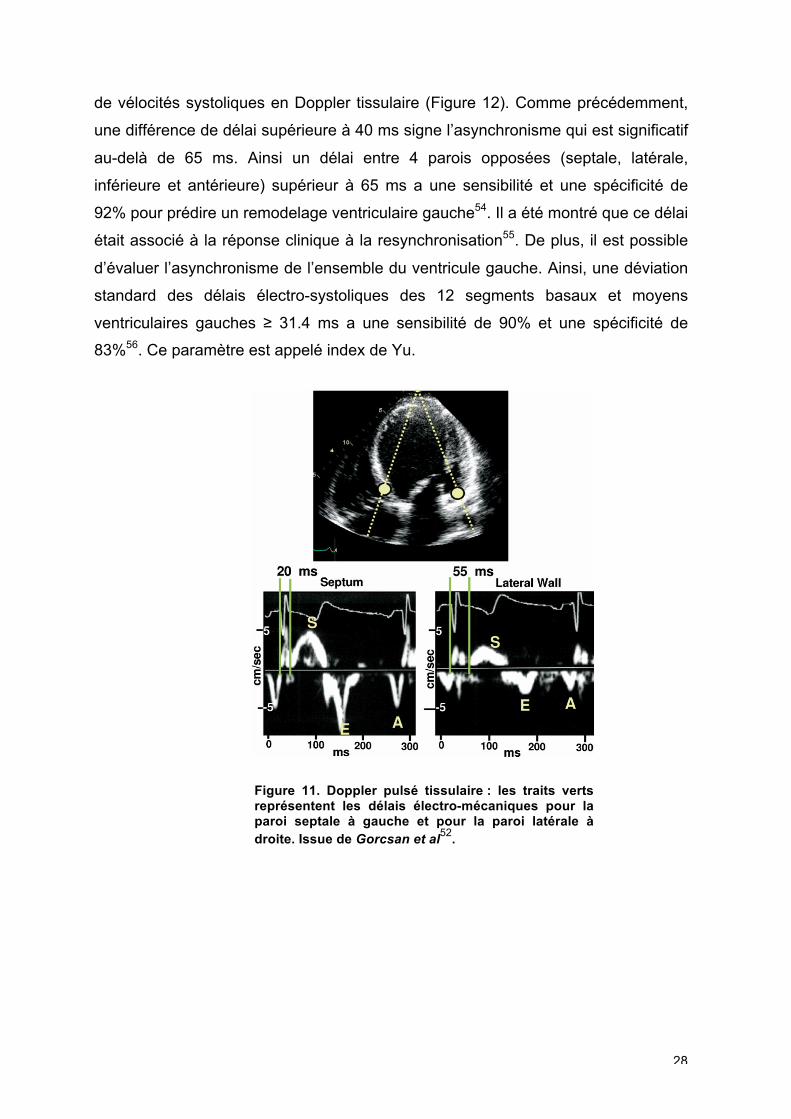
Un asynchronisme spatial proto-systolique s’identifie en mesurant les délais électro-
mécaniques définis par les temps entre le début de QRS et celui des ondes de
vélocité systoliques tissulaires enregistrés entre 2 et 6 segments basaux (Figure 11).
Une différence de délai supérieure à 40 ms signe la présence de l’asynchronisme
qui est dit significatif au-delà de 65 ms.
La recherche d’un asynchronisme spatial méso-systolique s’appuie sur les mêmes
tracés en mesurant les délais électro-systoliques entre le début de QRS et les pics
28
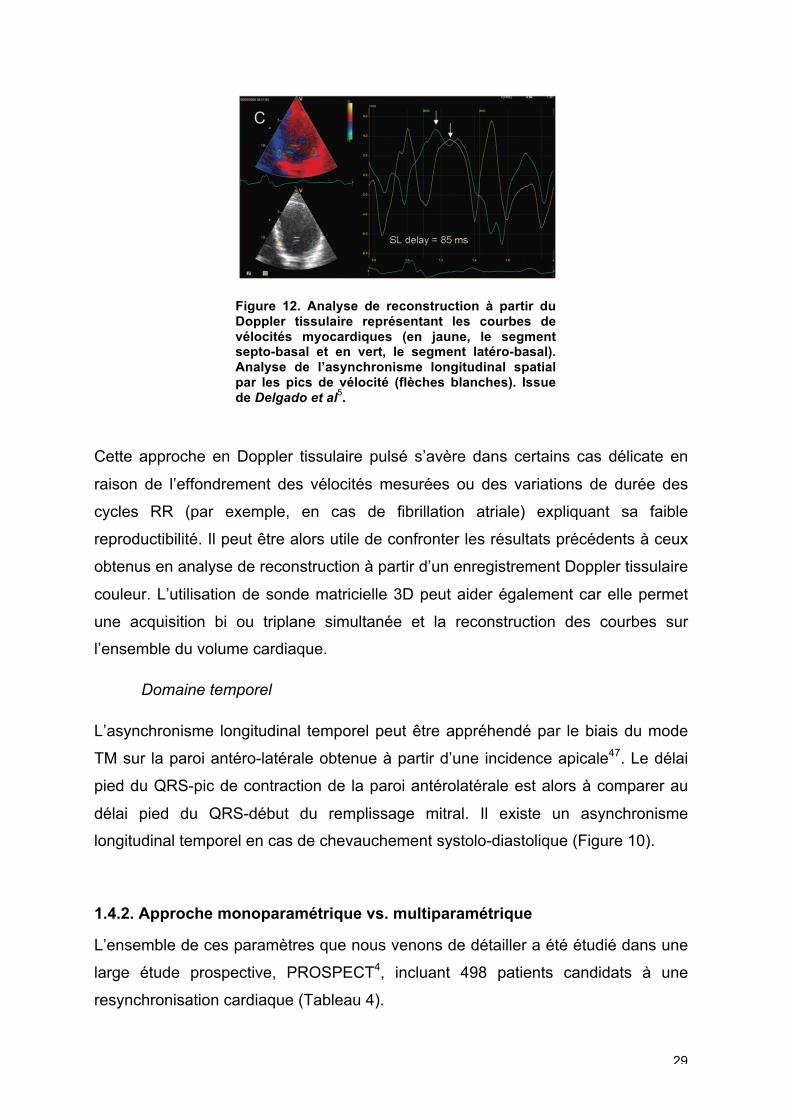
de vélocités systoliques en Doppler tissulaire (Figure 12). Comme précédemment,
une différence de délai supérieure à 40 ms signe l’asynchronisme qui est significatif
au-delà de 65 ms. Ainsi un délai entre 4 parois opposées (septale, latérale,
inférieure et antérieure) supérieur à 65 ms a une sensibilité et une spécificité de
92% pour prédire un remodelage ventriculaire gauche54. Il a été montré que ce délai
était associé à la réponse clinique à la resynchronisation55. De plus, il est possible
d’évaluer l’asynchronisme de l’ensemble du ventricule gauche. Ainsi, une déviation
standard des délais électro-systoliques des 12 segments basaux et moyens
ventriculaires gauches ≥ 31.4 ms a une sensibilité de 90% et une spécificité de
83%56. Ce paramètre est appelé index de Yu.
Figure 11. Doppler pulsé tissulaire : les traits verts représentent les délais électro-mécaniques pour la paroi septale à gauche et pour la paroi latérale à droite. Issue de Gorcsan et al
52.
29
Figure 12. Analyse de reconstruction à partir du Doppler tissulaire représentant les courbes de vélocités myocardiques (en jaune, le segment septo-basal et en vert, le segment latéro-basal). Analyse de l’asynchronisme longitudinal spatial par les pics de vélocité (flèches blanches). Issue de Delgado et al
5.
Cette approche en Doppler tissulaire pulsé s’avère dans certains cas délicate en
raison de l’effondrement des vélocités mesurées ou des variations de durée des
cycles RR (par exemple, en cas de fibrillation atriale) expliquant sa faible
reproductibilité. Il peut être alors utile de confronter les résultats précédents à ceux
obtenus en analyse de reconstruction à partir d’un enregistrement Doppler tissulaire
couleur. L’utilisation de sonde matricielle 3D peut aider également car elle permet
une acquisition bi ou triplane simultanée et la reconstruction des courbes sur
l’ensemble du volume cardiaque.
Domaine temporel
L’asynchronisme longitudinal temporel peut être appréhendé par le biais du mode
TM sur la paroi antéro-latérale obtenue à partir d’une incidence apicale47. Le délai
pied du QRS-pic de contraction de la paroi antérolatérale est alors à comparer au
délai pied du QRS-début du remplissage mitral. Il existe un asynchronisme
longitudinal temporel en cas de chevauchement systolo-diastolique (Figure 10).
1.4.2. Approche monoparamétrique vs. multiparamétrique
L’ensemble de ces paramètres que nous venons de détailler a été étudié dans une
large étude prospective, PROSPECT4, incluant 498 patients candidats à une
resynchronisation cardiaque (Tableau 4).
30
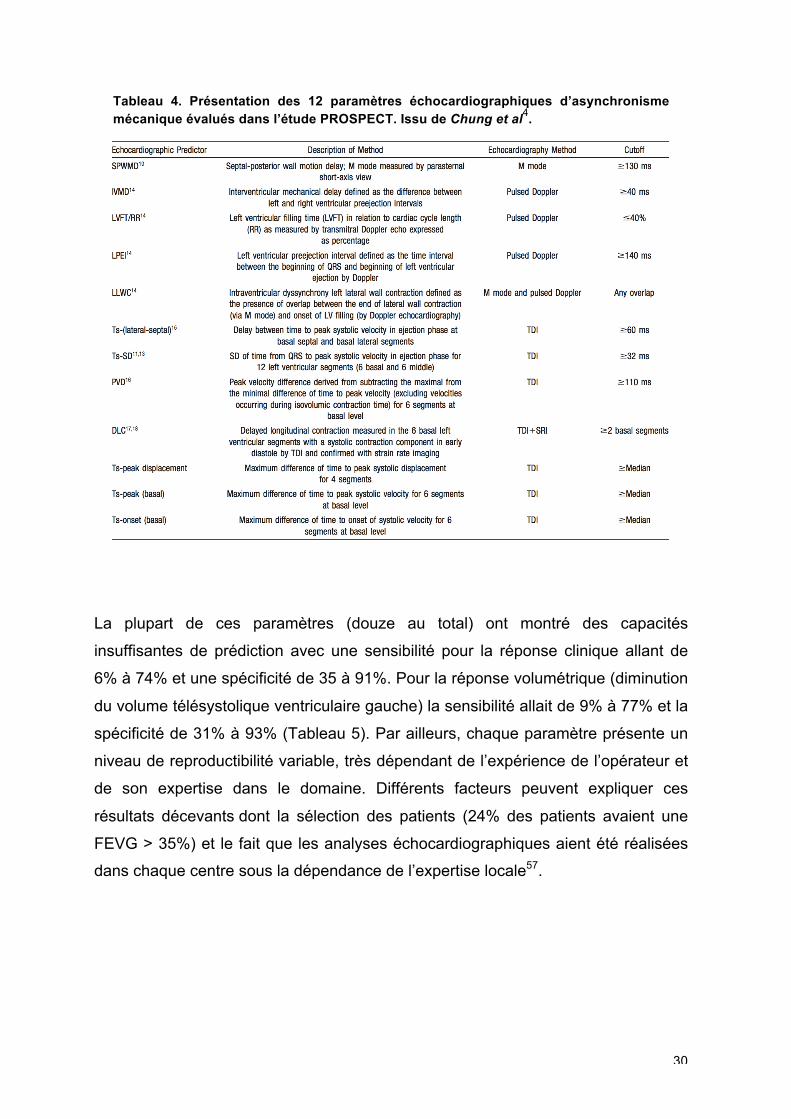
Tableau 4. Présentation des 12 paramètres échocardiographiques d’asynchronisme mécanique évalués dans l’étude PROSPECT. Issu de Chung et al
4.
La plupart de ces paramètres (douze au total) ont montré des capacités
insuffisantes de prédiction avec une sensibilité pour la réponse clinique allant de
6% à 74% et une spécificité de 35 à 91%. Pour la réponse volumétrique (diminution
du volume télésystolique ventriculaire gauche) la sensibilité allait de 9% à 77% et la
spécificité de 31% à 93% (Tableau 5). Par ailleurs, chaque paramètre présente un
niveau de reproductibilité variable, très dépendant de l’expérience de l’opérateur et
de son expertise dans le domaine. Différents facteurs peuvent expliquer ces
résultats décevants dont la sélection des patients (24% des patients avaient une
FEVG > 35%) et le fait que les analyses échocardiographiques aient été réalisées
dans chaque centre sous la dépendance de l’expertise locale57.
31
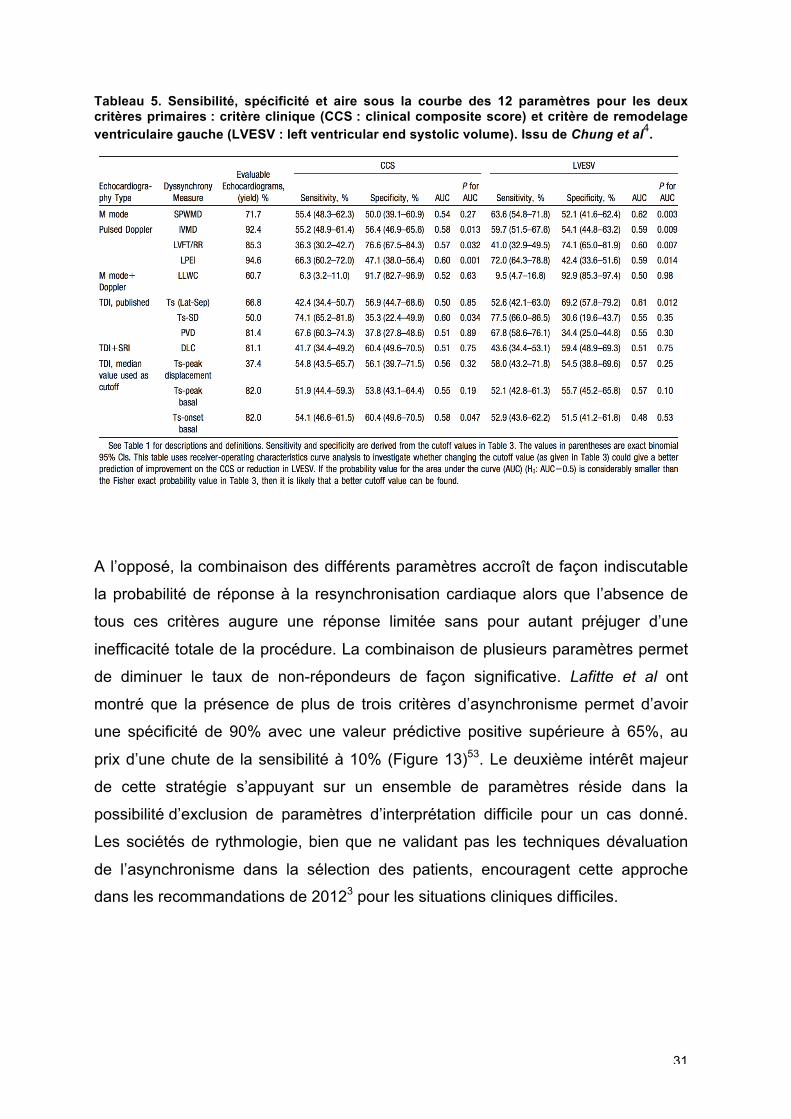
Tableau 5. Sensibilité, spécificité et aire sous la courbe des 12 paramètres pour les deux critères primaires : critère clinique (CCS : clinical composite score) et critère de remodelage ventriculaire gauche (LVESV : left ventricular end systolic volume). Issu de Chung et al
4.
A l’opposé, la combinaison des différents paramètres accroît de façon indiscutable
la probabilité de réponse à la resynchronisation cardiaque alors que l’absence de
tous ces critères augure une réponse limitée sans pour autant préjuger d’une
inefficacité totale de la procédure. La combinaison de plusieurs paramètres permet
de diminuer le taux de non-répondeurs de façon significative. Lafitte et al ont
montré que la présence de plus de trois critères d’asynchronisme permet d’avoir
une spécificité de 90% avec une valeur prédictive positive supérieure à 65%, au
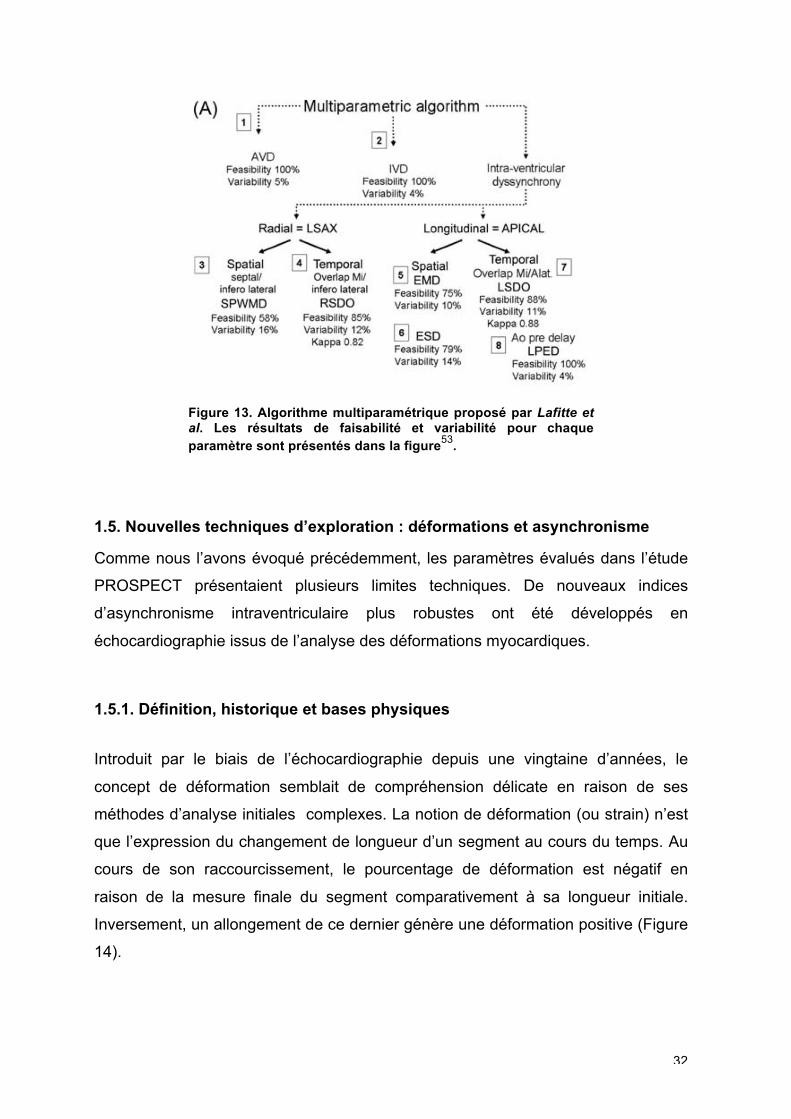
prix d’une chute de la sensibilité à 10% (Figure 13)53. Le deuxième intérêt majeur
de cette stratégie s’appuyant sur un ensemble de paramètres réside dans la
possibilité d’exclusion de paramètres d’interprétation difficile pour un cas donné.
Les sociétés de rythmologie, bien que ne validant pas les techniques dévaluation
de l’asynchronisme dans la sélection des patients, encouragent cette approche
dans les recommandations de 20123 pour les situations cliniques difficiles.
32
Figure 13. Algorithme multiparamétrique proposé par Lafitte et al. Les résultats de faisabilité et variabilité pour chaque paramètre sont présentés dans la figure
53.
1.5. Nouvelles techniques d’exploration : déformations et asynchronisme
Comme nous l’avons évoqué précédemment, les paramètres évalués dans l’étude
PROSPECT présentaient plusieurs limites techniques. De nouveaux indices
d’asynchronisme intraventriculaire plus robustes ont été développés en
échocardiographie issus de l’analyse des déformations myocardiques.
1.5.1. Définition, historique et bases physiques
Introduit par le biais de l’échocardiographie depuis une vingtaine d’années, le
concept de déformation semblait de compréhension délicate en raison de ses
méthodes d’analyse initiales complexes. La notion de déformation (ou strain) n’est
que l’expression du changement de longueur d’un segment au cours du temps. Au
cours de son raccourcissement, le pourcentage de déformation est négatif en
raison de la mesure finale du segment comparativement à sa longueur initiale.
Inversement, un allongement de ce dernier génère une déformation positive (Figure
14).
33
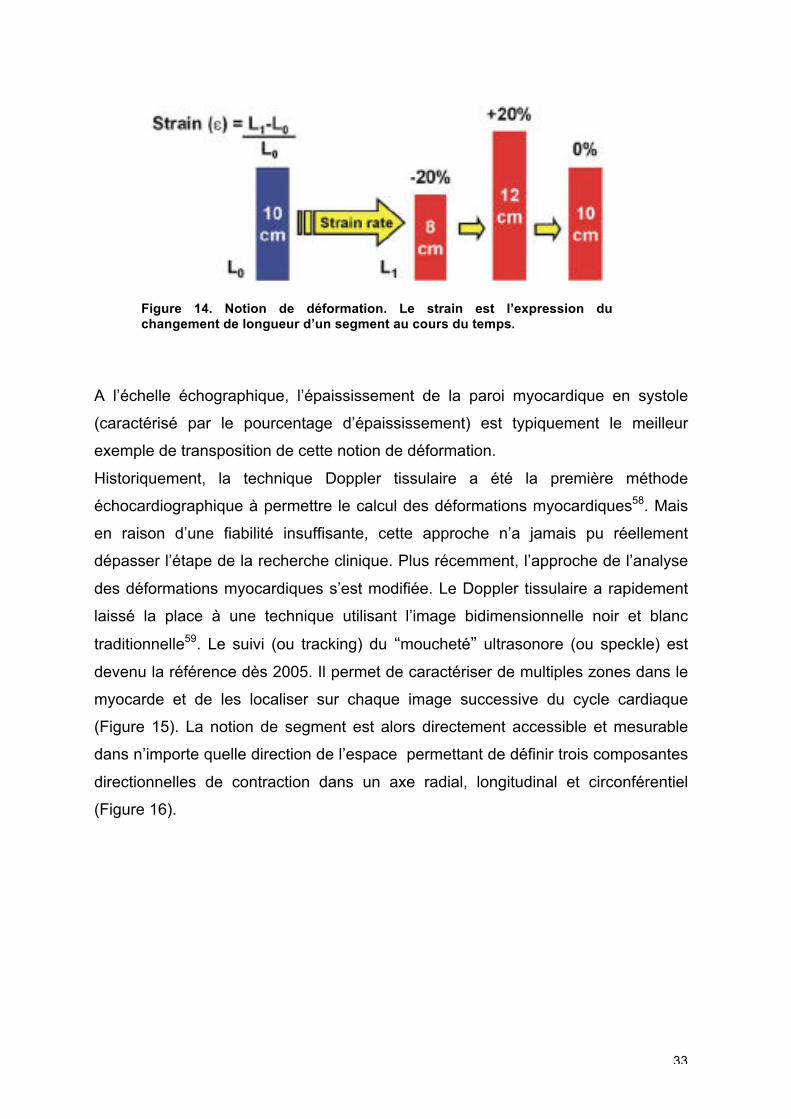
Figure 14. Notion de déformation. Le strain est l’expression du changement de longueur d’un segment au cours du temps.
A l’échelle échographique, l’épaississement de la paroi myocardique en systole
(caractérisé par le pourcentage d’épaississement) est typiquement le meilleur
exemple de transposition de cette notion de déformation.
Historiquement, la technique Doppler tissulaire a été la première méthode
échocardiographique à permettre le calcul des déformations myocardiques58. Mais
en raison d’une fiabilité insuffisante, cette approche n’a jamais pu réellement
dépasser l’étape de la recherche clinique. Plus récemment, l’approche de l’analyse
des déformations myocardiques s’est modifiée. Le Doppler tissulaire a rapidement
laissé la place à une technique utilisant l’image bidimensionnelle noir et blanc
traditionnelle59. Le suivi (ou tracking) du “moucheté” ultrasonore (ou speckle) est
devenu la référence dès 2005. Il permet de caractériser de multiples zones dans le
myocarde et de les localiser sur chaque image successive du cycle cardiaque
(Figure 15). La notion de segment est alors directement accessible et mesurable
dans n’importe quelle direction de l’espace permettant de définir trois composantes
directionnelles de contraction dans un axe radial, longitudinal et circonférentiel
(Figure 16).
34
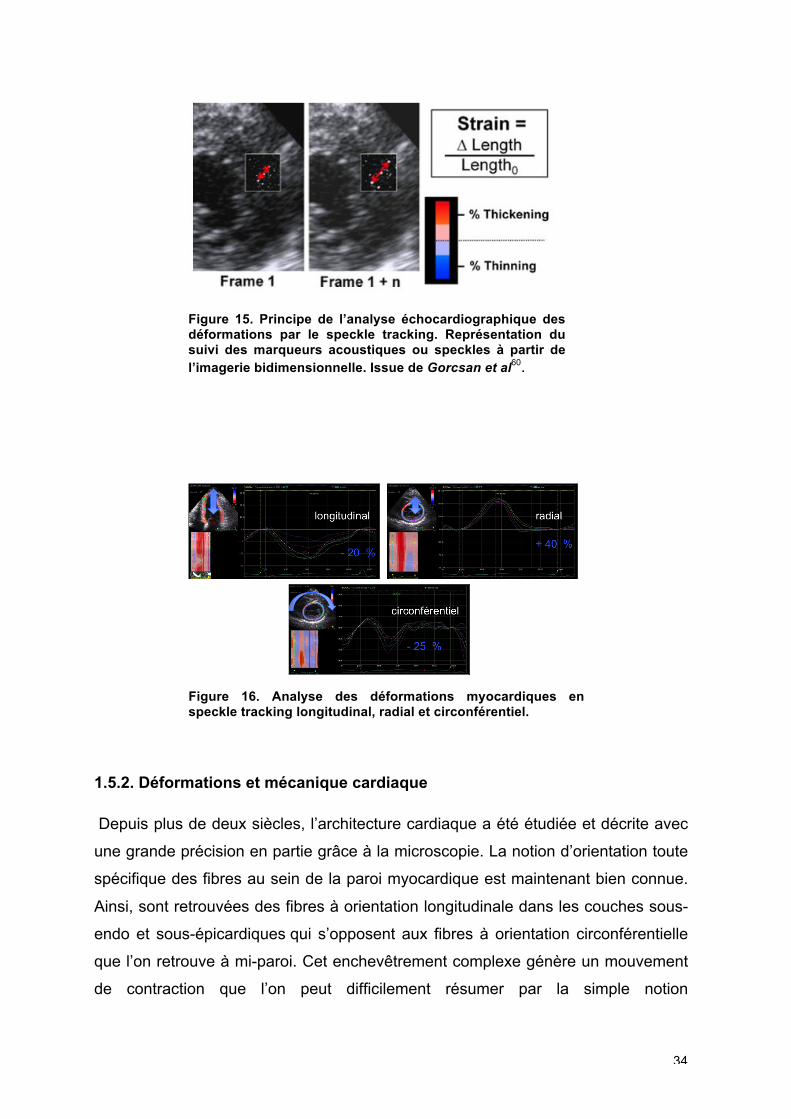
Figure 15. Principe de l’analyse échocardiographique des déformations par le speckle tracking. Représentation du suivi des marqueurs acoustiques ou speckles à partir de l’imagerie bidimensionnelle. Issue de Gorcsan et al
60.
Figure 16. Analyse des déformations myocardiques en speckle tracking longitudinal, radial et circonférentiel.
1.5.2. Déformations et mécanique cardiaque
Depuis plus de deux siècles, l’architecture cardiaque a été étudiée et décrite avec
une grande précision en partie grâce à la microscopie. La notion d’orientation toute
spécifique des fibres au sein de la paroi myocardique est maintenant bien connue.
Ainsi, sont retrouvées des fibres à orientation longitudinale dans les couches sous-
endo et sous-épicardiques qui s’opposent aux fibres à orientation circonférentielle
que l’on retrouve à mi-paroi. Cet enchevêtrement complexe génère un mouvement
de contraction que l’on peut difficilement résumer par la simple notion
35
d’épaississement de paroi. En effet, le cœur raccourcit sa longueur en systole
(distance anneau – apex) mais également subit un mouvement de torsion entre la
base et l’apex.
Trente années ont été nécessaires pour confirmer les premières hypothèses et de
les appliquer en routine avec la puissance de l’analyse des déformations en
échocardiographie, qui autorise une dimension supplémentaire à celles radiale et
longitudinale : la déformation circonférentielle.
Au-delà, de l’approche descriptive des déformations, il est essentiel de
repositionner les notions de contractilité (raccourcissement myocytaire) au sein de
leur environnement (charges et morphologie ventriculaire) résultant en la
contraction myocardique. En effet, avant même l’atteinte myocytaire, ces variables
peuvent influencer significativement les valeurs de déformations.
Ainsi, l’interprétation des variations de déformation ne pourra s’effectuer qu’après
une prise en considération stricte de ces paramètres (contractilité, charge et
morphologie ventriculaires gauches).
1.5.3. Déformations et analyse de l’asynchronisme mécanique
L’étude des asynchronismes a également bénéficié de la quantification
myocardique par la technique des déformations.
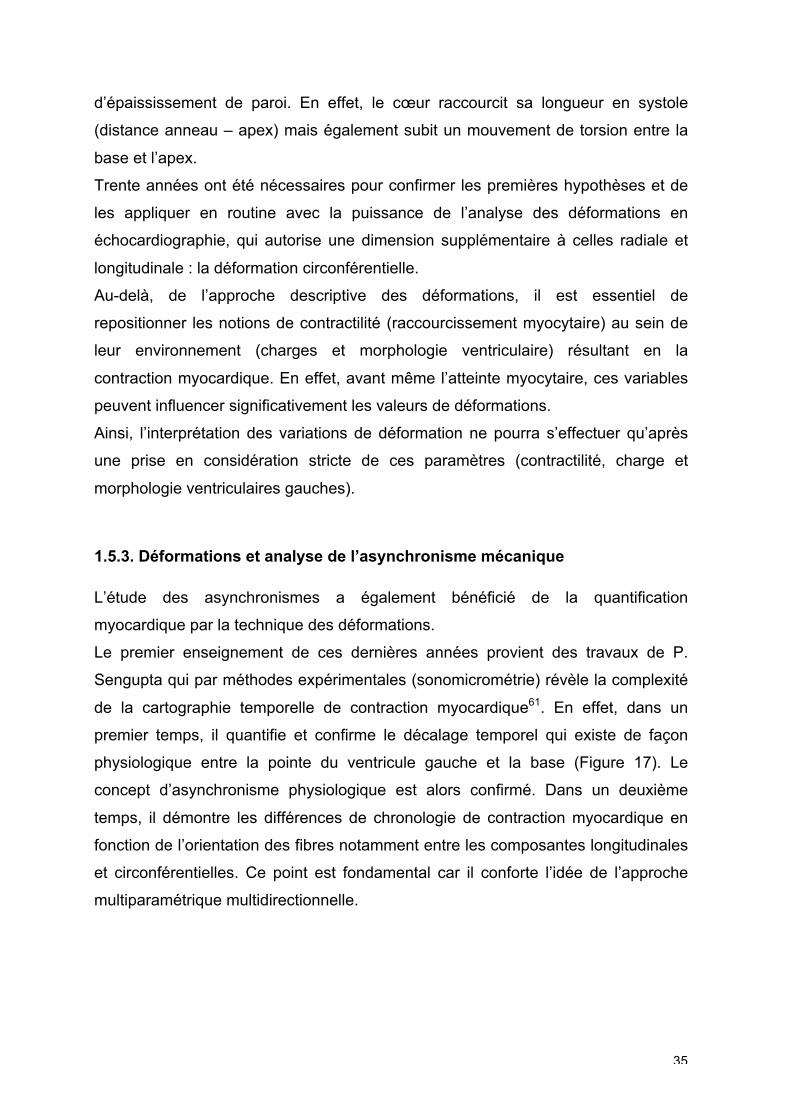
Le premier enseignement de ces dernières années provient des travaux de P.
Sengupta qui par méthodes expérimentales (sonomicrométrie) révèle la complexité
de la cartographie temporelle de contraction myocardique61. En effet, dans un
premier temps, il quantifie et confirme le décalage temporel qui existe de façon
physiologique entre la pointe du ventricule gauche et la base (Figure 17). Le
concept d’asynchronisme physiologique est alors confirmé. Dans un deuxième
temps, il démontre les différences de chronologie de contraction myocardique en
fonction de l’orientation des fibres notamment entre les composantes longitudinales
et circonférentielles. Ce point est fondamental car il conforte l’idée de l’approche
multiparamétrique multidirectionnelle.
36
Figure 17. Exemple de séquence des déformations longitudinales du segment apical au segment basal de la paroi latérale du ventricule gauche. Le pic de déformation (flèche noire) est plus précoce pour le segment apical et est retardé à la phase de relaxation isovolumique pour le segment basal.Phase 1= contraction isovolumique ; 2= éjection ; 3= relaxation isovolumique ; 4= proto-diastole ; 5= télé-diastole. Issue de Sengupta et
al61
.
Parallèlement, dans le domaine de la prédiction de la réponse à la
resynchronisation, plusieurs approches ont été décrites.
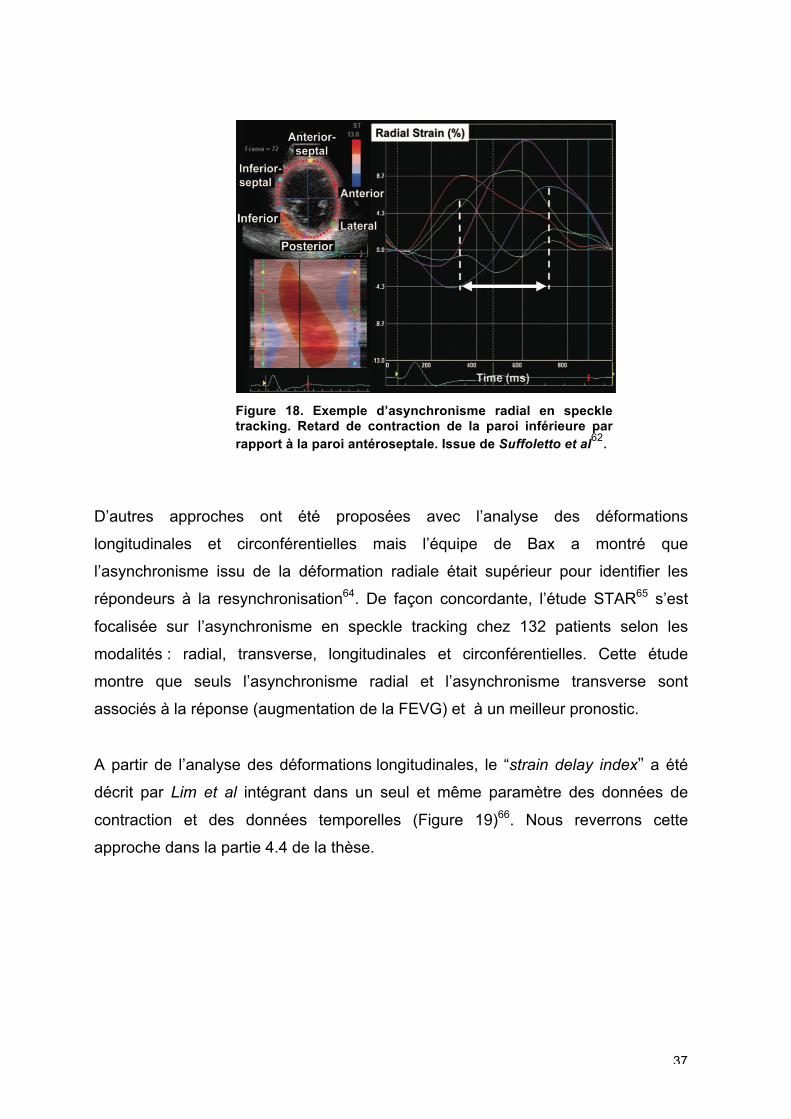
La première est dérivée de l’analyse de l’asynchronisme radial spatial en mode
TM : il s’agit de l’intervalle temporel entre le pic de déformation radiale de la paroi
antéro-septale et de la paroi inféro-latérale (Figure 18). Dans une étude incluant
161 patients, Suffoletto et al ont montré qu’un délai de 130 ms entre ces deux
parois prédisait une réponse à la resynchronisation cardiaque avec une sensibilité
et une spécificité de 89% et 83%, respectivement62. La combinaison de l’analyse de
l’asynchronisme radial en strain avec l’asynchronisme longitudinal en Doppler
tissulaire (cf supra) a été proposée par Gorcsan et al63. La combinaison de ces
deux types d’asynchronisme prédisait un remodelage avec une sensibilité de 88%
et une spécificité de 80%, ce qui, dans leur étude, était significativement meilleur
qu’avec chacune des techniques étudiées séparément.
37
Figure 18. Exemple d’asynchronisme radial en speckle tracking. Retard de contraction de la paroi inférieure par rapport à la paroi antéroseptale. Issue de Suffoletto et al
62.
D’autres approches ont été proposées avec l’analyse des déformations
longitudinales et circonférentielles mais l’équipe de Bax a montré que
l’asynchronisme issu de la déformation radiale était supérieur pour identifier les
répondeurs à la resynchronisation64. De façon concordante, l’étude STAR65 s’est
focalisée sur l’asynchronisme en speckle tracking chez 132 patients selon les
modalités : radial, transverse, longitudinales et circonférentielles. Cette étude
montre que seuls l’asynchronisme radial et l’asynchronisme transverse sont
associés à la réponse (augmentation de la FEVG) et à un meilleur pronostic.
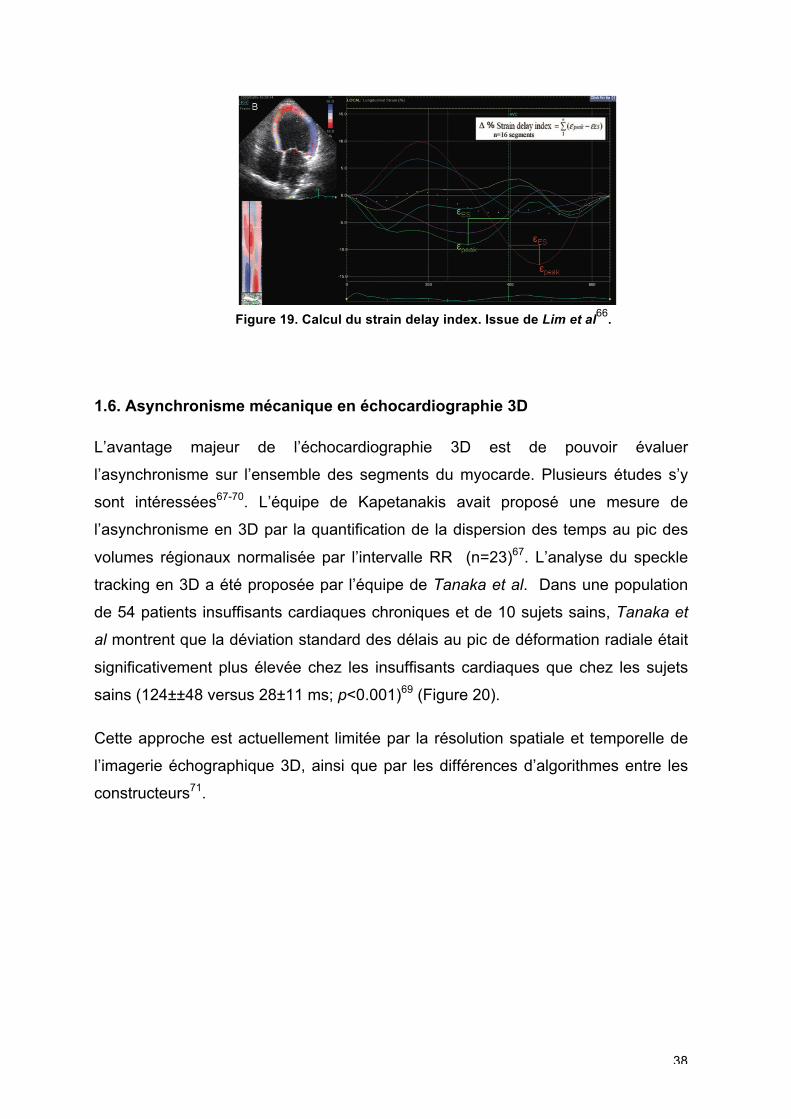
A partir de l’analyse des déformations longitudinales, le “strain delay index” a été
décrit par Lim et al intégrant dans un seul et même paramètre des données de
contraction et des données temporelles (Figure 19)66. Nous reverrons cette
approche dans la partie 4.4 de la thèse.
38
Figure 19. Calcul du strain delay index. Issue de Lim et al
66.
1.6. Asynchronisme mécanique en échocardiographie 3D
L’avantage majeur de l’échocardiographie 3D est de pouvoir évaluer
l’asynchronisme sur l’ensemble des segments du myocarde. Plusieurs études s’y
sont intéressées67-70. L’équipe de Kapetanakis avait proposé une mesure de
l’asynchronisme en 3D par la quantification de la dispersion des temps au pic des
volumes régionaux normalisée par l’intervalle RR (n=23)67. L’analyse du speckle
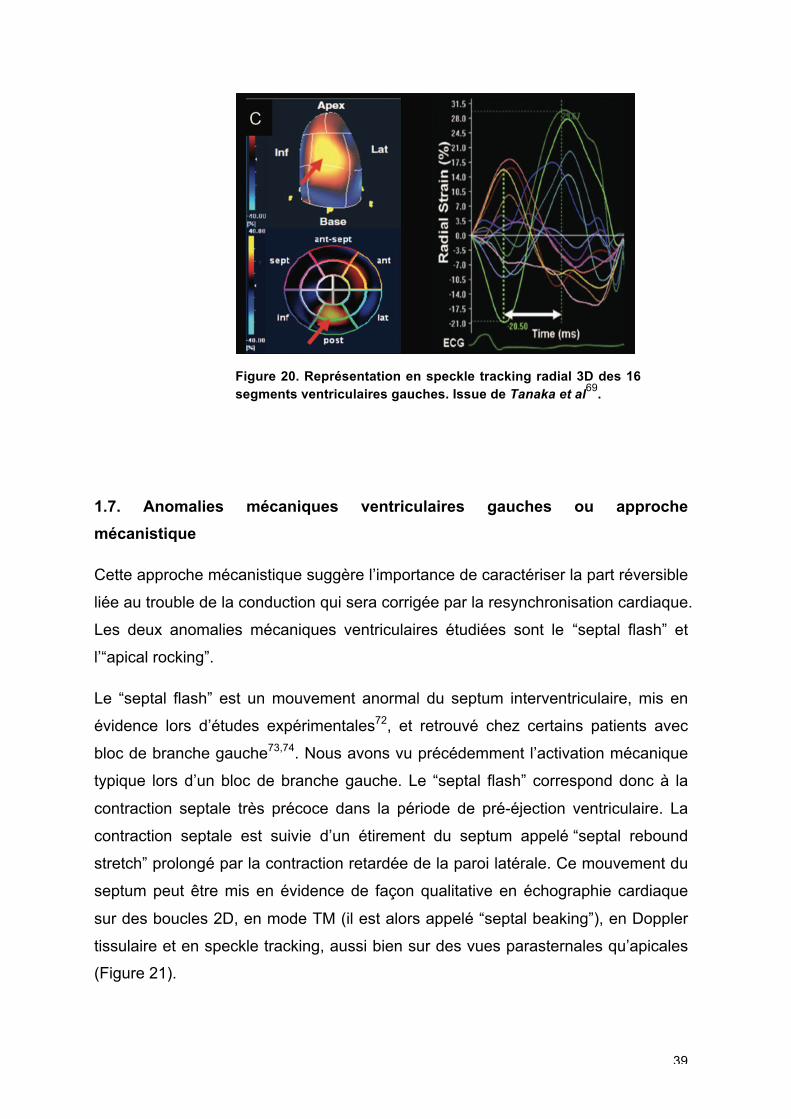
tracking en 3D a été proposée par l’équipe de Tanaka et al. Dans une population
de 54 patients insuffisants cardiaques chroniques et de 10 sujets sains, Tanaka et
al montrent que la déviation standard des délais au pic de déformation radiale était
significativement plus élevée chez les insuffisants cardiaques que chez les sujets
sains (124±±48 versus 28±11 ms; p<0.001)69 (Figure 20).
Cette approche est actuellement limitée par la résolution spatiale et temporelle de
l’imagerie échographique 3D, ainsi que par les différences d’algorithmes entre les
constructeurs71.
39
Figure 20. Représentation en speckle tracking radial 3D des 16 segments ventriculaires gauches. Issue de Tanaka et al
69.
1.7. Anomalies mécaniques ventriculaires gauches ou approche
mécanistique
Cette approche mécanistique suggère l’importance de caractériser la part réversible
liée au trouble de la conduction qui sera corrigée par la resynchronisation cardiaque.
Les deux anomalies mécaniques ventriculaires étudiées sont le “septal flash” et
l’“apical rocking”.
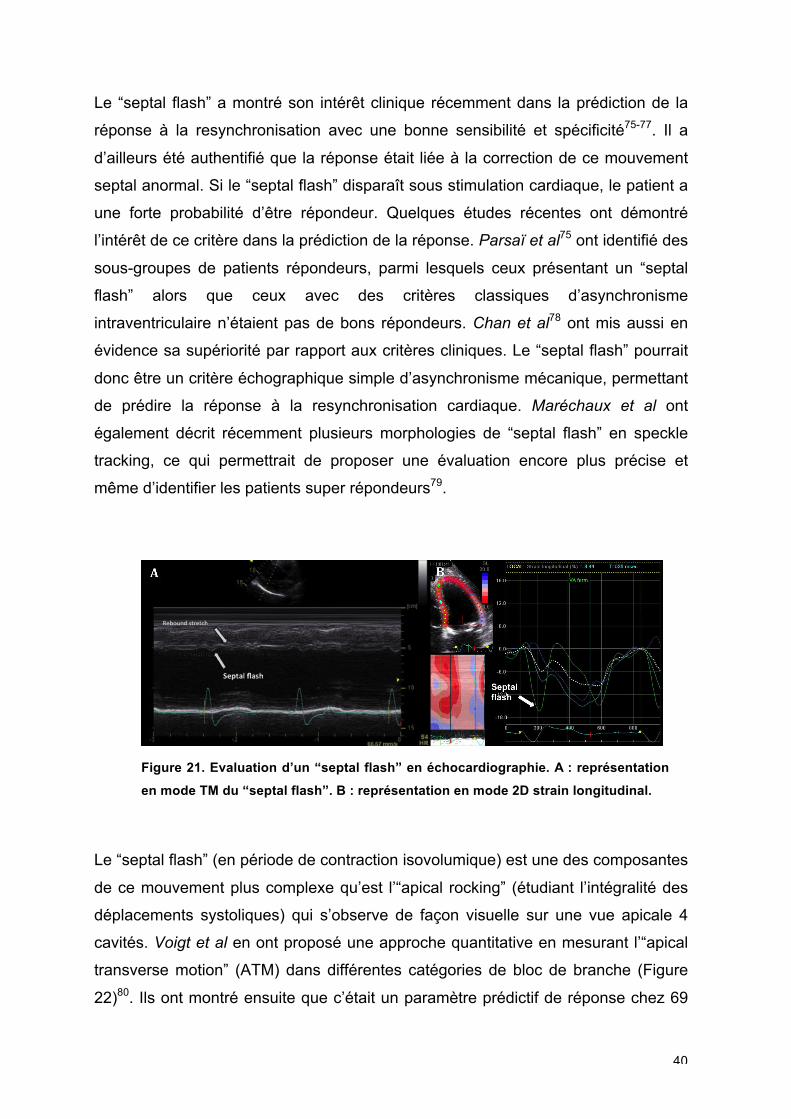
Le “septal flash” est un mouvement anormal du septum interventriculaire, mis en
évidence lors d’études expérimentales72, et retrouvé chez certains patients avec
bloc de branche gauche73,74. Nous avons vu précédemment l’activation mécanique
typique lors d’un bloc de branche gauche. Le “septal flash” correspond donc à la
contraction septale très précoce dans la période de pré-éjection ventriculaire. La
contraction septale est suivie d’un étirement du septum appelé “septal rebound
stretch” prolongé par la contraction retardée de la paroi latérale. Ce mouvement du
septum peut être mis en évidence de façon qualitative en échographie cardiaque
sur des boucles 2D, en mode TM (il est alors appelé “septal beaking”), en Doppler
tissulaire et en speckle tracking, aussi bien sur des vues parasternales qu’apicales
(Figure 21).
40
Le “septal flash” a montré son intérêt clinique récemment dans la prédiction de la
réponse à la resynchronisation avec une bonne sensibilité et spécificité75-77. Il a
d’ailleurs été authentifié que la réponse était liée à la correction de ce mouvement
septal anormal. Si le “septal flash” disparaît sous stimulation cardiaque, le patient a
une forte probabilité d’être répondeur. Quelques études récentes ont démontré
l’intérêt de ce critère dans la prédiction de la réponse. Parsaï et al75 ont identifié des
sous-groupes de patients répondeurs, parmi lesquels ceux présentant un “septal
flash” alors que ceux avec des critères classiques d’asynchronisme
intraventriculaire n’étaient pas de bons répondeurs. Chan et al78 ont mis aussi en
évidence sa supériorité par rapport aux critères cliniques. Le “septal flash” pourrait
donc être un critère échographique simple d’asynchronisme mécanique, permettant
de prédire la réponse à la resynchronisation cardiaque. Maréchaux et al ont
également décrit récemment plusieurs morphologies de “septal flash” en speckle
tracking, ce qui permettrait de proposer une évaluation encore plus précise et
même d’identifier les patients super répondeurs79.
Figure 21. Evaluation d’un “septal flash” en échocardiographie. A : représentation
en mode TM du “septal flash”. B : représentation en mode 2D strain longitudinal.
Le “septal flash” (en période de contraction isovolumique) est une des composantes
de ce mouvement plus complexe qu’est l’“apical rocking” (étudiant l’intégralité des
déplacements systoliques) qui s’observe de façon visuelle sur une vue apicale 4
cavités. Voigt et al en ont proposé une approche quantitative en mesurant l’“apical
transverse motion” (ATM) dans différentes catégories de bloc de branche (Figure
22)80. Ils ont montré ensuite que c’était un paramètre prédictif de réponse chez 69
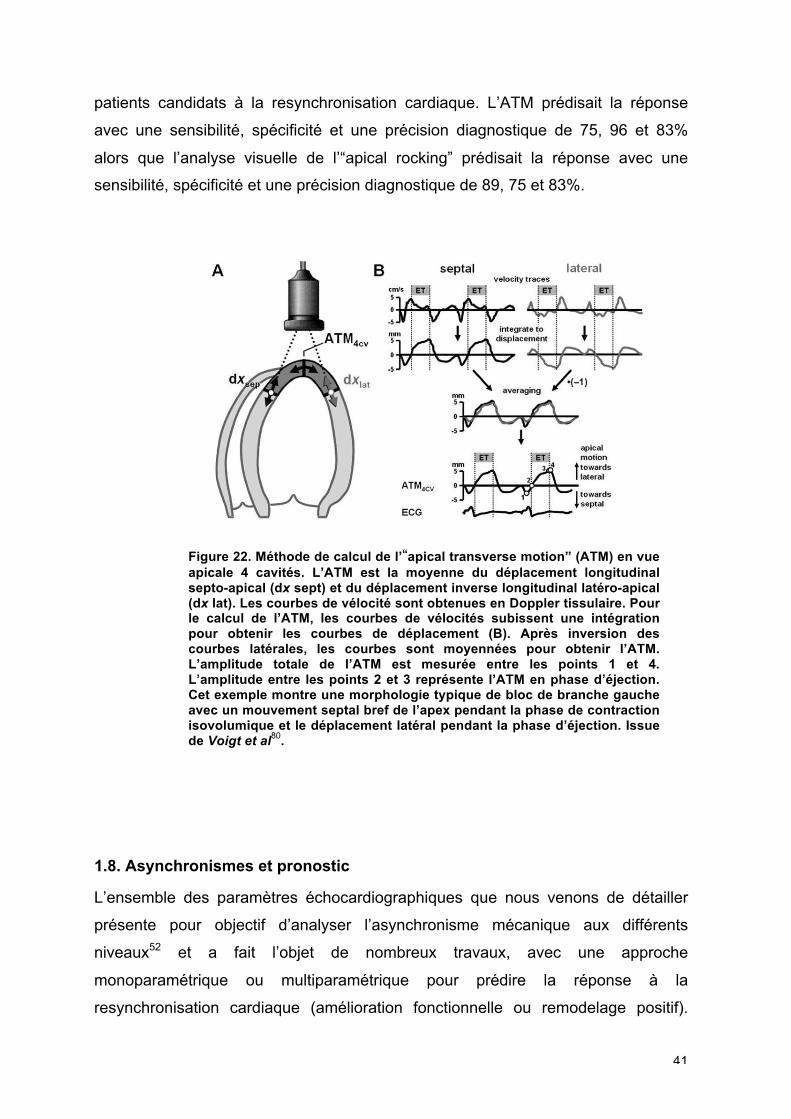
41
patients candidats à la resynchronisation cardiaque. L’ATM prédisait la réponse
avec une sensibilité, spécificité et une précision diagnostique de 75, 96 et 83%
alors que l’analyse visuelle de l’“apical rocking” prédisait la réponse avec une
sensibilité, spécificité et une précision diagnostique de 89, 75 et 83%.
Figure 22. Méthode de calcul de l’“apical transverse motion” (ATM) en vue apicale 4 cavités. L’ATM est la moyenne du déplacement longitudinal septo-apical (dx sept) et du déplacement inverse longitudinal latéro-apical (dx lat). Les courbes de vélocité sont obtenues en Doppler tissulaire. Pour le calcul de l’ATM, les courbes de vélocités subissent une intégration pour obtenir les courbes de déplacement (B). Après inversion des courbes latérales, les courbes sont moyennées pour obtenir l’ATM. L’amplitude totale de l’ATM est mesurée entre les points 1 et 4. L’amplitude entre les points 2 et 3 représente l’ATM en phase d’éjection. Cet exemple montre une morphologie typique de bloc de branche gauche avec un mouvement septal bref de l’apex pendant la phase de contraction isovolumique et le déplacement latéral pendant la phase d’éjection. Issue de Voigt et al
80.
1.8. Asynchronismes et pronostic
L’ensemble des paramètres échocardiographiques que nous venons de détailler
présente pour objectif d’analyser l’asynchronisme mécanique aux différents
niveaux52 et a fait l’objet de nombreux travaux, avec une approche
monoparamétrique ou multiparamétrique pour prédire la réponse à la
resynchronisation cardiaque (amélioration fonctionnelle ou remodelage positif).

42
Cependant, les recommandations internationales ne reconnaissent la place d’aucun
de ces paramètres dans la stratégie de sélection des patients candidats à la
resynchronisation cardiaque.
Pourtant, plusieurs grandes études récentes ont aussi montré que la présence d’un
asynchronisme mécanique était un facteur pronostique de survie à long terme20,81-84.
L’approche pronostique a été appréhendée au niveau interventriculaire20 comme au
niveau intraventriculaire. Zhang et al ont montré chez 239 patients, qu’un délai 65
ms entre les pics de vélocité de 2 parois opposées en Doppler tissulaire était un
facteur indépendant de mortalité cardiovasculaire (hazard ratio 0.463, intervalle de
confiance 95% 0.720-0.972; p<0.005)81. Leyva et al ont montré la valeur
pronostique de l’asynchronisme mécanique évalué en IRM82. Chez 148 patients,
l’asynchronisme mécanique était mesuré par la dispersion temporelle des pics de
déplacement myocardique. La présence d’un asynchronisme était corrélée à la
mortalité cardiovasculaire sur un suivi de 2,5 années (hazard ratio 1.01, intervalle
de confiance 95%1.00-1.02; p<0.001).
Risum et al ont confirmé ces résultats selon différentes méthodes en Doppler
tissulaire85. L’équipe de Gorcsan a montré en 2010 que l’index de Yu (Doppler
tissulaire) et l’asynchronisme radial étaient indépendamment associés au pronostic
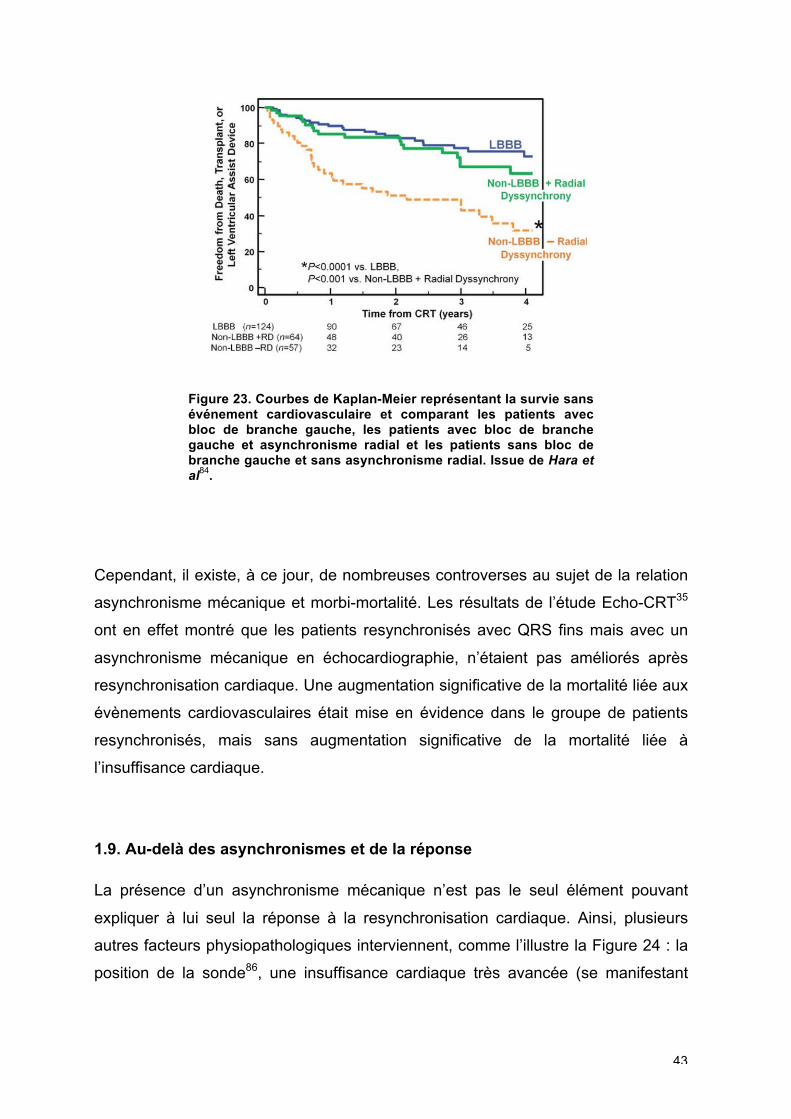
des patients83. Plus récemment, il était démontré de façon intéressante que les
patients n’ayant pas une morphologie de QRS de type bloc de branche gauche
mais avec un asynchronisme radial en speckle tracking avaient un meilleur
pronostic après resynchronisation cardiaque que ceux sans asynchronisme
mécanique (Figure 23)84.
43
Figure 23. Courbes de Kaplan-Meier représentant la survie sans événement cardiovasculaire et comparant les patients avec bloc de branche gauche, les patients avec bloc de branche gauche et asynchronisme radial et les patients sans bloc de branche gauche et sans asynchronisme radial. Issue de Hara et al
84.
Cependant, il existe, à ce jour, de nombreuses controverses au sujet de la relation
asynchronisme mécanique et morbi-mortalité. Les résultats de l’étude Echo-CRT35
ont en effet montré que les patients resynchronisés avec QRS fins mais avec un
asynchronisme mécanique en échocardiographie, n’étaient pas améliorés après
resynchronisation cardiaque. Une augmentation significative de la mortalité liée aux
évènements cardiovasculaires était mise en évidence dans le groupe de patients
resynchronisés, mais sans augmentation significative de la mortalité liée à
l’insuffisance cardiaque.
1.9. Au-delà des asynchronismes et de la réponse
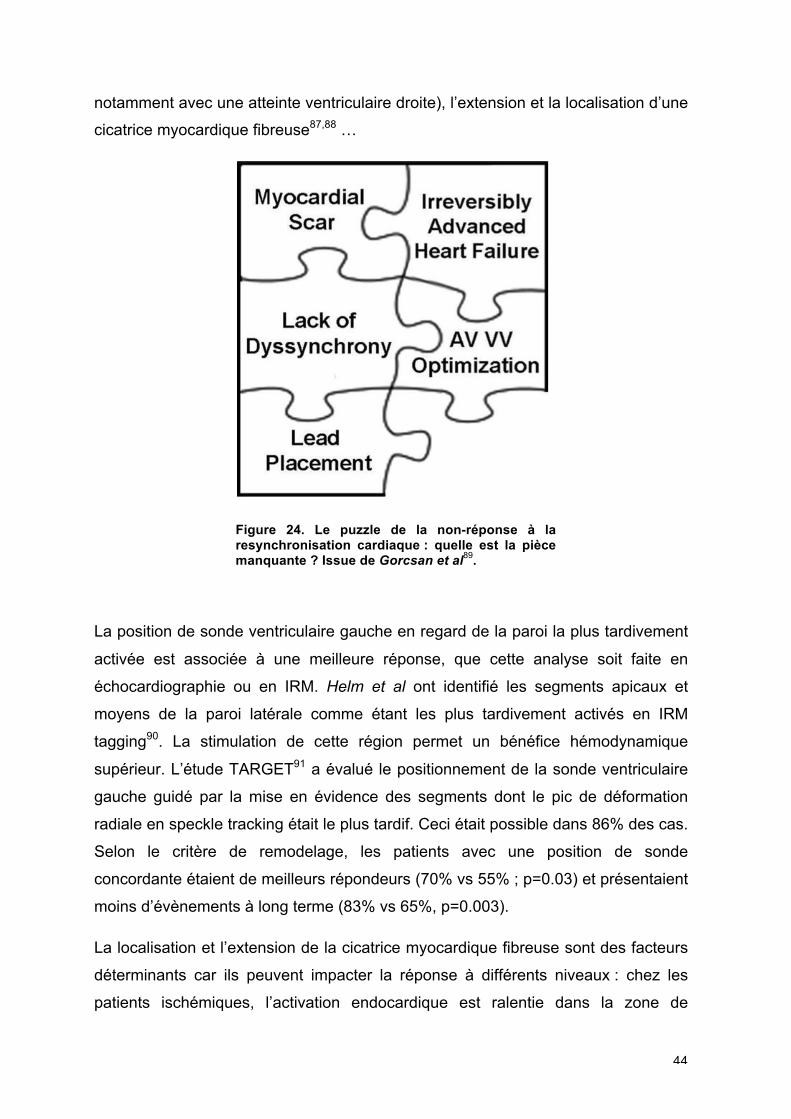
La présence d’un asynchronisme mécanique n’est pas le seul élément pouvant
expliquer à lui seul la réponse à la resynchronisation cardiaque. Ainsi, plusieurs
autres facteurs physiopathologiques interviennent, comme l’illustre la Figure 24 : la
position de la sonde86, une insuffisance cardiaque très avancée (se manifestant
44
notamment avec une atteinte ventriculaire droite), l’extension et la localisation d’une
cicatrice myocardique fibreuse87,88 …
Figure 24. Le puzzle de la non-réponse à la resynchronisation cardiaque : quelle est la pièce manquante ? Issue de Gorcsan et al
89.
La position de sonde ventriculaire gauche en regard de la paroi la plus tardivement
activée est associée à une meilleure réponse, que cette analyse soit faite en
échocardiographie ou en IRM. Helm et al ont identifié les segments apicaux et
moyens de la paroi latérale comme étant les plus tardivement activés en IRM
tagging90. La stimulation de cette région permet un bénéfice hémodynamique
supérieur. L’étude TARGET91 a évalué le positionnement de la sonde ventriculaire
gauche guidé par la mise en évidence des segments dont le pic de déformation
radiale en speckle tracking était le plus tardif. Ceci était possible dans 86% des cas.
Selon le critère de remodelage, les patients avec une position de sonde
concordante étaient de meilleurs répondeurs (70% vs 55% ; p=0.03) et présentaient
moins d’évènements à long terme (83% vs 65%, p=0.003).
La localisation et l’extension de la cicatrice myocardique fibreuse sont des facteurs
déterminants car ils peuvent impacter la réponse à différents niveaux : chez les
patients ischémiques, l’activation endocardique est ralentie dans la zone de
45
cicatrice, la présence d’une cicatrice transmurale dans la région de stimulation
limite l’efficacité de la resynchronisation, et l’extension de la cicatrice peut limiter le
remodelage du VG. L’examen de référence pour analyser la viabilité myocardique
est l’imagerie par résonance myocardique (IRM) avec une résolution spatiale
élevée : elle permet d’évaluer le caractère transmural ou non de la cicatrice. Ainsi,
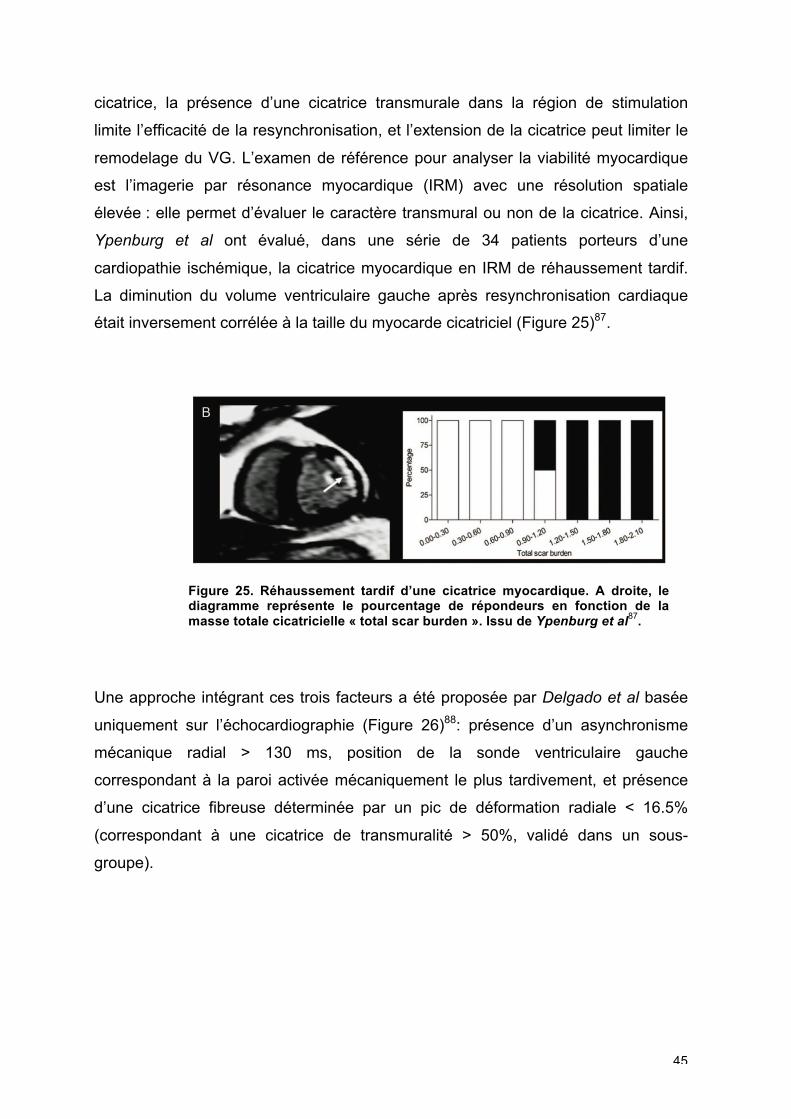
Ypenburg et al ont évalué, dans une série de 34 patients porteurs d’une
cardiopathie ischémique, la cicatrice myocardique en IRM de réhaussement tardif.
La diminution du volume ventriculaire gauche après resynchronisation cardiaque
était inversement corrélée à la taille du myocarde cicatriciel (Figure 25)87.
Figure 25. Réhaussement tardif d’une cicatrice myocardique. A droite, le diagramme représente le pourcentage de répondeurs en fonction de la masse totale cicatricielle « total scar burden ». Issu de Ypenburg et al
87.
Une approche intégrant ces trois facteurs a été proposée par Delgado et al basée
uniquement sur l’échocardiographie (Figure 26)88: présence d’un asynchronisme
mécanique radial > 130 ms, position de la sonde ventriculaire gauche
correspondant à la paroi activée mécaniquement le plus tardivement, et présence
d’une cicatrice fibreuse déterminée par un pic de déformation radiale < 16.5%
(correspondant à une cicatrice de transmuralité > 50%, validé dans un sous-
groupe).
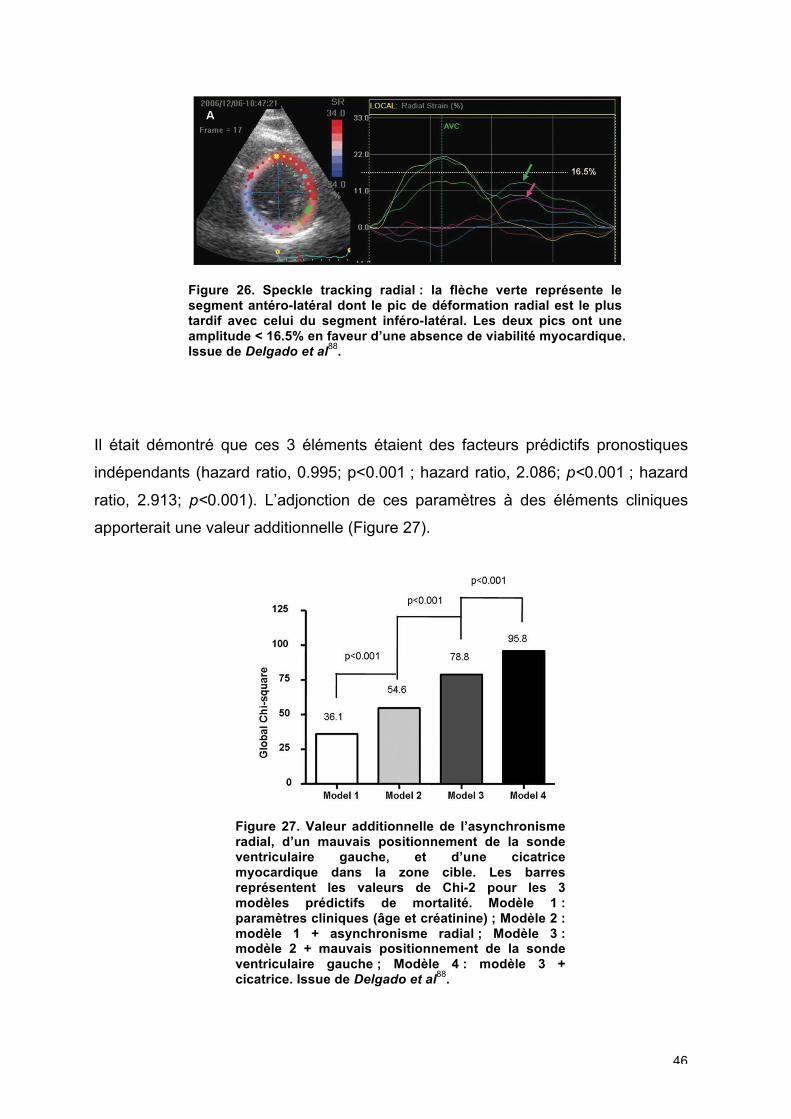
46
Figure 26. Speckle tracking radial : la flèche verte représente le segment antéro-latéral dont le pic de déformation radial est le plus tardif avec celui du segment inféro-latéral. Les deux pics ont une amplitude < 16.5% en faveur d’une absence de viabilité myocardique. Issue de Delgado et al
88.
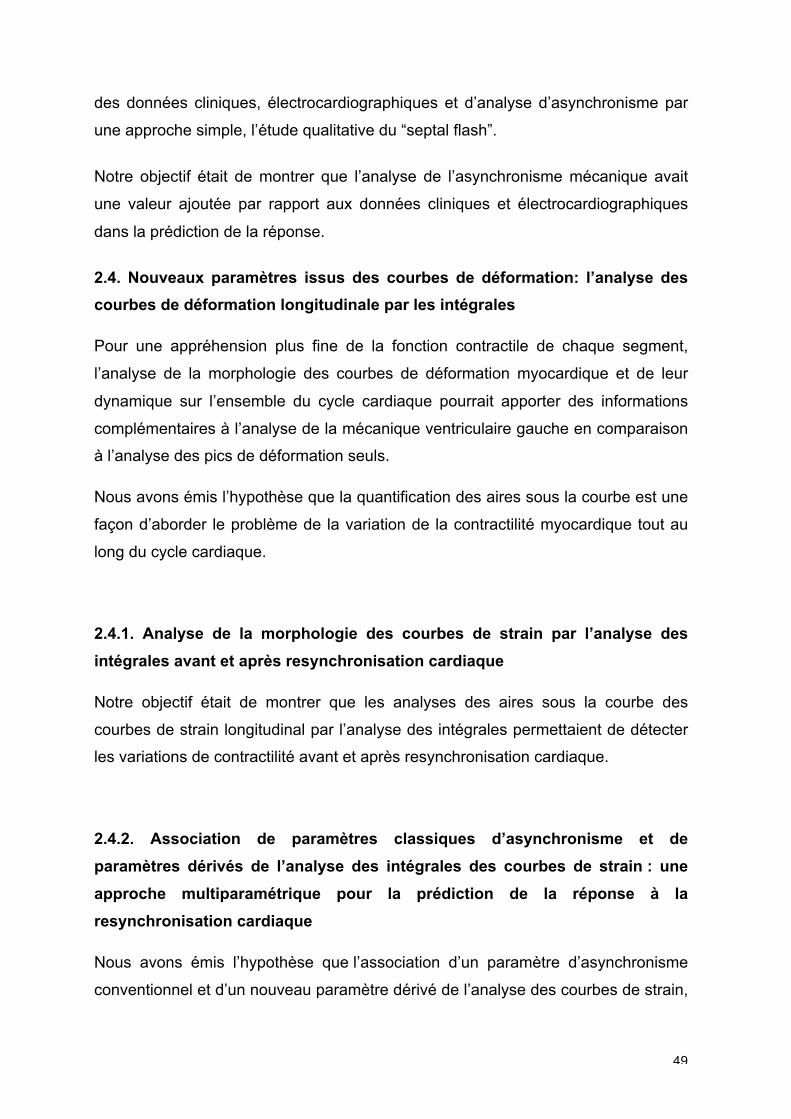
Il était démontré que ces 3 éléments étaient des facteurs prédictifs pronostiques
indépendants (hazard ratio, 0.995; p<0.001 ; hazard ratio, 2.086; p<0.001 ; hazard
ratio, 2.913; p<0.001). L’adjonction de ces paramètres à des éléments cliniques
apporterait une valeur additionnelle (Figure 27).
Figure 27. Valeur additionnelle de l’asynchronisme radial, d’un mauvais positionnement de la sonde ventriculaire gauche, et d’une cicatrice myocardique dans la zone cible. Les barres représentent les valeurs de Chi-2 pour les 3 modèles prédictifs de mortalité. Modèle 1 : paramètres cliniques (âge et créatinine) ; Modèle 2 : modèle 1 + asynchronisme radial ; Modèle 3 : modèle 2 + mauvais positionnement de la sonde ventriculaire gauche ; Modèle 4 : modèle 3 + cicatrice. Issue de Delgado et al
88.

47
PARTIE 2 : HYPOTHESES ET OBJECTIFS

48
PARTIE 2 : HYPOTHESES ET OBJECTIFS
Dans ce travail, nous étudierons différents facteurs qui peuvent influencer l’analyse
de l’asynchronisme mécanique et la réponse à la resynchronisation cardiaque.
Nous aborderons l’asynchronisme mécanique par différentes modalités
d’échocardiographie, principalement le speckle tracking, et nous étudierons
quelques unes des anomalies mécaniques ventriculaires gauches. Le but étant de
définir une approche combinant des informations quantitatives de contractilité
myocardique et des informations temporelles.
2.1. L’impact des structures connexes : le ventricule droit
Dans un premier temps, nous nous sommes focalisés sur le rôle des structures
connexes au ventricule gauche, en particulier le ventricule droit. Nous savons
qu’une dysfonction ventriculaire droite associée à une dysfonction ventriculaire
gauche est un facteur de mauvais pronostic dans l’insuffisance cardiaque92.
Notre objectif était de déterminer les interférences potentielles de la dysfonction
ventriculaire droite avec les asynchronismes mécaniques.
2.2. Le concept d’évaluation à l’effort dans l’étude de la réserve contractile
Dans un deuxième temps, nous avons étudié la viabilité tissulaire ou réserve
contractile à l’effort comme déterminant de la réponse à la resynchronisation.
Notre objectif était de montrer qu’une analyse échocardiographique à l’effort des
patients candidats à une resynchronisation pouvait apporter des informations
complémentaires, aussi bien sur la présence d’une réserve contractile de la paroi
latérale, que sur l’évaluation des asynchronismes mécaniques à l’effort.
2.3. Activation septale et approche multiparamétrique
Une troisième étape a été celle de déterminer, selon l’approche multiparamétrique,
un score de prédiction de la réponse positive au traitement électrique, en associant
49
des données cliniques, électrocardiographiques et d’analyse d’asynchronisme par
une approche simple, l’étude qualitative du “septal flash”.
Notre objectif était de montrer que l’analyse de l’asynchronisme mécanique avait
une valeur ajoutée par rapport aux données cliniques et électrocardiographiques
dans la prédiction de la réponse.
2.4. Nouveaux paramètres issus des courbes de déformation: l’analyse des
courbes de déformation longitudinale par les intégrales
Pour une appréhension plus fine de la fonction contractile de chaque segment,
l’analyse de la morphologie des courbes de déformation myocardique et de leur
dynamique sur l’ensemble du cycle cardiaque pourrait apporter des informations
complémentaires à l’analyse de la mécanique ventriculaire gauche en comparaison
à l’analyse des pics de déformation seuls.
Nous avons émis l’hypothèse que la quantification des aires sous la courbe est une
façon d’aborder le problème de la variation de la contractilité myocardique tout au
long du cycle cardiaque.
2.4.1. Analyse de la morphologie des courbes de strain par l’analyse des
intégrales avant et après resynchronisation cardiaque
Notre objectif était de montrer que les analyses des aires sous la courbe des
courbes de strain longitudinal par l’analyse des intégrales permettaient de détecter
les variations de contractilité avant et après resynchronisation cardiaque.
2.4.2. Association de paramètres classiques d’asynchronisme et de
paramètres dérivés de l’analyse des intégrales des courbes de strain : une
approche multiparamétrique pour la prédiction de la réponse à la
resynchronisation cardiaque
Nous avons émis l’hypothèse que l’association d’un paramètre d’asynchronisme
conventionnel et d’un nouveau paramètre dérivé de l’analyse des courbes de strain,

50
SDt,peak et SDIL, peak, permettait d’améliorer le remodelage inverse du ventricule
gauche et de prévenir la survenue d’évènements cliniques.

51
PARTIE 3 : METHODES
52
PARTIE 3 : METHODES
3.1. Population
3.1.1. Cohorte de Rennes
Dans le cadre de ces travaux successifs, nous avons étudié des patients
insuffisants cardiaques chroniques adressés consécutivement dans le service de
cardiologie du CHU de Rennes pour primo-implantation d’un dispositif de
resynchronisation cardiaque entre 2010 et 2012. Un bilan complet avec
interrogatoire, examen clinique, électrocardiogramme et échocardiographie
transthoracique était réalisé.
Tous les patients ont donné leur consentement écrit. Le projet avait été accepté par
le comité d’éthique local. Ces patients étaient enregistrés au sein d’une base de
données resynchronisation cardiaque du CHU de Rennes (déclaration CNIL
n°1620030 V.0).
Les critères d’exclusion étaient : un état hémodynamique instable, une
décompensation cardiaque datant de moins d’un mois, et une fibrillation atriale lors
de la réalisation de l’échocardiographie.
Les données cliniques et biologiques relevées étaient : âge, sexe, poids, taille,
traitement médical, étiologie de la cardiopathie, facteurs de risque cardiovasculaire,
BNP, créatinine, hémoglobine. Les données de l’électrocardiogramme relevées
étaient la durée du QRS et la morphologie des QRS.
L’échocardiographie transthoracique était réalisée au repos, avant l’implantation de
la resynchronisation cardiaque, sur un appareil Vivid 7 ou Vivid e9, de la marque
General Electric (GE, Horten, Norway). Elle devait être de bonne qualité pour
analyse offline des boucles échocardiographiques. L’échogénicité était jugée
mauvaise dès que 2 segments sur 17 du ventricule gauche n’étaient pas visualisés.
Une analyse complète, comprenant : des boucles échocardiographiques de 3
cycles consécutifs en mode 2D, niveaux de gris, Doppler couleur et Doppler
53
tissulaire (cadence d’image > 100 Hz) des vues apicales 4, 2 et 3 cavités,
parasternale grand axe, petit axe (base, mid et apex VG) étaient acquises.
Les enregistrements classiques en Doppler continu et pulsé pour analyse du flux
mitral, aortique et tricuspidien étaient réalisés.
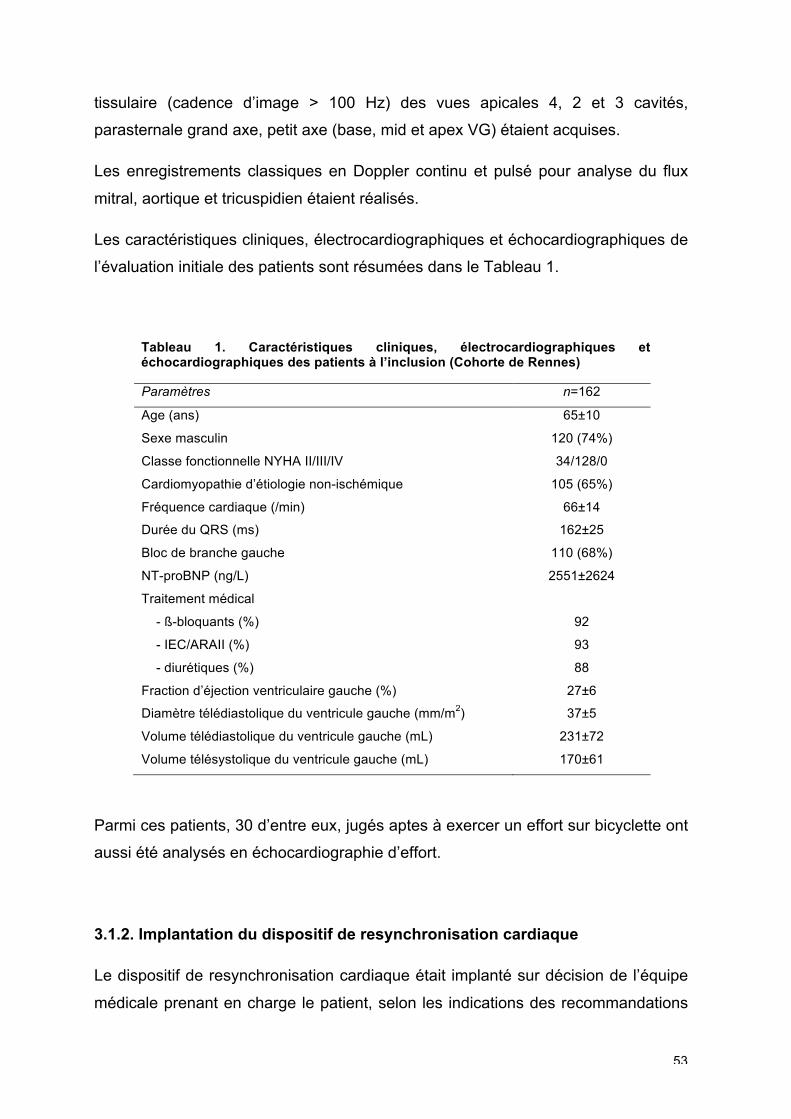
Les caractéristiques cliniques, électrocardiographiques et échocardiographiques de
l’évaluation initiale des patients sont résumées dans le Tableau 1.
Tableau 1. Caractéristiques cliniques, électrocardiographiques et échocardiographiques des patients à l’inclusion (Cohorte de Rennes)
Paramètres n=162
Age (ans) 65±10
Sexe masculin 120 (74%)
Classe fonctionnelle NYHA II/III/IV 34/128/0
Cardiomyopathie d’étiologie non-ischémique 105 (65%)
Fréquence cardiaque (/min) 66±14
Durée du QRS (ms) 162±25
Bloc de branche gauche 110 (68%)
NT-proBNP (ng/L) 2551±2624
Traitement médical
- ß-bloquants (%) 92
- IEC/ARAII (%) 93
- diurétiques (%) 88
Fraction d’éjection ventriculaire gauche (%) 27±6
Diamètre télédiastolique du ventricule gauche (mm/m2) 37±5
Volume télédiastolique du ventricule gauche (mL) 231±72
Volume télésystolique du ventricule gauche (mL) 170±61
Parmi ces patients, 30 d’entre eux, jugés aptes à exercer un effort sur bicyclette ont
aussi été analysés en échocardiographie d’effort.
3.1.2. Implantation du dispositif de resynchronisation cardiaque
Le dispositif de resynchronisation cardiaque était implanté sur décision de l’équipe
médicale prenant en charge le patient, selon les indications des recommandations
54
européennes de 201093 : a) classe NYHA III ou IV, ambulatoire, FEVG ≤35% et
largeur de QRS ≥120 ms ou b) classe NYHA II, FEVG≤35% et largeur de QRS≥150
ms. Un défibrillateur pouvait être associé selon les indications. Tous les patients ont
été implantés dans le mois suivant l’échocardiographie. Le dispositif était implanté
par une incision pectorale gauche, avec insertion intraveineuse de la sonde VG
dans le sinus coronaire. L’implantation de la sonde atriale et de la sonde VD était
laissée à la discrétion du médecin implanteur.
3.1.3. Suivi
Tous les patients ont été suivis entre 3 à 6 mois après l’implantation du dispositif de
resynchronisation cardiaque pour analyse du remodelage ventriculaire gauche
(critère échocardiographique de réponse à la resynchronisation cardiaque) avec
réalisation d’une échocardiographie transthoracique.
Pour la dernière partie de la thèse (partie 4.4), un suivi de 2 ans a été réalisé avec
recueil des évènements cliniques (en particulier hospitalisations pour insuffisance
cardiaque) et des décès toute-cause.
3.1.4. Cohorte de Lille
Une cohorte de patients de l’Université Catholique de Lille a aussi été analysée
pour validation de l’approche multiparamétrique que nous proposons dans la partie
6 de cette thèse. Il s’agissait de 45 patients insuffisants cardiaques chroniques
candidats à une resynchronisation cardiaque. L’échocardiographie a été réalisée
selon le même protocole et sur la même machine que la cohorte de Rennes (Vivid
e9, General Electric). Les patients étaient suivis entre 3 à 6 mois post implantation,
comme ceux de Rennes, avec une échocardiographie transthoracique. Les
caractéristiques cliniques, électrocardiographiques et échocardiographiques des
patients de la cohorte de Lille sont présentées dans le Tableau 2.
55
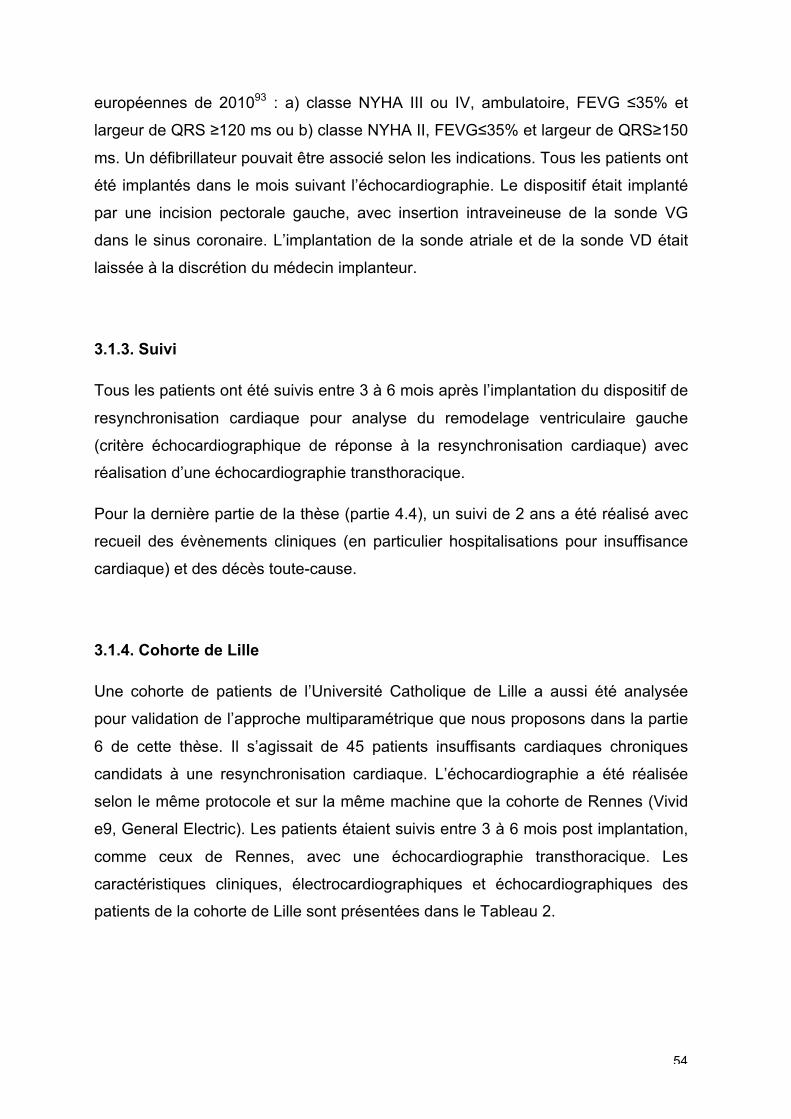
Tableau 2. Caractéristiques cliniques, électrocardiographiques et échocardiographiques des patients de la cohorte de Lille à l’inclusion.
Paramètres n=162
Age (ans) 68±12
Sexe masculin 24 (53%)
Classe fonctionnelle NYHA II/III/IV 19/24/2
Cardiomyopathie d’étiologie non-ischémique 29 (64%)
Fréquence cardiaque (/min) 71±13
Durée du QRS (ms) 156±27
Bloc de branche gauche 32 (71%)
Fraction d’éjection ventriculaire gauche (%) 26±4
Diamètre télédiastolique du ventricule gauche (mm/m2) 37±6
Volume télédiastolique du ventricule gauche (mL) 238±66
Volume télésystolique du ventricule gauche (mL) 177±51
3.2. Analyses échocardiographiques
Toutes les échocardiographies issues des cohortes de Rennes et de Lille ont été
analysées offline, c’est-à-dire sur station déportée avec un logiciel dédié (EchoPAC
PC BT-12, General Electric).
Ainsi tous les volumes auriculaires, ventriculaires, les mesures des diamètres et
des fonctions systoliques ventriculaires ont été calculés offline. L’analyse
échocardiographique comprenait les données habituelles de quantification de fuite
mitrale, évaluation des pressions de remplissage, évaluation des pressions
artérielles pulmonaires. Ces analyses ont été effectuées selon les
recommandations de l’American Society of Echocardiography94.
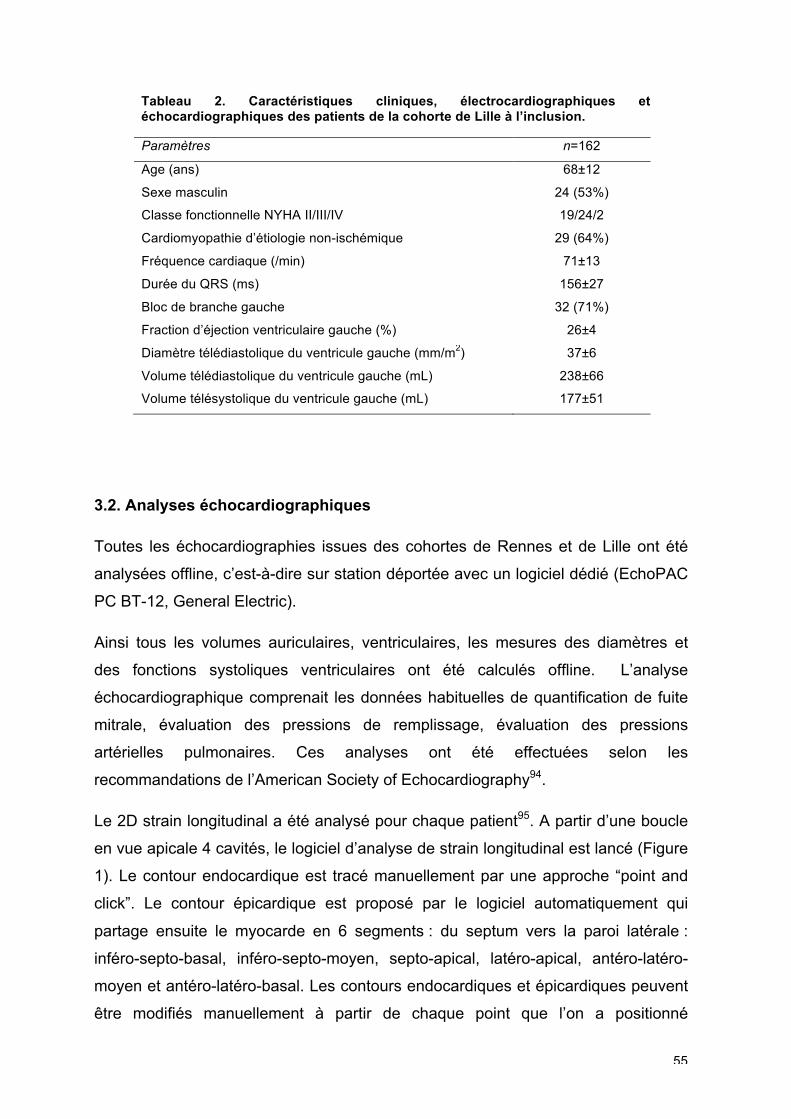
Le 2D strain longitudinal a été analysé pour chaque patient95. A partir d’une boucle
en vue apicale 4 cavités, le logiciel d’analyse de strain longitudinal est lancé (Figure
1). Le contour endocardique est tracé manuellement par une approche “point and
click”. Le contour épicardique est proposé par le logiciel automatiquement qui
partage ensuite le myocarde en 6 segments : du septum vers la paroi latérale :
inféro-septo-basal, inféro-septo-moyen, septo-apical, latéro-apical, antéro-latéro-
moyen et antéro-latéro-basal. Les contours endocardiques et épicardiques peuvent
être modifiés manuellement à partir de chaque point que l’on a positionné
56
manuellement. La qualité du tracking pour chaque segment (en vert : le tracking est
de bonne qualité ; en rouge : il n’est pas correct et le segment est exclu de l’analyse
si ceci n’est pas corrigé après correction manuelle du positionnement des points).
Après validation, le logiciel affiche les 6 courbes de strain longitudinal (et le strain
global longitudinal, représenté par la courbe en pointillés blancs).
Figure 1. Analyse du strain longitudinal en speckle tracking à partir du logiciel
EchoPAC BT-12 (A : image échographique 2D niveaux de gris ; B : contourage
épicardique ; C : contourage endocardique et épicardique et partage du
myocarde ventriculaire gauche en 6 segments ; D : affichage des 6 courbes de
strain longitudinal.
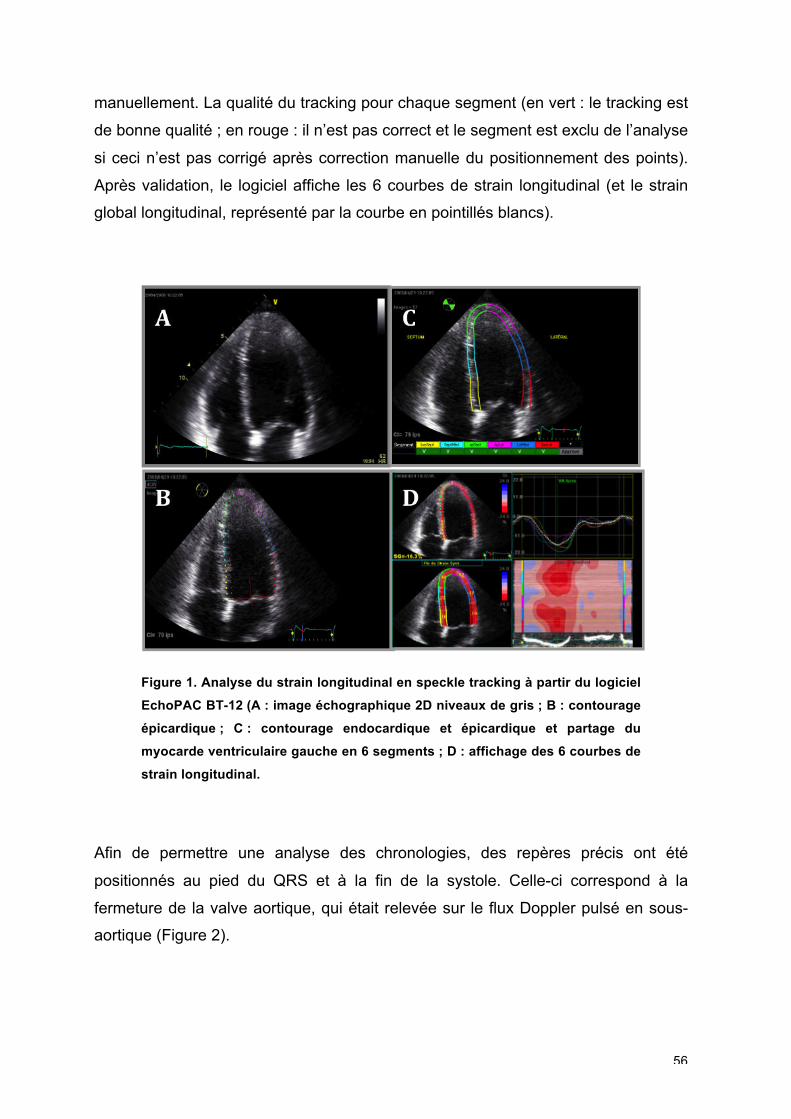
Afin de permettre une analyse des chronologies, des repères précis ont été
positionnés au pied du QRS et à la fin de la systole. Celle-ci correspond à la
fermeture de la valve aortique, qui était relevée sur le flux Doppler pulsé en sous-
aortique (Figure 2).
57
Figure 2. Positionnement des repères
chronologiques : en pointillé jaune, le pied du QRS et
en vert, la fin de la systole correspondant à la
fermeture de la valve aortique (trait blanc) analysée
en Doppler pulsé (au-dessus).
Les amplitudes des pics de strain segmentaires, ainsi que leurs chronologies ont
été relevées, de même pour le strain global.
Les courbes de strain longitudinal de chaque patient de la vue apicale 4 cavités ont
ensuite été exportées sous forme de fichier Excel pour analyse sur Matlab.
3.3. Analyse de l’asynchronisme mécanique
L’asynchronisme mécanique ventriculaire gauche a été étudié aux 3 étages et selon
différentes modalités52 :
‐ remplissage ventriculaire anormal
‐ asynchronisme interventriculaire
‐ asynchronisme intraventriculaire gauche :
o temps de pré-éjection aortique
o analyse qualitative du “septal flash”
o analyse de l’asynchronisme spatial longitudinal :
58
délai septo-latéral en Doppler tissulaire
délai septo-latéral en 2D strain longitudinal
o analyse de l’asynchronisme spatial radial :
délai antérosepto-inférolatéral en 2D strain radial
o analyse de l’asynchronisme temporel : overlap systole/diastole
3.4. Analyse Matlab des courbes de déformations myocardiques
Dans la dernière partie de la thèse (partie 4.4), nous avons analysé les courbes des
déformations longitudinales de la vue apicale 4 cavités à l’aide de Matlab
(Mathworks Inc, USA) et un algorithme que nous avons développé. L’étude des
courbes des déformations longitudinales est possible à partir de l’export du fichier
Excel de l’analyse du strain longitudinal sur le logiciel dédié EchoPAC. Nous avons
développé un algorithme sur Matlab permettant de reconstruire les courbes de
strain et de relever de façon automatique les amplitudes et les chronologies aussi
bien au pic du strain (amplitude maximale de la courbe) qu’à la fin de la systole
marquée par la fermeture de la valve aortique. L’algorithme analyse la morphologie
du signal de strain à partir du repère du pied du QRS. Il calcule les intégrales des
courbes de strain (aire sous la courbe) de deux façons : du pied du QRS au pic de
la courbe (IL,peak) ou du pied du QRS à la fin de la systole (IL,avc).

59
PARTIE 4 : RESULTATS
60
PARTIE 4 : RESULTATS
4.1. L’impact des structures connexes : le ventricule droit
Int J Cardiol 2011. 148;289-294
Introduction
La resynchronisation cardiaque a pour fonction de resynchroniser un ventricule
gauche dont la paroi latérale est retardée par rapport à la paroi septale. De ce fait,
l’étude de l’asynchronisme mécanique s’est focalisée sur l’analyse du ventricule
gauche et le diagnostic de ce retard de contraction d’une paroi par rapport à l’autre.
Mais devant la persistance d’un taux de non-réponse de 30% à la resynchronisation,
et l’absence de paramètre échocardiographique suffisamment robuste pour prédire
cette réponse, d’autres explications physiopathologiques que celle de la présence
d’un asynchronisme mécanique, ont été recherchées.
C’est ainsi que des questions ont été soulevées sur le rôle des structures
adjacentes au ventricule gauche, comme le ventricule droit.
En dehors du fait que le ventricule droit et le ventricule gauche soient situés dans le
même sac péricardique, l’interdépendance est permanente entre les deux
ventricules par l’interface du septum interventriculaire notamment96-98, mais aussi
par les fibres longitudinales du ventricule droit qui cravatent l’apex99. Il y a donc une
mécanique complexe, qui en cas de défaillance d’un des ventricules, influence le
travail de l’autre. Même si le ventricule droit est moins puissant que le ventricule
gauche, il n’en reste pas moins un pilier du fonctionnement cardiaque.
L’analyse du ventricule droit est une étape importante de l’évaluation
échocardiographique d’un patient insuffisant cardiaque100. Alors que la fonction du
ventricule droit est un facteur pronostique reconnu dans l’insuffisance cardiaque92,
peu de données sont disponibles quant à l’influence de la fonction systolique du
ventricule droit sur l’analyse des asynchronismes mécaniques101,102.
61
Objectif
L’association d’une dysfonction systolique du ventricule droit à une dysfonction
systolique du ventricule gauche a un impact sur l’analyse de l’asynchronisme
mécanique aux différents étages.
Méthodes
Nous avons inclus prospectivement et consécutivement des patients insuffisants
cardiaques chroniques (classe NYHA II-IV) avec une FEVG<40%, adressés au
laboratoire d’échocardiographie de Rennes pour bilan échocardiographique.
Nous avons étudié ainsi deux groupes de 20 patients : un premier groupe
présentant une dysfonction systolique ventriculaire droite associée à la dysfonction
ventricule gauche, définie par une vélocité de l’anneau tricuspide inférieure à 11.5
cm/s en Doppler tissulaire (SaVD) 103,104 ; et un deuxième groupe, le groupe
contrôle, ne présentant pas de dysfonction ventriculaire droite.
L’asynchronisme mécanique intraventriculaire gauche a été analysé en
échocardiographie avec :
‐ le temps de pré éjection aortique (asynchronisme si >140 ms)
‐ analyse de l’asynchronisme longitudinal spatial :
o délai entre la paroi septale et la paroi latérale ventriculaire gauche en
Doppler pulsé Doppler tissulaire (asynchronisme si >65 ms)
o délai entre la paroi septale et la paroi latérale ventriculaire gauche en
strain longitudinal (asynchronisme si >80 ms)
‐ analyse de l’asynchronisme radial spatial :
o délai entre la paroi antéroseptale et la paroi postérieure en strain radial
(asynchronisme si >130 ms)
L’asynchronisme mécanique a été comparé entre les deux groupes.
Résultats
Les deux groupes (avec dysfonction ventriculaire droite et sans dysfonction
ventriculaire droite) étaient comparables en termes de classe fonctionnelle,
d’étiologie de la cardiomyopathie, de traitement, de durée du QRS et de dilatation
ventriculaire gauche ainsi que de fonction systolique ventriculaire gauche.
En ce qui concerne la dysfonction ventriculaire droite, les deux groupes différaient
de vélocité de l’onde S à l’anneau tricuspide (SaVD), ce qui était le critère de
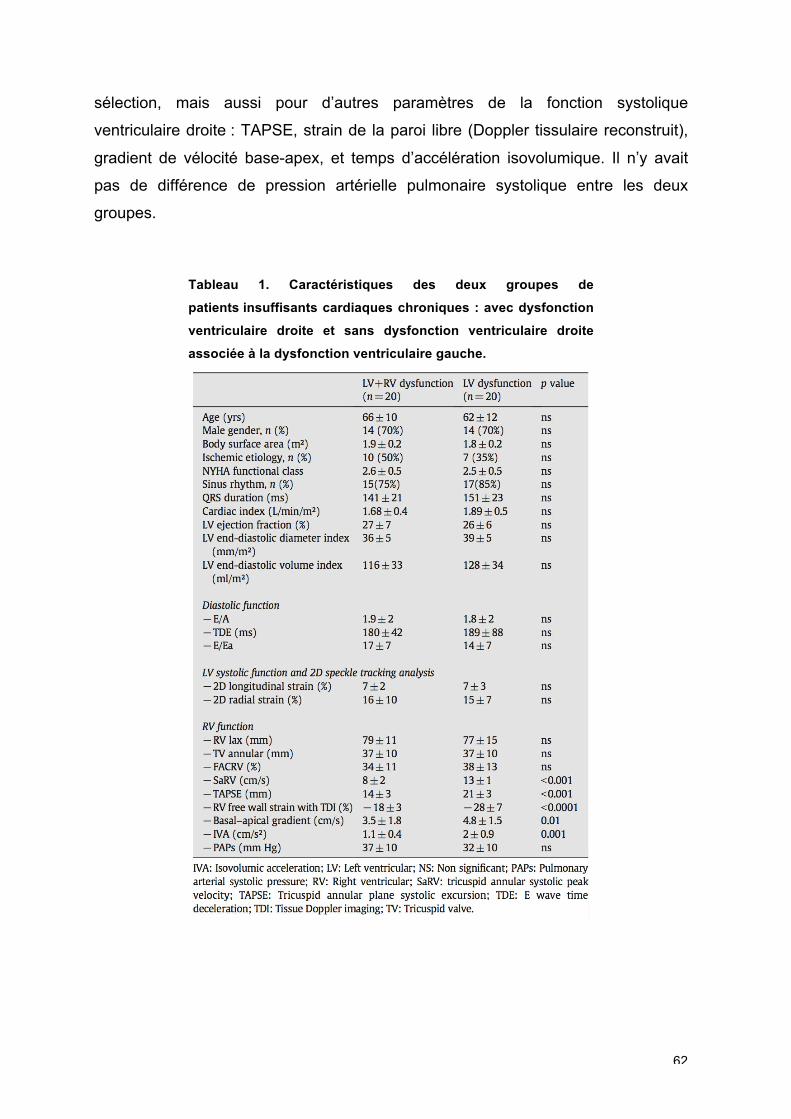
62
sélection, mais aussi pour d’autres paramètres de la fonction systolique
ventriculaire droite : TAPSE, strain de la paroi libre (Doppler tissulaire reconstruit),
gradient de vélocité base-apex, et temps d’accélération isovolumique. Il n’y avait
pas de différence de pression artérielle pulmonaire systolique entre les deux
groupes.
Tableau 1. Caractéristiques des deux groupes de
patients insuffisants cardiaques chroniques : avec dysfonction
ventriculaire droite et sans dysfonction ventriculaire droite
associée à la dysfonction ventriculaire gauche.
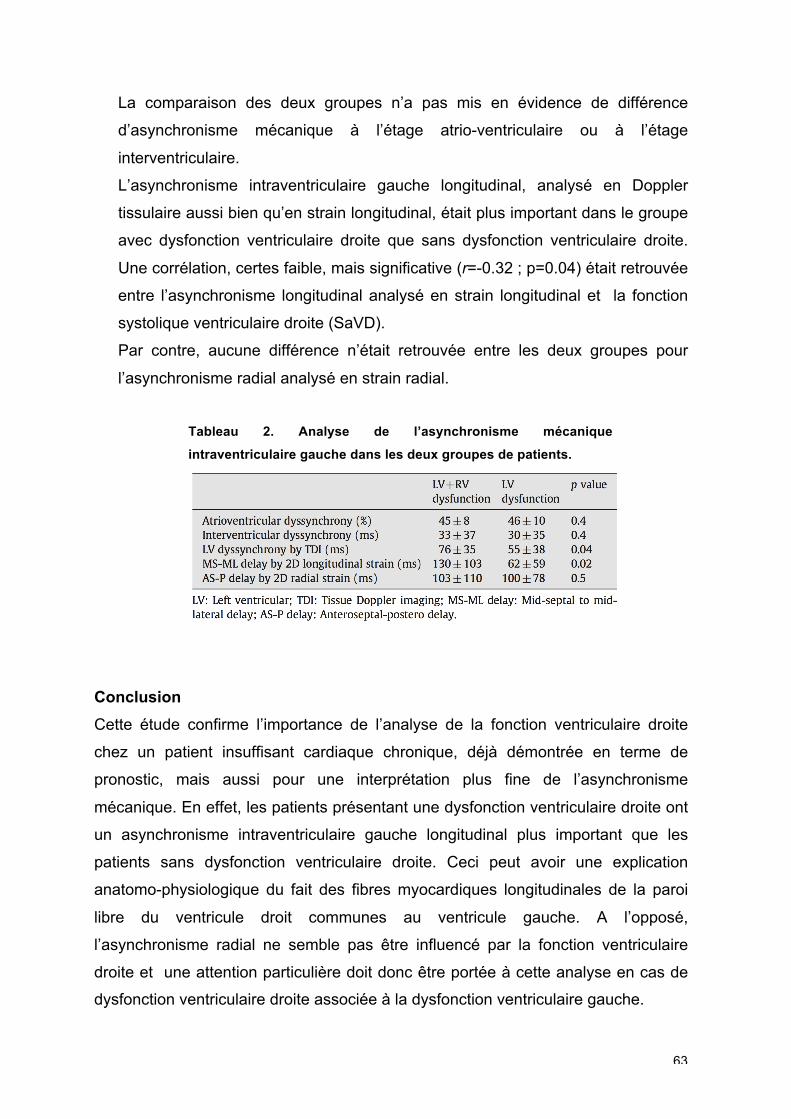
63
La comparaison des deux groupes n’a pas mis en évidence de différence
d’asynchronisme mécanique à l’étage atrio-ventriculaire ou à l’étage
interventriculaire.
L’asynchronisme intraventriculaire gauche longitudinal, analysé en Doppler
tissulaire aussi bien qu’en strain longitudinal, était plus important dans le groupe
avec dysfonction ventriculaire droite que sans dysfonction ventriculaire droite.
Une corrélation, certes faible, mais significative (r=-0.32 ; p=0.04) était retrouvée
entre l’asynchronisme longitudinal analysé en strain longitudinal et la fonction
systolique ventriculaire droite (SaVD).
Par contre, aucune différence n’était retrouvée entre les deux groupes pour
l’asynchronisme radial analysé en strain radial.
Tableau 2. Analyse de l’asynchronisme mécanique
intraventriculaire gauche dans les deux groupes de patients.
Conclusion
Cette étude confirme l’importance de l’analyse de la fonction ventriculaire droite
chez un patient insuffisant cardiaque chronique, déjà démontrée en terme de
pronostic, mais aussi pour une interprétation plus fine de l’asynchronisme
mécanique. En effet, les patients présentant une dysfonction ventriculaire droite ont
un asynchronisme intraventriculaire gauche longitudinal plus important que les
patients sans dysfonction ventriculaire droite. Ceci peut avoir une explication
anatomo-physiologique du fait des fibres myocardiques longitudinales de la paroi
libre du ventricule droit communes au ventricule gauche. A l’opposé,
l’asynchronisme radial ne semble pas être influencé par la fonction ventriculaire
droite et une attention particulière doit donc être portée à cette analyse en cas de
dysfonction ventriculaire droite associée à la dysfonction ventriculaire gauche.
64
4.2. Le concept d’évaluation à l’effort dans l’étude de la
réserve contractile
Int J Cardiol 2014;171:279-81.
Introduction
Dans le domaine de la prédiction de la réponse à la resynchronisation cardiaque
(ou de la non-réponse), de nombreuses études ont montré l’intérêt de l’étude des
asynchronismes à l’état de repos. Rares sont celles qui ont proposé une approche
multiparamétrique en combinant l’évaluation de repos et à l’effort.
Objectif
L’objectif de cette étude était d’évaluer l’intérêt de l’échocardiographie de repos et
d’effort à un niveau sous maximal en se focalisant sur les asynchronismes et la
réserve contractile.
Méthodes
30 patients étaient explorés par échocardiographie de repos et d’effort et suivis à 6
mois après resynchronisation cardiaque selon les critères conventionnels
d’implantation.
L’analyse des asynchronismes était effectuée selon une approche
multiparamétrique en mesurant :
‐ le remplissage mitral/RR,
‐ l’asynchronisme interventriculaire,
‐ l’asynchronisme intraventriculaire gauche avec : l’évaluation qualitative d’un
“septal flash”, la mesure du délai septo-latéral mesuré en 2D strain
longitudinal, la mesure du délai entre les parois antéro-septale et inféro-
latérale en 2D strain radial.
L’échocardiographie d’effort était réalisée en appliquant une montée incrémentielle
de la charge de 30 W toutes les deux minutes jusqu’à une fréquence cardiaque de
100-120/min au maximum (cadences d’image permettant l’analyse des
65
déformations). La mesure des volumes ventriculaires, télédiastoliques et
télésystoliques, et le calcul du 2D strain longitudinal régional et global étaient
effectués à l’effort. Les paramètres d’asynchronisme étaient alors une seconde fois
enregistrés.
Deux groupes de patients étaient alors définis selon la réduction des volumes
télésystoliques à 6 mois, groupe A : réduction de volume inférieure à 15%, groupe
B : réduction de volume supérieure à 15%.
Les paramètres mesurés au repos et à l’effort étaient comparés entre les deux
groupes.
Résultats
La population investiguée présentait 26% de cardiomyopathie ischémique. A 6 mois,
63% des patients présentaient un remodelage inverse du ventricule gauche et
constituent le groupe des répondeurs, le groupe B.
Concernant l’analyse de l’asynchronisme, le “septal flash” était visualisé chez 17/19
des patients du groupe B au repos contre 5/11 dans le groupe A. A l’effort, tous les
patients du groupe B présentaient le “septal flash” contre 7/11 du groupe A. Une
différence significative était mise en évidence au repos pour le délai septo-latéral en
2D strain, mais non retrouvée à l’effort. Il y avait une différence significative entre
les deux groupes pour l’asynchronisme atrio-ventriculaire, au repos, comme à
l’effort.
Concernant l’analyse de la réserve contractile, l’analyse du strain de la paroi
latérale (segment moyen) ne révélait pas de différence significative au repos entre
les deux groupes ; alors qu’à l’effort, il y avait une différence significative entre les
deux groupes avec un strain à l’effort plus important pour les patients
répondeurs (groupe A : 10.7±4.8% vs. groupe B : 14.7±5.3% ; p=0.02).
Une corrélation était obtenue entre le pourcentage de variation des volumes
ventriculaires gauches et le pic de déformation sur la paroi libre du ventricule
gauche au pic de l’effort (r=-0.48 ; p<0.01).
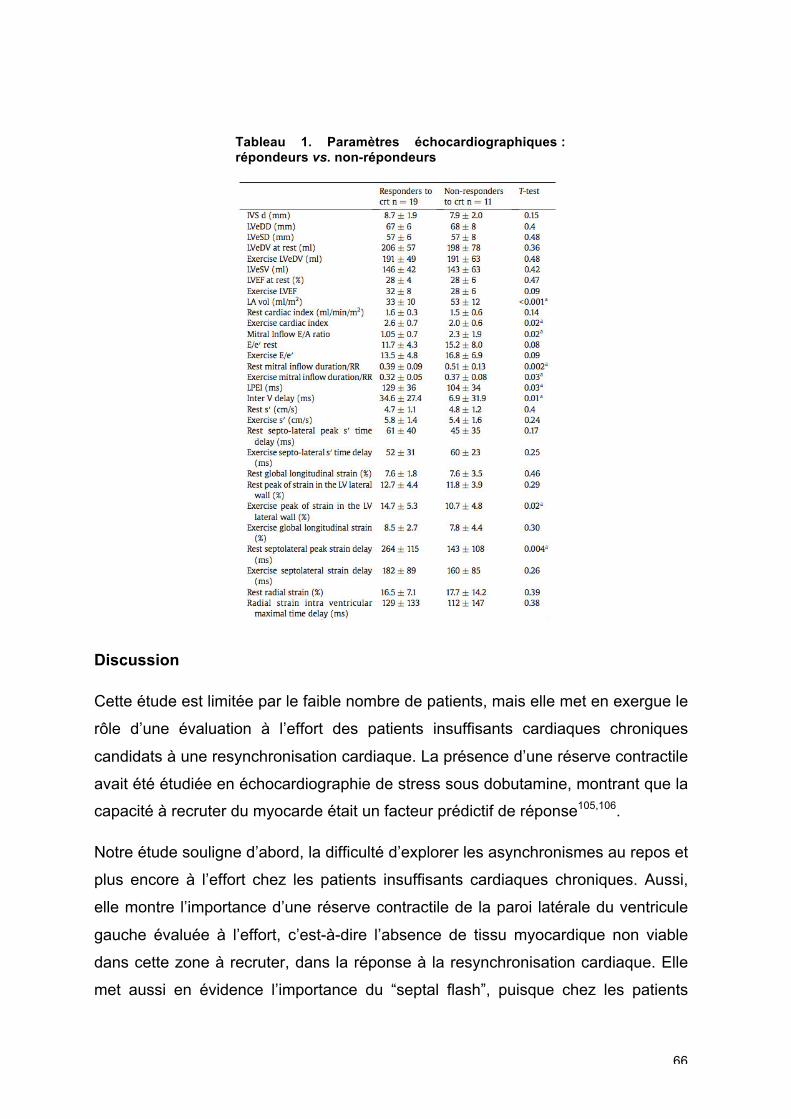
66
Tableau 1. Paramètres échocardiographiques : répondeurs vs. non-répondeurs
Discussion
Cette étude est limitée par le faible nombre de patients, mais elle met en exergue le
rôle d’une évaluation à l’effort des patients insuffisants cardiaques chroniques
candidats à une resynchronisation cardiaque. La présence d’une réserve contractile
avait été étudiée en échocardiographie de stress sous dobutamine, montrant que la
capacité à recruter du myocarde était un facteur prédictif de réponse105,106.
Notre étude souligne d’abord, la difficulté d’explorer les asynchronismes au repos et
plus encore à l’effort chez les patients insuffisants cardiaques chroniques. Aussi,
elle montre l’importance d’une réserve contractile de la paroi latérale du ventricule
gauche évaluée à l’effort, c’est-à-dire l’absence de tissu myocardique non viable
dans cette zone à recruter, dans la réponse à la resynchronisation cardiaque. Elle
met aussi en évidence l’importance du “septal flash”, puisque chez les patients
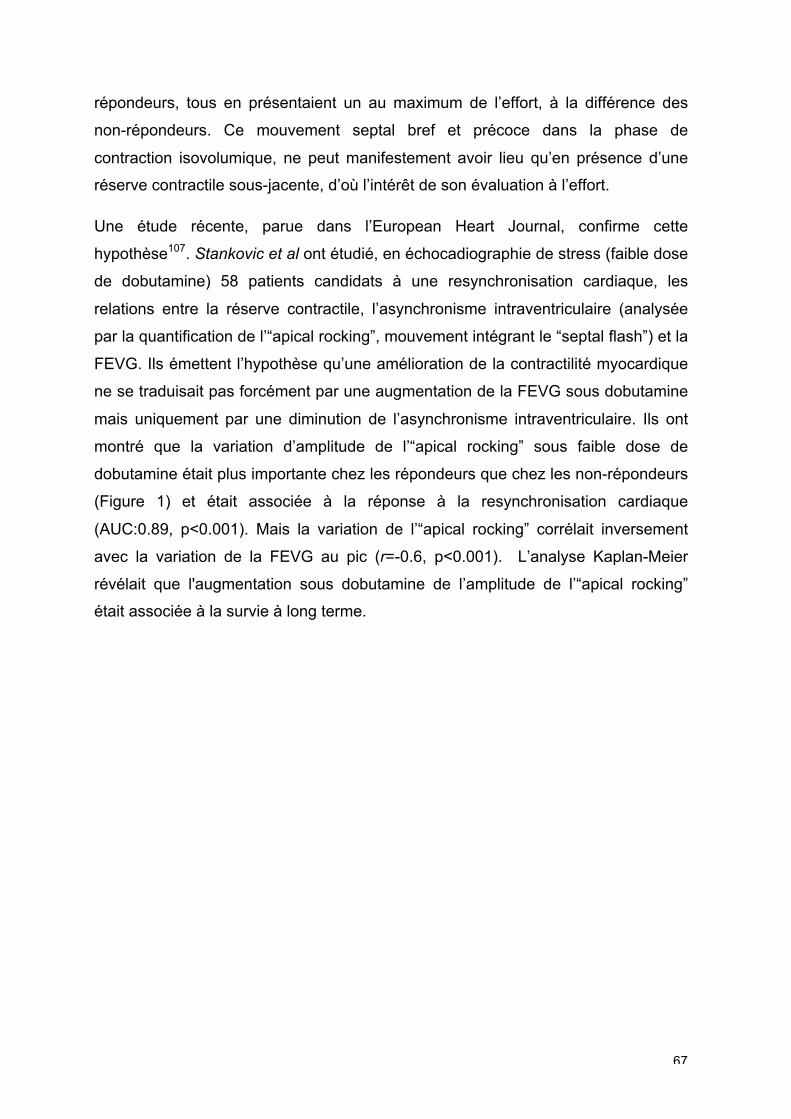
67
répondeurs, tous en présentaient un au maximum de l’effort, à la différence des
non-répondeurs. Ce mouvement septal bref et précoce dans la phase de
contraction isovolumique, ne peut manifestement avoir lieu qu’en présence d’une
réserve contractile sous-jacente, d’où l’intérêt de son évaluation à l’effort.
Une étude récente, parue dans l’European Heart Journal, confirme cette
hypothèse107. Stankovic et al ont étudié, en échocadiographie de stress (faible dose
de dobutamine) 58 patients candidats à une resynchronisation cardiaque, les
relations entre la réserve contractile, l’asynchronisme intraventriculaire (analysée
par la quantification de l’“apical rocking”, mouvement intégrant le “septal flash”) et la
FEVG. Ils émettent l’hypothèse qu’une amélioration de la contractilité myocardique
ne se traduisait pas forcément par une augmentation de la FEVG sous dobutamine
mais uniquement par une diminution de l’asynchronisme intraventriculaire. Ils ont
montré que la variation d’amplitude de l’“apical rocking” sous faible dose de
dobutamine était plus importante chez les répondeurs que chez les non-répondeurs
(Figure 1) et était associée à la réponse à la resynchronisation cardiaque
(AUC:0.89, p<0.001). Mais la variation de l’“apical rocking” corrélait inversement
avec la variation de la FEVG au pic (r=-0.6, p<0.001). L’analyse Kaplan-Meier
révélait que l'augmentation sous dobutamine de l’amplitude de l’“apical rocking”
était associée à la survie à long terme.
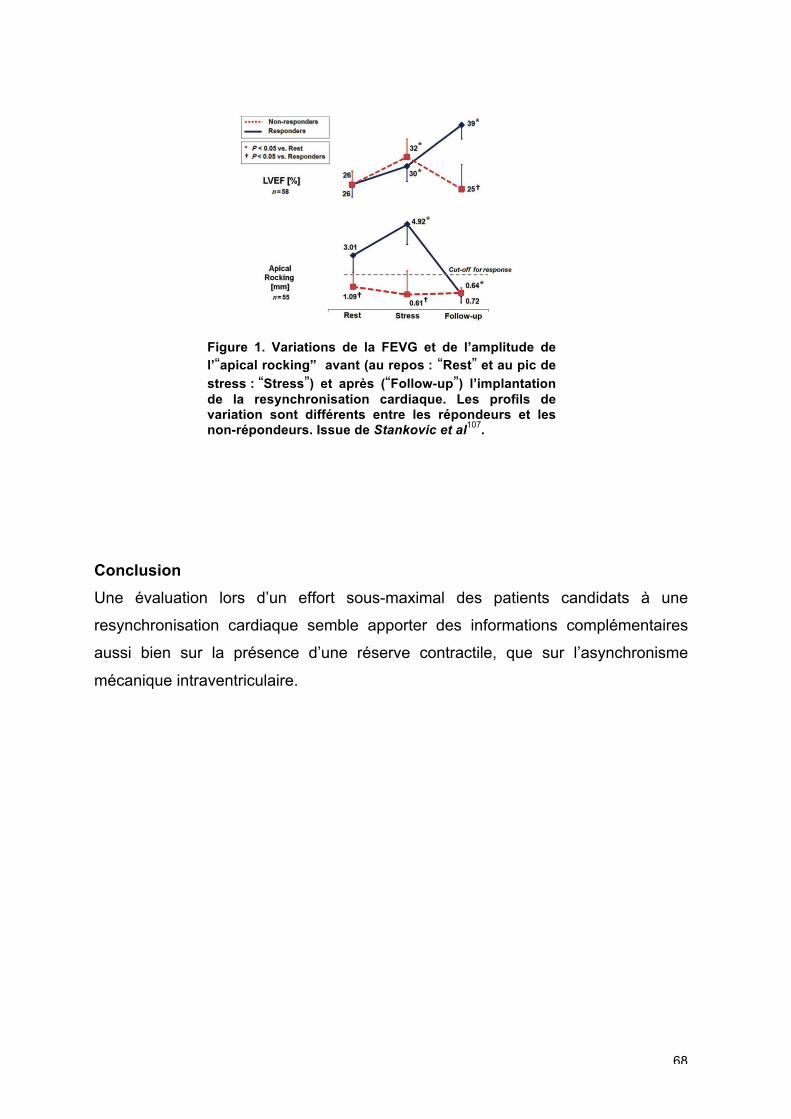
68
Figure 1. Variations de la FEVG et de l’amplitude de l’“apical rocking” avant (au repos : “Rest” et au pic de
stress : “Stress”) et après (“Follow-up”) l’implantation de la resynchronisation cardiaque. Les profils de variation sont différents entre les répondeurs et les non-répondeurs. Issue de Stankovic et al
107.
Conclusion
Une évaluation lors d’un effort sous-maximal des patients candidats à une
resynchronisation cardiaque semble apporter des informations complémentaires
aussi bien sur la présence d’une réserve contractile, que sur l’asynchronisme
mécanique intraventriculaire.
69
4.3. Activation septale et approche multiparamétrique
Am J Cardiol 2014 ;113:2045-51
Introduction
Devant les résultats négatifs des études multicentriques internationales4,33,35 portant
sur l’évaluation des asynchronismes mécaniques en échocardiographie et ne
permettant pas de proposer un paramètre quantitatif suffisamment reproductible et
fiable, de nouvelles approches pour prédire la réponse à la resynchronisation
cardiaque ont été proposées.
La combinaison de certains paramètres cliniques (sexe, étiologie de la
cardiomyopathie), ayant montré leur association à une meilleure réponse, à des
paramètres électriques, mais aussi morphologiques ventriculaires et des
paramètres d’asynchronisme, a été proposée dans le calcul de scores108,
confirmant l’idée qu’un seul paramètre ne pouvait répondre à cette question. Dès
lors, il apparaît nécessaire de multiplier les approches lors de l’évaluation d’un
patient candidat à un dispositif de resynchronisation cardiaque : approche clinique,
électrocardiographique, et échographique.
Une approche échographique multiparamétrique53 combinant plus de 3 paramètres
quantitatifs échographiques a démontré son intérêt en augmentant de façon
importante la fiabilité de la prédiction de la réponse. Cette approche est favorisée
actuellement par les sociétés savantes3 qui, de même, requièrent une certaine
expertise pour la réalisation de ces mesures.
Une autre approche échographique de l’asynchronisme mécanique est de proposer
des critères échographiques qualitatifs de réponse, permettant ainsi de s’affranchir
des problèmes de reproductibilité des mesures. C’est ainsi que la mise en évidence
d’une anomalie mécanique ventriculaire gauche tel que le “septal flash”, visuelle en
échocardiographie, a trouvé son intérêt.
70
Objectif
L’objectif de cette étude était de proposer un score de prédiction de la réponse à la
resynchronisation, combinant des informations cliniques, et électriques et d’y
adjoindre un paramètre d’asynchronisme mécanique qualitatif par l’étude du “septal
flash”.
Méthodes
Une base de données de 162 patients a été étudiée pour déterminer le score. Une
analyse clinique, électrocardiographique fine de la morphologie du QRS (bloc de
branche gauche ou non) a été réalisée ainsi qu’une analyse échocardiographique
de la morphologie ventriculaire. La mise en évidence d’un “septal flash” a été faite
visuellement à partir des boucles 2D parasternale petit axe ou apicale 4 cavités ou
en mode TM appliqué sur ces mêmes vues, par 2 opérateurs avec nécessité d’un
accord pour validation. Le score calculé selon les paramètres mis en évidence en
analyse multivariée, a ensuite été validé dans une cohorte de validation de 45
patients d’un autre centre universitaire français (Lille).
Le critère de réponse à la resynchronisation était basé sur le remodelage
ventriculaire à 6 mois avec diminution du volume télésystolique ventriculaire gauche
de plus de 15% en échocardiographie.
Résultats
Les caractéristiques cliniques, électrocardiographiques et échocardiographiques de
la cohorte de détermination et de la cohorte de validation sont présentées dans les
Tableaux 1 et 2 de l’article. Les deux cohortes ne présentaient pas de différence
significative en dehors d’une plus grande prévalence d’hommes, et de la présence
de patients plus graves (plus de patients en classe NYHA III) dans la cohorte de
détermination. Le taux de répondeurs était de 60% dans la cohorte de
détermination et de 71% dans la cohorte de validation.
Plusieurs échelles de score ont été testées, combinant avec des systèmes de
pondération différents les critères suivants mis en évidence en analyse multivariée
(Tableau 3 de l’article): bloc de branche gauche à l’électrocardiogramme (L), âge
>70 ans (A), étiologie non ischémique de la cardiomyopathie (N), diamètre
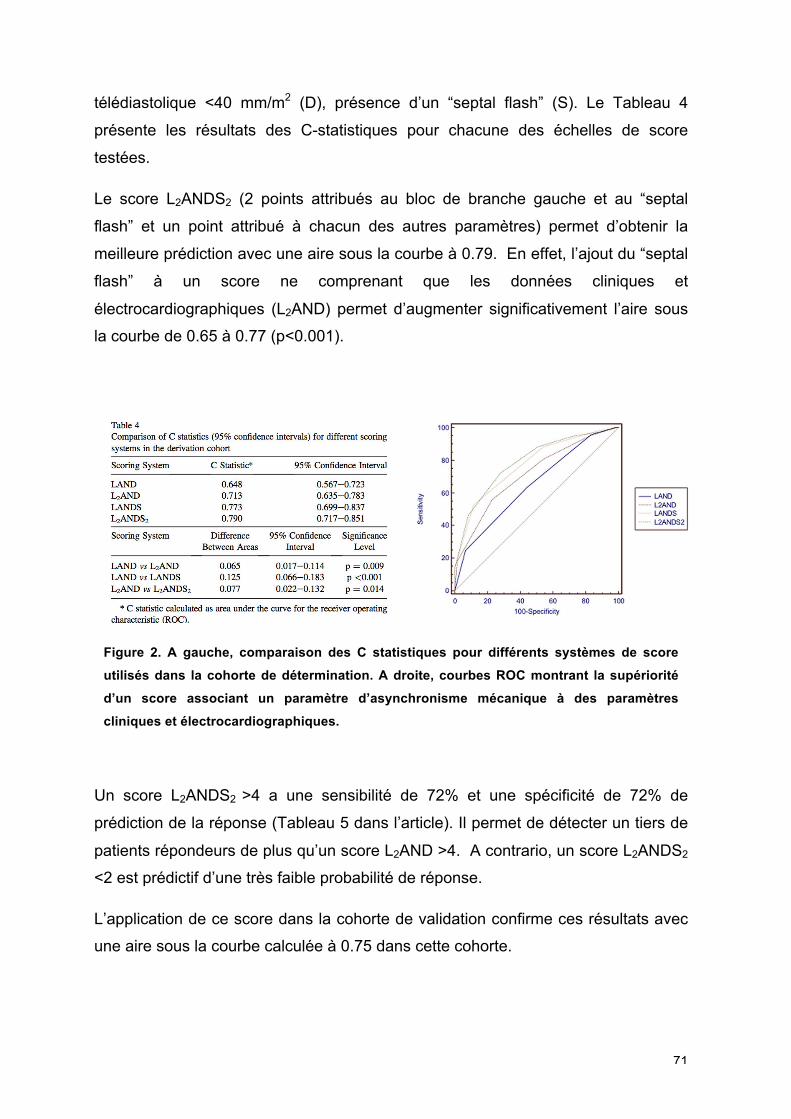
71
télédiastolique <40 mm/m2 (D), présence d’un “septal flash” (S). Le Tableau 4
présente les résultats des C-statistiques pour chacune des échelles de score
testées.
Le score L2ANDS2 (2 points attribués au bloc de branche gauche et au “septal
flash” et un point attribué à chacun des autres paramètres) permet d’obtenir la
meilleure prédiction avec une aire sous la courbe à 0.79. En effet, l’ajout du “septal
flash” à un score ne comprenant que les données cliniques et
électrocardiographiques (L2AND) permet d’augmenter significativement l’aire sous
la courbe de 0.65 à 0.77 (p<0.001).
Figure 2. A gauche, comparaison des C statistiques pour différents systèmes de score
utilisés dans la cohorte de détermination. A droite, courbes ROC montrant la supériorité
d’un score associant un paramètre d’asynchronisme mécanique à des paramètres
cliniques et électrocardiographiques.
Un score L2ANDS2 >4 a une sensibilité de 72% et une spécificité de 72% de
prédiction de la réponse (Tableau 5 dans l’article). Il permet de détecter un tiers de
patients répondeurs de plus qu’un score L2AND >4. A contrario, un score L2ANDS2
<2 est prédictif d’une très faible probabilité de réponse.
L’application de ce score dans la cohorte de validation confirme ces résultats avec
une aire sous la courbe calculée à 0.75 dans cette cohorte.
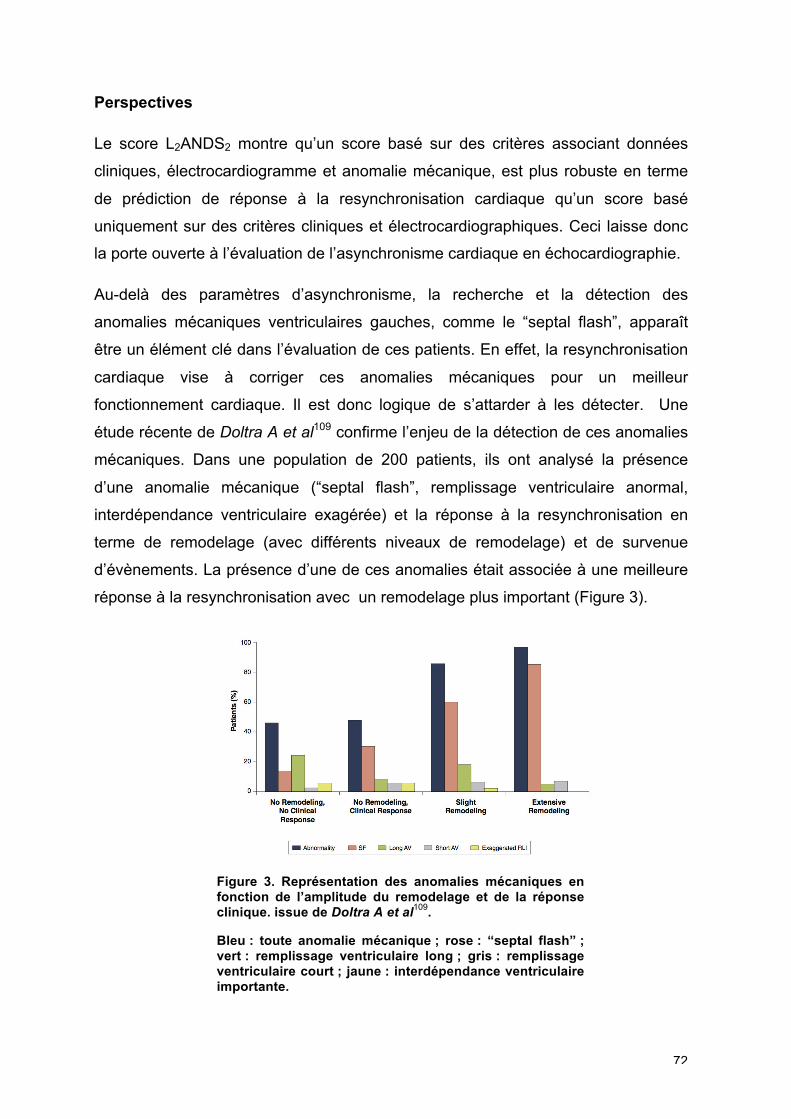
72
Perspectives
Le score L2ANDS2 montre qu’un score basé sur des critères associant données
cliniques, électrocardiogramme et anomalie mécanique, est plus robuste en terme
de prédiction de réponse à la resynchronisation cardiaque qu’un score basé
uniquement sur des critères cliniques et électrocardiographiques. Ceci laisse donc
la porte ouverte à l’évaluation de l’asynchronisme cardiaque en échocardiographie.
Au-delà des paramètres d’asynchronisme, la recherche et la détection des
anomalies mécaniques ventriculaires gauches, comme le “septal flash”, apparaît
être un élément clé dans l’évaluation de ces patients. En effet, la resynchronisation
cardiaque vise à corriger ces anomalies mécaniques pour un meilleur
fonctionnement cardiaque. Il est donc logique de s’attarder à les détecter. Une
étude récente de Doltra A et al109 confirme l’enjeu de la détection de ces anomalies
mécaniques. Dans une population de 200 patients, ils ont analysé la présence
d’une anomalie mécanique (“septal flash”, remplissage ventriculaire anormal,
interdépendance ventriculaire exagérée) et la réponse à la resynchronisation en
terme de remodelage (avec différents niveaux de remodelage) et de survenue
d’évènements. La présence d’une de ces anomalies était associée à une meilleure
réponse à la resynchronisation avec un remodelage plus important (Figure 3).
Figure 3. Représentation des anomalies mécaniques en fonction de l’amplitude du remodelage et de la réponse clinique. issue de Doltra A et al
109.
Bleu : toute anomalie mécanique ; rose : “septal flash” ; vert : remplissage ventriculaire long ; gris : remplissage ventriculaire court ; jaune : interdépendance ventriculaire importante.

73
Le score L2ANDS2 a été validé sur un critère de réponse échographique qu’est le
remodelage ventriculaire. L’objectif serait maintenant de le valider sur un critère
clinique : prédiction des évènements cliniques à 2 ans (mortalité et hospitalisation
pour insuffisance cardiaque).
D’autre part, la voie de l’approche multiparamétrique semblant être très
prometteuse, l’association d’autres critères d’asynchronisme mécanique, cette fois-
ci quantitatifs, évalués par les nouvelles techniques d’imagerie pourrait être une
perspective intéressante à la poursuite de ce premier travail sur les scores de
réponse à la resynchronisation cardiaque.
74
4.4. Nouveaux paramètres issus des courbes de
déformation : l’analyse des courbes de déformation
longitudinale par les intégrales
L’approche évaluative des asynchronismes mécaniques intraventriculaires gauches
s’est principalement appuyée sur l’analyse des chronologies de contraction
(décalages temporels). Qu’il s’agisse du retard latéro-septal en mode TM, de
l’analyse des délais électro-mécaniques (time-to-onset) ou des délais électro-
systoliques (time-to-peak) en Doppler tissulaire, comme des retards de déformation
objectivés par la technique du speckle tracking, tous ces paramètres sont associés
à un caractère prédictif limité avec des sensibilités de 60 à 80%. D’autre part, ils
sont marqués par un manque de robustesse avec une reproductibilité variable du
fait de mesures réalisées manuellement.
Par ailleurs, l’analyse temporelle ne préjuge pas de la capacité contractile du
myocarde sous-jacent qui peut être non fonctionnelle en cas notamment de
cicatrice d’infarctus. Il est en effet démontré que le réhaussement tardif
caractéristique de la fibrose myocardique est un élément à intégrer dans la
prédiction de la réponse à la resynchronisation88,110.
Au-delà d’une approche multiparamétrique associant des critères temporels à des
critères de fonction contractile, certains auteurs ont proposé l’intégration des deux
concepts au sein d’un même paramètre66,111.
Le strain delay index (SDI), proposé par Lim et al, correspond à la somme des
différences entre l’amplitude de la déformation longitudinale au moment de la
fermeture aortique et l’amplitude de la déformation longitudinale au minimum de la
courbe des 12 segments66. Un segment myocardique retardé mais contractile
affiche une différence de grande amplitude alors qu’un segment retardé et non
contractile (fibrose) présente une amplitude plus faible. La somme de ces
différences sur l’ensemble du myocarde est potentiellement le reflet de la quantité
de myocarde « recrutable » par la stimulation ventriculaire gauche (Figure 1).
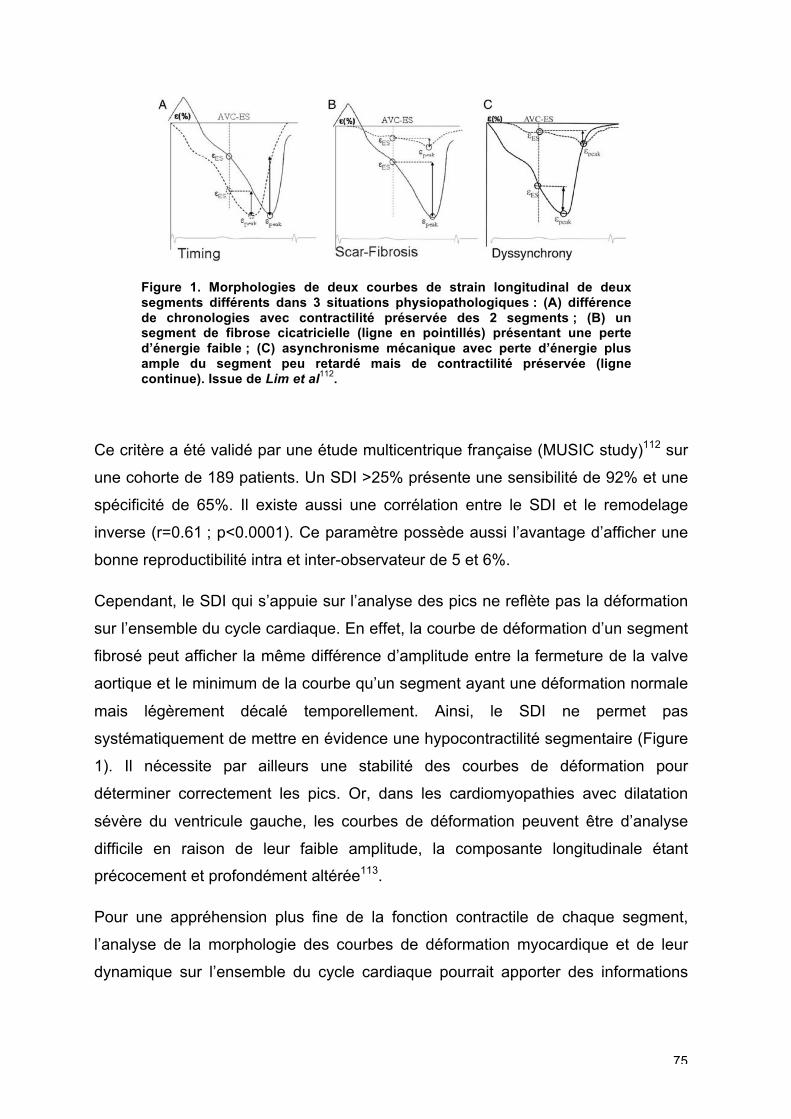
75
Figure 1. Morphologies de deux courbes de strain longitudinal de deux segments différents dans 3 situations physiopathologiques : (A) différence de chronologies avec contractilité préservée des 2 segments ; (B) un segment de fibrose cicatricielle (ligne en pointillés) présentant une perte d’énergie faible ; (C) asynchronisme mécanique avec perte d’énergie plus ample du segment peu retardé mais de contractilité préservée (ligne continue). Issue de Lim et al
112.
Ce critère a été validé par une étude multicentrique française (MUSIC study)112 sur
une cohorte de 189 patients. Un SDI >25% présente une sensibilité de 92% et une
spécificité de 65%. Il existe aussi une corrélation entre le SDI et le remodelage
inverse (r=0.61 ; p<0.0001). Ce paramètre possède aussi l’avantage d’afficher une
bonne reproductibilité intra et inter-observateur de 5 et 6%.
Cependant, le SDI qui s’appuie sur l’analyse des pics ne reflète pas la déformation
sur l’ensemble du cycle cardiaque. En effet, la courbe de déformation d’un segment
fibrosé peut afficher la même différence d’amplitude entre la fermeture de la valve
aortique et le minimum de la courbe qu’un segment ayant une déformation normale
mais légèrement décalé temporellement. Ainsi, le SDI ne permet pas
systématiquement de mettre en évidence une hypocontractilité segmentaire (Figure
1). Il nécessite par ailleurs une stabilité des courbes de déformation pour
déterminer correctement les pics. Or, dans les cardiomyopathies avec dilatation
sévère du ventricule gauche, les courbes de déformation peuvent être d’analyse
difficile en raison de leur faible amplitude, la composante longitudinale étant
précocement et profondément altérée113.
Pour une appréhension plus fine de la fonction contractile de chaque segment,
l’analyse de la morphologie des courbes de déformation myocardique et de leur
dynamique sur l’ensemble du cycle cardiaque pourrait apporter des informations
76
complémentaires à l’analyse de la mécanique ventriculaire gauche en comparaison
à l’analyse des pics de déformation seuls.
Nous avons émis l’hypothèse que la quantification des aires sous la courbe est une
façon d’aborder le problème de la variation de la contractilité myocardique tout au
long du cycle cardiaque.
Pour cela, nous avons développé un algorithme avec le logiciel Matlab de calcul
des intégrales des courbes de déformation longitudinale.
Les déformations myocardiques longitudinales ont été analysées en post-traitement
en vue apicale 4 cavités. Les marqueurs temporaux de début du QRS et fermeture
de valve aortique étaient positionnés. Les fichiers Excel des courbes de strain
longitudinal étaient exportés pour une analyse dédiée avec le logiciel Matlab. Nous
avons créé un algorithme d’analyse des courbes de déformation permettant de
calculer automatiquement les amplitudes des pics de strain, leur délai par rapport
au début du QRS, et l’aire sous la courbe selon 2 critères temporels: premièrement,
du début du QRS au minimum de la courbe, aussi appelé pic de strain (IL,peak) et
deuxièmement du début du QRS à la fermeture de la valve aortique (IL,avc) (Figure
2). Les valeurs de strain longitudinal supérieure à -5% n’étaient pas prises en
compte, considérées comme ayant un rapport signal/bruit trop faible.
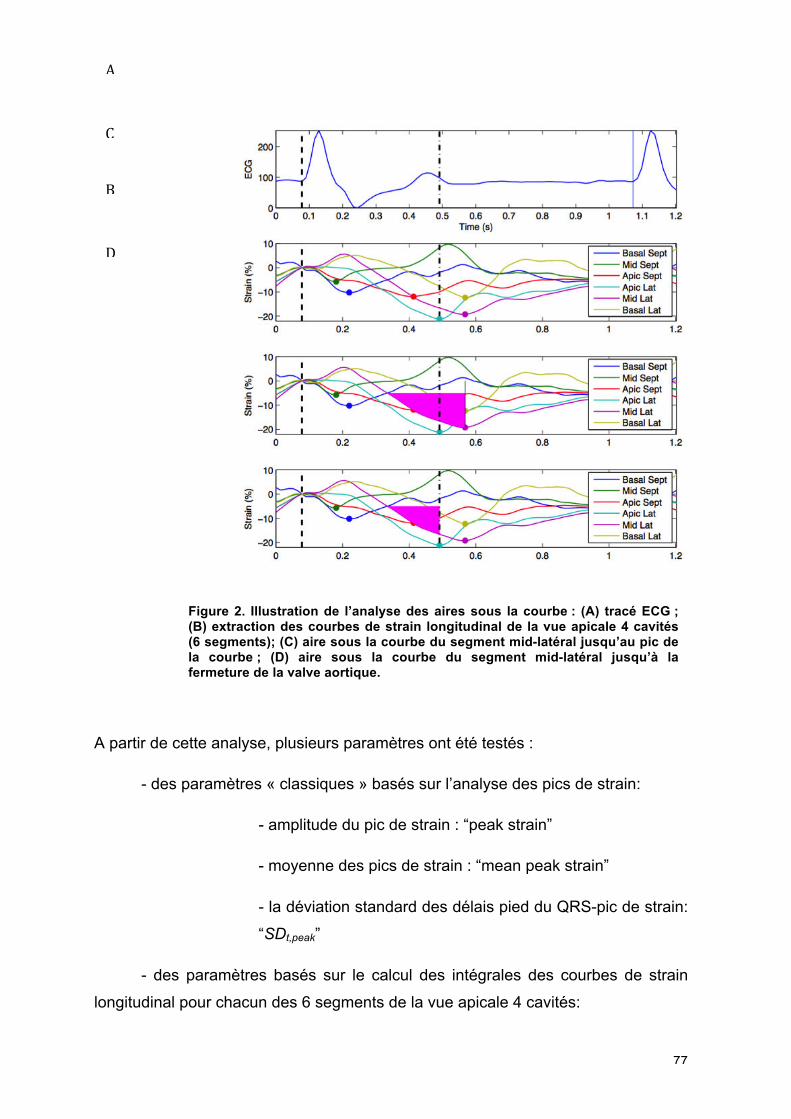
77
Figure 2. Illustration de l’analyse des aires sous la courbe : (A) tracé ECG ; (B) extraction des courbes de strain longitudinal de la vue apicale 4 cavités (6 segments); (C) aire sous la courbe du segment mid-latéral jusqu’au pic de la courbe ; (D) aire sous la courbe du segment mid-latéral jusqu’à la fermeture de la valve aortique.
A partir de cette analyse, plusieurs paramètres ont été testés :
- des paramètres « classiques » basés sur l’analyse des pics de strain:
- amplitude du pic de strain : “peak strain”
- moyenne des pics de strain : “mean peak strain”
- la déviation standard des délais pied du QRS-pic de strain:
“SDt,peak”
- des paramètres basés sur le calcul des intégrales des courbes de strain
longitudinal pour chacun des 6 segments de la vue apicale 4 cavités:
B
C
D
A
78
- intégrale segmentaire du début du QRS à la fermeture de
la valve cardiaque : “IL,avc”
- intégrale segmentaire du début du QRS au pic du strain:
“IL,peak”
- moyenne des intégrales des 6 segments “mean IL,avc” et
“mean IL,peak”
- la déviation standard des intégrales des 6 segments :
“SDIL,avc” et “SDIL,peak”
- la différence pour un segment entre : IL,avc et IL,peak : “DiffInt”
La différence entre ces deux valeurs, IL,avc and IL,peak, appelée “DiffInt”, correspond à
l’expression de la réserve contractile segmentaire ou encore de la perte d’énergie
générée par l’asynchronisme d’une paroi.
Nous proposons dans cette dernière partie de quantifier de façon automatique l’aire
sous les courbes (intégrales) des déformations myocardiques longitudinales dans le
même temps qu’une analyse automatique des pics de déformation chez une
population de patients insuffisants cardiaques gauches candidats à l’implantation
d’un dispositif de resynchronisation.
79
4.4.1. Analyse de la morphologie des courbes de déformation par l’analyse
des intégrales avant et après resynchronisation cardiaque
Article soumis en novembre 2014 dans Journal of the American Society of
Echocardiography : “Impact of cardiac resynchronization therapy on left
ventricular mechanics. Understanding the response through a new
quantitative approach based on longitudinal strain integral”
Objectif
L ‘objectif de cette étude était de montrer d’une part que les analyses de la
morphologie des courbes de déformation longitudinale par la méthode des
intégrales permettaient de détecter les variations de contractilité avant et après
resynchronisation cardiaque ; d’autre part que l’analyse de la perte d’énergie par les
intégrales révélait des variations entre les répondeurs et les non-répondeurs.
Méthodes
130 patients insuffisants cardiaques ayant bénéficié de l’implantation d’un dispositif
de resynchronisation cardiaque ont été étudiés rétrospectivement. Tous les patients
ont été investigués par échocardiographie avant et dans un délai de 3 à 6 mois
après implantation du dispositif. Les volumes ventriculaires ont été évalués par la
méthode Simpson biplan. Le critère de réponse à la resynchronisation était un
remodelage inverse avec une diminution du volume télésystolique ventriculaire
gauche d’au moins 15%.
Selon la méthode décrite précédemment, les courbes de strain longitudinal ont été
exportées en fichier Excel puis traitées par le logiciel Matlab. A partir de cette
analyse, tous les paramètres précédemment décrits ont été testés.
Chaque paramètre était moyenné pour chacun des groupes, répondeurs et non-
répondeurs, et comparé entre eux. Chaque paramètre était comparé avant et après
resynchronisation cardiaque dans chacun des groupes.
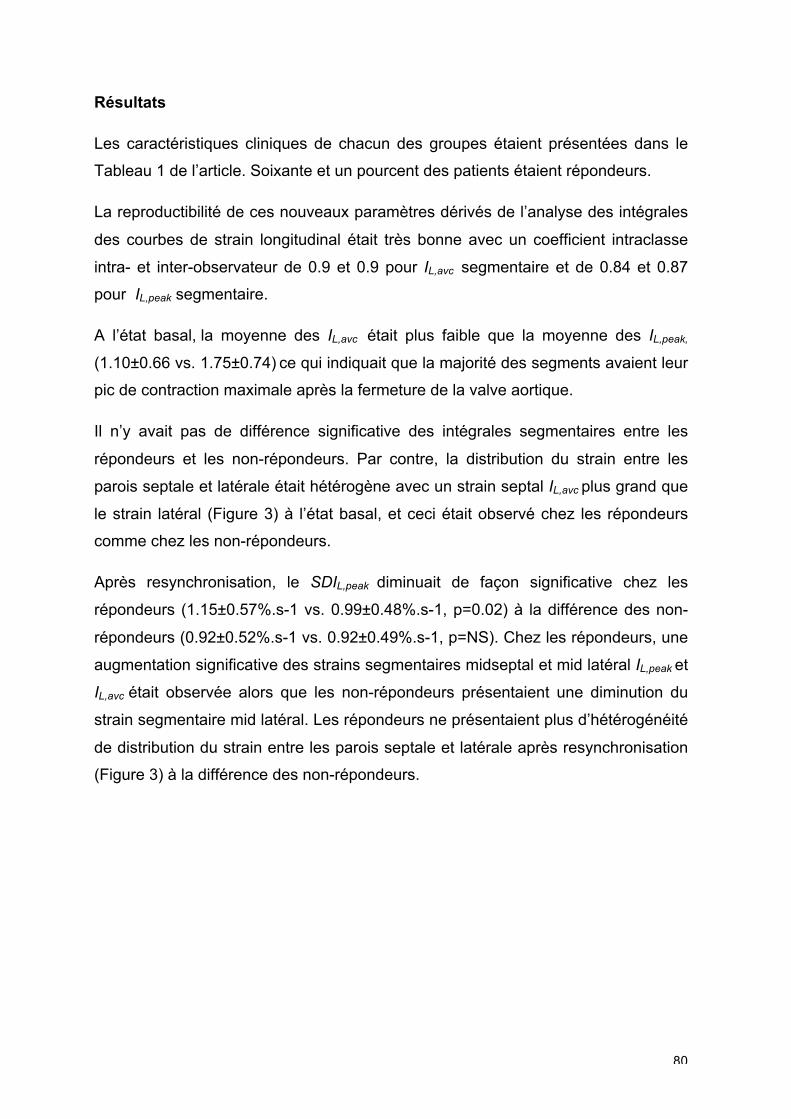
80
Résultats
Les caractéristiques cliniques de chacun des groupes étaient présentées dans le
Tableau 1 de l’article. Soixante et un pourcent des patients étaient répondeurs.
La reproductibilité de ces nouveaux paramètres dérivés de l’analyse des intégrales
des courbes de strain longitudinal était très bonne avec un coefficient intraclasse
intra- et inter-observateur de 0.9 et 0.9 pour IL,avc segmentaire et de 0.84 et 0.87
pour IL,peak segmentaire.
A l’état basal, la moyenne des IL,avc était plus faible que la moyenne des IL,peak,
(1.10±0.66 vs. 1.75±0.74) ce qui indiquait que la majorité des segments avaient leur
pic de contraction maximale après la fermeture de la valve aortique.
Il n’y avait pas de différence significative des intégrales segmentaires entre les
répondeurs et les non-répondeurs. Par contre, la distribution du strain entre les
parois septale et latérale était hétérogène avec un strain septal IL,avc plus grand que
le strain latéral (Figure 3) à l’état basal, et ceci était observé chez les répondeurs
comme chez les non-répondeurs.
Après resynchronisation, le SDIL,peak diminuait de façon significative chez les
répondeurs (1.15±0.57%.s-1 vs. 0.99±0.48%.s-1, p=0.02) à la différence des non-
répondeurs (0.92±0.52%.s-1 vs. 0.92±0.49%.s-1, p=NS). Chez les répondeurs, une
augmentation significative des strains segmentaires midseptal et mid latéral IL,peak et
IL,avc était observée alors que les non-répondeurs présentaient une diminution du
strain segmentaire mid latéral. Les répondeurs ne présentaient plus d’hétérogénéité
de distribution du strain entre les parois septale et latérale après resynchronisation
(Figure 3) à la différence des non-répondeurs.
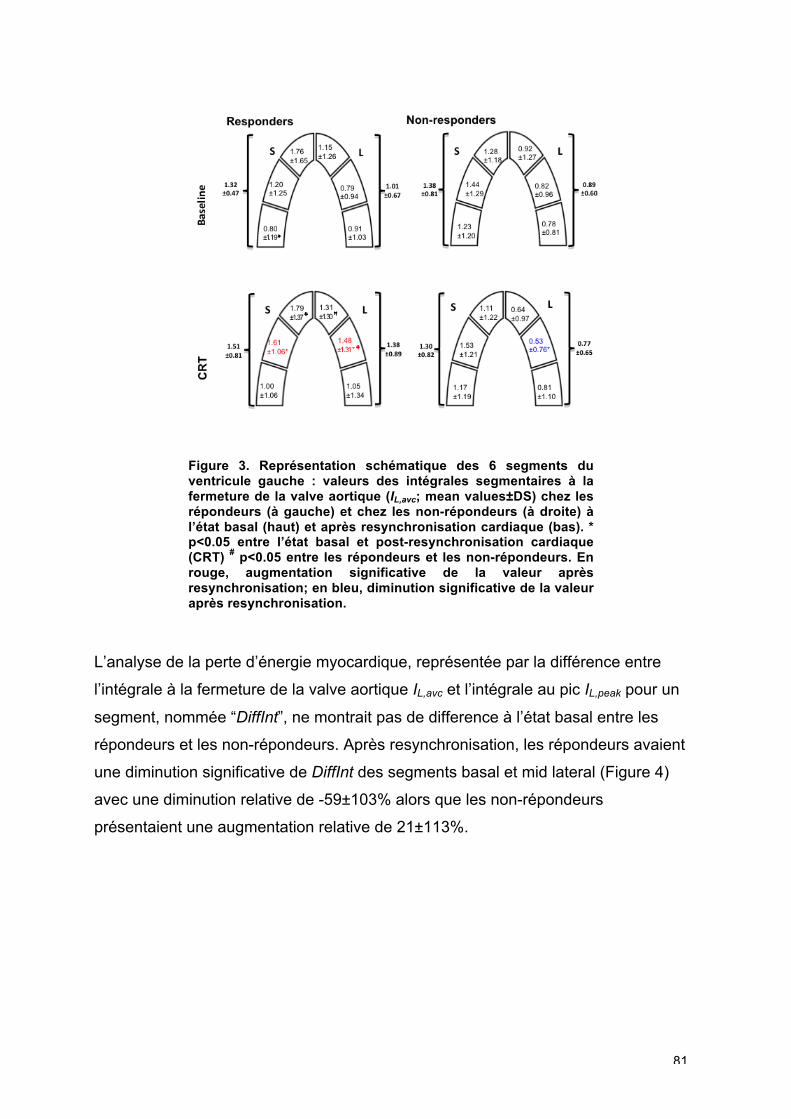
81
Figure 3. Représentation schématique des 6 segments du ventricule gauche : valeurs des intégrales segmentaires à la fermeture de la valve aortique (IL,avc; mean values±DS) chez les répondeurs (à gauche) et chez les non-répondeurs (à droite) à l’état basal (haut) et après resynchronisation cardiaque (bas). * p<0.05 entre l’état basal et post-resynchronisation cardiaque (CRT) # p<0.05 entre les répondeurs et les non-répondeurs. En rouge, augmentation significative de la valeur après resynchronisation; en bleu, diminution significative de la valeur après resynchronisation.
L’analyse de la perte d’énergie myocardique, représentée par la différence entre
l’intégrale à la fermeture de la valve aortique IL,avc et l’intégrale au pic IL,peak pour un
segment, nommée “DiffInt”, ne montrait pas de difference à l’état basal entre les
répondeurs et les non-répondeurs. Après resynchronisation, les répondeurs avaient
une diminution significative de DiffInt des segments basal et mid lateral (Figure 4)
avec une diminution relative de -59±103% alors que les non-répondeurs
présentaient une augmentation relative de 21±113%.
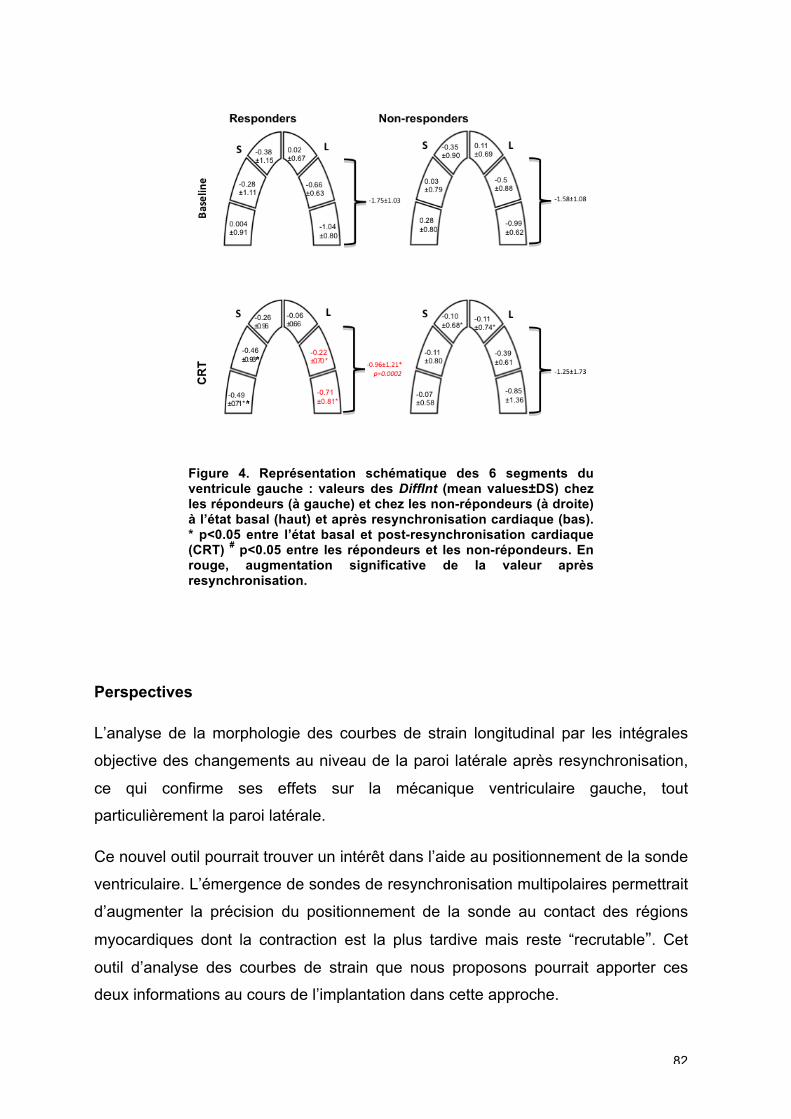
82
Figure 4. Représentation schématique des 6 segments du ventricule gauche : valeurs des DiffInt (mean values±DS) chez les répondeurs (à gauche) et chez les non-répondeurs (à droite) à l’état basal (haut) et après resynchronisation cardiaque (bas). * p<0.05 entre l’état basal et post-resynchronisation cardiaque (CRT) # p<0.05 entre les répondeurs et les non-répondeurs. En rouge, augmentation significative de la valeur après resynchronisation.
Perspectives
L’analyse de la morphologie des courbes de strain longitudinal par les intégrales
objective des changements au niveau de la paroi latérale après resynchronisation,
ce qui confirme ses effets sur la mécanique ventriculaire gauche, tout
particulièrement la paroi latérale.
Ce nouvel outil pourrait trouver un intérêt dans l’aide au positionnement de la sonde
ventriculaire. L’émergence de sondes de resynchronisation multipolaires permettrait
d’augmenter la précision du positionnement de la sonde au contact des régions
myocardiques dont la contraction est la plus tardive mais reste “recrutable”. Cet
outil d’analyse des courbes de strain que nous proposons pourrait apporter ces
deux informations au cours de l’implantation dans cette approche.

83
La quantification des aires sous la courbe de déformation longitudinale, mais aussi
des autres composantes de déformation, comme les composantes radiales et
circonférentielles, pourrait donner d’autres informations mais l’apport le plus
significatif se fera certainement par l’analyse des courbes de strain en 3D.
84
4.4.2. Association de paramètres classiques d’asynchronisme et de
paramètres dérivés de l’analyse des intégrales des courbes de déformation :
une approche multiparamétrique pour la prédiction de la réponse à la
resynchronisation cardiaque
Article soumis en novembre 2014 dans European Heart Journal Cardiovascular
Imaging : “New multiparametric strain integral-derived parameter for the
evaluation of dyssynchrony and prediction of cardiac resynchronization therapy
response”
Objectif
Nous avons émis l’hypothèse qu’une approche multiparamétrique entre
l’association d’un paramètre d’asynchronisme conventionnel (remplissage
ventriculaire, asynchronisme interventriculaire et intraventriculaire) et des
paramètres dérivés de l’analyse des courbes de strain, SDt,peak et SDIL,peak,
permettrait d’améliorer la prédiction de la réponse à la resynchronisation cardiaque
sur le plan du remodelage inverse du ventricule gauche et de la survenue
d’évènements cliniques.
Méthodes
133 patients insuffisants cardiaques candidats à l’implantation d’un dispositif de
resynchronisation cardiaque ont été étudiés rétrospectivement.
Afin de déterminer un cut-off de prédiction de réponse à la resynchronisation pour
les nouveaux paramètres issus de l’analyse des courbes de strain SDt,peak et SDIL,
peak, la population a été divisée en deux groupes : un groupe de détermination de 31
patients et un groupe de validation de 102 patients. L’analyse multiparamétrique de
l’asynchronisme mécanique a été réalisée au sein de ce groupe de validation.
Les patients ont été implantés d’une resynchronisation cardiaque selon les mêmes
critères que l’étude précédente.
85
L’analyse échocardiographique a été réalisée de la même façon que pour le travail
précédent avec extraction des fichiers de traitement de l’analyse des courbes de
strain longitudinal de la vue apicale 4 cavités.
L’analyse de l’asynchronisme mécanique a été réalisée de façon conventionnelle :
- recherche d’un remplissage ventriculaire gauche anormal : analyse du
remplissage mitral/RR<40%
- recherche d’un asynchronisme interventriculaire (différence entre le temps
de prééjection pulmonaire et aortique supérieure à 40 ms)
Deux paramètres issus de l’analyse des courbes de strain ont été analysés :
- la déviation standard des délais pied du QRS-pic de strain des 6 segments
de la vue apicale 4 cavités : “SDt,peak”
- la déviation standard des intégrales de strain longitudinal des 6 segments
de la vue apicale 4 cavités : “SDIL,peak”
Tous les patients ont été suivis à 6 mois par une échocardiographie transthoracique
afin de déterminer l’existence ou non d’un remodelage inverse (diminution du
volume télésystolique de plus de 15%), ce qui était le critère principal de réponse.
Un suivi clinique a été effectué à 2 ans avec recueil des évènements suivants :
hospitalisation pour insuffisance cardiaque, mortalité cardio-vasculaire et toute
cause.
Résultats
Dans la population globale, le SDt,peak est de 106±50 ms et le SDIL,peak de
1.06±0.55 %.s-1. Une différence significative est mise en évidence entre les
répondeurs et les non-répondeurs avec des valeurs plus amples pour les
répondeurs.
Dans le groupe de détermination, un cut-off de 105 ms pour le SDt,peak a une
sensibilité et une spécificité de 61% en faveur d’un remodelage inverse. Un cut-off
de 1.155 %.s-1 pour le SDIL,peak a une sensibilité de 61% et une spécificité de 84%.
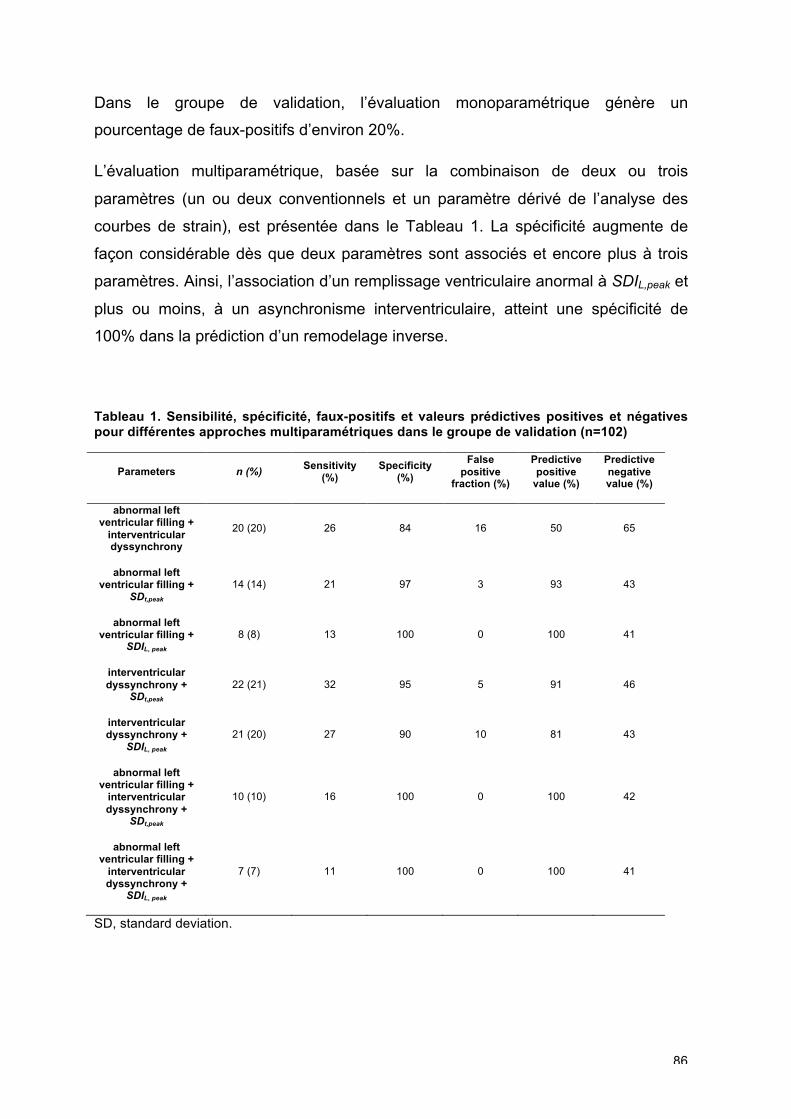
86
Dans le groupe de validation, l’évaluation monoparamétrique génère un
pourcentage de faux-positifs d’environ 20%.
L’évaluation multiparamétrique, basée sur la combinaison de deux ou trois
paramètres (un ou deux conventionnels et un paramètre dérivé de l’analyse des
courbes de strain), est présentée dans le Tableau 1. La spécificité augmente de
façon considérable dès que deux paramètres sont associés et encore plus à trois
paramètres. Ainsi, l’association d’un remplissage ventriculaire anormal à SDIL,peak et
plus ou moins, à un asynchronisme interventriculaire, atteint une spécificité de
100% dans la prédiction d’un remodelage inverse.
Tableau 1. Sensibilité, spécificité, faux-positifs et valeurs prédictives positives et négatives pour différentes approches multiparamétriques dans le groupe de validation (n=102)
Parameters n (%) Sensitivity
(%) Specificity
(%)
False positive
fraction (%)
Predictive positive
value (%)
Predictive negative value (%)
abnormal left ventricular filling +
interventricular dyssynchrony
20 (20) 26 84 16 50 65
abnormal left ventricular filling +
SDt,peak 14 (14) 21 97 3 93 43
abnormal left ventricular filling +
SDIL, peak 8 (8) 13 100 0 100 41
interventricular dyssynchrony +
SDt,peak 22 (21) 32 95 5 91 46
interventricular dyssynchrony +
SDIL, peak 21 (20) 27 90 10 81 43
abnormal left ventricular filling +
interventricular dyssynchrony +
SDt,peak
10 (10) 16 100 0 100 42
abnormal left ventricular filling +
interventricular dyssynchrony +
SDIL, peak
7 (7) 11 100 0 100 41
SD, standard deviation.
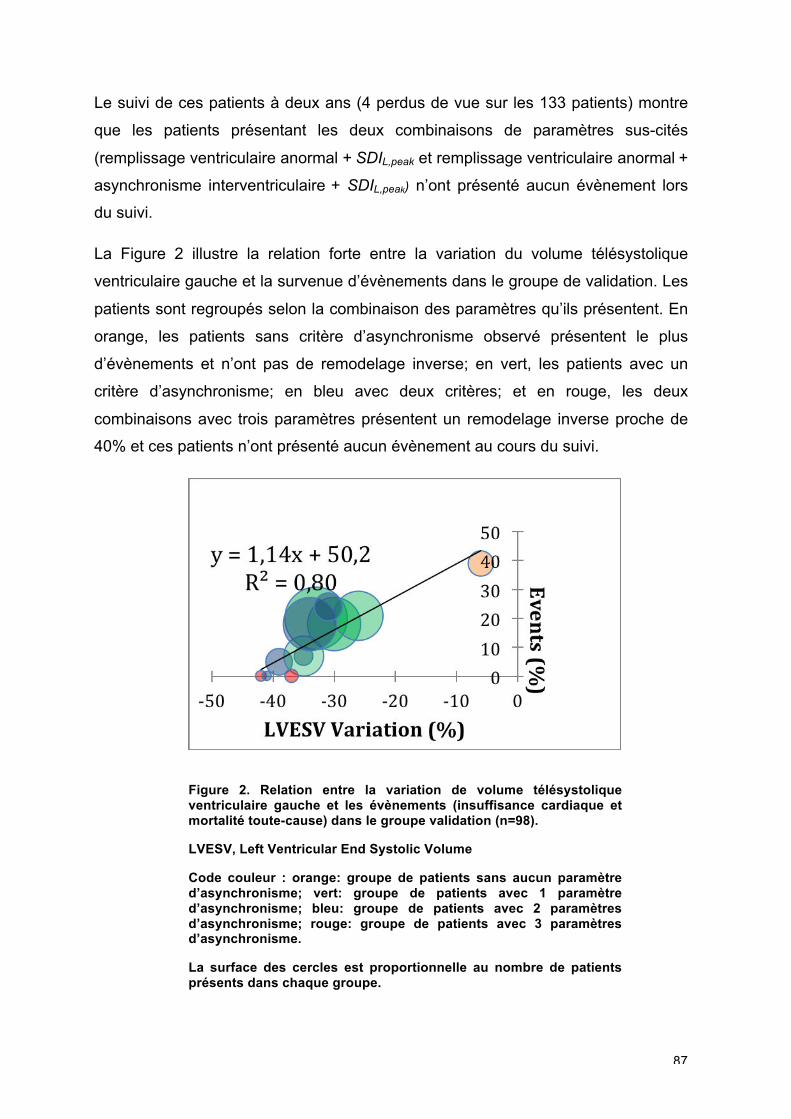
87
Le suivi de ces patients à deux ans (4 perdus de vue sur les 133 patients) montre
que les patients présentant les deux combinaisons de paramètres sus-cités
(remplissage ventriculaire anormal + SDIL,peak et remplissage ventriculaire anormal +
asynchronisme interventriculaire + SDIL,peak) n’ont présenté aucun évènement lors
du suivi.
La Figure 2 illustre la relation forte entre la variation du volume télésystolique
ventriculaire gauche et la survenue d’évènements dans le groupe de validation. Les
patients sont regroupés selon la combinaison des paramètres qu’ils présentent. En
orange, les patients sans critère d’asynchronisme observé présentent le plus
d’évènements et n’ont pas de remodelage inverse; en vert, les patients avec un
critère d’asynchronisme; en bleu avec deux critères; et en rouge, les deux
combinaisons avec trois paramètres présentent un remodelage inverse proche de
40% et ces patients n’ont présenté aucun évènement au cours du suivi.
Figure 2. Relation entre la variation de volume télésystolique ventriculaire gauche et les évènements (insuffisance cardiaque et mortalité toute-cause) dans le groupe validation (n=98).
LVESV, Left Ventricular End Systolic Volume
Code couleur : orange: groupe de patients sans aucun paramètre d’asynchronisme; vert: groupe de patients avec 1 paramètre d’asynchronisme; bleu: groupe de patients avec 2 paramètres d’asynchronisme; rouge: groupe de patients avec 3 paramètres d’asynchronisme.
La surface des cercles est proportionnelle au nombre de patients présents dans chaque groupe.

88
Conclusion
L’association d’un nouveau paramètre basé sur l’analyse automatique des courbes
de strain, tout particulièrement l’analyse des intégrales de courbes de strain, et d’un
paramètre conventionnel comme un remplissage ventriculaire anormal permet de
prédire avec une forte spécificité la réponse à la resynchronisation cardiaque.

89
PARTIE 5 : PERSPECTIVES
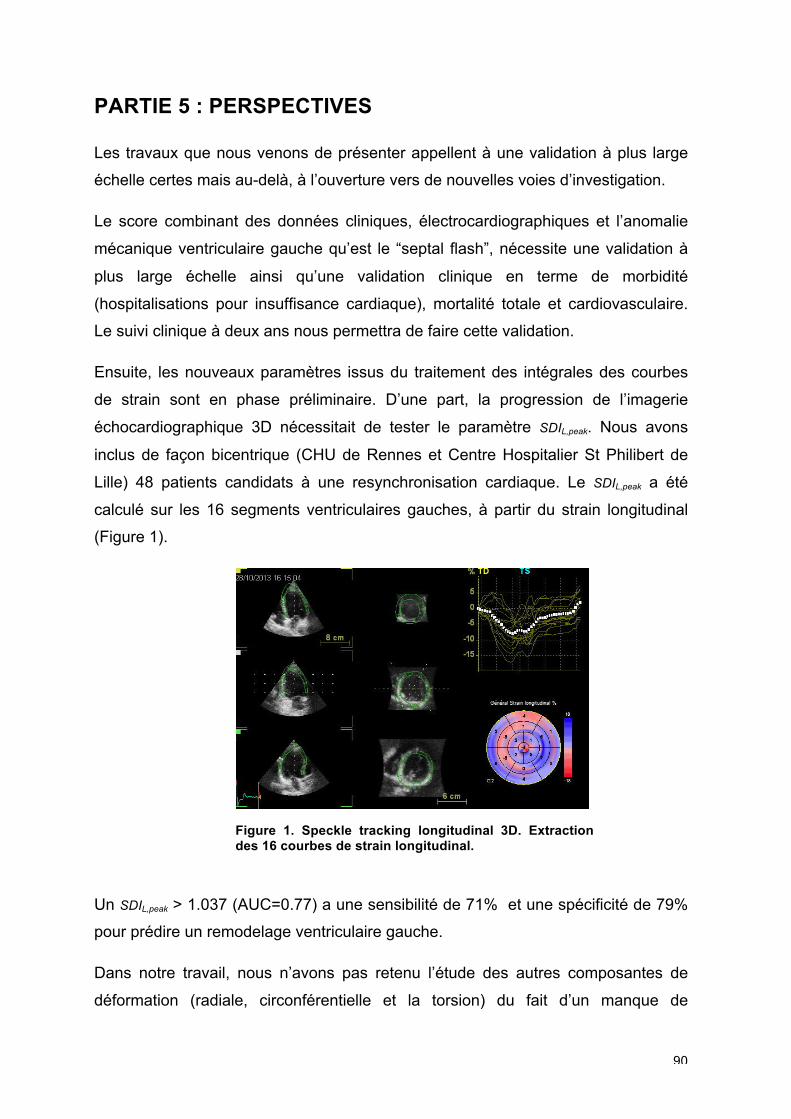
90
PARTIE 5 : PERSPECTIVES
Les travaux que nous venons de présenter appellent à une validation à plus large
échelle certes mais au-delà, à l’ouverture vers de nouvelles voies d’investigation.
Le score combinant des données cliniques, électrocardiographiques et l’anomalie
mécanique ventriculaire gauche qu’est le “septal flash”, nécessite une validation à
plus large échelle ainsi qu’une validation clinique en terme de morbidité
(hospitalisations pour insuffisance cardiaque), mortalité totale et cardiovasculaire.
Le suivi clinique à deux ans nous permettra de faire cette validation.
Ensuite, les nouveaux paramètres issus du traitement des intégrales des courbes
de strain sont en phase préliminaire. D’une part, la progression de l’imagerie
échocardiographique 3D nécessitait de tester le paramètre SDIL,peak. Nous avons
inclus de façon bicentrique (CHU de Rennes et Centre Hospitalier St Philibert de
Lille) 48 patients candidats à une resynchronisation cardiaque. Le SDIL,peak a été
calculé sur les 16 segments ventriculaires gauches, à partir du strain longitudinal
(Figure 1).
Figure 1. Speckle tracking longitudinal 3D. Extraction des 16 courbes de strain longitudinal.
Un SDIL,peak > 1.037 (AUC=0.77) a une sensibilité de 71% et une spécificité de 79%
pour prédire un remodelage ventriculaire gauche.
Dans notre travail, nous n’avons pas retenu l’étude des autres composantes de
déformation (radiale, circonférentielle et la torsion) du fait d’un manque de
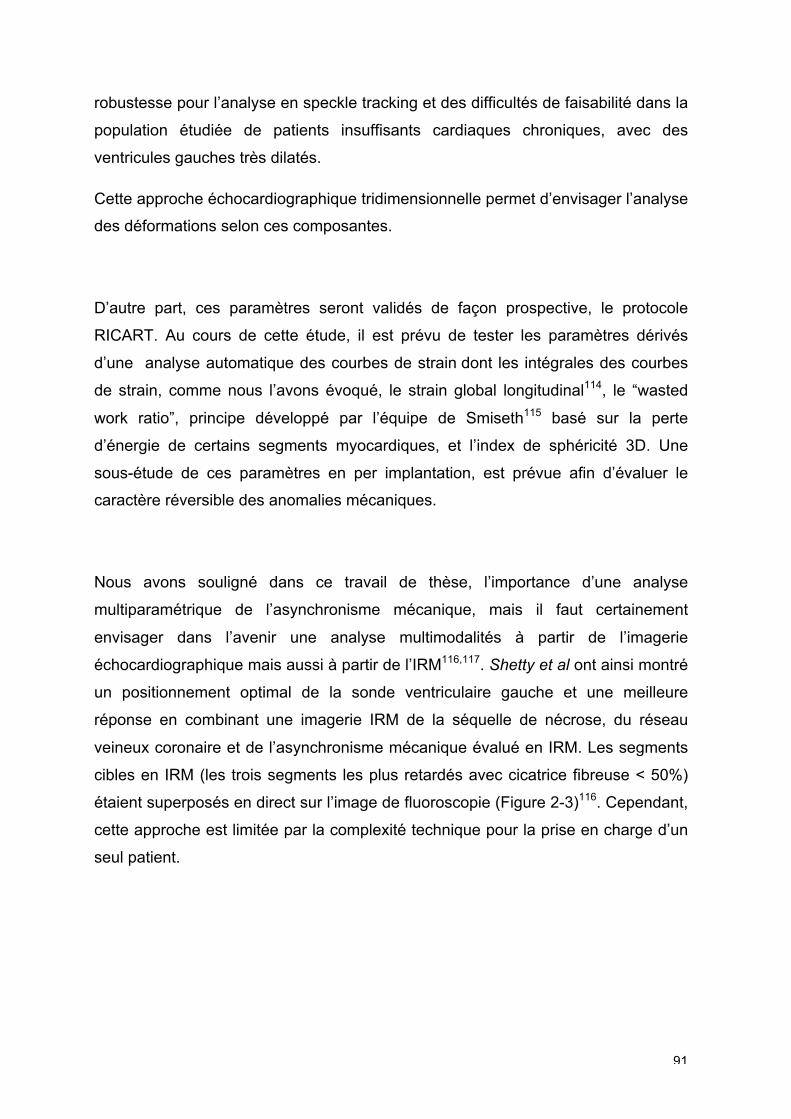
91
robustesse pour l’analyse en speckle tracking et des difficultés de faisabilité dans la
population étudiée de patients insuffisants cardiaques chroniques, avec des
ventricules gauches très dilatés.
Cette approche échocardiographique tridimensionnelle permet d’envisager l’analyse
des déformations selon ces composantes.
D’autre part, ces paramètres seront validés de façon prospective, le protocole
RICART. Au cours de cette étude, il est prévu de tester les paramètres dérivés
d’une analyse automatique des courbes de strain dont les intégrales des courbes
de strain, comme nous l’avons évoqué, le strain global longitudinal114, le “wasted
work ratio”, principe développé par l’équipe de Smiseth115 basé sur la perte
d’énergie de certains segments myocardiques, et l’index de sphéricité 3D. Une
sous-étude de ces paramètres en per implantation, est prévue afin d’évaluer le
caractère réversible des anomalies mécaniques.
Nous avons souligné dans ce travail de thèse, l’importance d’une analyse
multiparamétrique de l’asynchronisme mécanique, mais il faut certainement
envisager dans l’avenir une analyse multimodalités à partir de l’imagerie
échocardiographique mais aussi à partir de l’IRM116,117. Shetty et al ont ainsi montré
un positionnement optimal de la sonde ventriculaire gauche et une meilleure
réponse en combinant une imagerie IRM de la séquelle de nécrose, du réseau
veineux coronaire et de l’asynchronisme mécanique évalué en IRM. Les segments
cibles en IRM (les trois segments les plus retardés avec cicatrice fibreuse < 50%)
étaient superposés en direct sur l’image de fluoroscopie (Figure 2-3)116. Cependant,
cette approche est limitée par la complexité technique pour la prise en charge d’un
seul patient.
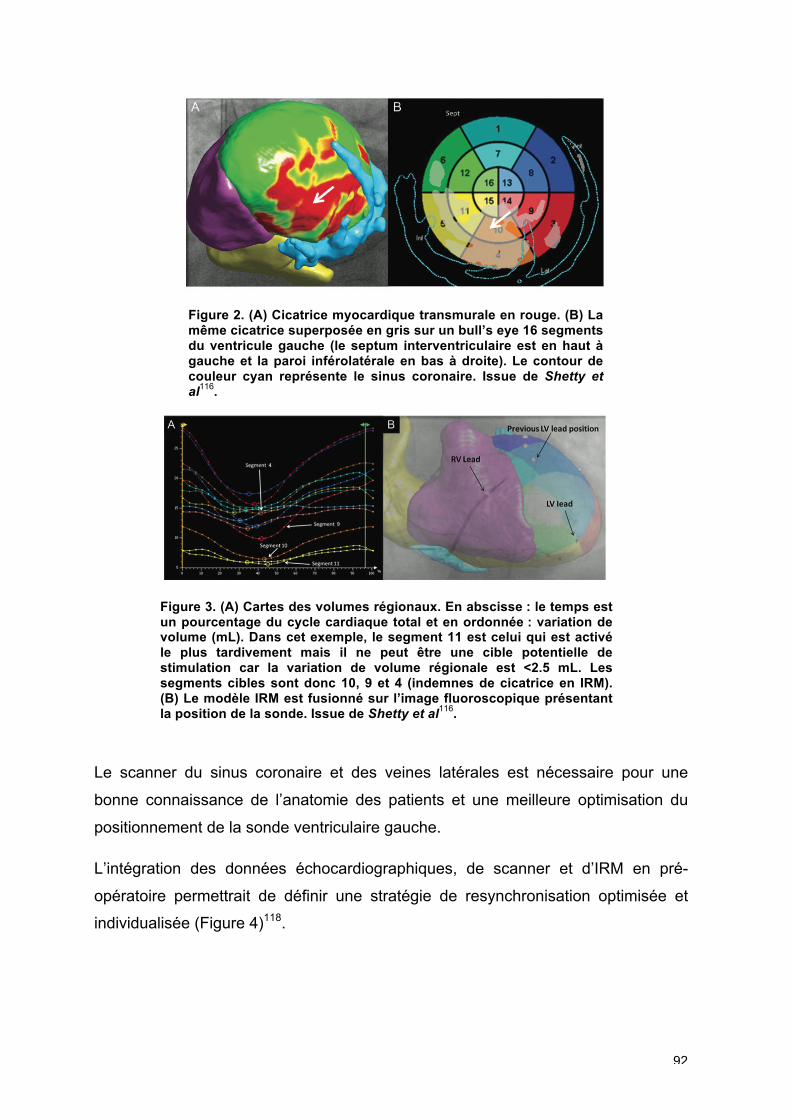
92
Figure 2. (A) Cicatrice myocardique transmurale en rouge. (B) La même cicatrice superposée en gris sur un bull’s eye 16 segments du ventricule gauche (le septum interventriculaire est en haut à gauche et la paroi inférolatérale en bas à droite). Le contour de couleur cyan représente le sinus coronaire. Issue de Shetty et al
116.
Figure 3. (A) Cartes des volumes régionaux. En abscisse : le temps est un pourcentage du cycle cardiaque total et en ordonnée : variation de volume (mL). Dans cet exemple, le segment 11 est celui qui est activé le plus tardivement mais il ne peut être une cible potentielle de stimulation car la variation de volume régionale est <2.5 mL. Les segments cibles sont donc 10, 9 et 4 (indemnes de cicatrice en IRM). (B) Le modèle IRM est fusionné sur l’image fluoroscopique présentant la position de la sonde. Issue de Shetty et al
116.
Le scanner du sinus coronaire et des veines latérales est nécessaire pour une
bonne connaissance de l’anatomie des patients et une meilleure optimisation du
positionnement de la sonde ventriculaire gauche.
L’intégration des données échocardiographiques, de scanner et d’IRM en pré-
opératoire permettrait de définir une stratégie de resynchronisation optimisée et
individualisée (Figure 4)118.
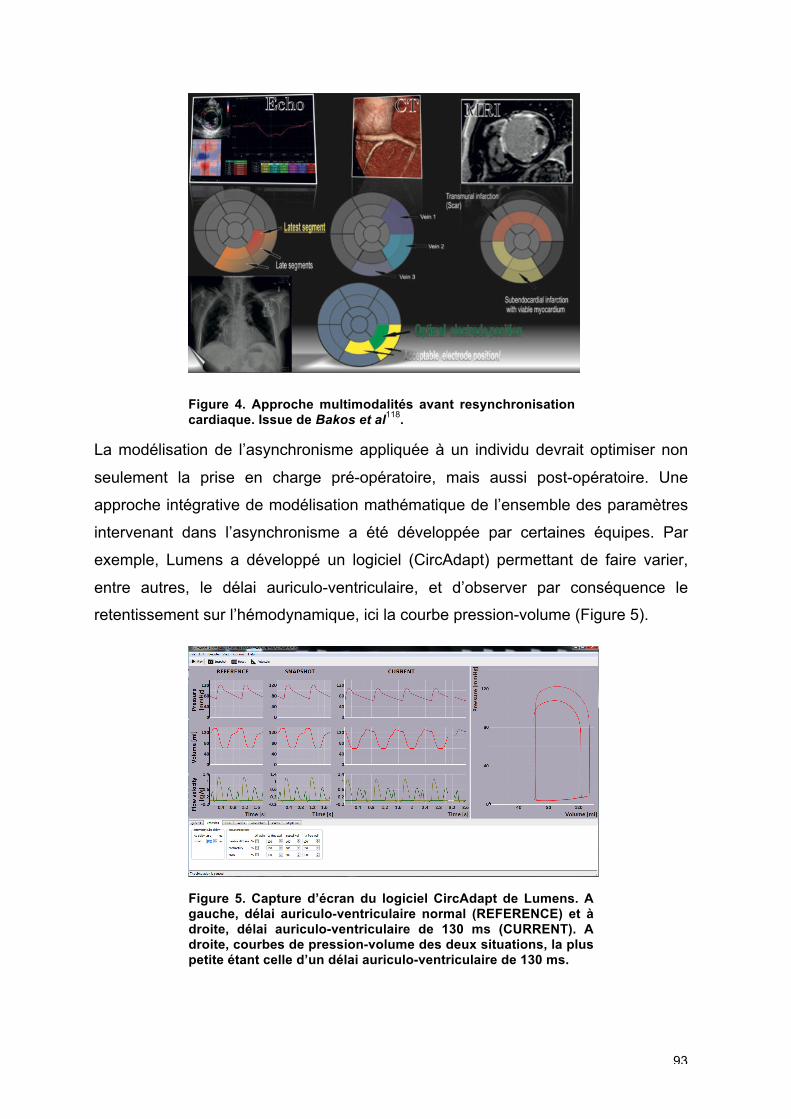
93
Figure 4. Approche multimodalités avant resynchronisation cardiaque. Issue de Bakos et al
118.
La modélisation de l’asynchronisme appliquée à un individu devrait optimiser non
seulement la prise en charge pré-opératoire, mais aussi post-opératoire. Une
approche intégrative de modélisation mathématique de l’ensemble des paramètres
intervenant dans l’asynchronisme a été développée par certaines équipes. Par
exemple, Lumens a développé un logiciel (CircAdapt) permettant de faire varier,
entre autres, le délai auriculo-ventriculaire, et d’observer par conséquence le
retentissement sur l’hémodynamique, ici la courbe pression-volume (Figure 5).
Figure 5. Capture d’écran du logiciel CircAdapt de Lumens. A gauche, délai auriculo-ventriculaire normal (REFERENCE) et à droite, délai auriculo-ventriculaire de 130 ms (CURRENT). A droite, courbes de pression-volume des deux situations, la plus petite étant celle d’un délai auriculo-ventriculaire de 130 ms.
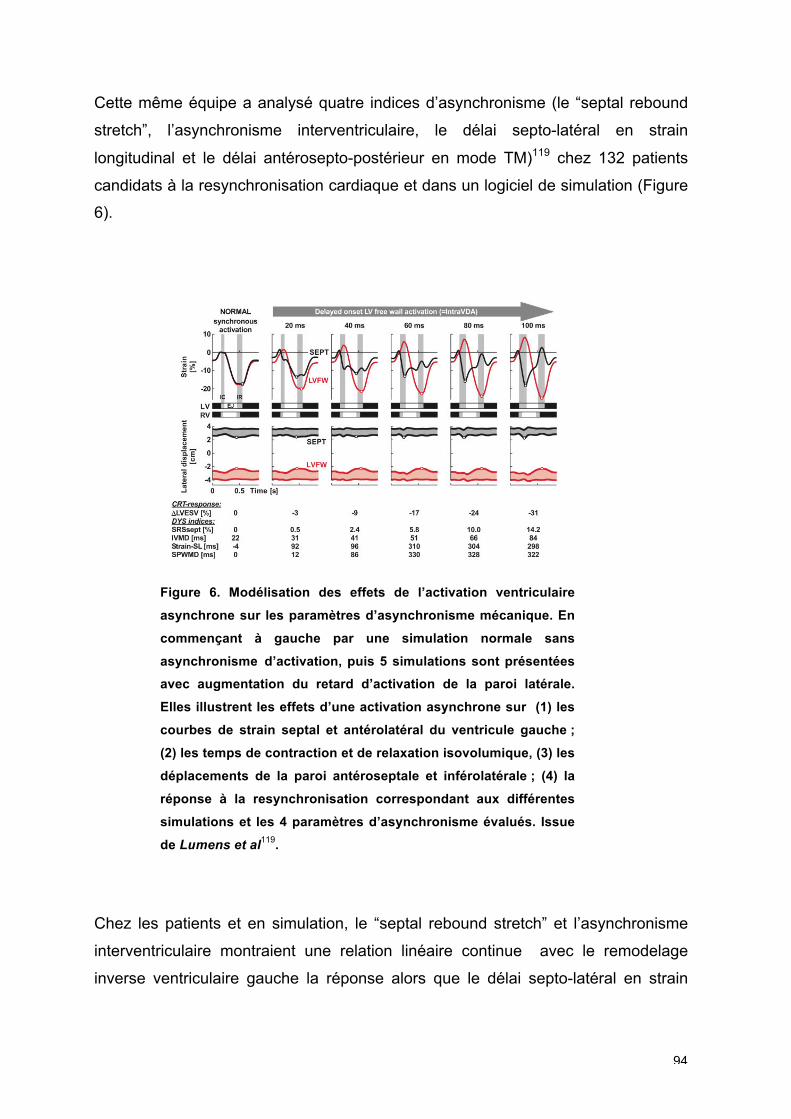
94
Cette même équipe a analysé quatre indices d’asynchronisme (le “septal rebound
stretch”, l’asynchronisme interventriculaire, le délai septo-latéral en strain
longitudinal et le délai antérosepto-postérieur en mode TM)119 chez 132 patients
candidats à la resynchronisation cardiaque et dans un logiciel de simulation (Figure
6).
Figure 6. Modélisation des effets de l’activation ventriculaire
asynchrone sur les paramètres d’asynchronisme mécanique. En
commençant à gauche par une simulation normale sans
asynchronisme d’activation, puis 5 simulations sont présentées
avec augmentation du retard d’activation de la paroi latérale.
Elles illustrent les effets d’une activation asynchrone sur (1) les
courbes de strain septal et antérolatéral du ventricule gauche ;
(2) les temps de contraction et de relaxation isovolumique, (3) les
déplacements de la paroi antéroseptale et inférolatérale ; (4) la
réponse à la resynchronisation correspondant aux différentes
simulations et les 4 paramètres d’asynchronisme évalués. Issue
de Lumens et al119.
Chez les patients et en simulation, le “septal rebound stretch” et l’asynchronisme
interventriculaire montraient une relation linéaire continue avec le remodelage
inverse ventriculaire gauche la réponse alors que le délai septo-latéral en strain
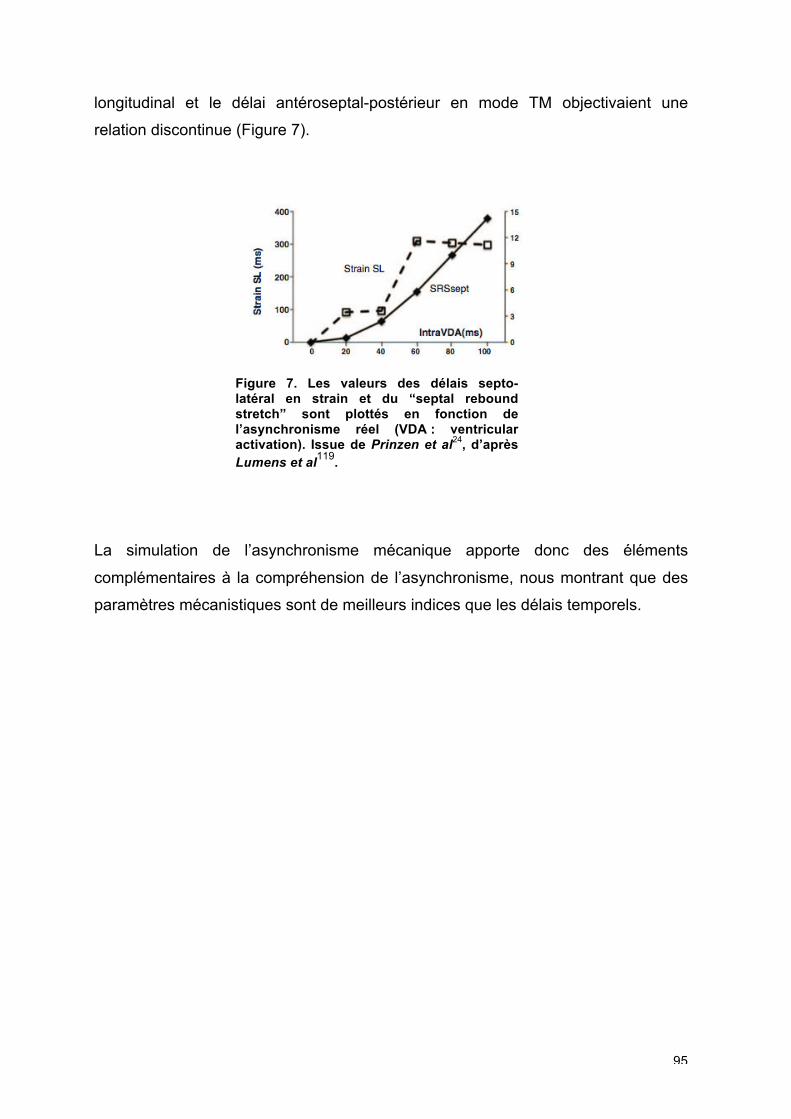
95
longitudinal et le délai antéroseptal-postérieur en mode TM objectivaient une
relation discontinue (Figure 7).
Figure 7. Les valeurs des délais septo-latéral en strain et du “septal rebound stretch” sont plottés en fonction de l’asynchronisme réel (VDA : ventricular activation). Issue de Prinzen et al
24, d’après Lumens et al
119.
La simulation de l’asynchronisme mécanique apporte donc des éléments
complémentaires à la compréhension de l’asynchronisme, nous montrant que des
paramètres mécanistiques sont de meilleurs indices que les délais temporels.
96
CONCLUSION
Les résultats de cette thèse démontrent que les analyses classiques des
asynchronismes, basées sur les chronologies ne peuvent suffire à une analyse
complète de la mécanique ventriculaire gauche avant resynchronisation cardiaque,
et qu’une analyse complète de la mécanique ventriculaire gauche devrait être
favorisée.
Le ventricule droit, structure connexe du ventricule gauche, interfère dans l’analyse
de l’asynchronisme mécanique. Une dysfonction ventriculaire droite contemporaine
d’une dysfonction ventriculaire gauche est associée à un asynchronisme
intraventriculaire longitudinal plus important.
La présence d’une réserve contractile de la paroi latérale du ventricule gauche,
évaluée en 2D strain à l’effort, est à intégrer dans l’évaluation des patients
candidats à une resynchronisation cardiaque.
L’analyse des anomalies de la mécanique ventriculaire gauche, telle le “septal
flash”, apporte des informations supplémentaires en comparaison aux seules
données cliniques et électrocardiographiques d’un patient.
Au-delà des asynchronismes, l’intégration de la contractilité résiduelle est
probablement à prendre en compte. On ne peut évaluer des délais sans connaître
le substrat sous-jacent. C’est ce que permet l’analyse des morphologies des
courbes de déformations myocardiques, les intégrales combinant des informations
de contractilité et de chronologie.
Les résultats que nous avons obtenu soulèvent des hypothèses quant à la
prédiction de la réponse mais ne peuvent à ce jour modifier la sélection des patients
candidats à la resynchronisation cardiaque selon les recommandations actuelles.
Nos travaux ouvrent de nouvelles pistes de travail pour une approche mécanistique,
multiparamétrique et automatisée. L’analyse de la mécanique d’activation cardiaque
ne peut se faire qu’après une analyse de l’asynchronisme électrique chez des
patients recevant une thérapie électrique. Elle se doit d’apporter les informations
nécessaires et complémentaires au clinicien pour une meilleure prise en charge du
patient. L’intégration de ces multiples paramètres dans notre pratique quotidienne

97
est délicate, nécessitant une expertise, et un temps certain d’analyse.
L’automatisation de ces mesures pourrait aboutir en une meilleure reproductibilité et
par voie de conséquence en l’utilisation en pratique clinique de ces algorithmes.
98
BIBLIOGRAPHIE
1. Mosterd A, Hoes AW. Clinical epidemiology of heart failure. Heart. 2007;93:1137–1146.
2. Brignole M, Auricchio A, Baron-Esquivias G, Bordachar P, Boriani G, Breithardt OA, Cleland J, Deharo J-C, Delgado V, Elliott PM, Gorenek B, Israel CW, Leclercq C, Linde C, Mont L, Padeletti L, Sutton R, Vardas PE, ESC Committee for Practice Guidelines CPG, Zamorano JL, Achenbach S, Baumgartner H, Bax JJ, Bueno H, Dean V, Deaton C, Erol C, Fagard R, Ferrari R, Hasdai D, Hoes AW, Kirchhof P, Knuuti J, Kolh P, Lancellotti P, Linhart A, Nihoyannopoulos P, Piepoli MF, Ponikowski P, Sirnes PA, Tamargo JL, Tendera M, Torbicki A, Wijns W, Windecker S, Document Reviewers, Kirchhof P, Blomstrom-Lundqvist C, Badano LP, Aliyev F, Bänsch D, Baumgartner H, Bsata W, Buser P, Charron P, Daubert J-C, Dobreanu D, Faerestrand S, Hasdai D, Hoes AW, Le Heuzey J-Y, Mavrakis H, McDonagh T, Merino JL, Nawar MM, Nielsen JC, Pieske B, Poposka L, Ruschitzka F, Tendera M, Van Gelder IC, Wilson CM. 2013 ESC Guidelines on cardiac pacing and cardiac resynchronization therapy: the Task Force on cardiac pacing and resynchronization therapy of the European Society of Cardiology (ESC). Developed in collaboration with the European Heart Rhythm Association (EHRA). Eur Heart J. 2013;34:2281–2329.
3. Daubert J-C, Saxon L, Adamson PB, Auricchio A, Berger RD, Beshai JF, Breithard O, Brignole M, Cleland J, Delurgio DB, Dickstein K, Exner DV, Gold M, Grimm RA, Hayes DL, Israel C, Leclercq C, Linde C, Lindenfeld J, Merkely B, Mont L, Murgatroyd F, Prinzen F, Saba SF, Shinbane JS, Singh J, Tang AS, Vardas PE, Wilkoff BL, Zamorano JL. 2012 EHRA/HRS expert consensus statement on cardiac resynchronization therapy in heart failure: implant and follow-up recommendations and management. Heart Rhythm. 2012;9:1524–1576.
4. Chung ES, Leon AR, Tavazzi L, Sun J-P, Nihoyannopoulos P, Merlino J, Abraham WT, Ghio S, Leclercq C, Bax JJ, Yu C-M, Gorcsan J, St John Sutton M, De Sutter J, Murillo J. Results of the Predictors of Response to CRT (PROSPECT) trial. Circulation. 2008;117:2608–2616.
5. Delgado V, Bax JJ. Assessment of Systolic Dyssynchrony for Cardiac Resynchronization Therapy Is Clinically Useful. Circulation. 2011;123:640–655.
6. Daubert J-C, Pavin D, Jauvert G, Mabo P. Intra- and interatrial conduction delay: implications for cardiac pacing. Pacing Clin Electrophysiol. 2004;27:507–525.
7. Daubert J-C. Pacing and hypertrophic obstructive cardiomyopathy. Pacing Clin Electrophysiol. 1996;19:1141–1142.
8. Hochleitner M, Hörtnagl H, Hörtnagl H, Fridrich L, Gschnitzer F. Long-term efficacy of physiologic dual-chamber pacing in the treatment of end-stage
99
idiopathic dilated cardiomyopathy. Am J Cardiol. 1992;70:1320–1325.
9. Tyers GF. Comparison of the effect on cardiac function of single-site and simultaneous multiple-site ventricular stimulation after A-V block. J Thorac Cardiovasc Surg. 1970;59:211–217.
10. Xiao HB, Lee CH, Gibson DG. Effect of left bundle branch block on diastolic function in dilated cardiomyopathy. Br Heart J. 1991;66:443–447.
11. Xiao HB, Brecker SJ, Gibson DG. Differing effects of right ventricular pacing and left bundle branch block on left ventricular function. Br Heart J. 1993;69:166–173.
12. Cazeau S, Ritter P, Bakdach S, Lazarus A, Limousin M, Henao L, Mundler O, Daubert J-C, Mugica J. Four chamber pacing in dilated cardiomyopathy. Pacing Clin Electrophysiol. 1994;17:1974–1979.
13. Cazeau S, Ritter P, Lazarus A, Gras D, Backdach H, Mundler O, Mugica J. Multisite pacing for end-stage heart failure: early experience. Pacing Clin Electrophysiol. 1996;19:1748–1757.
14. Blanc JJ, Etienne Y, Gilard M, Mansourati J, Munier S, Boschat J, Benditt DG, Lurie KG. Evaluation of different ventricular pacing sites in patients with severe heart failure: results of an acute hemodynamic study. Circulation. 1997;96:3273–3277.
15. Kass DA, Chen CH, Curry C, Talbot M, Berger R, Fetics B, Nevo E. Improved left ventricular mechanics from acute VDD pacing in patients with dilated cardiomyopathy and ventricular conduction delay. Circulation. 1999;99:1567–1573.
16. Auricchio A, Stellbrink C, Block M, Sack S, Vogt J, Bakker P, Klein H, Kramer A, Ding J, Salo R, Tockman B, Pochet T, Spinelli J. Effect of pacing chamber and atrioventricular delay on acute systolic function of paced patients with congestive heart failure. The Pacing Therapies for Congestive Heart Failure Study Group. The Guidant Congestive Heart Failure Research Group. Circulation. 1999;99:2993–3001.
17. Cazeau S, Leclercq C, Lavergne T, Walker S, Varma C, Linde C, Garrigue S, Kappenberger L, Haywood GA, Santini M, Bailleul C, Daubert J-C, Multisite Stimulation in Cardiomyopathies (MUSTIC) Study Investigators. Effects of multisite biventricular pacing in patients with heart failure and intraventricular conduction delay. N Engl J Med. 2001;344:873–880.
18. Abraham WT, Fisher WG, Smith AL, Delurgio DB, Leon AR, Loh E, Kocovic DZ, Packer M, Clavell AL, Hayes DL, Ellestad M, Trupp RJ, Underwood J, Pickering F, Truex C, McAtee P, Messenger J, MIRACLE Study Group. Multicenter InSync Randomized Clinical Evaluation. Cardiac resynchronization in chronic heart failure. N Engl J Med. 2002;346:1845–1853.
19. Bristow MR, Saxon LA, Boehmer J, Krueger S, Kass DA, De Marco T,
100
Carson P, DiCarlo L, DeMets D, White BG, DeVries DW, Feldman AM, Comparison of Medical Therapy Pacing and Defibrillation in Heart Failure COMPANION Investigators. Cardiac-resynchronization therapy with or without an implantable defibrillator in advanced chronic heart failure. N Engl J Med. 2004;350:2140–2150.
20. Cleland JGF, Daubert J-C, Erdmann E, Freemantle N, Gras D, Kappenberger L, Tavazzi L, Cardiac Resynchronization-Heart Failure CARE-HF Study Investigators. The effect of cardiac resynchronization on morbidity and mortality in heart failure. N Engl J Med. 2005;352:1539–1549.
21. Duncan A, Wait D, Gibson D, Daubert J-C, MUSTIC (Multisite Stimulationin Cardiomyopathies) Trial. Left ventricular remodelling and haemodynamic effects of multisite biventricular pacing in patients with left ventricular systolic dysfunction and activation disturbances in sinus rhythm: sub-study of the MUSTIC (Multisite Stimulationin Cardiomyopathies) trial. Eur Heart J. 2003;24:430–441.
22. St John Sutton MG, Plappert T, Abraham WT, Smith AL, Delurgio DB, Leon AR, Loh E, Kocovic DZ, Fisher WG, Ellestad M, Messenger J, Kruger K, Hilpisch KE, Hill MRS, Multicenter InSync Randomized Clinical Evaluation (MIRACLE) Study Group. Effect of cardiac resynchronization therapy on left ventricular size and function in chronic heart failure. Circulation. 2003;107:1985–1990.
23. Van Geldorp IE, Vernooy K, Delhaas T, Prins MH, Crijns HJ, Prinzen FW, Dijkman B. Beneficial effects of biventricular pacing in chronically right ventricular paced patients with mild cardiomyopathy. Europace. 2010;12:223–229.
24. Prinzen FW, Vernooy K, Auricchio A. Cardiac Resynchronization Therapy: State-of-the-Art of Current Applications, Guidelines, Ongoing Trials, and Areas of Controversy. Circulation. 2013;128:2407–2418.
25. Linde C, Abraham WT, Gold MR, St John Sutton M, Ghio S, Daubert C, REVERSE (REsynchronization reVErses Remodeling in Systolic left vEntricular dysfunction) Study Group. Randomized trial of cardiac resynchronization in mildly symptomatic heart failure patients and in asymptomatic patients with left ventricular dysfunction and previous heart failure symptoms. J Am Coll Cardiol. 2008;52:1834–1843.
26. Moss AJ, Hall WJ, Cannom DS, Klein H, Brown MW, Daubert JP, Estes NAM, Foster E, Greenberg H, Higgins SL, Pfeffer MA, Solomon SD, Wilber D, Zareba W, MADIT-CRT Trial Investigators. Cardiac-resynchronization therapy for the prevention of heart-failure events. N Engl J Med. 2009;361:1329–1338.
27. Tang ASL, Wells GA, Talajic M, Arnold MO, Sheldon R, Connolly S, Hohnloser SH, Nichol G, Birnie DH, Sapp JL, Yee R, Healey JS, Rouleau JL. Cardiac-Resynchronization Therapy for Mild-to-Moderate Heart Failure. N Engl J Med. 2010;363:2385–2395.
101
28. Udo EO, Zuithoff NPA, van Hemel NM, de Cock CC, Hendriks T, Doevendans PA, Moons KGM. Incidence and predictors of short- and long-term complications in pacemaker therapy: the FOLLOWPACE study. Heart Rhythm. 2012;9:728–735.
29. Al-Majed NS, McAlister FA, Bakal JA, Ezekowitz JA. Meta-analysis: cardiac resynchronization therapy for patients with less symptomatic heart failure. Ann Intern Med. 2011;154:401–412.
30. Johansen JB, Jørgensen OD, Møller M, Arnsbo P, Mortensen PT, Nielsen JC. Infection after pacemaker implantation: infection rates and risk factors associated with infection in a population-based cohort study of 46299 consecutive patients. Eur Heart J. 2011;32:991–998.
31. Russo AM, Stainback RF, Bailey SR, Epstein AE, Heidenreich PA, Jessup M, Kapa S, Kremers MS, Lindsay BD, Stevenson LW. ACCF/HRS/AHA/ASE/HFSA/SCAI/SCCT/SCMR 2013 appropriate use criteria for implantable cardioverter-defibrillators and cardiac resynchronization therapy: a report of the American College of Cardiology Foundation appropriate use criteria task force, Heart Rhythm Society, American Heart Association, American Society of Echocardiography, Heart Failure Society of America, Society for Cardiovascular Angiography and Interventions, Society of Cardiovascular Computed Tomography, and Society for Cardiovascular Magnetic Resonance. Heart Rhythm. 2013;10:e11–58.
32. Gold MR, Thebault C, Linde C, Abraham WT, Gerritse B, Ghio S, St John Sutton M, Daubert J-C. The Effect of QRS Duration and Morphology on Cardiac Resynchronization Therapy Outcomes in Mild Heart Failure: Results from the REsynchronization reVErses Remodeling in Systolic left vEntricular dysfunction (REVERSE) Study. Circulation. 2012;126:822–829.
33. Beshai JF, Grimm RA, Nagueh SF, Baker JH, Beau SL, Greenberg SM, Pires LA, Tchou PJ, RethinQ Study Investigators. Cardiac-resynchronization therapy in heart failure with narrow QRS complexes. N Engl J Med. 2007;357:2461–2471.
34. Donahue T, Niazi I, Leon A, Stucky M, Herrmann K, ESTEEM-CRT Investigators. Acute and chronic response to CRT in narrow QRS patients. J of Cardiovasc Trans Res. 2012;5:232–241.
35. Ruschitzka F, Abraham WT, Singh JP, Bax JJ, Borer JS, Brugada J, Dickstein K, Ford I, Gorcsan J III, Gras D, Krum H, Sogaard P, Holzmeister J. Cardiac-Resynchronization Therapy in Heart Failure with a Narrow QRS Complex. N Engl J Med. 2013;369:1395–1405.
36. Thibault B, Harel F, Ducharme A, White M, Ellenbogen KA, Frasure-Smith N, Roy D, Philippon F, Dorian P, Talajic M, Dubuc M, Guerra PG, Macle L, Rivard L, Andrade J, Khairy P, LESSER-EARTH Investigators. Cardiac resynchronization therapy in patients with heart failure and a QRS complex. Circulation. 2013;127:873–881.
102
37. Sutton MGSJ, Plappert T, Hilpisch KE, Abraham WT, Hayes DL, Chinchoy E. Sustained reverse left ventricular structural remodeling with cardiac resynchronization at one year is a function of etiology: quantitative Doppler echocardiographic evidence from the Multicenter InSync Randomized Clinical Evaluation (MIRACLE). Circulation. 2006;113:266–272.
38. Gold MR, Birgersdotter-Green U, Singh JP, Ellenbogen KA, Yu Y, Meyer TE, Seth M, Tchou PJ. The relationship between ventricular electrical delay and left ventricular remodelling with cardiac resynchronization therapy. Eur Heart J. 2011;32:2516–2524.
39. De Guillebon M, Thambo J-B, Ploux S, Deplagne A, Sacher F, Jais P, Haïssaguerre M, Ritter P, Clémenty J, Bordachar P. Reliability and reproducibility of QRS duration in the selection of candidates for cardiac resynchronization therapy. Journal of Cardiovascular Electrophysiology. 2010;21:890–892.
40. Ploux S, Lumens J, Whinnett Z, Montaudon M, Strom M, Ramanathan C, Derval N, Zemmoura A, DENIS A, De Guillebon M, Shah A, Hocini M, Jais P, Ritter P, Haïssaguerre M, Wilkoff BL, Bordachar P. Noninvasive electrocardiographic mapping to improve patient selection for cardiac resynchronization therapy: beyond QRS duration and left bundle branch block morphology. J Am Coll Cardiol. 2013;61:2435–2443.
41. Tournoux F, Donal E, Leclercq C, De Place C, Crocq C, Solnon A, Cohen-Solal A, Mabo P, Daubert J-C. Concordance between mechanical and electrical dyssynchrony in heart failure patients: a function of the underlying cardiomyopathy? Journal of Cardiovascular Electrophysiology. 2007;18:1022–1027.
42. Leenders GE, Cramer MJ, Bogaard MD, Meine M, Doevendans PA, Boeck BW. Echocardiographic prediction of outcome after cardiac resynchronization therapy: conventional methods and recent developments. Heart Fail Rev. 2010;16:235–250.
43. Steffel J, Leclercq C. Mechanical dyssynchrony in CRT: still searching for the Holy Grail. Eur Heart J. 2014;35:13–15.
44. Vernooy K. Left bundle branch block induces ventricular remodelling and functional septal hypoperfusion. Eur Heart J. 2004;26:91–98.
45. Kerckhoffs RCP, Faris OP, Bovendeerd PHM, Prinzen FW, Smits K, McVeigh ER, Arts T. Electromechanics of paced left ventricle simulated by straightforward mathematical model: comparison with experiments. Am J Physiol Heart Circ Physiol. 2005;289:H1889–97.
46. Prinzen FW, Vernooy K, Deboeck BWL, Delhaas T. Mechano-energetics of the asynchronous and resynchronized heart. Heart Fail Rev. 2010;16:215–224.
47. Cazeau S, Bordachar P, Jauvert G, Lazarus A, Alonso C, Vandrell MC, Mugica J, Ritter P. Echocardiographic modeling of cardiac dyssynchrony

103
before and during multisite stimulation: a prospective study. Pacing Clin Electrophysiol. 2003;26:137–143.
48. Richardson M, Freemantle N, Calvert MJ, Cleland JGF, Tavazzi L, CARE-HF Study Steering Committee and Investigators. Predictors and treatment response with cardiac resynchronization therapy in patients with heart failure characterized by dyssynchrony: a pre-defined analysis from the CARE-HF trial. Eur Heart J. 2007;28:1827–1834.
49. Pitzalis MV, Iacoviello M, Romito R, Massari F, Rizzon B, Luzzi G, Guida P, Andriani A, Mastropasqua F, Rizzon P. Cardiac resynchronization therapy tailored by echocardiographic evaluation of ventricular asynchrony. J Am Coll Cardiol. 2002;40:1615–1622.
50. Pitzalis MV, Iacoviello M, Romito R, Guida P, De Tommasi E, Luzzi G, Anaclerio M, Forleo C, Rizzon P. Ventricular asynchrony predicts a better outcome in patients with chronic heart failure receiving cardiac resynchronization therapy. J Am Coll Cardiol. 2005;45:65–69.
51. Díaz-Infante E, Sitges M, Vidal B, Mont L, Delgado V, Marigliano A, Macias A, Tolosana JM, Tamborero D, Azqueta M, Roig E, Paré C, Brugada J. Usefulness of ventricular dyssynchrony measured using M-mode echocardiography to predict response to resynchronization therapy. Am J Cardiol. 2007;100:84–89.
52. Gorcsan J III, Abraham T, Agler DA, Bax JJ, Derumeaux G, Grimm RA, Martin R, Steinberg JS, Sutton MSJ, Yu C-M. Echocardiography for Cardiac Resynchronization Therapy: Recommendations for Performance and Reporting–A Report from the American Society of Echocardiography Dyssynchrony Writing Group Endorsed by the Heart Rhythm Society. J Am Soc Echocardiogr. 2008;21:191–213.
53. Lafitte S, Reant P, Zaroui A, Donal E, Mignot A, Bougted H, Belghiti H, Bordachar P, Deplagne A, Chabaneix J, Franceschi F, Deharo J-C, Santos PD, Clementy J, Roudaut R, Leclercq C, Habib G. Validation of an echocardiographic multiparametric strategy to increase responders patients after cardiac resynchronization: a multicentre study. Eur Heart J. 2009;30:2880–2887.
54. Bax JJ, Bleeker GB, Marwick TH, Molhoek SG, Boersma E, Steendijk P, van der Wall EE, Schalij MJ. Left ventricular dyssynchrony predicts response and prognosis after cardiac resynchronization therapy. J Am Coll Cardiol. 2004;44:1834–1840.
55. Van Bommel RJ, Ypenburg C, Borleffs CJW, Delgado V, Marsan NA, Bertini M, Holman ER, Schalij MJ, Bax JJ. Value of tissue Doppler echocardiography in predicting response to cardiac resynchronization therapy in patients with heart failure. Am J Cardiol. 2010;105:1153–1158.
56. Yu C-M, Chau E, Sanderson JE, Fan K, Tang M-O, Fung W-H, Lin H, Kong S-L, Lam Y-M, Hill MRS, Lau C-P. Tissue Doppler echocardiographic
104
evidence of reverse remodeling and improved synchronicity by simultaneously delaying regional contraction after biventricular pacing therapy in heart failure. Circulation. 2002;105:438–445.
57. Chung ES, Katra RP, Ghio S, Bax J, Gerritse B, Hilpisch K, Peterson BJ, Feldman DS, Abraham WT. Cardiac resynchronization therapy may benefit patients with left ventricular ejection fraction >35%: a PROSPECT trial substudy. Eur J Heart Fail. 2010;12:581–587.
58. Urheim S, Edvardsen T, Torp H, Angelsen B, Smiseth OA. Myocardial strain by Doppler echocardiography. Validation of a new method to quantify regional myocardial function. Circulation. 2000;102:1158–1164.
59. Leitman M, Lysyansky P, Sidenko S, Shir V, Peleg E, Binenbaum M, Kaluski E, Krakover R, Vered Z. Two-dimensional strain–a novel software for real-time quantitative echocardiographic assessment of myocardial function. J Am Soc Echocardiogr. 2004;17:1021–1029.
60. Gorcsan J, Tanaka H. Echocardiographic assessment of myocardial strain. J Am Coll Cardiol. 2011;58:1401–1413.
61. Sengupta PP, Khandheria BK, Korinek J, Wang J, Jahangir A, Seward JB, Belohlavek M. Apex-to-base dispersion in regional timing of left ventricular shortening and lengthening. J Am Coll Cardiol. 2006;47:163–172.
62. Suffoletto MS, Dohi K, Cannesson M, Saba S, Gorcsan J. Novel speckle-tracking radial strain from routine black-and-white echocardiographic images to quantify dyssynchrony and predict response to cardiac resynchronization therapy. Circulation. 2006;113:960–968.
63. Gorcsan J III, Tanabe M, Bleeker GB, Suffoletto MS, Thomas NC, Saba S, Tops LF, Schalij MJ, Bax JJ. Combined Longitudinal and Radial Dyssynchrony Predicts Ventricular Response After Resynchronization Therapy. J Am Coll Cardiol. 2007;50:1476–1483.
64. Delgado V, Ypenburg C, van Bommel RJ, Tops LF, Mollema SA, Marsan NA, Bleeker GB, Schalij MJ, Bax JJ. Assessment of Left Ventricular Dyssynchrony by Speckle Tracking Strain Imaging. J Am Coll Cardiol. 2008;51:1944–1952.
65. Tanaka H, Nesser H-J, Buck T, Oyenuga O, Janosi RA, Winter S, Saba S, Gorcsan J. Dyssynchrony by speckle-tracking echocardiography and response to cardiac resynchronization therapy: results of the Speckle Tracking and Resynchronization (STAR) study. Eur Heart J. 2010;31:1690–1700.
66. Lim P, Buakhamsri A, Popovic ZB, Greenberg NL, Patel D, Thomas JD, Grimm RA. Longitudinal Strain Delay Index by Speckle Tracking Imaging: A New Marker of Response to Cardiac Resynchronization Therapy. Circulation. 2008;118:1130–1137.
67. Kapetanakis S. Real-Time Three-Dimensional Echocardiography: A Novel
105
Technique to Quantify Global Left Ventricular Mechanical Dyssynchrony. Circulation. 2005;112:992–1000.
68. Marsan NA, Bleeker GB, Ypenburg C, van Bommel RJ, Ghio S, Van de Veire NR, Delgado V, Holman ER, van der Wall EE, Schalij MJ, Bax JJ. Real-time three-dimensional echocardiography as a novel approach to assess left ventricular and left atrium reverse remodeling and to predict response to cardiac resynchronization therapy. Heart Rhythm. 2008;5:1257–1264.
69. Tanaka H, Hara H, Saba S, Gorcsan J. Usefulness of Three-Dimensional Speckle Tracking Strain to Quantify Dyssynchrony and the Site of Latest Mechanical Activation. Am J Cardiol. 2010;105:235–242.
70. Thebault C, Donal E, Bernard A, Moreau O, Schnell F, Mabo P, Leclercq C. Real-time three-dimensional speckle tracking echocardiography: a novel technique to quantify global left ventricular mechanical dyssynchrony. Eur J Echocardiogr. 2011;12:26–32.
71. Aly MFA, Kleijn SA, de Boer K, Abd El-Hady YA, Sorour KA, Kandil HI, van Rossum AC, Kamp O. Comparison of three-dimensional echocardiographic software packages for assessment of left ventricular mechanical dyssynchrony and prediction of response to cardiac resynchronization therapy. Eur Heart J Cardiovasc Imaging. 2013;14:700–710.
72. Gjesdal O, Remme EW, Opdahl A, Skulstad H, Russell K, Kongsgaard E, Edvardsen T, Smiseth OA. Mechanisms of abnormal systolic motion of the interventricular septum during left bundle-branch block. Circ Cardiovasc Imaging. 2011;4:264–273.
73. Dillon JC, Chang S, Feigenbaum H. Echocardiographic Manifestations of Left Bundle Branch Block. Circulation. 1974;49:876–880.
74. Little WC, Reeves RC, Arciniegas J, Katholi RE, Rogers EW. Mechanism of abnormal interventricular septal motion during delayed left ventricular activation. Circulation. 1982;65:1486–1491.
75. Parsai C, Bijnens B, Sutherland GR, Baltabaeva A, Claus P, Marciniak M, Paul V, Scheffer M, Donal E, Derumeaux G, Anderson L. Toward understanding response to cardiac resynchronization therapy: left ventricular dyssynchrony is only one of multiple mechanisms. Eur Heart J. 2008;30:940–949.
76. Cikes M, Bijnens B, Durić Z, Bencic ML, Gosev I, Velagić V, Gasparović H, Milicić D, Biocina B. Detecting volume responders prior to implantation of a cardiac resynchronization therapy device via minithoracotomy: the septal flash as a predictor of immediate left ventricular reverse remodeling. Heart Surg Forum. 2009;12:E362–7.
77. Leenders GE, Lumens J, Cramer MJ, De Boeck BWL, Doevendans PA, Delhaas T, Prinzen FW. Septal Deformation Patterns Delineate Mechanical Dyssynchrony and Regional Differences in Contractility: Analysis of Patient
106
Data Using a Computer Model. Circ Heart Fail. 2012;5:87–96.
78. Chan Y-H, Wu L-S, Kuo C-T, Wang C-L, Yeh Y-H, Ho W-J, Hsu L-A. Incremental value of inefficient deformation indices for predicting response to cardiac resynchronization therapy. J Am Soc Echocardiogr. 2013;26:307–315.
79. Maréchaux S, Guiot A, Castel AL, Guyomar Y, Semichon M, Delelis F, Heuls S, Ennezat PV, Graux P, Tribouilloy C. Relationship between Two-Dimensional Speckle-Tracking Septal Strain and Response to Cardiac Resynchronization Therapy in Patients with Left Ventricular Dysfunction and Left Bundle Branch Block: A Prospective Pilot Study. J Am Soc Echocardiogr. 2014;27:501–511.
80. Voigt J-U, Schneider T-M, Korder S, Szulik M, Gürel E, Daniel WG, Rademakers F, Flachskampf FA. Apical transverse motion as surrogate parameter to determine regional left ventricular function inhomogeneities: a new, integrative approach to left ventricular asynchrony assessment. Eur Heart J. 2009;30:959–968.
81. Zhang Q, van Bommel RJ, Fung JW-H, Chan JY-S, Bleeker GB, Ypenburg C, Yip G, Liang Y-J, Schalij MJ, Bax JJ, Yu CM. Tissue Doppler velocity is superior to strain imaging in predicting long-term cardiovascular events after cardiac resynchronisation therapy. Heart. 2009;95:1085–1090.
82. Leyva F, Foley PWX, Stegemann B, Ward JA, Ng LL, Frenneaux MP, Regoli F, Smith REA, Auricchio A. Development and validation of a clinical index to predict survival after cardiac resynchronisation therapy. Heart. 2009;95:1619–1625.
83. Gorcsan J, Oyenuga O, Habib PJ, Tanaka H, Adelstein EC, Hara H, McNamara DM, Saba S. Relationship of echocardiographic dyssynchrony to long-term survival after cardiac resynchronization therapy. Circulation. 2010;122:1910–1918.
84. Hara H, Oyenuga OA, Tanaka H, Adelstein EC, Onishi T, McNamara DM, Schwartzman D, Saba S, Gorcsan J. The relationship of QRS morphology and mechanical dyssynchrony to long-term outcome following cardiac resynchronization therapy. Eur Heart J. 2012;33:2680–2691.
85. Risum N, Williams ES, Khouri MG, Jackson KP, Olsen NT, Jons C, Storm KS, Velazquez EJ, Kisslo J, Bruun NE, Sogaard P. Mechanical dyssynchrony evaluated by tissue Doppler cross-correlation analysis is associated with long-term survival in patients after cardiac resynchronization therapy. Eur Heart J. 2013;34:48–56.
86. Ypenburg C, van Bommel RJ, Delgado V, Mollema SA, Bleeker GB, Boersma E, Schalij MJ, Bax JJ. Optimal left ventricular lead position predicts reverse remodeling and survival after cardiac resynchronization therapy. J Am Coll Cardiol. 2008;52:1402–1409.
87. Ypenburg C, Roes SD, Bleeker GB, Kaandorp TAM, de Roos A, Schalij MJ,
107
van der Wall EE, Bax JJ. Effect of total scar burden on contrast-enhanced magnetic resonance imaging on response to cardiac resynchronization therapy. Am J Cardiol. 2007;99:657–660.
88. Delgado V, van Bommel RJ, Bertini M, Borleffs CJW, Marsan NA, Ng ACT, Nucifora G, van de Veire NRL, Ypenburg C, Boersma E, Holman ER, Schalij MJ, Bax JJ. Relative Merits of Left Ventricular Dyssynchrony, Left Ventricular Lead Position, and Myocardial Scar to Predict Long-Term Survival of Ischemic Heart Failure Patients Undergoing Cardiac Resynchronization Therapy. Circulation. 2011;123:70–78.
89. Gorcsan J. Finding pieces of the puzzle of nonresponse to cardiac resynchronization therapy. Circulation. 2011;123:10–12.
90. Helm RH, Byrne M, Helm PA, Daya SK, Osman NF, Tunin R, Halperin HR, Berger RD, Kass DA, Lardo AC. Three-dimensional mapping of optimal left ventricular pacing site for cardiac resynchronization. Circulation. 2007;115:953–961.
91. Khan FZ, Virdee MS, Palmer CR, Pugh PJ, O'Halloran D, Elsik M, Read PA, Begley D, Fynn SP, Dutka DP. Targeted left ventricular lead placement to guide cardiac resynchronization therapy: the TARGET study: a randomized, controlled trial. J Am Coll Cardiol. 2012;59:1509–1518.
92. Di Salvo TG, Mathier M, Semigran MJ, Dec GW. Preserved right ventricular ejection fraction predicts exercise capacity and survival in advanced heart failure. J Am Coll Cardiol. 1995;25:1143–1153.
93. Dickstein K, Vardas PE, Auricchio A, Daubert J-C, Linde C, McMurray J, Ponikowski P, Priori SG, Sutton R, van Veldhuisen DJ, ESC Committee for Practice Guidelines CPG, Vahanian A, Auricchio A, Bax J, Ceconi C, Dean V, Filippatos G, Funck-Brentano C, Hobbs R, Kearney P, McDonagh T, Popescu BA, Reiner Z, Sechtem U, Sirnes PA, Tendera M, Vardas P, Widimsky P, Document Reviewers, Tendera M, Anker SD, Blanc J-J, Gasparini M, Hoes AW, Israel CW, Kalarus Z, Merkely B, Swedberg K, Camm AJ. 2010 Focused Update of ESC Guidelines on device therapy in heart failure: An update of the 2008 ESC Guidelines for the diagnosis and treatment of acute and chronic heart failure and the 2007 ESC guidelines for cardiac and resynchronization therapy Developed with the special contribution of the Heart Failure Association and the European Heart Rhythm Association. Eur Heart J. 2010;31:2677–2687.
94. Lang RM, Bierig M, Devereux RB, Flachskampf FA, Foster E, Pellikka PA, Picard MH, Roman MJ, Seward J, Shanewise J, Solomon S, Spencer KT, St John Sutton M, Stewart W, American Society of Echocardiography's Nomenclature and Standards Committee, Task Force on Chamber Quantification, American College of Cardiology Echocardiography Committee, American Heart Association, European Association of Echocardiography, European Society of Cardiology. Recommendations for chamber quantification. Eur J Echocardiogr. 2006;7:79–108.
108
95. Mor-Avi V, Lang RM, Badano LP, Belohlavek M, Cardim NM, Derumeaux G, Galderisi M, Marwick T, Nagueh SF, Sengupta PP, Sicari R, Smiseth OA, Smulevitz B, Takeuchi M, Thomas JD, Vannan M, Voigt JU, Zamorano JL. Current and Evolving Echocardiographic Techniques for the Quantitative Evaluation of Cardiac Mechanics: ASE/EAE Consensus Statement on Methodology and Indications Endorsed by the Japanese Society of Echocardiography. Eur J Echocardiogr. 2011;12:167–205.
96. Beyar R, Dong SJ, Smith ER, Belenkie I, Tyberg JV. Ventricular interaction and septal deformation: a model compared with experimental data. Am J Physiol. 1993;265:H2044–56.
97. Dong SJ, Smith ER, Tyberg JV. Changes in the radius of curvature of the ventricular septum at end diastole during pulmonary arterial and aortic constrictions in the dog. Circulation.1992;86:1280-90.
98. Popescu BA. Right ventricular functional recovery after acute myocardial infarction: relation with left ventricular function and interventricular septum motion. GISSI-3 echo substudy. Heart. 2005;91:484–488.
99. Scollan DF, Holmes A, Zhang J, Winslow RL. Reconstruction of cardiac ventricular geometry and fiber orientation using magnetic resonance imaging. Ann Biomed Eng. 2000;28:934–944.
100. Meluzin J, Spinarová L, Hude P, Krejcí J, Kincl V, Panovský R, Dusek L. Prognostic Importance of Various Echocardiographic Right Ventricular Functional Parameters in Patients with Symptomatic Heart Failure. J Am Soc Echocardiogr. 2005;18:435–444.
101. Gupta S, Khan F, Shapiro M, Weeks SG, Litwin SE, Michaels AD. The associations between tricuspid annular plane systolic excursion (TAPSE), ventricular dyssynchrony, and ventricular interaction in heart failure patients. Eur J Echocardiogr. 2008;9:766–771.
102. Marciniak M, Bijnens B, Baltabaeva A, Marciniak A, Parsai C, Claus P, Sutherland GR. Interventricular interaction as a possible mechanism for the presence of a biphasic systolic velocity profile in normal left ventricular free walls. Heart. 2008;94:1058–1064.
103. Bleeker GB. Assessing right ventricular function: the role of echocardiography and complementary technologies. Heart. 2006;92:i19–i26.
104. Lindqvist P, Calcutteea A, Henein M. Echocardiography in the assessment of right heart function. Eur J Echocardiogr. 2008;9:225-34.
105. Muto C, Gasparini M, Neja CP, Iacopino S, Davinelli M, Zanon F, Dicandia C, Distefano G, Donati R, Calvi V, Denaro A, Tuccillo B. Presence of left ventricular contractile reserve predicts midterm response to cardiac resynchronization therapy—results from the LOw dose DObutamine Stress-Echo Test in Cardiac Resynchronization Therapy (LODO-CRT) Trial. Heart Rhythm. 2010;7:1600–1605.
109
106. Parsai C, Baltabaeva A, Anderson L, Chaparro M, Bijnens B, Sutherland GR. Low-dose dobutamine stress echo to quantify the degree of remodelling after cardiac resynchronization therapy. Eur Heart J. 2009;30:950–958.
107. Stankovic I, Aarones M, Smith HJ, Voros G, Kongsgaard E, Neskovic AN, Willems R, Aakhus S, Voigt JU. Dynamic relationship of left-ventricular dyssynchrony and contractile reserve in patients undergoing cardiac resynchronization therapy. Eur Heart J. 2014;35:48–55.
108. Park J-H, Negishi K, Grimm RA, Popovic Z, Stanton T, Wilkoff BL, Marwick TH. Echocardiographic predictors of reverse remodeling after cardiac resynchronization therapy and subsequent events. Circ Cardiovasc Imaging. 2013;6:864–872.
109. Doltra A, Bijnens B, Tolosana JM, Borràs R, Khatib M, Penela D, De Caralt TM, Castel MA, Berruezo A, Brugada J, Mont L, Sitges M. Mechanical Abnormalities Detected With Conventional Echocardiography Are Associated With Response and Midterm Survival in CRT. JACC Cardiovasc Imaging. 2014;7:969–979.
110. Bleeker GB. Effect of Posterolateral Scar Tissue on Clinical and Echocardiographic Improvement After Cardiac Resynchronization Therapy. Circulation. 2006;113:969–976.
111. Kydd AC, Khan FZ, O'Halloran D, Pugh PJ, Virdee MS, Dutka DP. Radial Strain Delay Based on Segmental Timing and Strain Amplitude Predicts Left Ventricular Reverse Remodeling and Survival following Cardiac Resynchronization Therapy. Circ Cardiovasc Imaging. 2013;6:177–184.
112. Lim P, Donal E, Lafitte S, Derumeaux G, Habib G, Reant P, Thivolet S, Lellouche N, Grimm RA, Gueret P. Multicentre study using strain delay index for predicting response to cardiac resynchronization therapy (MUSIC study). Eur J Heart Fail. 2011;13:984–991.
113. Lim P, Mitchell-Heggs L, Buakhamsri A, Thomas JD, Grimm RA. Impact of left ventricular size on tissue Doppler and longitudinal strain by speckle tracking for assessing wall motion and mechanical dyssynchrony in candidates for cardiac resynchronization therapy. J Am Soc Echocardiogr. 2009;22:695–701.
114. Haugaa KH, Goebel B, Dahlslett T, Meyer K, Jung C, Lauten A, Figulla HR, Poerner TC, Edvardsen T. Risk assessment of ventricular arrhythmias in patients with nonischemic dilated cardiomyopathy by strain echocardiography. J Am Soc Echocardiogr. 2012;25:667–673.
115. Russell K, Eriksen M, Aaberge L, Wilhelmsen N, Skulstad H, Gjesdal O, Edvardsen T, Smiseth OA. Assessment of wasted myocardial work: a novel method to quantify energy loss due to uncoordinated left ventricular contractions. Am J Physiol Heart Circ Physiol. 2013;305:H996–1003.
116. Shetty AK, Duckett SG, Ginks MR, Ma Y, Sohal M, Bostock J, Kapetanakis S, Singh JP, Rhode K, Wright M, O'Neill MD, Gill JS, Carr-White G, Razavi
110
R, Rinaldi CA. Cardiac magnetic resonance-derived anatomy, scar, and dyssynchrony fused with fluoroscopy to guide LV lead placement in cardiac resynchronization therapy: a comparison with acute haemodynamic measures and echocardiographic reverse remodelling. Eur Heart J Cardiovasc Imaging. 2013;14:692–699.
117. Cochet H, Denis A, Ploux S, Lumens J, AMRAOUI S, Derval N, Sacher F, Reant P, Lafitte S, Jais P, Laurent F, Ritter P, Montaudon M, Bordachar P. Pre- and Intra-Procedural Predictors of Reverse Remodeling After Cardiac Resynchronization Therapy: An MRI Study. J Cardiovasc Electrophysiol. 2013;24:682–691.
118. Bakos Z, Markstad H, Ostenfeld E, Carlsson M, Roijer A, Borgquist R. Combined preoperative information using a bullseye plot from speckle tracking echocardiography, cardiac CT scan, and MRI scan: targeted left ventricular lead implantation in patients receiving cardiac resynchronization therapy. Eur Heart J Cardiovasc Imaging. 2014;15:523-531.
119. Lumens J, Leenders GE, Cramer MJ, De Boeck BWL, Doevendans PA, Prinzen FW, Delhaas T. Mechanistic Evaluation of Echocardiographic Dyssynchrony Indices: Patient Data Combined With Multiscale Computer Simulations. Circ Cardiovasc Imaging. 2012;5:491–499.

111
ANNEXES
112
Articles publiés et articles soumis, en révision
1. Brunet-Bernard A, Maréchaux S, Fauchier L, Guiot A, Fournet M, Reynaud A, Schnell F, Leclercq C, Mabo P, Donal E. Combined score using clinical, ECG, and echocardiographic parameters to predict left ventricular remodeling in CRT patients. Am J Cardiol 2014;113:2045-51.
2. Donal E, Brunet A, Galli E. Can we predict the non-response to cardiac resynchronization therapy ? Acta Cardiol. 2014;69:366-8.
3. Bernard-Brunet A, Leclercq C, Donal E. Defining patients at risk of non-response to cardiac resynchronization therapy. Value of rest and exercise echocardiography. Int J Cardiol 2014;171:279-81.
4. Donal E, Bernard A, Daubert J.-C. Will mechanical dyssynchrony one day impact our management of chronic heart failure patients? Eur Heart J Cardiovasc Imaging. 2013;14:93-94.
5. Bernard A, Donal E, Leclercq C, Ollivier R, Schnell F, De Place C, Daubert JC, Mabo P. Impact of right ventricular contractility on left ventricular dyssynchrony in patients with chronic systolic heart failure. Int J Cardiol 2011;148:289-94.
6. Article soumis en novembre 2014 dans Journal of the American Society of Echocardiography : “Impact of cardiac resynchronization therapy on left ventricular mechanics. Understanding the response through a new quantitative approach based on longitudinal strain integral”
7. Article soumis en novembre 2014 dans European Heart Journal Cardiovascular Imaging : “New multiparametric strain integral-derived parameter for the evaluation of dyssynchrony and prediction of cardiac resynchronization therapy response”
113
COMMUNICATIONS ORALES ET AFFICHEES
COMMUNICATIONS ORALES
1. A. Bernard, A. Hernandez, A. Reynaud, C. Leclercq, J.-C. Daubert, E. Donal. Myocardial function and dyssynchrony during exercise predicts left ventricular reverse remodelling after cardiac resynchronization therapy. Journées Européennes de la Société Française de Cardiologie, Paris, Janvier 2013.
2. A. Bernard, Maréchaux S, Fauchier L, Guiot A, Fournet M, Reynaud A, Schnell F, Leclercq C, Mabo P, Donal E. Combined score using clinical, ECG, and echocardiographic parameters to predict left ventricular remodeling in CRT patients. Congrès de l'ESC, Barcelone, octobre 2014.
Lauréat du Prix French Book Bayer CNCF 2014 meilleure communication orale 2014 des 3 congrès internationaux ESC, AHA, ACC.
3. A. Bernard, E. Donal, A. Hernandez. Intérêt des intégrales des courbes de strain dans l'analyse multiparamétrique de l'asynchronisme cardiaque. Groupe de recherche en imagerie cardiovasculaire, Journées Françaises de Radiologie, Paris, Octobre 2014.
4. A. Bernard, E. Donal, C. Leclercq, F. Schnell, M. Fournet, A. Reynaud, C. Thebault, P. Mabo, JC. Daubert, A. Hernandez. Impact of cardiac resynchronization therapy on left ventricular mechanics: understanding the response through a new quantitative approach based on longitudinal strain integrals. EuroEcho Imaging, Vienne, décembre 2014.
COMMUNICATIONS AFFICHEES
1. A. Bernard, A. Hernandez, A. Reynaud, C. Leclercq, JC. Daubert, E. Donal. Myocardial function and dyssynchrony during exercise predicts left ventricular reverse remodelling after cardiac resynchronization therapy. EuroEcho, Athens, Décembre 2012. 2. A. Bernard, E. Donal, A. Reynaud, F. Schnell, JC. Daubert, C. Leclercq, A. Hernandez. Analyse des intégrales de strain longitudinal de patients insuffisants cardiaques au repos et à l’effort. Paris Echo, Juin 2013. 3. A. Bernard, A. Reynaud, E. Oger, F. Gardant, JC. Daubert, P.Mabo, E. Donal. L’évaluation de la fonction cardiaque à l’effort permet-elle de mieux définir le risque de non-réponse à la resynchronisation cardiaque ? Paris Echo, Juin 2013. 4. A. Bernard, E. Donal, A. Reynaud, F. Schnell, JC. Daubert, C. Leclercq, A. Hernandez. Analysis of longitudinal strain integrals during rest and effort on heart failure patients. ESC congress, Amsterdam, Août 2013. 5. A. Bernard, E. Donal, A. Reynaud, F. Schnell, JC. Daubert, C. Leclercq, A. Hernandez. New insights into left ventricular mechanics with the analysis of longitudinal strain integrals on heart failure patients. Euroecho, Istanbul, Déc 2013.

Impact of right ventricular contractility on left ventricular dyssynchrony in patientswith chronic systolic heart failure
Anne Bernard, Erwan Donal ⁎, Christophe Leclercq, Romain Ollivier, Frédéric Schnell, Christian de Place,Jean-Claude Daubert, Philippe Mabo
Service de Cardiologie, CIT-IC 804, LTSI INSERM U 642, CHU Rennes, France
a b s t r a c ta r t i c l e i n f o
Article history:
Received 29 April 2009
Received in revised form 12 September 2009
Accepted 8 November 2009
Available online 30 November 2009
Keywords:
Dyssynchrony
Heart failure
Echocardiography
2D strain
Background: Cardiac resynchronization therapy (CRT) is an important therapeutic approach for patients with
symptomatic heart failure. The assessment of mechanical dyssynchrony, however, remains an issue. Little
data are available regarding the influence of the right ventricle (RV) on left ventricle (LV) mechanical
dyssynchrony as assessed by echocardiography.
Aims: We sought to assess the impact of RV contractility on LV function and dyssynchrony.
Methods: A total of 40 patients with congestive heart failure were analyzed. Twenty had RV dysfunction, as
defined by a tricuspid annular systolic peak of tissue Doppler (SaRV) b11.5 cm/s, while the remaining 20 had
SaRVN11.5 cm/s. All patients underwent echocardiography in order to determine RV function, LV function,
and dyssynchrony.
Results: The two populations were similar regarding diastolic function, atrio-ventricular conduction and
interventricular dyssynchrony. Patients with RV dysfunction showed significantly more severe LV
longitudinal dyssynchrony (130±103 ms vs. 62±59 ms; p=0.01). In addition, SaRV (systolic peak
recorded at the tricuspid annulus) was correlated with LV longitudinal dyssynchrony (r=0.47; p=0.001).
In contrast, LV radial contractility and dyssynchrony (103±110 ms vs. 100±78 ms; p=0.5) were not
affected by RV function.
Conclusion: Quantitative analysis of RV function is important when assessing LV function and dyssynchrony
in patients with systolic heart failure. RV function is associated with intra-LV dyssynchrony, particularly
when considering longitudinal function.
© 2009 Elsevier Ireland Ltd. All rights reserved.
1. Introduction
Cardiac resynchronization therapy (CRT) is a major treatment for
patients with severe symptomatic heart failure (HF) and wide
electrocardiographic QRS complex [1,2]. Although biventricular pacing
leads to improvement in left ventricular (LV) function andHF symptoms,
a significant number of patients (N30%) either do not improve or
experience a worsening of symptoms following CRT implantation [3–5].
The assessment of intraventricular dyssynchrony may be more
adequate than interventricular dyssynchrony [6] for identifying
potential responders [7–9]. Different echocardiography-based imaging
modalities have been used to assess this intraventricular dyssynchrony.
However, all approaches for assessing intra-LV dyssynchrony have
individually given disappointing results, especially in the PROSPECT
study [10]. A more physiopathology-driven approach should probably
be developed to better explain dyssynchrony.
RV function and contractility, as well as the interaction with LV
function and dyssynchrony, have not been given enough attention.
Nevertheless, RV function has proven to be a major determinant of
clinical outcome in LV failure patients [11,12]. Also, an abundance of
experimental data has demonstrated that left and right ventricular
pump mechanics influence each other [13–16]. We thus believe that
the ability to distinguish the influence of RV function on abnormalities
observed while exploring LV mechanics is of clinical value.
Consequently, we used echocardiography to investigate the impact
of RV functiononLV function anddyssynchrony in patientswith chronic
systolic HF.
2. Methods
2.1. Study population
This case-control study included patients with symptoms of
moderate congestive HF (class II–III according to the New York
International Journal of Cardiology 148 (2011) 289–294
Abbreviations: CRT, Cardiac resynchronization therapy; HF, Heart failure; LVEF, Left
ventricular ejection fraction; LV, Left ventricle/ventricular; NYHA, New York Heart
Association; RV, Right ventricle/ventricular; SaRV, Tricuspid annular systolic peak
(pulsed tissue Doppler); TAPSE, Tricuspid annular plane systolic excursion; TDI, Tissue
Doppler imaging.
⁎ Corresponding author. Service de Cardiologie et CIC-IT INSERM U 642, CHU Rennes,
Pontchaillou, 35033 RENNES, France. Tel.: +33 2 99 28 25 25; fax: +33 2 99 28 25 10.
E-mail address: [email protected] (E. Donal).
0167-5273/$ – see front matter © 2009 Elsevier Ireland Ltd. All rights reserved.
doi:10.1016/j.ijcard.2009.11.007
Contents lists available at ScienceDirect
International Journal of Cardiology
j ourna l homepage: www.e lsev ie r.com/ locate / i j ca rd
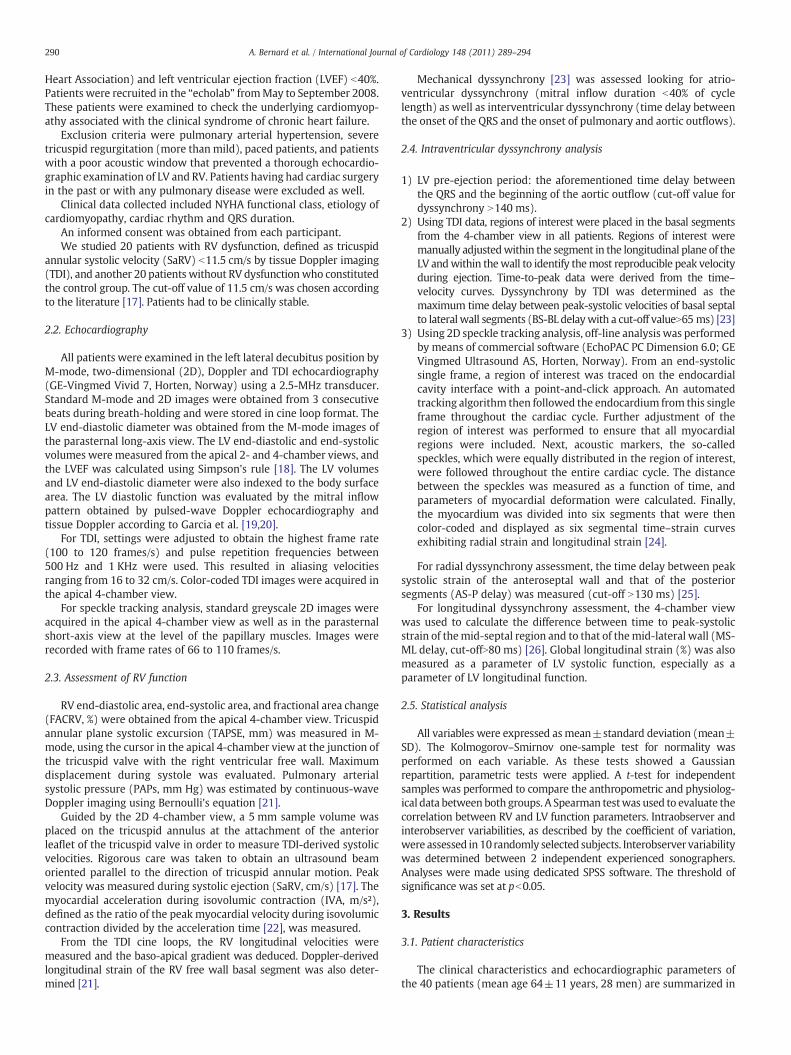
Heart Association) and left ventricular ejection fraction (LVEF) b40%.
Patients were recruited in the “echolab” fromMay to September 2008.
These patients were examined to check the underlying cardiomyop-
athy associated with the clinical syndrome of chronic heart failure.
Exclusion criteria were pulmonary arterial hypertension, severe
tricuspid regurgitation (more than mild), paced patients, and patients
with a poor acoustic window that prevented a thorough echocardio-
graphic examination of LV and RV. Patients having had cardiac surgery
in the past or with any pulmonary disease were excluded as well.
Clinical data collected included NYHA functional class, etiology of
cardiomyopathy, cardiac rhythm and QRS duration.
An informed consent was obtained from each participant.
We studied 20 patients with RV dysfunction, defined as tricuspid
annular systolic velocity (SaRV) b11.5 cm/s by tissue Doppler imaging
(TDI), and another 20 patients without RV dysfunctionwho constituted
the control group. The cut-off value of 11.5 cm/s was chosen according
to the literature [17]. Patients had to be clinically stable.
2.2. Echocardiography
All patients were examined in the left lateral decubitus position by
M-mode, two-dimensional (2D), Doppler and TDI echocardiography
(GE-Vingmed Vivid 7, Horten, Norway) using a 2.5-MHz transducer.
Standard M-mode and 2D images were obtained from 3 consecutive
beats during breath-holding and were stored in cine loop format. The
LV end-diastolic diameter was obtained from the M-mode images of
the parasternal long-axis view. The LV end-diastolic and end-systolic
volumes were measured from the apical 2- and 4-chamber views, and
the LVEF was calculated using Simpson's rule [18]. The LV volumes
and LV end-diastolic diameter were also indexed to the body surface
area. The LV diastolic function was evaluated by the mitral inflow
pattern obtained by pulsed-wave Doppler echocardiography and
tissue Doppler according to Garcia et al. [19,20].
For TDI, settings were adjusted to obtain the highest frame rate
(100 to 120 frames/s) and pulse repetition frequencies between
500 Hz and 1 KHz were used. This resulted in aliasing velocities
ranging from 16 to 32 cm/s. Color-coded TDI images were acquired in
the apical 4-chamber view.
For speckle tracking analysis, standard greyscale 2D images were
acquired in the apical 4-chamber view as well as in the parasternal
short-axis view at the level of the papillary muscles. Images were
recorded with frame rates of 66 to 110 frames/s.
2.3. Assessment of RV function
RV end-diastolic area, end-systolic area, and fractional area change
(FACRV, %) were obtained from the apical 4-chamber view. Tricuspid
annular plane systolic excursion (TAPSE, mm) was measured in M-
mode, using the cursor in the apical 4-chamber view at the junction of
the tricuspid valve with the right ventricular free wall. Maximum
displacement during systole was evaluated. Pulmonary arterial
systolic pressure (PAPs, mm Hg) was estimated by continuous-wave
Doppler imaging using Bernoulli's equation [21].
Guided by the 2D 4-chamber view, a 5 mm sample volume was
placed on the tricuspid annulus at the attachment of the anterior
leaflet of the tricuspid valve in order to measure TDI-derived systolic
velocities. Rigorous care was taken to obtain an ultrasound beam
oriented parallel to the direction of tricuspid annular motion. Peak
velocity was measured during systolic ejection (SaRV, cm/s) [17]. The
myocardial acceleration during isovolumic contraction (IVA, m/s²),
defined as the ratio of the peak myocardial velocity during isovolumic
contraction divided by the acceleration time [22], was measured.
From the TDI cine loops, the RV longitudinal velocities were
measured and the baso-apical gradient was deduced. Doppler-derived
longitudinal strain of the RV free wall basal segment was also deter-
mined [21].
Mechanical dyssynchrony [23] was assessed looking for atrio-
ventricular dyssynchrony (mitral inflow duration b40% of cycle
length) as well as interventricular dyssynchrony (time delay between
the onset of the QRS and the onset of pulmonary and aortic outflows).
2.4. Intraventricular dyssynchrony analysis
1) LV pre-ejection period: the aforementioned time delay between
the QRS and the beginning of the aortic outflow (cut-off value for
dyssynchrony N140 ms).
2) Using TDI data, regions of interest were placed in the basal segments
from the 4-chamber view in all patients. Regions of interest were
manually adjustedwithin the segment in the longitudinal plane of the
LV andwithin thewall to identify themost reproducible peak velocity
during ejection. Time-to-peak data were derived from the time–
velocity curves. Dyssynchrony by TDI was determined as the
maximum time delay between peak-systolic velocities of basal septal
to lateral wall segments (BS-BL delaywith a cut-off valueN65 ms) [23]
3) Using 2D speckle tracking analysis, off-line analysis was performed
by means of commercial software (EchoPAC PC Dimension 6.0; GE
Vingmed Ultrasound AS, Horten, Norway). From an end-systolic
single frame, a region of interest was traced on the endocardial
cavity interface with a point-and-click approach. An automated
tracking algorithm then followed the endocardium from this single
frame throughout the cardiac cycle. Further adjustment of the
region of interest was performed to ensure that all myocardial
regions were included. Next, acoustic markers, the so-called
speckles, which were equally distributed in the region of interest,
were followed throughout the entire cardiac cycle. The distance
between the speckles was measured as a function of time, and
parameters of myocardial deformation were calculated. Finally,
the myocardium was divided into six segments that were then
color-coded and displayed as six segmental time–strain curves
exhibiting radial strain and longitudinal strain [24].
For radial dyssynchrony assessment, the time delay between peak
systolic strain of the anteroseptal wall and that of the posterior
segments (AS-P delay) was measured (cut-off N130 ms) [25].
For longitudinal dyssynchrony assessment, the 4-chamber view
was used to calculate the difference between time to peak-systolic
strain of themid-septal region and to that of themid-lateral wall (MS-
ML delay, cut-offN80 ms) [26]. Global longitudinal strain (%) was also
measured as a parameter of LV systolic function, especially as a
parameter of LV longitudinal function.
2.5. Statistical analysis
All variables were expressed asmean±standard deviation (mean±
SD). The Kolmogorov–Smirnov one-sample test for normality was
performed on each variable. As these tests showed a Gaussian
repartition, parametric tests were applied. A t-test for independent
samples was performed to compare the anthropometric and physiolog-
ical data between both groups. A Spearman testwas used to evaluate the
correlation between RV and LV function parameters. Intraobserver and
interobserver variabilities, as described by the coefficient of variation,
were assessed in 10 randomly selected subjects. Interobserver variability
was determined between 2 independent experienced sonographers.
Analyses were made using dedicated SPSS software. The threshold of
significance was set at pb0.05.
3. Results
3.1. Patient characteristics
The clinical characteristics and echocardiographic parameters of
the 40 patients (mean age 64±11 years, 28 men) are summarized in
290 A. Bernard et al. / International Journal of Cardiology 148 (2011) 289–294
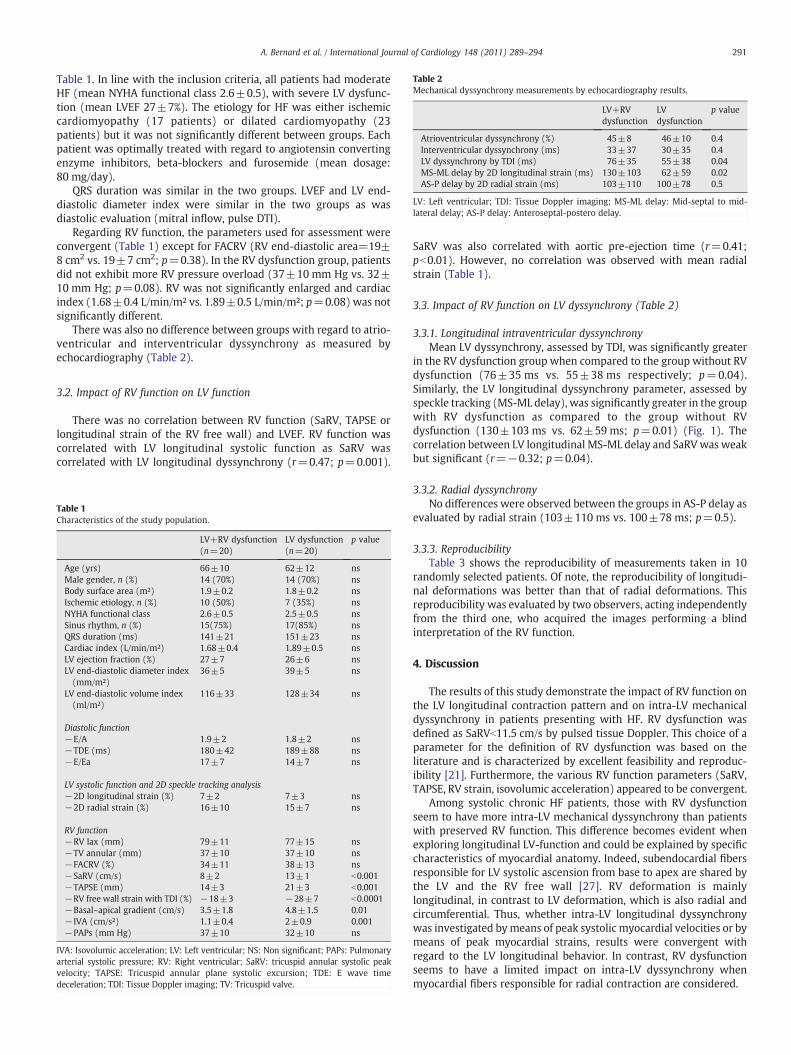
Table 1. In line with the inclusion criteria, all patients had moderate
HF (mean NYHA functional class 2.6±0.5), with severe LV dysfunc-
tion (mean LVEF 27±7%). The etiology for HF was either ischemic
cardiomyopathy (17 patients) or dilated cardiomyopathy (23
patients) but it was not significantly different between groups. Each
patient was optimally treated with regard to angiotensin converting
enzyme inhibitors, beta-blockers and furosemide (mean dosage:
80 mg/day).
QRS duration was similar in the two groups. LVEF and LV end-
diastolic diameter index were similar in the two groups as was
diastolic evaluation (mitral inflow, pulse DTI).
Regarding RV function, the parameters used for assessment were
convergent (Table 1) except for FACRV (RV end-diastolic area=19±
8 cm2 vs. 19±7 cm2; p=0.38). In the RV dysfunction group, patients
did not exhibit more RV pressure overload (37±10 mm Hg vs. 32±
10 mm Hg; p=0.08). RV was not significantly enlarged and cardiac
index (1.68±0.4 L/min/m² vs. 1.89±0.5 L/min/m²; p=0.08) was not
significantly different.
There was also no difference between groups with regard to atrio-
ventricular and interventricular dyssynchrony as measured by
echocardiography (Table 2).
3.2. Impact of RV function on LV function
There was no correlation between RV function (SaRV, TAPSE or
longitudinal strain of the RV free wall) and LVEF. RV function was
correlated with LV longitudinal systolic function as SaRV was
correlated with LV longitudinal dyssynchrony (r=0.47; p=0.001).
SaRV was also correlated with aortic pre-ejection time (r=0.41;
pb0.01). However, no correlation was observed with mean radial
strain (Table 1).
3.3. Impact of RV function on LV dyssynchrony (Table 2)
3.3.1. Longitudinal intraventricular dyssynchrony
Mean LV dyssynchrony, assessed by TDI, was significantly greater
in the RV dysfunction group when compared to the group without RV
dysfunction (76±35 ms vs. 55±38 ms respectively; p=0.04).
Similarly, the LV longitudinal dyssynchrony parameter, assessed by
speckle tracking (MS-ML delay), was significantly greater in the group
with RV dysfunction as compared to the group without RV
dysfunction (130±103 ms vs. 62±59 ms; p=0.01) (Fig. 1). The
correlation between LV longitudinal MS-ML delay and SaRVwas weak
but significant (r=−0.32; p=0.04).
3.3.2. Radial dyssynchrony
No differences were observed between the groups in AS-P delay as
evaluated by radial strain (103±110 ms vs. 100±78 ms; p=0.5).
3.3.3. Reproducibility
Table 3 shows the reproducibility of measurements taken in 10
randomly selected patients. Of note, the reproducibility of longitudi-
nal deformations was better than that of radial deformations. This
reproducibility was evaluated by two observers, acting independently
from the third one, who acquired the images performing a blind
interpretation of the RV function.
4. Discussion
The results of this study demonstrate the impact of RV function on
the LV longitudinal contraction pattern and on intra-LV mechanical
dyssynchrony in patients presenting with HF. RV dysfunction was
defined as SaRVb11.5 cm/s by pulsed tissue Doppler. This choice of a
parameter for the definition of RV dysfunction was based on the
literature and is characterized by excellent feasibility and reproduc-
ibility [21]. Furthermore, the various RV function parameters (SaRV,
TAPSE, RV strain, isovolumic acceleration) appeared to be convergent.
Among systolic chronic HF patients, those with RV dysfunction
seem to have more intra-LV mechanical dyssynchrony than patients
with preserved RV function. This difference becomes evident when
exploring longitudinal LV-function and could be explained by specific
characteristics of myocardial anatomy. Indeed, subendocardial fibers
responsible for LV systolic ascension from base to apex are shared by
the LV and the RV free wall [27]. RV deformation is mainly
longitudinal, in contrast to LV deformation, which is also radial and
circumferential. Thus, whether intra-LV longitudinal dyssynchrony
was investigated bymeans of peak systolic myocardial velocities or by
means of peak myocardial strains, results were convergent with
regard to the LV longitudinal behavior. In contrast, RV dysfunction
seems to have a limited impact on intra-LV dyssynchrony when
myocardial fibers responsible for radial contraction are considered.
Table 1
Characteristics of the study population.
LV+RV dysfunction
(n=20)
LV dysfunction
(n=20)
p value
Age (yrs) 66±10 62±12 ns
Male gender, n (%) 14 (70%) 14 (70%) ns
Body surface area (m²) 1.9±0.2 1.8±0.2 ns
Ischemic etiology, n (%) 10 (50%) 7 (35%) ns
NYHA functional class 2.6±0.5 2.5±0.5 ns
Sinus rhythm, n (%) 15(75%) 17(85%) ns
QRS duration (ms) 141±21 151±23 ns
Cardiac index (L/min/m²) 1.68±0.4 1.89±0.5 ns
LV ejection fraction (%) 27±7 26±6 ns
LV end-diastolic diameter index
(mm/m²)
36±5 39±5 ns
LV end-diastolic volume index
(ml/m²)
116±33 128±34 ns
Diastolic function
−E/A 1.9±2 1.8±2 ns
−TDE (ms) 180±42 189±88 ns
−E/Ea 17±7 14±7 ns
LV systolic function and 2D speckle tracking analysis
−2D longitudinal strain (%) 7±2 7±3 ns
−2D radial strain (%) 16±10 15±7 ns
RV function
−RV lax (mm) 79±11 77±15 ns
−TV annular (mm) 37±10 37±10 ns
−FACRV (%) 34±11 38±13 ns
−SaRV (cm/s) 8±2 13±1 b0.001
−TAPSE (mm) 14±3 21±3 b0.001
−RV free wall strain with TDI (%) −18±3 −28±7 b0.0001
−Basal–apical gradient (cm/s) 3.5±1.8 4.8±1.5 0.01
− IVA (cm/s²) 1.1±0.4 2±0.9 0.001
−PAPs (mm Hg) 37±10 32±10 ns
IVA: Isovolumic acceleration; LV: Left ventricular; NS: Non significant; PAPs: Pulmonary
arterial systolic pressure; RV: Right ventricular; SaRV: tricuspid annular systolic peak
velocity; TAPSE: Tricuspid annular plane systolic excursion; TDE: E wave time
deceleration; TDI: Tissue Doppler imaging; TV: Tricuspid valve.
Table 2
Mechanical dyssynchrony measurements by echocardiography results.
LV+RV
dysfunction
LV
dysfunction
p value
Atrioventricular dyssynchrony (%) 45±8 46±10 0.4
Interventricular dyssynchrony (ms) 33±37 30±35 0.4
LV dyssynchrony by TDI (ms) 76±35 55±38 0.04
MS-ML delay by 2D longitudinal strain (ms) 130±103 62±59 0.02
AS-P delay by 2D radial strain (ms) 103±110 100±78 0.5
LV: Left ventricular; TDI: Tissue Doppler imaging; MS-ML delay: Mid-septal to mid-
lateral delay; AS-P delay: Anteroseptal-postero delay.
291A. Bernard et al. / International Journal of Cardiology 148 (2011) 289–294
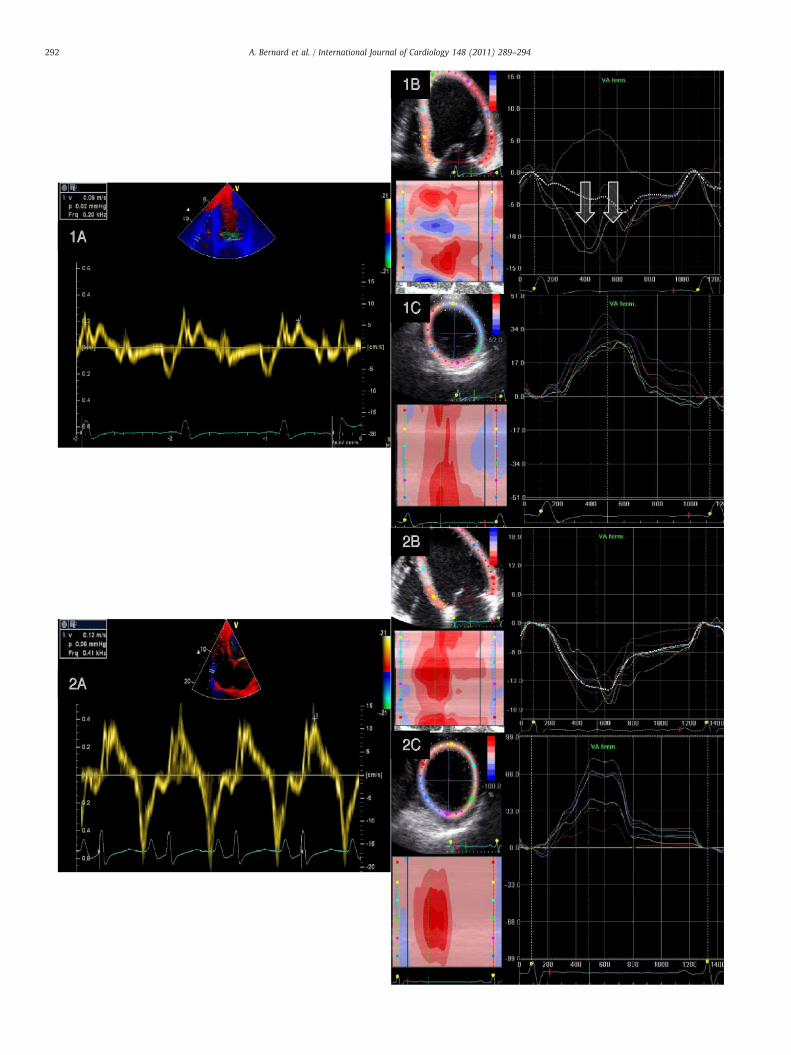
292 A. Bernard et al. / International Journal of Cardiology 148 (2011) 289–294
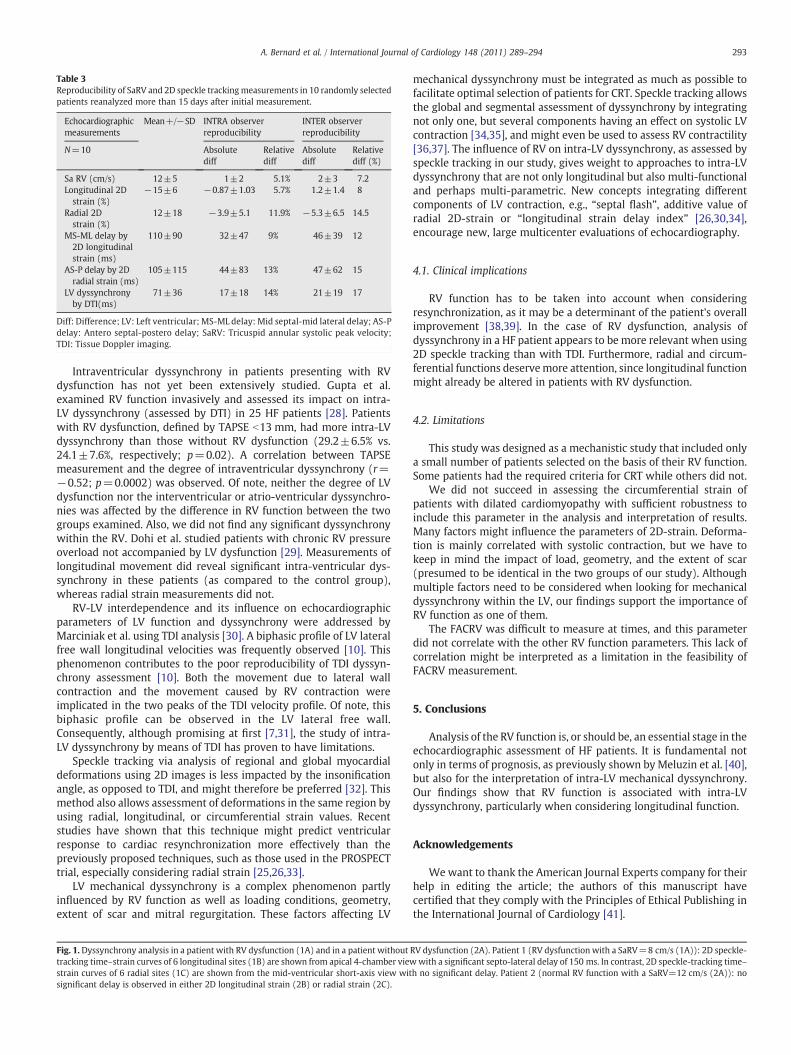
Intraventricular dyssynchrony in patients presenting with RV
dysfunction has not yet been extensively studied. Gupta et al.
examined RV function invasively and assessed its impact on intra-
LV dyssynchrony (assessed by DTI) in 25 HF patients [28]. Patients
with RV dysfunction, defined by TAPSE b13 mm, had more intra-LV
dyssynchrony than those without RV dysfunction (29.2±6.5% vs.
24.1±7.6%, respectively; p=0.02). A correlation between TAPSE
measurement and the degree of intraventricular dyssynchrony (r=
−0.52; p=0.0002) was observed. Of note, neither the degree of LV
dysfunction nor the interventricular or atrio-ventricular dyssynchro-
nies was affected by the difference in RV function between the two
groups examined. Also, we did not find any significant dyssynchrony
within the RV. Dohi et al. studied patients with chronic RV pressure
overload not accompanied by LV dysfunction [29]. Measurements of
longitudinal movement did reveal significant intra-ventricular dys-
synchrony in these patients (as compared to the control group),
whereas radial strain measurements did not.
RV-LV interdependence and its influence on echocardiographic
parameters of LV function and dyssynchrony were addressed by
Marciniak et al. using TDI analysis [30]. A biphasic profile of LV lateral
free wall longitudinal velocities was frequently observed [10]. This
phenomenon contributes to the poor reproducibility of TDI dyssyn-
chrony assessment [10]. Both the movement due to lateral wall
contraction and the movement caused by RV contraction were
implicated in the two peaks of the TDI velocity profile. Of note, this
biphasic profile can be observed in the LV lateral free wall.
Consequently, although promising at first [7,31], the study of intra-
LV dyssynchrony by means of TDI has proven to have limitations.
Speckle tracking via analysis of regional and global myocardial
deformations using 2D images is less impacted by the insonification
angle, as opposed to TDI, and might therefore be preferred [32]. This
method also allows assessment of deformations in the same region by
using radial, longitudinal, or circumferential strain values. Recent
studies have shown that this technique might predict ventricular
response to cardiac resynchronization more effectively than the
previously proposed techniques, such as those used in the PROSPECT
trial, especially considering radial strain [25,26,33].
LV mechanical dyssynchrony is a complex phenomenon partly
influenced by RV function as well as loading conditions, geometry,
extent of scar and mitral regurgitation. These factors affecting LV
mechanical dyssynchrony must be integrated as much as possible to
facilitate optimal selection of patients for CRT. Speckle tracking allows
the global and segmental assessment of dyssynchrony by integrating
not only one, but several components having an effect on systolic LV
contraction [34,35], and might even be used to assess RV contractility
[36,37]. The influence of RV on intra-LV dyssynchrony, as assessed by
speckle tracking in our study, gives weight to approaches to intra-LV
dyssynchrony that are not only longitudinal but also multi-functional
and perhaps multi-parametric. New concepts integrating different
components of LV contraction, e.g., “septal flash”, additive value of
radial 2D-strain or “longitudinal strain delay index” [26,30,34],
encourage new, large multicenter evaluations of echocardiography.
4.1. Clinical implications
RV function has to be taken into account when considering
resynchronization, as it may be a determinant of the patient's overall
improvement [38,39]. In the case of RV dysfunction, analysis of
dyssynchrony in a HF patient appears to be more relevant when using
2D speckle tracking than with TDI. Furthermore, radial and circum-
ferential functions deservemore attention, since longitudinal function
might already be altered in patients with RV dysfunction.
4.2. Limitations
This study was designed as a mechanistic study that included only
a small number of patients selected on the basis of their RV function.
Some patients had the required criteria for CRT while others did not.
We did not succeed in assessing the circumferential strain of
patients with dilated cardiomyopathy with sufficient robustness to
include this parameter in the analysis and interpretation of results.
Many factors might influence the parameters of 2D-strain. Deforma-
tion is mainly correlated with systolic contraction, but we have to
keep in mind the impact of load, geometry, and the extent of scar
(presumed to be identical in the two groups of our study). Although
multiple factors need to be considered when looking for mechanical
dyssynchrony within the LV, our findings support the importance of
RV function as one of them.
The FACRV was difficult to measure at times, and this parameter
did not correlate with the other RV function parameters. This lack of
correlation might be interpreted as a limitation in the feasibility of
FACRV measurement.
5. Conclusions
Analysis of the RV function is, or should be, an essential stage in the
echocardiographic assessment of HF patients. It is fundamental not
only in terms of prognosis, as previously shown by Meluzin et al. [40],
but also for the interpretation of intra-LV mechanical dyssynchrony.
Our findings show that RV function is associated with intra-LV
dyssynchrony, particularly when considering longitudinal function.
Acknowledgements
Wewant to thank the American Journal Experts company for their
help in editing the article; the authors of this manuscript have
certified that they comply with the Principles of Ethical Publishing in
the International Journal of Cardiology [41].
Table 3
Reproducibility of SaRV and 2D speckle trackingmeasurements in 10 randomly selected
patients reanalyzed more than 15 days after initial measurement.
Echocardiographic
measurements
Mean+/−SD INTRA observer
reproducibility
INTER observer
reproducibility
N=10 Absolute
diff
Relative
diff
Absolute
diff
Relative
diff (%)
Sa RV (cm/s) 12±5 1±2 5.1% 2±3 7.2
Longitudinal 2D
strain (%)
−15±6 −0.87±1.03 5.7% 1.2±1.4 8
Radial 2D
strain (%)
12±18 −3.9±5.1 11.9% −5.3±6.5 14.5
MS-ML delay by
2D longitudinal
strain (ms)
110±90 32±47 9% 46±39 12
AS-P delay by 2D
radial strain (ms)
105±115 44±83 13% 47±62 15
LV dyssynchrony
by DTI(ms)
71±36 17±18 14% 21±19 17
Diff: Difference; LV: Left ventricular; MS-ML delay: Mid septal-mid lateral delay; AS-P
delay: Antero septal-postero delay; SaRV: Tricuspid annular systolic peak velocity;
TDI: Tissue Doppler imaging.
Fig. 1. Dyssynchrony analysis in a patient with RV dysfunction (1A) and in a patient without RV dysfunction (2A). Patient 1 (RV dysfunction with a SaRV=8 cm/s (1A)): 2D speckle-
tracking time–strain curves of 6 longitudinal sites (1B) are shown from apical 4-chamber viewwith a significant septo-lateral delay of 150 ms. In contrast, 2D speckle-tracking time–
strain curves of 6 radial sites (1C) are shown from the mid-ventricular short-axis view with no significant delay. Patient 2 (normal RV function with a SaRV=12 cm/s (2A)): no
significant delay is observed in either 2D longitudinal strain (2B) or radial strain (2C).
293A. Bernard et al. / International Journal of Cardiology 148 (2011) 289–294
References
[1] Fuster V, Ryden LE, Cannom DS, et al. ACC/AHA/ESC 2006 Guidelines for theManagement of Patients with Atrial Fibrillation: a report of the American Collegeof Cardiology/American Heart Association Task Force on Practice Guidelines andthe European Society of Cardiology Committee for Practice Guidelines (WritingCommittee to Revise the 2001 Guidelines for the Management of Patients WithAtrial Fibrillation): developed in collaboration with the European Heart RhythmAssociation and the Heart Rhythm Society. Circulation 2006;114(7):e257–354.
[2] Dickstein K, Cohen-Solal A, Filippatos G, et al. ESC guidelines for the diagnosis andtreatment of acute and chronic heart failure 2008. Eur Heart J 2008;10(10):933–89.
[3] Bristow M, Saxon L, Boehmer J, et al. Cardiac-resynchronization therapy with orwithout an implantable defibrillator in advanced chronic heart failure. N Engl JMed 2004;350(21):2140–50.
[4] Cleland J, Daubert J, Erdmann E, et al. The effect of cardiac resynchronization onmorbidity and mortality in heart failure. N Engl J Med 2005;352(15):1539–49.
[5] Young J, Abraham W, Smith A, et al. Combined cardiac resynchronization andimplantable cardioversion defibrillation in advanced chronic heart failure: theMIRACLE ICD Trial. JAMA 2003;289(20):2685–94.
[6] Bax J, Abraham T, Barold S, et al. Cardiac resynchronization therapy: Part 1—issuesbefore device implantation. J Am Coll Cardiol 2005;46(12):2153–67.
[7] Bax J, Bleeker G, Marwick T, et al. Left ventricular dyssynchrony predicts responseand prognosis after cardiac resynchronization therapy. J Am Coll Cardiol 2004;44(9):1834–40.
[8] Dohi K, Suffoletto M, Schwartzman D, Ganz L, Pinsky M, Gorcsan J. Utility ofechocardiographic radial strain imaging to quantify left ventricular dyssynchronyand predict acute response to cardiac resynchronization therapy. Am J Cardiol2005;96(1):112–6.
[9] Pitzalis M, Iacoviello M, Romito R, et al. Ventricular asynchrony predicts a betteroutcome in patients with chronic heart failure receiving cardiac resynchronizationtherapy. J Am Coll Cardiol 2005;45(1):65–9.
[10] Chung E, Leon A, Tavazzi L, et al. Results of the predictors of response to CRT(PROSPECT) trial. Circulation 2008;117(20):2608–16.
[11] Di Salvo T, Mathier M, Semigran M, Dec G. Preserved right ventricular ejectionfraction predicts exercise capacity and survival in advanced heart failure. J Am CollCardiol 1995;25(5):1143–53.
[12] Juilliere Y, Trochu J, de Groote P, et al. Heart failure with preserved systolicfunction: a diagnostic algorithm for a pragmatic definition. Arch Mal Coeur Vaiss2006;99(4):279–86.
[13] Dong S, Smith E, Tyberg J. Changes in the radius of curvature of the ventricularseptum at end diastole during pulmonary arterial and aortic constrictions in thedog. Circulation 1992;86(4):1280–90.
[14] Popescu BA, Antonini-Canterin F, Temporelli PL, et al. Right ventricular functionalrecovery after acute myocardial infarction: relation with left ventricular functionand interventricular septum motion. GISSI-3 echo substudy. Heart 2005;91:484–8.
[15] Beyar R, Dong SJ, Smith ER, Belenkie I, Tyberg JV. Ventricular interaction and septaldeformation: a model compared with experimental data. Am J Physiol 1993;265:H2044–56.
[16] Damiano Jr RJ, La Follette P, Jr Cox JL, Lowe JE, Santamore WP. Significant leftventricular contribution to right ventricular systolic function. Am J Physiol1991;261:H1514–24.
[17] Meluzin J, Spiranova L, Bakala J, Toman J, Krejci J, Hude P. Pulsed Doppler tissueimaging of the velocity of tricuspid annular systolic motion. Eur Heart J 2001;22(4):340–8.
[18] Lang R, Bierig M, Devereux R, et al. Recommendations for chamber quantification.Eur J Echocardiogr 2006;7(2):79–108.
[19] Garcia M, Thomas J, Klein A. New Doppler echocardiographic applications for thestudy of diastolic function. J Am Coll Cardiol 1998;32(4):865–75.
[20] Quinones M, Otto C, Stoddard M, Waggoner A, Zoghbi W. Recommendations forquantification of Doppler echocardiography: a report from the Doppler Quantifica-tion Task Force of the Nomenclature and Standards Committee of the AmericanSociety of Echocardiography. J Am Soc Echocardiogr 2002;15(2):167–84.
[21] Bleeker G, Steendijk P, Holman E, et al. Assessing right ventricular function:the role of echocardiography and complementary technologies. Heart 2006;92(Suppl I):i19–26.
[22] Vogel M, Schmidt M, Kristiansen S, et al. Validation of myocardial accelerationduring isovolumic contraction as a novel noninvasive index of right ventricularcontractility. Circulation 2002;105(14):1693–9.
[23] Gorcsan J, Abraham T, Agler D, et al. Echocardiography for cardiac resynchroniza-tion therapy: recommendations for performance and reporting—a report from theAmerican Society of Echocardiography Dyssynchrony Writing Group Endorsed bythe Heart Rhythm Society. J Am Soc Echocardiogr 2008;21:191–213.
[24] Perk G, Tunick P, Kronzon I. Non-Doppler two-dimensional strain imaging byechocardiography—from technical considerations to clinical applications. J Am SocEchocardiogr 2007;20(3):234–43.
[25] Suffoletto M, Dohi K, Cannesson M, Saba S, Gorcsan J. novel speckle-tracking radialstrain from routine black-and-white echocardiographic images to quantify dyssyn-chrony and predict response to cardiac resynchronization therapy. Circulation2006;113(7):960–8.
[26] Gorcsan J, Tanabe M, Bleeker G, et al. Combined longitudinal and radialdyssynchrony predicts ventricular response after resynchronization therapy.J Am Coll Cardiol 2007;50:1476–83.
[27] Scollan DF, Holmes A, Zhang J, Winslow RL. Reconstruction of cardiac ventriculargeometry and fiber orientation using magnetic resonance imaging. Ann BiomedEng 2000;28(8):934–44.
[28] Gupta S, Khan F, Shapiro M, Weeks SG, Litwin SE, Michaels AD. The associationsbetween tricuspid annular plane systolic excursion (TAPSE), ventricular dyssyn-chrony, and ventricular interaction in heart failure patients. Eur J Echocardiogr2008 Nov;9(6):766–71.
[29] Dohi K, Onishi K, Gorcsan J, et al. Role of radial strain and displacement imaging toquantify wall motion dyssynchrony and chronic right ventricular pressureoverload. Am J Cardiol 2008;101(8):1206–12.
[30] Marciniak M, Bijnens B, Baltabaeva A, et al. Interventricular interaction as apossible mechanism for the presence of a biphasic systolic velocity profile innormal left ventricular free walls. Heart 2008;94(8):1058–64.
[31] Yu C, Chau E, Sanderson J, et al. Tissue Doppler echocardiographic evidence ofreverse remodeling and improved synchronicity by simultaneously delayingregional contraction after biventricular pacing therapy in heart failure. Circulation2002;105(4):438–45.
[32] Leitman M, Lysyansky P, Sidenko S, et al. Two-dimensional strain—a novelsoftware for real-time quantitative echocardiographic assessment of myocardialfunction. J Am Soc Echocardiogr 2004;17(10):1021–9.
[33] Delgado V, Ypenburg C, van Bommel R, et al. Assessment of left ventriculardyssynchrony by speckle tracking strain imaging. J Am Coll Cardiol 2008;51(20):1944–52.
[34] Lim P, Buakhamsri A, Popovic Z, et al. Longitudinal strain delay index by speckletracking imaging: a newmarker of response to cardiac resynchronization therapy.Circulation 2008;118(11):1130–7.
[35] Parsai C, Bijnens B, Sutherland G, et al. Toward understanding response to cardiacresynchronization therapy: left ventricular dyssynchrony is only one of multiplemechanisms. Eur Heart J 2009;30(8):940–9.
[36] Lindqvist P, Calcutteea A, Henein M. Echocardiography in the assessment of rightheart function. Eur J Echocardiogr 2008;9(2):225–34.
[37] Pirat B, McCulloch M, ZoghbiW. Evaluation of global and regional right ventricularsystolic function in patients with pulmonary hypertension using a novel speckletracking method. Am J Cardiol 2006;98(5):699–704.
[38] Yu C, Bleeker G, Fung J, et al. Left ventricular reverse remodeling but not clinicalimprovement predicts long-term survival after cardiac resynchronization therapy.Circulation 2005;112(11):1580–6.
[39] Donal E, Thibault H, Bergerot C, et al. Right ventricular pump function is earlyimproved by resynchronization therapy: a strain imaging study. Arch CardiovascDis 2008;101(7–8):475–84.
[40] Meluzin J, Spinarová L, Hude P, et al. Prognostic importance of various echocardio-graphic right ventricular functional parameters in patients with symptomatic heartfailure. J Am Soc Echocardiogr 2005;18:435–44.
[41] Coats AJ. Ethical authorship and publishing. Int J Cardiol 2009;131:149–50.
294 A. Bernard et al. / International Journal of Cardiology 148 (2011) 289–294
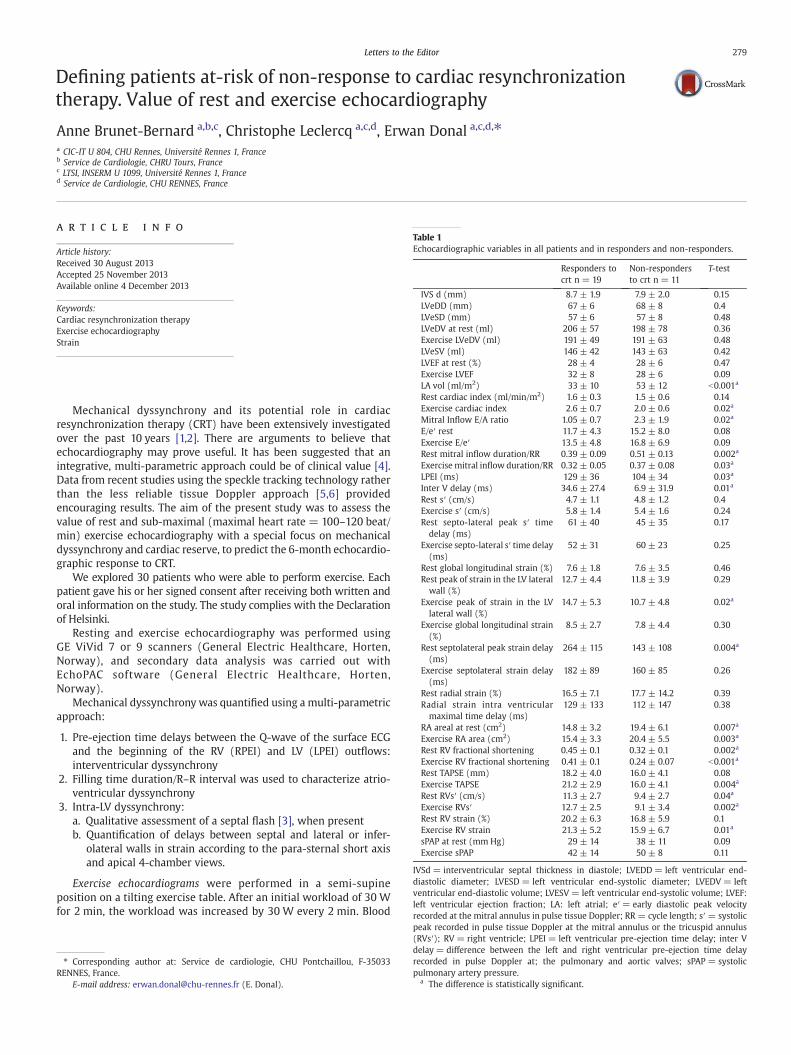
Defining patients at-risk of non-response to cardiac resynchronizationtherapy. Value of rest and exercise echocardiography
Anne Brunet-Bernard a,b,c, Christophe Leclercq a,c,d, Erwan Donal a,c,d,⁎a CIC-IT U 804, CHU Rennes, Université Rennes 1, Franceb Service de Cardiologie, CHRU Tours, Francec LTSI, INSERM U 1099, Université Rennes 1, Franced Service de Cardiologie, CHU RENNES, France
a r t i c l e i n f o
Article history:
Received 30 August 2013
Accepted 25 November 2013
Available online 4 December 2013
Keywords:
Cardiac resynchronization therapy
Exercise echocardiography
Strain
Mechanical dyssynchrony and its potential role in cardiac
resynchronization therapy (CRT) have been extensively investigated
over the past 10 years [1,2]. There are arguments to believe that
echocardiography may prove useful. It has been suggested that an
integrative, multi-parametric approach could be of clinical value [4].
Data from recent studies using the speckle tracking technology rather
than the less reliable tissue Doppler approach [5,6] provided
encouraging results. The aim of the present study was to assess the
value of rest and sub-maximal (maximal heart rate = 100–120 beat/
min) exercise echocardiography with a special focus on mechanical
dyssynchrony and cardiac reserve, to predict the 6-month echocardio-
graphic response to CRT.
We explored 30 patients who were able to perform exercise. Each
patient gave his or her signed consent after receiving both written and
oral information on the study. The study complies with the Declaration
of Helsinki.
Resting and exercise echocardiography was performed using
GE ViVid 7 or 9 scanners (General Electric Healthcare, Horten,
Norway), and secondary data analysis was carried out with
EchoPAC software (General Electric Healthcare, Horten,
Norway).
Mechanical dyssynchrony was quantified using a multi-parametric
approach:
1. Pre-ejection time delays between the Q-wave of the surface ECG
and the beginning of the RV (RPEI) and LV (LPEI) outflows:
interventricular dyssynchrony
2. Filling time duration/R–R interval was used to characterize atrio-
ventricular dyssynchrony
3. Intra-LV dyssynchrony:
a. Qualitative assessment of a septal flash [3], when present
b. Quantification of delays between septal and lateral or infer-
olateral walls in strain according to the para-sternal short axis
and apical 4-chamber views.
Exercise echocardiograms were performed in a semi-supine
position on a tilting exercise table. After an initial workload of 30 W
for 2 min, the workload was increased by 30 W every 2 min. Blood
⁎ Corresponding author at: Service de cardiologie, CHU Pontchaillou, F-35033
RENNES, France.
E-mail address: [email protected] (E. Donal).
Table 1
Echocardiographic variables in all patients and in responders and non-responders.
Responders to
crt n = 19
Non-responders
to crt n = 11
T-test
IVS d (mm) 8.7 ± 1.9 7.9 ± 2.0 0.15
LVeDD (mm) 67 ± 6 68 ± 8 0.4
LVeSD (mm) 57 ± 6 57 ± 8 0.48
LVeDV at rest (ml) 206 ± 57 198 ± 78 0.36
Exercise LVeDV (ml) 191 ± 49 191 ± 63 0.48
LVeSV (ml) 146 ± 42 143 ± 63 0.42
LVEF at rest (%) 28 ± 4 28 ± 6 0.47
Exercise LVEF 32 ± 8 28 ± 6 0.09
LA vol (ml/m2) 33 ± 10 53 ± 12 b0.001a
Rest cardiac index (ml/min/m2) 1.6 ± 0.3 1.5 ± 0.6 0.14
Exercise cardiac index 2.6 ± 0.7 2.0 ± 0.6 0.02a
Mitral Inflow E/A ratio 1.05 ± 0.7 2.3 ± 1.9 0.02a
E/e′ rest 11.7 ± 4.3 15.2 ± 8.0 0.08
Exercise E/e′ 13.5 ± 4.8 16.8 ± 6.9 0.09
Rest mitral inflow duration/RR 0.39 ± 0.09 0.51 ± 0.13 0.002a
Exercise mitral inflow duration/RR 0.32 ± 0.05 0.37 ± 0.08 0.03a
LPEI (ms) 129 ± 36 104 ± 34 0.03a
Inter V delay (ms) 34.6 ± 27.4 6.9 ± 31.9 0.01a
Rest s′ (cm/s) 4.7 ± 1.1 4.8 ± 1.2 0.4
Exercise s′ (cm/s) 5.8 ± 1.4 5.4 ± 1.6 0.24
Rest septo-lateral peak s′ time
delay (ms)
61 ± 40 45 ± 35 0.17
Exercise septo-lateral s′ time delay
(ms)
52 ± 31 60 ± 23 0.25
Rest global longitudinal strain (%) 7.6 ± 1.8 7.6 ± 3.5 0.46
Rest peak of strain in the LV lateral
wall (%)
12.7 ± 4.4 11.8 ± 3.9 0.29
Exercise peak of strain in the LV
lateral wall (%)
14.7 ± 5.3 10.7 ± 4.8 0.02a
Exercise global longitudinal strain
(%)
8.5 ± 2.7 7.8 ± 4.4 0.30
Rest septolateral peak strain delay
(ms)
264 ± 115 143 ± 108 0.004a
Exercise septolateral strain delay
(ms)
182 ± 89 160 ± 85 0.26
Rest radial strain (%) 16.5 ± 7.1 17.7 ± 14.2 0.39
Radial strain intra ventricular
maximal time delay (ms)
129 ± 133 112 ± 147 0.38
RA areal at rest (cm2) 14.8 ± 3.2 19.4 ± 6.1 0.007a
Exercise RA area (cm2) 15.4 ± 3.3 20.4 ± 5.5 0.003a
Rest RV fractional shortening 0.45 ± 0.1 0.32 ± 0.1 0.002a
Exercise RV fractional shortening 0.41 ± 0.1 0.24 ± 0.07 b0.001a
Rest TAPSE (mm) 18.2 ± 4.0 16.0 ± 4.1 0.08
Exercise TAPSE 21.2 ± 2.9 16.0 ± 4.1 0.004a
Rest RVs′ (cm/s) 11.3 ± 2.7 9.4 ± 2.7 0.04a
Exercise RVs′ 12.7 ± 2.5 9.1 ± 3.4 0.002a
Rest RV strain (%) 20.2 ± 6.3 16.8 ± 5.9 0.1
Exercise RV strain 21.3 ± 5.2 15.9 ± 6.7 0.01a
sPAP at rest (mm Hg) 29 ± 14 38 ± 11 0.09
Exercise sPAP 42 ± 14 50 ± 8 0.11
IVSd = interventricular septal thickness in diastole; LVEDD= left ventricular end-
diastolic diameter; LVESD = left ventricular end-systolic diameter; LVEDV= left
ventricular end-diastolic volume; LVESV = left ventricular end-systolic volume; LVEF:
left ventricular ejection fraction; LA: left atrial; e′= early diastolic peak velocity
recorded at the mitral annulus in pulse tissue Doppler; RR = cycle length; s′ = systolic
peak recorded in pulse tissue Doppler at the mitral annulus or the tricuspid annulus
(RVs′); RV = right ventricle; LPEI = left ventricular pre-ejection time delay; inter V
delay = difference between the left and right ventricular pre-ejection time delay
recorded in pulse Doppler at; the pulmonary and aortic valves; sPAP = systolic
pulmonary artery pressure.a The difference is statistically significant.
279Letters to the Editor
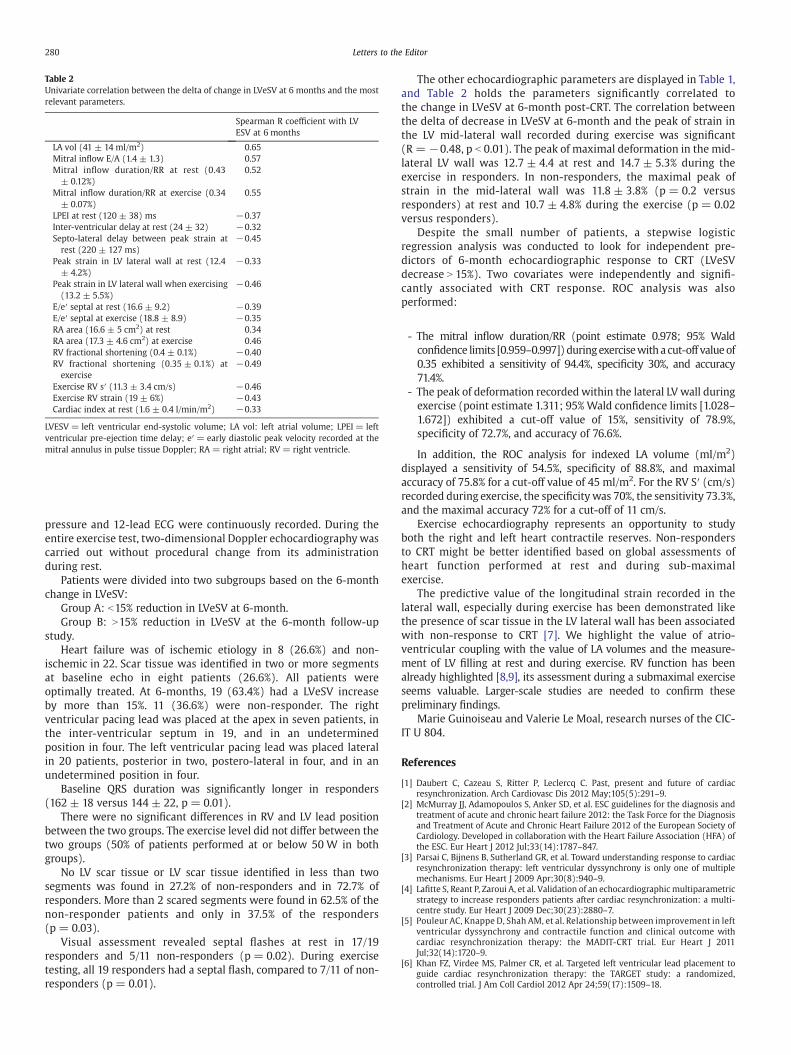
pressure and 12-lead ECG were continuously recorded. During the
entire exercise test, two-dimensional Doppler echocardiography was
carried out without procedural change from its administration
during rest.
Patients were divided into two subgroups based on the 6-month
change in LVeSV:
Group A: b15% reduction in LVeSV at 6-month.
Group B: N15% reduction in LVeSV at the 6-month follow-up
study.
Heart failure was of ischemic etiology in 8 (26.6%) and non-
ischemic in 22. Scar tissue was identified in two or more segments
at baseline echo in eight patients (26.6%). All patients were
optimally treated. At 6-months, 19 (63.4%) had a LVeSV increase
by more than 15%. 11 (36.6%) were non-responder. The right
ventricular pacing lead was placed at the apex in seven patients, in
the inter-ventricular septum in 19, and in an undetermined
position in four. The left ventricular pacing lead was placed lateral
in 20 patients, posterior in two, postero-lateral in four, and in an
undetermined position in four.
Baseline QRS duration was significantly longer in responders
(162 ± 18 versus 144 ± 22, p = 0.01).
There were no significant differences in RV and LV lead position
between the two groups. The exercise level did not differ between the
two groups (50% of patients performed at or below 50 W in both
groups).
No LV scar tissue or LV scar tissue identified in less than two
segments was found in 27.2% of non-responders and in 72.7% of
responders. More than 2 scared segments were found in 62.5% of the
non-responder patients and only in 37.5% of the responders
(p = 0.03).
Visual assessment revealed septal flashes at rest in 17/19
responders and 5/11 non-responders (p = 0.02). During exercise
testing, all 19 responders had a septal flash, compared to 7/11 of non-
responders (p = 0.01).
The other echocardiographic parameters are displayed in Table 1,
and Table 2 holds the parameters significantly correlated to
the change in LVeSV at 6-month post-CRT. The correlation between
the delta of decrease in LVeSV at 6-month and the peak of strain in
the LV mid-lateral wall recorded during exercise was significant
(R =−0.48, p b 0.01). The peak of maximal deformation in the mid-
lateral LV wall was 12.7 ± 4.4 at rest and 14.7 ± 5.3% during the
exercise in responders. In non-responders, the maximal peak of
strain in the mid-lateral wall was 11.8 ± 3.8% (p = 0.2 versus
responders) at rest and 10.7 ± 4.8% during the exercise (p = 0.02
versus responders).
Despite the small number of patients, a stepwise logistic
regression analysis was conducted to look for independent pre-
dictors of 6-month echocardiographic response to CRT (LVeSV
decrease N 15%). Two covariates were independently and signifi-
cantly associated with CRT response. ROC analysis was also
performed:
- The mitral inflow duration/RR (point estimate 0.978; 95% Wald
confidence limits [0.959–0.997]) duringexercisewith a cut-off valueof
0.35 exhibited a sensitivity of 94.4%, specificity 30%, and accuracy
71.4%.
- The peak of deformation recorded within the lateral LV wall during
exercise (point estimate 1.311; 95%Wald confidence limits [1.028–
1.672]) exhibited a cut-off value of 15%, sensitivity of 78.9%,
specificity of 72.7%, and accuracy of 76.6%.
In addition, the ROC analysis for indexed LA volume (ml/m2)
displayed a sensitivity of 54.5%, specificity of 88.8%, and maximal
accuracy of 75.8% for a cut-off value of 45 ml/m2. For the RV S′ (cm/s)
recorded during exercise, the specificity was 70%, the sensitivity 73.3%,
and the maximal accuracy 72% for a cut-off of 11 cm/s.
Exercise echocardiography represents an opportunity to study
both the right and left heart contractile reserves. Non-responders
to CRT might be better identified based on global assessments of
heart function performed at rest and during sub-maximal
exercise.
The predictive value of the longitudinal strain recorded in the
lateral wall, especially during exercise has been demonstrated like
the presence of scar tissue in the LV lateral wall has been associated
with non-response to CRT [7]. We highlight the value of atrio-
ventricular coupling with the value of LA volumes and the measure-
ment of LV filling at rest and during exercise. RV function has been
already highlighted [8,9], its assessment during a submaximal exercise
seems valuable. Larger-scale studies are needed to confirm these
preliminary findings.
Marie Guinoiseau and Valerie Le Moal, research nurses of the CIC-
IT U 804.
References
[1] Daubert C, Cazeau S, Ritter P, Leclercq C. Past, present and future of cardiacresynchronization. Arch Cardiovasc Dis 2012 May;105(5):291–9.
[2] McMurray JJ, Adamopoulos S, Anker SD, et al. ESC guidelines for the diagnosis andtreatment of acute and chronic heart failure 2012: the Task Force for the Diagnosisand Treatment of Acute and Chronic Heart Failure 2012 of the European Society ofCardiology. Developed in collaboration with the Heart Failure Association (HFA) ofthe ESC. Eur Heart J 2012 Jul;33(14):1787–847.
[3] Parsai C, Bijnens B, Sutherland GR, et al. Toward understanding response to cardiacresynchronization therapy: left ventricular dyssynchrony is only one of multiplemechanisms. Eur Heart J 2009 Apr;30(8):940–9.
[4] Lafitte S, Reant P, Zaroui A, et al. Validation of an echocardiographic multiparametricstrategy to increase responders patients after cardiac resynchronization: a multi-centre study. Eur Heart J 2009 Dec;30(23):2880–7.
[5] Pouleur AC, Knappe D, Shah AM, et al. Relationship between improvement in leftventricular dyssynchrony and contractile function and clinical outcome withcardiac resynchronization therapy: the MADIT-CRT trial. Eur Heart J 2011Jul;32(14):1720–9.
[6] Khan FZ, Virdee MS, Palmer CR, et al. Targeted left ventricular lead placement toguide cardiac resynchronization therapy: the TARGET study: a randomized,controlled trial. J Am Coll Cardiol 2012 Apr 24;59(17):1509–18.
Table 2
Univariate correlation between the delta of change in LVeSV at 6 months and the most
relevant parameters.
Spearman R coefficient with LV
ESV at 6 months
LA vol (41 ± 14 ml/m2) 0.65
Mitral inflow E/A (1.4 ± 1.3) 0.57
Mitral inflow duration/RR at rest (0.43
± 0.12%)
0.52
Mitral inflow duration/RR at exercise (0.34
± 0.07%)
0.55
LPEI at rest (120 ± 38) ms −0.37
Inter-ventricular delay at rest (24 ± 32) −0.32
Septo-lateral delay between peak strain at
rest (220 ± 127 ms)
−0.45
Peak strain in LV lateral wall at rest (12.4
± 4.2%)
−0.33
Peak strain in LV lateral wall when exercising
(13.2 ± 5.5%)
−0.46
E/e′ septal at rest (16.6 ± 9.2) −0.39
E/e′ septal at exercise (18.8 ± 8.9) −0.35
RA area (16.6 ± 5 cm2) at rest 0.34
RA area (17.3 ± 4.6 cm2) at exercise 0.46
RV fractional shortening (0.4 ± 0.1%) −0.40
RV fractional shortening (0.35 ± 0.1%) at
exercise
−0.49
Exercise RV s′ (11.3 ± 3.4 cm/s) −0.46
Exercise RV strain (19 ± 6%) −0.43
Cardiac index at rest (1.6 ± 0.4 l/min/m2) −0.33
LVESV = left ventricular end-systolic volume; LA vol: left atrial volume; LPEI = left
ventricular pre-ejection time delay; e′= early diastolic peak velocity recorded at the
mitral annulus in pulse tissue Doppler; RA = right atrial; RV = right ventricle.
280 Letters to the Editor
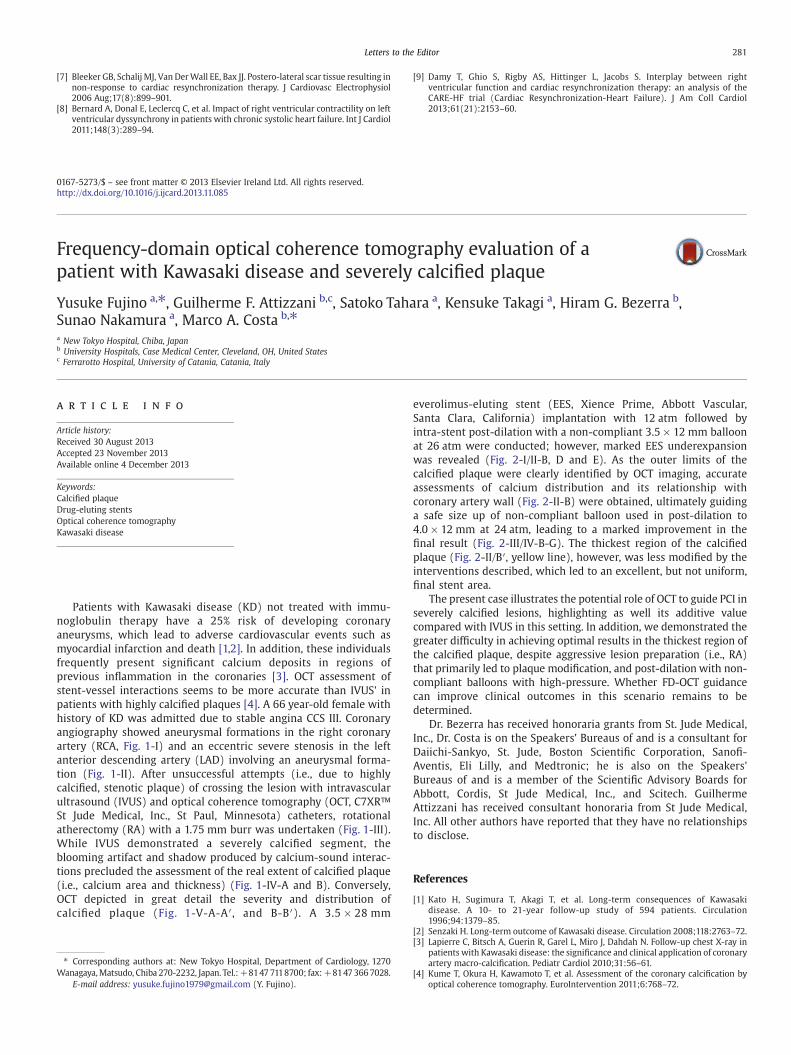
[7] Bleeker GB, Schalij MJ, Van DerWall EE, Bax JJ. Postero-lateral scar tissue resulting innon-response to cardiac resynchronization therapy. J Cardiovasc Electrophysiol2006 Aug;17(8):899–901.
[8] Bernard A, Donal E, Leclercq C, et al. Impact of right ventricular contractility on leftventricular dyssynchrony in patients with chronic systolic heart failure. Int J Cardiol2011;148(3):289–94.
[9] Damy T, Ghio S, Rigby AS, Hittinger L, Jacobs S. Interplay between rightventricular function and cardiac resynchronization therapy: an analysis of theCARE-HF trial (Cardiac Resynchronization-Heart Failure). J Am Coll Cardiol2013;61(21):2153–60.
0167-5273/$ – see front matter © 2013 Elsevier Ireland Ltd. All rights reserved.http://dx.doi.org/10.1016/j.ijcard.2013.11.085
Frequency-domain optical coherence tomography evaluation of apatient with Kawasaki disease and severely calcified plaque
Yusuke Fujino a,⁎, Guilherme F. Attizzani b,c, Satoko Tahara a, Kensuke Takagi a, Hiram G. Bezerra b,Sunao Nakamura a, Marco A. Costa b,⁎
a New Tokyo Hospital, Chiba, Japanb University Hospitals, Case Medical Center, Cleveland, OH, United Statesc Ferrarotto Hospital, University of Catania, Catania, Italy
a r t i c l e i n f o
Article history:
Received 30 August 2013
Accepted 23 November 2013
Available online 4 December 2013
Keywords:
Calcified plaque
Drug-eluting stents
Optical coherence tomography
Kawasaki disease
Patients with Kawasaki disease (KD) not treated with immu-
noglobulin therapy have a 25% risk of developing coronary
aneurysms, which lead to adverse cardiovascular events such as
myocardial infarction and death [1,2]. In addition, these individuals
frequently present significant calcium deposits in regions of
previous inflammation in the coronaries [3]. OCT assessment of
stent-vessel interactions seems to be more accurate than IVUS' in
patients with highly calcified plaques [4]. A 66 year-old female with
history of KD was admitted due to stable angina CCS III. Coronary
angiography showed aneurysmal formations in the right coronary
artery (RCA, Fig. 1-I) and an eccentric severe stenosis in the left
anterior descending artery (LAD) involving an aneurysmal forma-
tion (Fig. 1-II). After unsuccessful attempts (i.e., due to highly
calcified, stenotic plaque) of crossing the lesion with intravascular
ultrasound (IVUS) and optical coherence tomography (OCT, C7XR™
St Jude Medical, Inc., St Paul, Minnesota) catheters, rotational
atherectomy (RA) with a 1.75 mm burr was undertaken (Fig. 1-III).
While IVUS demonstrated a severely calcified segment, the
blooming artifact and shadow produced by calcium-sound interac-
tions precluded the assessment of the real extent of calcified plaque
(i.e., calcium area and thickness) (Fig. 1-IV-A and B). Conversely,
OCT depicted in great detail the severity and distribution of
calcified plaque (Fig. 1-V-A-A′, and B-B′). A 3.5 × 28 mm
everolimus-eluting stent (EES, Xience Prime, Abbott Vascular,
Santa Clara, California) implantation with 12 atm followed by
intra-stent post-dilation with a non-compliant 3.5 × 12 mm balloon
at 26 atm were conducted; however, marked EES underexpansion
was revealed (Fig. 2-I/II-B, D and E). As the outer limits of the
calcified plaque were clearly identified by OCT imaging, accurate
assessments of calcium distribution and its relationship with
coronary artery wall (Fig. 2-II-B) were obtained, ultimately guiding
a safe size up of non-compliant balloon used in post-dilation to
4.0 × 12 mm at 24 atm, leading to a marked improvement in the
final result (Fig. 2-III/IV-B-G). The thickest region of the calcified
plaque (Fig. 2-II/B′, yellow line), however, was less modified by the
interventions described, which led to an excellent, but not uniform,
final stent area.
The present case illustrates the potential role of OCT to guide PCI in
severely calcified lesions, highlighting as well its additive value
compared with IVUS in this setting. In addition, we demonstrated the
greater difficulty in achieving optimal results in the thickest region of
the calcified plaque, despite aggressive lesion preparation (i.e., RA)
that primarily led to plaque modification, and post-dilation with non-
compliant balloons with high-pressure. Whether FD-OCT guidance
can improve clinical outcomes in this scenario remains to be
determined.
Dr. Bezerra has received honoraria grants from St. Jude Medical,
Inc., Dr. Costa is on the Speakers' Bureaus of and is a consultant for
Daiichi-Sankyo, St. Jude, Boston Scientific Corporation, Sanofi-
Aventis, Eli Lilly, and Medtronic; he is also on the Speakers'
Bureaus of and is a member of the Scientific Advisory Boards for
Abbott, Cordis, St Jude Medical, Inc., and Scitech. Guilherme
Attizzani has received consultant honoraria from St Jude Medical,
Inc. All other authors have reported that they have no relationships
to disclose.
References
[1] Kato H, Sugimura T, Akagi T, et al. Long-term consequences of Kawasakidisease. A 10- to 21-year follow-up study of 594 patients. Circulation1996;94:1379–85.
[2] Senzaki H. Long-term outcome of Kawasaki disease. Circulation 2008;118:2763–72.[3] Lapierre C, Bitsch A, Guerin R, Garel L, Miro J, Dahdah N. Follow-up chest X-ray in
patients with Kawasaki disease: the significance and clinical application of coronaryartery macro-calcification. Pediatr Cardiol 2010;31:56–61.
[4] Kume T, Okura H, Kawamoto T, et al. Assessment of the coronary calcification byoptical coherence tomography. EuroIntervention 2011;6:768–72.
⁎ Corresponding authors at: New Tokyo Hospital, Department of Cardiology, 1270
Wanagaya,Matsudo, Chiba 270-2232, Japan. Tel.:+8147 7118700; fax:+81473667028.
E-mail address: [email protected] (Y. Fujino).
281Letters to the Editor
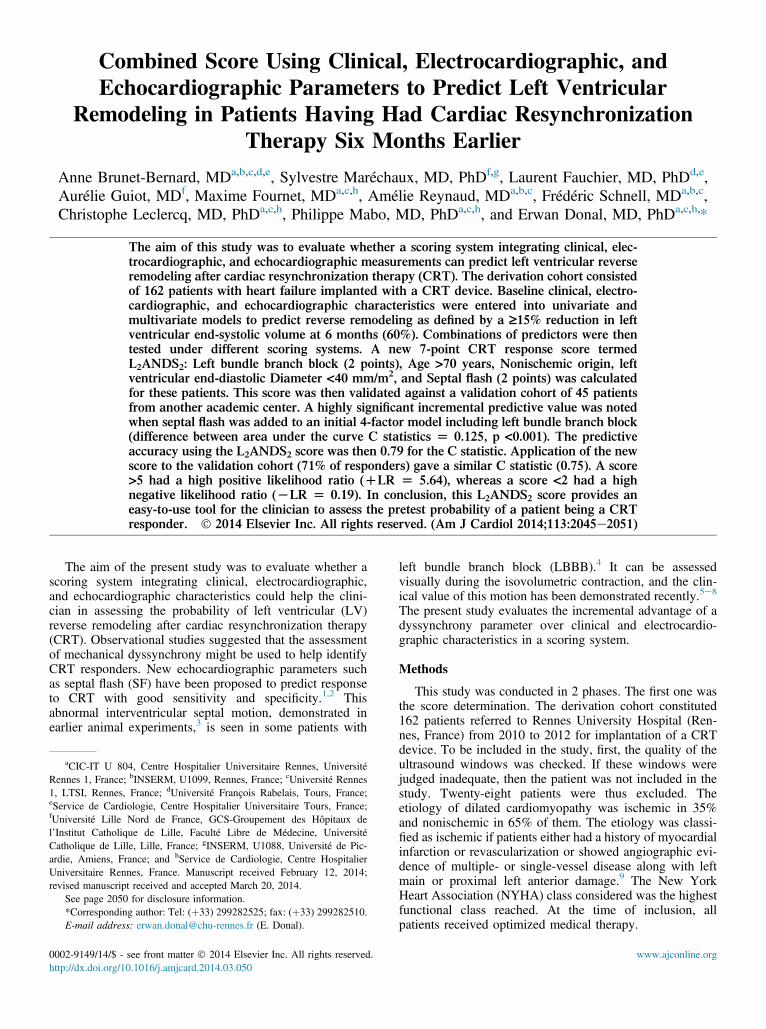
Combined Score Using Clinical, Electrocardiographic, and
Echocardiographic Parameters to Predict Left Ventricular
Remodeling in Patients Having Had Cardiac Resynchronization
Therapy Six Months Earlier
Anne Brunet-Bernard, MDa,b,c,d,e, Sylvestre Maréchaux, MD, PhDf,g, Laurent Fauchier, MD, PhDd,e,Aurélie Guiot, MDf, Maxime Fournet, MDa,c,h, Amélie Reynaud, MDa,b,c, Frédéric Schnell, MDa,b,c,Christophe Leclercq, MD, PhDa,c,h, Philippe Mabo, MD, PhDa,c,h, and Erwan Donal, MD, PhDa,c,h,*
The aim of this study was to evaluate whether a scoring system integrating clinical, elec-trocardiographic, and echocardiographic measurements can predict left ventricular reverseremodeling after cardiac resynchronization therapy (CRT). The derivation cohort consistedof 162 patients with heart failure implanted with a CRT device. Baseline clinical, electro-cardiographic, and echocardiographic characteristics were entered into univariate andmultivariate models to predict reverse remodeling as defined by a ‡15% reduction in leftventricular end-systolic volume at 6 months (60%). Combinations of predictors were thentested under different scoring systems. A new 7-point CRT response score termedL2ANDS2: Left bundle branch block (2 points), Age >70 years, Nonischemic origin, leftventricular end-diastolic Diameter <40 mm/m2, and Septal flash (2 points) was calculatedfor these patients. This score was then validated against a validation cohort of 45 patientsfrom another academic center. A highly significant incremental predictive value was notedwhen septal flash was added to an initial 4-factor model including left bundle branch block(difference between area under the curve C statistics [ 0.125, p <0.001). The predictiveaccuracy using the L2ANDS2 score was then 0.79 for the C statistic. Application of the newscore to the validation cohort (71% of responders) gave a similar C statistic (0.75). A score>5 had a high positive likelihood ratio (DLR [ 5.64), whereas a score <2 had a highnegative likelihood ratio (LLR [ 0.19). In conclusion, this L2ANDS2 score provides aneasy-to-use tool for the clinician to assess the pretest probability of a patient being a CRTresponder. � 2014 Elsevier Inc. All rights reserved. (Am J Cardiol 2014;113:2045e2051)
The aim of the present study was to evaluate whether ascoring system integrating clinical, electrocardiographic,and echocardiographic characteristics could help the clini-cian in assessing the probability of left ventricular (LV)reverse remodeling after cardiac resynchronization therapy(CRT). Observational studies suggested that the assessmentof mechanical dyssynchrony might be used to help identifyCRT responders. New echocardiographic parameters suchas septal flash (SF) have been proposed to predict responseto CRT with good sensitivity and specificity.1,2 Thisabnormal interventricular septal motion, demonstrated inearlier animal experiments,3 is seen in some patients with
left bundle branch block (LBBB).4 It can be assessedvisually during the isovolumetric contraction, and the clin-ical value of this motion has been demonstrated recently.5e8
The present study evaluates the incremental advantage of adyssynchrony parameter over clinical and electrocardio-graphic characteristics in a scoring system.
Methods
This study was conducted in 2 phases. The first one wasthe score determination. The derivation cohort constituted162 patients referred to Rennes University Hospital (Ren-nes, France) from 2010 to 2012 for implantation of a CRTdevice. To be included in the study, first, the quality of theultrasound windows was checked. If these windows werejudged inadequate, then the patient was not included in thestudy. Twenty-eight patients were thus excluded. Theetiology of dilated cardiomyopathy was ischemic in 35%and nonischemic in 65% of them. The etiology was classi-fied as ischemic if patients either had a history of myocardialinfarction or revascularization or showed angiographic evi-dence of multiple- or single-vessel disease along with leftmain or proximal left anterior damage.9 The New YorkHeart Association (NYHA) class considered was the highestfunctional class reached. At the time of inclusion, allpatients received optimized medical therapy.
aCIC-IT U 804, Centre Hospitalier Universitaire Rennes, Université
Rennes 1, France; bINSERM, U1099, Rennes, France; cUniversité Rennes
1, LTSI, Rennes, France; dUniversité François Rabelais, Tours, France;eService de Cardiologie, Centre Hospitalier Universitaire Tours, France;fUniversité Lille Nord de France, GCS-Groupement des Hôpitaux de
l’Institut Catholique de Lille, Faculté Libre de Médecine, Université
Catholique de Lille, Lille, France; gINSERM, U1088, Université de Pic-
ardie, Amiens, France; and hService de Cardiologie, Centre Hospitalier
Universitaire Rennes, France. Manuscript received February 12, 2014;
revised manuscript received and accepted March 20, 2014.
See page 2050 for disclosure information.
*Corresponding author: Tel: (þ33) 299282525; fax: (þ33) 299282510.
E-mail address: [email protected] (E. Donal).
0002-9149/14/$ - see front matter � 2014 Elsevier Inc. All rights reserved. www.ajconline.org
http://dx.doi.org/10.1016/j.amjcard.2014.03.050
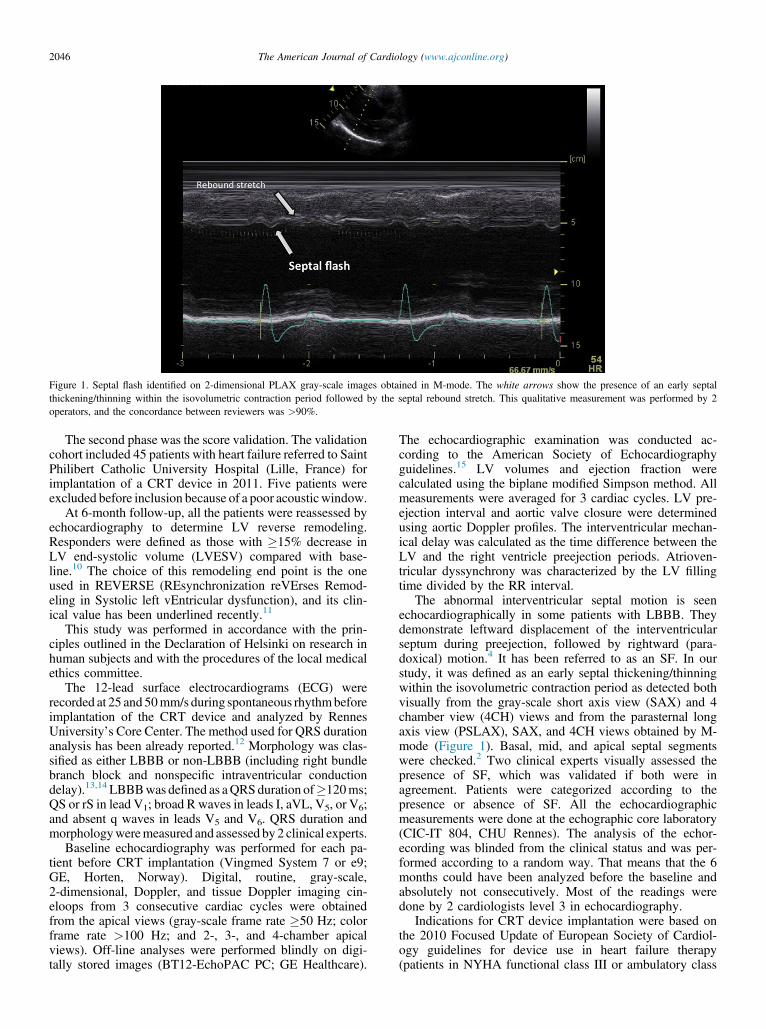
The second phase was the score validation. The validationcohort included 45 patients with heart failure referred to SaintPhilibert Catholic University Hospital (Lille, France) forimplantation of a CRT device in 2011. Five patients wereexcluded before inclusion because of a poor acousticwindow.
At 6-month follow-up, all the patients were reassessed byechocardiography to determine LV reverse remodeling.Responders were defined as those with �15% decrease inLV end-systolic volume (LVESV) compared with base-line.10 The choice of this remodeling end point is the oneused in REVERSE (REsynchronization reVErses Remod-eling in Systolic left vEntricular dysfunction), and its clin-ical value has been underlined recently.11
This study was performed in accordance with the prin-ciples outlined in the Declaration of Helsinki on research inhuman subjects and with the procedures of the local medicalethics committee.
The 12-lead surface electrocardiograms (ECG) wererecorded at 25 and 50mm/s during spontaneous rhythmbeforeimplantation of the CRT device and analyzed by RennesUniversity’s Core Center. The method used for QRS durationanalysis has been already reported.12 Morphology was clas-sified as either LBBB or non-LBBB (including right bundlebranch block and nonspecific intraventricular conductiondelay).13,14LBBBwas defined as aQRSduration of�120ms;QS or rS in lead V1; broad R waves in leads I, aVL, V5, or V6;and absent q waves in leads V5 and V6. QRS duration andmorphologyweremeasured and assessed by 2 clinical experts.
Baseline echocardiography was performed for each pa-tient before CRT implantation (Vingmed System 7 or e9;GE, Horten, Norway). Digital, routine, gray-scale,2-dimensional, Doppler, and tissue Doppler imaging cin-eloops from 3 consecutive cardiac cycles were obtainedfrom the apical views (gray-scale frame rate �50 Hz; colorframe rate >100 Hz; and 2-, 3-, and 4-chamber apicalviews). Off-line analyses were performed blindly on digi-tally stored images (BT12-EchoPAC PC; GE Healthcare).
The echocardiographic examination was conducted ac-cording to the American Society of Echocardiographyguidelines.15 LV volumes and ejection fraction werecalculated using the biplane modified Simpson method. Allmeasurements were averaged for 3 cardiac cycles. LV pre-ejection interval and aortic valve closure were determinedusing aortic Doppler profiles. The interventricular mechan-ical delay was calculated as the time difference between theLV and the right ventricle preejection periods. Atrioven-tricular dyssynchrony was characterized by the LV fillingtime divided by the RR interval.
The abnormal interventricular septal motion is seenechocardiographically in some patients with LBBB. Theydemonstrate leftward displacement of the interventricularseptum during preejection, followed by rightward (para-doxical) motion.4 It has been referred to as an SF. In ourstudy, it was defined as an early septal thickening/thinningwithin the isovolumetric contraction period as detected bothvisually from the gray-scale short axis view (SAX) and 4chamber view (4CH) views and from the parasternal longaxis view (PSLAX), SAX, and 4CH views obtained by M-mode (Figure 1). Basal, mid, and apical septal segmentswere checked.2 Two clinical experts visually assessed thepresence of SF, which was validated if both were inagreement. Patients were categorized according to thepresence or absence of SF. All the echocardiographicmeasurements were done at the echographic core laboratory(CIC-IT 804, CHU Rennes). The analysis of the echor-ecording was blinded from the clinical status and was per-formed according to a random way. That means that the 6months could have been analyzed before the baseline andabsolutely not consecutively. Most of the readings weredone by 2 cardiologists level 3 in echocardiography.
Indications for CRT device implantation were based onthe 2010 Focused Update of European Society of Cardiol-ogy guidelines for device use in heart failure therapy(patients in NYHA functional class III or ambulatory class
Figure 1. Septal flash identified on 2-dimensional PLAX gray-scale images obtained in M-mode. The white arrows show the presence of an early septal
thickening/thinning within the isovolumetric contraction period followed by the septal rebound stretch. This qualitative measurement was performed by 2
operators, and the concordance between reviewers was >90%.
2046 The American Journal of Cardiology (www.ajconline.org)
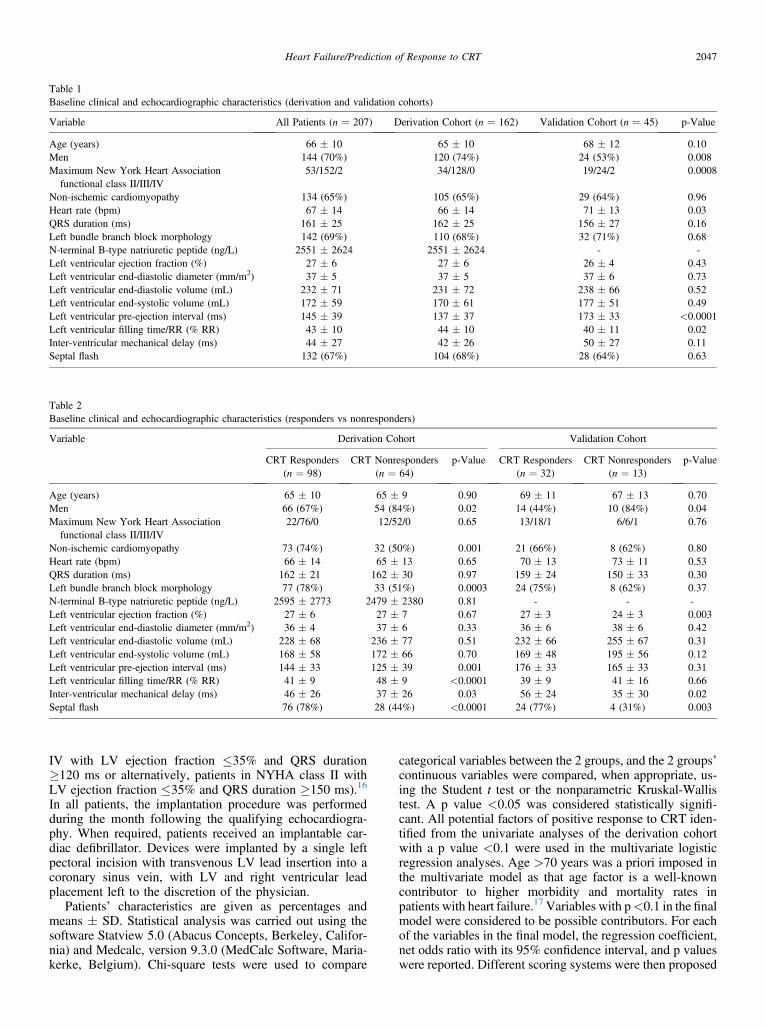
IV with LV ejection fraction �35% and QRS duration�120 ms or alternatively, patients in NYHA class II withLV ejection fraction �35% and QRS duration �150 ms).16
In all patients, the implantation procedure was performedduring the month following the qualifying echocardiogra-phy. When required, patients received an implantable car-diac defibrillator. Devices were implanted by a single leftpectoral incision with transvenous LV lead insertion into acoronary sinus vein, with LV and right ventricular leadplacement left to the discretion of the physician.
Patients’ characteristics are given as percentages andmeans � SD. Statistical analysis was carried out using thesoftware Statview 5.0 (Abacus Concepts, Berkeley, Califor-nia) and Medcalc, version 9.3.0 (MedCalc Software, Maria-kerke, Belgium). Chi-square tests were used to compare
categorical variables between the 2 groups, and the 2 groups’continuous variables were compared, when appropriate, us-ing the Student t test or the nonparametric Kruskal-Wallistest. A p value <0.05 was considered statistically signifi-cant. All potential factors of positive response to CRT iden-tified from the univariate analyses of the derivation cohortwith a p value <0.1 were used in the multivariate logisticregression analyses. Age >70 years was a priori imposed inthe multivariate model as that age factor is a well-knowncontributor to higher morbidity and mortality rates inpatients with heart failure.17Variables with p<0.1 in the finalmodel were considered to be possible contributors. For eachof the variables in the final model, the regression coefficient,net odds ratio with its 95% confidence interval, and p valueswere reported. Different scoring systems were then proposed
Table 1
Baseline clinical and echocardiographic characteristics (derivation and validation cohorts)
Variable All Patients (n ¼ 207) Derivation Cohort (n ¼ 162) Validation Cohort (n ¼ 45) p-Value
Age (years) 66 � 10 65 � 10 68 � 12 0.10
Men 144 (70%) 120 (74%) 24 (53%) 0.008
Maximum New York Heart Association
functional class II/III/IV
53/152/2 34/128/0 19/24/2 0.0008
Non-ischemic cardiomyopathy 134 (65%) 105 (65%) 29 (64%) 0.96
Heart rate (bpm) 67 � 14 66 � 14 71 � 13 0.03
QRS duration (ms) 161 � 25 162 � 25 156 � 27 0.16
Left bundle branch block morphology 142 (69%) 110 (68%) 32 (71%) 0.68
N-terminal B-type natriuretic peptide (ng/L) 2551 � 2624 2551 � 2624 - -
Left ventricular ejection fraction (%) 27 � 6 27 � 6 26 � 4 0.43
Left ventricular end-diastolic diameter (mm/m2) 37 � 5 37 � 5 37 � 6 0.73
Left ventricular end-diastolic volume (mL) 232 � 71 231 � 72 238 � 66 0.52
Left ventricular end-systolic volume (mL) 172 � 59 170 � 61 177 � 51 0.49
Left ventricular pre-ejection interval (ms) 145 � 39 137 � 37 173 � 33 <0.0001
Left ventricular filling time/RR (% RR) 43 � 10 44 � 10 40 � 11 0.02
Inter-ventricular mechanical delay (ms) 44 � 27 42 � 26 50 � 27 0.11
Septal flash 132 (67%) 104 (68%) 28 (64%) 0.63
Table 2
Baseline clinical and echocardiographic characteristics (responders vs nonresponders)
Variable Derivation Cohort Validation Cohort
CRT Responders
(n ¼ 98)
CRT Nonresponders
(n ¼ 64)
p-Value CRT Responders
(n ¼ 32)
CRT Nonresponders
(n ¼ 13)
p-Value
Age (years) 65 � 10 65 � 9 0.90 69 � 11 67 � 13 0.70
Men 66 (67%) 54 (84%) 0.02 14 (44%) 10 (84%) 0.04
Maximum New York Heart Association
functional class II/III/IV
22/76/0 12/52/0 0.65 13/18/1 6/6/1 0.76
Non-ischemic cardiomyopathy 73 (74%) 32 (50%) 0.001 21 (66%) 8 (62%) 0.80
Heart rate (bpm) 66 � 14 65 � 13 0.65 70 � 13 73 � 11 0.53
QRS duration (ms) 162 � 21 162 � 30 0.97 159 � 24 150 � 33 0.30
Left bundle branch block morphology 77 (78%) 33 (51%) 0.0003 24 (75%) 8 (62%) 0.37
N-terminal B-type natriuretic peptide (ng/L) 2595 � 2773 2479 � 2380 0.81 - - -
Left ventricular ejection fraction (%) 27 � 6 27 � 7 0.67 27 � 3 24 � 3 0.003
Left ventricular end-diastolic diameter (mm/m2) 36 � 4 37 � 6 0.33 36 � 6 38 � 6 0.42
Left ventricular end-diastolic volume (mL) 228 � 68 236 � 77 0.51 232 � 66 255 � 67 0.31
Left ventricular end-systolic volume (mL) 168 � 58 172 � 66 0.70 169 � 48 195 � 56 0.12
Left ventricular pre-ejection interval (ms) 144 � 33 125 � 39 0.001 176 � 33 165 � 33 0.31
Left ventricular filling time/RR (% RR) 41 � 9 48 � 9 <0.0001 39 � 9 41 � 16 0.66
Inter-ventricular mechanical delay (ms) 46 � 26 37 � 26 0.03 56 � 24 35 � 30 0.02
Septal flash 76 (78%) 28 (44%) <0.0001 24 (77%) 4 (31%) 0.003
Heart Failure/Prediction of Response to CRT 2047
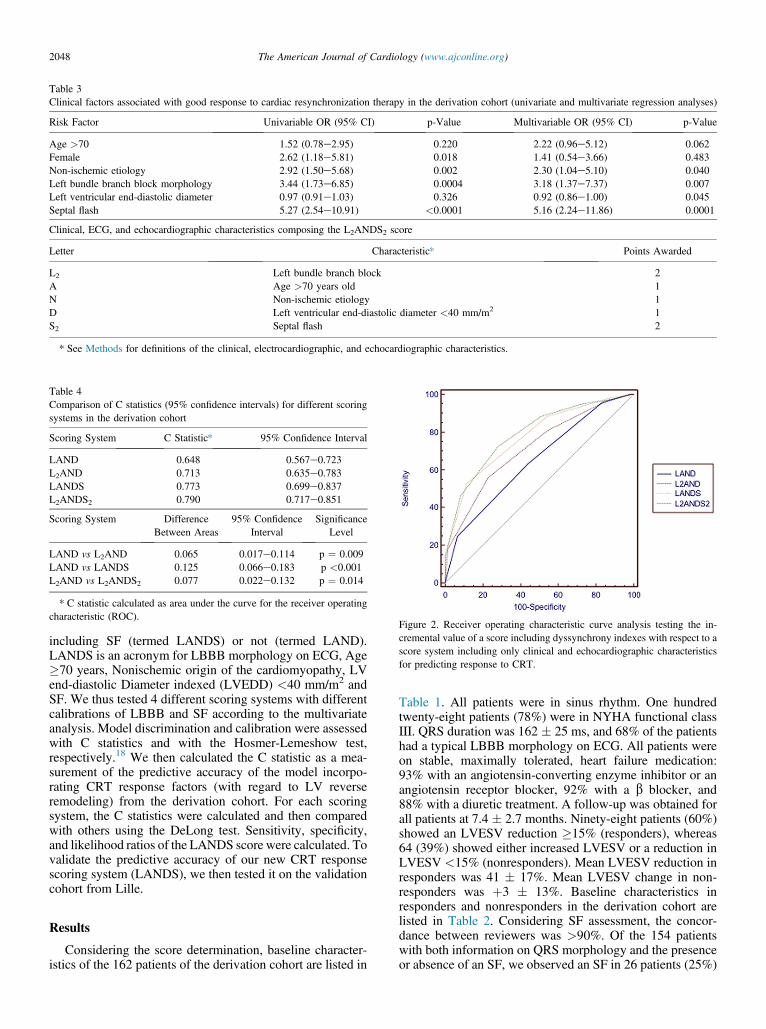
including SF (termed LANDS) or not (termed LAND).LANDS is an acronym for LBBB morphology on ECG, Age�70 years, Nonischemic origin of the cardiomyopathy, LVend-diastolic Diameter indexed (LVEDD) <40 mm/m2 andSF. We thus tested 4 different scoring systems with differentcalibrations of LBBB and SF according to the multivariateanalysis. Model discrimination and calibration were assessedwith C statistics and with the Hosmer-Lemeshow test,respectively.18 We then calculated the C statistic as a mea-surement of the predictive accuracy of the model incorpo-rating CRT response factors (with regard to LV reverseremodeling) from the derivation cohort. For each scoringsystem, the C statistics were calculated and then comparedwith others using the DeLong test. Sensitivity, specificity,and likelihood ratios of the LANDS score were calculated. Tovalidate the predictive accuracy of our new CRT responsescoring system (LANDS), we then tested it on the validationcohort from Lille.
Results
Considering the score determination, baseline character-istics of the 162 patients of the derivation cohort are listed in
Table 1. All patients were in sinus rhythm. One hundredtwenty-eight patients (78%) were in NYHA functional classIII. QRS duration was 162 � 25 ms, and 68% of the patientshad a typical LBBB morphology on ECG. All patients wereon stable, maximally tolerated, heart failure medication:93% with an angiotensin-converting enzyme inhibitor or anangiotensin receptor blocker, 92% with a b blocker, and88% with a diuretic treatment. A follow-up was obtained forall patients at 7.4 � 2.7 months. Ninety-eight patients (60%)showed an LVESV reduction �15% (responders), whereas64 (39%) showed either increased LVESV or a reduction inLVESV <15% (nonresponders). Mean LVESV reduction inresponders was 41 � 17%. Mean LVESV change in non-responders was þ3 � 13%. Baseline characteristics inresponders and nonresponders in the derivation cohort arelisted in Table 2. Considering SF assessment, the concor-dance between reviewers was >90%. Of the 154 patientswith both information on QRS morphology and the presenceor absence of an SF, we observed an SF in 26 patients (25%)
Table 3
Clinical factors associated with good response to cardiac resynchronization therapy in the derivation cohort (univariate and multivariate regression analyses)
Risk Factor Univariable OR (95% CI) p-Value Multivariable OR (95% CI) p-Value
Age >70 1.52 (0.78e2.95) 0.220 2.22 (0.96e5.12) 0.062
Female 2.62 (1.18e5.81) 0.018 1.41 (0.54e3.66) 0.483
Non-ischemic etiology 2.92 (1.50e5.68) 0.002 2.30 (1.04e5.10) 0.040
Left bundle branch block morphology 3.44 (1.73e6.85) 0.0004 3.18 (1.37e7.37) 0.007
Left ventricular end-diastolic diameter 0.97 (0.91e1.03) 0.326 0.92 (0.86e1.00) 0.045
Septal flash 5.27 (2.54e10.91) <0.0001 5.16 (2.24e11.86) 0.0001
Clinical, ECG, and echocardiographic characteristics composing the L2ANDS2 score
Letter Characteristic* Points Awarded
L2 Left bundle branch block 2
A Age >70 years old 1
N Non-ischemic etiology 1
D Left ventricular end-diastolic diameter <40 mm/m2 1
S2 Septal flash 2
* See Methods for definitions of the clinical, electrocardiographic, and echocardiographic characteristics.
Table 4
Comparison of C statistics (95% confidence intervals) for different scoring
systems in the derivation cohort
Scoring System C Statistic* 95% Confidence Interval
LAND 0.648 0.567e0.723
L2AND 0.713 0.635e0.783
LANDS 0.773 0.699e0.837
L2ANDS2 0.790 0.717e0.851
Scoring System Difference
Between Areas
95% Confidence
Interval
Significance
Level
LAND vs L2AND 0.065 0.017e0.114 p ¼ 0.009
LAND vs LANDS 0.125 0.066e0.183 p <0.001
L2AND vs L2ANDS2 0.077 0.022e0.132 p ¼ 0.014
* C statistic calculated as area under the curve for the receiver operating
characteristic (ROC).Figure 2. Receiver operating characteristic curve analysis testing the in-
cremental value of a score including dyssynchrony indexes with respect to a
score system including only clinical and echocardiographic characteristics
for predicting response to CRT.
2048 The American Journal of Cardiology (www.ajconline.org)
who did not have an LBBB morphology, whereas 78patients (75%) with an SF had an LBBB morphology.Twenty-seven patients (26%) with an LBBB morphologydid not present an SF echocardiographically.
Univariate regression analysis identified 4 variables withp <0.1 after evaluation of all the clinical, electrocardio-graphic, and echocardiographic variables. Table 3 lists thefindings of univariate and the multivariate regression ana-lyses, which identified 5 variables as potential contributors:age >70 years, nonischemic origin, LBBB, LVEDD<40 mm/m2, and SF. Four different scoring systems werethen generated from these 5 variables: LAND (LBBBmorphology on ECG, Age �70 years, Nonischemic originof the cardiomyopathy, and LVEDD <40 mm/m2); L2AND(2 points awarded for LBBB morphology on ECG); LANDS(LBBB morphology on ECG, Age �70 years, Nonischemicorigin of the cardiomyopathy, LVEDD <40 mm/m2, andSF), and L2ANDS2 (2 points awarded for LBBBmorphology on ECG and for SF). Comparisons of the pre-dictive accuracy (C statistics) in the derivation cohort foreach scoring system are displayed in Table 4. The predictiveaccuracy improved significantly when adding SF to thescoring points awarded to LBBB and SF. Figure 2 presentsanalysis by receiver operating characteristic curves of thedifferent scoring systems in the derivation cohort.
A 7-point score was therefore chosen to predict responseto CRT. We assigned 2 points to LBBB and SF (highestodds ratio in multivariable analysis >3) and 1 point each for
age >70 years, nonischemic origin, and LVEDD <40 mm/m2 (Table 3). A L2ANDS2 score was calculated for only 154patients in the derivation cohort because 8 patients werelacking at least 1 datum. Twenty-two patients had a score�2 with a rate of LV reverse remodeling <30%; 84 patientshad a score >4 with a rate of LV reverse remodeling of67%; and 48 patients had a score >5 with a rate of LVreverse remodeling >85%. L2ANDS2 score sensitivity andspecificity and the calculated likelihood ratios for the deri-vation cohort are listed in Table 5.
Considering the score validation, baseline characteristicsof the 45 patients of the validation cohort are listed inTable 1. No significant differences between the derivationand the validation cohorts were noted for QRS duration andLBBB morphology on ECG (Table 1). The main significantdifferences between the derivation and the validationcohorts were a greater prevalence of men, a greater NYHAfunctional class (more patients in NYHA class III), and alower LV preejection interval in the derivation cohort. Atthe 6-month follow-up, an LVESV decrease �15% wasobserved in 32 of the 45 patients (71%) from the validationcohort. Differences in baseline characteristics betweenresponders and nonresponders of the validation cohort arelisted in Table 2. Of the 44 patients with both information ofQRS morphology and the presence or absence of an SF, weobserved an SF in 7 patients (25%) who did not have anLBBB morphology, whereas 21 patients (75%) with an SFhad an LBBB morphology. Eleven patients (34%) with anLBBB morphology did not present an SF echocardio-graphically. Application of the new CRT response score(L2ANDS2) to the validation cohort yielded C statisticssimilar to those derived from the derivation cohort overall(0.75). The same incremental value as in the derivationcohort was found for the validation cohort when adding SFto the scoring system (the C statistic increased from 0.59 to0.71; Table 6).
Discussion
The present study shows that combining clinical andelectrocardiographic baseline characteristics with SF pro-vides better predictive power than clinical and electrocar-diographic characteristics alone. The L2ANDS2 score looksto be a new promising tool to assess the probability of LVreverse remodeling, especially as it has been validated on2 independent cohorts. This original scoring system,
Table 5
Sensitivity, specificity, and likelihood ratios of L2ANDS2 for good response to cardiac resynchronization therapy in the derivation cohort (n ¼ 154*)
L2ANDS2Score
Nb of Patients (%) Sensitivity 95% CI Specificity 95% CI Positive Likelihood
Ratio
Negative Likelihood
Ratio
>0 154 100 100.0 96.1e100.0 0.0 0.0e5.9 1 -
>1 147 95 97.9 92.4e99.7 8.2 2.7e18.1 1.07 0,26
>2 132 86 94.6 87.9e98.2 27.9 17.2e40.8 1.31 0,19
>3 113 73 88.2 79.8e93.9 49.2 36.1e62.3 1.73 0,24
>4 84 55 72.0 61.8e80.9 72.1 59.2e82.8 2.59 0,39
>5 48 31 46.2 35.8e56.9 91.8 81.9e97.3 5.64 0,59
>6 13 8 14.0 7.7e22.7 100.0 94.1e100.0 - 0,86
>7 0 0 0.0 0.0e3.9 100.0 94.1e100.0 - 1
* Data lacking for 8 patients.
Table 6
Comparison of the C statistics (95% confidence intervals) for different
scoring systems in the validation cohort
Scoring System C Statistic* 95% Confidence Interval
LAND 0.592 0.433e0.737
L2AND 0.619 0.460e0.761
LANDS 0.706 0.549e0.833
L2ANDS2 0.751 0.597e0.868
Scoring System Difference
Between Areas
95% Confidence
Interval
Significance
Level
LAND vs L2AND 0.027 �0.041e0.095 p ¼ 0.430
LAND vs LANDS 0.114 0.026e0.202 p ¼ 0.011
L2AND vs L2ANDS2 0.132 0.028e0.235 p ¼ 0.013
* C statistic calculated as area under the curve for the receiver operating
characteristic (ROC).
Heart Failure/Prediction of Response to CRT 2049
combining clinical and electrocardiographic parameters withan index of inefficient deformation, provides an easy-to-usescale for the clinician to assess the pretest probability of apatient being a CRT responder. A score >4 had a sensitivityof 72% and a specificity of 72% in predicting LV reverseremodeling. This makes it a relevant cutoff for the clinician.A score >5 had a high positive likelihood ratio, meaning forthe patient a high pretest probability of being a CRTresponder, which may bolster clinicians in their decision. Onthe contrary, a score <2 had a high negative likelihood ratio,meaning for the patient a high pretest probability of notbeing an echocardiographic CRT responder, which could beof value in some difficult cases. For instance, an elderlypatient (>75 years) with an ischemic cardiomyopathy, nomajor LV dilatation (LVEDD <40 mm/m2), and withneither typical LBBB nor SF on echocardiogram has a highpretest probability of not being a responder. This may behelpful when deciding on an invasive and costly strategy.Therefore, this score is rather a scale allowing the clinicianto graduate the probability of LV reverse remodeling.Another positive point is that it is easy to use and does notrequire complex measurements or calculations. Clinical andelectrocardiographic characteristics are easily collected atbedside.
Previous studies have identified few clinical character-istics associated with a favorable response to CRT.19 Thebeneficial effects of CRT on morbidity, mortality, and LVfunction may be greater for women.20 This showed up inunivariate but not in multivariate analysis, which highlightsthe role of possible confusing factors in female patients suchas age and/or the origin of the cardiomyopathy and thegender difference for QRS duration. LV function oftenimproves more in patients with nonischemic heart diseasethan in those with ischemic disease, presumably because ofmyocardial scar.21 We have chosen to impose the inclusionof age in the model because an age >70 years is a well-known contributor to higher morbidity and mortality ratesin patients with heart failure.17 Looking once again atelectrocardiographic characteristics, the beneficial effect ofCRT is well demonstrated in patients with typical LBBB.12
A recent meta-analysis22 nevertheless revealed that the mostpowerful predictor of mortality and morbidity is QRSduration. Few patients had a QRS duration <140 ms in ourstudy, which was the cut-off value chosen by Clelandet al.22 The interrelationship between QRS morphology andQRS duration can induce confusion in some cases. How-ever, a detailed analysis of QRS morphology, as performedin our study, may provide prognostic information.
Imaging techniques to assess mechanical dyssynchrony,such as echocardiography, are not currently recognized asrelevant to the selection of patients for CRT. However, someobservational studies including mechanical dyssynchronyparameters and/or inefficient deformation parameters23e25
have demonstrated a benefit for CRT patient selection.Therefore, recent studies tend to focus on indexes combiningtime delay and contractility.26 SF (also called septal systolicrebound stretch) is one of these indexes.8,27 Parsaï et al2
identified subgroups of patients who were responders toCRT, one of which consisted of patients presenting SF,whereas classic intraventricular dyssynchrony parametersfailed to predict CRT response. More recently, Chan et al28
showed that septal systolic rebound stretch rather than timedelay indexes provided significantly more incremental valuethan clinical characteristics for predicting LV reverseremodeling. Assessment of SF is therefore a simple way toidentify an intraventricular dyssynchrony.
Our study includes 2 real-life populations from 2different hospitals with some consequent differences inclinical practice. However, our L2ANDS2 score was vali-dated in both populations with the same incremental valuewhen SF was added to clinical and electrocardiographiccharacteristics. Although some experience may be requiredto assess QRS morphology and SF analysis, they arenonetheless simple tools. Only echocardiographic parame-ters were used to define a positive response in our study.This is a limitation. Nevertheless, there are converging datatending to demonstrate that the reverse remodeling is highlycorrelated to the clinical long-term response to the ther-apy.11 Therefore, further study including long-term clinicalfollow-up might be of additional value, but already, thepresented study might have a real clinical value.
Disclosures
The authors have no conflicts of interest to disclose.
1. Leenders GE, De Boeck BWL, Teske AJ, Meine M, Bogaard MD,Prinzen FW, Doevendans PA, Cramer MJ. Septal rebound stretch is astrong predictor of outcome after cardiac resynchronization therapy.J Card Fail 2012;18:404e412.
2. Parsai C, Bijnens B, Sutherland GR, Baltabaeva A, Claus P,MarciniakM,Paul V, Scheffer M, Donal E, Derumeaux G, Anderson L. Toward un-derstanding response to cardiac resynchronization therapy: left ventriculardyssynchrony is only one of multiple mechanisms. Eur Heart J 2008;30:940e949.
3. Gjesdal O, Remme EW, Opdahl A, Skulstad H, Russell K, KongsgaardE, Edvardsen T, Smiseth OA. Mechanisms of abnormal systolic motionof the interventricular septum during left bundle-branch block. CircCardiovasc Imaging 2011;4:264e273.
4. Little WC, Reeves RC, Arciniegas J, Katholi RE, Rogers EW. Mech-anism of abnormal interventricular septal motion during delayed leftventricular activation. Circulation 1982;65:1486e1491.
5. Voigt JU, Schneider TM, Korder S, Szulik M, Gürel E, Daniel WG,Rademakers F, Flachskampf FA. Apical transverse motion as surrogateparameter to determine regional left ventricular function inhomogeneities:a new, integrative approach to left ventricular asynchrony assessment.EurHeart J 2009;30:959e968.
6. SzulikM, TillekaertsM,VangeelV,Ganame J,WillemsR, LenarczykR,Rademakers F, Kalarus Z, Kukulski T, Voigt J-U. Assessment of apicalrocking: a new, integrative approach for selection of candidates for car-diac resynchronization therapy. Eur J Echocardiogr 2010;11:863e869.
7. Tournoux F, Singh JP, Chan RC, Chen-Tournoux A, McCarty D,Manzke R, Ruskin JN, Semigran M, Heist EK, Moore S, Picard MH,Weyman AE. Absence of left ventricular apical rocking and atrial-ventricular dyssynchrony predicts non-response to cardiac resynchro-nization therapy. Eur Heart J Cardiovasc Imaging 2012;13:86e94.
8. Cikes M, Bijnens B, Duri�c Z, Bencic ML, Gosev I, Velagi�c V,Gasparovi�c H, Milici�c D, Biocina B. Detecting volume responders priorto implantation of a cardiac resynchronization therapy device via mini-thoracotomy: the septal flash as a predictor of immediate left ventricularreverse remodeling. Heart Surg Forum 2009;12:E362eE367.
9. Felker GM, Shaw LK, O’Connor CM. A standardized definition ofischemic cardiomyopathy for use in clinical research. J Am Coll
Cardiol 2002;39:210e218.10. Yu CM, Fung WH, Lin H, Zhang Q, Sanderson JE, Lau CP. Predictors
of left ventricular reverse remodeling after cardiac resynchronizationtherapy for heart failure secondary to idiopathic dilated or ischemiccardiomyopathy. Am J Cardiol 2003;91:684e688.
11. Bertini M, Hoke U, van Bommel RJ, Ng AC, Shanks M, Nucifora G,Auger D, Borleffs CJ, van Rijnsoever EP, van Erven L, Schalij MJ,
2050 The American Journal of Cardiology (www.ajconline.org)
Marsan NA, Bax JJ, Delgado V. Impact of clinical and echocardio-graphic response to cardiac resynchronization therapy on long-termsurvival. Eur Heart J Cardiovasc Imaging 2013;14:774e781.
12. Gold MR, Thebault C, Linde C, Abraham WT, Gerritse B, Ghio S, StJohn Sutton M, Daubert JC. The effect of QRS duration andmorphology on cardiac resynchronization therapy outcomes in mildheart failure: results from the REsynchronization reVErses Remodelingin Systolic left vEntricular dysfunction (REVERSE) study. Circulation2012;126:822e829.
13. Surawicz B, Childers R, Deal BJ, Gettes LS, Bailey JJ, Gorgels A,Hancock EW, Josephson M, Kligfield P, Kors JA, Macfarlane P,Mason JW, Mirvis DM, Okin P, Pahlm O, Rautaharju PM, van HerpenG, Wagner GS, Wellens H; American Heart Association Electrocar-diography and Arrhythmias Committee; Council on Clinical Cardiol-ogy; American College of Cardiology Foundation, Heart RhythmSociety. AHA/ACCF/HRS recommendations for the standardizationand interpretation of the electrocardiogram: part III: intraventricularconduction disturbances: a scientific statement from the AmericanHeart Association Electrocardiography and Arrhythmias Committee,Council on Clinical Cardiology; the American College of CardiologyFoundation; and the Heart Rhythm Society. Endorsed by the Interna-tional Society for Computerized Electrocardiology. J Am Coll Cardiol
2009;53:976e981.14. Zareba W, Klein H, Cygankiewicz I, Hall WJ, McNitt S, Brown M,
CannomD,Daubert JP, EldarM,GoldMR,Goldberger JJ,Goldenberg I,Lichstein E, Pitschner H, Rashtian M, Solomon S, Viskin S, Wang P,Moss AJ; on behalf of the MADIT-CRT Investigators. Effectiveness ofcardiac resynchronization therapy by QRS morphology in the Multi-center Automatic Defibrillator Implantation Trial-Cardiac Resynchro-nization Therapy (MADIT-CRT). Circulation 2011;123:1061e1072.
15. Lang RM, Bierig M, Devereux RB, Flachskampf FA, Foster E,Pellikka PA, Picard MH, Roman MJ, Seward J, Shanewise JS, Solo-mon SD, Spencer KT, Sutton MSJ, Stewart WJ; Chamber Quantifi-cation Writing Group; American Society of Echocardiography’sGuidelines and Standards Committee; European Association of Echo-cardiography. Recommendations for chamber quantification: a reportfrom the American Society of Echocardiography’s Guidelines andStandards Committee and the Chamber Quantification Writing Group,developed in conjunction with the European Association of Echocar-diography, a branch of the European Society of Cardiology. J Am Soc
Echocardiogr 2005;18:1440e1463.16. Dickstein K, Vardas PE, Auricchio A, Daubert JC, Linde C, McMurray
J, Ponikowski P, Priori SG, Sutton R, van Veldhuisen DJ; ESCCommittee for Practice Guidelines. 2010 focused update of ESCguidelines on device therapy in heart failure: an update of the 2008ESC guidelines for the diagnosis and treatment of acute and chronicheart failure and the 2007 ESC guidelines for cardiac and resynchro-nization therapy developed with the special contribution of the HeartFailure Association and the European Heart Rhythm Association. EurHeart J 2010;31:2677e2687.
17. Brignole M, Auricchio A, Baron-Esquivias G, Bordachar P, Boriani G,Breithardt OA, Cleland J, Deharo J-C, Delgado V, Elliott PM, GorenekB, Israel CW, Leclercq C, Linde C, Mont L, Padeletti L, Sutton R,Vardas PE; ESC Committee for Practice Guidelines. 2013 ESCguidelines on cardiac pacing and cardiac resynchronization therapy: the
Task Force on Cardiac Pacing and Resynchronization Therapy of theEuropean Society of Cardiology (ESC). Developed in collaborationwith the European Heart Rhythm Association (EHRA). Eur Heart J
2013;34:2281e2329.18. Cook NR. Use and misuse of the receiver operating characteristic curve
in risk prediction. Circulation 2007;115:928e935.19. Goldenberg I, Moss AJ, Hall WJ, Foster E, Goldberger JJ, Santucci P,
Shinn T, Solomon S, Steinberg JS, Wilber D, Barsheshet A, McNitt S,Zareba W, Klein H; on behalf of the MADIT-CRT ExecutiveCommittee. Predictors of response to cardiac resynchronization therapyin the Multicenter Automatic Defibrillator Implantation Trial WithCardiac Resynchronization Therapy (MADIT-CRT). Circulation
2011;124:1527e1536.20. Arshad A, Moss AJ, Foster E, Padeletti L, Barsheshet A, Goldenberg I,
Greenberg H, Hall WJ, McNitt S, Zareba W, Solomon S, Steinberg JS;MADIT-CRT Executive Committee. Cardiac resynchronizationtherapy is more effective in women than in men: the MADIT-CRT(Multicenter Automatic Defibrillator Implantation Trial with CardiacResynchronization Therapy) trial. J Am Coll Cardiol 2011;57:813e820.
21. Barsheshet A, Goldenberg I, Moss AJ, Eldar M, Huang DT, McNitt S,Klein HU, Hall WJ, Brown MW, Goldberger JJ, Goldstein RE,Schuger C, Zareba W, Daubert JC. Response to preventive cardiacresynchronization therapy in patients with ischaemic and nonischaemiccardiomyopathy in MADIT-CRT. Eur Heart J 2011;32:1622e1630.
22. Cleland JG, Abraham WT, Linde C, Gold MR, Young JB, Daubert JC,Sherfesee L, Wells GA, Tang AS. An individual patient meta-analysisof five randomized trials assessing the effects of cardiac resynchroni-zation therapy on morbidity and mortality in patients with symptomaticheart failure. Eur Heart J 2013;34:3547e3556.
23. Lafitte S, Reant P, Zaroui A, Donal E, Mignot A, Bougted H, Belghiti H,Bordachar P, Deplagne A, Chabaneix J, Franceschi F, Deharo J-C,Santos PD, Clementy J, Roudaut R, Leclercq C, Habib G. Validation ofan echocardiographic multiparametric strategy to increase responderspatients after cardiac resynchronization: a multicentre study. Eur Heart J2009;30:2880e2887.
24. Smiseth OA, Russell K, Skulstad H. The role of echocardiography inquantification of left ventricular dyssynchrony: state of the art andfuture directions. Eur Heart J Cardiovasc Imaging 2012;13:61e68.
25. Park JH, Negishi K, Grimm RA, Popovic Z, Stanton T, Wilkoff BL,Marwick TH. Echocardiographic predictors of reverse remodeling aftercardiac resynchronization therapy and subsequent events. Circ
Cardiovasc Imaging 2013;6:864e872.26. Lim P, Donal E, Lafitte S, Derumeaux G, Habib G, Reant P, Thivolet S,
Lellouche N, Grimm RA, Gueret P. Multicentre study using strain delayindex for predicting response to cardiac resynchronization therapy(MUSIC study). Eur J Heart Fail 2011;13:984e991.
27. De Boeck BW, Teske AJ, Meine M, Leenders GE, Cramer MJ, PrinzenFW, Doevendans PA. Septal rebound stretch reflects the functionalsubstrate to cardiac resynchronization therapy and predicts volumetricand neurohormonal response. Eur J Heart Fail 2009;11:863e871.
28. Chan YH, Wu LS, Kuo CT, Wang CL, Yeh YH, Ho WJ, Hsu LA.Incremental value of inefficient deformation indices for predictingresponse to cardiac resynchronization therapy. J Am Soc Echocardiogr
2013;26:307e315.
Heart Failure/Prediction of Response to CRT 2051
Impact of cardiac resynchronization therapy on left ventricular mechanics.
Understanding the response through a new quantitative approach based on
longitudinal strain integrals.
Short title: longitudinal strain integral in heart failure
Anne Bernard1,2,3,4, MD, Erwan Donal1,3,5, MD, PhD, Christophe Leclercq1,3,5, MD,
PhD, Frédéric Schnell1,3,4,6, MD, Maxime Fournet1,5, Amélie Reynaud1,3,4, MD,
Christophe Thebault1,5, MD, Philippe Mabo1,3,5, MD, PhD, Jean-Claude
Daubert1,3,5, MD, Alfredo Hernandez3,4, PhD
1. CIC-IT U 804, CHU Rennes, Université Rennes 1
2. Service de Cardiologie, CHU Tours
3. INSERM, U1099, Rennes, F-35000, France
4. Université de Rennes 1, LTSI, Rennes, F-35000, France
5. Service de Cardiologie, CHU Rennes
6. Service de Médecine du Sport, CHU Rennes
Funding:
Erwan DONAL receives a research grant from the « Fondation de l’Avenir » (Fondation de France) for this project about new imaging approaches for cardiac resynchronization
Conflict of interest: There are no commercial products involved in this study.
Correspondence
Erwan Donal, MD, PhD,
Service de Cardiologie - Hôpital Pontchaillou – CHU Rennes-
F-35033 RENNES
Fax 33299282510
3270 Words
2
Abstract
Background. The mechanisms of improvement of left ventricular function with CRT
are not yet elucidated. We sought to evaluate changes in LV strain distribution after
cardiac resynchronization therapy (CRT) with a new tool based on automatic
quantification of the integrals of regional longitudinal strain signals.
Methods and Results. Integrals of regional longitudinal strain signals (from the
beginning of the cardiac cycle to the instant of aortic valve closure, IL,avc and to strain
peak, IL,peak) were analyzed retrospectively with custom-made algorithms in 130 heart
failure patients before CRT implantation and after 3 to 6 months of follow-up.
Response to CRT was defined as a decrease in LV end-systolic volume by ≥15%.
Responders (61%) and non-responders (39%) showed similar baseline values for
regional IL,peak and IL,avc. At follow-up, significant improvement of mid lateral IL,peak and
of mid lateral IL,avc was noted only in responders. The mid lateral IL,avc showed a
relative increase of 151±276% in responders, whereas a decrease of 33±69% was
observed in non-responders. The difference between IL,avc and IL,peak (representing
wasted energy of the LV myocardium) of the lateral wall showed a relative change of
-59±103% in responders between baseline and CRT, whereas in non-responders the
relative change was 21±113% (p=0.009).
Conclusions. Strain integrals brought out changes between baseline and CRT in the
lateral wall, demonstrating the beneficial effects of CRT on LV mechanics and
perhaps providing a tool for optimizing lead placement.
Key words: heart failure, cardiac resynchronization therapy, speckle-tracking
echocardiography
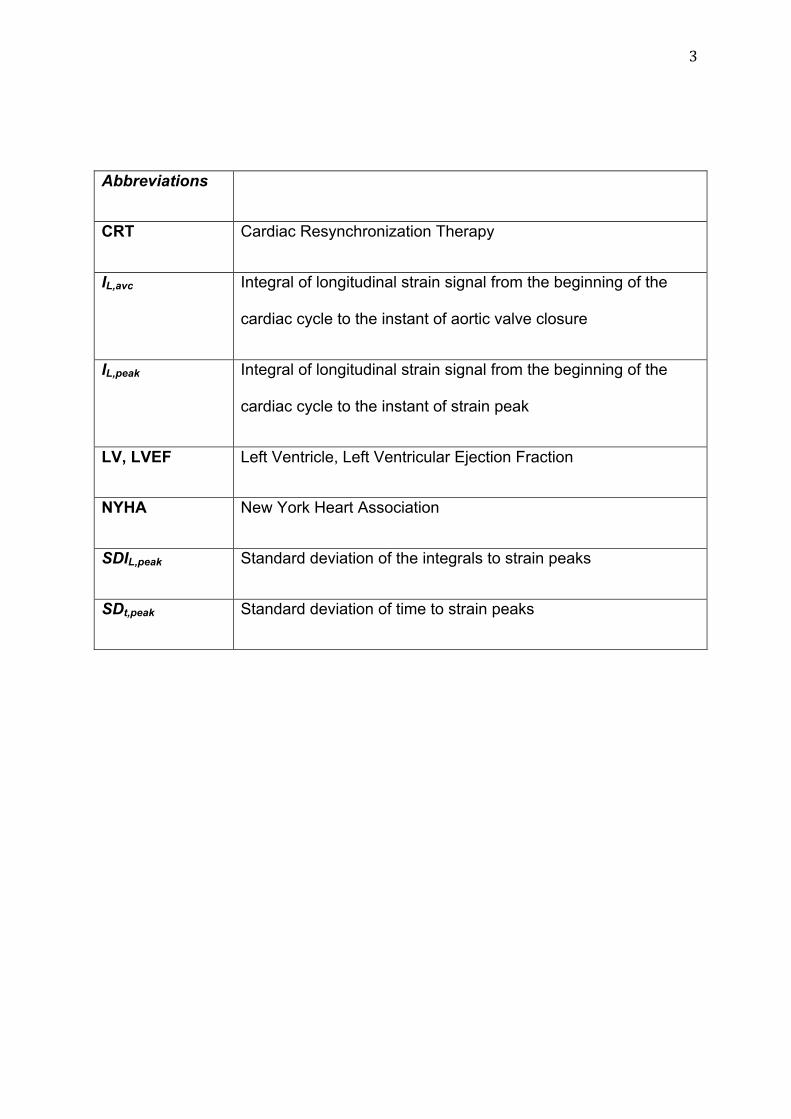
3
Abbreviations
CRT Cardiac Resynchronization Therapy
IL,avc Integral of longitudinal strain signal from the beginning of the
cardiac cycle to the instant of aortic valve closure
IL,peak Integral of longitudinal strain signal from the beginning of the
cardiac cycle to the instant of strain peak
LV, LVEF Left Ventricle, Left Ventricular Ejection Fraction
NYHA New York Heart Association
SDIL,peak Standard deviation of the integrals to strain peaks
SDt,peak Standard deviation of time to strain peaks
4
Assessment of left ventricular (LV) mechanical dyssynchrony in heart failure patients
is typically based on the echocardiographic analysis of differences in timing of
myocardial velocity or deformation. However, no echocardiographic parameter based
on timing has so far been shown to be reliable enough to identify cardiac
resynchronization therapy (CRT) responders1. Indeed, up to one-third of heart failure
patients selected with respect to the very frequently reviewed guidelines2-4 in Europe
and America do not improve clinically after implantation of the CRT device, and
around 50% exhibit no LV reverse remodeling5,6. While there is strong evidence that
CRT is beneficial overall, large studies involving echocardiographic evaluation of
mechanical dyssynchrony have all given negative results1,7,8. There are, however,
reasons to believe that there is still room for an assessment of mechanical
dyssynchrony9. Recent studies have focused less on the estimation of mechanical
dyssynchrony and more on the characterization of the myocardial substrate10-14 in
order to describe the complexity of LV mechanics before and during CRT. The
development of speckle tracking echocardiography, combining assessment of LV
dyssynchrony and contractility, was a cornerstone in this approach. This has been
reinforced by reports that speckle tracking is one of the most reliable tools for the
assessment of myocardial regional and global function, particularly through the
analysis of longitudinal strain13,15. Observational studies have shown that longitudinal
strain analysis reflects the segmental heterogeneity of myocardial function16, and that
the increase in global longitudinal strain correlates with the degree of LV
remodeling17. However, this approach is often based on manually detected peaks,
which could be a challenge in severely altered LV function.
Most of the strain analysis methods proposed in the literature are based on peak
timings and peak values of strain signals. Lim et al published very promising results
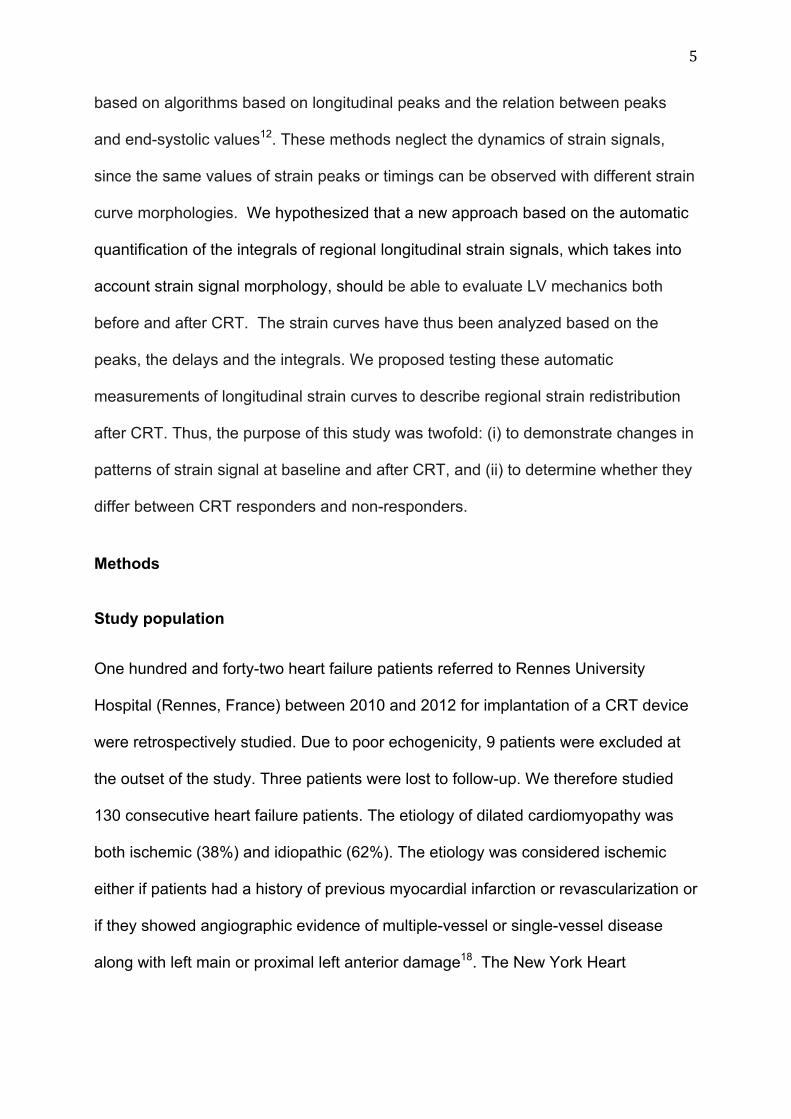
5
based on algorithms based on longitudinal peaks and the relation between peaks
and end-systolic values12. These methods neglect the dynamics of strain signals,
since the same values of strain peaks or timings can be observed with different strain
curve morphologies. We hypothesized that a new approach based on the automatic
quantification of the integrals of regional longitudinal strain signals, which takes into
account strain signal morphology, should be able to evaluate LV mechanics both
before and after CRT. The strain curves have thus been analyzed based on the
peaks, the delays and the integrals. We proposed testing these automatic
measurements of longitudinal strain curves to describe regional strain redistribution
after CRT. Thus, the purpose of this study was twofold: (i) to demonstrate changes in
patterns of strain signal at baseline and after CRT, and (ii) to determine whether they
differ between CRT responders and non-responders.
Methods
Study population
One hundred and forty-two heart failure patients referred to Rennes University
Hospital (Rennes, France) between 2010 and 2012 for implantation of a CRT device
were retrospectively studied. Due to poor echogenicity, 9 patients were excluded at
the outset of the study. Three patients were lost to follow-up. We therefore studied
130 consecutive heart failure patients. The etiology of dilated cardiomyopathy was
both ischemic (38%) and idiopathic (62%). The etiology was considered ischemic
either if patients had a history of previous myocardial infarction or revascularization or
if they showed angiographic evidence of multiple-vessel or single-vessel disease
along with left main or proximal left anterior damage18. The New York Heart
6
Association (NYHA) class considered was the maximum functional class reached. At
the time of inclusion all patients were undergoing stable optimized medical therapy.
This study was performed in accordance with the principles outlined in the
Declaration of Helsinki on research in human subjects and with the procedures of the
Rennes University Hospital Medical Ethics Committee (usual care).
The study was approved by a national review committee (n° CNIL 0507317b).
Patients gave their informed consent.
Two-dimensional echocardiography
Complete baseline echocardiography (GE, Vingmed System 7, Horten, Norway)
including standard gray-scale (frame rate ≥50Hz) and color DTI (frame rate >100 Hz)
in the apical views (2-, 3-, and 4-chamber views) was performed before CRT device
implantation and then 6 months after device implantation. Two-dimensional
echocardiographic, Doppler, and Doppler tissue imaging (DTI) parameters were
measured according to the guidelines of the American Society of
Echocardiography19. All measurements were averaged for 3 cardiac cycles. LV
volumes and ejection fraction (LVEF) were calculated using the biplane modified
Simpson method. Systolic ejection time was measured by recording aortic flow with
pulsed-wave Doppler imaging. It was defined as the time between the onset of the
QRS and aortic valve closure. A decrease in LV end-systolic volume by ≥15% of the
baseline value, as measured by echocardiography 6 months after device
implantation, was used to define a CRT responder.
Longitudinal strain signal analysis

7
Offline analysis was performed using a previously validated software pack (BT12-
EchoPAC PC, GE Healthcare). If five segments out of six were reliably tracked and
approved for speckle tracking analysis, the images were accepted. Inadequately
tracked segments were excluded from the analysis. Close attention was paid to the
placement of timing markers. The first timing marker was placed at the onset of the
QRS, and aortic valve closure was marked with the ejection time measured as
previously described (Figure 1).
Excel files of apical 4-chamber longitudinal strain analysis were exported for a
dedicated analysis performed with Matlab software (Mathworks Inc, USA). Based on
custom-made methods and algorithms, we analyzed the strain signal morphology
through the analysis of the integral of the strain curve. Integrals of strain signals were
calculated for each of the 6 available segments in two different ways: firstly, from the
beginning of the cardiac cycle (QRS onset) to the instant of the corresponding
longitudinal strain peak (IL,peak), and secondly, to the instant of aortic valve closure
(IL,avc) (Figure2). All values greater than - 5% were considered noise, and were thus
not taken into consideration in calculating the integral.
We tested a number of integral-based indicators of regional longitudinal strain
signals, all of them calculated automatically: classical parameters such as “peak
strain” (amplitude), “mean peak strain” and “SDt,peak” (standard deviation of time to
strain peak); and novel parameters: “IL,avc” and “IL,peak” for each segment, “mean IL,avc”
and “mean IL,peak”, and finally “SDIL,avc” and “SDIL,peak”, the standard deviation of the
integrals of strain signals, corresponding to the energy dispersion for all of the 6
segments. “DiffInt” was calculated as the difference between IL,avc and IL,peak for a
given segment. DiffInt might be considered an indicator of the wasted energy
developed by the ventricle after the closure of the aortic valve.
8
CRT device implantation
Indications for CRT device implantation were based on the 2010 Focused Update of
ESC guidelines for device used in heart failure therapy (patients in NYHA functional
class III or ambulatory class IV, LVEF less than or equal to 35%, and QRS duration
greater than or equal to 120 ms; or alternatively, patients in NYHA class II, LVEF less
than or equal to 35%, and QRS duration greater than or equal to 150 ms)2. Each
patient was implanted during the month following echocardiography. When required,
patients received an implantable cardiac defibrillator. Devices were implanted by a
single left pectoral incision with trans-venous LV lead insertion into a coronary sinus
vein. The placement of the LV lead was lateral for 81 patients (62%), postero-lateral
or posterior for 18 patients (14%), and other for 31 patients (24%). The right
ventricular lead was placed at the apex for 30 patients (23%), in the inter-ventricular
septum for 100 patients (77%), and not precisely determined for 31 patients (24%).
Statistical analysis
Quantitative data were expressed as mean ± standard deviation, and qualitative data
were given in numbers and percentages. The Student’s t-test was used to compare
the means between independent samples, while a paired Student’s t-test was
employed for intra-group comparisons. Dichotomized comparisons were assessed
by Chi2 test or the Fischer exact test.
Reproducibility was performed in 10 randomly selected patients based on the traces
done twice by a same observer and one time by a second observer. Intraclass
correlation coefficient (ICC)20 was calculated to assess intraobserver and
interobserver reproducibility of IL,avc and IL,peak.
The level of statistical significance was set at p<0.05.
9
Results
Study population
One hundred and thirty patients, with a mean age of 65±9 years, of whom 73% were
male (95/130), were analyzed. 107 patients (82%) were in NYHA functional class III.
All patients were on stable, maximally tolerated heart failure medication according to
the ESC guidelines. Mean LVEF was 27±6%, and QRS duration was 162±23 ms.
Heart rate did not differ between baseline and the 6-month follow-up (67±14 bpm vs.
65±11 bpm; p=0.06). Follow-up was carried out for all patients at 6.6±2.7 months. 80
(62%) patients were responders at 6-month follow-up with a mean LVESV reduction
of 42±17%. 50 (38%) patients were classified as non-responders with a mean LVESV
increase of 2±14%. Baseline clinical and echocardiographic characteristics of
responders vs. non-responders are summarized in Table 1. There were no
differences in baseline characteristics between responders and non-responders,
except for male patients, non-ischemic patients, and LBBB, that are responding
better.
Reproducibility
Mean intraobserver and interobserver ICC were, respectively, 0.90 and 0.90 for
regional IL,avc and 0.84 and 0.87 for regional IL,peak. The minimal intraobserver ICC
was 0.83 for regional basal septal IL,avc and 0.78 for regional mid septal IL,peak. The
maximal intraobserver ICC was 0.96 for regional apical septal and lateral IL,avc and
0.99 for regional apical septal IL,peak. The minimal interobserver ICC was 0.80 for
regional apical lateral IL,avc and 0.76 for regional mid septal IL,peak. The maximal
interobserver ICC was 0.97 for regional mid lateral IL,avc and 0.98 for regional basal
septal IL,peak.
10
Patterns of myocardial strain signal at baseline evaluation
In both responders and non-responders, mean IL,avc (p<0.0001) was lower than mean
IL,peak (p<0.0001), indicating that most of the segments reached their maximal
deformation after aortic valve closure (Table 2). Baseline global integral values were
comparable between responders and non-responders. SDIL,peak of all segments
differed significantly at baseline between responders and non-responders (1.15±0.57
vs. 0.99±0.48(%.s-1), respectively; p=0.02). There was no regional difference in IL,peak
at baseline evaluation between responders and non-responders (Figure 3).
Segmental strain distribution between septal and lateral wall during systole was
heterogeneous: the mean of septal IL,avc (basal, mid and apical septal segments) was
significantly greater than the mean of lateral IL,avc (basal, mid and apical lateral
segments) in responders (1.32±0.87 vs. 1.01±0.67 (%.s-1); p=0.03) and in non-
responders (1.38±0.81 vs. 0.89±0.60(%.s-1); p=0.003) (Figure 4). This heterogeneity
was comparable between responders and non-responders.
Changes in regional strain signal curves after CRT
In responders, SDIL,peak decreased significantly after CRT (Table 2). There was a
significant increase of regional mid septal IL,peak (1.71±1.32 vs. 2.13±1.07(%.s-1); p=
0.004) and mid lateral IL,peak (1.60±1.21 vs. 1.89±1.21(%.s-1); p= 0.04) after CRT in
responders (Figure 3). There was no change in SDIL,avc, whereas mean IL,avc
increased significantly after CRT (Table 2). There was a significant increase of
regional mid septal IL,avc (1.20±1.25 vs. 1.61±1.06(%.s-1); p=0.005) and mid lateral IL,avc
(0.79±0.94 vs. 1.48±1.31; p<0.0001) after CRT in responders (Figure 4). In non-
responders, SDIL,peak showed no change after CRT. Regional mid lateral IL,peak
decreased significantly after CRT (1.55±1.31 vs. 1.11±0.77(%.s-1); p=0.02) (Figure 3),
11
as did regional mid lateral IL,avc (0.82±0.96 vs. 0.53±0.76(%.s-1); p=0.02) (Figure 4).
The mid lateral IL,avc showed a relative increase of 151±276% in responders, whereas
a decrease of 33±69% was observed in non-responders at 6-month.
The same observation was made for regional mid septal IL,peak (2.13±1.07 vs.
1.89±0.96(%.s-1); p=0.004) and mid lateral IL,peak (1.89±1.21 vs. 1.11±0.77(%.s
-1);
p<0.001).
Responders no longer showed heterogeneity of strain distribution between the septal
and the lateral wall (1.51±0.81 for septal wall vs. 1.38±0.89 for lateral wall; p=0.26),
whereas non-responders still did (1.30±0.82 for septal wall vs. 0.77±0.65 for lateral
wall; p=0.0004) (Figure 4).
Differences between longitudinal strain integrals to aortic valve closure and
integrals to strain peak
The wasted energy represented by DiffInt, i.e. the difference between IL,avc and IL,peak
for one segment, was virtually the same at baseline for responders and non-
responders. In responders there was a significant decrease in DiffInt of basal and mid
lateral segments after CRT (Figure 5). DiffInt of basal and mid lateral segments
showed a relative change of -59±103% in responders, whereas in non-responders
the relative change was 21±113% (p=0.009).
Changes in regional strain peak patterns after CRT
No significant difference in segmental strain peaks was shown at baseline between
responders and non-responders, whereas SDt,peak did differ (Table 2). In responders,
a significant increase in the absolute value of mean longitudinal strain (-11.3±2.5% to
-12.2±2.8%; p=0.008) was observed, particularly for the mid lateral segment (-
12
11.3±4.6% to -12.6±4.7%; p<0.05). SDt,peak decreased in responders after CRT
(115±49 ms to 72±35 ms; p<0.0001) (Table 2). In non-responders, a significant
decrease in the absolute value of mean longitudinal strain was observed after CRT,
particularly for the mid lateral segment (-10.3±4.1 to -8.8±2.3%; p<0.05). After 6
months of CRT, mean longitudinal strain differed between responders and non-
responders (-12.2±2.8% vs. -10.4±1.6% respectively; p<0.0001), as did SDt,peak
(80±43 ms vs. 93±51 ms, respectively; p=0.006) (Table 2).
Discussion
Our study demonstrated that longitudinal strain curve integrals had an incremental
value in describing regional strain redistribution after CRT with respect to strain
peaks alone. The main findings were: (i) The standard deviation of IL,peak (SDIL,peak)
differed at baseline between responders and non-responders but the large overlap
prevents us to draw conclusion about its ability to predict CRT response; (ii)
responders showed an improvement in mid septal and mid lateral strain integrals;
and (iii) the difference between IL,peak and IL,avc (wasted energy) decreased
significantly at basal and mid lateral level in responders, whereas it did not in non-
responders. The present work's originality lies in the clues that it demonstrates that
integrals of strain signals could detect the beneficial effects of CRT on LV mechanics
and perhaps provides a tool for optimizing lead placement in the intraoperative
period. The automatic computation of integrals of the strain curves (so rapid post-
treatment after serial acquisition of apical 4-chamber views) could be tested to best
use the newly developed multipolar LV-electrods that offer a large amount of way to
pace any heart.
13
Strain redistribution after CRT
Information regarding changes in LV mechanics after CRT is limited. It has been
demonstrated that the absolute value of global strain increases after CRT17,21-24.
Indeed, Delgado et al. showed that improvement in multidirectional strain was a long-
term effect in responders and that the changes in global longitudinal strain were
related to the extent of LV reverse remodeling17. It is worthwhile to notice that, both in
that study and in ours, LV strain analysis at baseline showed similar values in
responders and non-responders and also that no change was observed immediately
after CRT device implantation. We were able to observe heterogeneity in segmental
strain changes. In a tissue Doppler strain study on 18 patients, Breithardt et al. had
previously showed reversal of septal and lateral strain amplitudes at the mid-
ventricular level in an acute-CRT study24. The heterogeneity of segmental strain
distribution in heart failure patients was present16, but in responders to CRT this
heterogeneity decreased significantly after CRT. The septal deformation was much
improved, whereas non-responders showed a significant decline in posterolateral
wall contraction. CRT apparently leads to a more uniform distribution of myocardial
strains, representing redistribution of mechanical work across the heart25-28. This
mechanical effect of an electrical therapy and the importance of such heterogeneity
in LV mechanics have also been shown previously also in myocardial metabolism.
The CRT-related mechanical observation has been associated with significant
reduction of ventricular arrhythmias28.
Strain integrals and wasted energy
Studying the integrals of the strain curves thus appears to be a promising new
concept for assessing LV mechanics. The present study provides clues for perhaps a
14
better understanding of the response to CRT. Our method, based on a custom-made
algorithm, differs from current approaches based on the analysis of strain peaks that
are probably less reproducible and robust. We demonstrated that intra and inter
observer variabilities were clinically valid. Over the past few years, speckle tracking
has brought out new concepts on mechanical dyssynchrony that focus more on the
myocardial substrate than on temporal dyssynchrony12,29. Chan et al demonstrated
recently that systolic rebound stretch in the septal wall and strain delay index rather
than time delay indices provided significant incremental value over clinical
characteristics when predicting CRT response14.
Our study concentrates on strain integrals, taking into account their morphology,
which is neglected when analyzing strain peaks alone. To our knowledge, only the
recent work by Russell K et al30 has also focused on a more detailed analysis of
strain signals, estimating the amount of physical work performed by each LV
segment. Although preliminary results of this method are encouraging, it requires a
comparative large-prospective and multicenter evaluation. If this large comparative
study takes place in the future, our proposed approach could be tested at the same
time. The advantage of our method is that it focuses on two specific temporal
supports of the cardiac cycle (QRS onset to AC and QRS onset to peak instants) and
the difference between them. The proposed integral-based indicators give an
estimation of the wasted energy, which makes it possible to exclude those segments
of the LV that apparently do not take an active part in the synchronized deformation
contributing to improved cardiac output after CRT. Our results demonstrated that
there was a more pronounced wasted energy in responders and that it has been
corrected by the biventricular pacing. As proposed by De Boeck et al10, our study
highlights the relevance of effective recruitment. We demonstrated the importance of
15
precisely assessing the effect of CRT on the LV lateral wall myocardium, as it
appears to play a key role in improving overall LV function. It reinforces the
conclusion obtained a few years ago that a certain degree of myocardial fibrosis in
the LV lateral wall as determined by cardiac magnetic resonance is a marker of non-
response31.
Study limitations
Only the pre-operative and the 6-month follow-up echocardiographies were
considered. Further studies will need to look for the acute effect of CRT on strain
integrals. We focused on the apical 4-chamber longitudinal strain values, which
simplifies evaluation by lowering data loss and enhancing reproducibility. This
excludes exploration of the infero-lateral and the anterior LV walls, a task that could
be carried out using the software that has been developed in our lab. According to a
receiver operating characteristic analysis performed by varying the cutoff values from
0% to -10% insteps of -1% on a randomly chosen sub-set of data, a cutoff value of -
5% produced the best tradeoff between classification performance and false alarm
rate. All values greater than - 5% were thus, considered noise, and were thus not
taken into consideration in calculating the integral.
Clinical implication
There is still skepticism in regard to the potential of quantitative echographic
assessment of LV mechanics for improvement in the quality of care for patients
amenable to CRT. Electrophysiologists know from clinical experience that the pacing
configuration sometimes remains inappropriate after implantation. Several solutions
have been recently proposed in the literature, but they have not yet provided
evidence of their utility in clinical settings32,33. In the present study we provide
16
evidence that the analysis of strain integrals may be a potential tool for intraoperative
and postoperative optimization of CRT. Recent randomized studies have
demonstrated that radial strain could help in guiding the placement of the LV lead15,34
by assessing which area of the LV is activated last, which even in typical LBBB is not
always the same. Likewise, the strain integrals we are proposing in the present study
could be applied to optimize pacing modality during implantation. The emergence of
new multipolar leads, requiring optimal pacing modalities, could take advantage of
our technique's precise description of lateral wall mechanics.
Conclusion
The analysis of strain signal morphology through the analysis of strain integrals
brought out changes between baseline and CRT in the lateral wall, demonstrating the
ability of this parameter to detect the beneficial effects of CRT on LV mechanics and
providing a potential new tool for intraoperative optimization of CRT.
17
References
1. Chung ES, Leon AR, Tavazzi L, Sun J-P, Nihoyannopoulos P, Merlino J et al.
Results of the Predictors of Response to CRT (PROSPECT) trial. Circulation
2008;117:2608–2616.
2. Dickstein K, Vardas PE, Auricchio A, Daubert J-C, Linde C, McMurray J et al.
2010 Focused Update of ESC Guidelines on device therapy in heart failure: An
update of the 2008 ESC Guidelines for the diagnosis and treatment of acute
and chronic heart failure and the 2007 ESC guidelines for cardiac and
resynchronization therapy Developed with the special contribution of the Heart
Failure Association and the European Heart Rhythm Association. Eur Heart J
2010;31:2677–2687.
3. Daubert J-C, Saxon L, Adamson PB, Auricchio A, Berger RD, Beshai JF et al.
2012 EHRA/HRS expert consensus statement on cardiac resynchronization
therapy in heart failure: implant and follow-up recommendations and
management. Heart Rhythm 2012;9:1524–1576.
4. Brignole M, Auricchio A, Baron-Esquivias G, Bordachar P, Boriani G, Breithardt
OA et al. 2013 ESC Guidelines on cardiac pacing and cardiac
resynchronization therapy: the Task Force on cardiac pacing and
resynchronization therapy of the European Society of Cardiology (ESC).
Developed in collaboration with the European Heart Rhythm Association
(EHRA). Eur Heart J 2013;34:2281–2329.
5. Young JB, Abraham WT, Smith AL, Leon AR, Lieberman R, Wilkoff B et al.
Combined cardiac resynchronization and implantable cardioversion
18
defibrillation in advanced chronic heart failure: the MIRACLE ICD Trial. JAMA.
2003;289:2685–2694.
6. Bertini M, Hoke U, van Bommel RJ, Ng ACT, Shanks M, Nucifora G et al.
Impact of clinical and echocardiographic response to cardiac resynchronization
therapy on long-term survival. Eur Heart J Cardiovasc Imaging 2013;14:774–
781.
7. Beshai JF, Grimm RA, Nagueh SF, Baker JH, Beau SL, Greenberg SM et al.
Cardiac-resynchronization therapy in heart failure with narrow QRS complexes.
N Engl J Med 2007;357:2461–2471.
8. Ruschitzka F, Abraham WT, Singh JP, Bax JJ, Borer JS, Brugada J et al.
Cardiac-Resynchronization Therapy in Heart Failure with a Narrow QRS
Complex. N Engl J Med 2013;369:1395–1405.
9. Sohaib SMA, Chen Z, Whinnett ZI, Bouri S, Dickstein K, Linde C et al. Meta-
analysis of symptomatic response attributable to the pacing component of
cardiac resynchronization therapy. Eur J Heart Fail 2013;15:1419–1428.
10. De Boeck BWL, Teske AJ, Meine M, Leenders GE, Cramer MJ, Prinzen FW et
al. Septal rebound stretch reflects the functional substrate to cardiac
resynchronization therapy and predicts volumetric and neurohormonal
response. Eur J Heart Fail 2009;11:863–871.
11. Muto C, Gasparini M, Neja CP, Iacopino S, Davinelli M, Zanon F et al.
Presence of left ventricular contractile reserve predicts midterm response to
cardiac resynchronization therapy—results from the LOw dose DObutamine
Stress-Echo Test in Cardiac Resynchronization Therapy (LODO-CRT) Trial.
19
Heart Rhythm 2010;7:1600–1605.
12. Lim P, Donal E, Lafitte S, Derumeaux G, Habib G, Reant P et al. Multicentre
study using strain delay index for predicting response to cardiac
resynchronization therapy (MUSIC study). Eur J Heart Fail 2011;13:984–991.
13. Inden Y, Ito R, Yoshida N, Kamiya H, Kitamura K, Kitamura T et al. Combined
assessment of left ventricular dyssynchrony and contractility by speckled
tracking strain imaging: A novel index for predicting responders to cardiac
resynchronization therapy. Heart Rhythm 2012;7:655–661.
14. Chan Y-H, Wu L-S, Kuo C-T, Wang C-L, Yeh Y-H, Ho W-J e al. Incremental
value of inefficient deformation indices for predicting response to cardiac
resynchronization therapy. J Am Soc Echocardiogr 2013;26:307–315.
15. Khan FZ, Virdee MS, Palmer CR, Pugh PJ, O'Halloran D, Elsik M et al.
Targeted left ventricular lead placement to guide cardiac resynchronization
therapy: the TARGET study: a randomized, controlled trial. J Am Coll Cardiol.
2012;59:1509–1518.
16. Klimusina J, De Boeck BW, Leenders GEH, Faletra FF, Prinzen F, Averaimo M
et al. Redistribution of left ventricular strain by cardiac resynchronization
therapy in heart failure patients. Eur J Heart Fail 2011;13:186–194.
17. Delgado V, Ypenburg C, Zhang Q, Mollema SA, Fung JW, Schalij MJ et al.
Changes in Global Left Ventricular Function by Multidirectional Strain
Assessment in Heart Failure Patients Undergoing Cardiac Resynchronization
Therapy. J Am Soc Echocardiogr 2009;22:688–694.
20
18. Felker GM, Shaw LK, O'Connor CM. A standardized definition of ischemic
cardiomyopathy for use in clinical research. J Am Coll Cardiol 2002;39:210–
218.
19. Lang RM, Bierig M, Devereux RB, Flachskampf FA, Foster E, Pellikka PA et al.
Recommendations for chamber quantification. Eur J Echocardiogr 2006;7:79–
108.
20. Deyo RA, Diehr P, Patrick DL. Reproducibility and responsiveness of health
status measures. Statistics and strategies for evaluation. Control Clin Trials
1991;12:142S–158S.
21. Zhang Q, Fung JW-H, Yip GWK, Chan JY-S, Lee AP-W, Lam Y-Y et al.
Improvement of left ventricular myocardial short-axis, but not long-axis function
or torsion after cardiac resynchronisation therapy: an assessment by two-
dimensional speckle tracking. Heart 2008;94:1464–1471.
22. Becker M, Franke A, Breithardt OA, Ocklenburg C, Kaminski T, Kramann R et
al. Impact of left ventricular lead position on the efficacy of cardiac
resynchronisation therapy: a two-dimensional strain echocardiography study.
Heart 2007;93:1197–1203.
23. Delgado V, Ypenburg C, van Bommel RJ, Tops LF, Mollema SA, Marsan NA et
al. Assessment of Left Ventricular Dyssynchrony by Speckle Tracking Strain
Imaging. J Am Coll Cardiol 2008;51:1944–1952.
24. Breithardt OA, Stellbrink C, Herbots L, Claus P, Sinha AM, Bijnens B et al.
Cardiac resynchronization therapy can reverse abnormal myocardial strain
distribution in patients with heart failure and left bundle branch block. J Am Coll
21
Cardiol 2003;42:486–494.
25. Ukkonen H, Beanlands RS, Burwash IG, de Kemp RA, Nahmias C, Fallen E et
al. Effect of Cardiac Resynchronization on Myocardial Efficiency and Regional
Oxidative Metabolism. Circulation 2002;107:28–31.
26. Nelson GS, Berger RD, Fetics BJ, Talbot M, Spinelli JC, Hare JM et al. Left
Ventricular or Biventricular Pacing Improves Cardiac Function at Diminished
Energy Cost in Patients With Dilated Cardiomyopathy and Left Bundle-Branch
Block. Circulation 2000;102:3053–3059.
27. Vernooy K, Cornelussen RNM, Verbeek XAAM, Vanagt WYR, van Hunnik A,
Kuiper M et al. Cardiac resynchronization therapy cures dyssynchronopathy in
canine left bundle-branch block hearts. Eur Heart J 2007;28:2148–2155.
28. Kutyifa V, Pouleur A-C, Knappe D, Al-Ahmad A, Gibinski M, Wang PJ et al.
Dyssynchrony and the risk of ventricular arrhythmias. JACC Cardiovasc
Imaging 2013;6:432–444.
29. Parsai C, Bijnens B, Sutherland GR, Baltabaeva A, Claus P, Marciniak M et al.
Toward understanding response to cardiac resynchronization therapy: left
ventricular dyssynchrony is only one of multiple mechanisms. Eur Heart J
2008;30:940–949.
30. Russell K, Eriksen M, Aaberge L, Wilhelmsen N, Skulstad H, Gjesdal O et al.
Assessment of wasted myocardial work: a novel method to quantify energy
loss due to uncoordinated left ventricular contractions. Am J Physiol Heart and
Circulatory Physiology 2013;305:H996–1003.
22
31. Marsan NA, Westenberg JJM, Ypenburg C, van Bommel RJ, Roes S, Delgado
V et al. Magnetic resonance imaging and response to cardiac
resynchronization therapy: relative merits of left ventricular dyssynchrony and
scar tissue. Eur Heart J 2009;30:2360–2367.
32. Abraham WT, Gras D, Yu CM, Guzzo L, Gupta MS; FREEDOM Steering
Committee. Rationale and design of a randomized clinical trial to assess the
safety and efficacy of frequent optimization of cardiac resynchronization
therapy: The Frequent Optimization Study Using the QuickOpt Method
(FREEDOM) trial. Am Heart J 2010;159:944–948.
33. Donal E, Giorgis L, Cazeau S, Leclercq C, Senhadji L, Amblard A et al.
Endocardial acceleration (sonR) vs. ultrasound-derived time intervals in
recipients of cardiac resynchronization therapy systems. Europace
2011;13:402–408.
34. Thebault C, Donal E, Meunier C, Gervais R, Gerritse B, Gold MR et al. Sites of
left and right ventricular lead implantation and response to cardiac
resynchronization therapy observations from the REVERSE trial. Eur Heart J
2012;33:2662–2671.
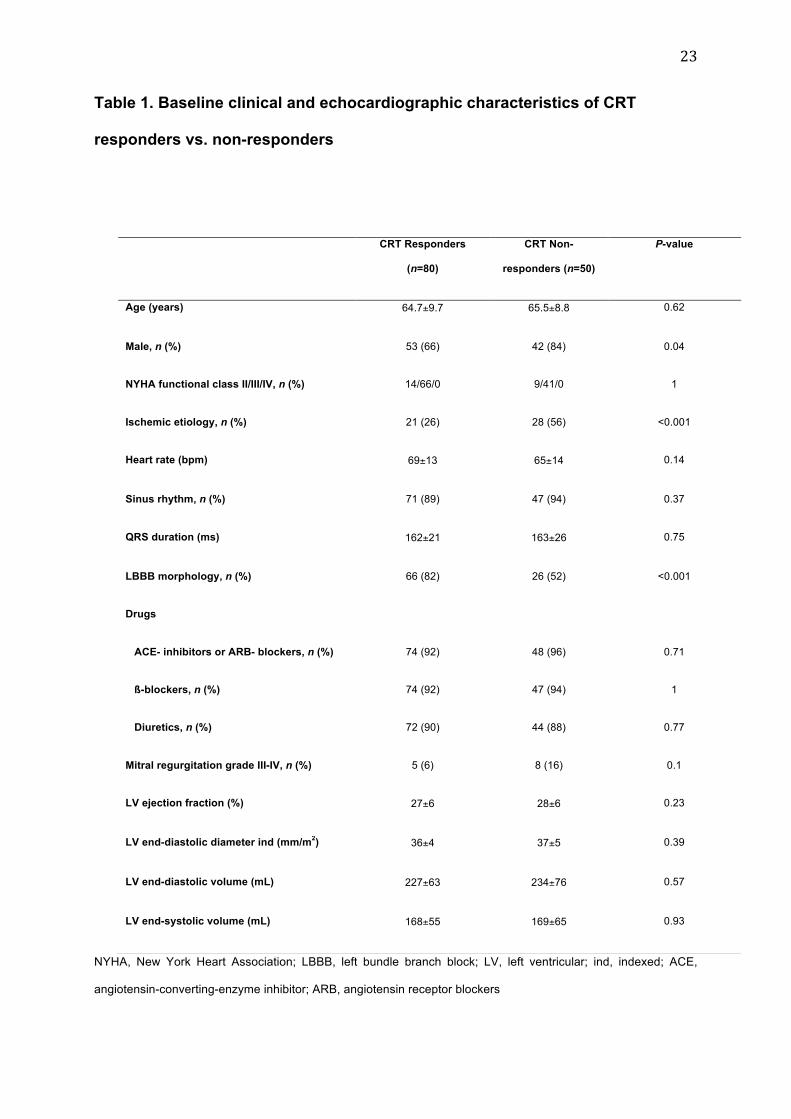
23
Table 1. Baseline clinical and echocardiographic characteristics of CRT
responders vs. non-responders
NYHA, New York Heart Association; LBBB, left bundle branch block; LV, left ventricular; ind, indexed; ACE,
angiotensin-converting-enzyme inhibitor; ARB, angiotensin receptor blockers
CRT Responders
(n=80)
CRT Non-
responders (n=50)
P-value
Age (years) 64.7±9.7 65.5±8.8 0.62
Male, n (%) 53 (66) 42 (84) 0.04
NYHA functional class II/III/IV, n (%) 14/66/0 9/41/0 1
Ischemic etiology, n (%) 21 (26) 28 (56) <0.001
Heart rate (bpm) 69±13 65±14 0.14
Sinus rhythm, n (%) 71 (89) 47 (94) 0.37
QRS duration (ms) 162±21 163±26 0.75
LBBB morphology, n (%) 66 (82) 26 (52) <0.001
Drugs
ACE- inhibitors or ARB- blockers, n (%) 74 (92) 48 (96) 0.71
ß-blockers, n (%) 74 (92) 47 (94) 1
Diuretics, n (%) 72 (90) 44 (88) 0.77
Mitral regurgitation grade III-IV, n (%) 5 (6) 8 (16) 0.1
LV ejection fraction (%) 27±6 28±6 0.23
LV end-diastolic diameter ind (mm/m2) 36±4 37±5 0.39
LV end-diastolic volume (mL) 227±63 234±76 0.57
LV end-systolic volume (mL) 168±55 169±65 0.93
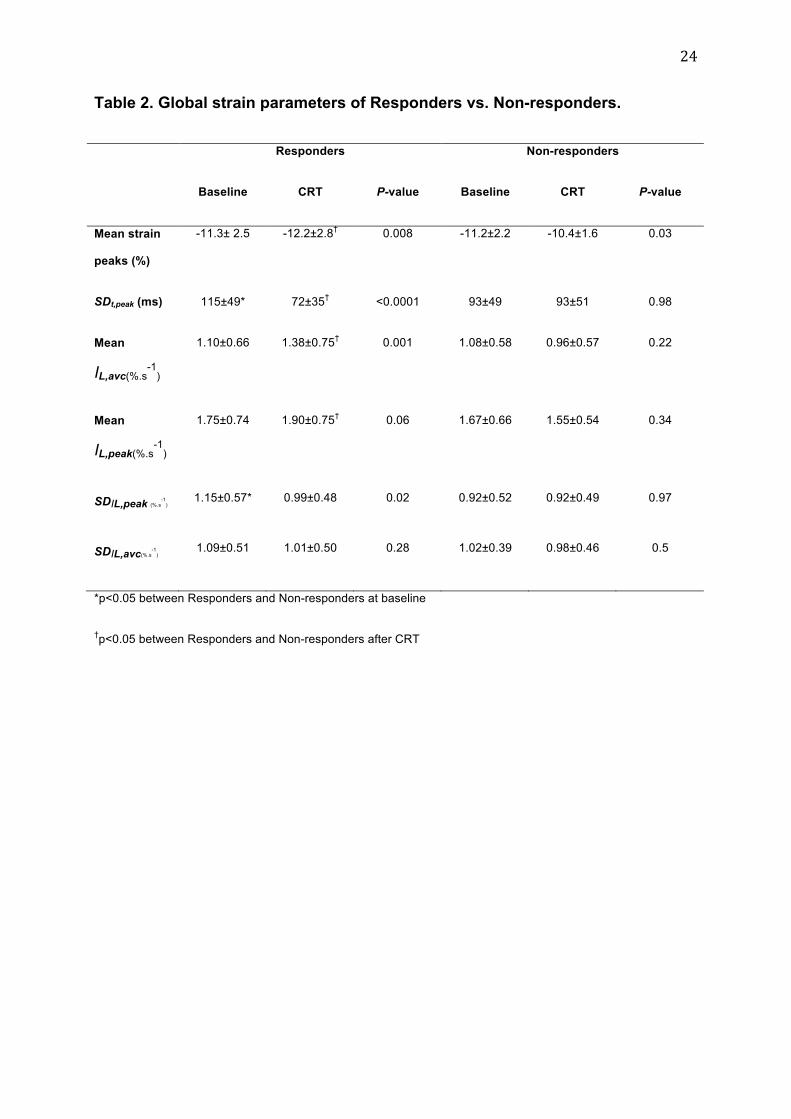
24
Table 2. Global strain parameters of Responders vs. Non-responders.
Responders Non-responders
Baseline CRT P-value Baseline CRT P-value
Mean strain
peaks (%)
-11.3± 2.5 -12.2±2.8† 0.008 -11.2±2.2 -10.4±1.6 0.03
SDt,peak (ms) 115±49* 72±35† <0.0001 93±49 93±51 0.98
Mean
IL,avc(%.s-1
)
1.10±0.66 1.38±0.75† 0.001 1.08±0.58 0.96±0.57 0.22
Mean
IL,peak(%.s-1
)
1.75±0.74 1.90±0.75† 0.06 1.67±0.66 1.55±0.54 0.34
SDIL,peak (%.s-1
) 1.15±0.57* 0.99±0.48 0.02 0.92±0.52 0.92±0.49 0.97
SDIL,avc(%.s-1
) 1.09±0.51 1.01±0.50 0.28 1.02±0.39 0.98±0.46 0.5
*p<0.05 between Responders and Non-responders at baseline
†p<0.05 between Responders and Non-responders after CRT
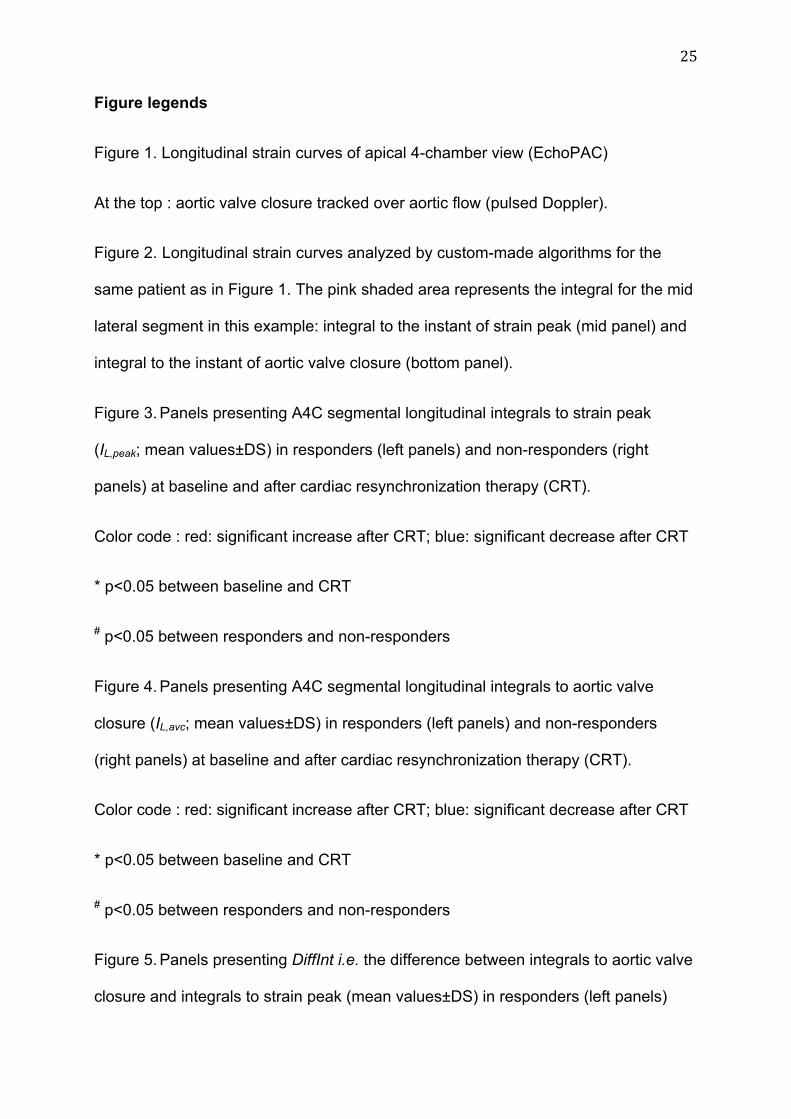
25
Figure legends
Figure 1. Longitudinal strain curves of apical 4-chamber view (EchoPAC)
At the top : aortic valve closure tracked over aortic flow (pulsed Doppler).
Figure 2. Longitudinal strain curves analyzed by custom-made algorithms for the
same patient as in Figure 1. The pink shaded area represents the integral for the mid
lateral segment in this example: integral to the instant of strain peak (mid panel) and
integral to the instant of aortic valve closure (bottom panel).
Figure 3. Panels presenting A4C segmental longitudinal integrals to strain peak
(IL,peak; mean values±DS) in responders (left panels) and non-responders (right
panels) at baseline and after cardiac resynchronization therapy (CRT).
Color code : red: significant increase after CRT; blue: significant decrease after CRT
* p<0.05 between baseline and CRT
# p<0.05 between responders and non-responders
Figure 4. Panels presenting A4C segmental longitudinal integrals to aortic valve
closure (IL,avc; mean values±DS) in responders (left panels) and non-responders
(right panels) at baseline and after cardiac resynchronization therapy (CRT).
Color code : red: significant increase after CRT; blue: significant decrease after CRT
* p<0.05 between baseline and CRT
# p<0.05 between responders and non-responders
Figure 5. Panels presenting DiffInt i.e. the difference between integrals to aortic valve
closure and integrals to strain peak (mean values±DS) in responders (left panels)

26
and non-responders (right panels) at baseline and after cardiac resynchronization
therapy (CRT).
Color code : red: significant increase after CRT
* p<0.05 between baseline and CRT
# p<0.05 between responders and non-responders
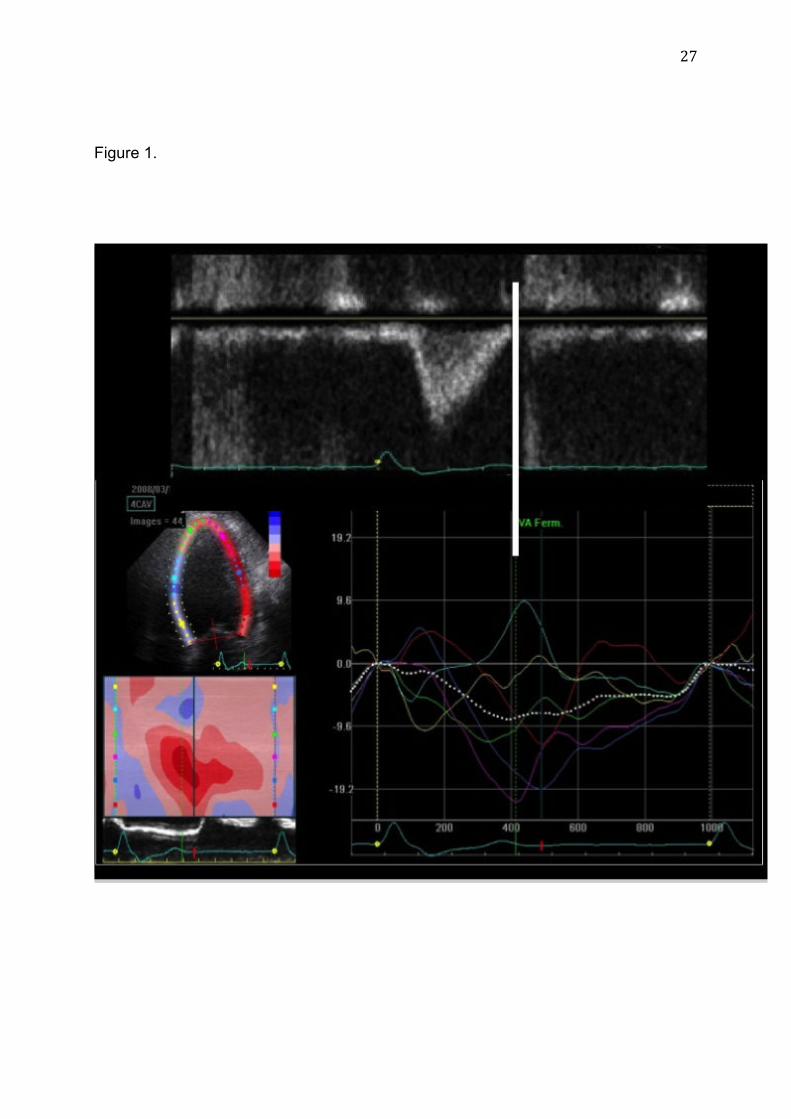
27
Figure 1.
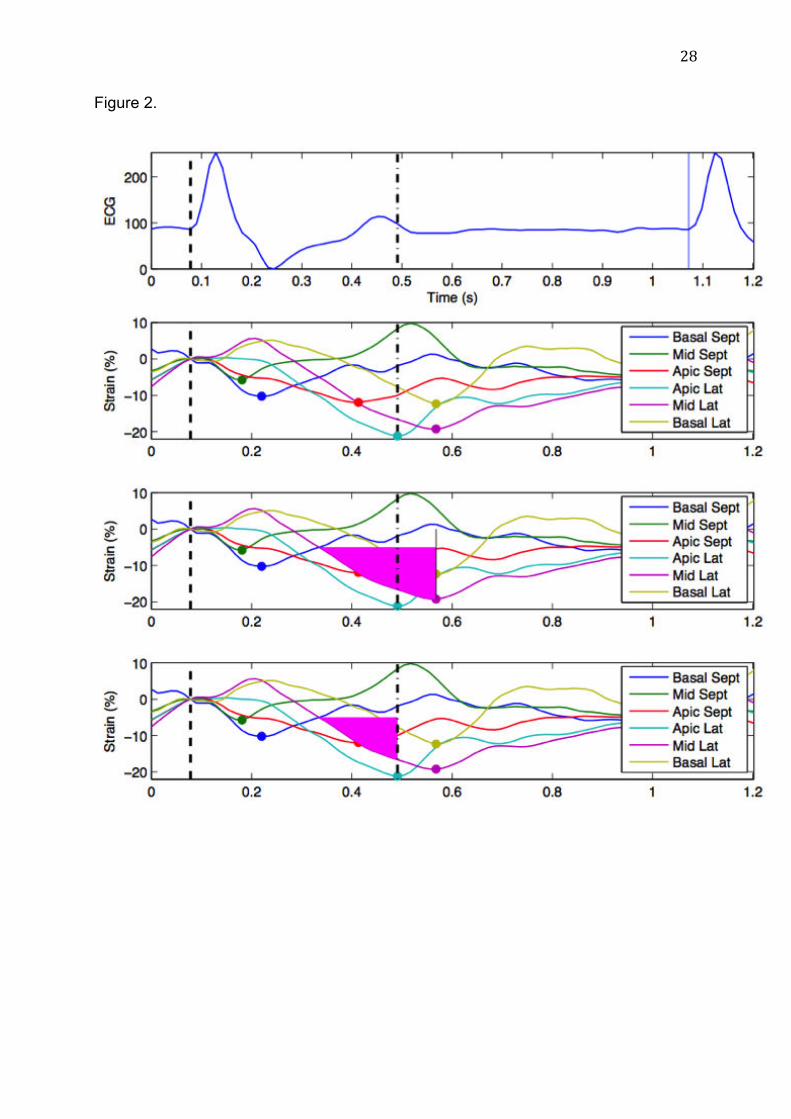
28
Figure 2.
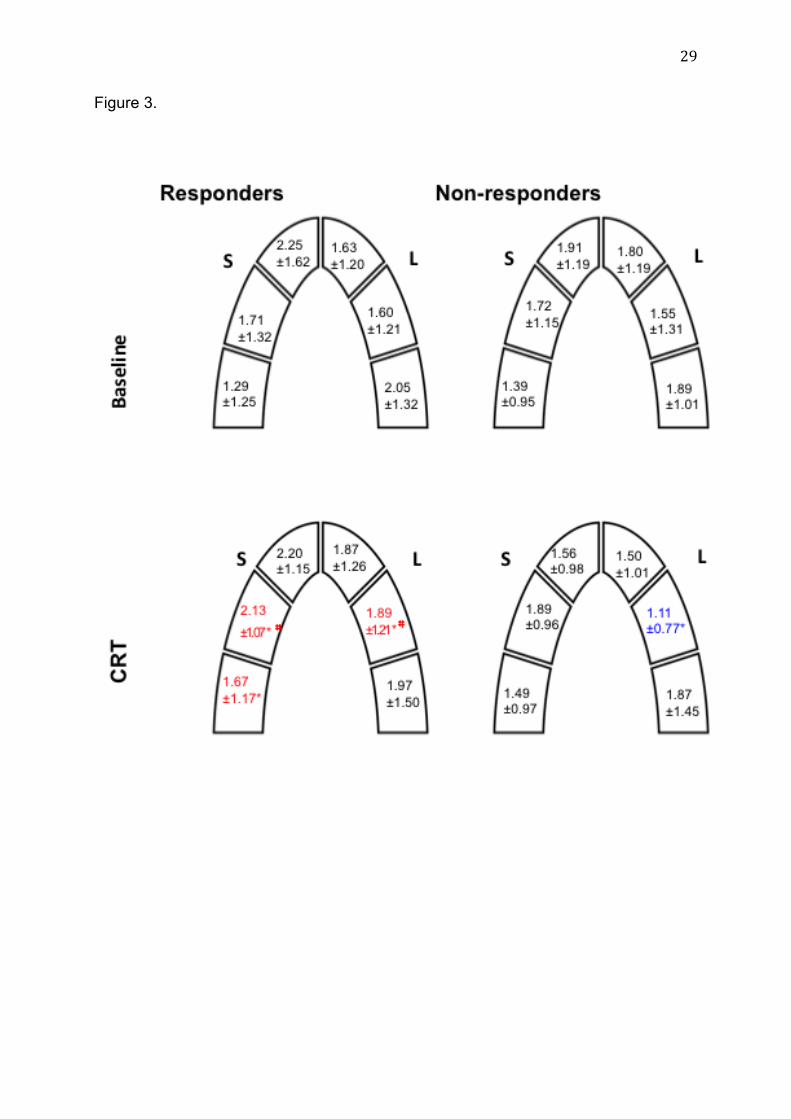
29
Figure 3.
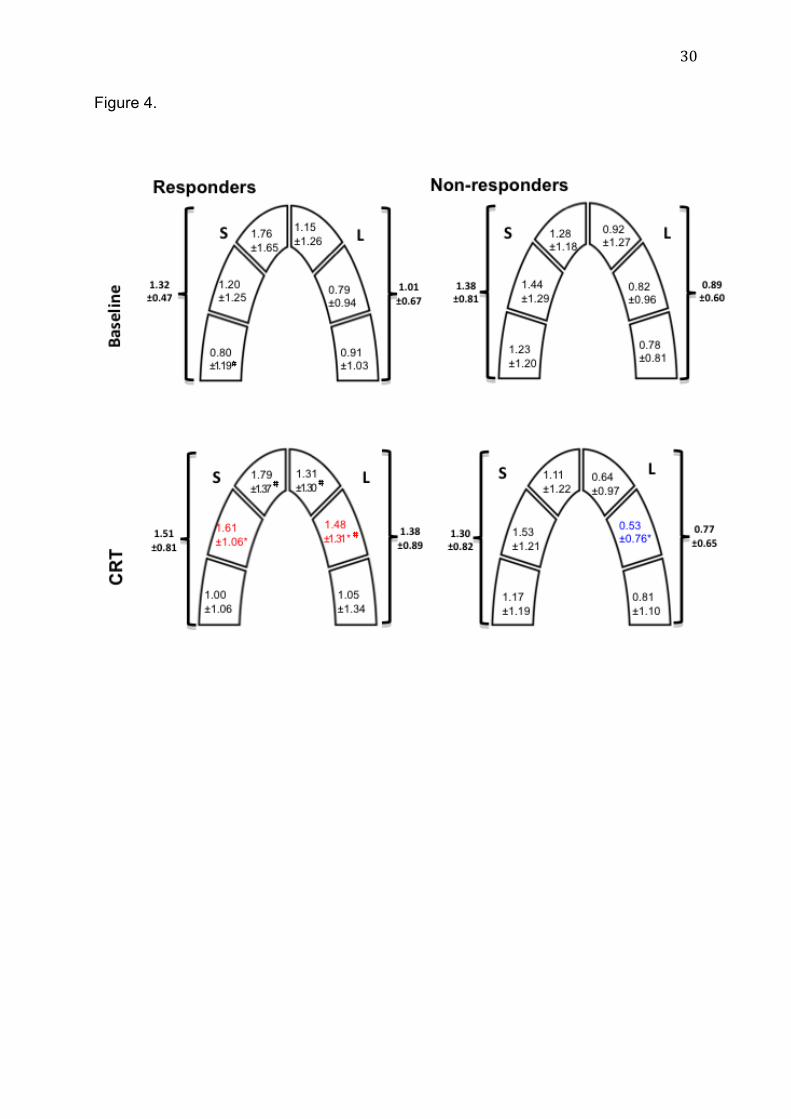
30
Figure 4.
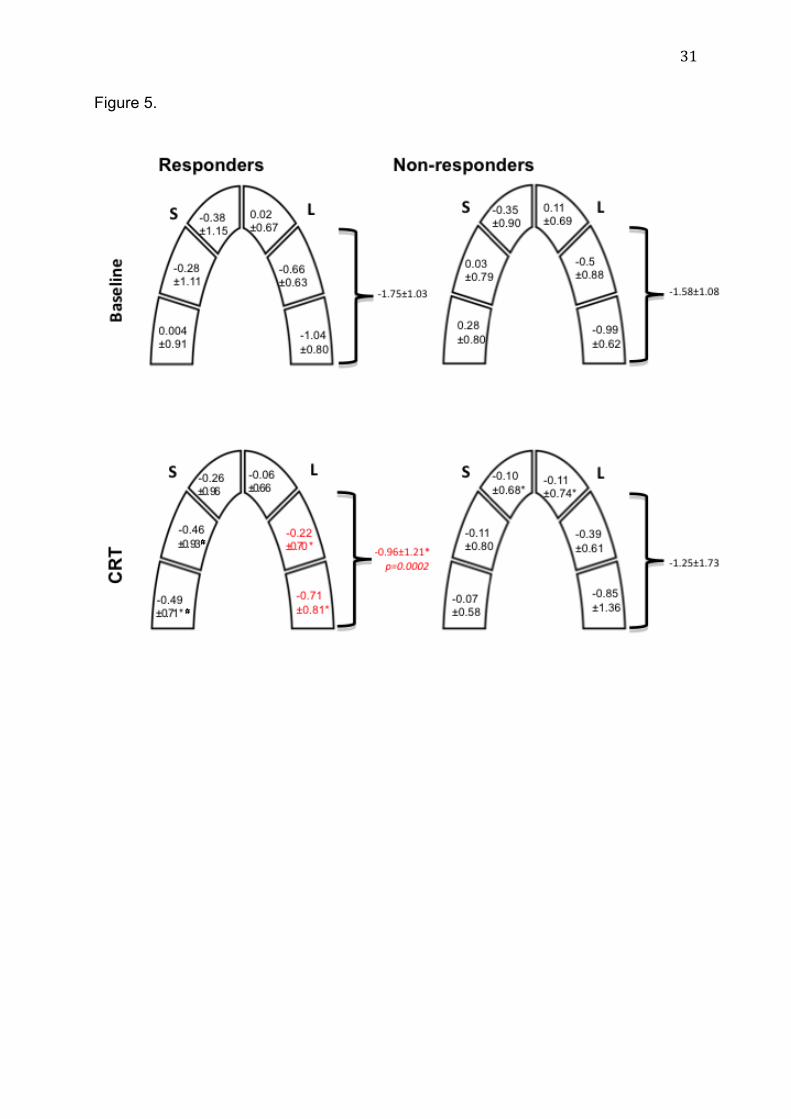
31
Figure 5.
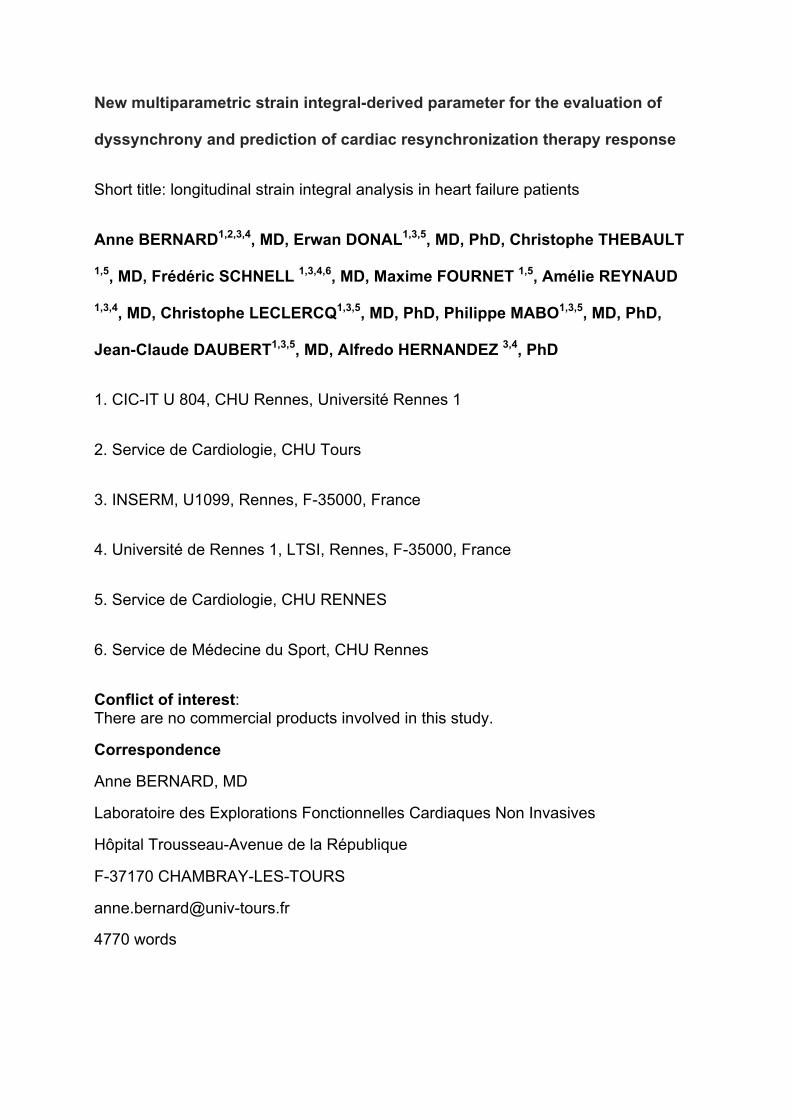
New multiparametric strain integral-derived parameter for the evaluation of
dyssynchrony and prediction of cardiac resynchronization therapy response
Short title: longitudinal strain integral analysis in heart failure patients
Anne BERNARD1,2,3,4, MD, Erwan DONAL1,3,5, MD, PhD, Christophe THEBAULT
1,5, MD, Frédéric SCHNELL 1,3,4,6, MD, Maxime FOURNET 1,5, Amélie REYNAUD
1,3,4, MD, Christophe LECLERCQ1,3,5, MD, PhD, Philippe MABO1,3,5, MD, PhD,
Jean-Claude DAUBERT1,3,5, MD, Alfredo HERNANDEZ 3,4, PhD
1. CIC-IT U 804, CHU Rennes, Université Rennes 1
2. Service de Cardiologie, CHU Tours
3. INSERM, U1099, Rennes, F-35000, France
4. Université de Rennes 1, LTSI, Rennes, F-35000, France
5. Service de Cardiologie, CHU RENNES
6. Service de Médecine du Sport, CHU Rennes
Conflict of interest: There are no commercial products involved in this study.
Correspondence
Anne BERNARD, MD
Laboratoire des Explorations Fonctionnelles Cardiaques Non Invasives
Hôpital Trousseau-Avenue de la République
F-37170 CHAMBRAY-LES-TOURS
4770 words
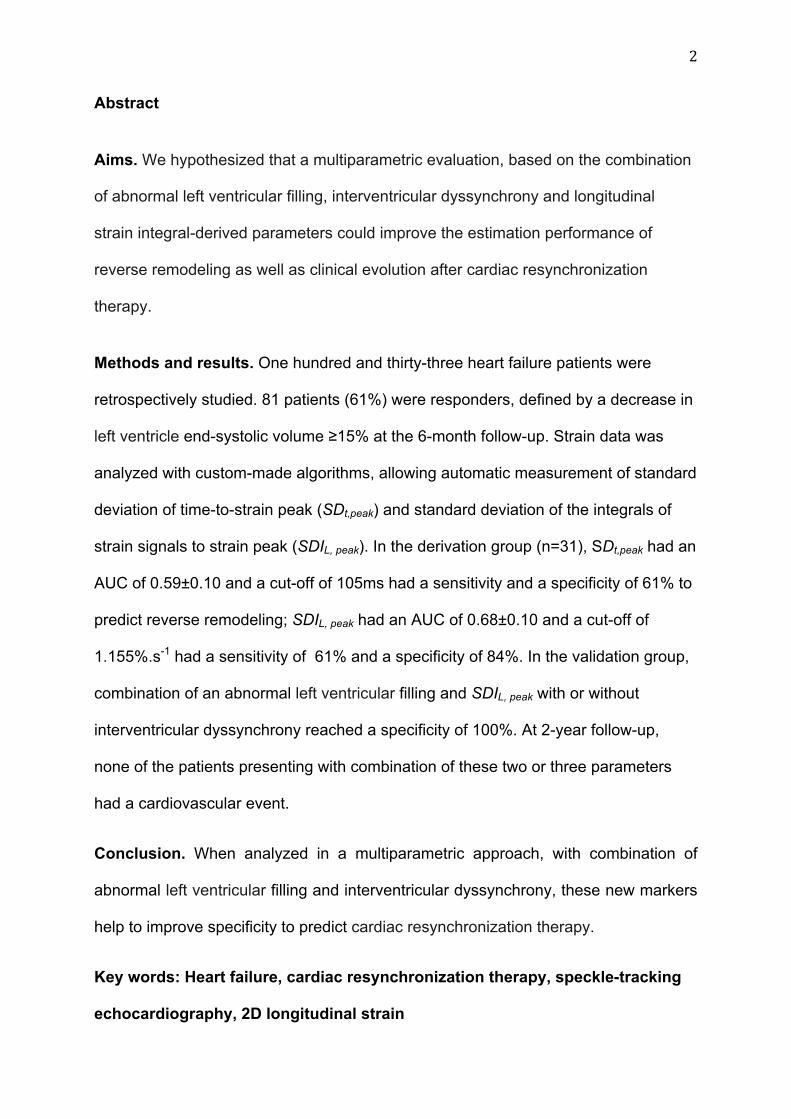
2
Abstract
Aims. We hypothesized that a multiparametric evaluation, based on the combination
of abnormal left ventricular filling, interventricular dyssynchrony and longitudinal
strain integral-derived parameters could improve the estimation performance of
reverse remodeling as well as clinical evolution after cardiac resynchronization
therapy.
Methods and results. One hundred and thirty-three heart failure patients were
retrospectively studied. 81 patients (61%) were responders, defined by a decrease in
left ventricle end-systolic volume ≥15% at the 6-month follow-up. Strain data was
analyzed with custom-made algorithms, allowing automatic measurement of standard
deviation of time-to-strain peak (SDt,peak) and standard deviation of the integrals of
strain signals to strain peak (SDIL, peak). In the derivation group (n=31), SDt,peak had an
AUC of 0.59±0.10 and a cut-off of 105ms had a sensitivity and a specificity of 61% to
predict reverse remodeling; SDIL, peak had an AUC of 0.68±0.10 and a cut-off of
1.155%.s-1 had a sensitivity of 61% and a specificity of 84%. In the validation group,
combination of an abnormal left ventricular filling and SDIL, peak with or without
interventricular dyssynchrony reached a specificity of 100%. At 2-year follow-up,
none of the patients presenting with combination of these two or three parameters
had a cardiovascular event.
Conclusion. When analyzed in a multiparametric approach, with combination of
abnormal left ventricular filling and interventricular dyssynchrony, these new markers
help to improve specificity to predict cardiac resynchronization therapy.
Key words: Heart failure, cardiac resynchronization therapy, speckle-tracking
echocardiography, 2D longitudinal strain

3
Introduction
Previous studies have suggested that the analysis of mechanical dyssynchrony can
improve prediction of response to cardiac resynchronization therapy. Recent
guidelines for cardiac resynchronization therapy1,2 still neglect the value of left
ventricular mechanical dyssynchrony, as assessed with imaging techniques,
particularly because of the negative results of the PROSPECT trial3.
Conventional tissue Doppler imaging4,5 and certain speckle-tracking-based
echocardiographic analyses6 of intraventricular mechanical dyssynchrony are
grounded only on the manual detection of velocity peak instants or strain peak
instants, opposing the septal wall to the inferior or lateral wall. In most situations
these methods cannot reflect the complexity of a dyssynchronized heart, resulting in
a high rate of false-positive despite the emergence of new echocardiographic
technics. A multiparametric evaluation of mechanical dyssynchrony, considering the
three levels of dyssynchrony (atrio-ventricular, interventricular and intraventricular)
can overcome some of these difficulties by reducing variability and increasing
specificity of the tests7.
Moreover, if timings classically appear to be the main tool to characterize mechanical
dyssynchrony, myocardial deformations have also to be taken into account in order
to insure myocardial contraction after resynchronization8.
We sought that a new approach, based on the semi-automatic quantification of the
integrals of regional longitudinal strain signals, should provide valuable information
on dyssynchrony. Indeed, integrals of strain signals provide the advantage to
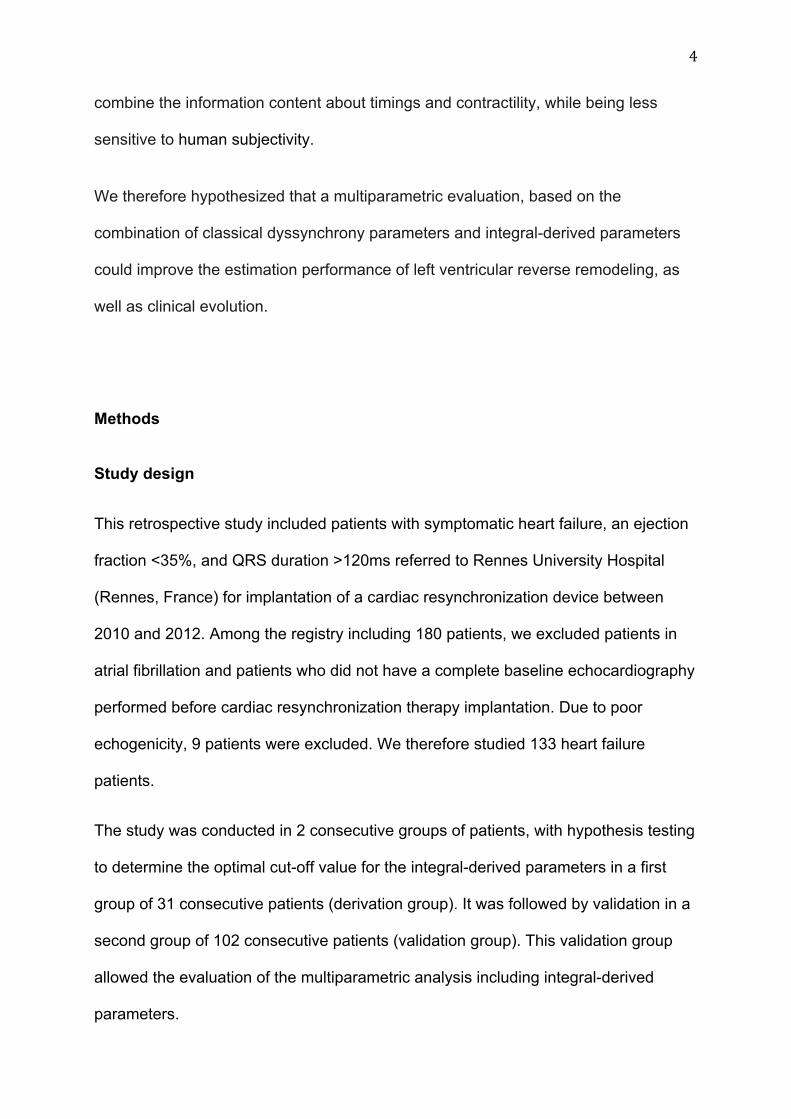
4
combine the information content about timings and contractility, while being less
sensitive to human subjectivity.
We therefore hypothesized that a multiparametric evaluation, based on the
combination of classical dyssynchrony parameters and integral-derived parameters
could improve the estimation performance of left ventricular reverse remodeling, as
well as clinical evolution.
Methods
Study design
This retrospective study included patients with symptomatic heart failure, an ejection
fraction <35%, and QRS duration >120ms referred to Rennes University Hospital
(Rennes, France) for implantation of a cardiac resynchronization device between
2010 and 2012. Among the registry including 180 patients, we excluded patients in
atrial fibrillation and patients who did not have a complete baseline echocardiography
performed before cardiac resynchronization therapy implantation. Due to poor
echogenicity, 9 patients were excluded. We therefore studied 133 heart failure
patients.
The study was conducted in 2 consecutive groups of patients, with hypothesis testing
to determine the optimal cut-off value for the integral-derived parameters in a first
group of 31 consecutive patients (derivation group). It was followed by validation in a
second group of 102 consecutive patients (validation group). This validation group
allowed the evaluation of the multiparametric analysis including integral-derived
parameters.

5
This study was performed in accordance with the principles outlined in the
Declaration of Helsinki on research in human subjects and with the procedures of the
local Medical Ethics Committee (usual care).
Cardiac resynchronization device implantation
Indications for cardiac resynchronization device implantation were based on the 2010
Focused Update of ESC guidelines for device use in heart failure therapy9. Each
patient had the implantation performed during the month following echocardiography.
When required, patients received an implantable cardiac defibrillator.
Echocardiography analysis
All patients had a complete baseline echocardiography before implantation (GE,
Vingmed System 7, Horten, Norway) including standard gray-scale (frame rate ≥
50Hz) and color TDI (frame rate > 100 Hz) in the apical views (2-, 3-, and 4-chamber
views). Two-dimensional echocardiographic, Doppler, and TDI parameters were
measured according to the guidelines of the American Society of
Echocardiography10,11 by a certified senior in echocardiography. All measurements
were averaged for 3 cardiac cycles. Left ventricular volumes and ejection fraction
were calculated using the biplane modified Simpson method. Systolic ejection time
was measured by recording aortic flow with pulsed-wave Doppler imaging. It was
defined as the time between the onset of the QRS and aortic valve closure.
Conventional dyssynchrony parameters

6
Conventional dyssynchrony parameters were analyzed manually as follows:
1) Abnormal left ventricular filling was characterized by a filling time duration
divided by the R-R interval<40%12.
2) Interventricular dyssynchrony was determined using continuous-wave
Doppler technique on the aorta and pulmonary artery, measuring the difference in
time from QRS onset to initial flow spectrum in the pulmonary and aortic outflow
tracts (a time difference >40ms characterized an inter-ventricular dyssynchrony)12.
3) Intraventricular dyssynchrony was assessed using two techniques:
a. septo-lateral delay: the septal to lateral wall delay, as analyzed by
color tissue Doppler Imaging13
b. radial strain delay: the delay between anteroseptal radial strain and
inferior lateral radial strain, as analyzed by speckle tracking
echocardiography6.
This approach is favored by the 2008 report from the American Society of
Echocardiography Dyssynchrony Writing Group Endorsed by the Heart Rhythm
Society14.
Longitudinal strain integral-derived parameters
Offline analysis was performed using a previously validated software pack (BT12-
EchoPAC PC, GE Healthcare). If six segments out of seven were reliably tracked
and approved for speckle tracking analysis, the images were accepted. Inadequately
tracked segments were excluded from the analysis. Much attention was paid to the
placement of timing markers. The first timing marker was placed at the onset of the
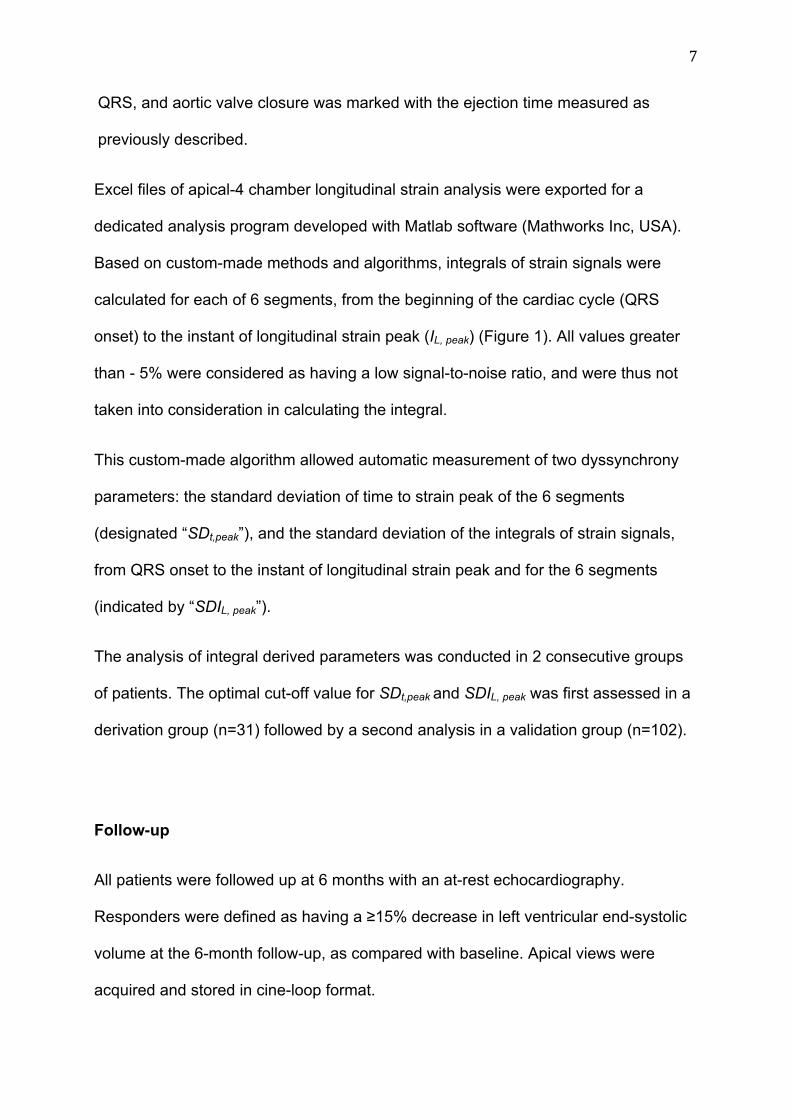
7
QRS, and aortic valve closure was marked with the ejection time measured as
previously described.
Excel files of apical-4 chamber longitudinal strain analysis were exported for a
dedicated analysis program developed with Matlab software (Mathworks Inc, USA).
Based on custom-made methods and algorithms, integrals of strain signals were
calculated for each of 6 segments, from the beginning of the cardiac cycle (QRS
onset) to the instant of longitudinal strain peak (IL, peak) (Figure 1). All values greater
than - 5% were considered as having a low signal-to-noise ratio, and were thus not
taken into consideration in calculating the integral.
This custom-made algorithm allowed automatic measurement of two dyssynchrony
parameters: the standard deviation of time to strain peak of the 6 segments
(designated “SDt,peak”), and the standard deviation of the integrals of strain signals,
from QRS onset to the instant of longitudinal strain peak and for the 6 segments
(indicated by “SDIL, peak”).
The analysis of integral derived parameters was conducted in 2 consecutive groups
of patients. The optimal cut-off value for SDt,peak and SDIL, peak was first assessed in a
derivation group (n=31) followed by a second analysis in a validation group (n=102).
Follow-up
All patients were followed up at 6 months with an at-rest echocardiography.
Responders were defined as having a ≥15% decrease in left ventricular end-systolic
volume at the 6-month follow-up, as compared with baseline. Apical views were
acquired and stored in cine-loop format.
8
All patients had a clinical evaluation at 2 years follow-up. All-causes mortality and
hospitalizations for heart failure during the 2 years were reported.
Statistical method
Quantitative data were expressed as mean ± standard deviation, and qualitative data
were given in numbers and percentages. The clinical and echocardiographic
parameters between responders and non-responders were compared by unpaired t-
test or Pearson Chi2 test where appropriate. Receiver operating characteristics
(ROC) were analyzed for all quantitative parameters in the derivation group in order
to determine area under the curve (AUC) and cut-off values. Then, in the validation
group, each parameter was analyzed, based on sensibility and specificity calculation,
as well as positive predictive value and negative predictive value. Subsequently,
different combinations of dyssynchrony parameters were tested in the validation
group, including one, two or three parameters.
Reproducibility of integral derived parameters was performed in 10 randomly
selected patients. Excel files of apical 4-chamber longitudinal strain analysis were
exported at two different moments by the same observer and by a second observer.
Intraclass correlation coefficient (ICC)15 was calculated to assess intraobserver and
interobserver reproducibility of IL,peak for each segment of the apical 4-chamber view.
The level of statistical significance was set at p<0.05.
Results
9
Global population
One hundred and thirty-three patients, with a mean age of 64 ±12 years, of whom
73% were male (97/133), participated in the study. 116 patients (87%) were in NYHA
functional class III. All patients were on stable, maximally tolerated heart failure
medication. 38% of patients had ischemic cardiomyopathy, whereas 62% had dilated
cardiomyopathy. Mean ejection fraction was 27±6%, and QRS duration was 161±23
ms.
A follow-up was obtained for all patients at 6.8 ± 2.8 months. 81 (61%) patients had a
left ventricular end-systolic volume reduction >15% (responders), whereas 52 (39%)
had increased left ventricular end-systolic volume, or less than 15% left ventricular
end-systolic volume reduction.
Baseline clinical and echocardiographic characteristics of responders vs. non-
responders are summarized in Table 1. The etiology of the disease was significantly
different between the 2 groups, with a majority of ischemic etiology in the non-
responder group (responders: 13/81 vs. non-responders 29/52; p<0.0001).
Mechanical dyssynchrony parameters are displayed in Table 1.
Automatic analyses and integral-derived parameters
Within the global population, SDt,peak was 106±50ms and SDIL, peak was 1.06±0.55%.s-
1. A significant difference between responders and non-responders was noted for
both SDt,peak (responders: 114±49ms vs. non-responders: 93±48ms; p=0.02) and
SDIL, peak (1.15±0.56%.s-1 vs. 0.91±0.52%.s-1, respectively; p=0.01).
10
In order to determine cut-off values of integral-derived parameters, a derivation group
(n=31) was used, in which there were 18 responders (58%) at 6 months follow-up.
No difference was observed between the derivation group and the validation group
(Table 2). Considering left ventricular reverse remodeling, AUC for SDt,peak was
0.59±0.10. A cut-off of 105ms had a sensitivity of 61% and a specificity of 61%. AUC
for SDIL, peak was 0.68±0.10. A cut-off of 1.155%.s-1 had a sensitivity of 61% and a
specificity of 84%.
Reproducibility of the integral-derived parameters.
Reproducibility of the integral-derived parameters was assessed for each of the 6
segments of the apical 4-chamber view. Mean intraobserver and interobserver ICC
were, respectively, 0.84 and 0.87 for regional IL,peak. The minimal intraobserver ICC
was 0.78 for regional mid septal IL,peak. The maximal intraobserver ICC was 0.99 for
regional apical septal IL,peak. The minimal interobserver ICC was 0.76 for regional mid
septal IL,peak. The maximal interobserver ICC was 0.98 for regional basal septal IL,peak.
Comparative monoparametric analysis. In the validation group (n=102), 63
patients (61%) demonstrated a left ventricular reverse remodeling at 6 months follow-
up. Mean left ventricular end-systolic volume variation in responders was -40±17%.
In the validation group, 29 (31%) patients presented an abnormal left ventricular
filling with a sensitivity of 45% and a specificity of 88% to predict left ventricular
reverse remodeling. Forty-six patients presented an interventricular dyssynchrony
with a sensitivity of 61% and a specificity of 79%.
11
Mean SDt,peak and SDIL, peak in the validation group was 103±50ms and 1.05±0.54,
respectively.
The cut-off determined in the derivation group for SDt,peak and SDIL, peak were applied
in the validation group. In this group, a cut-off of 105ms for SDt,peak had a sensitivity
of 51% and a specificity of 82% to predict left ventricular reverse remodeling. For
SDIL, peak, a cut-off of 1.155 had a sensitivity of 38% and a specificity of 69% to
predict left ventricular reverse remodeling.
This monoparametric analysis, even according to new parameters developed on new
automatized and echocardiographic technics, generates a false-positive rate of at
least 20% (Table 3).
Multiparametric dyssynchrony analysis including SDt,peak and SDIL, peak
Combination of two parameters
Five different bi-parametric associations were tested and displayed in Table 4. As
expected, the sensitivity decreased with a combination of 2 parameters while
specificity increased considerably. For instance, the association of an interventricular
dyssynchrony and SDt,peak was found in 22 patients and demonstrated a specificity of
95%. The combination of an abnormal left ventricular filling and a SDIL,peak was found
in 8 patients and demonstrated a specificity of 100%.
Combination of three parameters
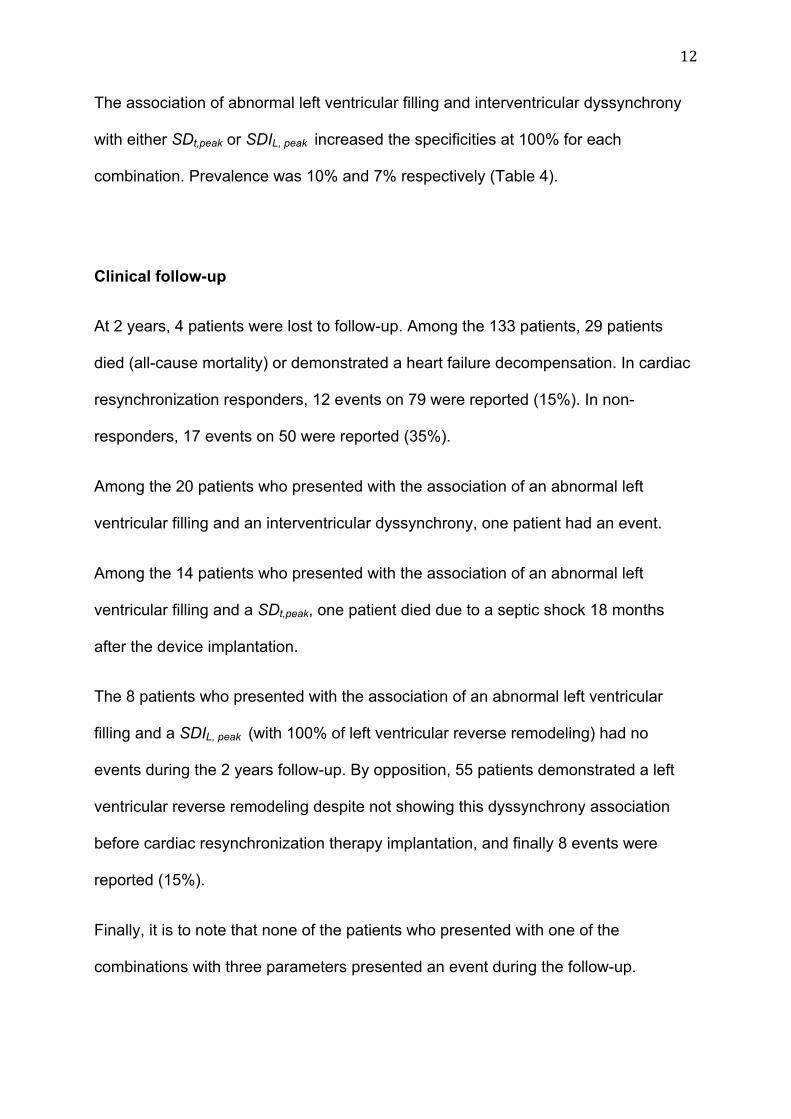
12
The association of abnormal left ventricular filling and interventricular dyssynchrony
with either SDt,peak or SDIL, peak increased the specificities at 100% for each
combination. Prevalence was 10% and 7% respectively (Table 4).
Clinical follow-up
At 2 years, 4 patients were lost to follow-up. Among the 133 patients, 29 patients
died (all-cause mortality) or demonstrated a heart failure decompensation. In cardiac
resynchronization responders, 12 events on 79 were reported (15%). In non-
responders, 17 events on 50 were reported (35%).
Among the 20 patients who presented with the association of an abnormal left
ventricular filling and an interventricular dyssynchrony, one patient had an event.
Among the 14 patients who presented with the association of an abnormal left
ventricular filling and a SDt,peak, one patient died due to a septic shock 18 months
after the device implantation.
The 8 patients who presented with the association of an abnormal left ventricular
filling and a SDIL, peak (with 100% of left ventricular reverse remodeling) had no
events during the 2 years follow-up. By opposition, 55 patients demonstrated a left
ventricular reverse remodeling despite not showing this dyssynchrony association
before cardiac resynchronization therapy implantation, and finally 8 events were
reported (15%).
Finally, it is to note that none of the patients who presented with one of the
combinations with three parameters presented an event during the follow-up.
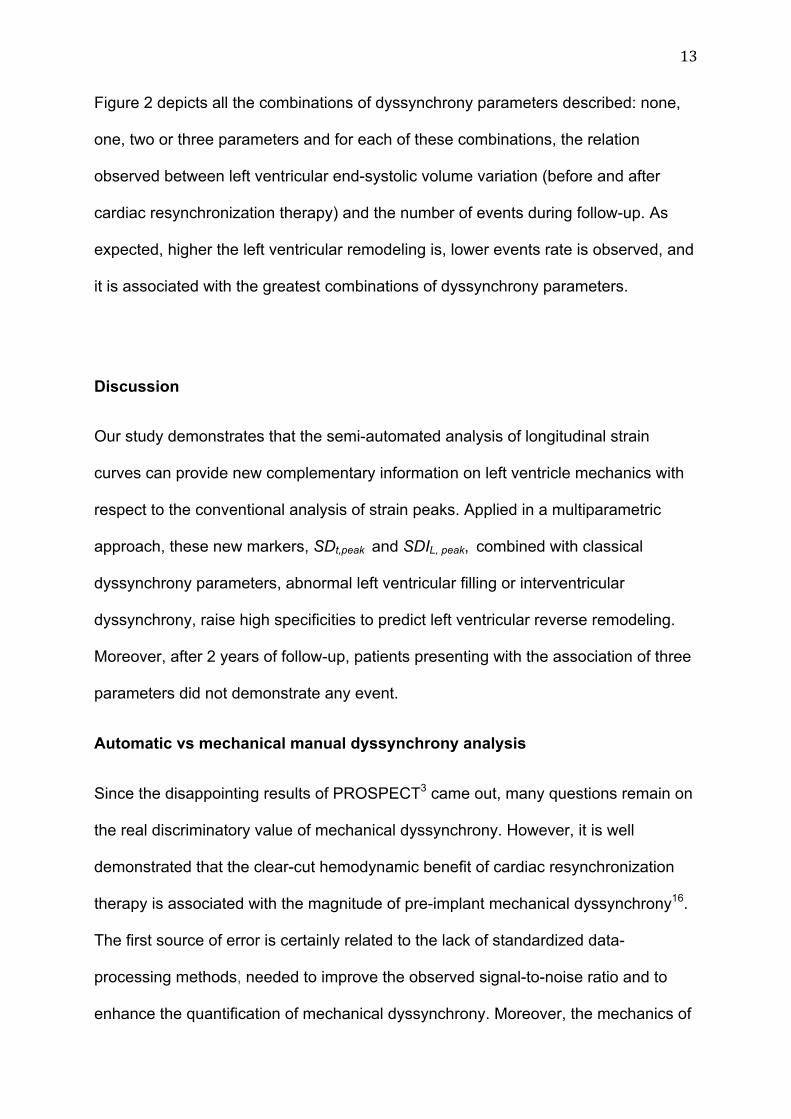
13
Figure 2 depicts all the combinations of dyssynchrony parameters described: none,
one, two or three parameters and for each of these combinations, the relation
observed between left ventricular end-systolic volume variation (before and after
cardiac resynchronization therapy) and the number of events during follow-up. As
expected, higher the left ventricular remodeling is, lower events rate is observed, and
it is associated with the greatest combinations of dyssynchrony parameters.
Discussion
Our study demonstrates that the semi-automated analysis of longitudinal strain
curves can provide new complementary information on left ventricle mechanics with
respect to the conventional analysis of strain peaks. Applied in a multiparametric
approach, these new markers, SDt,peak and SDIL, peak, combined with classical
dyssynchrony parameters, abnormal left ventricular filling or interventricular
dyssynchrony, raise high specificities to predict left ventricular reverse remodeling.
Moreover, after 2 years of follow-up, patients presenting with the association of three
parameters did not demonstrate any event.
Automatic vs mechanical manual dyssynchrony analysis
Since the disappointing results of PROSPECT3 came out, many questions remain on
the real discriminatory value of mechanical dyssynchrony. However, it is well
demonstrated that the clear-cut hemodynamic benefit of cardiac resynchronization
therapy is associated with the magnitude of pre-implant mechanical dyssynchrony16.
The first source of error is certainly related to the lack of standardized data-
processing methods, needed to improve the observed signal-to-noise ratio and to
enhance the quantification of mechanical dyssynchrony. Moreover, the mechanics of
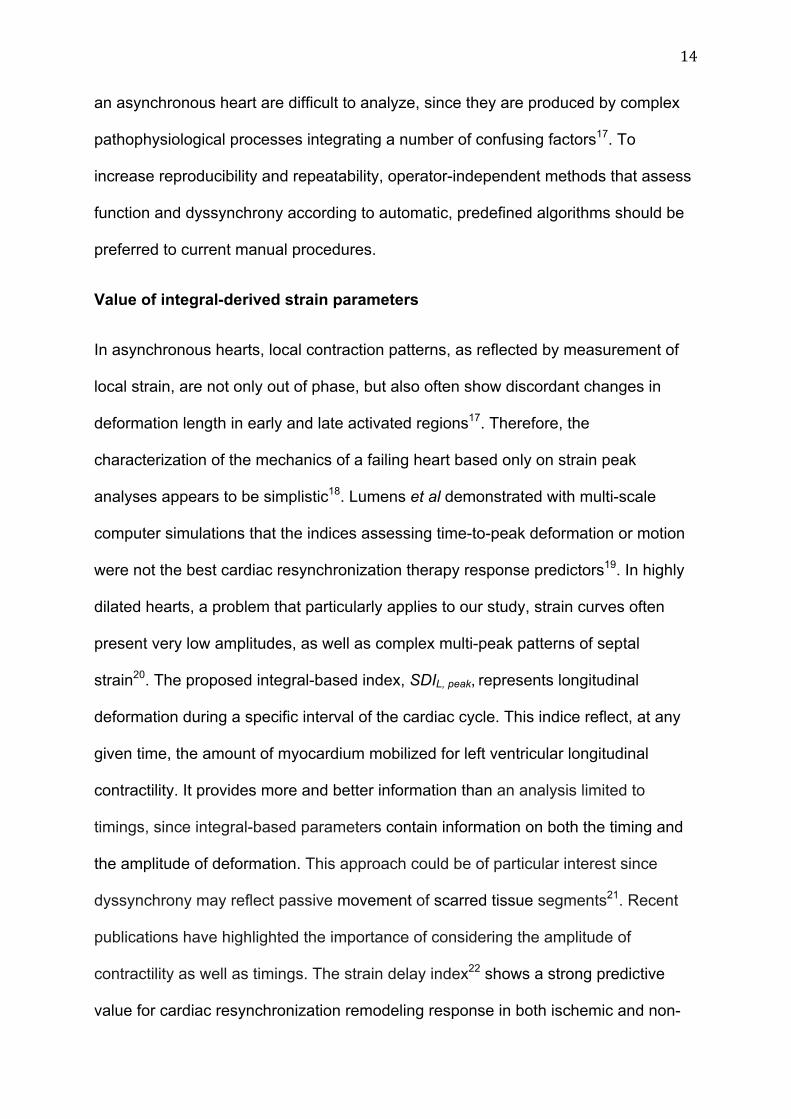
14
an asynchronous heart are difficult to analyze, since they are produced by complex
pathophysiological processes integrating a number of confusing factors17. To
increase reproducibility and repeatability, operator-independent methods that assess
function and dyssynchrony according to automatic, predefined algorithms should be
preferred to current manual procedures.
Value of integral-derived strain parameters
In asynchronous hearts, local contraction patterns, as reflected by measurement of
local strain, are not only out of phase, but also often show discordant changes in
deformation length in early and late activated regions17. Therefore, the
characterization of the mechanics of a failing heart based only on strain peak
analyses appears to be simplistic18. Lumens et al demonstrated with multi-scale
computer simulations that the indices assessing time-to-peak deformation or motion
were not the best cardiac resynchronization therapy response predictors19. In highly
dilated hearts, a problem that particularly applies to our study, strain curves often
present very low amplitudes, as well as complex multi-peak patterns of septal
strain20. The proposed integral-based index, SDIL, peak, represents longitudinal
deformation during a specific interval of the cardiac cycle. This indice reflect, at any
given time, the amount of myocardium mobilized for left ventricular longitudinal
contractility. It provides more and better information than an analysis limited to
timings, since integral-based parameters contain information on both the timing and
the amplitude of deformation. This approach could be of particular interest since
dyssynchrony may reflect passive movement of scarred tissue segments21. Recent
publications have highlighted the importance of considering the amplitude of
contractility as well as timings. The strain delay index22 shows a strong predictive
value for cardiac resynchronization remodeling response in both ischemic and non-
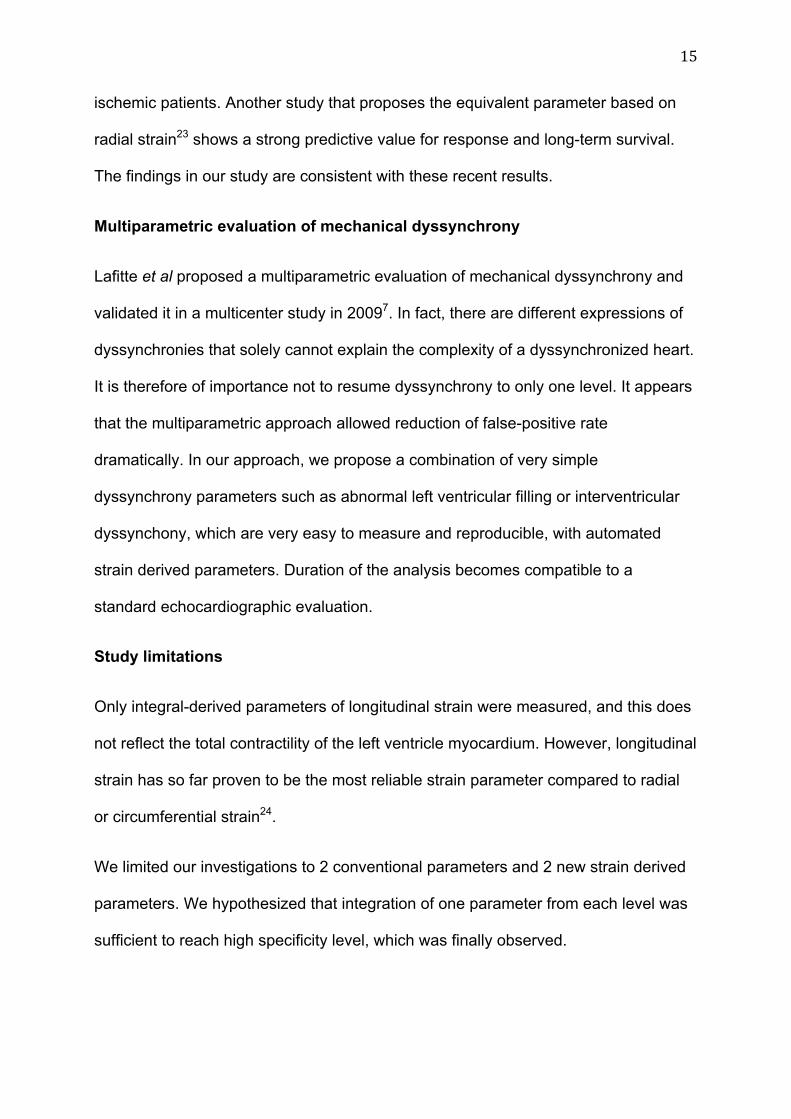
15
ischemic patients. Another study that proposes the equivalent parameter based on
radial strain23 shows a strong predictive value for response and long-term survival.
The findings in our study are consistent with these recent results.
Multiparametric evaluation of mechanical dyssynchrony
Lafitte et al proposed a multiparametric evaluation of mechanical dyssynchrony and
validated it in a multicenter study in 20097. In fact, there are different expressions of
dyssynchronies that solely cannot explain the complexity of a dyssynchronized heart.
It is therefore of importance not to resume dyssynchrony to only one level. It appears
that the multiparametric approach allowed reduction of false-positive rate
dramatically. In our approach, we propose a combination of very simple
dyssynchrony parameters such as abnormal left ventricular filling or interventricular
dyssynchony, which are very easy to measure and reproducible, with automated
strain derived parameters. Duration of the analysis becomes compatible to a
standard echocardiographic evaluation.
Study limitations
Only integral-derived parameters of longitudinal strain were measured, and this does
not reflect the total contractility of the left ventricle myocardium. However, longitudinal
strain has so far proven to be the most reliable strain parameter compared to radial
or circumferential strain24.
We limited our investigations to 2 conventional parameters and 2 new strain derived
parameters. We hypothesized that integration of one parameter from each level was
sufficient to reach high specificity level, which was finally observed.
16
We did not include qualitative parameters such as apical rocking25 and septal
flash26,27 since our study was mainly based on quantitative parameters with
automation of measurements.
Conclusion
Based on the results of our study, analysis of the integrals of longitudinal strain
curves appears to be a new tool for the assessment of mechanical dyssynchrony in
heart failure patients. Integral-based analysis gives information on timing and
contractility minimizing manual procedures. These markers throw new light on left
ventricle mechanics, in particular when analyzed in a multiparametric approach,
combining abnormal left ventricular filling and interventricular dyssynchrony.
Feasibility of this approach should be compatible with standard echocardiographic
times for a clinical practical use without limiting robustness.
17
REFERENCES
1. Brignole M, Auricchio A, Baron-Esquivias G, Bordachar P, Boriani G, Breithardt
OA et al. 2013 ESC Guidelines on cardiac pacing and cardiac
resynchronization therapy: the Task Force on cardiac pacing and
resynchronization therapy of the European Society of Cardiology (ESC).
Developed in collaboration with the European Heart Rhythm Association
(EHRA). Eur Heart J 2013; 34: 2281-2329.
2. Daubert J-C, Saxon L, Adamson PB, Auricchio A, Berger RD, Beshai JF et al.
2012 EHRA/HRS expert consensus statement on cardiac resynchronization
therapy in heart failure: implant and follow-up recommendations and
management. Heart Rythm 2012; 9: 1524-1576.
3. Chung ES, Leon AR, Tavazzi L, Sun J-P, Nihoyannopoulos P, Merlino J et al.
Results of the Predictors of Response to CRT (PROSPECT) trial. Circulation
2008; 117: 2608-2616.
4. Yu C-M, Fung W-H, Lin H, Zhang Q, Sanderson JE, Lau C-P. Predictors of left
ventricular reverse remodeling after cardiac resynchronization therapy for heart
failure secondary to idiopathic dilated or ischemic cardiomyopathy. Am J
Cardiol 2003; 91: 684-688.
5. Bax JJ, Bleeker GB, Marwick TH, Molhoek SG, Boersma E, Steendijk P et al.
Left ventricular dyssynchrony predicts response and prognosis after cardiac
resynchronization therapy. J Am Coll Cardiol 2004; 44: 1834-1840.
6. Suffoletto MS, Dohi K, Cannesson M, Saba S, Gorcsan J. Novel speckle-
tracking radial strain from routine black-and-white echocardiographic images to
18
quantify dyssynchrony and predict response to cardiac resynchronization
therapy. Circulation 2006; 113: 960-968.
7. Lafitte S, Reant P, Zaroui A, Donal E, Mignot A, Bougted H et al. Validation of
an echocardiographic multiparametric strategy to increase responders patients
after cardiac resynchronization: a multicentre study. Eur Heart J 2009; 30:
2880-2887.
8. Lim P, Buakhamsri A, Popovic ZB, Greenberg NL, Patel D, Thomas JD et al.
Longitudinal Strain Delay Index by Speckle Tracking Imaging: A New Marker of
Response to Cardiac Resynchronization Therapy. Circulation 2008; 118: 1130-
1137.
9. Dickstein K, Vardas PE, Auricchio A, Daubert J-C, Linde C, McMurray J et al.
2010 Focused Update of ESC Guidelines on device therapy in heart failure: An
update of the 2008 ESC Guidelines for the diagnosis and treatment of acute
and chronic heart failure and the 2007 ESC guidelines for cardiac and
resynchronization therapy Developed with the special contribution of the Heart
Failure Association and the European Heart Rhythm Association. Eur Heart J
2010; 31: 2677-2687.
10. Lang RM, Bierig M, Devereux RB, Flachskampf FA, Foster E, Pellikka PA et al.
Recommendations for chamber quantification: a report from the American
Society of Echocardiography's Guidelines and Standards Committee and the
Chamber Quantification Writing Group, developed in conjunction with the
European Association of Echocardiography, a branch of the European Society
of Cardiology. J Am Soc Echocardiogr 2005; 18: 1440-1463.

19
11. Quiñones MA, Otto CM, Stoddard M, Waggoner A, Zoghbi WA, Doppler
Quantification Task Force of the Nomenclature and Standards Committee of
the American Society of Echocardiography. Recommendations for
quantification of Doppler echocardiography: a report from the Doppler
Quantification Task Force of the Nomenclature and Standards Committee of
the American Society of Echocardiography. J Am Soc Echocardiogr 2002; 15:
167-184.
12. Cazeau S, Bordachar P, Jauvert G, Lazarus A, Alonso C, Vandrell MC et al.
Echocardiographic modeling of cardiac dyssynchrony before and during
multisite stimulation: a prospective study. Pacing Clin Electrophysiol 2003; 26:
137-143.
13. Yu C-M, Chau E, Sanderson JE, Fan K, Tang M-O, Fung W-H et al. Tissue
Doppler echocardiographic evidence of reverse remodeling and improved
synchronicity by simultaneously delaying regional contraction after biventricular
pacing therapy in heart failure. Circulation 2002; 105: 438-445.
14. Gorcsan J III, Abraham T, Agler DA, Bax JJ, Derumeaux G, Grimm RA et al.
Echocardiography for Cardiac Resynchronization Therapy: Recommendations
for Performance and Reporting–A Report from the American Society of
Echocardiography Dyssynchrony Writing Group Endorsed by the Heart Rhythm
Society. J Am Soc Echocardiogr 2008; 21: 191-213.
15. Deyo RA, Diehr P, Patrick DL. Reproducibility and responsiveness of health
status measures. Statistics and strategies for evaluation. Control Clin Trials
1991; 12: 142S-158S.
20
16. Breithardt OA, Stellbrink C, Kramer AP, Sinha AM, Franke A, Salo R et al,
PATH-CHF Study Group. Pacing Therapies for Congestive Heart Failure.
Echocardiographic quantification of left ventricular asynchrony predicts an
acute hemodynamic benefit of cardiac resynchronization therapy. J Am Coll
Cardiol 2002; 40: 536-545.
17. Prinzen FW, Vernooy K, Deboeck BWL, Delhaas T. Mechano-energetics of the
asynchronous and resynchronized heart. Heart Fail Rev 2010; 16: 215-224.
18. Carasso S, Rakowski H, Witte KK, Smith P, Carasso D, Garceau P et al. Left
Ventricular Strain Patterns in Dilated Cardiomyopathy Predict Response to
Cardiac Resynchronization Therapy: Timing Is Not Everything. J Am Soc
Echocardiogr 2009; 22: 242-250.
19. Lumens J, Leenders GE, Cramer MJ, De Boeck BWL, Doevendans PA,
Prinzen FW et al. Mechanistic Evaluation of Echocardiographic Dyssynchrony
Indices: Patient Data Combined With Multiscale Computer Simulations. Circ
Cardiovasc Imaging 2012; 5: 491-499.
20. Lim P, Mitchell-Heggs L, Buakhamsri A, Thomas JD, Grimm RA. Impact of left
ventricular size on tissue Doppler and longitudinal strain by speckle tracking for
assessing wall motion and mechanical dyssynchrony in candidates for cardiac
resynchronization therapy. J Am Soc Echocardiogr 2009; 22: 695-701.
21. Lim P, Pasquet A, Gerber B, D'Hondt AM, Vancraeynest D, Gueret P et al. Is
postsystolic shortening a marker of viability in chronic left ventricular ischemic
dysfunction? Comparison with late enhancement contrast magnetic resonance
imaging. J Am Soc Echocardiogr 2008; 21: 452-457.
21
22. Lim P, Donal E, Lafitte S, Derumeaux G, Habib G, Reant P et al. Multicentre
study using strain delay index for predicting response to cardiac
resynchronization therapy (MUSIC study). Eur J Heart Fail 2011; 13: 984-991.
23. Kydd AC, Khan FZ, O'Halloran D, Pugh PJ, Virdee MS, Dutka DP. Radial
Strain Delay Based on Segmental Timing and Strain Amplitude Predicts Left
Ventricular Reverse Remodeling and Survival following Cardiac
Resynchronization Therapy. Circ Cardiovasc Imaging 2013; 6: 177-184.
24. Mor-Avi V, Lang RM, Badano LP, Belohlavek M, Cardim NM, Derumeaux G et
al. Current and Evolving Echocardiographic Techniques for the Quantitative
Evaluation of Cardiac Mechanics: ASE/EAE Consensus Statement on
Methodology and Indications Endorsed by the Japanese Society of
Echocardiography. Eur J Echocardiogr 2011; 12: 167-205.
25. Voigt J-U, Schneider T-M, Korder S, Szulik M, Gürel E, Daniel WG et al. Apical
transverse motion as surrogate parameter to determine regional left ventricular
function inhomogeneities: a new, integrative approach to left ventricular
asynchrony assessment. Eur Heart J 2009; 30: 959-968.
26. Parsai C, Bijnens B, Sutherland GR, Baltabaeva A, Claus P, Marciniak M et al.
Toward understanding response to cardiac resynchronization therapy: left
ventricular dyssynchrony is only one of multiple mechanisms. Eur Heart J
2008; 30: 940-949.
27. Brunet-Bernard A, Maréchaux S, Fauchier L, Guiot A, Fournet M, Reynaud A et
al. Combined score using clinical, electrocardiographic, and echocardiographic
parameters to predict left ventricular remodeling in patients having had cardiac

22
resynchronization therapy six months earlier. Am J Cardiol 2014; 113: 2045-
2051.
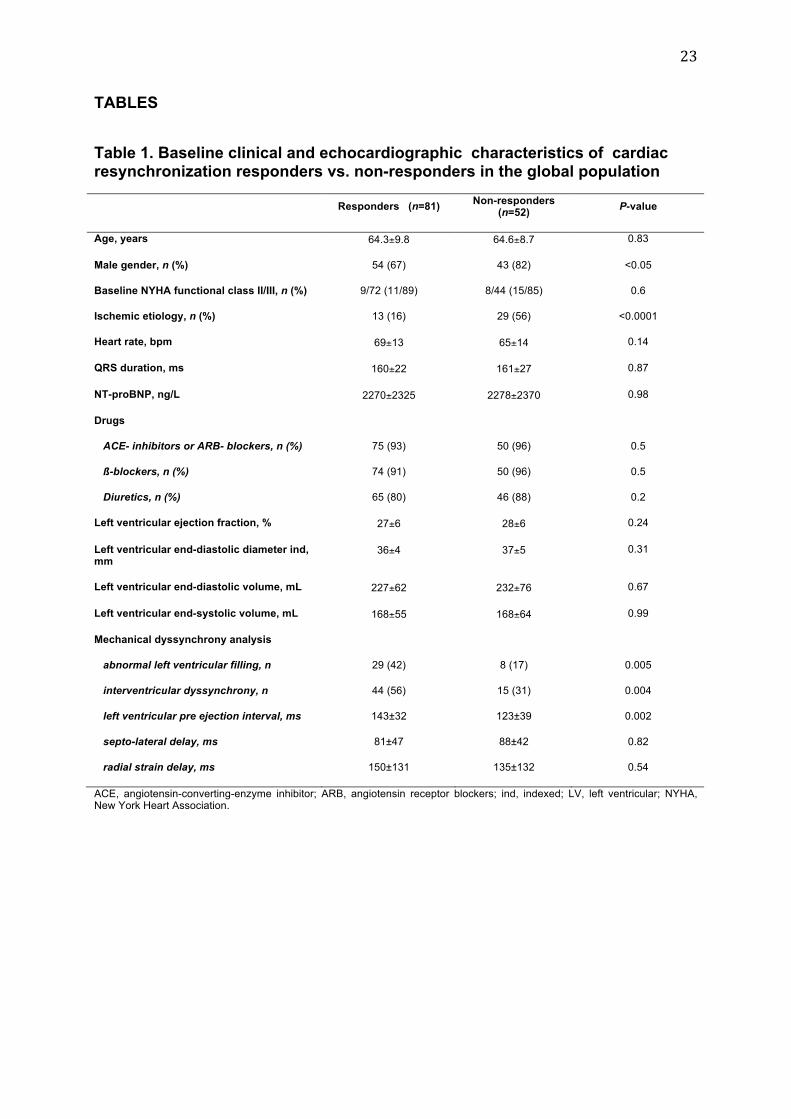
23
TABLES
Table 1. Baseline clinical and echocardiographic characteristics of cardiac resynchronization responders vs. non-responders in the global population
Responders (n=81)
Non-responders (n=52)
P-value
Age, years 64.3±9.8 64.6±8.7 0.83
Male gender, n (%) 54 (67) 43 (82) <0.05
Baseline NYHA functional class II/III, n (%) 9/72 (11/89) 8/44 (15/85) 0.6
Ischemic etiology, n (%) 13 (16) 29 (56) <0.0001
Heart rate, bpm 69±13 65±14 0.14
QRS duration, ms 160±22 161±27 0.87
NT-proBNP, ng/L 2270±2325 2278±2370 0.98
Drugs
ACE- inhibitors or ARB- blockers, n (%) 75 (93) 50 (96) 0.5
ß-blockers, n (%) 74 (91) 50 (96) 0.5
Diuretics, n (%) 65 (80) 46 (88) 0.2
Left ventricular ejection fraction, % 27±6 28±6 0.24
Left ventricular end-diastolic diameter ind, mm
36±4 37±5 0.31
Left ventricular end-diastolic volume, mL 227±62 232±76 0.67
Left ventricular end-systolic volume, mL 168±55 168±64 0.99
Mechanical dyssynchrony analysis
abnormal left ventricular filling, n 29 (42) 8 (17) 0.005
interventricular dyssynchrony, n 44 (56) 15 (31) 0.004
left ventricular pre ejection interval, ms 143±32 123±39 0.002
septo-lateral delay, ms 81±47 88±42 0.82
radial strain delay, ms 150±131 135±132 0.54
ACE, angiotensin-converting-enzyme inhibitor; ARB, angiotensin receptor blockers; ind, indexed; LV, left ventricular; NYHA, New York Heart Association.
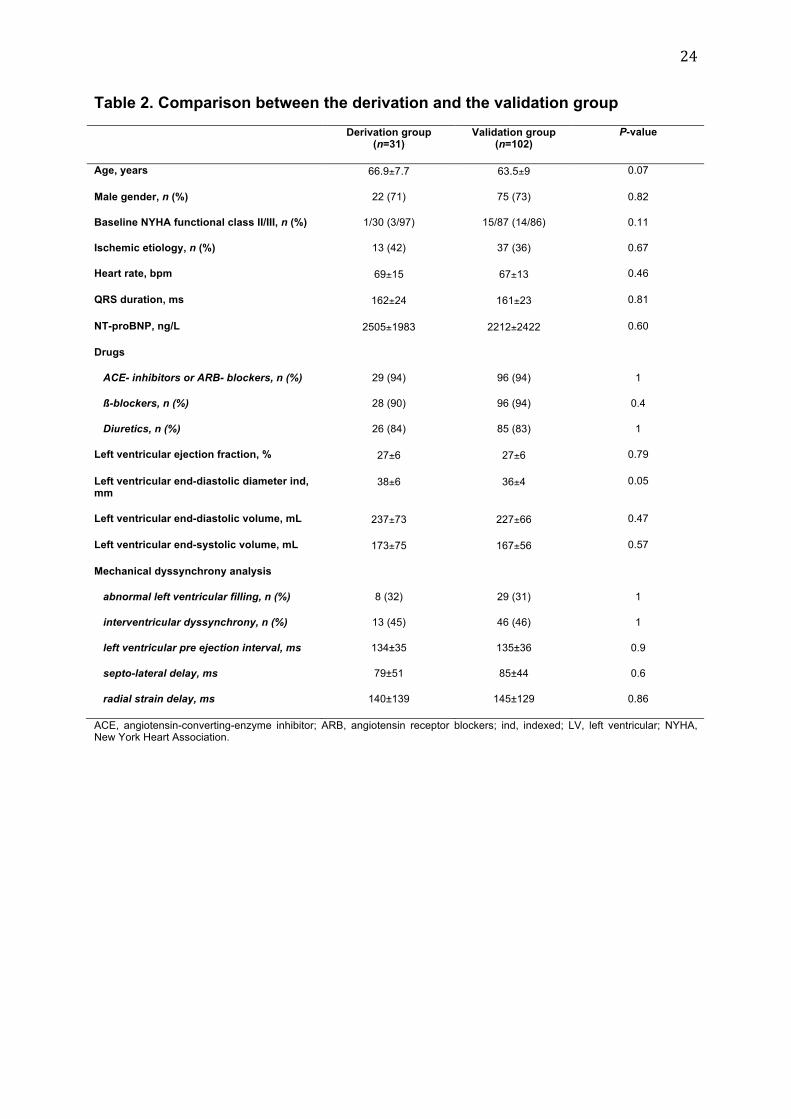
24
Table 2. Comparison between the derivation and the validation group
Derivation group (n=31)
Validation group (n=102)
P-value
Age, years 66.9±7.7 63.5±9 0.07
Male gender, n (%) 22 (71) 75 (73) 0.82
Baseline NYHA functional class II/III, n (%) 1/30 (3/97) 15/87 (14/86) 0.11
Ischemic etiology, n (%) 13 (42) 37 (36) 0.67
Heart rate, bpm 69±15 67±13 0.46
QRS duration, ms 162±24 161±23 0.81
NT-proBNP, ng/L 2505±1983 2212±2422 0.60
Drugs
ACE- inhibitors or ARB- blockers, n (%) 29 (94) 96 (94) 1
ß-blockers, n (%) 28 (90) 96 (94) 0.4
Diuretics, n (%) 26 (84) 85 (83) 1
Left ventricular ejection fraction, % 27±6 27±6 0.79
Left ventricular end-diastolic diameter ind, mm
38±6 36±4 0.05
Left ventricular end-diastolic volume, mL 237±73 227±66 0.47
Left ventricular end-systolic volume, mL 173±75 167±56 0.57
Mechanical dyssynchrony analysis
abnormal left ventricular filling, n (%) 8 (32) 29 (31) 1
interventricular dyssynchrony, n (%) 13 (45) 46 (46) 1
left ventricular pre ejection interval, ms 134±35 135±36 0.9
septo-lateral delay, ms 79±51 85±44 0.6
radial strain delay, ms 140±139 145±129 0.86
ACE, angiotensin-converting-enzyme inhibitor; ARB, angiotensin receptor blockers; ind, indexed; LV, left ventricular; NYHA, New York Heart Association.
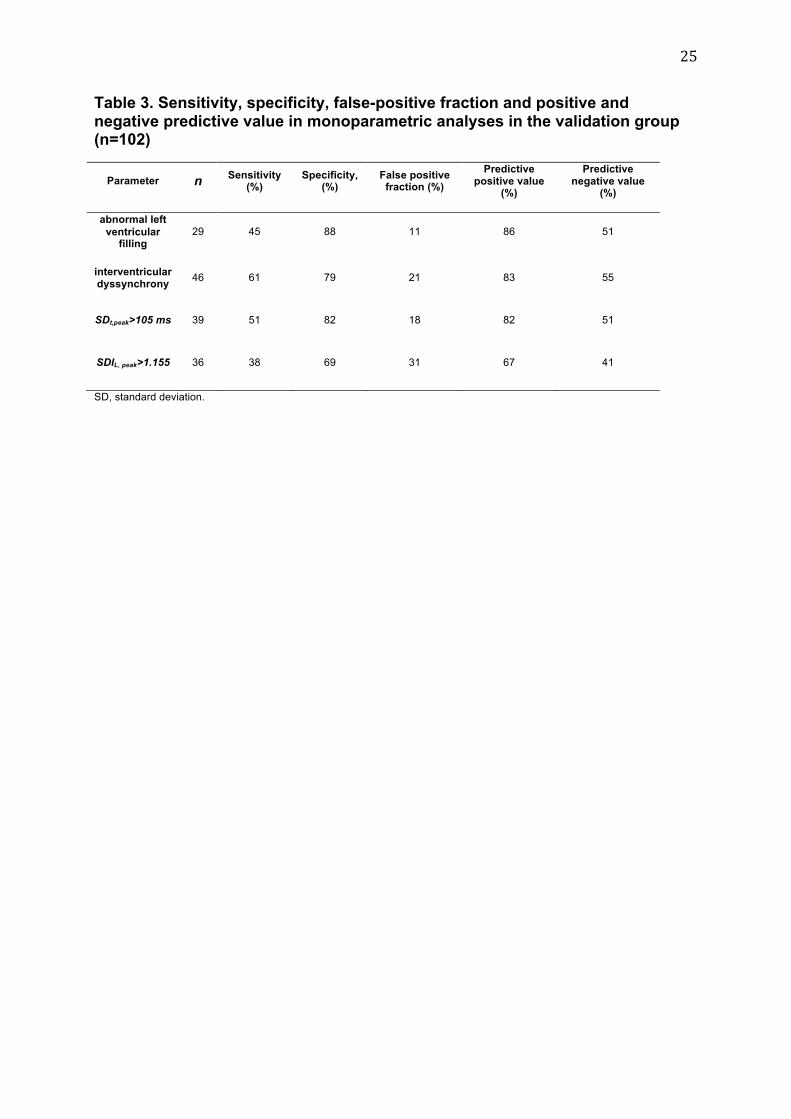
25
Table 3. Sensitivity, specificity, false-positive fraction and positive and negative predictive value in monoparametric analyses in the validation group (n=102)
Parameter n Sensitivity
(%) Specificity,
(%) False positive
fraction (%)
Predictive positive value
(%)
Predictive negative value
(%)
abnormal left
ventricular filling
29 45 88 11 86 51
interventricular dyssynchrony
46 61 79 21 83 55
SDt,peak>105 ms 39 51 82 18 82 51
SDIL, peak>1.155 36 38 69 31 67 41
SD, standard deviation.
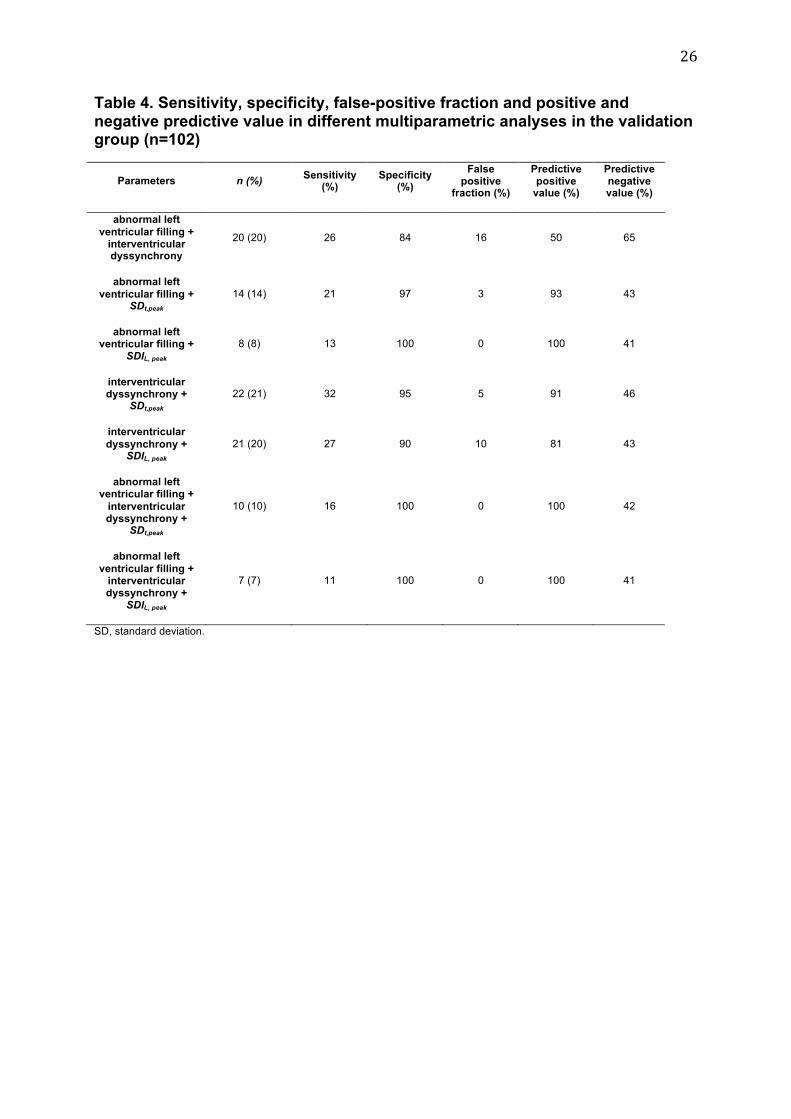
26
Table 4. Sensitivity, specificity, false-positive fraction and positive and negative predictive value in different multiparametric analyses in the validation group (n=102)
Parameters n (%) Sensitivity
(%) Specificity
(%)
False positive
fraction (%)
Predictive positive
value (%)
Predictive negative value (%)
abnormal left
ventricular filling + interventricular dyssynchrony
20 (20) 26 84 16 50 65
abnormal left
ventricular filling + SDt,peak
14 (14) 21 97 3 93 43
abnormal left ventricular filling +
SDIL, peak 8 (8) 13 100 0 100 41
interventricular dyssynchrony +
SDt,peak 22 (21) 32 95 5 91 46
interventricular
dyssynchrony + SDIL, peak
21 (20) 27 90 10 81 43
abnormal left ventricular filling +
interventricular dyssynchrony +
SDt,peak
10 (10) 16 100 0 100 42
abnormal left
ventricular filling + interventricular dyssynchrony +
SDIL, peak
7 (7) 11 100 0 100 41
SD, standard deviation.
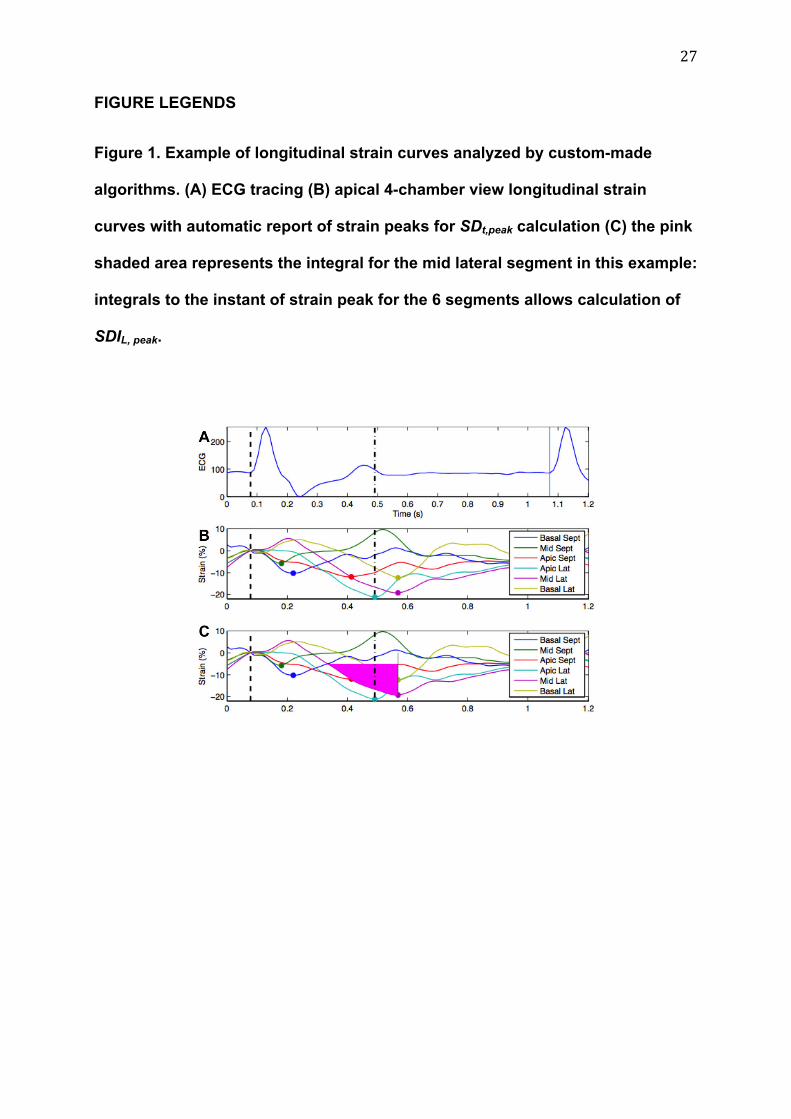
27
FIGURE LEGENDS
Figure 1. Example of longitudinal strain curves analyzed by custom-made
algorithms. (A) ECG tracing (B) apical 4-chamber view longitudinal strain
curves with automatic report of strain peaks for SDt,peak calculation (C) the pink
shaded area represents the integral for the mid lateral segment in this example:
integrals to the instant of strain peak for the 6 segments allows calculation of
SDIL, peak.
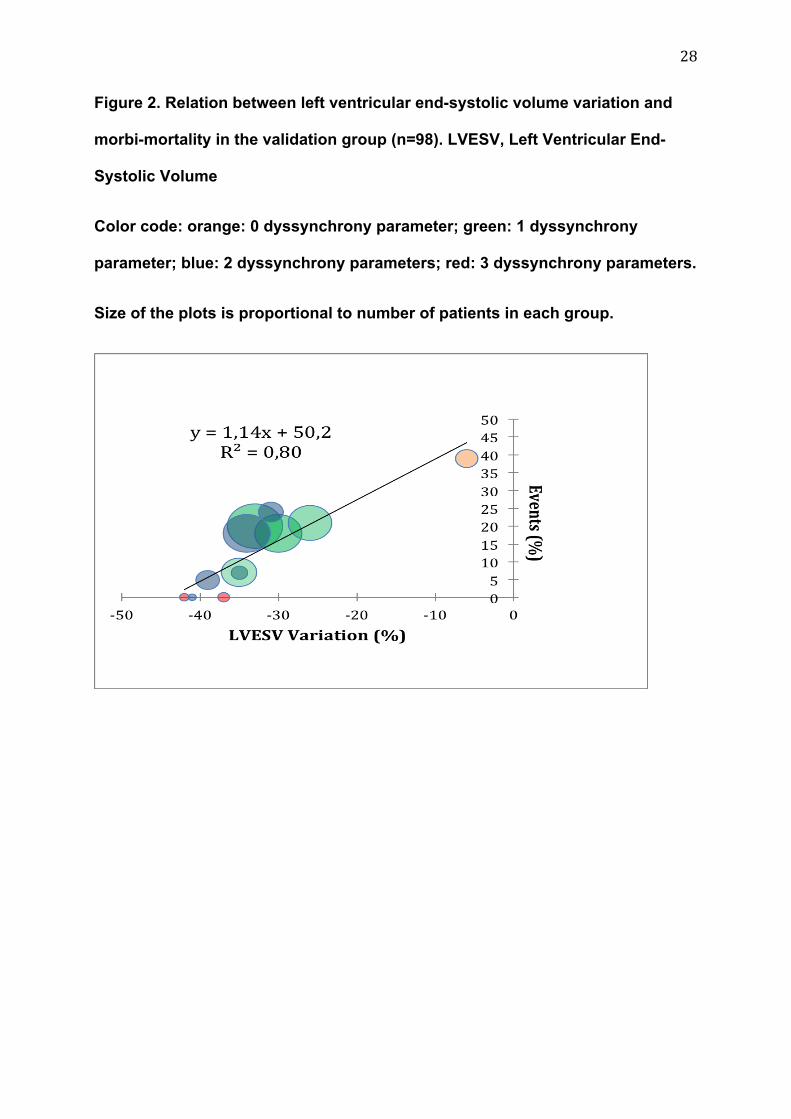
28
Figure 2. Relation between left ventricular end-systolic volume variation and
morbi-mortality in the validation group (n=98). LVESV, Left Ventricular End-
Systolic Volume
Color code: orange: 0 dyssynchrony parameter; green: 1 dyssynchrony
parameter; blue: 2 dyssynchrony parameters; red: 3 dyssynchrony parameters.
Size of the plots is proportional to number of patients in each group.

29