xtnth nnl rprt - cdpq
TRANSCRIPT

SIXTEENTH ANNUAL REPORT 1981

.n n n
CAISSEIXTEENTH ANNUAL REPORT 1981

3
CAISSEDE DEPOT
ET LACEMENTDU SUEbEC
Monsieur Jacques ParizeauMinistre des FinancesGouvernement du QuébecQuébec
Monsieur le Ministre,
Conformément aux dispositions dela Loi sur la Caisse de dépôt et pla-cement du Québec, l'ai l'honneurde vous soumettre le seizième rap-port de gestion, soit pour l'exerciceterminé le 31 décembre 1981.
Veuillez agréer, monsieur le Minis-tre, l'expression de mes meilleurssentiments.
Le président du conseil d'adminis-tration et directeur général,
Gouvernement du QuébecCabinet du ministredes Finances
Monsieur Claude VaillancourtPrésident de l'Assemblée nationaleQuébec
Monsieur le Président,
J'ai l'honneur de vous transmettrele rapport de gestion de la Caissede dépôt et placement du Québecpour l'exercice terminé le 31décembre 1981
Veuillez croire, monsieur le Prési-dent, à l'expression de mes senti-ments les meilleurs.
Le ministre des Finances,
Jean Campeau Jacques Parizeau
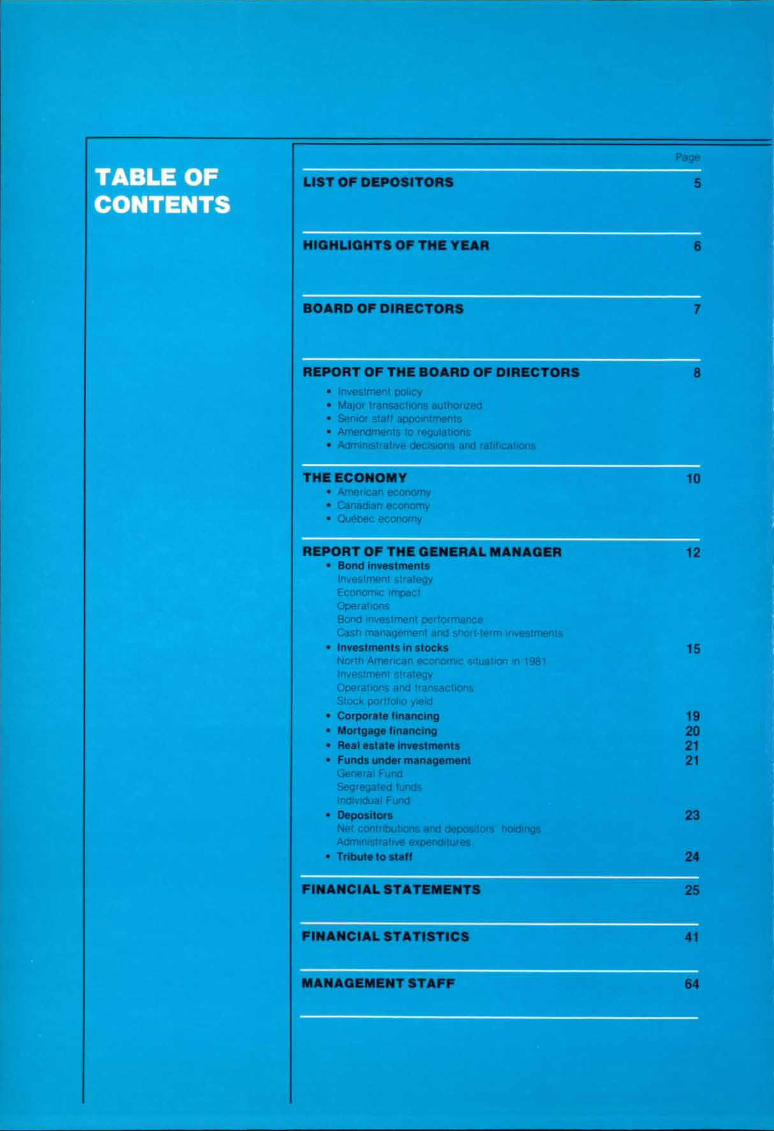
Page
LIST OF DEPOSITORS
HIGHLIGHTS OF THE YEAR
BOARD OF DIRECTORS
REPORT OF THE BOARD OF DIRECTORS• Investment policy• Major transactions authorized• Senior staff appointments• Amendments to regulations• AdministrafIve decisions and ratifications
THE ECONOMY• American economy• Canadian economy• Quebec economy
5
6
7
8
dalim°II=P 10
REPORT OF THE GENERAL MANAGER 12• Bond investments
Investment strategyEconomic impactOperationsBond investment performanceCash management and short-term investments
• Investments in stocks 15North American economic situation in 1981Investment strategyOperations and transactionsStock portfolio yield
• Corporate financing 19• Mortgage financing 20• Real estate investments 21• Funds under management 21
General Fund
Segregated fundsIndividual Fund
• Depositors 23Net contributions and depositors holdingsAdministrative expenditures
• Tribute to staff 24
FINANCIAL STATEMENTS
Mal 25
FINANCIAL STATISTICS 111. 41
MANAGEMENT STAFF MIEL 64
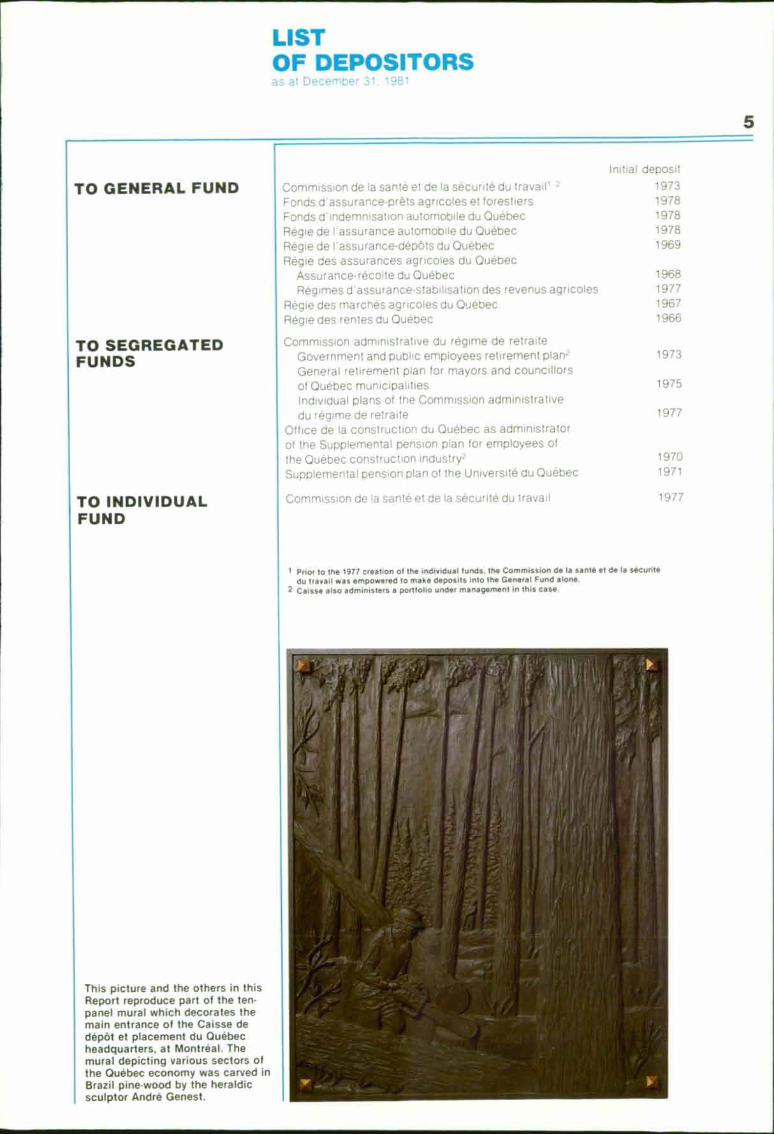
LIS aOF DEPOSITORSas at December 31. 1961
TO GENERAL FUND
TO SEGREGATEDFUNDS
TO INDIVIDUALFUND
Initial deposit
Commission de la santé et de la sécurité du travail' 2 1973Fonds d'assurance-préts agricoles et forestiers 1978Fonds d' indemnisation automobile du Quebec 1978
Régie de l'assurance automobile du Quebec 1978Régie de l'assurance-dépôts du Quebec 1969Regie des assurances agricoles du Quebec
Assurance-récolte du Quebec 1968Regimes d'assurance-stabiiisation des revenus agricoles 1977
Régie des marches agricoles du Quebec 1967
Régie des rentes du Quebec 1966
Commission administrative du regime de retraiteGovernment and public employees retirement ptan 2 1973General retirement plan for mayors and councittorsof Quebec municipalities 1975
Individual plans of the Commission administrativedu regime de retraite 1977
Office de la construction du Quebec as administratorof the Supplemental pension plan for employees of
the Quebec construction inidustry2 1970
Supplemental pension plan of the Université du Quebec 1971
Commission de la santé et de la sécurité du travail 1977
I Prior to the 1977 creation at the individual funds. the Commission de la santé et de la sécurite
du travail was empowered to make deposits Into the General Fund alone
2 Caisse also administers a portfolio under management in this case
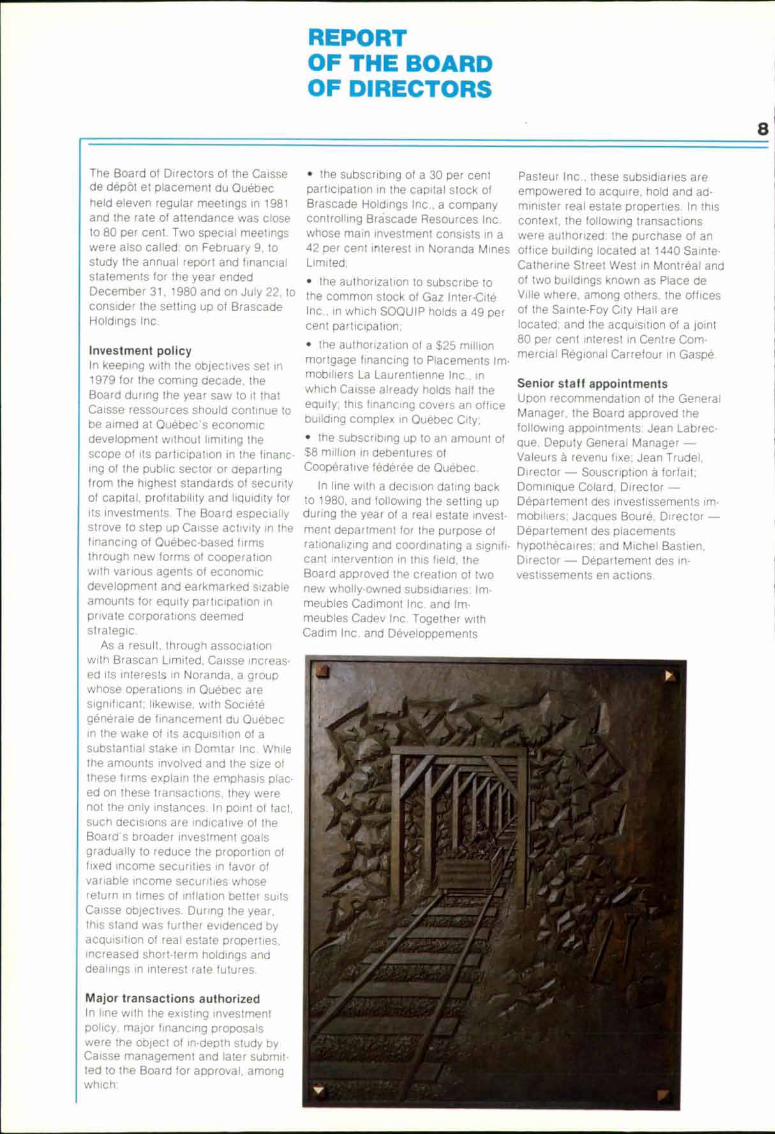
This picture and the others in thisReport reproduce part of the ten-panel mural which decorates themain entrance of the Caisse dedépôt et placement du Québecheadquarters, at Montreal. Themural depicting various sectors of
the Quebec economy was carved inBrazil pine-wood by the heraldicsculptor Andre Genest.

6HIGHLIGHTSOF THE YEARI millions of dollars)
1981 1980 Percentageincrease
TOTAL FUNDS Assets under management 13914.8 11747.5 18.4Total investments 13639.3 11507.6 18_5Long-term investments 13 146.3 11192.9 17.5Total income 1 450.3 1133.9 27.9Net income 1 273.8 1 041.8 22.3Net contributions' 732.3 888.1 (17.5)Administrative expenditures 9.5 8.3 14.5
GENERAL FUND Assets2 9442.5 8 169.1 15.6Income to be paid out to
participation deposit holders 863.8 724.9 19.2Net contributions' 295.1 497_3 (407)Yield on participation
deposits (percentage) 10.50 10.20
SEGREGATED FUNDS Combined assets 2 3 092.8 2 443.8 26.6Income to be paid out to
participation deposit holders 279.6 215.3 29,9Net contributions1 327.2 292.2 12.0Yield on participation
deposits (percentage)Fund "0 - 11.77 10.97Fund "0 - 10.04 9_89Fund "A" 7.27 8.22Fund ''H' 11.16 10.45
INDIVIDUAL FUND Assets 1 222.1 962.7 26.9Income to be paid out to
participation deposit holder 117.9 88.5 33,2Net contributions' 110.0 986 11.6Yield on participation
deposits (percentage) 10.93 10.59
PORTFOLIOS UNDERMANAGEMENT
Combined assetsNet income
157.412.5
171.913.1
(8.4)6)
Net contributions' -
1 Net contributions are made up of deposits recei ed less withdrawals made.2 For purposes of this presentation, assets ol the General Fund do not reflect demand deposits at the segregated funds and the Individual Fund and in-terest accrued on those deposits. Assets of the egregaled funds however reflect the deduction of advances by the General Fund and interest accrued onthose advances.
1 BREAKDOWN OF ASSETSUNDER MANAGEMENTas at December 31percer'.,
Bonds
Stocks and convertiblesecurities
Real estate and mortgages
Shod-term investmentsand other assets
DISTRIBUTION OF ASSETSUNDER MANAGEMENTas at December 31(percentage)
1981 1980 1981 1980
69.5 74.2 General Fund 67.9 69.5
16.7 12.7 Segregated funds 22.2 20.8
8.3 8 4
5.5 4.7Individual FundPortfolios under management
8.81.1
8 215

ebiL•Am&RD OFDIRECTORS
Jean CampeauChairman of the BoardGeneral ManagerCaisse de dépôt et placement duQuébec
Claude LegauliVice-Chairman of the BoardPresidentRégie des rentes du Quebec
Judge Richard Beaulieu*PresidentCommission municipale duQuebec
Michel Caron*Deputy MinisterMinistère des FinancesGouvernement du Quebec
Louis LabergePresidentFederation des travailleurs duQuebec
Georges Lafond*Vice-President — FinanceHydro-Québec
André MarierPresidentSociete québécoise d'initiativesagro-alimentaires
Fernand PareGeneral ManagerLa Solidarité,Compagnie d'assurance sur la vie
Pierre PéladeauPresidentQuebecor Inc.
Gaston PelletierPresidentLombard Ocher Trust Company
Alfred RouleauAssociate AdministratorMallette, Benoit, Boulanger.Rondeau et associés
' Associate member
At December 31. 1981, there was one vacanCy
on the Board of Directors.
EPORToF THE BOARD
OF DIRECTORS
8
The Board of Directors of the Caissede dépôt et placement du Quebecheld eleven regular meetings in 1981and the rate of attendance was closeto 80 per cent. Two special meetingswere also called: on February 9, tostudy the annual report and financialstatements for the year endedDecember 31, 1980 and on July 22, toconsider the setting up of BrascadeHoldings Inc.
Investment policyIn keeping with the objectives set in1979 for the coming decade. theBoard during the year saw to it thatCaisse ressources should continue tobe aimed at Quebec's economicdevelopment without limiting thescope of its participation in the financ-ing of the public sector or departingfrom the highest standards of Securityof capital, profitability and liquidity forits investments. The Board especiallystrove to step up Caisse activity in thefinancing of Quebec-based firmsthrough new forms of cooperationwith various agents of economicdevelopment and earkrnarked sizableamounts for equity participation inprivate corporations deemedstrategic.
As a result, through associationwith Brascan Limited, Caisse increa:.ed its interests in Noranda, a groupwhose operations in Quebec aresignificant: likewise. with Societegénérale de financement du Quebecin the wake of its acquisition of asubstantial stake in Domtar Inc_ Whilethe amounts involved and the size ofthese firms explain the emphasis plac-ed on these transactions, they werenot the only instances. In point of fact_such decisions are indicative of theBoard's broader investment goalsgradually to reduce the proportion offixed income securities in favor ofvariable income securities whosereturn in times of inflation better suitsCaisse objectives. During the year,this stand was further evidenced byacquisition of real estate properties.increased short-term holdings anddealings in interest rate futures.
Major transactions authorizedIn line with the existing investmentpolicy, major financing proposalswere the object of in-depth study byCaisse management and later submit-ted to the Board for approval, amongwhich:
• the subscribing of a 30 per centparticipation in the capital stock ofBrascade Holdings Inc., a companycontrolling Brascade Resources Inc.whose main investment consists in a42 per cent interest in Noranda MinesLimited:
• the authorization to subscribe tothe common stock of Gaz Inter-CiteInc., in which SOQUIP holds a 49 percent participation:
• the authorization of a $25 millionmortgage financing to Placements lm-mobiliers La Laurentienne Inc_ inwhich Caisse already holds half theequity: this financing covers an officebuilding complex in Quebec City:
• the subscribing up to an amount of$8 million in debentures ofCooperative fédérée de Quebec.
In line with a decision dating backto 1980, and following the setting upduring the year of a real estate invest-ment department for the purpose ofrationalizing and coordinating a signifi-cant intervention in this field. theBoard approved the creation of twonew wholly-owned subsidiaries: Im-meubles Cadimont Inc. and Im-meubles Cadev Inc. Together withCadim Inc. and Développements
Pasteur Inc., these subsidiaries areempowered to acquire, hold and ad-minister real estate properties, In thiscontext, the following transactionswere authorized: the purchase of anoffice building located at 1440 Sainte-Catherine Street West in Montreal andof two buildings known as Place deVille where, among others, the officesof the Sainte-Foy City Hall arelocated; and the acquisition of a joint80 per cent interest in Centre Com-mercial Régional Carrefour in Gaspe.
Senior staff appointmentsUpon recommendation of the GeneralManager, the Board approved thefollowing appointments: Jean Labrec-que, Deputy General Manager —Valeurs a revenu fixe; Jean Trudel.Director — Souscription à forfeit,Dominique Colard, Director —Département des investissements im-mobiliers; Jacques Bouré, Director —Département des placementshypothécaires: and Michel Bastien,Director — Département des in-vestissements en actions,
9
Amendments to regulations Administrative decisions andDuring the year, amendments were ratificationsmade to Caisse regulations with As provided for in Section 15 of the
orders En council 192-81 dated regulations, the Board was during the
January 21, 1981 and 3569-81 dated year called upon to rule on the sale of
December 22. 1981. The first allowed, shares likely to affect the control of a
among other changes, an increase in corporation; in addition, it ratified
staff requirements and the second many decisions taken at various
specified that transactions of all management levels. The year's invest-
segregated funds and of the Individual ment program, the operating budget
Fund would henceforth be reported on and the relocation of Caisse head-a monthly basis rather than quarterly, quarters at 1981 McGill College
However the latter change does not Avenue in Montreal, scheduled for
affect operations 01 the General Fund. September 1982. have also been sub-mitted to the Board for approval.
Report of the General ManagerIn addition to its own report, theBoard of Directors is pleased to pre-sent the report of the General
Manager which gives an account of
the administration of Caisse de dépôtet placement du Quebec and testifiesto its accomplishments in the various
spheres of ils activity.
On behalf of the Board of Directors,
Jean CampeauChairmanMontreal. February 15, 1982
10000
5000
O
— 5000
—10000
—15000
10000
5000
O
— 5000
—10000
— 15000
trw
74 75 76 77 78 79 BO 81
THE ECONOMY
10
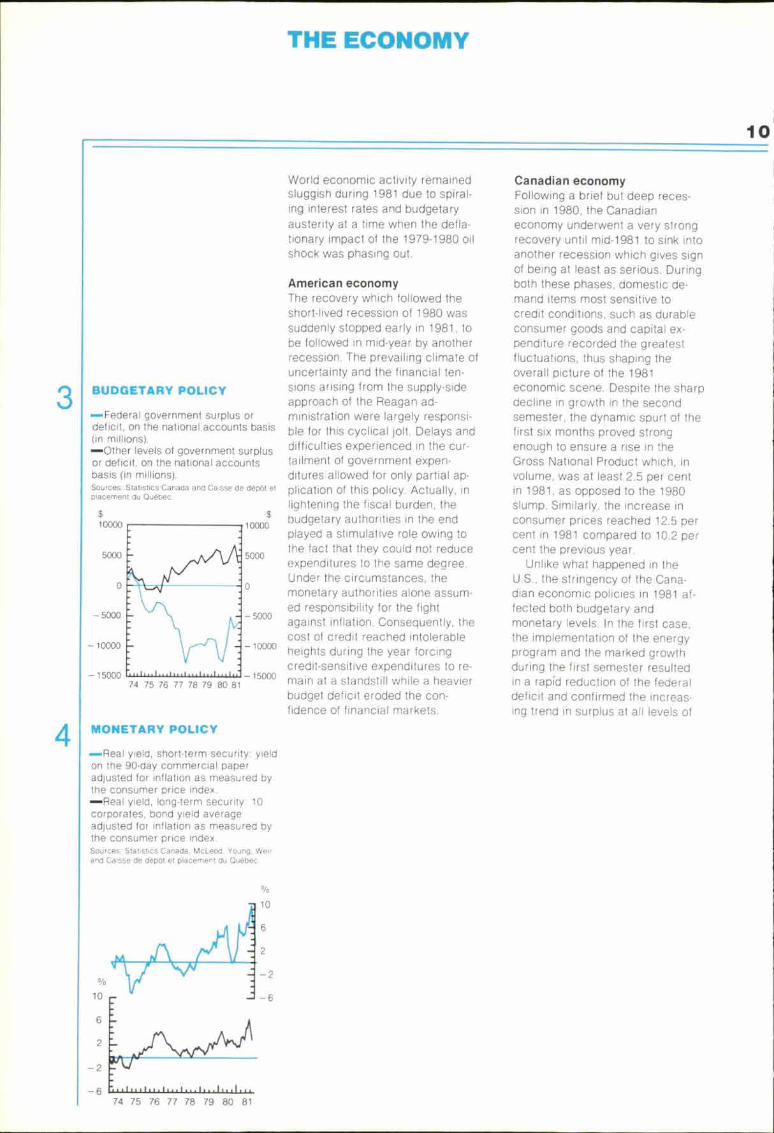
BUDGETARY POLICY
—Federal government surplus ordeficit, on the national accounts basis
millions).Other levels of government surplus
or deficit, on the national accountsbasis (in millions),Sources: Statistics Canada and Caisse de depêt etplacement du Quebec.
MONETARY POLICY
—Real yield, short-term security: yieldon the 90-day commercial paperadjusted for inflation as measured bythe consumer price index.
Real yield, long-term security: 10corporates, bond yield averageadjusted for inflation as measured bythe consumer price index.Sources. Statistics Canada. McLeod, Young. Weirand Caisse de dépôt et placement du Quebec.
World economic activity remainedsluggish during 1981 due to spiral-ing interest rates and budgetaryausterity at a time when the defla-tionary impact of the 1979-1980 oilshock was phasing out.
American economyThe recovery which followed theshort-lived recession of 1980 wassuddenly stopped early in 1981. tobe followed in mid-year by anotherrecession. The prevailing climate ofuncertainty and the financial ten-sions arising from the supply-sideapproach of the Reagan ad-ministration were largely responsi-ble for this cyclical jolt. Delays anddifficulties experienced in the cur-tailment of government expen-ditures allowed for only partial ap-plication of this policy. Actually, inlightening the fiscal burden, thebudgetary authorities in the endplayed a stimulative role Owing to
the fact that they could not reduceexpenditures to the same degree.Under the circumstances, themonetary authorities alone assum-ed responsibility for the fightagainst inflation. Consequently, thecost of credit reached intolerableheights during the year forcingcredit-sensitive expenditures to re-main at a standstill while a heavierbudget deficit eroded the con-fidence of financial markets.
Canadian economyFollowing a brief but deep reces-sion in 1980, the Canadianeconomy underwent a very strongrecovery until mid-1981 to sink intoanother recession which gives signof being at least as serious. Duringboth these phases, domestic de-mand items most sensitive tocredit conditions, such as durableconsumer goods and capital ex-penditure recorded the greatestfluctuations, thus shaping theoverall picture of the 1981economic scene. Despite the sharpdecline in growth in the secondsemester. the dynamic spurt of thefirst six months proved strongenough to ensure a rise in theGross National Product which, involume, was at least 2.5 per centin 1981. as opposed to the 1980slump. Similarly, the increase inconsumer prices reached 12.5 percent in 1981 compared to 10.2 percent the previous year.
Unlike what happened in theU.S., the stringency of the Cana-dian economic policies in 1981 af-fected both budgetary andmonetary levels. In the first case.the implementation of the energyprogram and the marked growthduring the first semester resultedin a rapid reduction of the federaldeficit and confirmed the increas-ing trend in surplus at all levels of
1 0
1 0

11
government (Graph 3). In the se-cond instance. the Bank of Canadafavored interest rates which in real
terms were exceptionally highcompared to previous yearsaverage, both on short-term and
long-term securities (Graph 4).Under the circumstances,monetary authorities were compel-led to check the fall of the Cana-
dian currency under the impact ofa maior deterioration of the current
account, the result of the cyclicalvariance of the Canadian economywith that of the rest of the world.
The effects of these restrictiveeconomic policies, in line withthose followed the previous years,may finally be observed in the per-
GROSS DOMESTIC PRODUCT
Ratio of the Canadian grossdomestic product to its trend for thelast ten years.Sources Slatisiics Canada ana Caisse de dépat el
placement du Quebec
7 7
4
-2
74 75 76 77 78 79 80 81
GROSS DOMESTIC PRODUCT
Growth differential in real grossdomestic product . Quebec lessCanada.Sources Stalisics Canaaa Conference Board ofCanada and Caisse ctfe clepbt el piacemeni du
Quebec
3 3
3 -374 75 76 77 78 79 808
formance of the Canadianeconomy which at the end of 1981stood at a level of approximately 5per cent off the previous ten-yeartrend (Graph 5).
Quebec economyWithin this context of worldwidelagging economy and stringentoverall stabilization policies inCanada, the situation in Quebecrapidly deteriorated in 1981 Ln ab-solute terms and as regards the
situation in Canada (Graph 6). Infact, when Quebec experiencedstrong economic activity in 1979 ,this stemmed from dynamic small-and medium-sized firms, much
more important in terms of employ-ment than those in Ontario. But the
policy of high interest rates follow-
ed in the last two years by theBank of Canada proved veryrestricting for these enterprises sothat employment ln that sector haddropped by 75 000 in December1981, as compared with December1980. With conditions prevailing on
the labour market, Quebec con-sumers were extremely wary and
the volume of retail sales declined
by 7.5 per cent from October 1980to October 1981. Such uncertaineconomic conditions coupled withthe precarious financial position of
companies caused the volume ofinvestments to stagnate in 1981 ex-cept for the housing constructionsector which posted slight gains
from an especially depressed level,it must be said.
The immediate outlook is notvery encouraging, given that a
struggling U.S. economy carriesalong that of Quebec and the rest
of Canada_ But although signs of
recovery are few at the moment, arebound may well materialize in the
second half of the year so thateconomic performance in 1983ought to be clearly better than in
1982.

REPORTOF THEGENERAL MANAGER
12
The year 1981 was the most activein the history of the Caisse dedépôt et placement du Quebecwith results testifying to major ad-vances and significant changes inmany respects. It must first beunderlined that, for the first timeduring one given year, funds undermanagement soared by more than$2 billion, reaching $13.9 billion atyear-end, compared with $11.7billion at the end of 1980. Consider-ing that annual growth of fundsunder management has since 1978exceeded $1.5 billion and thatassets have more than doubledevery five years since 1966, it is nowonder that Caisse has becomethe government corporation fourthin importance in Canada and oneof the ten largest financial institu-tions in the country.
The $2.2 billion increaseregistered in 1981 stems mainly
from the year's net income total-ling $1.3 billion, depositors net con-tributions of $732.3 million and netgains of $87.4 million from the saleof investments. Upon transfer ofthis amount to appropriate generalreserve accounts, and payment ofa net sum of $79.5 million as in-terest on demand and termdeposits, Caisse attributed the netincome to participation depositholders in its different funds asshown in the "Highlights" Table.
The summary of assets undermanagement given in Table 7 in-dicates the stated value of in-vestments to be $13.6 billion andrealization value, $11.2 billion, ashortfall of $2.4 billion. Thevariance, it will be noted, is greaterin the case of Bonds and MortgageFinancing - fixed incomesecurities. Yet, with respect toStocks and Convertible Securitiesand Heal Estate investments -variable income securities - anappreciation in value is recordedThe high interest rates prevailing in1981 caused a dramatic drop inthe value of fixed incomesecurities, whose preponderancewithin Caisse portfolios contributedto widen the spread already ex-isting at the end of the previousfiscal year. But as a result of theplanning initiated in 1980, togetherwith the 1981 investment program,the ratio of fixed income securitiesto aggregate long-term investmentswas brought from 86.4 per cent to82 per cent, thereby raising up theratio of variable income securitiesto 18 per cent.
BONDINVESTMENTSThe slated value of bond in-vestments totalled $9.7 billion atDecember 31, 1981 or 70.9 percent of Caisse overall investmentsas compared with 75.7 per centthe previous year. The breakdownof portfolios was as follows:General Fund, $7.1 billion;Segregated Bond Fund, $1.4billion; Segregated GovernmentBond Fund, $103.9 million; In-dividual Fund, $930.1 million andportfolios under management,$1455 million. The summary ofthese investments appears inTable 20 and data regardingmarket value, yield and relative im-portance of each category of bondsecurities is presented in Tables21, 22 and 23.
Investment strategyAs may be observed in Graph 8,for the second year in a row, thevolatility of the bond market wassuch that the investment strategyhad to be reconsidered. Morespecifically, portfolio managers feltthe need to question their tradi-tional perception of the mainvariables relating to investmentsand revised their concept of securi-ty, profitability and liquidity.
Security of capitalAny bond investment entails twotypes of risk: the specific risk, at-tributable to the borrower and themarket risk. Although the first may,to a large extent, be minimized by
SUMMARY OF ASSETS UNDER MANAGEMENTas at December 31, 1981
Of [Jolla r
InvestmentsGeneral Segregated
Fund funds
PortfoliosIndividual under
Fund management
Netchange Realization
Total in 1R81 value
7 120.6 1 473.4 930.2 145.5 9669.7 955.2 7 259_71 221.9 961.9 131.5 1.4 2316.7 820_3 2447.8
452.6 615.7 29.0 7.3 1 104 6 153.6 913.755.0 0.3 55.3 24.3 57.9
493.0 493 178.3 493.0(118.1) 13.5 104.6
9225.0 3 064.8 1195.3 154.2 13639.3 2131.7 11172.1217.5 28.0 26.8 3.2 275.5 356 275.5
94425 3092.8 1 222.1 157.4 13 914.8 2 167.3 11 447.6
RondsStocks and convertible securitiesMortgage financingReal estate investmentsShort-term investmentsDeposits in General Fund
Total investmentsOther asset , ,
Total assets under managementi
1 In the total assets under management, the assets of the General Fund do not include the amount of demand deposits of the segregated funds and the In.dividual Fund and interest accrued on those deposits. The assets of the segregated funds moreover reflect the deduction of advances by the General Fundand interest accrued on those advances.

EVOLUTION OF YIELD ONCANADIAN SECURITIESIN 1980 AND 1981
19811980111111111111111111.111
25
22
19
18
13
10
— Government of Canada Securities— over 10 years
— Chartered bankdeposit receipts — 90 daysSource. Bank df Canada Rev[ew
the acquisition of high-qualitysecurities, such is not the casewith the other
In the past, long-term securitiesissued by governments and largecorporations were considered safe,the investor being satisfied that hewould recover principal at maturity.after having obtained a fixed andguaranteed income. Also, whenneeded the near-total of principalcould be recouped by way of thesecondary market. Suchunderstanding of long-term bondswas based on the assumption thatinflation w•Duld more or less leveloff and that interest rates would,on the average , remain the same:consequently the realization valueof a given security would hold andthe purchasing power of the in-vested capital would be protected.There was no question of themarket presenting any risk.
Such a view is no longer true; fortwo years now the market value oflong-term bonds has fluctuated asmuch, if not more, than that of
stocks. Yet, bond investmentmathematics is such that themarket value of these securities ismore likely to fluctuate with in-
terest rate movements when the
due date is distant, coupon andyield, low. Conversely, the higherthe coupon and yield and thecloser the maturity, the lesser willthe impact be of interest rate fluc-
13
tuations on the market value of theinvestment, To ensure genuinesecurity of capital it is thereforenecessary to figure out betweenmaturity, coupon and yield a mixwhich will offer to the investor therisk he is willing to assume, con-sidering yield sought and interest
rate outlook.As regards the quality of in-
vestments in Caisse bond port-folios, the degree of risk is rathersmall: with respect to the markethowever, the risk is relatively high.
Actually, the market value of theseportfolios recorded pronouncedfluctuations during the last twoyears mainly due to a high content
in long-term, relatively low-coupon
and yield securities, when com-pared with prevailing rates. One ofthe objectives pursued during theyear was to bring to a more accept-
able level the degree of risk and
this was achieved by purchasing,on the primary market, medium-term securities, extensible orretractable bonds and, on thesecondary market, by exchanginglong-term securities for othersmaturing earlier, as well asfloating-rates bonds.
Profitability
One of Caisse major objectives isto ensure profitability of funds in-
!ested. In this respect however,
bond performance measure ismore accurate when based onrealized yield than on yield tomaturity. The notion of realizedyield actually takes into considera-tion both income and change in
market value for a set period. It
must be underscored al this pointthat unlike realized yield, yield tomaturity is not a proper benchmarkfor comparison with alternate typesof investments. Hence, on the
basis of realized yield, long-termbonds have not only displayed veryhigh volatility but, generally speak-ing, their yield was weak despitecurrent income often higher thanother types of investments.
Bond trading programs and trans-
actions aimed at reducingaverage maturity term causedsizable losses to be recorded.However, in the long run, perfor-
mance of the various bond port-folios should improve through re-investment at higher interest rates of
the proCeeds from the sale of
securities.
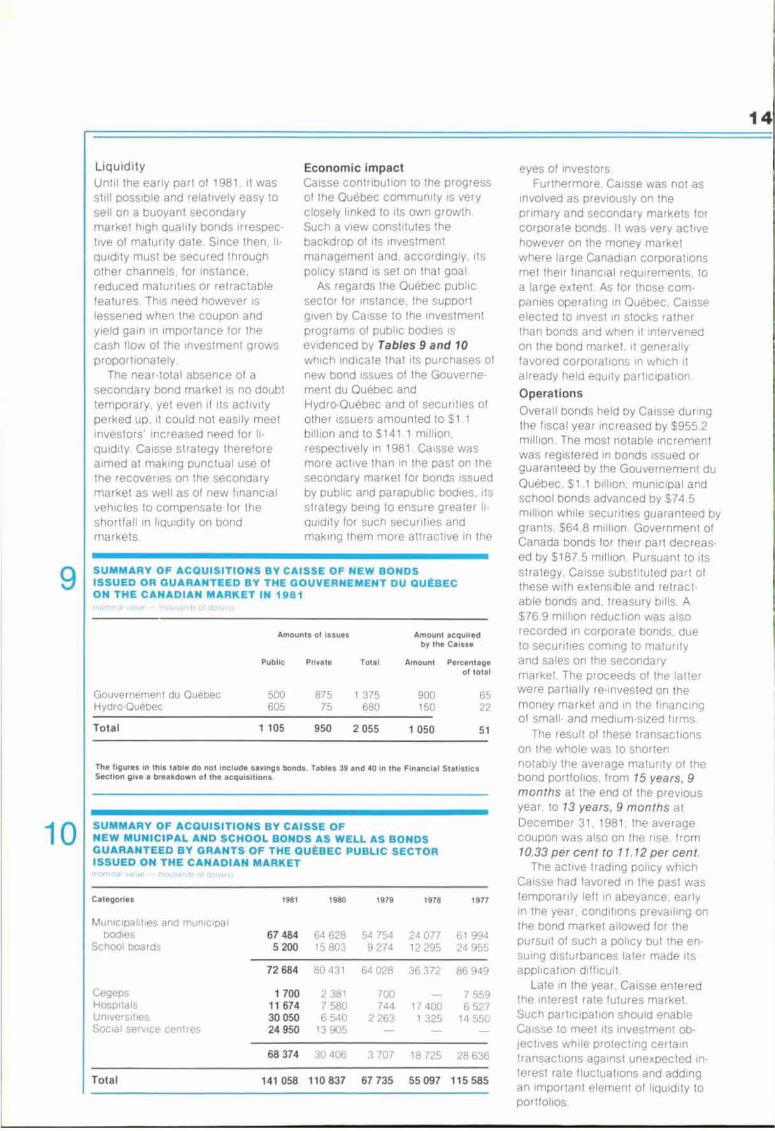
SUMMARY OF ACQUISITIONS BY CAISSE OF NEW BONDSISSUED OR GUARANTEED BY THE GOUVERNEMENT DU QUEBECON THE CANADIAN MARKET IN 1981
Amounts el issues Amount acquiredby the Caisse
Public
Private Total Amount Peveeniageof total
Gouvernement du QuebecHydro-Quebec
500605
87575
1 375680
900150
6522
51Total 1 105 950 2 055 1 050
The figures in this table do not include savings bonds. Tables 39 and 40 in the Financial StatisticsSection give a breakdown of the acquisitions.
SUMMARY OF ACQUISITIONS BY CAISSE OFNEW MUNICIPAL AND SCHOOL BONDS AS WELL AS BONDSGUARANTEED BY GRANTS OF THE QUEBEC PUBLIC SECTORISSUED ON THE CANADIAN MARKET
Categories
Municipalities and r•nunicipai
1981 1980 1974 1978 1977
bodies 67 484 64 628 54 754 24 077 61 994School boards 5 200 15 803 9 274 12 295 24 955
72 684 80 431 64 028 36 372 86 949
Cegeps 1 700 2 381 700 7 559Hospitals 11 674 7 580 744 17 400 6 527Universities 30 050 6 540 2 263 1 325 14 550Social service centres 24 950 13 905
68 374 30 406 3 707 18 725 28 636
Total 141 058 110 837 67 735 55 097 115 585
14
Liquidity
Until the early part of 1981, it wasstill possible and relatively easy tosell on a buoyant secondarymarket high quality Ponds irrespec-tive of maturity date. Since then, li-quidity must be secured throughother channels, for instance,reduced maturities or retractablefeatures_ This need however islessened when the coupon andyield gain in importance for thecash flow of the investment growsproportionately.
The near-total absence of asecondary bond market is no doubttemporary, yet even it ils activityperked up, it could not easily meetinvestors increased need for li-quidity. Caisse strategy thereforeaimed at making punctual use ofthe recoveries on the secondarymarket as well as of new financialvehicles to compensate for theshortfall in liquidity on bondmarkets.
Economic impactCaisse contribution to the progressof the Québec community is veryclosely linked to its own growth.Such a view constitutes thebackdrop of its investmentmanagement and, accordingly, itspolicy stand is Set on that goal.
As regards the Quebec publicsector for instance, the supportgiven by Caisse to the investmentprograms of public bodies isevidenced by Tables 9 and 10which indicate that its purchases ofnew bond issues of the Gouverne-ment du Quebec andHydra-Québec and of securities ofother issuers amounted to $1.1billion and to $141.1 million,respectively in 1981. Caisse wasmore active than in the past on thesecondary market for bonds issuedby public and parapublic bodies, itsstrategy being to ensure greater li-quidity for such securities andmaking them more attractive in the
eyes of investors.Furthermore. Caisse was not as
involved as previously on theprimary and secondary markets forcorporate bonds. It was very activehowever on the money marketwhere large Canadian corporationsmet their financial requirements, toa large extent. As for those com-panies operating in Quebec . Caisseelected to invest in stocks ratherthan bonds and when it intervenedon the bond market, it generallyfavored corporations in which italready held equity participation.
Operations
Overall bonds held by Caisse duringthe fiscal year increased by $955.2million. The most notable incrementwas registered in bonds issued orguaranteed by the Gouvernement duQuebec, $1.1 billion: municipal andschool bonds advanced by $74.5million while securities guaranteed bygrants. $64.8 million. Government ofCanada bonds for their part decreas-ed by $187.5 million. Pursuant to itsstrategy. Caisse Substituted part ofthese with extensible and retract-able bonds and, treasury bills. A$76.9 million reduction was alsorecorded in corporate bonds, dueto securities coming to maturityand sales on the secondarymarket. The proceeds of the latterwere partially re-invested on themoney market and in the financingof small- and medium-sized firms.
The result of these transactionson the whole was to shortennotably the average maturity of thebond portfolios. from 15 years, 9months at the end of the previousyear, to 13 years, 9 months atDecember 31, 1981: the averagecoupon was also on the rise, from10.33 per cent to 11.12 per cent.
The active trading policy whichCaisse had favored in the past wastemporarily left in abeyance: earlyin the year, conditions prevailing onthe bond market allowed for thepursuit of such a policy but the en-suing disturbances later made itsapplication difficult.
Late in the year, Caisse enteredthe interest rate futures market.Such participation should enableCaisse to meet its investment ob-jectives while protecting certaintransactions against unexpected in-terest rate fluctuations and addingan important element of liquidity toportfolios.
9
10
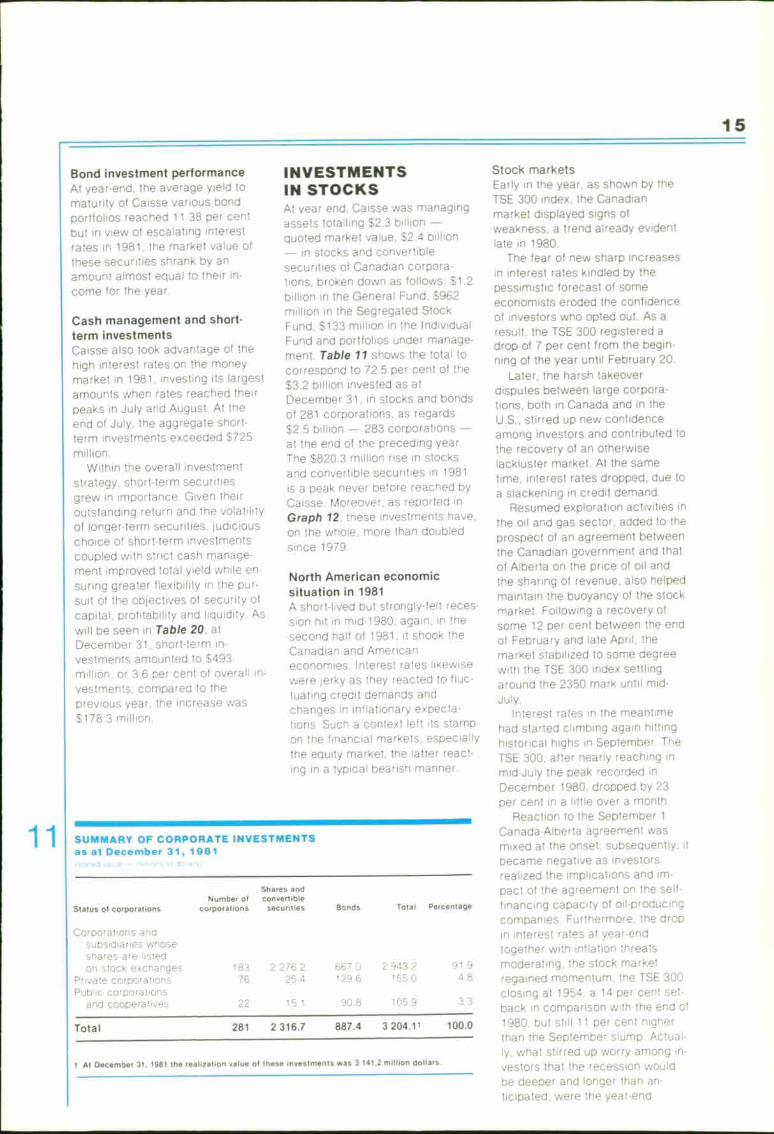
SUMMARY OF CORPORATE INVESTMENTSas at December 31, 1981
Shares andNumber of convertibie
Status ut corporations corporations securities Bonds Total Percentage
Corporations andsubsidiaries whoseshares are listedon stock exchanges 182 2 276 2 667 0 2 943 2 91 9
Private corporations 76 254 129 6 155 0 4 8
Public corporationsand cooperatives 22 15 1 908 05 3
Total 281 2 316.7 887.4 3204.1 1 100.0
1 Al December 31. 1981 the realization value of these investments was 3 141.2 million dollars
15
Bond investment performance
At year-end, the average yield to
maturity of Caisse various bondportfolios reached 11.38 per cent
but in view of escalating interest
rates in 1981, the market value of
these securities shrank by an
amount almost equal to their in-come for the year.
Cash management and short-
term investments
Caisse also took advantage of the
high interest rates on the money
market in 1981, investing its largest
amounts when rates reached their
peaks in July and August. At the
end of July, the aggregate short-term investments exceeded $725
Within the overall investmentstrategy. short-term securitiesgrew in importance. Given theiroutstanding return and the volatility
of longer-term securities, judicious
choice of short-term investmentscoupled with strict cash manage-
ment improved total yield while en-suring greater flexibility in the pur-
suit of the objectives of security of
capital, profitability and liquidity_ As
will be seen in Table 20, atDecember 31, short-term in-vestments amounted to $493million. or 3.6 per cent of overall in-
vestments: compared to the
previous year, the increase was$178,3 million.
INVESTMENTSIN STOCKSAt year end, Caisse was managingassets totalling $2.3 billion —
quoted market value. $2.4 billion
— in stocks and convertiblesecurities of Canadian corpora-tions, broken down as follows: $1.2
billion in the General Fund, $962million in the Segregated Stock
Fund, $133 million in the IndividualFund and portfolios under manage-ment. Table 11 shows the total to
correspond to 72.5 per cent of the
$3.2 billion invested as atDecember 31, in stocks and bonds
of 281 corporations, as regards$2.5 billion — 283 corporations —
at the end of the preceding year,
The $820.3 million rise in stocks
and convertible securities in 1981is a peak never before reached by
Caisse. Moreover, as reported in
Graph 12. these investments have.
or the whole, more than doubled
since 1979
North American economic
situation in 1981A short-lived but strongly-felt reces-sion hit in mid-1980: again, in thesecond half of 1981, it shook the
Canadian and Americaneconomies. Interest rates likewise
were jerky as they reacted to fluc-tuating credit demands and
changes in inflationary expecta-
tions. Such a context left its stamp
on the financial markets, especially
the equity market, the latter react-
ing in a typical bearish manner.
Stock marketsEarly in the year, as shown by the
TSE 300 index, the Canadianmarket displayed signs of
weakness, a trend already evidentlate in 1980_
The fear of new sharp increasesin interest rates kindled by thepessimistic forecast of someeconomists eroded the confidence
of investors who opted out. As a
result, the TSE 300 registered adrop of 7 per cent from the begin-ning of the year until February 20.
Later, the harsh takeoverdisputes between large corpora-tions, both in Canada and in the
U.S., stirred up new confidenceamong investors and contributed to
the recovery of an otherwiselackluster market. At the same
time, interest rates dropped, due to
a slackening in credit demand_Resumed exploration activities in
the oil and gas sector, added to the
prospect of an agreement betweenthe Canadian government and that
of Alberta on the price of oil and
the sharing of revenue, also helped
maintain the buoyancy of the stock
market. Following a recovery of
some 12 per cent between the end
of February and late April, themarket stabilized to some degreewith the TSE 300 index settling
around the 2350 mark until mid-
July.Interest rates in the meantime
had started climbing again hittinghistorical highs in September. The
TSE 300. after nearly reaching in
mid-July the peak recorded inDecember 1980, dropped by 23
per cent in a little over a month_
Reaction to the September 1Canada-Alberta agreement wasmixed at the onset: subsequently. it
became negative as investors
realized the implications and im-
pact of the agreement on the self-
financing capacity of oil-producingcompanies_ Furthermore, the drop
in interest rates at year-endtogether with inflation threatsmoderating. the stock marketregained momentum, the TSE 300
closing at 1954. a 14 per cent set-
back in comparison with the end of
1980, but still 11 per cent higher
than the September slump. Actual-ly. what stirred up worry among in-vestors that the recession wouldbe deeper and longer than an-
ticipated. were the year-end

DISTRIBUTION OF CORPORATE INVESTMENTS IN SHARESAND BONDS BY ORDER OF IMPORTANCEas at December 31, 1981
Shares and
Number at
convertibleCategories corporations securities
Bonds Total Percentage
To 10 million 225 226.7 298.4 525.1 16.410 10 25 million 28 317.9 127A 445.3 13.925 to 50 million 14 331.6 192.0 523.6 16.350 to 100 million 9 537.5 107.4 644_9 20.1100 million and more 5 903.0 162.2 1 065.2 33.3
Totat 281 2 316.7 887.4 3204.1 1 100.0
1 Realization value of these investments at December 31, 1981 was 3141.2 million dollars.
16
12
13
1000
MI Bonds
Shares andconvertible securities
statistics and the evidence ofserious deterioration of theeconomy.
Investment strategyWith the prospect ol a recurringslump in 1981 and an extension ofthe stock market cycle, Caissemaintained the defensive strategyinitiated in 1980_ Although thatstrategy proved premature the firstyear mostly because of numeroustakeover bids, it nonethelessbrought results in 1981 wheneconomic conditions and the stockmarket behaved as forecast.Taking into consideration the an-ticipated recovery in the secondsemester of 1982, it would seemsuitable gradually to follow a moredynamic policy thrust with respectto stocks.
A dizzy sequence of takeovers,several of these transactions in-volving major corporations engag-ed in the development of naturalresources, shook the market in1981 both in Canada and in theU.S. The most important mergersand acquisitions in the history ofthe North American economy wererecorded. This phenomenon inCanada may notably be explainedby the diligent action of some cor-porations in taking advantage ofthe oil industry canadianization pro-gram introduced by the federalgovernment in October 1980.
Among examples of this timelyintervention ; the following areworth mentioning: the acquisitionof Petrofina Canada by Petro-Canada ($1.5 billion); the transac-tion involving Dome PetroleumLimited and Conoco inc. for a 52.9per cent interest in Hudson Bay'sOil and Gas ($1.7 billion U.S.); thepurchase by Canada DevelopmentCorporation of a near-75 per centparticipation in Aquitaine Canada($1.6 billion) then held by SocieteNationale Elf Aquitaine of France.
Brascade Resources Inc.Such was the framework of thenegotiations between BrascanLimited ("Brascan") and Caisse forthe setting up of a new investmentcompany under the nameBrascade Holdings Inc.("Holdings") whose object wouldbe the development of naturalresources in Canada through itssubsidiary, Brascade ResourcesInc. ( 'Brascade"). A press releaseissued on July 23, 1981 by bothparties to the agreement announc-ed that (1) the share capital ofHoldings would be held by Brascanand Caisse on a 70 per cent and30 per cent basis, respectively; (2)the partners would pool theirholdings in common and preferredshares of Noranda Mines Limited("Noranda"), initially givingBrascacle a 28 per cent interest inNoranda; (3) they had authorizedsubscription of an additional $600million in Holdings' treasury com-mon shares; (4) Brascade would ar-range a $1 billion bank line withmajor Canadian chartered banksfor the purchase of Noranda com-mon shares and (5) they con-templated a widespread publicdistribution of Brascade shares. In
EVOLUTION OF INVESTMENTS INSHARES AND CORPORATE BONDSas at December 3151a!€, d vaCurf - mdilc,ns
4000
3000
2000
Operations and transactionsCaisse was most active on thestock market in 1981. Through ac-quisition of substantial equity par-ticipation in certain corporations,among other things, it increasedthe proportion of shares and con-vertible securities within its overallinvestments from 13 to 17 per centin 1981, the highest level since1975.
Distribution of corporate in-vestments in shares and bonds byorder of importance appears inTable 13; at December 31, Caisseboasted $2.7 billion in investmentsexceeding $10 million, in 56 com-panies, an average of $47.8 million,as opposed to $36 million last year.

17
the press release, the following
was also slated, "Brascan andCaisse. as the two largestshareholders of Noranda. arehopeful that by increasing theirholdings they can be assured ofboard representation to give them
and other shareholders an effec-tive voice in the affairs of Noran-
da".Before the offer to purchase
dated September 1 was sent to
Noranda common and preferred
shareholders, an agreement wasreached between the management
of Brascade and Noranda whereby
Brascade was to subscribe 12.5million Noranda common treasuryshares for an aggregate amount of
$500 million and secure adequaterepresentation to an expanded
board. On September 25, Brascadeannounced that approximately 69.8million common and some 3.2million preferred share certificates
of Noranda had been tendered.Then owner of 42 per cent ofNoranda common shares,Brascade listed its convertiblepreferred shares with both theBourse de Montreal and the Toron-
to Stock Exchange or November
23.
and bonds according to the 14 ma-jor sectors of activity of the TSE300 and confirms the investmentpolicy outlined in this report. Thenet $743.4 million change is theresult of a rise of $820.3 million inequities and a $76.9 million
decrease in bonds.In addition , this table shows that
the main changes to be found first
are under "Metals and minerals",then "Oil and gas • . "Transporta-
tion" and "Utilities". The first entryrecorded a $372.5 million increase
due mainly to the Brascade trans-action. In the second case, thecharge is a normal stabilization ad-justment of this sector within theoverall portfolios. The variationunder "Transportation" reflectsparticularly Caisse increasedholdings in Canadian PacificLimited, of which it had been a ma-jor shareholder tor some years.
The $57.7 million increment in"Utilities" is for the most part theresult of a transaction concludedMarch 30, 1981 for a $55 016 392issue of subordinated debentures,13 per cent. of Northern and Cen-tral Gas Corporation Limited, ex-changeable at the option of Caisseover a 7 1/2-year period for6 877 049 Gaz Métropolitain, inc.
common shares at an exchangeprice of $8 each. Under the terms
of this transaction. Caisse may usethe voting rights attached to thecommon shares of this companyfor which these debentures are ex-changeable. Thereby, Caisse which
beneficially owned 2 314 000 (12_9per cent) of Gaz Métropolitainoutstanding common shares couldexercise the voting rights attached
to 9 191 049 (51.2 per cent)outstanding common shares of that
company. At December 31, 1981.Caisse had not exercised its ex-change privilege.
Domtar Inc.Several other major transactions inthe resource field were completedin 1981: acquisition of Abitibi-PriceInc. by Olympia & YorkDevelopments Ltd. ($620 million)
and that of Canadian InternationalPaper Company by CanadianPacific Enterprises Limited ($1.1billion). It must also be recalledthat on August 18. Societegénérale de financement duQuebec and Caisse announcedthat they held 22 per cent and 20per cent, respectively. of DomtarInc. common shares and as aresult, they were the two majorshareholders. After consultationwith the management of Domtar, itwas announced by the latter that
adequate board representationwould be granted to the twoshareholders within an expanded
board of directors and also, on theexecutive committee.
Relative importance of
sectors of activity
Table 14 presents the components
of corporate investments in shares

18
SHARES AND CORPORATE BONDSBY SECTORS OF ACTIVITYas al December 31, 19131
Sectors of activity
Shares and
Number of convertible
corporations securities Bonds
Net
change
Total in 1981
Metals and minerals 11 591 .0 48.0 639.0 372.5Golds 2 120 12.0 12.0Oil and gas 14 228.0 41.0 269.0 76.9Paper and forest
products 17 157 6 33.9 191.5 15.3Consumer products 46 222.0 116.9 338.9 52.2Industrial products 51 165.0 125.9 290_9 37.1Real estate and
construction 19 23 56.0 58.3 (17.4)Transportation 8 170.8 10.0 180.8 74.2Pipelines 5 58.2 07 58.9 27.3Utilittes 15 207 8 183 6 391 4 57.7Communications
and media 10 49 3 11.9 61,2 11.5Merchandising 36 92.3 42.7 15.0 23.5Financial services 38 331.0 214.1 545.1 (11.4)Investment companies 9 29 4 2.7 32 1 12.0
Total 281 2 316.7 887.4 3 204.11 743.4
1 Realization value of these investments at December 31. 1981 was 3 141.2 million dollars.
14
Stock portfolio yieldIncome from investments in sharesand convertible securities of theGeneral Fund, the SegregatedStock Fund and the Individual Fundtotalled $316.4 miIlion, $130 millionof which in dividends and interestand $186.4 million in net gainsfrom sales of investments. Thegreater part of this last amountstems from the disposal of in-terests in Abitibi-Price, AquitaineCompany of Canada Lid., Mac-Millan Bloedel Limited, PetrofinaCanada Inc., The Seagram Com-pany Ltd and Texasgulf Inc.,following private or public offers topurchase_
Despite unfavorable conditionson the stock market in 1981,Caisse has nevertheless managedto record on the whole a rate ofreturn slightly higher than the TSE300 which stood at -13.9 per cent,excluding dividends, and at -10.3per cent when including them. TheGeneral Fund stock portfolioregistered a total yield of -9.8 percent, -14.1 per cent as to capitaland 4.3 per cent. income. TheSegregated Stock Fund for its partreported a total return of -9.9 percent, considering a 4.7 per cent in-come. Investments in shares andconvertible securities of the In-dividual Fund, first purchases ofwhich go back to January 1981,
yielded -8.8 per cent for the eleven-month period, -137 per cent at-tributable to capital and 4.9 percent, to income.
19
CORPORATEFINANCINGUnder the heading of corporatefinancing are Included the In-
vestments made by Caisse since1967 in medium-sized private firmsnot listed on the stock market andcorporations in the Quebec publicand cooperative sectors. Such in-vestments do not however includemortgage loans on commercial andindustrial buildings nor sale andleaseback transactions.
The year 1981 was one of transi-
tion and policy change for thedépartement des financementsd'entreprises which was entrustedwith coordinating all operationsrelated to the financing of Quebecsmall- and medium-sized firms.Under the terms of this new man-date. the department is consider-ing, in addition to maintainingregular service to its existingcustomers, acquiring equity par-ticipation through subscription toconvertible debenture issues, com-mon or convertible preferredshares in companies of goodstanding, dynamic, profitable andlikely to expand rapidly. By meansof participation in the share capital.ranging from 10 per cent to 30 percent and for a minimum of
$500 000, the department is look-ing for service or manufacturingcorporations whose owners/managers are willing to work withone or more experienced financial
partners. Associations of this typewill aim at promoting moderniza-tion and expansion projects. aswell as acquisitions or mergersand, in certain instances, providing
the consolidation of financial struc-tures.
As indicated in Table II. this ac-tivity at December 31. involved$261 million — 98 corporations. or8.1 per cent of the aggregateamounts invested in Canadianenterprises_ During the year. 73
financing proposals were filed; atotal of $19.5 million was subscrib-ed, compared to $61.4 million in1980_ Despite this drop in volume,a rise exceeding $100 million insuch holdings must be noted since1978, following analysis of morethan 200 projects. In 1981, thedepartment's outlays reached$29.5 million and at December 31.the balance of commitments total-led $5.2 million.
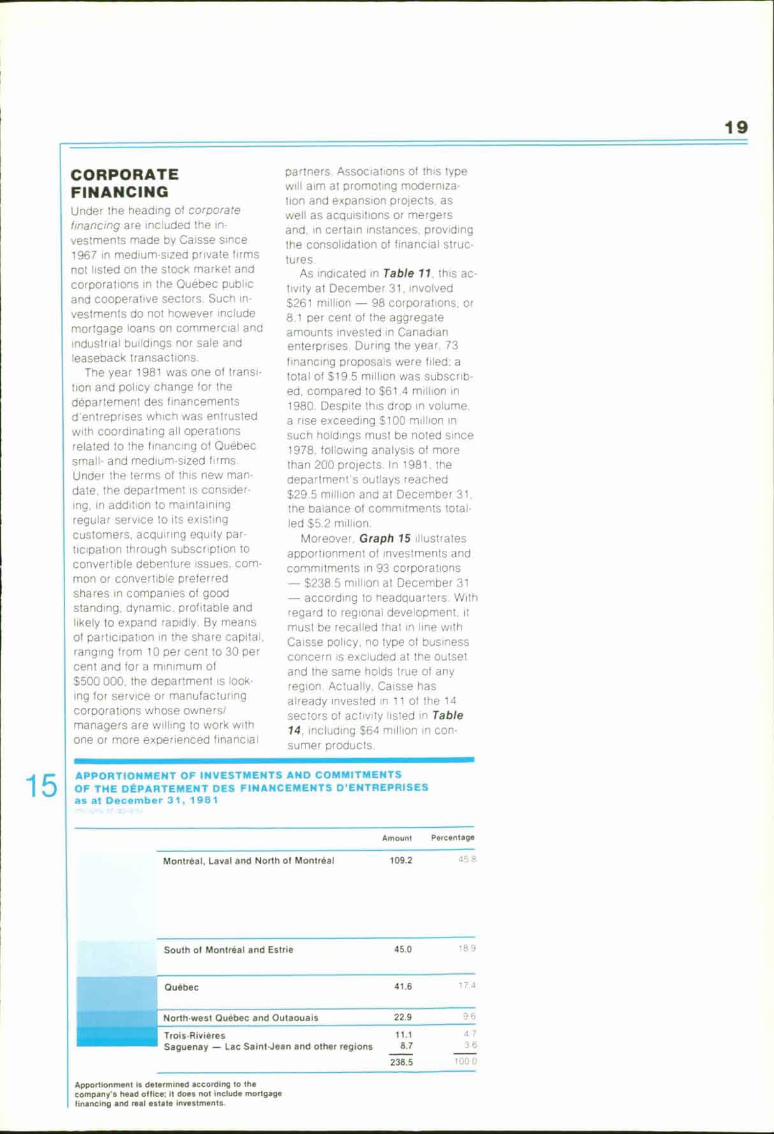
Moreover, Graph 15 illustratesapportionment of investments andcommitments in 93 corporations $238.5 million at December 31— according to headquarters. Withregard to regional development, itmust be recalled that in line withCaisse policy, no type of businessconcern is excluded at the outsetand the same holds true of anyregion. Actually. Caisse hasalready invested in 11 of the 14sectors of activity listed in Table14, including $64 million in con-sumer products.
15 APPORTIONMENT OF INVESTMENTS AND COMMITMENTSOF THE DEPARTEMENT DES FINANCEMENTS D'ENTREPRISESas at December 31, 1981
Amount Percentage
Montréal. Laval and North of Montreal 109.2 458
South of Montreal and Estr 45.0 189
Quebec 41.6 1 74
North-west Quebec and Outaouais 22.9 96
Trois-Rivières 11.1 4 7
Saguenay — Lac Saint-Jean and other regions 8.7 36
238.5 100 0
Apportionment is determined according to thecompany's head office: it does not include mortgagefinancing and real estate inveslments.

20
MORTGAGE FINANCING ANDREAL ESTATE INVESTMENTSas at December 31
value — ['pinions
1200
1000
800
600
400
200
Balance at yearend
Industrial
Commercial
Residential
1977 1978 1979
MORTGAGEFINANCINGCaisse mortgage holdings duringthe year exceeded $1 billion toreach the $1.1 billion mark atDecember 31. As observed inTable 20, this portfolio inciudedfirst mortgages on dwellings for$601.6 million, commercial and in-dustrial building financing for $478million and other types of debtamounting to $25 mnon. Withinthe overall Caisse investments, theproportion of mortgage financingreceded to 8.10 per cent in 1981compared to 8.27 per cent at theend of 1980.
Outlays for the year totalled$195 million, 50 per cent morethan in 1980 and broken down asfollows: $47 million for the GeneralFund; $120 million for theSegregated Mortgage Fund and$28 million for the Individual Fund.The housing sector for its partclaimed 58 per cent of thesedisbursements while the commer-cial and industrial buildingcategories represented 36 per centand 6 per cent. respectively. Thehousing construction industryshowed small gains in Quebec in
1980 198/
16

21
1981. with housing starts number-
ing 29 645 units as opposed to
29 186 in 1980.The mortgage financing port-
folios posted the following yields:
10.54 per cent for the General
Fund, 11_81 per cent for theSegregated Mortgage Fund and
19.89 per cent for the IndividualFund. such securities being in-cluded in the latter for the first
time_ The balance of mortgagecommitments at the end of theyear amounted to $91 million, 82
per cent of which earmarked forthe housing sector.
REAL ESTATEINVESTMENTSCaisse, like many other investors.is constantly on the look out forways to safeguard its funds againsterosion. Having reduced the terms
of mortgage loans, it endeavoured
to share in the appreciation of the
real estate properties it had financ-ed notably through partnership withreal estate developers, later to im-
plement a policy dealing with ac-
quisition of commercial or in-
dustrial buildings.Supply in this field increased
noticeably due to difficult financing
conditions and, to a certain extent.
this gave momentum to Caisse
new orientation. Whenever sale is
contemplated. the potential buyeris whoever can produce a substan-
tial down payment and wait until in-terest rates stabilize pending soundlong-term financing. From thispoint of view. Caisse foresees amarked rise in its real estate activi-ty.
Since this kind of operations re-
quire facilities to be provided on a
daily basis, Caisse expanded itsoperating framework throughwholly-owned subsidiaries, CadimInc.. Développements Pasteur Inc..
Immeubles Cadimont Inc. and Im-
meubles Cadev Inc . whose object
is to acquire. hold , rent and ad-
minister real estate properties_ The
financial statements of these sub-sidiaries are consolidated with the
General Fund.
Three purchase offers were ap-proved and completed during the
year for an overall investment of
$19 million. The real estate proper-
ties involved are an office building
1 at Montreal. another at Quebec
and a shopping center at Gaspé.
With respect to Montreal and
Quebec. Caisse is the exclusiveowner. In the third case, it holds an
80 per cent interest. In the wake of
these transactions, real estate in-vestments at year-end amounted tO
$55.3 million, a $24.3 million in-
crease over the preceding year. A
summary of real estate in-vestments is provided in Table 42.
FUNDS UNDER.MANAGEMENTThere are six different fundsthrough which Caisse manages theholdings of its depositors: the finan-
cial position of each is presented inthe Financial Statements Section
of this report. The following is asummary of the operating resultsfor the year ended December 31,1981. In the latter part of the fiscal
year. a minor change was brought
to the regulations whereby thetransactions of depositors in the
segregated funds and the In-
dividual Fund are to be reported on
a monthly rather than quarterlybasis from January 1, 1982.
General FundAmong the assets in this fund are
those of the Régie des rentes du
Quebec and the Régie de
l'assurance automobile du Quebec,
this fund also acts in a bankingcapacity to all depositors and the
various other funds.
General Fund assets were $9.6billion at December 31, an in-
crease of $1.3 billion over last
year_ Mainly responsible for this in-
crement are net income of $904.2million and net contributions of
$295.1 million as compared to
$497.3 million in 1980.Investments of the General Fund
reached $9.3 billion. Table 21shows the summary of these in-
vestments. various item changes
as well as the realization value set
at $7.6 billion. The weighted
average yield — current income —
was 10_82 per cent against 10_42
per cent the previous year.For reasons already dealt with,
realization value of a General Fund
unit stood at $674 from $784 at the
end of 1980. But as will be seen in
Table 24, the current yield on
average participation deposits ad-vanced to 10.50 per cent from
10.20 per cent_
Segregated fundsin tnese four funds are managed
holdings of public and parapublicsupplemental pension plans and of
the construction industry. Through
these pooled funds, the ad-ministrators of these plans,together with Caisse authorities,may allocate their funds accordingto specific requirements and objec-
tives.The combined assets of the four
segregated funds amounted to$3.1 billion at December 31, a$678.6 million increase from 1980.In addition, these fundsrepresented at year-end 22.2 per
cent of Caisse overall assets undermanagement, in 1980, this percen-
tage was 20.8.

22
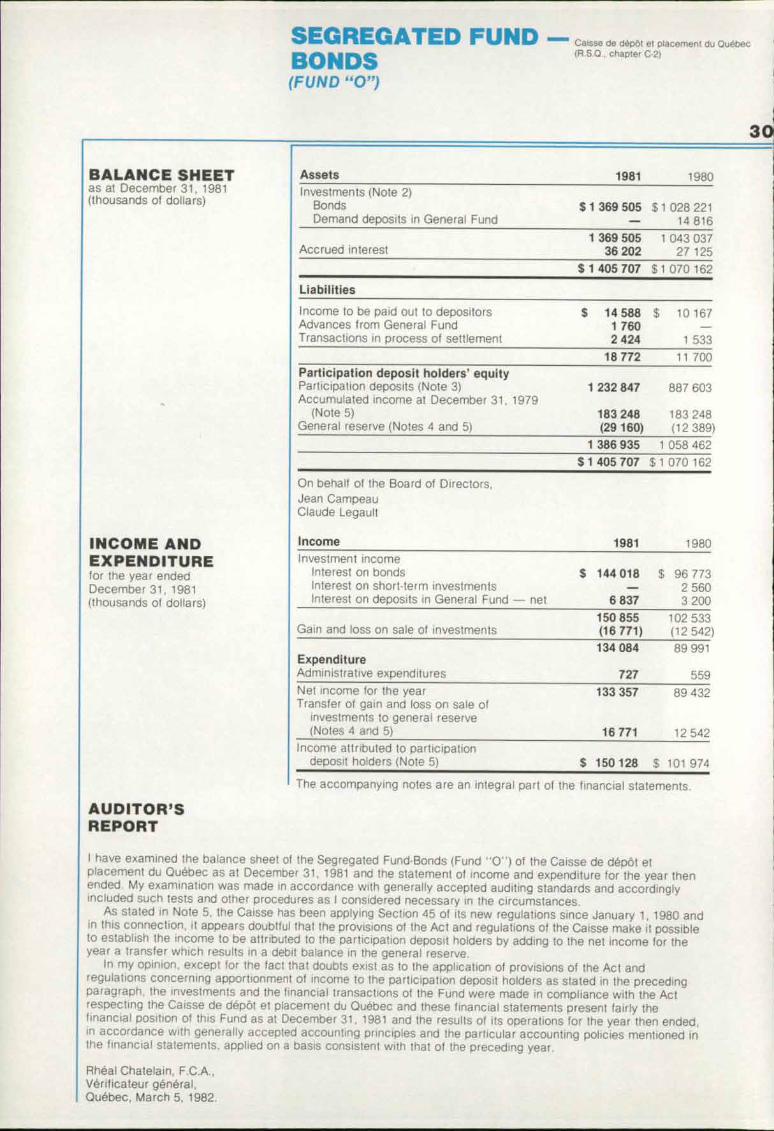
Fund "0" investments of $1.4billion and Fund "G", $108.2million, account for 48.2 per centof segregated funds investments;the $971.1 million of Fund "A",31.7 per cent and the $616 millionof Fund "H", 20.1 per cent_
The five plans in the segregatedfunds recorded deposits of $327.2million during the year, against$292.2 million in 1980. Overall netft)come of the four funds for theyear was $336.9 million, comparedwith last year's total of $224.5million.
Table 22 provides the summaryof investments by categories,changes during the year andweighted average yields. Their totalincreased by $666.4 million toreach $3.1 billion at year-end.
Fund "0"Assets of the Segregated BondFund surged by $335.5 million toreach $1.4 billion at December 31Investments in bonds represented$1.37 billion, with realization valueof $1,1 billion.
Net income of the fund totalled$133.4 million; the fund's unitrealization value declined from$1924 in 1980 to $1644 in 1981. In-come paid to participation depositholders expressed as a percentageof the average participationdeposits of the fund was 11,77 percent, as given in Table 26.
Fund "G"At December 31, the SegregatedGovernment Bond Fund recordedassets of $111.3 million and in-vestments of $108.2 million, therealization value of the latter was$75.5 million. The fund's net in-come for the year amounted to$10.4 million; income paid toholder represented a 10.04 per centyield on the average participationdeposits as shown in Table 27. Asto unit realization value, it was$914 at the end of the year.
Fund "A"Assets of the Segregated StockFund were $979 million atDecember 31, a surge of $259.8million. Holdings of the participa-tion deposit holders were on therise by $262.4 million following$188.1 million issue of units andtaking account of $74.3 million ingains realized and recorded in thegeneral reserve. Investments offund "A" were $971.1 million, withrealization value, approximately ofthe same order. The fund's net in-come for the year amounted to$130.8 million and the portion paidto participation deposit holdersrepresented a 7.27 per cent yieldon average deposits, as listed inTable 28. Unit realization valueamounted to $2427 at year-end.
Fund "H"The Segregated Mortgage Fundrecorded assets higher by $84million, totalling $626.4 million atDecember 31.
The portfolios, made up mainlyof mortgage financing, also includereal estate properties fromforeclosure, stood at $616 millionand were valued at $534.2 million.The fund's net income for the yeartotalled $62.3 million. Table 29shows for 1981 a yield of 11.16 per
cent on average participationdeposits, as against 10.45 per centthe previous year. The fund's unitrealization value was $1844 atyear-end.
Individual FundThe Individual Fund for the Com-mission de la santé et de lasécurité du travail was created in1977. At December 31, its assetshad increased by $259.4 million toreach $1.2 billion.
During the year, the Commissionacquired $254 million in participa-tion deposits, $110 million of whichfrom receipts and the rest fromreinvested income. Table 25 in-dicates the yield on average par-ticipation deposits to be 10.93 percent,
The individual Fund's in-vestments, which until now mostlyincluded bonds, were diversifiedduring fiscal 1981. At year-end.they reached $1.2 billion, of thatamount $131.5 million in sharesand convertible securities and $29million in mortgage financing. Totalrealization value was $928.8million, as appears in Table 23.which also gives the breakdown ofportfolios, changes during the yeartogether with yield.
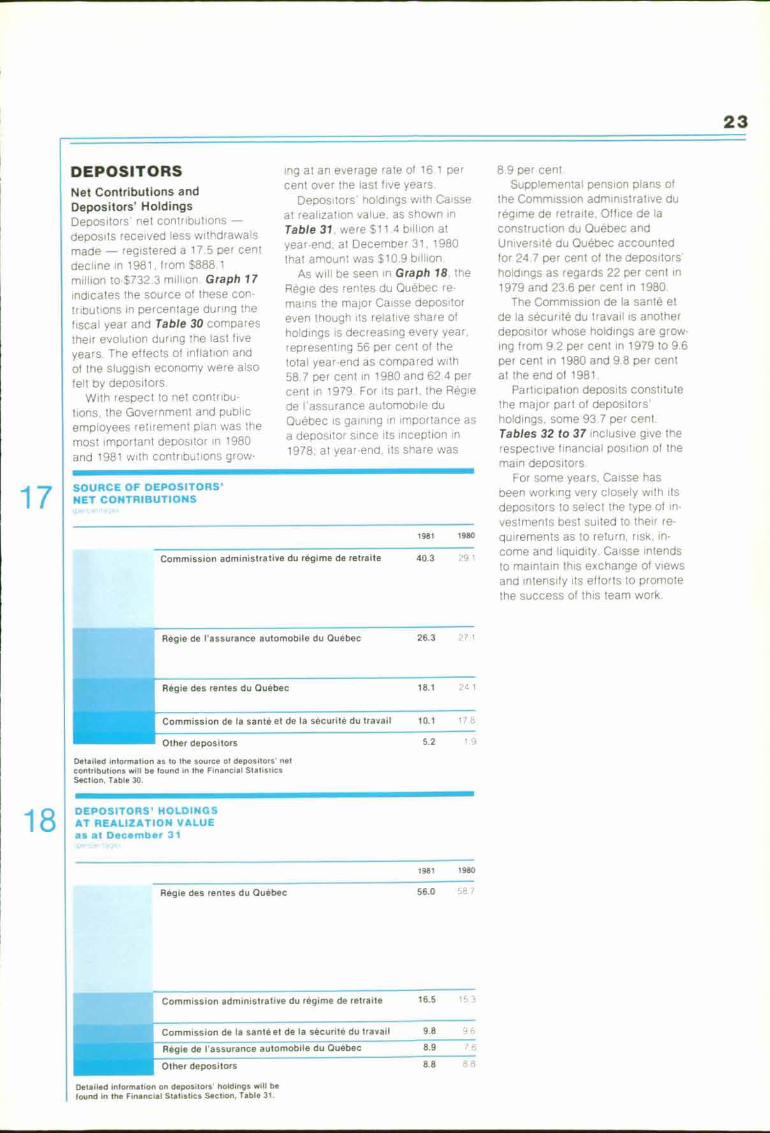
SOURCE OF DEPOSITORS'NET CONTRIBUTIONS
Commission administrative du regime de retraite
Régie de l'assurance automobile du Quebec
Régie des rentes du Quebec
Commission de la santé et de la sécurité du travail
Other depositors
Detailed information as to the source of depositors netcontributions will be found in the Financial StatisticsSection. Table 30.
Régie des rentes du Quebec
Commission administrative du regime de retraite
Commission de la santé et de la sécurité du travail
Régie de l'assurance automobile du Quebec
Other depositors
23
DEPOSITORSNet Contributions andDepositors' HoldingsDepositors' net contributions —deposits received less withdrawalsmade — registered a 17.5 per cent
decline in 1981, from $888 1million to-S7 32.3 million. Graph 17indicates the source of these con-
tributions in percentage during the
fiscal year and Table 30 compares
their evolution during the last five
years. The effects of inflation and
of the sluggish economy were also
felt by depositors.With respect to net contribu-
tions, the Government and publicemployees retirement plan was the
most important depositor in 1980and 1981 with contributions grow-
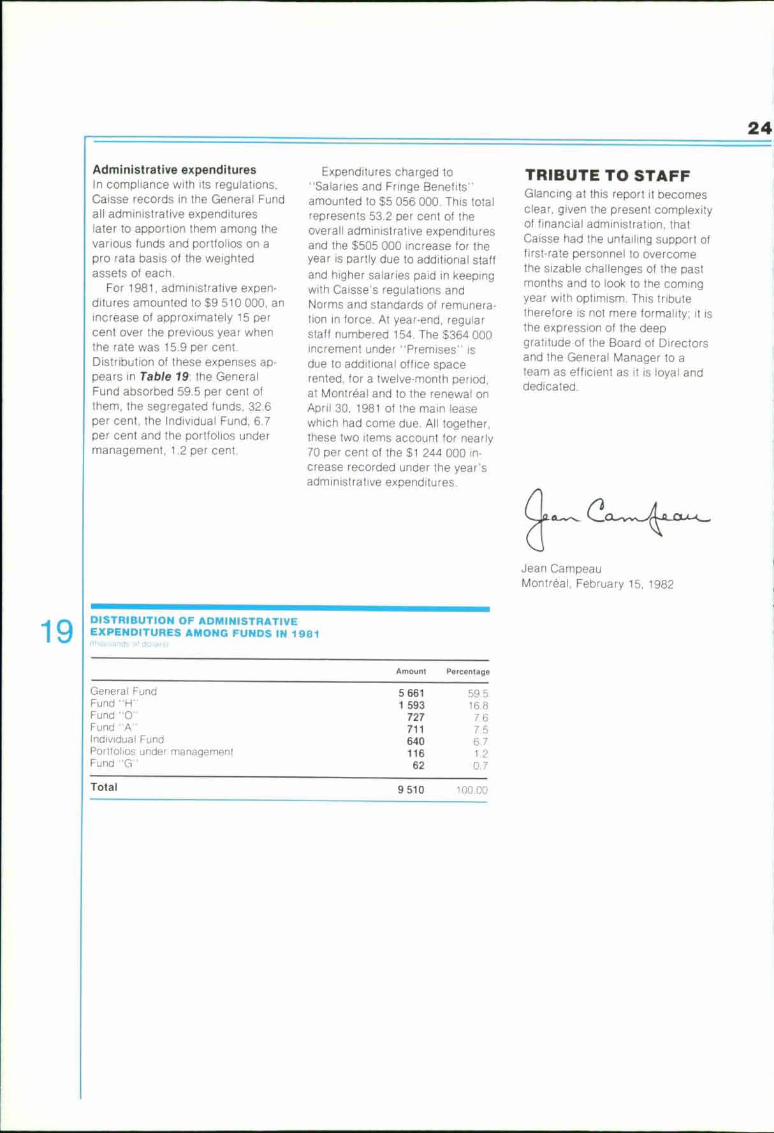
DEPOSITORS' HOLDINGSAT REALIZATION VALUEas at December 31
ing at an everage rate of 16.1 percent over the last five years.
Depositors' holdings with Caisseat realization value, as shown in
Table 31, were $11.4 billion at
year-end; at December 31, 1980that amount was $10.9 billion,
As will be seen in Graph 18. the
Régie des rentes du Quebec re-
mains the major Caisse depositor
even though its relative share of
holdings is decreasing every year,
representing 56 per cent of thetotal year-end as compared with
58.7 per cent in 1980 and 62.4 per
cent in 1979_ For its part, the Régiede l'assurance automobile du
Quebec is gaining in importance as
a depositor since its inception in
1978; at year-end, ils share was
8.9 per cent.Supplemental pension plans of
the Commission administrative duregime de retraite, Office de laconstruction du Quebec and
Université du Quebec accountedfor 24 7 per cent of the depositors'holdings as regards 22 per cent in
1979 and 23.6 per cent in 1980.The Commission de la santé et
de la sécurité du travail is anotherdepositor whose holdings are grow-ing from 9,2 per cent in 1979 to 9.6per cent in 1980 and 9,8 per centat the end of 1981.
Participation deposits constitutethe major part of depositors'holdings, some 93.7 per cent_Tables 32 to 37 inclusive give therespective financial position of themain depositors.
For some years. Caisse hasbeen working very closely with itsdepositors to select the type of In-
vestments best suited to thelr re-quirements as to return, rlsk, in-
come and liquidity. Caisse intendsto maintain this exchange of viewsand intensify its efforts to promote
the success of this team work.
1981 1980
40.3 29.1
26.3 27 1
18.1 24 1
10.1 17.8
5.2 1.9
1981 1980
56.0 58 7
16.5 15 3
9.8 96
8.9 76
8.8 88
Detailed information on depositors' holdings will be
found in the Financial Statistics Section, Table 31
17
18
24
19
Administrative expendituresIn compliance with its regulations.Caisse records in the General Fundall administrative expenditureslater to apportion them among thevarious funds and portfolios on apro rata basis of the weightedassets of each.
For 1981, administrative expen-ditures amounted to $9 510 000, anincrease of approximately 15 percent over the previous year whenthe rate was 15.9 per cent.Distribution of these expenses ap-pears in Table 19: the GeneralFund absorbed 59.5 per cent ofthem, the segregated funds, 32.6per cent, the Individual Fund, 6.7per cent and the portfolios undermanagement, 1.2 per cent.
Expenditures charged to"Salaries and Fringe Benefits -
amounted to $5 056 000. This totalrepresents 53.2 per cent of theoverall administrative expendituresand the $505 000 increase for theyear is partly due to additional staffand higher salaries paid in keepingwith Caisses regulations andNorms and standards of remunera-tion in force. At year-end, regularstaff numbered 154. The $364 000increment under "Premises" isdue to additional office spacerented, for a twelve-month period,at Montreal and to the renewal orApril 30, 1981 of the main leasewhich had come due. All together,these two items account for nearly70 per cent of the $1 244 000 in-crease recorded under the year'sadministrative expenditures.
TRIBUTE TO STAFFGlancing at this report it becomesclear, given the present complexityof financial administration, thatCaisse had the unfailing support offirst-rate personnel to overcomethe sizable challenges of the pastmonths and to look to the comingyear with optimism. This tributetherefore is not mere formality: it isthe expression of the deepgratitude of the Board of Directorsand the General Manager to ateam as efficient as it is loyal anddedicated.
Jean CampeauMontreal, February 15, 1982
DISTRIBUTION OF ADMINISTRATIVEEXPENDITURES AMONG FUNDS IN 1981rhousands clnllars)
Amount Percentage
General FundFund "H"Fund "0"Fund -A"Individual FundPorHobos under managementFund "G"
5 661 59.5
1 593 16.8
727 7.6
711 7.5
640 6.7
116 1.2
62 0.7
Total 9 510 100 00
25
11111111111111111. Page
Generareünd 11.1111111111MMINI 26
Segregated Fund — Bonds (Fund "0") Ira
Segregated Fund — Government Bonds (Fund "G"
Segregated Fund —7§Teicks (Fund 'A'1 34
Segregated Fund — Mortgages (Fund "H")
11111111101111mMiIndividual Fund
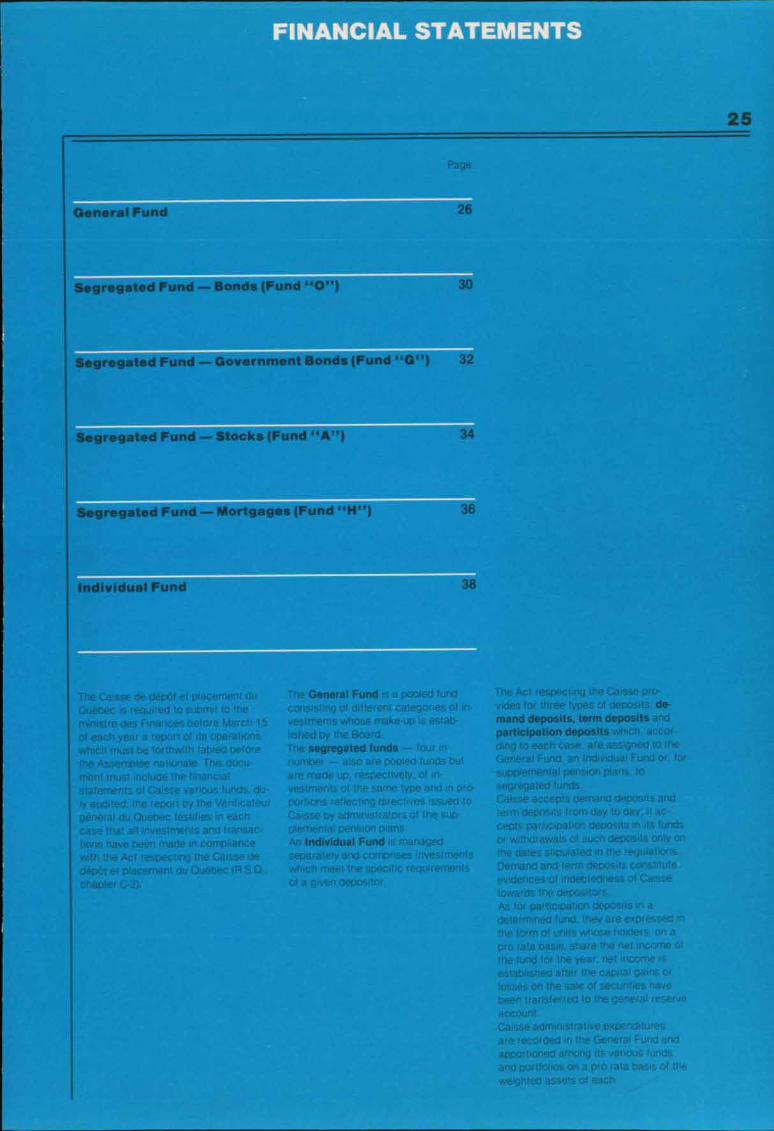
The Caisse de dépôt el placement duQuebec is required to submit to theministre des Finances before March 15of each year a report of its operationswhich must be forthwith tabled beforethe Assemblée nationale. This docu-ment must include the financialstatements of Caisse various funds, du-ly audited; the report by the Vérificateurgeneral du Quebec testifies in eachcase that all investments and transac-ions have been made in compliance
with the Act respecting the Caisse declépôt el placement du Quebec (FISchapter C-2).
The General Fund Is a pooled fuconsisting of different categories afin-vestments whose make-up is eslab-lished by the BoardThe segregated funds — four innumber — also are pooled funds butare made up , respectively, of in-vestments at the same type and in pro-portions reflecting directives issued toCaisse by administrators of the sup-plemental pension plans.An Individual Fund is managedseparately and comprises investmentswhich meet the specific requirementsof a given depositor
The Act respecting the Caisse pro-vides for three types of deposits de -
mand deposits, term deposits andparticipation deposits which, accor-ding to each case, are assigned to theGeneral Fund, an Individuar Fund or. forsupplemental pension plans , tosegregated funds.Caisse accepts demand deposits andterm deposits from day to day: it ac-cepts participation deposits in its fundsor withdrawals of such deposits only Of1
the dates stipulated in the regulations.Demand and term deposits constituteevidences of indebtedness of Caissetowards the depositors.As for participation deposits in adetermined fund, they are expressed inthe form of units whose holders on apro rata basis, share the net income ofthe fund for the year. net income isestablished after the capital gains ortosses on the safe of securities havebeen transferred to the general reserveaccountCaisse administrative expendituresare recorded in the General Fund andapportioned among its various fundsand portfolios on a pro rata basis of theweighted assets of each

Caisse de dépôt et placement du Québec(P .S 0., chapter C-2)
BALANCE SHEETas at December 31. 1981(thousands of dollars)
Assets 1981 1980Investments (Note 3)
Portfolios:(Note 9)
— Bonds $ 7 120 682 $ 6 485 205— Shares and convertible securities 1 221 867 879 393— Mortgage and real estate investments 452 591 417 126— Real estate 54 972 30 974— Short-term investments 492 950 314 738
9 343 062 8 127 436Cash 448 451Investment income accrued and receivable 189 073 168 098Advances to segregated funds 29 276Other assets 444 463
219 241 169 012
$ 9 562 303 $ 8 296 448
Liabilities
Deposits (Note 4)Demand $ 302 356 $ 210 483Term 107 969 122 555
Income and interest to be paid out todepositors and other funds 240 772 205 871
Transactions in process of settlement 4 018 5 449Mortgages payable 5 933 774Other liabilities 7 922 4 397
668 970 549 529Participation deposit
holders' equityParticipation deposits (Note 6) 8 651 502 7 545 443General reserve (Note 7) 241 831 201 476
8 893 333 7 746 919$ 9 562 303 $ 8 296 448
The accompanyIng notes are an integral part of the financial statements.On behalf of the Board of Directors,
Jean CampeauClaude Legault
AUDITOR'SREPORT
I have examined the balance sheet of the General Fund of the Caisse de dépôt et placement du Quebec as atDecember 31, 1981 and the statement of income and expenditure and the statement of income and interest to bepaid out to depositors and to other funds for the year then ended. My examination was made in accordance withgenerally accepted auditing standards and accordingly included such tests and other procedures as I considerednecessary in the circumstances.
In my opinion, the investments and the financial transactions of the Fund were made in compliance with theAct respecting the Caisse de dépôt et placement du Quebec and these financial statements present fairly thefinancial position of thls Fund as at December 31, 1981 and the results of its operations for the year then ended,in accordance with generally accepted accounting principles and the particular accounting policies mentioned inthe financial statements, applled on a basis consistent with that of the preceding year.
Rhea! Chatelain, F.C.A.,Vérificateur general,Quebec, March 5, 1982.
26
27
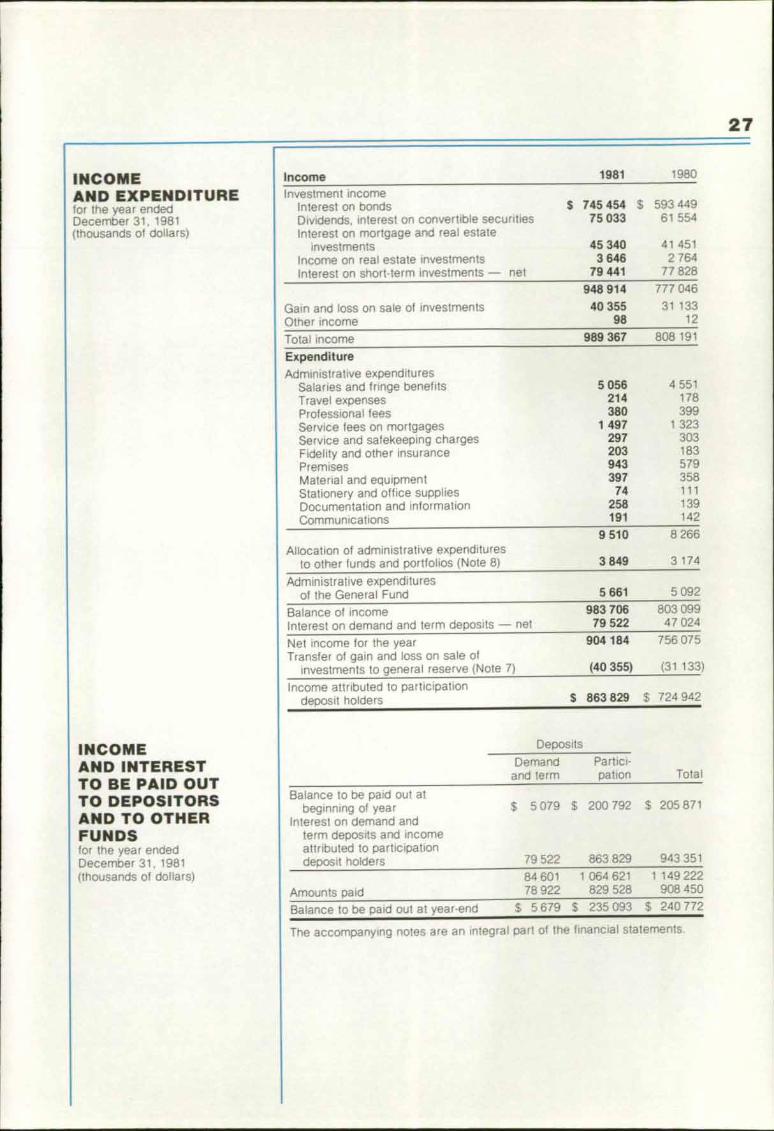
IncomeInvestment income
Interest on bondsDividends, interest on convertible securitiesInterest on mortgage and real estate
investmentsIncome on real estate investmentsInterest on short-term investments — net
1981 1980
$ 745 454 $ 593 449
75 033 61 554
45 340
41 4513 646
2 764
79 441
77 828
Gain and loss on sale of investmentsOther income
948 914 777 046
40 355 31 13398 12
989 367 808 191Total income
ExpenditureAdministrative expenditures
Salaries and fringe benefitsTravel expensesProfessional feesService fees on mortgagesService and safekeeping chargesFidelity and other insurancePremisesMaterial and equipmentStationery and office suppliesDocumentation and informationCommunications
5 056 4 551
214 178
380 3991 497 1 323297 303
203 183
943 579
397 358
74 111
258 139191 142
Allocation of administrative expendituresto other funds and portfolios (Note 8)
9 510 8 266
3 849 3 174
Administrative expendituresof the General Fund 5 661 5 092
983 706 803 09979 522 47 024
904 184 756 075
Balance of incomeInterest on demand and term deposits — net
Net income for the yearTransfer of gain and loss on sale of
investments to general reserve (Note 7)
Income attributed to participationdeposit holders
(40 355) (31 133)
S 863 829 $ 724 942
Balance to be paid out atbeginning of year
Interest on demand andterm deposits and incomeattributed to participationdeposit holders
Amounts paidBalance to be paid out at year-end
$ 5 079 $ 200 792 $ 205 871
79 522 863 829 943 351
84 601 1 064 621 1 149 22278 922 829 528 908 450
$ 5 679 $ 235 093 $ 240 772
Deposits
Demand
Partici-and term pation Total
INCOMEAND EXPENDITUREfor the year endedDecember 31, 1981(thousands of dollars)
INCOMEAND INTERESTTO BE PAID OUTTO DEPOSITORSAND TO OTHERFUNDSfor the year endedDecember 31, 1981(thousands of dollars)
The accompanying notes are an integral part of the financial statements.
28
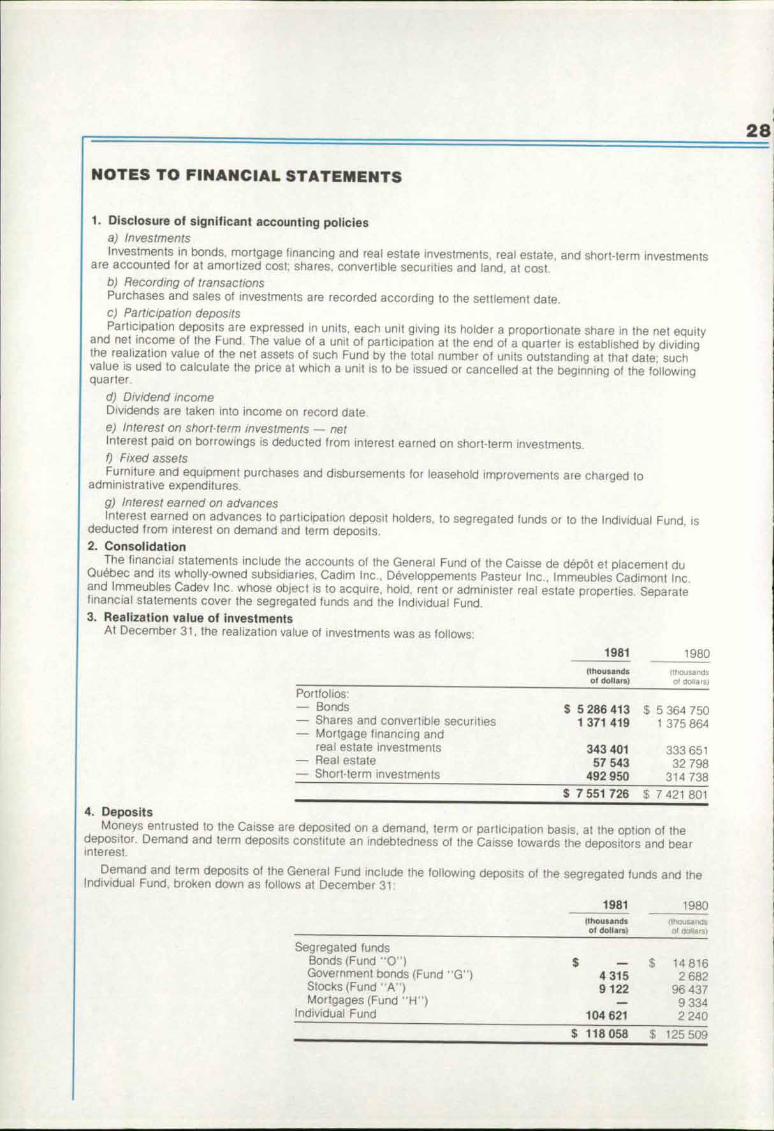
NOTES TO FINANCIAL STATEMENTS
1. Disclosure of significant accounting policiesa) InvestmentsInvestments in bonds, mortgage financing and real estate investments, real estate, and short-term investments
are accounted for at amortized cost; shares, convertible securities and land, at cost,b) Recording of transactionsPurchases and sales of investments are recorded according to the settlement date.c) Participation depositsParticipation deposits are expressed in units, each unit giving its holder a proportionate share in the net equity
and net income of the Fund. The value of a unit of participation at the end of a quarter is established by dividingthe realization value of the net assets of such Fund by the total number of units outstanding at that date; suchvalue is used to calculate the price at which a unit is to be issued or cancelled at the beginning of the followingquarter,
d) Dividend incomeDividends are taken into income on record date.e) Interest on short-term investments — netInterest paid on borrowings is deducted from interest earned on short-term investments.f) Fixed assetsFurniture and equipment purchases and disbursements for leasehold improvements are charged to
administrative expenditures.
g) interest earned on advancesInterest earned on advances to participation deposit holders, to segregated funds or to the Individual Fund, is
deducted from interest on demand and term deposits.
2. ConsolidationThe financial statements include the accounts of the General Fund of the Caisse de dépôt et placement du
Quebec and its wholly-owned subsidiaries, Cadim Inc., Développements Pasteur Inc., Immeubles Cadimont Inc.and Immeubles Cadev Inc. whose object is to acquire, hold, rent or administer real estate properties. Separatefinancial statements cover the segregated funds and the Individual Fund.3. Realization value of investments
At December 31, the realization value of investments was as follows:
1981 1980thousandsor dollars)
(thousandsor dollars)
Portfolios:— Bonds $ 5 286 413 $ 5 364 750— Shares and convertible securities 1 371 419 1 375 864— Mortgage financing and
real estate investments 343 401 333 651— Real estate 57 543 32 798— Short-term investments 492 950 314 738
$ 7 551 726 $ 7 421 801
4. DepositsMoneys entrusted to the Caisse are deposited on a demand, term or participation basis, at the option of the
depositor. Demand and term deposits constitute an indebtedness of the Caisse towards the depositors and bearinterest.
Demand and term deposits of the General Fund include the following deposits of the segregated funds and theIndividual Fund, broken down as follows at December 31:
1981 1980(thousandso douars)
(thousandsl dollarS1
Segregated fundsBonds (Fund "0") $ 14 816Government bonds (Fund "G") 4 315 2 682Stocks (Fund "A") 9 122 96 437Mortgages (Fund "H") 9 334
Individual Fund 104 621 2 240
$ 118 058 $ 1 25 509
29
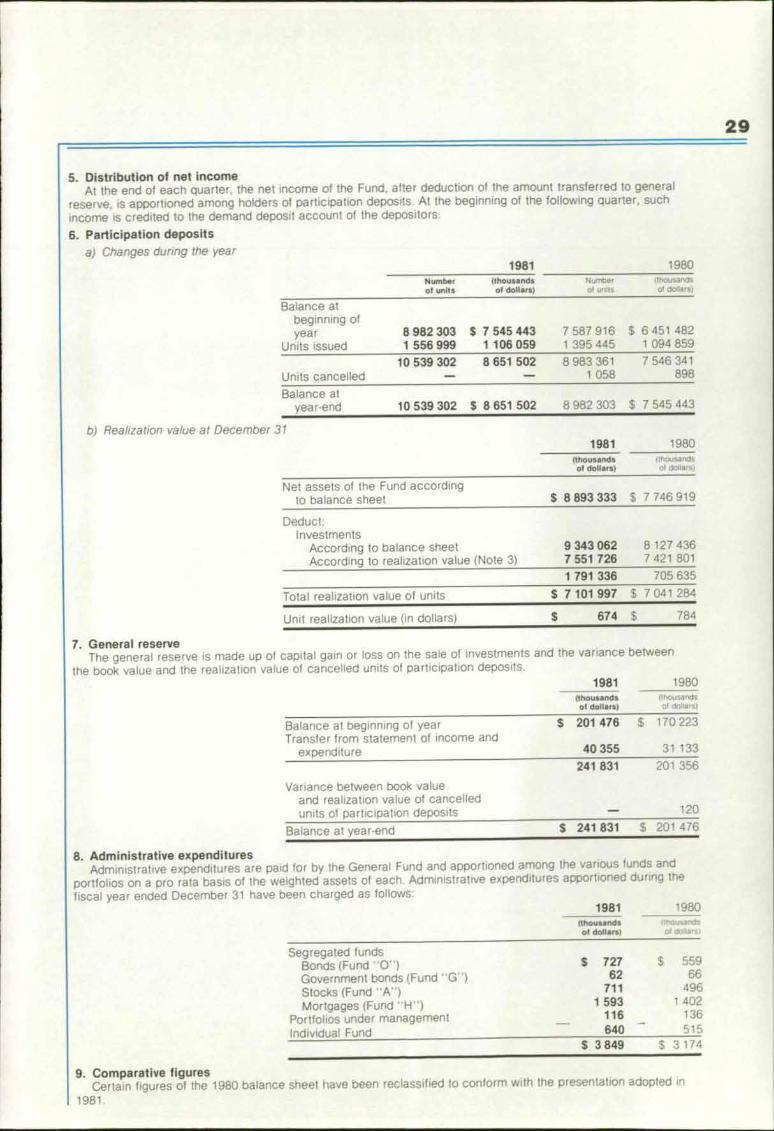
5. Distribution of net incomeAt the end of each quarter, the net income of the Fund, after deduction of the amount transferred to general
reserve, is apportioned among holders of participation deposits. Al the beginning of the following quarter, such
income is credited to the demand deposit account of the depositors.
6. Participation deposits
a) Changes during the year1981 1980
Number (thousandsof units of dollars)
Numberof units
(thousandsof dollars)
Balance atbeginning ofyear 8 982 303 $ 7 545 443 7 587 916 $ 6 451 482
Units issued 1 556 999 1 106 059 1 395 445 1 094 859
10 539 302 8 651 502 8 983 361 7 546 341Units cancelled 1 058 898
Balance atyear-end 10 539 302 5 8 651 502 8 982 303 $ 7 545 443
b) Realization value at December 311981 1980
(thousands (thousandsof dollars) of dollars)
Net assets of the Fund accordingto balance sheet $ 8 893 333 $ 7 746 919
Deduct:Investments
According to balance sheet 9 343 062 8 127 436According to realization value (Note 3) 7 551 726 7 421 801
1 791 336 705 635
Total realization value of units $ 7 101 997 $ 7 041 284
Unit realization value (in dollars) 674 $ 784
7. General reserveThe general reserve is made up of capital gain or loss on the sale of investments and the variance between
the book value and the realization value of cancelled units of participation deposits.1981 1980
(thousandsof dollars)
(thousandsof dollars)
Balance at beginning of year S 201 476 $ 170 223
Transfer from statement of income andexpenditure 40 355 31 133
241 831 201 356
Variance between book valueand realization value of cancelledunits of participation deposits 120
Balance at year-end $ 241 831 $ 201 476
8. Administrative expendituresAdministrative expenditures are paid for by the General Fund and apportioned among the various funds and
portfolios on a pro rata basis of the weighted assets of each. Administrative expenditures apportioned during the
fiscal year ended December 31 have been charged as follows:
(thousandsof dollars)
(lhousaodsof dorlars)
Segregated fundsBonds (Fund "0-) S 727 5 559
Government bonds (Fund "G-) 62 66
Stocks (Fund "A") 711 496
Mortgages (Fund "H") 1 593 1 402
Portfolios under management 116 136
Individual Fund 640 515$ 3 849 $ 3 174
9. Comparative figuresCertain figures of the 1980 balance sheet have been reclassified to conform with the presentation adopted in
1981
1981 1980
a Fin de depot el placemerit Cu Cduebet,
14014DS
(19.S.0.. chapter C-2)
(FUND "0")
1981 1980
$ 1 369 505 $ 1 02814
221816
1 369 505 1 043 03736 202 27 125
$ 1 405 707 $ 1 070 162
$ 14 588 $ 10 1671 760 —2 424 1 533
18 772 11 700
1 232 847 887 603
183 248 183 248(29 160) (12389)
1 386 935 1 058 462
$ 1 405 707 $ 1 070 162
1981 1980
$ 144
6
018
837
$ 9623
773560200
150 855(16771)
102 533(12542)
134 084
727
89 991
559
133
16
357
771
89
12
432
542
$ 150 128 $ 101 974
BALANCE SHEETas at December 31, 1981(thousands of dollars)
INCOME ANDEXPENDITUREfor the year endedDecember 31, 1981(thousands of dollars)
Investment incomeInterest on bondsInterest on short-term investmentsInterest on deposits in General Fund — net
Gain and loss on sale of investments
ExpenditureAdministrative expenditures
Net income for the yearTransfer of gain and loss on sale of
investments to general reserve(Notes 4 and 5)
Income attributed to participationdeposit holders (Note 5)
AssetsInvestments (Note 2)
BondsDemand deposits in General Fund
Accrued interest
Liabilities
Income to be paid out to depositorsAdvances from General FundTransactions in process of settlement
Participation deposit holders' equityParticipation deposits (Note 3)Accumulated income at December 31, 1979
(Note 5)General reserve (Notes 4 and 5)
On behalf of the Board of Directors,Jean CampeauClaude Legault
Income
The accompanying notes are an integral part of the financial statements.
AUDITOR'SREPORT
I have examined the balance sheet of the Segregated Fund-Bonds (Fund "0") of the Caisse de dépôt etplacement du Quebec as at December 31, 1981 and the statement of income and expenditure for the year thenended. My examination was made in accordance with generally accepted auditing standards and accordinglyincluded such tests and other procedures as I considered necessary in the circumstances.
As stated in Note 5, the Caisse has been applying Section 45 of its new regulations since January 1, 1980 andin this connection, it appears doubtful that the provisions of the Act and regulations of the Caisse make it possibleto establish the income to be attributed to the participation deposit holders by adding to the net income for theyear a transfer which results in a debit balance in the general reserve.
In my opinion, except for the fact that doubts exist as to the application of provisions of the Act andregulations concerning apportionment of income to the participation deposit holders as stated in the precedingparagraph , the investments and the financial transactions of the Fund were made in compliance with the Actrespecting the Caisse de dépôt et placement du Quebec and these financial statements present fairly thefinancial position of this Fund as at December 31, 1981 and the results of its operations for the year then ended,in accordance with generally accepted accounting principles and the particular accounting policies mentioned inthe financial statements, applied on a basis consistent with that of the preceding year.
Rhea! Chatelain, F.C.A.,Vérificateur general,Quebec. March 5. 1982.

31
NOTES TO FINANCIAL STATEMENTS
1. Disclosure of significant accounting policies
a) InvestmentsBond and short - term investments are accounted for at amortized cost: deposits in the General Fund, at cost.b) Recording of transactionsPurchases and sales of investments are recorded according to the settlement date.
C) Participation depositsParticipation deposits are expressed in units, each unit g iving its holder a proportionate share in the net equity
and net income of the Fund. The value of a unit of participation at the end of each month is established bydividing the realization value of the net assets of such Fund by the total number of units outstanding at that date:such value is used to calculate the price at which a unit is to be issued or cancelled at the beginning of thefollowing month.
d) Interest paid on advancesInterest paid on advances by the General Fund is deducted from interest on deposits in the General Fund.e) Administrative expendituresAdministrative expenditures are paid for by the General Fund and apportioned among the various funds and
portfolios on a pro rata basis of the weighted assets of each.2. Realization value of investments
At December 31. 1981, the realization value of investments was $1 120 219 000 (1980, $925 665 000).
3. Participation depositsa) Changes during the year 1981 1980
Numberof units
(thousandsof dollars)
Numberof units
(thousandsof dollars)
Balance atbeginning of year 489 210 $ 887 603 342 091 $ 598 971
Units issued 202 883 345 244 147 119 288 632
Balanceat year-end 692 093 $ 1 232 847 489 210 $ 887 603
b) Realization value at December 31 1981 1980(thousandsof dollars)
(thousandsof dollars)
Net assets of the Fund accordingto balance sheet $ 1 386 935 $ 1 058 462
Deduct:Investments
According to balance sheetAccording to realization value (Note 2)
11
369120
505219
1 043925
037665
249 286 117 372
Total realization value of units $ 1 137 649 $ 941 090
Unit realization value (in dollars) $ 1 644 3 1 924
4. General reserveThe general reserve is made up of capital gain or loss on the sale of investments and the variance between
book value and realization value of cancelled units of participation deposits.1981 1980
(thousandsof dollars)
(thousandsof dollars)
Balance at beginning of year (debit) $ (12389) $ 153Transfer from statement of income
and expenditure (16 771) (12 542)
Balance at year-end (debit) $ (29 160) $ (12 389)
5. Distribution of net incomeThe Caisse has been applying Section 45 of its regulations since its coming into force January 1, 1980 and
which reads as follows: "At the closing of the fiscal period of a fund, the net income of the fiscal period isestablished and, after transfer of the amount of capital gain or loss on the sale of securities to the generalreserve account of the fund, the balance of net income is apportioned among the depositors of the fund on a pro
rata basis of the number of units of participation held by each of them." At the beginning of the next fiscal year,such income is paid into the demand deposit account of the depositors in the General Fund.
It appears doubtful as was the case in 1980 that the provisions of the Act and regulations of the Caisse makeit possible to establish the income to be attributed to the participation deposit holders by adding to the net incomefor the year a transfer which results in a debit balance in the general reserve.
Until December 31, 1979, the net income of segregated funds was held as accumulated income in each fund.The Caisse is still studying amendments to be made to its Act and regulations with a view to regularizing this
situation and defining the terms and conditions for disposal of accumulated income at December 31, 1979.
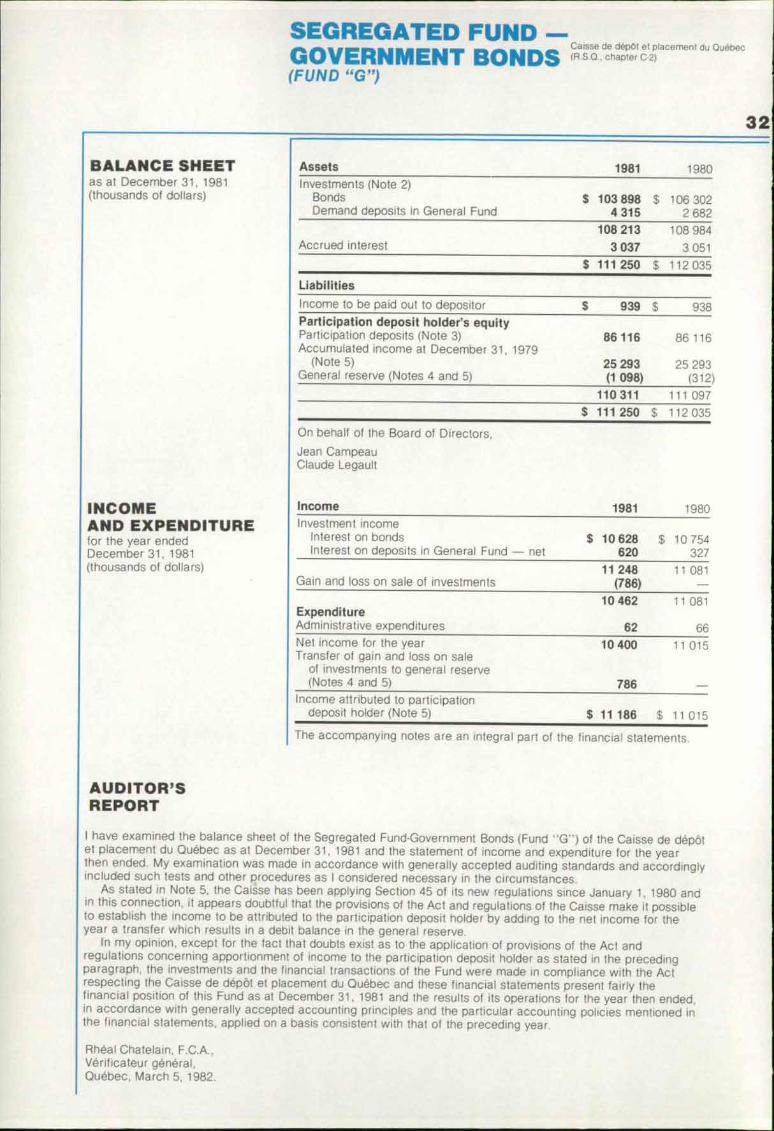
,EGREGATED FUNDCaisse de depot et placement du Quebec
•„AOVERNMENT BONDS (P50, chapter C2)
(FUND "G")
32
BALANCE SHEETas at December 31, 1981(thousands of dollars)
Assets 1981 1980Investments (Note 2)
Bonds $ 103 898 $ 106 302Demand deposits in General Fund 4 315 2 882
108 213 108 984Accrued interest 3 037 3 051
$ 111 250 $ 112 035
Liabilities
Income to be paid out to depositor $ 939 $ 938Participation deposit holder's equityParticipation deposits (Note 3) 86 116 86 116Accumulated income at December 31, 1979
(Note 5) 25 293 25 293General reserve (Notes 4 and 5) (1 098) (312)
110 311 111 097
$ 111 250 $ 112 035
On behalf of the Board of Directors,
Jean CampeauClaude Legault
INCOME Income 1981 1980
AND EXPENDITURE Investment income
for the year ended Interest on bonds $ 10 628 $ 10 754December 31, 1981 Interest on deposits in General Fund — net 620 327(thousands of dollars) 11 248 11 081
Gain and loss on sale of investments (786)
10 462 11 081ExpenditureAdministrative expenditures 62 66Net income for the year 10 400 11 015Transfer of gain and loss on sale
of investments to general reserve(Notes 4 and 5) 786
Income attributed to participationdeposit holder (Note 5) $ 11 186 $ 11 015
The accompanying notes are an Integral part of the financial statements.
AUDITOR'SREPORT
I have examined the balance sheet of the Segregated Fund-Government Bonds (Fund - G") of the Caisse de dépôtet placement du Quebec as at December 31, 1981 and the statement of income and expenditure for the yearthen ended. My examination was made in accordance with generally accepted auditing standards and accordinglyincluded such tests and other procedures as I considered necessary in the circumstances.
As stated in Note 5. the Caisse has been applying Section 45 of its new regulations since January 1, 1980 andin this connection, it appears doubtful that the provisions of the Act and regulations of the Caisse make it possibleto establish the income to be attributed to the participation deposit holder by adding to the net income for theyear a transfer which results in a debit balance in the general reserve.
In my opinion, except for the fact that doubts exist as to the application of provisions of the Act andregulations concerning apportionment of income to the participation deposit holder as stated in the precedingparagraph, the investments and the financial transactions of the Fund were made in compliance with the Actrespecting the Caisse de dépôt et placement du Quebec and these financial statements present fairly thefinancial position of this Fund as at December 31, 1981 and the results of its operations for the year then ended,in accordance with generally accepted accounting principles and the particular accounting policies mentioned inthe financial statements, applied on a basis consistent with that of the preceding year.
Rhéal Chatelain, F.C.A.,Vérificateur general,Quebec, March 5, 1982.

33
NOTES TO FINANCIAL STATEMENTS
1. Disclosure of significant accounting policies
a) InvestmentsBond investments are accounted for at amortized cost; deposits in the General Fund, at cost.
b) Recording of transactionsPurchases and sales of investments are recorded according to the settlement date.
c) Participation depositsParticipation deposits are expressed in units, each unit giving its holder a proportionate share in the net equity
and net income of the Fund. The value of a unit of participation at the end of each month is established by
dividing the realization value of the net assets of such Fund by the total number of units outstanding at that date;
such value is used to calculate the price at which a unit is to be issued or cancelled at the beginning of the
following month.
d) Interest paid on advancesInterest paid on advances by the General Fund is deducted from interest on deposits in the General Fund.
e) Administrative expendituresAdministrative expenditures are paid for by the General Fund and apportioned among the various funds and
portfolios on a pro rata basis of the weighted assets of each.
2. Realization value of investmentsAt December 31, 1981, the realization value of investments was $75 452 000 (1980, $88 249 000).
3. Participation depositsAt December 31, 1980 and 1981, there was only one deposit holder in this Fund.
a) Changes during the year 1981 1980Number (thousands Number (Mousands
ol units of dollars) of unllS of dollars)
Balance atbeginningand year-end 84 816 S 86 116 84 816 $ 86 116
b) Realization value at December 31 1981 1 980(thousandsof dollars) 'icahf°duos al I :FT)
Net assets of the Fund accordingto balance sheet $ 110 311 S 111 097
Deduct:Investments
According to balance sheetAccording to realization value (Note 2)
108 21375 452
108 98488 249
32 761 20 735
Total realization value of units $ 77 550 $ 90 362
Unit realization value (in dollars) $ 914 $ 1 065
4. General reserveThe general reserve is made up of capital gain or loss on the sale of investments and the variance between
book value and realization value of cancelled units of participation deposits.1981 1980
(thousands (thousandsof dollars} Of dollarS)
Balance at beginning of year (debit) $ (312) $ (312)
Transfer from statement of income andexpenditure
s (786)
Balance at year-end (debit) $ (1 098), $ (312)
5. Distribution of net incomeThe Caisse has been applying Section 45 of its regulations since its coming into force January 1, 1980 and
which reads as follows: "At the closing of the fiscal period of a fund, the net income of the fiscal period is
established and, after transfer of the amount of capital gain or loss on the sale of securities to the general
reserve account of the fund, the balance of net income is apportioned among the depositors of the fund on a pro
rata basis of the number of units of participation held by each of them." At the beginning of the next fiscal year,
such income is paid into the demand deposit account of the depositors in the General Fund.
It appears doubtful that the provisions of the Act and regulations of the Caisse make it possible to establish the
income to be attributed to the participation deposit holders by adding to the net income for the year a transfer
which results in a debit balance in the general reserve.Until December 31, 1979, the net income of segregated funds was held as accumulated income in each fund.
The Caisse is still studying amendments to be made to its Act and regulations with a view to regularizing this
situation and defining the terms and conditions for disposal of accumulated income at December 31, 1979.

SEGREGATED FUND - Caisse de dept51 et plarerrier ! du Quebec
STOCKS (R S.C) , chapter
(FUND "A")
34
BALANCE SHEETas at December 31, 1981(thousands of dollars)
Assets 1981 1980Investments (Note 2)
Shares and convertible securities $ 961 961 $ 615 106Demand deposits in General Fund 9 122 96 437
971 083 711 543Investment income accrued and receivable 7 883 7 584
978 966 $ 719 127
Liabilities
Income to be paid out to depositors $ 8 320 $ 7 463Transactions in process of settlement 3 390
8 320 10 853Participation deposit holders' equityParticipation deposits (Note 3) 745 337 557 232Accumulated income at December 31, 1979
(Note 5) 129 634 129 634General reserve (Notes 4 and 5) 95 675 21 408
970 646 708 274
$ 978 966 $ 719 127
On behalf of the Board of Directors,Jean CampeauClaude Legault
INCOME Income 1981 1980AND EXPENDITURE Investment incomefor the year ended Dividends, interest on convertible securities $ 50 773 $ 34 870December 31, 1981 Interest on short-term investments — 737(thousands of dollars) Interest on deposits in General Fund — net 6 494 14 362
57 267 49 969Gain and loss on sale of investments 74 267 22 139
131 534 72 108ExpenditureAdministrative expenditures 711 496Net income for the year 130 823 71 612Transfer of gain and loss on sale of
investments to general reserve(Notes 4 and 5) (74267) (22 139)
Income attributed to participationdeposit holders (Note 5) $ 56 556 $ 49 473
The accompanying notes are an integral part of the financial statements.
AUDITOR'SREPORTI have examined the balance sheet of the Segregated Fund-Stocks (Fund -A") of the Caisse de dépôt etplacement du Quebec as at December 31, 1981 and the statement of income and expenditure for the year thenended. My examination was made in accordance with generally accepted auditing standards and accordinglyincluded such tests and other procedures as I considered necessary in the circumstances.
In my opinion, the investments and the financial transactions of the Fund were made in compliance with theAct respecting the Caisse de dépôt et placement du Quebec and these financial statements present fairly thefinancial position of this Fund as at December 31, 1981 and the results of its operations for the year then ended,in accordance with generally accepted accounting principles and the particular accounting policies mentioned inthe financial statements, applied on a basis consistent with that of the preceding year.
Rhea! Chatelain, F.C.A.,Vérificateur general,Quebec, March 5, 1982.

35
NOTES TO FINANCIAL STATEMENTS1. Disclosure of significant accounting policies
a) investmentsInvestments in shares and convertible securities as well as the deposits in the General Fund are accounted for
at cost short-term investments, at amortized cost.
b) Recording of transactionsPurchases and sales of investments are recorded according to the settlement date.
C) Participation depositsParticipation deposits are expressed in units, each unit giving its holder a proportionate share in the ne t equity
and net income of the Fund. The value of a unit of participation at the end of each month is established by
dividing the realization value of the net assets of such Fund by the total number of units outstanding at that date;
such value is used to calculate the price at which a unit is to be issued or cancelled at the beginning of the
following month.d) Dividend incomeDividends are taken into income on record date.
e) Interest paid on advancesInterest paid on advances by the General Fund is deducted from interest on deposits in the General Fund.
f) Administrative expendituresAdministrative expenditures are paid for by the General Fund and apportioned among the various funds and
portfolios on a pro rata basis of the weighted assets of each.
2. Realization value of investmentsAt December 31, 1981, the realization value of investments was $971 167 000 (1980, $970 160 000).
3. Participation depositsa) Changes during the year 1981 1980
Number (thousands Number (thousands
of units of dollars) 01 units of dollars)
Balance
at beginning ot year 330 708 $ 557 232Units issued 69 268 188 105
Add:Investments
According to realization value (Note 2)According to balance sheet
275 077 $ 404 17955 631 153 053
330 708 $ 557 232
1981 1980 (thousands (thousands
Of dollars) 01 dollars)
$ 970 646 $ 708 274
971 167 970 160
971 083 711 543
84 258 617
S 970 730 $ 966 891
S 2 427 $ 2 924
Balanceat year-end
399 976 $ 745 337
b) Realization value at December 31
Net assets of the Fund accordingto balance sheet
Total realization value of units
Unit realization value (in dollars)
4. General reserveThe general reserve is made up of capital gain or loss on the sale of investments and the variance between
book value and realization value of cancelled units of participation deposits.1981 1980
(thousands (thousands
of dollars) of dollars'
Balance at beginning of year (debit) $ 21 408 $ (731)
Transfer from statement of income andexpenditure 74 267 22 139
Balance at year-end S 95 675 $ 21 408
5. Distribution of net incomeThe Caisse has been applying Section 45 of its regulations since its coming into force January 1, 1980 and
which reads as follows: "At the closing of the fiscal period of a fund, the net income of the fiscal period is
established and, after transfer of the amount of capital gain or loss on the sale of securities to the general
reserve account of the fund, the balance of net income is apportioned among the depositors of the fund on a pro
rata basis of the number of units of participation held by each of them. - At the beginning of the next fiscal year,
such income is paid into the demand deposit account of the depositors in the General Fund.
Until December 31, 1979, the net income of segregated funds was held as accumulated income in each fund.
The Caisse is still studying amendments to be made to its Act and regulations with a view to regularizing this
situation and defining the terms and conditions for disposal of accumulated income at December 31, 1979.

SEGREGA1 _;D FUNDMORTGAGES
Caisse de depôt et placement du Quebec0.S.O., chapter C-2)
(FUND "H")
BALANCE SHEETas at December 31, 1981(thousands of dollars)
Assets 1981 1980Investments (Note 2)
Portfolios:— Mortgage financing $ 615 704 $ 525 555— Real estate investments (Note 3) 311
616 015 525 555Demand deposits in General Fund 9 334
616 015 534 889Accrued interest 10 429 7 575
$ 626 444 $ 542 464
Liabilities
Income to be paid out to depositors $ 16 143 $ 14 160Advances from General Fund 27 516 —Other liabilites 5 984 3 508
49 643 17 668Participation deposit holders equityParticipation depostts (Note 4) 447 020 395 621Accumulated income at December 31, 1979
(Note 6) 129 482 129 482General reserve (Notes 5 and 6) 299 (307)
576 801 524 796
$ 626 444 $ 542 464
On behalf of the Board of Directors,Jean CampeauClaude Legault
INCOME Income 1981 1980
AND EXPENDITURE Investment incomefor the year ended Interest or mortgage financing $ 65 279 $ 51 992December 31, 1981 Interest on deposits in General Fund — net (2 029) 2 253(thousands of dollars) 63 250 54 245
Other income 14 6
63 264 54 251Gain and loss on sale of investments 606 (423)
63 870 53 828ExpenditureAdministrative expenditures 1 593 1 402Net income for the year 62 277 52 426Transfer of gain and loss on sale of
investments to general reserve(Notes 5 and 6) (606) 423
Income attributed to participationdeposit holders (Note 6) $ 61 671 $ 52 849
The accompanying notes are an integral part of the financial statements.
AUDITOR'SREPORT
I have examined the balance sheet of the Segregated Fund-Mortgages (Fund "H") of the Caisse de dépôt etplacement du Quebec as at December 31, 1981 and the statement of income and expenditure for the year thenended. My examination was made in accordance with generally accepted auditing standards and accordinglyincluded such tests and other procedures as I considered necessary in the circumstances.
In my opinion, the investments and the financial transactions of the Fund were made in compliance with theAct respecting the Caisse de dépôt et placement du Quebec and these financial statements present fairly thefinancial position of this Fund as at December 31, 1981 and the results of its operations for the year then ended,in accordance with generally accepted accounting principles and the particular accounting policies mentioned inthe financial statements, applied on a basis consistent with that of the preceding year.
Rhea! Chatelain, F.C.A.,Vérificateur general,Quebec, March 5, 1982.
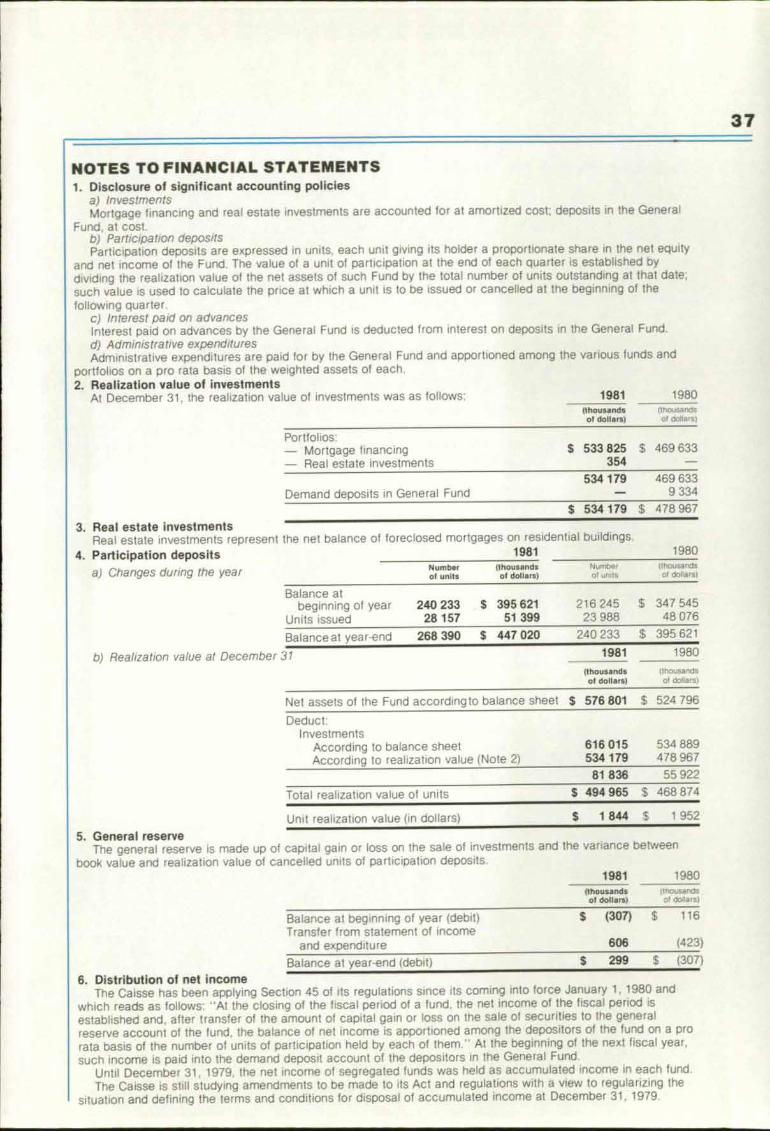
37
NOTES TO FINANCIAL STATEMENTS1. Disclosure of significant accounting policies
a) InvestmentsMortgage financing and real estate investments are accounted for at amortized cost; deposits in the General
Fund, at cost.b) Participation depositsParticipation deposits are expressed in units, each unit giving its holder a proportionate share in the net equity
and net income of the Fund. The value of a unit of participation at the end of each quarter is established by
dividing the realization value of the net assets of such Fund by the total number of units outstanding at that date;
such value is used to calculate the price at which a unit is to be issued or cancelled at the beginning of the
following quarter.C) Interest paid on advancesInterest paid on advances by the General Fund is deducted from interest on deposits in the General Fund.
d) Administrative expendituresAdministrative expenditures are paid for by the General Fund and apportioned among the various funds and
portfolios on a pro rata basis of the weighted assets of each.
2. Realization value of investmentsAt December 31, the realization value of investments was as follows: 1981 1980
{thousandsof dollars)
(thousandsol dollars)
Portfolios:— Mortgage financing $ 533 825 $ 469 633— Real estate investments 354
534 179 469 633Demand deposits in General Fund 9 334
$ 534 179 $ 478 967
3. Real estate investmentsReal estate investments represent the net balance of foreclosed mortgages on residential buildings.
4. Participation deposits 1981 1980
a) Changes during the year Numberol units
(thousandsof dollars)
Numberof units
(thousandsof dots(s)
Balance atbeginning of year 240 233 $ 395 621 216 245 $ 347 545
Units issued 28 157 51 399 23 988 48 076
Balance at year-end 268 390 $ 447 020 240 233 $ 395 621
b) Realization value at December 31 1981 1980
(thousandsof dollars)
(thousands01 dollars)
Net assets of the Fund according to balance sheet $ 576 801 $ 524 796
Deduct:Investments
According to balance sheetAccording to realization value (Note 2)
616534
015179
534478
889967
81 836 55 922
Total realization value of units $ 494 965 $ 468 874
Unit realization value On dollars) $ 1 844 $ 1 952
5. General reserveThe general reserve is made up of capital gain or loss on the sale of investments and the variance between
book value and realization value of cancelled units of participation deposits.
1981 1980(thousandsof dollars)
(thousandsof cio[ n ars)
Balance at beginning of year (debit) $ (307) $ 116Transfer from statement of income
and expenditure 606 (423)
Balance at year-end (debit) 299 $ (307)
6. Distribution of net IncomeThe Caisse has been applying Section 45 of its regulations since its coming into force January 1, 1980 and
which reads as follows: -At the closing of the fiscal period of a fund, the net income of the fiscal period is
established and, after transfer of the amount of capital gain or loss on the sale of securities to the general
reserve account of the fund, the balance of net income is apportioned among the depositors of the fund on a pro
rata basis of the number of units of participation held by each of them." At the beginning of the next fiscal year,
such income is paid into the demand deposit account of the depositors in the General Fund.
Until December 31, 1979, the net income of segregated funds was held as accumulated income in each fund.
The Caisse is still studying amendments to be made to its Act and regulations with a view to regularizing the
situation and defining the terms and conditions for disposal of accumulated income at December 31, 1979.
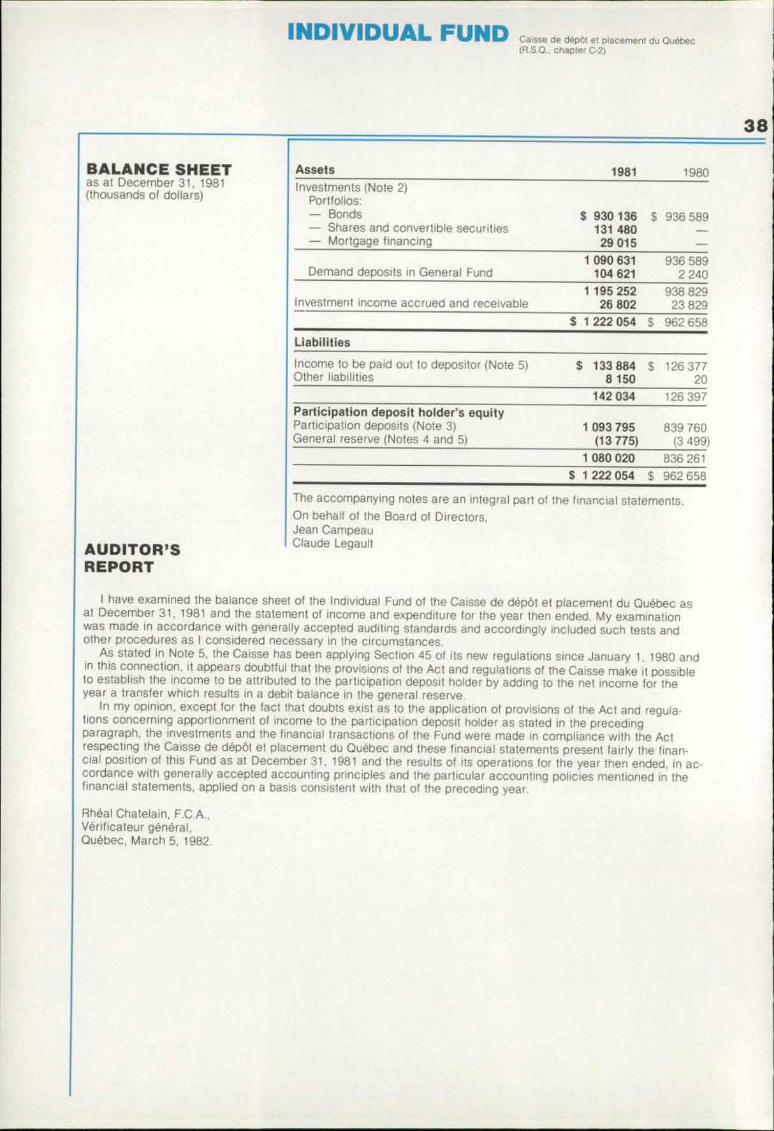
1lik .,DUAL iND Caisse de dépôt et placement du QuebectR.S.O., chapter C-2)
38
BALANCE SHEETas at December 31, 1981(thousands of dollars)
Assets 1981 1980Investments (Note 2)
Portfolios:— Bonds— Shares and convertible securities
Mortgage financing
$ 93013129
136480015
$ 936 589
Demand deposits in General Fund1 090
104631621
9362
589240
1 195 252 938 829Investment income accrued and receivable 26 802 23 829
$ 1 222 054 $ 962 658
Liabilities
Income to be paid out to depositor (Note 5) $ 133 884 $ 126 377Other liabilities 8 150 20
142 034 126 397Participation deposit holder's equityParticipation deposits (Note 3) 1 093 795 839 760General reserve (Notes 4 and 5) (13 775) (3 499)
1 080 020 836 261
$ 1 222 054 $ 962 658
AUDITOR'SREPORT
The accompanying notes are an integral part of the financial statements.On behalf of the Board of Directors,Jean CampeauClaude Legault
I have examined the balance sheet of the Individual Fund of the Caisse de dépôt et placement du Québec asat December 31, 1981 and the statement of income and expenditure for the year then ended_ My examinationwas made in accordance with generally accepted auditing standards and accordingly included such tests andOther procedures as I considered necessary in the circumstances.
As stated in Note 5, the Caisse has been applying Section 45 of its new regulations since January 1, 1980 andin this connection, it appears doubtful that the provisions of the Act and regulations of the Caisse make it possibleto establish the income to be attributed to the participation deposit holder by adding to the net income for theyear a transfer which results in a debit balance in the general reserve.
In my opinion, except for the fact that doubts exist as to the application of provisions of the Act and regula-tions concerning apportionment of income to the participation deposit holder as stated in the precedingparagraph, the investments and the financial transactions of the Fund were made in compliance with the Actrespecting the Caisse de dépôt et placement du Québec and these financial statements present fairly the finan-cial position of this Fund as at December 31, 1981 and the results of its operations for the year then ended, in ac-cordance with generally accepted accounting principles and the particular accounting policies mentioned in thefinancial statements, applied on a basis consistent with that of the preceding year.
Rhea' Chatelain, F.C.A.,Vérificateur general,Québec, March 5, 1982.
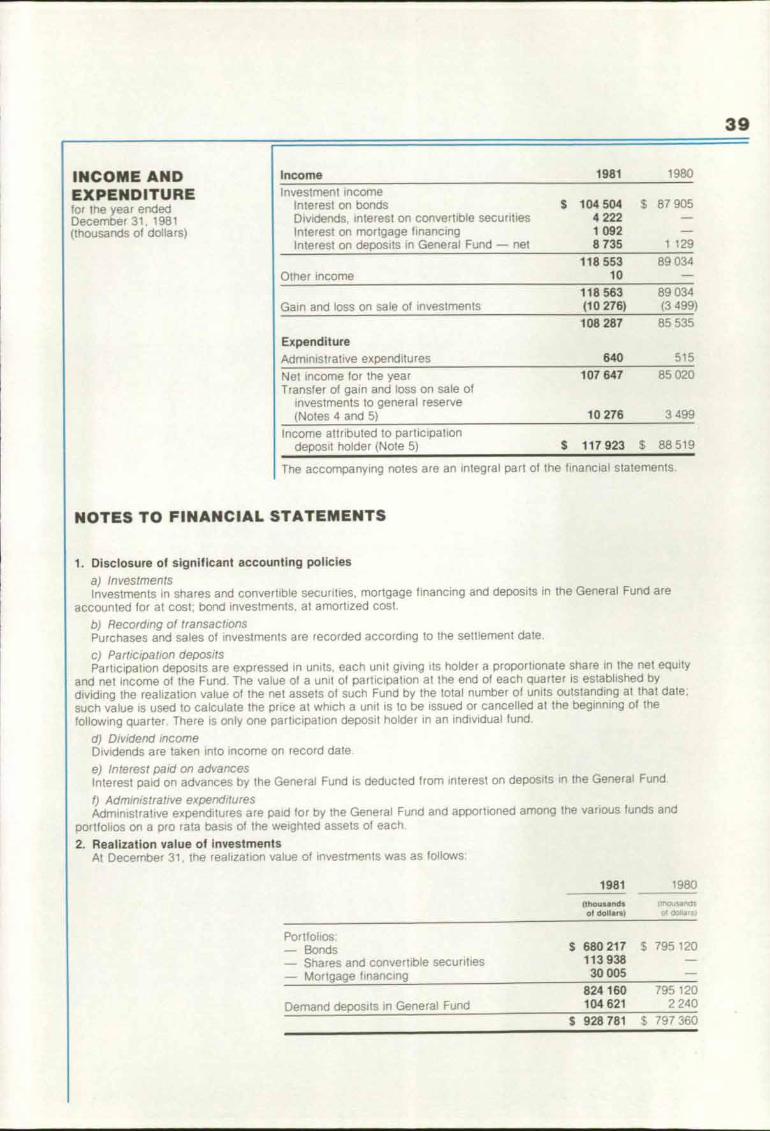
39
INCOME ANDEXPENDITUREfor the year ended
Income 1981 1980
Investment incomeInterest on bonds $ 104 504 $ 87 905
December 31, 1981 Dividends, interest on convertible securities 4 222(thousands of dollars) Interest on mortgage financing 1 092
Interest on deposits in General Fund — net 8 735 1 129
118 553 89 034Other income 10
118 563 89 034Gain and loss on sale of investments (10216) (3 499)
108 287 85 535
Expenditure
Administrative expenditures 640 515
Net income for the year 107 647 85 020Transfer of gain and loss on sale of
investments to general reserve(Notes 4 and 5) 10 276 3 499
Income attributed to participationdeposit holder (Note 5) $ 117 923 $ 88 519
The accompanying notes are an integral part of the financial statements.
NOTES TO FINANCIAL STATEMENTS
1. Disclosure of significant accounting policies
a) InvestmentsInvestments in shares and convertible securities, mortgage financing and deposits in the General Fund are
accounted for at cost: bond investments, at amortized cost_
b) Recording of transactionsPurchases and sales of investments are recorded according to the settlement date.
C) Participation depositsParticipation deposits are expressed in units, each unit giving its holder a proportionate share in the net equity
and net income of the Fund. The value of a unit of participation at the end of each quarter is established by
dividing the realization value of the net assets of such Fund by the total number of units outstanding at that date;
such value is used to calculate the price at which a unit is to be issued or cancelled at the beginning of the
following quarter. There is only one participation deposit holder in an individual fund.
d) Dividend incomeDividends are taken into income on record date.
e) Interest paid on advancesInterest paid on advances by the General Fund is deducted from interest on deposits in the General Fund.
f) Administrative expendituresAdministrative expenditures are paid for by the General Fund and apportioned among the various funds and
portfolios on a pro rate basis of the weighted assets of each.
2. Realization value of investmentsAt December 31, the realization value of investments was as follows:
1981 1980
Ithousandsof dollars)
tihousandsOf dollars)
Portfolios:— Bonds $ 680 217 $ 795 120
— Shares and convertible securities 113 938
— Mortgage financing 30 005
824 160 795 120Demand deposits in General Fund 104 621 2 240
928 781 $ 797 360

40
3. Participation depositsThe holder of participation deposits in this Fund is the Commission de la santé et de la sécurité du travail.a) Changes during the year
1981 1980Number
al units(thousands01 dollars)
Numberof units
(thousands
Of dollars)
Balance atbeginningOf year 761 585 $ 839 760 569 051 $ 649 761
Units issued 326 029 254 035 192 534 189 999Balance at
year-end 1 087 614 $ 1 093 795 761 585 $ 839 760
b) Realization value at December 31
1981 1980(thousandsal dollars)
(thousandsut dollars)
Net assets of the Fund accordingto balance sheet $ 1 080 020 $ 836 261
Deduct:Investments
According to balance sheet 1 195 252 938 829According to realization value (Note 2) 928 781 797 360
266 471 141 469Total realization value of units $ 813 549 $ 694 792
Unit realization value (in dollars) 748 $ 912
4. General reserveThe general reserve is made up of capital gain or loss on the sale of investments.
1981 1980(thousandsat dollars)
(thousands01 dollars)
Balance at beginning of year (debit) $ (3 499) $
Transfer from statement of incomeand expenditure (10 276) (3 499)
Balance at year -end (debit) $ (13 775) $ (3 499)
5. Distribution of net incomeThe Caisse has been applying Section 45 of its regulations since its coming into force January 1, 1980 and
which reads as follows: "At the closing of the fiscal period of a fund, the net income of the fiscal period isestablished and, after transfer of the amount of capital gain or loss on the sale of securities to the generalreserve account of the fund, the balance of net income is apportioned among the depositors of the fund on a prorata basis of the number of units of participation held by each of them." At the beginning of the next fiscal year,such income is paid into the demand deposit account of the depositors in the General Fund.
It appears doubtful as was the case in 1980 that the provisions of the Act and regulations of the Caisse makeit possible to establish the income to be attributed to the participation deposit holder by adding to the net incomefor the year a transfer which results in a debit balance in the general reserve.
Income to be paid out to the depositor at December 31, 1981 consisted of $33 002 000 representing income ofthe last quarter of the year 1981, paid to the depositor January 1, 1982 and of $100 882 000, representing netincome for the years 1978 and 1979.
The Caisse is still studying amendments to be made to its Act and regulations with a view to regularizing thissituation and defining the terms and conditions for disposal of the net income for the years 1978 and 1979.

41
TOTAL FUNDSSummary of investments as at December 31. 1981 (Table 20)
GENERAL FUNDSummary of investments as at December 31, 1981 (Table 21)
SEGREGATED FUNDSSummary of investments as at December 31, 1981 (Table 22)
INDIVIDUAL FUNDSummary of investments as at December 31. 1981 (Table 23)
GENERAL FUNDYield on various categories of average deposits (Table 24)
INDIVIDUAL FUNDYield on various categories of average deposits (Table 25)
SEGREGATED FUND — BONDS (FUND "0")Yield on various categories of average deposits (Table 26)
SEGREGATED FUND — GOVERNMENT BONDS(FUND "G")
Yield or various categories of average deposits (Table 27)
SEGREGATED FUND — STOCKS (FUND "A")Yield on various categories of average deposits (Table 28)
SEGREGATED FUND — MORTGAGES (FUND "H")Yieid on various categories of average deposits (Table 29)
Net contributions by depositors (Table 30)
Depositors holdings with Caisse at realization
value as at December 31. 1981 (Table 31)
RÉGIE DES RENTES DU QUEBECFunds entrusted to management of Caisse as at December 31 (Table 32)
REGIE DE L'ASSURANCE AUTOMOBILE DU QUEBECFunds entrusted to management of Caisse as at December 31 (Table 33)
COMMISSION DE LA SANTE ET DE LA SECU RITE DU TRAVAILFunds entrusted to management of Caisse as at December 31 (Table 34)
GOVERNMENT AND PUBLIC EMPLOYEES RETIREMENT PLAN
Funds entrusted to management of Caisse as at December 31 (Table 35)
SUPPLEMENTAL PENSION PLAN FOR EMPLOYEES OF THE QUEBEC
CONSTRUCTION INDUSTRYFunds entrusted to management of Caisse as at December 31 (Table 36)
SUPPLEMENTAL PENSION PLAN OF THE UNIVERSITÉ DU QUEBEC
Funds entrusted to management of Caisse as at December 31 (Table 37)
Participations in new Gouvernement du Quebec and Hydro-Quebec
issues on the Canadian market in 1981 (Table 38)
Breakdown of acquisitions by Caisse of new bonds issued or guaranteed
by the Gouvernement du Quebec on the Canadian market (Table 39)
Acquisitions by Caisse of new bonds issued or guaranteed by the
Gouvernement du Quebec on the Canadian market (Table 40)
Percentage of securities issued or guaranteed by the
Gouvernement du Quebec and held by Caisse in relation to total
investments as at December 31 (Table and Graph 44)
Statement or real estate investments of Caisse and subsidiaries
held as al December 31, 1981 (Table 42)
Ten-year retrospective of investments as al December 31 (Table 43)
Total funds — Ten-year retrospective ot financial
data as al December 31 (Table 44)
INVESTMENTS
YIELD
DEPOSITORS
PARTICIPATIONS —BONDS ISSUED ORGUARANTEEDBY THE GOUVERNEMENTDU QUEBEC
REAL ESTATEINVESTMENTS
FINANCIALRETROSPECTIVE
Pages42-43
44-45
46-47
48-49
50
50
50
50
50
50
51
5253
53
54
54
55
55
56
56
57
57
58-59
60-61
62-63
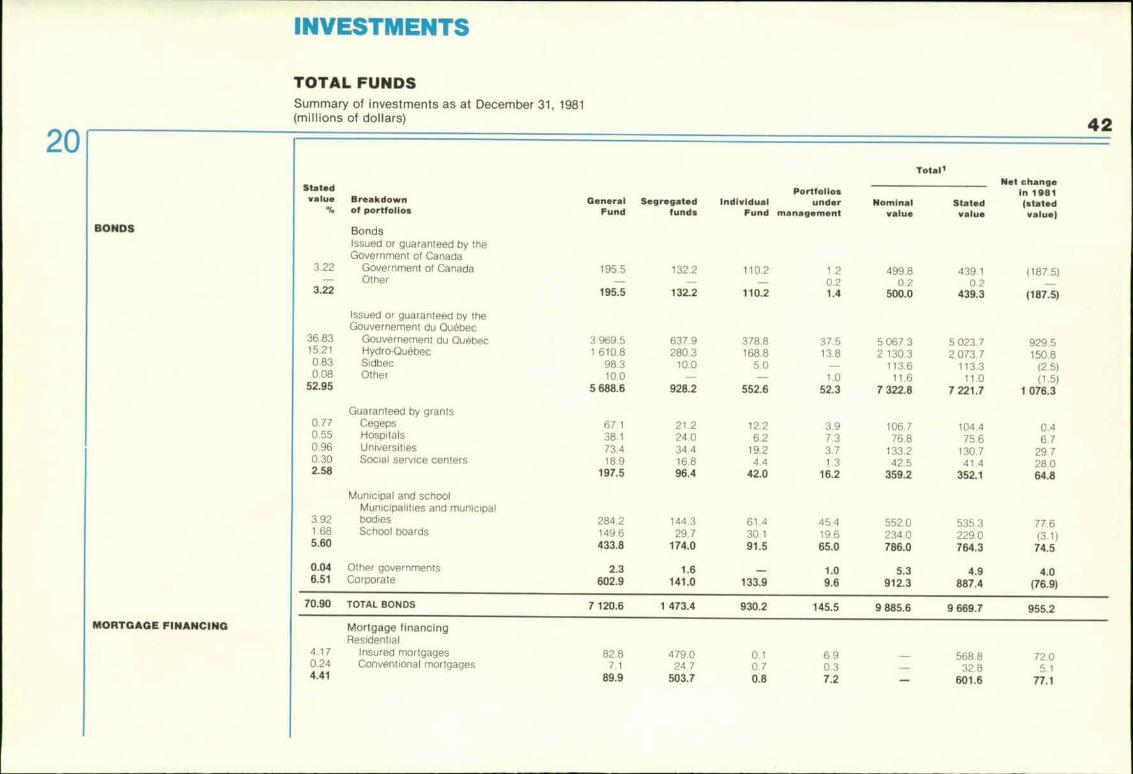
INVESTMENTS
TOTAL FUNDSSummary of investments as at December 31, 1981(millions of dollars)
Totall Net change
Stated Portfolios in 1981value Breakdown General Segregated Individual under Nominal Stated (stated% of portfolios Fund funds Fund management value value value)
BondsIssued or guaranteed by theGovernment of Canada
3.22 Government of Canada
- Other3.22
195.5 132.2 110.2 1.2 499.8 439.1 (187.5)- 0.2 0.2 0. 2
195.5 132.2 110.2 1.4 500.0 439.3 (187.5)
3969.5 637.9 37_5 5067.3 76023.71 610.8 5280.•6788.8 138 1103..36.32 13 20737 915209.
98.3 10.0 5.0 - (2.5)10.0 - - 1.0 11.6 11.0 (1.5)
5 688.6 928.2 552.6 52.3 7 322.8 7221.7 1 076.3
67.1 21.2 12.2 3.9 104.4 0.438.1 24.0 6.2 7.3
1370366.125775.6 6.7
73.4 34.4 19.2 3,7 130.7 29.718.9 16.8 4.4 1.3 42.5 41 4 28.0
197 .5 96.4 42.0 16.2 359.2 .1352.1
4'2289.614144.329.7
61.430. 1
45.419.6 2552.0340 2253905.3
77.6(3,1)
433.8 174.0 91.5 65.0 786.0 764.3 74.5
2.3 1.6 1.0 5.3 4.9 4.0602.9 141.0 133.9 9.6 912.3 887.4 (76.9)
7 120.6 1 473.4 930.2 145.5 9 885.6 9669.7 955.2
82.8 479.0 0.1 6.9 568.8 72.07.1 24.7 0.7 0. 3 52 8 51
89.9 503.7 0.8 7.2 601.6 77.1
BONDS
MORTGAGE FINANCING
Issued or guaranteed by theGouvernement du Quebec
36.83 Gouvernement du Quebec15.21 Hydro-Quebec0.83 Sidbec0_08 Other
52.95
Guaranteed by grants0.77 Cegeps0.55 Hospitals0.96 Universities0.30 Social service centers2.58
Municipal and schoolMunicipaIities and municipal
3.92 bodies1 .68 School boards5.60
0.04 Other governments6.51 Corporate
70.90 TOTAL BON DS
Mortgage financingResidential
4.17
Insured mortgages0.24
Conventional mortgages4.41
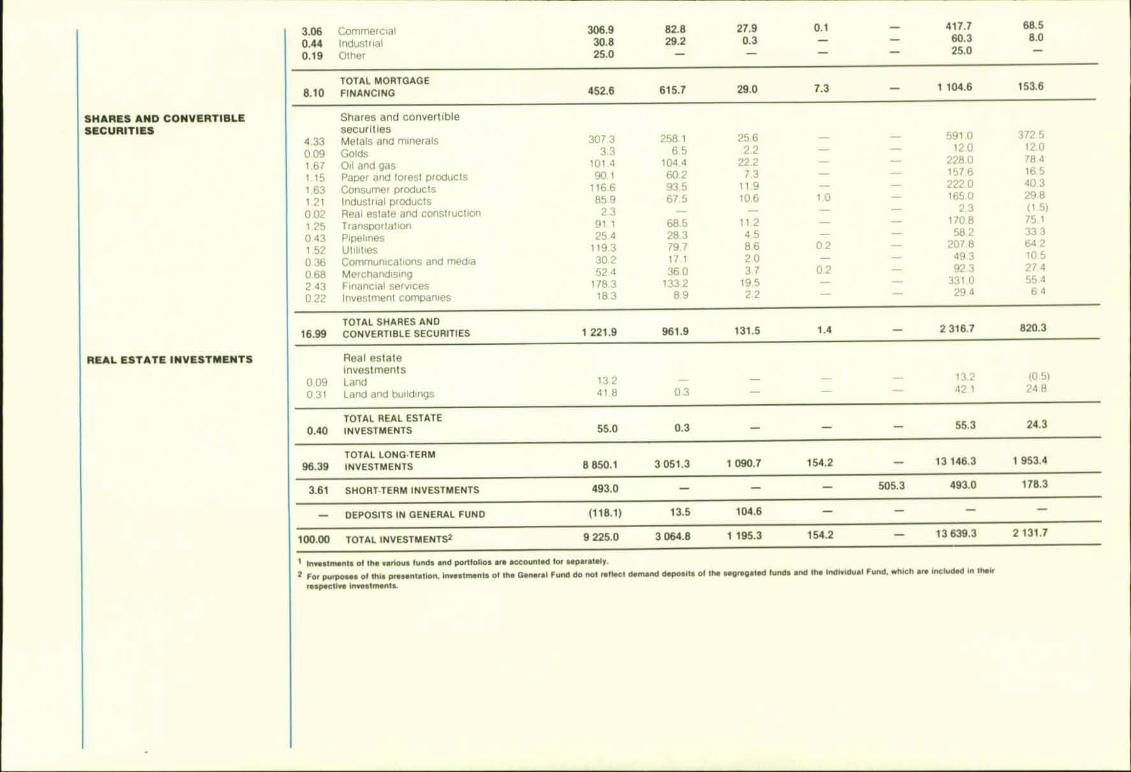
3.06 Commercial 306.9 82.8 27.9 0.1 417.7 68.5
0.44 Industrial 30.8 29.2 0.3 60.3 8.0
0.19 Other 25.0 25.0
TOTAL MORTGAGE8.10 FINANCING 452.6 615.7 29.0 7.3
-
1104.6 153.6
Shares and convertiblesecurities
4.33 Metals and minerals0.09 Golds
1.67 Oil and gas1.15 Paper and forest products
1.63 Consumer products1.21 Industrial products0.02 Real estate and construction1.25 Transportation0.43 Pipelines
1.52 utilities
0.36 Communications and media0.68 Merchandising
2.43 Financial services0 22 Investment companies
307.3 258.1 25.6 591.0 372.5
3.3 6.5 2.2 12.0 12.0
101.4 104.4 22.2 228.0 78_4
90.1 60.2 7.3 157.6 16.5
116_6 93.5 11.9 - 222_0 40.3
85.9 67.5 10.6 1.0 165.0 29.8
2.3 - - 2.3 (1.5)
91.1 68.5 11.2 170.8 75.1
25.4 28.3 4.5 - - 58.2 33.3
119.3 79.7 8.6 0.2 2078. 64_2
30.2 17.1 2.0 49.3 10.5
52.4 36.0 3.7 0.2 - 92.3 27.4
178.3 133_2 19.5 - 331 0 55_4
183 89 2.2 - 294 6_4
TOTAL SHARES AND16.99 CONVERTIBLE SECURITIES 1 221.9 961.9 131.5 1.4 - 2 316.7 820.3
Real estateinvestments
0.09 Land0.31 Land and buildings
13.241.8 0.3
13.2 (0.5)42 1 24A
TOTAL REAL ESTATE0.40 INVESTMENTS 55.0 0.3 55.3 24.3
TOTAL LONG TERM96.39 INVESTMENTS 8850.1 3051.3 1 090.7 154.2 13146.3 1 953.4
3.61 SHORT TERM INVESTMENTS 493.0 505.3 493.0 178.3
- DEPOSITS IN GENERAL FUND (118.1) 13.5 104.6
1 00.00 TOTAL INVESTMENTS 2 9 225.0 3 064.8 1 195.3 154.2 - 13639.3 2131.7
1 Investments of the various funds and portIolios age accounted for separately.
2 For purposes of this presentation. investments of the General Fund do not reflect demand deposits of the segregated funds and the Individual Fund, which ore included in their
respective investments.
SHARES AND CONVERTIBLESECURITIES
REAL ESTATE INVESTMENTS
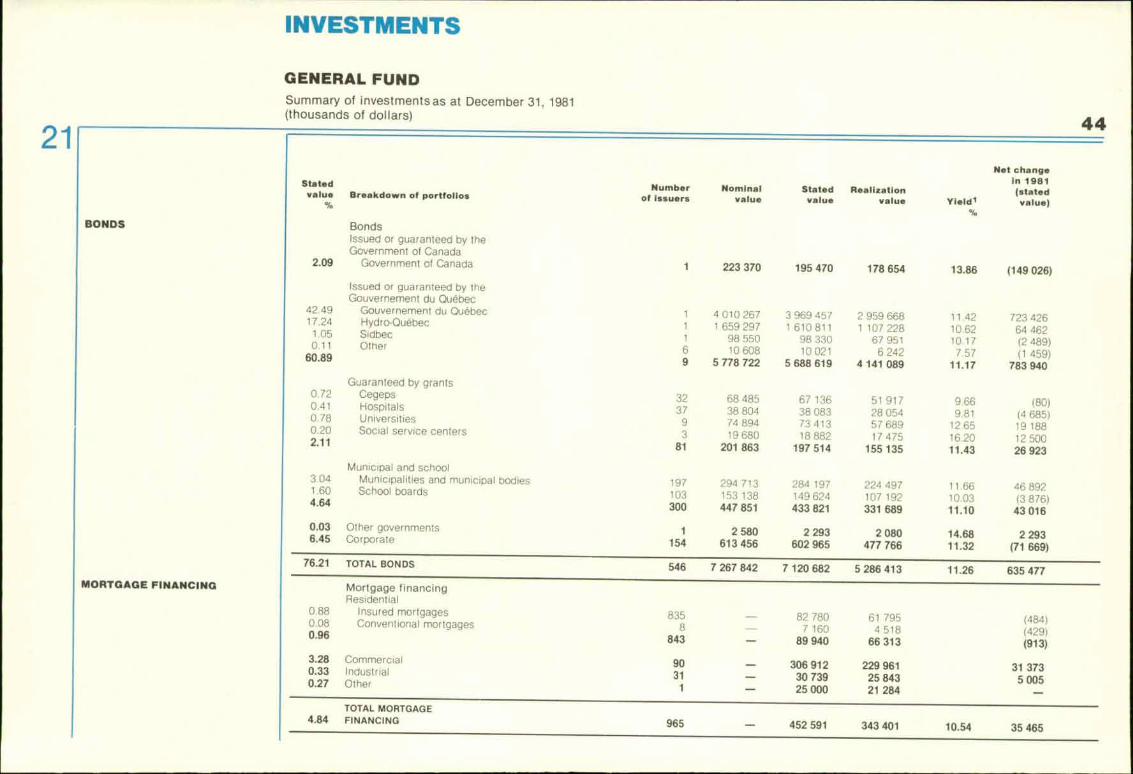
INVESTMENTS
GENERAL FUNDSummary of investments as at December 31, 1981(thousands of dollars)
Statedvalue
%Breakdown of portfolios
Numberof issuers
Nominalvalue
Statedvalue
Realizationvalue Yield',
Net change
in 1981(statedvalue)
%
BONDS BondsIssued or guaranteed by theGovernment of Canada
2.09 Government of Canada 1 223 370 195 470 178 654 13.86 (149 026)
Issued or guaranteed by theGouvernement du Quebec
42.4917.24
Gouvernement du Quebec 1 4 010 267 3 969 457 2 959 668 11.42 723 426Hydro-Québec 1 1 659 297 1 610 811 1 107 228 10.62 64 4621_050_11
Sidbec 1 98 550 98 330 67 951 10.17 (2489)
60.89Other 6 10 608 10 021 6 242 7.57 (1459)
9 5 778 722 5 688 619 4 141 089 11.17 783 940
Guaranteed by grants0.720.41
Cegeps 32 68 485 67 136 51 917 9.66 (80)
0.78Hospitals 37 38 804 36 083 28 054 9.81 (4 685)
0.20Universities 9 74 894 73 413 57 689 12.65 19 188
2.11Social service centers 3 19 680 18 882 17 475 16.20 12 500
81 201 863 197 514 155 135 11.43 26 923
Municipal and school3.041.60
Municipalities and municipal bodies 197 294 713 284 197 224 497 11.66 46 892School boards 103 153 138 149 624 107 192 10.03 (3876)4.64 300 447 851 433 821 331 689 11.10 43 016
0.036.45
Other governments 1 2 580 2 293 2 080 14.68 2 293Corporate 154 613 456 602 965 477 766 11.32 (71 669)
76.21 TOTAL BONDS 546 7 267 842 7 120 682 5 286 413 11.26 635 477MORTGAGE FINANCING Mortgage financing
Residential0.880.08
Insured mortgages 835 82 780 61 795 (484)
0.96Conventional mortgages 8 7 160 4 518 (429)
843 - 89 940 66 313 (913)
3.280.33
Commercial 90 - 306 912 229 961 31 373Industrial 31 - 30 739 25 843 5 0050.27 Other 1 25 000 21 284 -TOTAL MORTGAGE
4.84 FINANCING 965 452 591 343 401 10.54 35 465
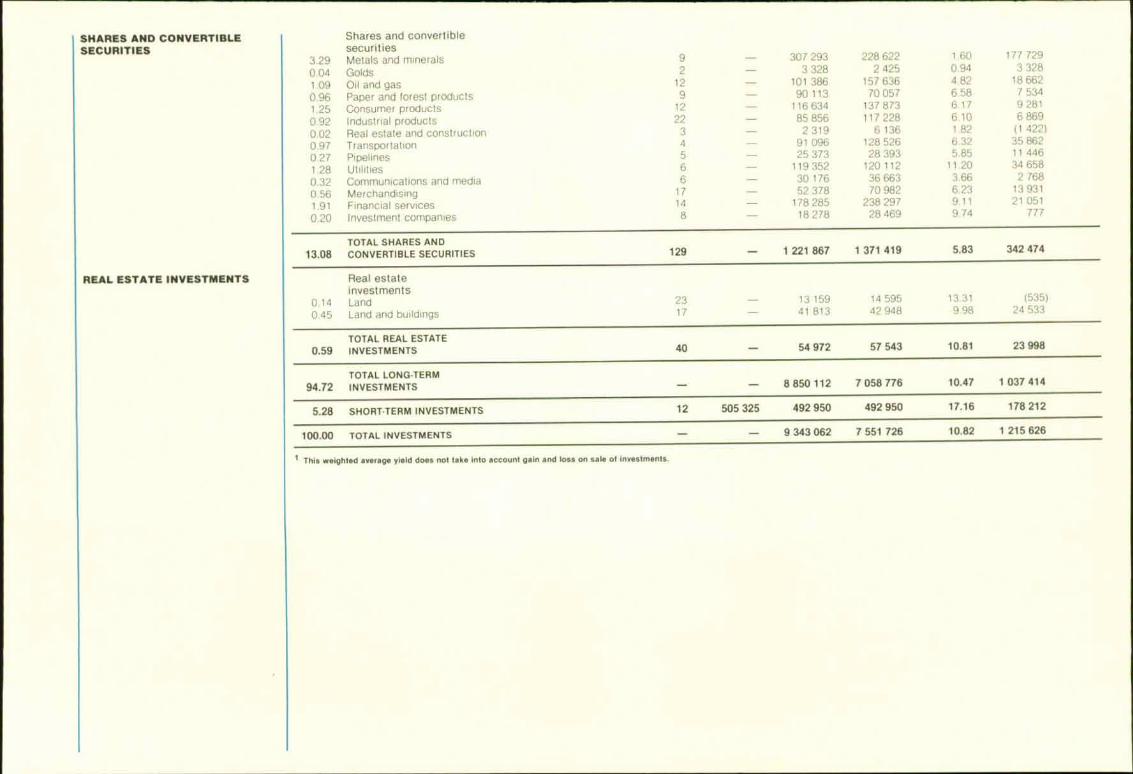
Shares and convertiblesecurities
3.29 Metals and minerals 9 307 293 228 622 1.60 177 729
0.04 Golds 2 _ 3 328 2 425 0.94 3 328
1_09 Oil and gas 12 101 386 157 636 4.82 18 662
0_96 Paper and forest products 9 90 113 70 057 6_58 7 534
1.25 Consumer products 12 116 634 137 873 6.17 9 281
0.92 Industrial products 22 85 856 117 228 6.10 6 869
0.02 Real estate and construction 3 2 319 6 136 1.82 (1 422)
097 Transportation 4 91 096 128 526 6.32 35 862
0 27 Pipelines 5 25 373 28 393 5.85 11 446
1.28 Utilities 6 119 352 120 112 11.20 34 658
0.32 Communications and media 6 30 176 36 663 3.66 2 768
0.56 Merchandising 17 52 378 70 982 6.23 13 931
1.91 Financial services 14 178 285 238 297 9.11 21 051
0.20 Investment companies 8 18 278 28 469 9.74 777
TOTAL SHARES AND
13.08 CONVERTIBLE SECURITIES 129
-
1 221 867 1 371 419 5.83 342 474
Real estateinvestments
0.14 Land0.45 Land and buihdings
23 13 159 14 595 13.31 (535)17 41 813 42 948 9.98 24 533
TOTAL REAL ESTATE
0.59 INVESTMENTS 40
-
54 972 57 543 10.81 23 998
TOTAL LONG-TERM94.72 INVESTMENTS - - 8 850 112 7 058 776 10.47 1 037 414
12 505 325 492 950 492 950 17.16 178 212
- - 9 343 062 7 551 726 10.82 1 215 626
5.28 SHORT-TERM INVESTMENTS
100.00 TOTAL INVESTMENTS
1•This weighted average yield does not take into account gain and toss on saie al investments.
SNARES AND CONVERTIBLESECURITIES
REAL ESTATE INVESTMENTS

INVESTMENTS
SEGREGATED FUNDSSummary of investments as at December 31, 1981(thousands of dollars)
FUND "0"BONDS
Staledvalue Breakdown of portfolios
BondsIssued or guaranteed by theGovernment of Canada
Numberof issuers
Nominalvalue
Statedvalue
Realizationvalue Yield I
Net changein 1981(statedvalue)
4.31 Government of Canada 1 151 125 132 201 120 741 13.82 (26 161)
Issued or guaranteed by theGouvernement du Quebec
18.86 Gouvernement du Quebec 1 578 632 577 966 463 560 12.52 203 3468.68 Hydro-Quebec 1 270 325 266 118 222 450 13.08 90 8340.33 Sidbec 1 10 000 9 968 6 801 10.64 1
27.87 3 858 957 854 052 692 811 12.67 294 181
Guaranteed by grants0.57 Cegeps 17 18 104 17 602 13 359 11 07 1 2990_73 Hospitals 22 22 389 22 225 19 261 14.61 11 7191.04 Universities 8 32 426 31 904 25 180 13.53 11 8360.55 Social service centres 2 17 040 16 834 16 513 17.58 12 8342.89 49 89 959 88 565 74 313 14.08 37 688
Municipal and school4.07 Municipalities and munIcipal bodies 109 127 438 124 691 101 926 13.09 32 605090 School boards 30 27 908 27 432 19 703 11.32 2 4954.97 139 155 346 152 123 121 629 12.77 35 100
0.05 Other governments 1 1 750 1 616 1 494 14.88 1 6164.60 Corporate 54 151 231 140 948 109 231 11.64 (1 140)
44.69 TOTAL BONDS 247 1 408 368 1 369 505 1 120 219 12.78 341 284
- DEPOSITS IN GENERAL FUND (14 816)
44.69 TOTAL INVESTMENTS - FUND - 0- 247 1 408 368 1 369 505 1 120 219 12.78 326 468
FUND "G" Government bondsGOVERNMENT BONDS Issued or guaranteed by the
Gouvernement du Quebec1.96 Gouvernement du Quebec 1 60 000 59 915 41 076 9.83 20.46 Hydro-Quebec 1 /4 600 14 224 9 328 10.48 (2355)2.42 2 74 600 74 139 50 404 9.96 (2 353)
Guaranteed by grants0.12 Cegeps 9 3 690 3 612 2 757 10.54 10006 Hospitals 3 1 800 1 769 1 309 10.40 4

0.08 Universities 3 2 550 2 490 1 516 10.46 1
0.26 15 8 040 7 871 5 582 10.49 15
Municipal and school0.640.07
Municipalities and municipal bodiesSchool boards
2712
19 974 19 6092 279
13 3921 759 10.11045
29(95)
0.71 39 3222 2381 7 21 888 15 151 10.51 (66)
3.39 TOTAL BONDS 56 104 927 103 898 71 137 10.11 (2 404)
0.14 DEPOSITS IN GENERAL FUND 4 315 4 315 4 315 14.50 1 633
3.53 TOTAL INVESTMENTS - FUND "G" 56 109 242 108 213 75 452 10.29 (771)
FUND "A" Shares and convertible securitiesSHARES AND 8.42 Metals and minerals 9 258 055 177 993 1.52 169 086
CONVERTIBLE SECURITIES 0.21 Golds 2 _ 6 541 5 140 1.18 6 541
3.41 Oil and gas 12 104 421 121 326 3.73 37 553
1.97 Paper and forest products 8 60 247 45 978 6.04 1 752
3.05 Consumer products 9 93 469 105 492 5.91 19 334
2.20 Industrial products 17 67 460 84 059 5.87 12 521
- Real estate and construction - - - (85)
2.23 Transportation 3 - 68 484 84 619 5.61 28 080
0.92 Pipelines 4 28 272 26 765 4.89 17 262
2.60 Utilities 4 _ 79 739 75 133 10.91 21 074
0.56 Communications and media 5 17 135 21 423 5.12 5 713
1.17 Merchandising 10 - 36 004 43 164 5.23 9 854
4.35 Financial services 9 133 201 159 604 8.44 14 802
0.29 Investment companies 3 8 933 11 349 7.13 3 368
TOTAL SHARES AND CONVERTIBLE
31.38 SECURITIES 95 961 961 962 045 5.15 346 855
0.30 DEPOSITS IN GENERAL FUND 9 122 9 122 9 122 14.50 (87 315)
31.68 TOTAL INVESTMENTS - FUND "A" 95 971 083 971 167 5.24 259 540
FUND "H" Mortgage financingMORTGAGE FINANCING Residential
15.63 Insured mortgages 20 227 479 036 417 435 65 723
0.81 Conventional mortgages 259 - 24 654 22 321 12 626
16.44 20 486 - 503 690 439 756 78 349
2.70 Commercial 140 - 82 765 68 610 9 166
0.95 Industrial 61 _ 29 249 25 459 2 634
20.09 MORTGAGE FINANCING 20 687 - 615 704 533 825 11.81 90 149
0.01 REAL ESTATE INVESTMENTS 9 - 311 354 - 311
TOTAL MORTGAGE FINANCING AND
201 0 REAL ESTATE INVESTMENTS 20 696 - 616 015 534 179 11.81 90 460
- DEPOSITS IN GENERAL FUND - _ - - - (9 334)
20.10 TOTAL INVESTMENTS - FUND "H - 20 696 - 616 015 534 179 11.81 81 126
100.00 TOTAL INVESTMENTS -- 3 064 816 2 701 017 10.11 666 363
1 This weighted average yield does not take Into account gain and loss on sale of investments.

INVESTMENTS
INDIVIDUAL FUNDSummary of investments as at December 31, 1981(thousands of dollars)
BONDS
Statedvalue Breakdown of portfolios
BondsIssued or guaranteed by theGovernment of Canada
Numberof issuers
Nominalvalue
Statedvalue
Realizationvalue 'Ilele
%
Net change
in 1981(statedvalue)
9.22 Government of Canada 1 123 975 110 229 89 835 12.22 (12 202)
Issued or guaranteed by theGouvernement du Quebec
31.69 Gouvernement du Quebec 1 380 465 378 812 266 312 11.04 4 81314.12 Hydro-Québec 1 172 100 168 756 122 118 11 46 (11)0.42 Sidbec 1 5 000 4 984 3 389 10.59
46.23 3 557 565 552 552 391 819 11.16 4 802
Guaranteed by grants1.02 Cegeps 14 12 447 12 204 9 331 10.97 (69)0.52 Hospitals 7 6 340 6 202 5 025 12.13 9771.61 Universities 7 19 587 19 154 12 447 10.63 (1 133)0.37 Social service centers 2 4 500 4 446 3 569 13 68 1 4463.52 30 42 874 42 006 30 372 11.28 1 221
Municipal and school5.13 Municipalities and municipal bodies 99 63 400 61 365 46 017 11.47 2172_52 School boards 35 30 569 30 103 22 638 10.93 (40)7.65 134 93 969 91 468 68 655 11.29 177
11.20 Corporate 51 137 522 133 881 99 536 11.07 (451)
77.82 TOTAL BONDS 219 955 905 930 136 680 217 11.29 (6453)
MORTGAGE FINANCING Mortgage financingResidential
0.01 Insured mortgages 2 134 137 134006 Conventional mortgages 4 694 702 6940.07 6 - 828 839 828
2.34 Commercial 7 27 911 28 894 27 9110.02 Industrial 2 276 272 276
TOTAL MORTGAGE2.43 FINANCING 15 29 015 30 005 19.89 29 015
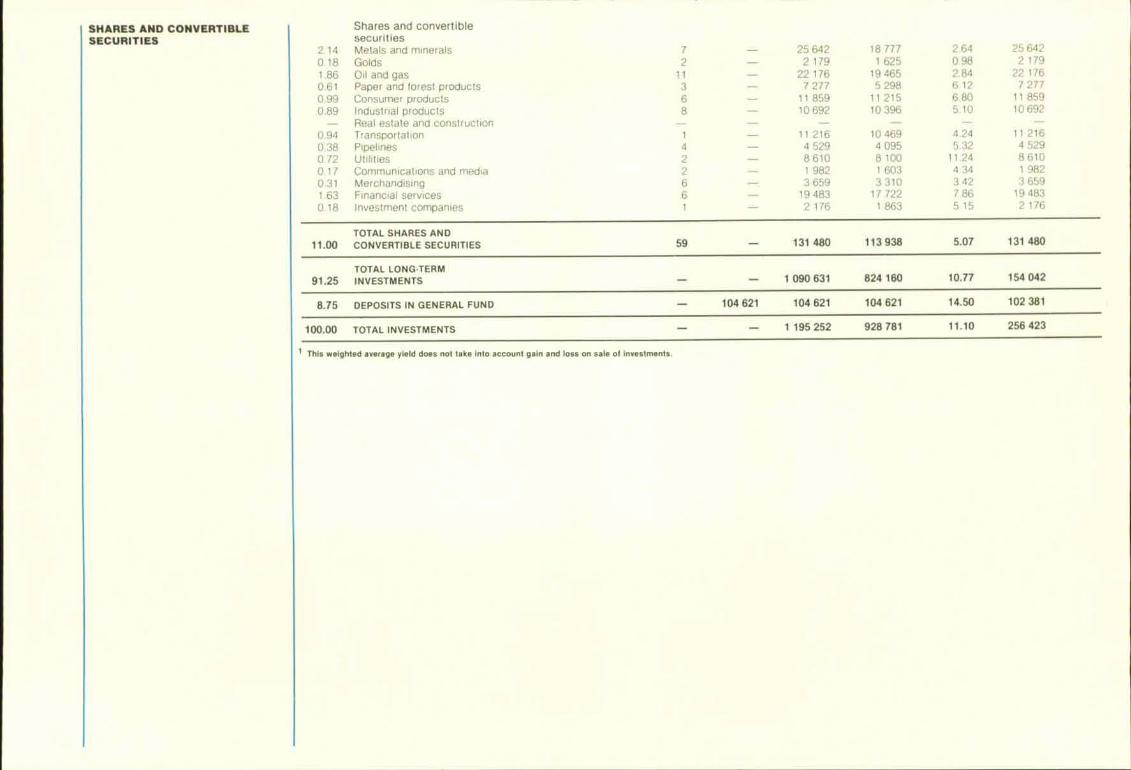
Shares and convertiblesecurities
2.14 Metals and minerals 7 25 642 18 777 2.64 25 6420.18 Golds 2 2 179 1 625 0.98 2 179
1.86 Oil and gas 11 22 176 19 465 2.84 22 1760.61 Paper and forest products 3 7 277 5 298 6_12 7 277
0.99 Consumer products 6 11 859 11 215 6.80 11 8590.89 Industrial products 8 10 692 10 396 5.10 10 692- Real estate and construction - _ _ - - -
0.94 Transportation 1 - 11 216 10 469 4.24 11 2160_38 Pipelines 4 - 4 529 4 095 5.32 4 5290.72 Utilities 2 8 610 8 100 11.24 8 6100.17 Communications and media 2 1 982 1 603 4.34 1 9820.31 Merchandising 6 3 659 3 310 3.42 3 6591.63 Financial services 6 19 483 17 722 7.86 19 4830 18 Investment companies 1 2 176 1 863 5.15 2 176
SHARES AND CONVERTIBLESECURITIES
TOTAL SHARES AND11.00 CONVERTIBLE SECURITIES 59 - 131 480 113 938 5.07 131 480
TOTAL LONG-TERM91.25 INVESTMENTS - - 1 090 631 824 160 10.77 154 042
_ 104 621 104 621 104 621 14.50 102 381
- - 1 195 252 928 781 11.10 256 423
8.75 DEPOSITS IN GENERAL FUND
100.00 TOTAL INVESTMENTS
1 This weighted average yield does not lake into account gain and loss on sale of investments.
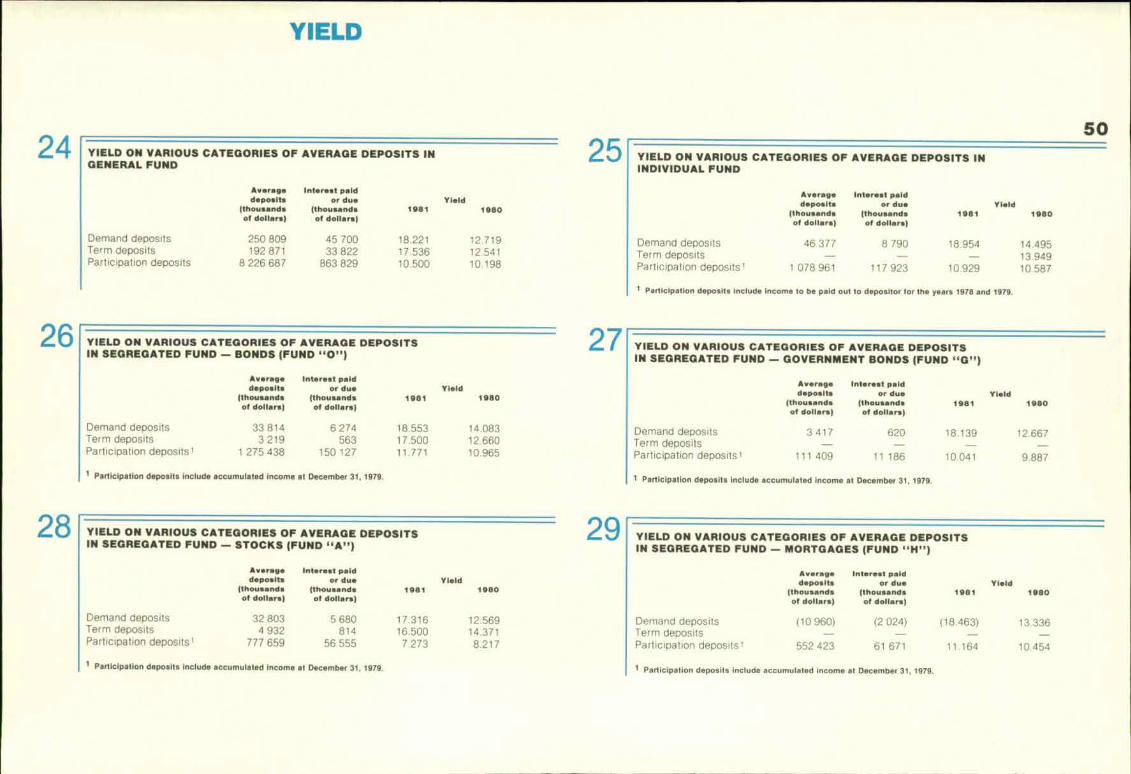
YIELD ON VARIOUS CATEGORIES OF AVERAGE DEPOSITS INGENERAL FUND
Average interest paid
deposits or due
Yield
(thousands (thousands
1981
1080
of dollars) of dollars)
Demand deposits 250 809 45 700 18.221 12 719Term deposits 192 871 33 822 17.536 12.541Participation deposits 8 226 687 863 829 10.500 10.198
24 25
YIELD ON VARIOUS CATEGORIES OF AVERAGE DEPOSITSIN SEGREGATED FUND — BONDS (FUND "0")
Average Interest paid
deposits or due Yield
(thousands (thousands 1981 1080
of dollars) of dollars)
Demand deposits 33 814 6 274 18.553 14.083Term deposits 3 219 563 17.500 12.660Participation deposits 1 1 275 438 150 127 11.771 10_965
1 Participation deposits include accumulated income at December 31, 1979.
26 27
YIELD ON VARIOUS CATEGORIES OF AVERAGE DEPOSITSIN SEGREGATED FUND — STOCKS (FUND "A")
29
YU. 0
28
50YIELD ON VARIOUS CATEGORIES OF AVERAGE DEPOSITS ININDIVIDUAL FUND
Average
Interest paid
deposits
or due
Yield
(thousands
(thousands
1081 1980
of dollors)
of dollars)
Demand deposits 46 377 8 790 18.954 14.495Term deposits 13.949Participation deposits 1 1 078 961 117 923 10.929 10 587
1 Participation deposits include income to be paid out to depositor tor the years 1978 and 1979.
YIELD ON VARIOUS CATEGORIES OF AVERAGE DEPOSITSIN SEGREGATED FUND — GOVERNMENT BONDS (FUND "G")
Average interest paid
deposits or due
Yield
(thousands (thousands
19131 1980
of dollars) of dollars)
Demand deposits 3 417 620 18.139 12.667Term deposits —Participation deposits 1 111 409 11 186 10.041 9.887
1 participation deposits include accumulated income at December 31, 1979.
YIELD ON VARIOUS CATEGORIES OF AVERAGE DEPOSITSIN SEGREGATED FUND — MORTGAGES (FUND "H")
Averagedeposits
(thousandsof dollars)
Interest paidor due
(thousand.of dollars)
1981Yield
1980
Averagedeposits
(thousandsof dollars)
interest paidor due
(thousandsof dollars)
1981Yield
1980
Demand depositsTerm deposits
32 8034 932
5 680814
17.31616.500
12.56914.371
Demand depositsTerm deposits
(10960) (2024) (18.463) 13.336
Participation depostsl 777 659 56 555 7.273 8.217 Participation deposits 1 552 423 61 671 11.164 10.454
Participation deposits include accumulated income at December 31, 1979. 1 Participation deposits include accumulated income al December 31, 1979.
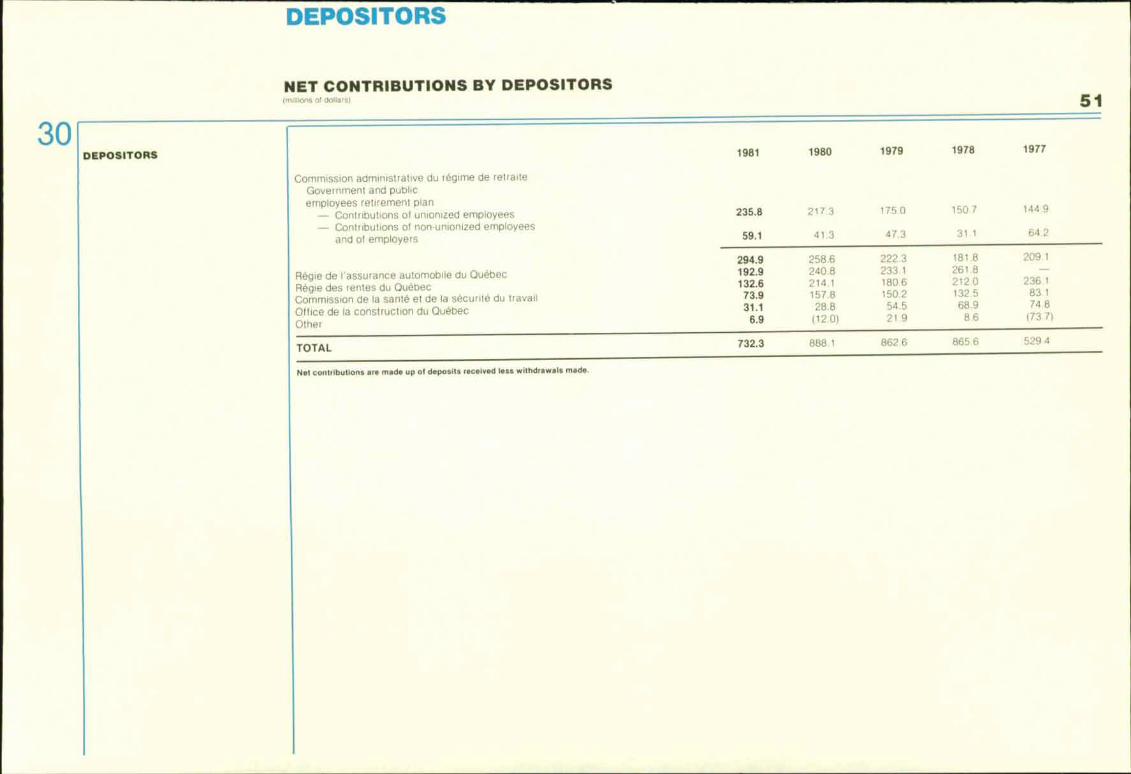
.4EPOSITORS
NET CONTRIBUTIONS BY DEPOSITORS(millions oi dollar .
51
1981 1980 1979 1978 1977
Commission administrative du régime de retraiteGovernment and publicemployees retirement pian
- Contributions of unionized employees- Contributions of non-unionized employees
and of employers
235.8
59.1
217.3
41.3
175 0
47.3
150,7
311
144.9
64 2
294.9 258.6 222.3 181.8 209.1
Régie de l'assurance automobile du Québec 192.9 240.8 233.1 261.8 -
Régie des rentes du Québec 132.6 214.1 180.6 212.0 236.1
Commission de la santé et de la sécurité du travail 73.9 157.8 150.2 132.5 83.1
Office de la construction du Québec 31.1 28.8 54.5 68.9 74,8
Other 6.9 (12.0} 21.9 8.6 {73.7)
TOTAL 732.3 888.1 862.6 865_6 529 4
Net contributions are rode up of deposits received less withdrawals made
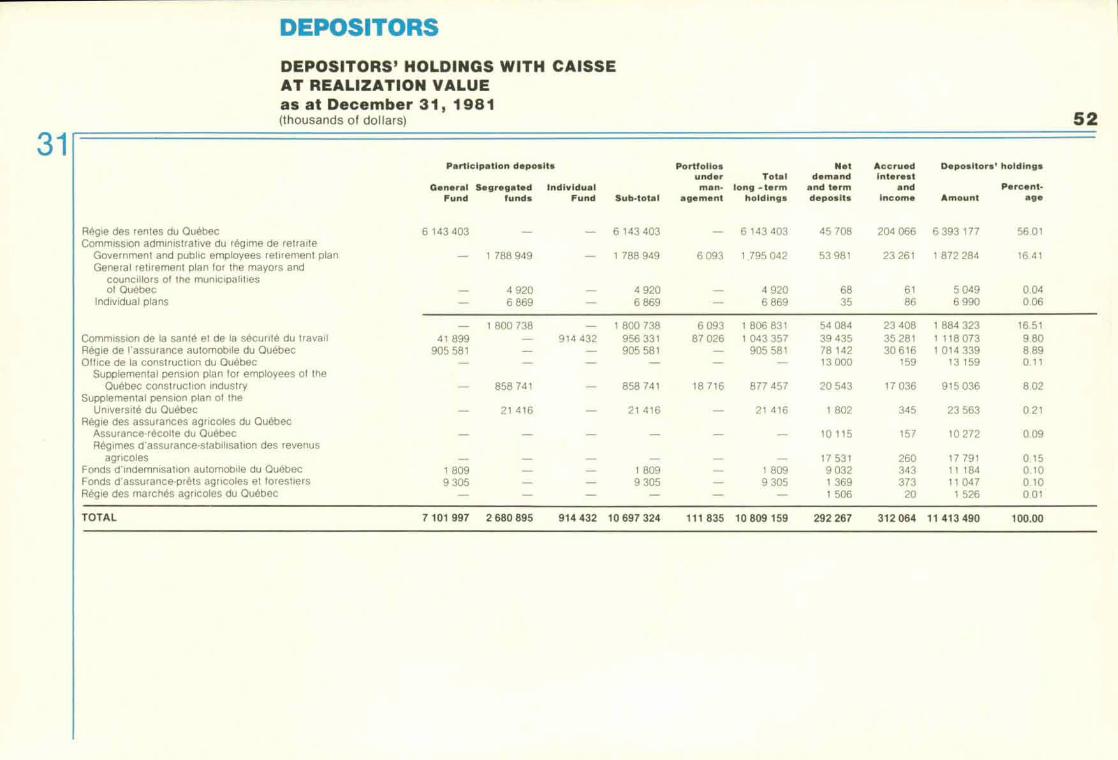
DEPOSITORS
DEPOSITORS' HOLDINGS WITH CAISSEAT REALIZATION VALUEas at December 31, 1981(thousands of dollars)
Participation deposits
General Segregated individual
Fund funds Fund Sub•total
Portfoliosunderman-
agement
Totallong -term
holdings
Netdemand
and termdeposits
Accruedinterest
andincome
Depositors' holdings
Percent-Amount age
Régie des rentes du Québec 6 143 403 — 6 143 403 — 6 143 403 45 708 204 066 6 393 177 56 01Commission administrative du régime de retraite
Government and public employees retirement plan — 1 788 949 1 788 949 6 093 1 795 042 53 981 23 261 1 872 284 16.41General retirement plan for the mayors and
councillors of the municipalitiesof Québec 4 920 4 920 4 920 68 61 5 049 0.04
Individual plans 6 869 6 869 6 869 35 86 6 990 0.06
— 1 800 738 1 800 738 6 093 1 806 831 54 084 23 408 1 884 323 16.51Commission de la santé et de la sécurité du travail 41 899 914 432 956 331 87 026 1 043 357 39 435 35 281 1 118 073 9.80Régie de l'assurance automobile du Québec 905 581 — 905 581 — 905 581 78 142 30 616 1 014 339 8.89Office de la construction du Québec _ 13 000 159 13 159 0.11
Supplemental pension plan for employees of theQuébec construction industry 858 741 858 741 18 716 877 457 20 543 17 036 915 036 8.02
Supplemental pension plan of theUniversité du Québec 21 416 21 416 21 416 1 802 345 23 563 0.21
Régie des assurances agricoles du QuébecAssurance -récolte du Québec 10 115 157 10 272 0.09Régimes d'assurance-stabilisation des revenus
agricoles _ 17 531 260 17 791 0.15Fonds d'indemnisation automobile du Québec 1 809 1 809 1 809 9 032 343 11 184 0.10Fonds d'assurance-prêts agricoles el forestiers 9 305 9 305 9 305 1 369 373 11 047 0.10Régie des marchés agricoles du Québec 1 506 20 1 526 0 01
TOTAL 7 101 997 2 680 895 914 432 10 697 324 111 835 10 809 159 292 267 312 064 11 413 490 100.00
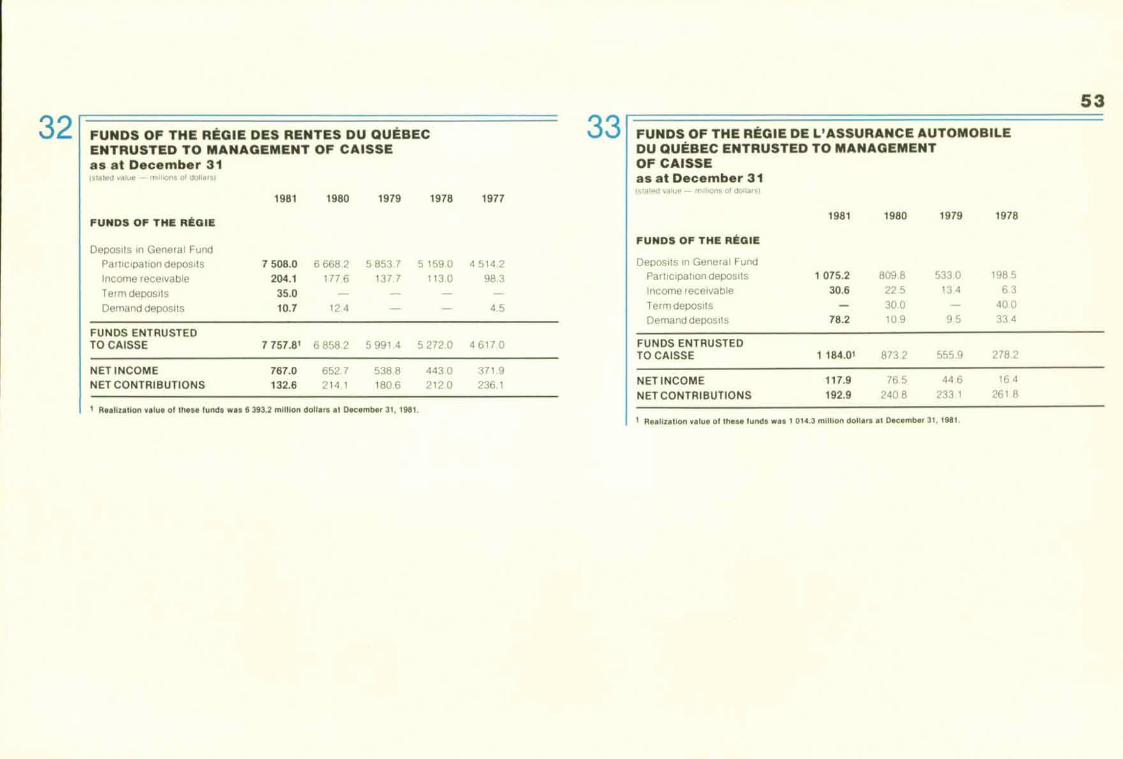
FUNDS OF THE RÉGIE DES RENTES DU QUEBECENTRUSTED TO MANAGEMENT OF CAISSEas at December 31(staled valu - rudlloroi dolla,sf
1981 1980 1979 1978 1977
FUNDS OF THE RÉGIE
Deposits in General FundParticipation deposits 7 508.0 6668.2 5853.7 5 159.0 4514.2
Income receivable 204.1 177.6 137.7 113.0 98.3
Term deposits 35.0 - - - -
Demand deposits 10.7 12.4 4.5
FUNDS ENTRUSTEDTO CAISSE 7 757.8 1 6 858.2 5991.4 5272.0 4617.0
NET INCOME 767.0 652.7 538 8 443_0 371_9NET CONTRIBUTIONS 132.6 214.1 180.6 212.0 236_1
Realization value of these funds was fi 393.2 million dollars at December 31, 1981.
32 33 FUNDS OF THE RÉGIE DE L'ASSURANCE AUTOMOBILEDU QUÉBEC ENTRUSTED TO MANAGEMENTOF CAISSEas at December 31; slated value - m n lhons 01 dollars)
1981 1980 1979 1978
FUNDS OF THE RÉGIE
Deposits in General FundParticipation deposits 1 075.2 809.8 533.0 198_5
Income receivable 30.6 22_5 13.4 6.3
Term deposits - 30.0 - 40_0
Demand deposits 78.2 10.9 9.5 334
FUNDS ENTRUSTEDTO CAISSE 1184.01 873.2 555.9 278.2
NET INCOME 117.9 765 44.6 16.4
NET CONTRIBUTIONS 192.9 240 8 233.1 261.8
1 Realization value ol these lends was 1 014.3 million dollars at December 31, 1981.
53

DEPOSITORS
5434 35FUNDS OF THE COMMISSION DE LA SANTÉ ET DE LA
SÉCURITÉ DU TRAVAIL ENTRUSTED TO MANAGEMENTOF CAISSEas at December 31f stated value - millions of dollars)
1981 1980 1979 1978 1977
FUNDS OF THE COMMISSION
Deposits in General FundParticipation deposits 52.4 52_4 52.4 52_4 524
Term deposits 35.0 60.0 - - -
Demand deposits 6.7 9.8 4.1 10.8 1.3
94.1 122.2 56.5 63.2 53.7
Deposits in Individual Fund
Participation deposits 1 093.8 839.8 649.7 464.8 302.0Income recevable 133.9 126.4 100.9 37.9 7.8
1 227.7 966.2 750.6 502.7 309.8
Portfolio under management 123.8 133 5 147_5 159_7 175.6
FUNDS ENTRUSTEDTO CAISSE 1 445.6 1 1 221.9 954.6 725.6 539.1
NET INCOME 149.8 109.5 78.8 54.0 41.1
NET CONTRIBUTIONS 73.9 157.8 150.2 132.5 83.1
1 Realization value of these funds was 1 118.1 million dollars at December 31. 1981.
FUNDS OF THE GOVERNMENT AND PUBLIC EMPLOYEESRETIREMENT PLAN ENTRUSTED TO MANAGEMENTOF CAISSEas at December 31{staled value - millions of dollars)
1981 1980 1979 1978
FUNDS OF THE PLAN
Deposits in General Fund 54.5 43.9 37.7 72.5
1977
29.8
Deposits in segregated fundsParticipation deposits
Bonds (Fund "0") 996.3 705.4 458.9 329.8 230_2Government bonds (Fund "G - ) 111.4 111.4 111.9 101.4 92.1Stocks (Fund "A") 669.3 519_4 415.1 236.8 140.4Mortgages (Fund "H") 1716 151.5 133.1 79.3 62.0
1 950.6 1 487.7 1 119.0 747.3 524.7Income receivable 22.7 17.5 - - -
1 973.3 1 505_2 1119.0 747.3 524.7
Portfolios under management 7.6 8.6 9.4 10.7 17.0
FUNDS ENTRUSTEDTO CAISSE 2 035.4 1 1 557 7 1166.1 830.5 571.5
NET INCOME 182.8 133.5 113.3 66.0 41_1
NET CONTRIBUTIONS 294.9 258.6 222.3 181.8 209.1
1Realization value of these funds was 1 872.3 million dollars at December 31, 1981.
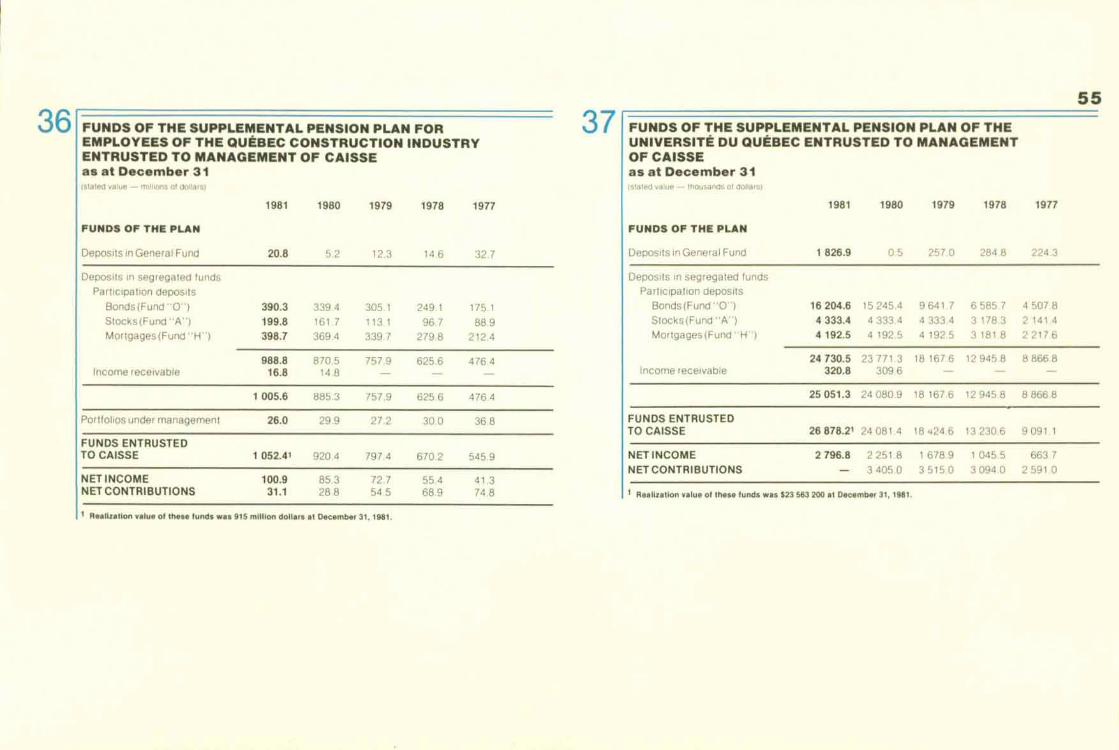
FUNDS OF THE SUPPLEMENTAL PENSION PLAN FOREMPLOYEES OF THE QUEBEC CONSTRUCTION INDUSTRYENTRUSTED TO MANAGEMENT OF CAISSEas at December 3 1
n ,!oted v,out, - fn , ,nort, ur Jofiais)
FUNDS OF THE PLAN
Deposits in Genera t Fund
1961
20.8
1980
5.2
1979
12.3
1978
14.6
1977
32.7
Deposits in segregated funds
Participation deposits
Bonds (Fund "0") 390.3 339.4 305.1 249.1 175.1Stocks (Fund "A") 199.8 161.7 113.1 96.7 88.9Mortgages (Fund "H") 398.7 369.4 339.7 279.8 212.4
988.8 870_5 757.9 625.6 476.4Income receivable 16,8 14.8
1 005.6 885.3 757.9 625.6 476,4
Portfolios under management 26.0 29.9 27.2 30.0 36.8
FUNDS ENTRUSTEDTO CAISSE 1 052.41 920.4 797_4 670.2 545.9
NET INCOME 100.9 85.3 72.7 55.4 41.3NET CONTRIBUTIONS 31.1 28.8 54.5 68.9 74.8
1 Realization value of these lunds was 915 million dollars at December 31, 1981.
55
36 37 FUNDS OF THE SUPPLEMENTAL PENSION PLAN OF THEUNIVERSITÉ DU QUEBEC ENTRUSTED TO MANAGEMENTOF CAISSEas at December 31(st,, [ ,,, vd l ue - mou,dotis ol dohaf
1981 1980 1979 1978
FUNDS OF THE PLAN
1977
Deposits in General Fund 1 826.9 0.5 257_0 284.8 224.3
Deposits in segregated fundsParticipation deposits
Bonds (Fund "0") 16204.6 15245.4 9641.7 6585.7 4507.8
Stocks (Fund "A") 4333.4 4333.4 4 333.4 3 178.3 2 141.4Mortgages (Fund - H) 4192.5 4 192.5 4192.5 3181.8 2217.6
24730.5 23771.3 18167.6 12945.8 8866.8Income receivable 320.8 309.6 - - -
25051.3 24080.9 18 167.6 12945.8 8866.8
FUNDS ENTRUSTEDTO CAISSE 26 878.2 1 24081.4 18424.6 13230.6 9091.1
NET INCOME 2796.8 2251.8 1678.9 1045.5 663.7
NET CONTRIBUTIONS - 3405.0 3 515 0 3094.0 2 591 0
1 Realization value ot these funds was 5 23 563 200 al December 31, 1981.
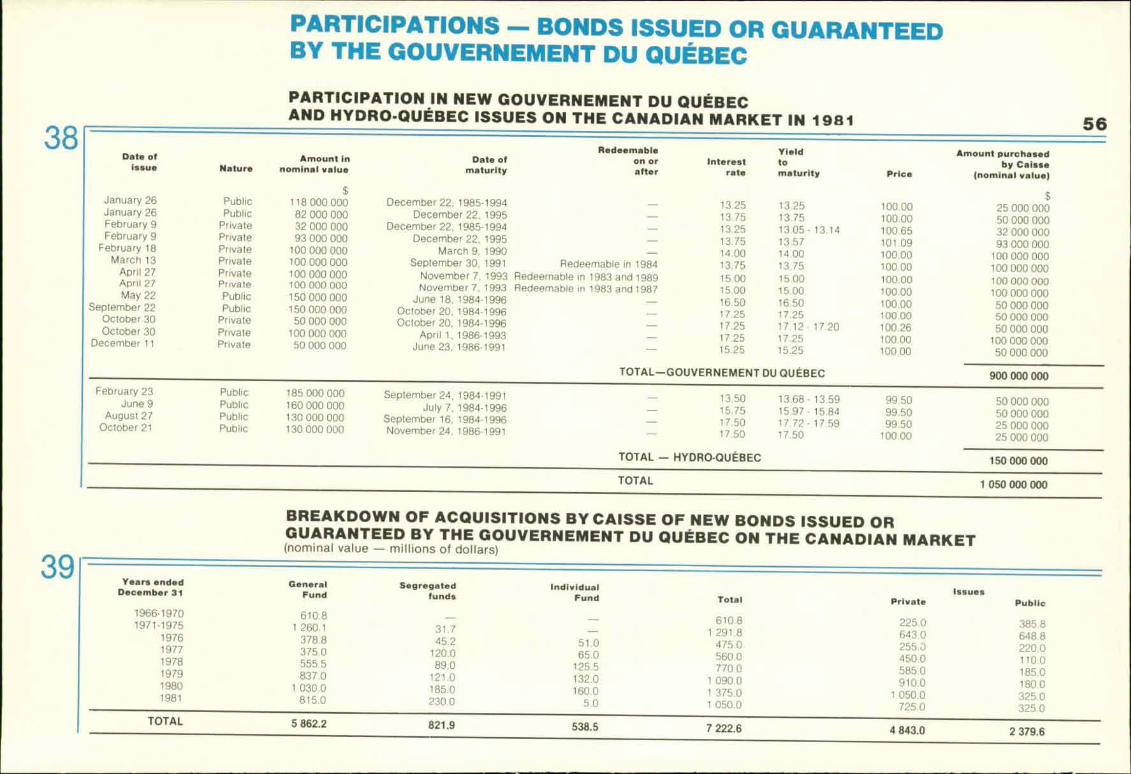
PARTICIPATIONS - BONDS ISSUED OR GUARANTEEDTHE GOUVERNEMENT DU QUÉBEC
PARTICIPATION IN NEW GOUVERNEMENT DU QUÉBECAND HYDRO-QUÉBEC ISSUES ON THE CANADIAN MARKET IN 1981
Date ofissue Nature
Amount innominal value
$
Date of
maturity
Redeemable Yieldon Or Interest to
after rate maturity Price
Amount purchasedby Caisse
(nominal value)
$January 26 Public 118 000 000 December 22, 1985-1994 13.25 13.25 100.00 25 000 000January 26 Public 82 000 000 December 22, 1995 13 75 13.75 100.00 50 000 000February 9 Private 32 000 000 December 22, 1985-1994 13.25 13.05 - 13.14 100.65 32 000 000February 9 Private 93 000 000 December 22, 1995 13.75 13.57 101.09 93 000 000February 18March
Private 100 000 000 March 9, 1990 14.00 14.00 100.00 100 000 0001327
Private 100 000 000 September 30, 1991 Redeemable in 1984 13.75 13.75 100.00 100 000 000AprilApril 27May 22
PrivatePrivatePublic
100 000 000100 000 000
November 7, 1993November 7, 1993
Redeemable in 1983 and 1989 15_00 15.00Redeemable in 1983 and 1987 15.00 15.00
100.00100.00
100100
000000
000000
September 22October 30
PublicPrivate
150 000 000150 000 000
June 18, 1984-1996October 20, 1984-1996
- 16.50 16.50
17.25 17.25100.00100_00
5050
000000
000000
October 30 Private50 000 000 October 20, 1984-1996 17.2517.12- 17.20 100.26 50 000 000
December 11100 000 000 April 1, 1986-1993 17.25 17.25 100.00 100 000 000Private 50 000 000 June 23, 1986-1991 15.25 15.25 100.00 50 000 000
TOTAL-GOUVERNEMENT DU QUÉBEC 900 000 000
February 23June 9
PublicPublic
185 000 000 September 24. 1984-1991 13.50 13.68 - 13.59 99_50 50 000 000August 27
October 21PublicPublic
160 000 000130 000 000
July 7, 1984-1996September 16, 1984-1996
15 7515.97- 15.8417.50 17.72- 17.59
99.5099.50
5025
000000
000000130 000 000 November 24. 1986-1991 17.50 17.50 100.00 25 000 000
TOTAL - HYDRO-QUEBEC 150 000 000
TOTAL 1 050 000 000
BREAKDOWN OF ACQUISITIONS BY CAISSE OF NEW BONDS ISSUED ORGUARANTEED BY THE GOUVERNEMENT DU QUEBEC ON THE CANADIAN MARKET(nominal value - millions of dollars)
Years ended General Segregated Individuel Issues
December 31 Fund funds Fund Total Private Public
1966-1970 610.8 - 610.8 225.0 385.8
1971-1975 1 260.1 31.7 - 1 291.8 643.0 648_8
1976 378.8 45.2 51.0 475.0 255.0 220.0
1977 375,0 120.0 65.0 560,0 450.0 110.0
1978 555.5 89.0 125_5 770.0 585_0 185.0
1979 837.0 121_0 132.0 1 090.0 910.0 180.0
19801030.0 185.0 160.0 1375.0 10500 325.0
1981 815.0 230.0 5.0 1050.0 725.0 325.0TOTAL5862.2 821.9 538.5 7222.6 4843.0 2 379.6
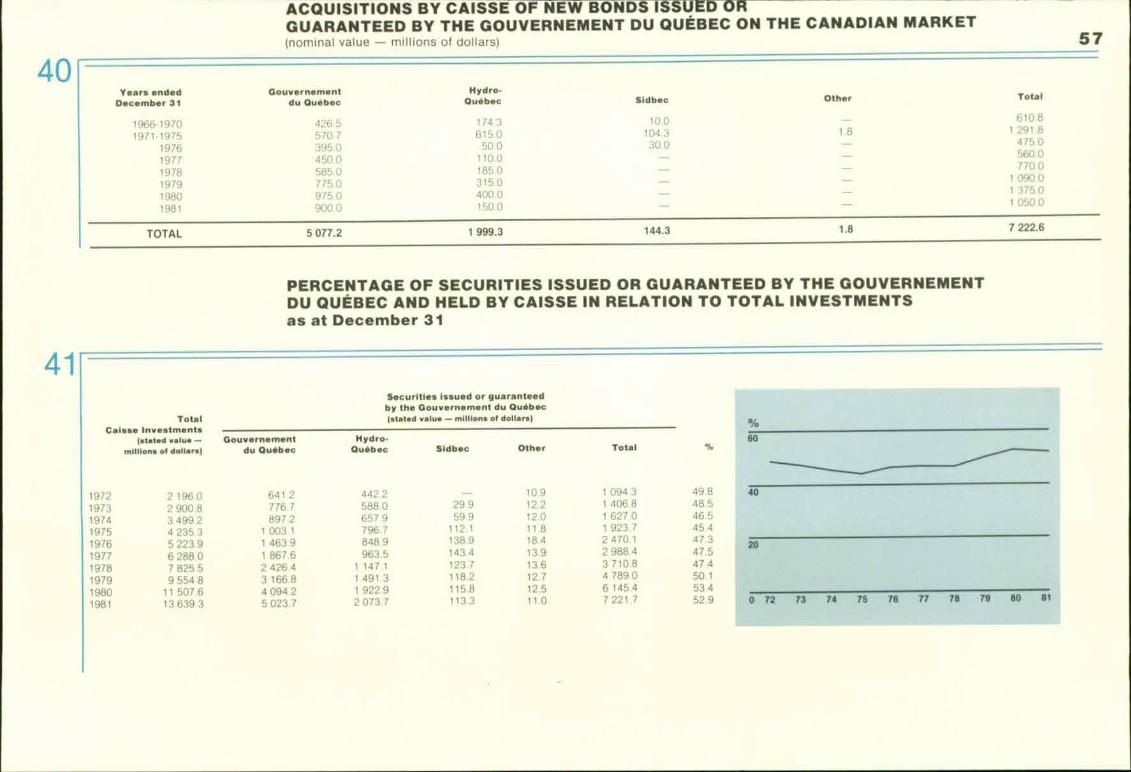
Years endedDecember 31
1966•19701971-1975
197619771978197919801981
TOTAL
Gouvernementdu Quebec
426.5570.7395.0450.0585.0775.0975 0900. 0
Hydro-Quebec
174.3615_0
50.0110.0185.0315.0400.0150.0
Other
Total
610 81.8 1 291 8
475.0560.0770.0
1 090.01 375.01 050.0
1.8 7222.6
Sicibac
10.0104.330.0
5 077.2 1 999.3 144.3
ACQUISITIONS BY CAISSE OF NEW BONDS ISSU D e "
GUARANTEED BY THE GOUVERNEMENT DU QUEBEC ON THE CANADIAN MARKET(nominal value - millions 01 dollars)
PERCENTAGE OF SECURITIES ISSUED OR GUARANTEED BY THE GOUVERNEMENTDU QUEBEC AND HELD BY CAISSE IN RELATION TO TOTAL INVESTMENTSas at December 31
Total'Ga)s*. Investments
(stated value -
millions of dollars)
1972 2 196.01973 2900.81974 3499.21975 4235.31976 5223.91977 628801978 7 825 51979 9 554 81980 11507.61981 13 639 3
Securities issued or guaranteed
by the Gouvernement du Quebec
(sta (ed value - millions of dollars)
Gouvernement
du Quebec
641.2776.7897.2
1003.11 463.91 867.62426Â316684094.25023.7
Hydro•
Quebec
442.2588_0657.97961848.9963.5
1147.11491.31922.92073.7
Sidbec
-29.959.9
112.1138.9143.4123.7118.2115.8113.3
Other
10.912.212.011.818.413.913.612.712.511.0
Total
1 094.31 406.81 627.0192372 470.12988.43 710 84789.06145.47221.7
49.848.546.545.447.347.547.450.153.452.9
60
40
29
0 72 13 74 15 78 77 78 79 80 81

REAL ESTATE INVESTMENTS
STATEMENT OF REAL ESTATE INVESTMENTSOF CAISSE AND SUBSIDIARIESheld at December 31, 1981
Section 46d1 01 the Act respecting Me Caisse de dépôt et placement du Quebec IAS.O. chapter C-21
Netstated
Municipalities Land and buildings Cost value
Directly held by CaisseBale-Comeau Lots (part C-2, C-2-26, C-116, C-158 and C-164), Lafleche District $ 6 071 120 $ 5 999 625Baie d'Urfé Lois (327-1, part 58-1 and part 343). Parish of Sainte-Arme 831 813 759 596Dorval Lois (87 and 88), Parish of Pointe-Claire 725 000 664 253Hauterive Lot (8-1-94-1) Rang 1, Laflèc he Township 31 900 31 900Hauterive Lot (8-1-96) Rang 1. Laflèche Township 33 325Hauterive Lot (8-1-91) Rang 1. Laflèche TownshipHauterive Lot (8-1-98) Rang 1, Laffeche TownshipHauterive Lot (9-1-77) Rang 1, [allèche TownshipJonquiere Lot (29-1) Rang 4, Jonquiere Township
3709323813333° 210640°335110°45° 8
32 41833 116
357933 33204Laval Lois (352-1-19, 20, 21,22), Parish of Saint-Martin 163 828 Laval Lot (616-3). Parish of Saint-Martin 900 000 796 695Laval Lots (616-7, 617-3. 618-12), Parish of Saint-MartinPointe-Claire Lot (130-17). Parish of Pointe-Claire
516076
11
602680 000
11
399575
686
Pointe-Claire Lots (116-7, 117-6), Parish of Pointe-Claire 1 300 000 1 131 188Port-Cartier Lot (6-467). Babel TownshipSainte-Foy Lots (86-51, 87-122. 91-48). Parish of Sainte-FoySaint-Laurent Lots (477-3, 475-413), Parish of Saint-Laurent 1
36653400
421000000 1 51653607 954283921
Sept-lies Lot (369-20) Rang 3, Village of Sept-Iles, Letellier Township371 7356
37 756Sept-lies Lots (369-1,369-2) Rang 3, Village of Sept-lies, Letellier Township 4 9 7 41 937Sept-iles Lot (46) Rang 3, Village of Sept-lies, Letetlier TownshipSherbrooke Lots (113-5-1-1, 113-5-2-1. 113-11, 113-12-1, 113-12-2, 113-22. 113-23), Orford Township 4235° °050°0
30400
500322
Ville Mont-Royal Lot (577-4). Parish of Saint-Laurent 6631 712 639 1 622
18 590 815 17 335 500Held by Cadim Inc.
Charlesbourg Lot (part 271 -90), Parish of Charlesbourg 755 709 755 709
Held by Développements Pasteur Inc.Quebec Lot (407). Parish of Saint-Colomb-de-Sillery 2 116 346 2 116 346
Sainte-Foy Lots (288-9. 288-10. 288-11. part 288). Parish of Sainte-Foy 7 351 836 7 298 807
9 468 182 9 415 153
Held by Immeubles Cadev Inc.
Gaspé Lots (C -5-21, C-5 - 7 -2, C - 5-8 - 1, C - 5 -8 part 5, C - 5-8 part 6) York Township, 5 536 905 5 526 983
Held by Immeubles Cadimont Inc.Montréal Lot (1946). District of Saint -Antoine 9 090 349 9 090 349
TOTAL — LAND AND BUILDINGS 543 441 960 542 123 694
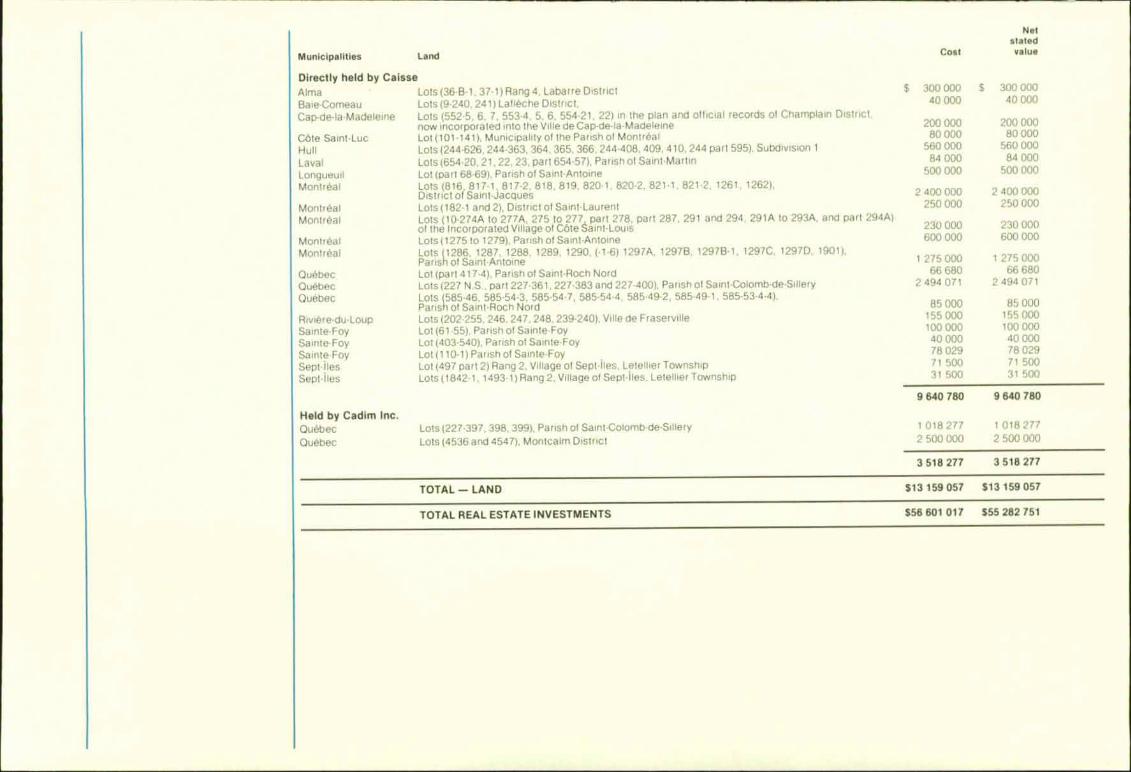
Net.i,ited
Municipalities Land Coal value
Directly held by Caisse
AlmaBaie-Comeau
Lots (36-B-1, 37-1) Rang 4, Labarre DistrictLots (9-240, 241) Lafleche District,
$ 30400 0000001 300 00000040
Cap-de-la-Madeleine
Côte Saint-Luc
Lots (552-5, 6, 7, 553-4, 5, 6, 554-21, 22) in the plan and official records of Champlain District,now incorporated into the Ville de Cap-de-la-MadeleineLot (101-141), Municipality of the Parish of Montreal
200 00080 000
200 00080 000
Hull Lots (244-626, 244-363, 364, 365, 366, 244-408, 409, 410, 244 part 595), Subdivision 1 560 000 560 000
Laval Lots (654-20, 21, 22. 23, part 654-57), Parish 01 Saint-Martin 84 000 84 000
Longueuil Lot (part 68-69), Parish of Saint-Antoine 500 000 500 000
Montréal
Montreal
Lots (816, 817-1. 817-2, 818, 819,820-1, 820-2, 821-1. 821-2. 1261, 1262),District of Saint-JacquesLots (182-1 and 2), District of Saint-Laurent
2 400 000250 000
2 400 000250 000
Montreal Lots (10-274A to 277A, 275 to 277, part 278, part 287, 291 and 294, 291A to 293A, and part 294A)of the Incorporated Village of Côte Saint-Louis 230 000 230 000
Montreal Lots (1275 to 1279). Parish of Saint-Antoine 600 000 600 000
Montreal Lots (1286, 1287, 1288, 1289, 1290, (-1-6) 1297A, 1297B, 1297B-1, 1297C, 12970, 1901),Parish of Saint-Antoine 1 275 0001 275 000
Quebec Lot (part 417-4), Parish of Saint-Roch Nord 66 680 66 680
Quebec Lots (227 N.S., part 227-361. 227-383 and 227-400), Parish of Saint-Colomb-de-Sillery 2 494 071 2 494 071
Quebec Lots (585-46, 585-54-3, 585-54-7, 585-54-4, 585-49-2, 585-49-1, 585-53-4-4).Parish of Saint-Roch Nord 85 000 85 000
Rivière-du-Loup Lots (202-255, 246. 247. 248, 239-240), Ville de Fraserville 155 000 155 000
Sainte-Foy Lot (61-55), Parish of Sainte-Foy 100 000 100 000
Sainte-Foy Lot (403-540), Parish of Sainte-Foy 40 000 40 000
Lot (110-1) Parish of Sainte-Foy 78 029 78 029
SaSept-lies Lot (497 part 2) Rang 2, Village at Sept-ties, Letellier Township 71 500 71 500
Sept-lies Lots (1842-1, 1493-1) Rang 2, Village of Sept-lies, Letellier Township 31 500 31 500
9 640 780 9 640 780
Held by Cadim Inc.Quebec Lots (227-397, 398, 399), Parish of Saint-Colomb-de-Sillery 1 018 277 1 018 277
Quebec Lots (4536 and 4547), Montcalm District 2 500 000 2 500 000
3 518 277 3 518 277
TOTAL-LAND $ 13 159 057 $13 159 057
TOTAL REAL ESTATE INVESTMENTS $56 601 017 $55 282 751
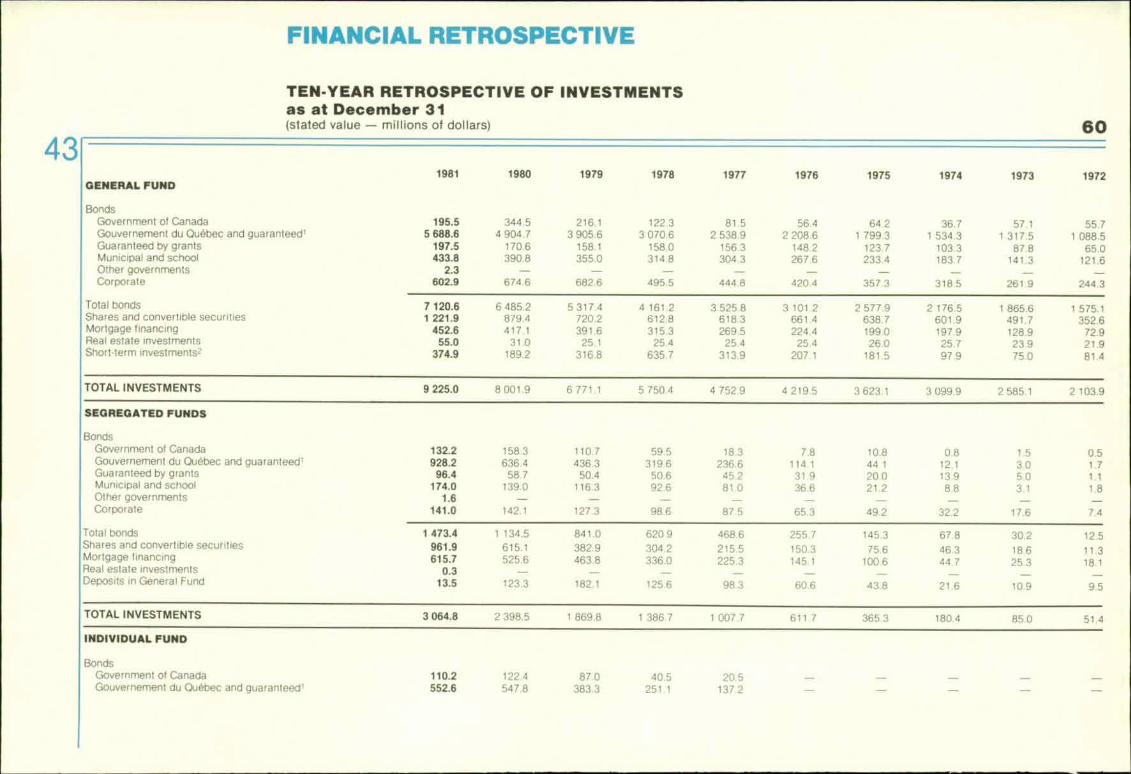
FINANCIAL RETROSPECTIVE
TEN-YEAR RETROSPECTIVE OF INVESTMENTSas at December 31(stated value - millions of dollars)
1979 1978 1975 1974
60
1981 1980 1977 1976 1973 1972GENERAL FUND
BondsGovernment of Canada 195.5 344.5 216.1 122_3 81.5 56.4 64.2 36.7 57.1 55.7Gouvernement du Quebec and guaranteed , 5 688.6 4 904.7 3905.6 3070.6 2 538.9 2 208_6 1 799.3 1 534.3 1 317.5 1 088.5Guaranteed by grants 197.5 170.6 158,1 158.0 156.3 148.2 123.7 103.3 87.8 650Municipal and school 433.8 390.6 355.0 314.8 304.3 267.6 233.4 183.7 141.3 121.6Other governments 2.3 - - - - - - - _ -Corporate 602.9 674.6 682.6 495.5 444.8 420.4 357_3 318.5 261.9 244.3
Total bonds 7 120.6 6 485.2 5317.4 4 161.2 3.525.8 3 101 2 2 577.9 2176.5 1 865.6 1 575 1Shares and convertible securities 1221.9 879.4 720.2 612.8 618.3 661.4 638.7 601.9 491.7 352.i-:Mortgage financing 452.6 417.1 391.6 315.3 269.5 224.4 199.0 197.9 128.9 72 :Real estate investments 55.0 31.0 25.1 25.4 25.4 25.4 26.0 25.7 23.9 21Short-term investments 2 374.9 189.2 316.8 635.7 313,9 207.1 181.5 97.9 75.0 81
TOTAL INVESTMENTS 9225.0 8001.9 6771.1 5 750 4 4 752 9 4 219 5 3 623 1 3 099 9 2585.1 2 103.9
SEGREGATED FUNDS
BondsGovernment 01 Canada 132.2 158.3 110.7 59.5 18.3 7.8 10.8 0.8 1.5 0.5Gouvernement du Quebec and guaranteedl 928.2 636.4 436.3 319.6 236.6 114_1 44_1 12.1 3.0 1.7Guaranteed by grants 96.4 58.7 50.4 50.6 45_2 31.9 20.0 13.9 5.0 1, 1Municipal and school 174.0 139.0 116.3 92.6 81.0 36.6 21.2 8.8 3.1 1.8Other governments 1.6 _ - - - _ - - - -Corporate 141.0 142.1 127_3 98.6 87.5 65_3 492 32.2 17.6 7.4
Total bonds 1473.4 1134.5 841.0 620 9 468.6 255.7 145.3 67.8 30.2 12.5Shares and convertible securitiesMortgage financing
961.9615.7
615,1525,6
382.9463.8
304.2336.0
215.5225.3
150.3145.1
75.6100.6
46.344.7
18,625.3
11.318.1Real estate investments 0.3 - - -
Deposits in General Fund 13.5 123.3 182.1 125.6 98_3 60.6 43.8 21.6 10.9 9.5
TOTAL INVESTMENTS 3 064.8 2 398.5 1 869.8 1 386.7 1 007.7 611.7 365.3 180. 4 85.0 51.4
INDIVIDUAL FUND
BondsGovernment of Canada 110.2 122.4 87.0 40.5 20,5 -a
Gouvernement du Quebec and guaranteed' 552.6 547.8 383,3 251.1 137.2
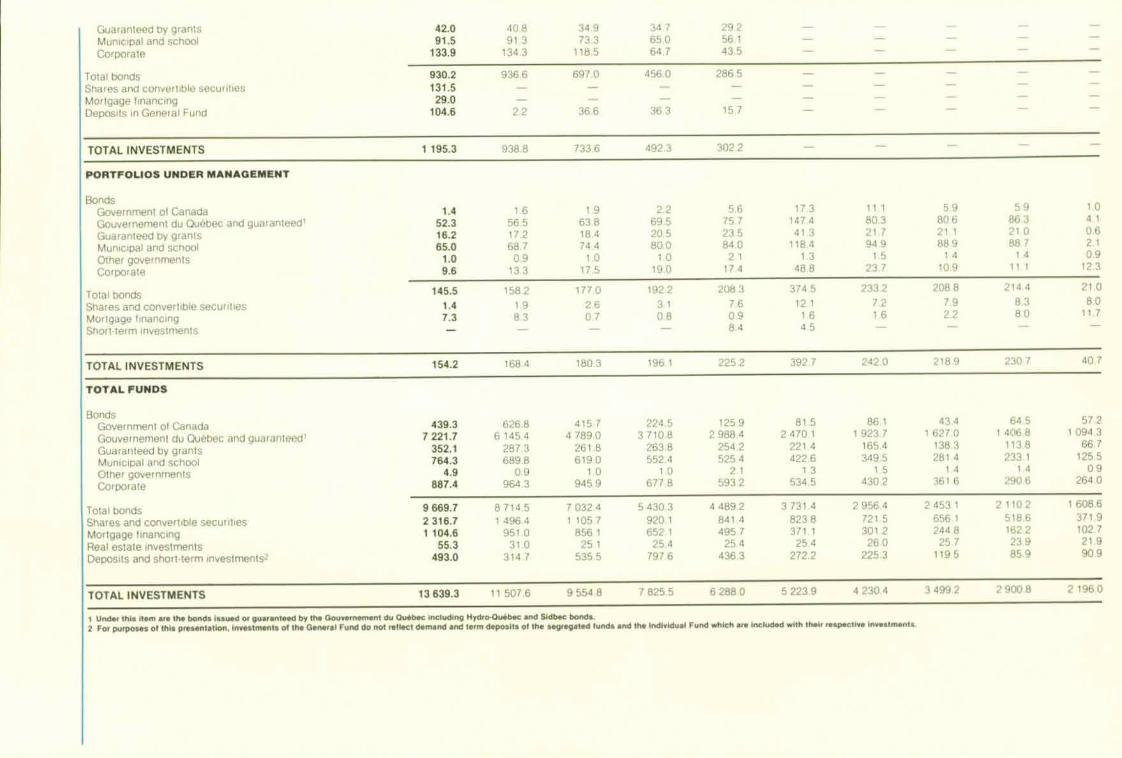
Guaranteed by grants 42.0 408 34.9 341 29.2Municipal and school 91.5 91.3 73.3 65.0 56.1
Corporate 133.9 134.3 118.5 64.7 43.5
Total bonds 930.2 936 6 697.0 456.0 286.5
Shares and convertible securities 131.5 - -Mortgage financing 29.0 - -Deposits in General Fund 104.6 2.2 36.6 36.3 15.7
TOTAL INVESTMENTS 1195.3 938.8 733.6 492.3 302.2
PORTFOLIOS UNDER MANAGEMENT
BondsGovernment of Canada 1.4 1.6 1.9 2.2 5 6 17.3 11.1 5.9 5 9 1.0
Gouvernement du Quebec and guaranteed' 52.3 56.5 63.8 69.5 75.7 147.4 80.3 806 863 4.1
Guaranteed by grants 16.2 17.2 18.4 20.5 23.5 41.3 21 7 21.1 21 0 0.6
Municipal and school 65.0 687 74.4 80.0 84.0 118.4 94.9 88.9 BB 7 2.1
Other governments 1.0 0.9 1.0 1.0 2.1 1.3 1.5 1.4 1.4 0.9
Corporate 9.6 13.3 17.5 19.0 17.4 488 237 10.9 111 12.3
Total bondsShares and convertible securitiesMortgage financing
145.5
1.47.3
158.21.98.3
177.0
2.60.7
192 2
3.10.8
208.3
7.60.9
374.512.1
1.6
233.2
7.21.6
208 8792.2
214.48.380
21.08.0
11.7
Short • term investments - - - - 8.4 4.5 - -
TOTAL INVESTMENTS 154.2 168 4 180.3 196 1 225.2 392.7 242.0 218 (1 230 7 407
TOTAL FUNDS
BondsGovernment 01 Canada 439.3 626.8 415.7 224.5 125.9 81.5 86.1 43.4 64.5 57.2
Gouvernement du Quebec and guaranteed' 7221.7 6 145.4 4789.0 3710.8 2988.4 2 470_1 1 923.7 1 627.0 1 406.8 1 094_3
Guaranteed by grants 352.1 287_3 261.8 263.8 254.2 221.4 165.4 138.3 113.8 66.7
Municipal and school 764.3 689.8 619.0 552.4 525.4 422.6 349.5 281.4 233.1 125.5
Other governments 4.9 0.9 1.0 1_0 2.1 1_3 1.5 1 4 1.4 0_9
Corporate 88 7.4 964.3 945.9 677.8 593.2 534.5 430.2 361.6 290.6 264.0
Total bonds 9669.7 8 714 5 7032.4 5430.3 4 489. 2 3 731.4 2 956 4 2 453 1 2 110.2 1 608_6
Shares and convertible securitiesMortgage financingReal estate investmentsDeposits and short • term tnvestments2
2 316.71104.6
55.3493.0
1 496.4951 0
31.0314.7
1105.7856 1
25..1535.5
920.1652.1
25 4797_6
841.4495.7
25.4436.3
823.8371.1
25.4272.2
721.5301.226.0
225.3
656 1244 8
25.7119 5
518.6162.223.985.9
371.9102.721.990.9
TOTAL INVESTMENTS 13639.3 11 507 6 9 554 8 7 825 5 6 288 0 5 223 9 4 230 4 3 499 2 2 900 8 2 196 0
Under this item are the bonds issued or guaranteed by the Gouvernement du Guebec including Hydro-Ouribec and Sidbec bonds.
2 For purposes of this presentation. Investmenis of the General Fund do not relied l demand and term deposils of the segregated funds and the Individual Fund which are included with their respective investments.
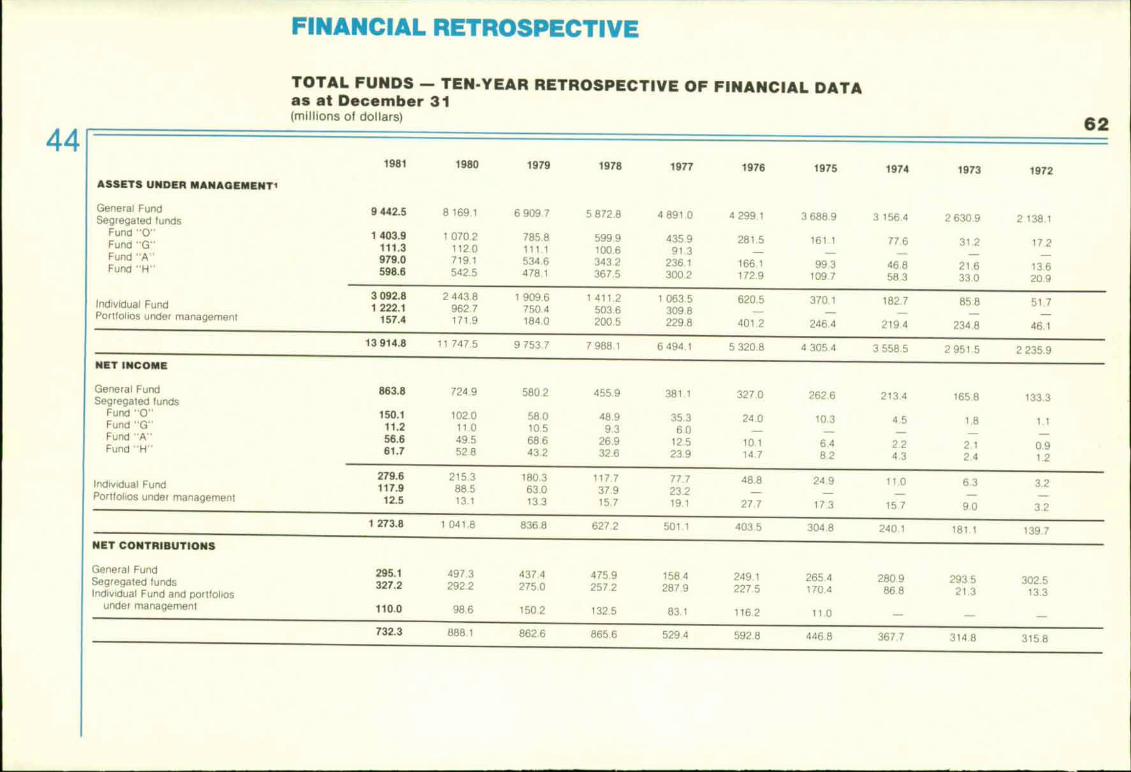
FINANCIAL RETROSPECTIVE
TOTAL FUNDS - TEN-YEAR RETROSPECTIVE OF FINANCIAL DATAas at December 31(millions of dollars)
1977 1976 1975 1974 1973 1972
4 891.0 4 299.1 3 688_9 3 156.4 2 630.9 2 138.1
435.9 281.5 161.1 77.6 31.2 17.291.3 - - - - -
236.1 166.1 99_3 46.8 21.6 13.6300_2 172.9 109.7 58.3 33.0 20.9
1 063.5 620.5 370.1 182.7 85.8 511309.8 - - - -229.8 401.2 246.4 219.4 234.8 46.1
6 494 1 5320.8 4305.4 3558.5 2951.5 2 235.9
381.1 327.0 262_6 213.4 165.8 133.3
35.3 24.0 10.3 4.5 1.8 1.16.0 - - - -
12.5 10.1 6.4 2.2 21 0.923.9 14.7 8.2 4.3 2.4 1.2
77.7 48.8 24.9 11.0 6.3 3.223.219.1 27.7 173 15.7 9.0 3.2
501.1 403.5 304 8 240 1 181 1 139.7
158.4 249.1 265.4 280.9 293.5 302.5287.9 227.5 170.4 86.8 21.3 13,3
83.1 116 2 110
529.4 592.8 446.8 367.7 314,8 315.8
1981 1980 1979 1978
ASSETS UNDER MANAGEMENT1
General Fund 9 442.5 8 169.1 6 909.7 5 872.8Segregated funds
Fund -0" 1 403.9 1 070.2 785.8 599.9Fund "G" 111.3 112.0 111.1 100.6Fund "A" 979.0 719.1 534.6 343.2Fund "H" 598.6 542.5 478.1 367.5
3 092.8 2 443.8Individual Fund 1 222.1 962.7
Portfolios under management157.4 171.9
1 909.6 1 411.2
750_4 503.8
184.0 200.5
13914,8 11 747 5 9 753.77988.1
NET INCOME
General FundSegregated funds
Fund "0"Fund "G"Fund -A"Fund "H"
863.8
150.111.256.661.7
724.9 580.2
102.011.049.552.8
58.010.568.643.2
455.9
48.99.3
26.932.6
Individual FundPortfolios under management
279.6117.912.5
215.388.513.1
180.363.013.3
117.737.915.7
1 273.8 1 041.8 836.8 627.2
NET CONTRIBUTIONS
General FundSegregated fundsIndiv dual Fund and portfolios
under management
295.1 497.3 437.4 475.9
327.2 292.2 275.0 257.2
110_0 98.6 150.2 132.5
732.3 888 1 862.6 865.6
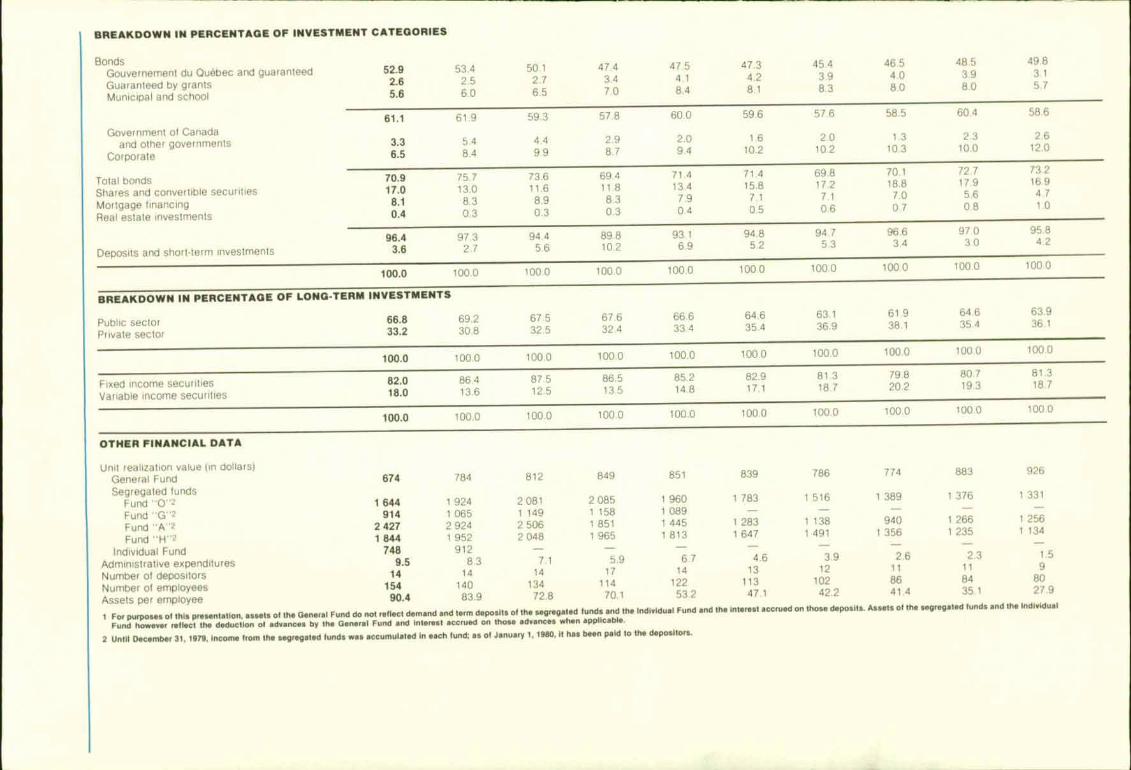
47 43.47.0
46.54.08.0
45.43.98.3
47.34.28.1
47.54.18.4
50.12.76.5
53.42.56.0
52.92.65.6
59.3 57.8 57.6 58.5 60.4 58.660.0 59.661.161.9
2.9 2.0
8.7 9.4
Government of Canadaand other governments
Corporate
3.3 5.4 4.4
6.5 8.4 9.9
1.6 2.0 1.3 2.3 2.6
10.210.2 10.3 10.0 12.0
97,3 9442. 7 5.6
94.8 94.7
5.2 5.389.8 93.110.2 6_9
96.6 97.0 95.8
3.4 3.0 4.296.4
Deposits and short-term investments 3.6
100.0 100.0 100.0 100.0 100.0 100 0100.0 100 0100.0 100.0
86.4 87.5
13.6 12.5
82.9 81.3
17.118.786.5 85.2
13.514879.8 80.7 81.3
20.2 19.3 18.7Fixed income securities 82.0
Variable income securities 18.0
BREAKDOWN IN PERCENTAGE OF INVESTMENT CATEGORIES
BondsGouvernement du Quebec and guaranteedGuaranteed by grantsMunicipal and school
48.5 49.83.9 3.18.0 5_7
Total bondsShares and convertible securitiesMortgage financingReal estate investments
BREAKDOWN IN PERCENTAGE OF LONG-TERM INVESTMENTS
66.8 69.2 67.5 67.6 66.6 64.6 63.1 61.9 64.6 63.9
33.2 30.8 32_5 324 33.4 35_4 36_9 38.1 35_4 36.1
100.0 100.0 100.0 100.0100.0 100.0 100.0 100.0 100.0 100 0
100.0 100.0 100.0 100.0 100.0 100.0 100.0 100.0 100.0 100.0
OTNEFI FINANCIAL DATA
Unit realization value tin dollars)
General Fund 674 784 812 849 851 839 786 774 883 926
Segregated funds
Fund "0" 2 1 644 1 924 2 081 2 085 1 960 1 783 1 516 1 389 1 376 1 331
Fund "G -2 914 1 065 1 149 1 158 1 089 _ _ _ _
Fund "A" 2 2 427 2 924 2 506 1 851 1 445 1 283 1 138 940 1 266 1 256
Fund "H" 2 1 844 1 952 2 048 1 965 1 813 1 647 1 491 1 356 1 235 1 134
Individual Fund 748 912 - - - - - - - -
Administrative expenditures 9.5 8.3 7.1 5.9 6.7 4 6 3.9 2.6 2.3 1.5
Number of depositors 14 14 14 17 14 13 12 11 11 9
Number of employees 154 140 134 114 122 113 102 86 84 80
Assets per employee 90.4 83.9 72.8 70_1 53.2 47 1 422 41.4 35.1 27.9
1 For purposes of this presentation. assets of the General Fund do not reflect demand and term deposits of the segregated funds and the Individual Fund and the interest accrued on those deposits Assets of the segregated hinds and the Individual
Fund however reflect the deduction of advances by the General Fund and interest accrued on those advances when applicable_
2 Until December 31. 1979. Income from the segregated funds was accumulated in each fund: as of January 1. 1980,11 has been paid to the depositors.
Public sectorPrivate sector
73.216.94,71.0
72.717.95.60.8
71.415,8
7 10.5
69.817_2
7.10.6
70.118.8
7.00.7
71.413.47.90.4
73.611.68.90.3
69.411.88.30.3
75.713.08.30.3
70.917.0
8.10.4

MANAt.„Eri ENT STAFF
64
Jean CampeauChairman of the Board andGeneral Manager
André BaronDirector — Placementsimmobiliers (Montréal region)
Michel BastienDirector — Investissements enactions
Yves BenoitDirector — Ressourcesinformatiques
Gerard J. BlondeauDirector — Communications
Jacques BouréDirector — Placementshypothécaires
Marcel CamuSecretary
Marcel CazavanSpecial Advisor to the Chairmanand General Manager
Denise Simard ChapulDirector — Services auxdéposants
Dominique ColardDirector — Placementsimmobiliers
Serge DesjardinsDirector — Verification interne
Pierre DufresneSenior Investment Analyst —Investissements en actions
Jacques DumontPortfolio Manager — Placementsen obligations
Jean FaubertPortfolio Manager —Investissements en actions
Pierre GarceauManager Encaisse et valeurs àcourt ferme
Philippe GirardPortfolio Manager —Investissements en actions
Denis GirouxPortfolio Manager — Participationsspéciales
Reynald N. HarpinChief — Service de la recherche— Investissements en actions
Georges HebertChief — Service exploitation etentretien des systèmes
Louis JournaultChief — Planification desinvestissements
Jean LabrecqueDeputy General ManagerValeurs à revenu fixe
Claude L. LangevinPortfolio Manager —Investissements en actions
Pierre E. LangloisDeputy General Manager —Administration
Serge LeclercAdvisor — Participations spéciales
Cody LienhardDirector — Ressourcesmatérielles
Pierre MayerChief Economist and Director —Éludes économiques
Bernard RangerChief — Service juridique,Placements hypothécaires
Yvon SauvageauDirector — Placements enobligations
Jean -Claude ScraireLegal Advisor
Alain TessierDirector — Ressourcescomptables
Jean TrudelDirector — Souscription à forfaitLouise M. ZakaibDirector Ressources humaines

E EnglishE French
Name
Title
Firm
ProvinceCity
Postal code
Caisse de dépôt et placement du QuebecAnnual Report 1981
Please check the appropriate box if you wish an additional copy of this annual report. in English or in
French. Kindly fill in your name and address and return this selt-addressed and stamped card.
Address
Design and printing:Therien Freres Limitée
Photography:Jean-Pierre Beaudin
Legal Deposit — 1982Bibliothèque nationale du Quebec
Lea Canada
Should you wish an additional copy01 this report, please fill in the cardor forward your request to:
Direction des communicationsCaisse de dépôt et placementdu Quebec1200, La Tour de la BourseMontreal (Quebec)H4Z 1B4Telex: (CDPOMTL) 055-61874Telephone: (514) 873-2460Ce rapport est disponible enfrançais sur demande.
Publication of the Annual Reportwas coordinated by the Directiondes communications.
This report is printed on Canadianpaper. The cover is lithographedon Domtar Byronic Cover 130 Mstock; the report section onRolland Renaissance Offset 160 M;the financial statements and thefinancial statistics on DomtarByronic Text 140 M.

ISBN 2-400-00050-6ISSN 0481-309X