université des sciences et de la technologie houari...
TRANSCRIPT


Ministère de l’Enseignement Supérieur et de la Recherche Scientifique
Université des Sciences et de la Technologie Houari Boumédiène
Laboratory for Research in Artificial Intelligence(LRIA)
Artificial Intelligence
Doctorials
LRIA, USTHB
May 20-21, 2012
Algiers, Algeria
© LRIA, USTHB, Algiers, Algeria 2012
201 2
PROCEEDINGS


AID’2012 May 20-21, 2012
Table of Contents
Welcome message from the conference chair......................................................................................................................... 6 Prof. Habiba DRIAS
Message from the program chair................................................................................................................................................ 7 Prof. Ahmed GUESSOUM
Program and organizing committees........................................................................................................................................ 9
Invited Speakers Scalable Exploration of Large Datasets....................................................................................................................... 11 Prof. Daniel BOLEY
Planning and Learning in Multi-Agent Environments: Theory and Practice.................................................. 12 Prof. Brahim CHAIB-DRAA
Allocation of time-extended tasks via auctions........................................................................................................ 13 Prof. Maria GINI
Clustering Algorithms...................................................................................................................................................... 14 Dr. Nadjet KAMEL
Image Analogies................................................................................................................................................................. 15 Prof. Slimane LARABI
Data Intensive Computing.............................................................................................................................................. 16 Prof. Farid MEZIANE
Bioinformatics: past, present and (likely) short term future................................................................................. 17 Dr. Mathieu RAFFINOT
StudentLong Papers
A Feature Generation Method Based on the Contourlet Transform for Offline Handwritten Signature Verification.................................................................................................................................................. 19
Assia HAMADENE and Youcef CHIBANI
A Similarity Distances and DTW in Handwritten Arabic Word Image Retrieval by Word Spotting.............................................................................................................................................................................. 29
Youcef BRIK and Youcef CHIBANI
A Hybrid Approach to Arabic Text Categorization....................................................................................... 39 Riadh BELKEBIR and Ahmed GUESSOUM
Genetic, Immune and Classification Algorithms for Bitmap Join Index Selection........................ 51 Amina GACEM, Billel SAM, Kouceyla HADJIand Kamel BOUKHALFA
A Genetic Algorithm to Solve University Timetabling Problem............................................................. 63 Alaa Eddine BELFEDHAL
Economic Power Dispatching with Firefly Algorithm................................................................................. 73 Latifa DEKHICI, Khaled BELKADI and Abdelmoumene DEKHICI
Robust Particle Filtering with Multiple-Cues for Non-rigid object Tracking................................... 81 Fouad BOUSETOUANE and Lynda DIB
Use of the formal models in Computer Science Security........................................................................... 91 Naouel OUROUA andMalika IOUALLALEN_BOUKALA
Tools of Graph-based Model Transformation: Comparative Study....................................................... 103 Asmaa AOUAT, El abbassia DEBA and Fatima BENDELLA
The Organization Based Access Control: An Overview.............................................................................. 111 Ouarda BETTAZ
StudentShort Papers
Description and Classification of Semantics Web Services....................................................................... 123 Fatima BEDAD, Aek HAOUAS and Djelloul BOUCHIHA
Integrating agents in loosely coupled inter-organizational workflow................................................. 129 Khellaf BENFIFI
Pattern Matching........................................................................................................................................................... 135 Ibrahim CHEGRANE and Meriem BELOUCIF
Modeling of the reactive navigation of Autonomous Robot Using the Discrete EVent system Specification DEVS....................................................................................................................................................... 141
Kadda MOSTEFAOUI and Youcef DAHMANI
An approach Cloud computing based mobileagents for discovery of web services..................... 147 Hamza SAOULI, Okba KAZAR, Aïcha-Nabila BENHARKAT and Youssef AMGHAR
Previous Doctorials
How to conduct doctoral research…………………………………………………………………………………………………………………….… 158 Dr. Thouraya BOUABANA-TEBIBEL

De la recherche orientée requête vers la recherche orientée contexte…………………………………………………………. 159 Prof. Mohand BOUGHANEM
The future computing ……………………………………………………………………………………………………………………………………………. 160 Prof. Habiba DRIAS
Variety of meta-heuristics based on genetic algorithms to solve a generalized job-shop scheduling problem…………………………………………………………………………………………………………………………………………………………………….. 162
Dr. Fatima GHEDJATI
A concise introduction to machine learning……………………………………………………………………………………………………... 163 Prof. Ahmed GUESSOUM
Analysis and modeling of semantic information………………………………………………………………………………………………. 164 Dr. Selma TEKIR

6
AID’2012 May 20-21, 2012
Welcome message from the conference chair
Dear AID 2012 Attendees,
t is my pleasure to welcome all the participants to the artificial
intelligence doctoral conference, namely AID 2012. In particular, it
is with a great honor that I express my warmest welcome to the
keynote speakers who accepted to give an invited lecture and who have
made long trips to attend this event.
AID is organized by the laboratory of research in artificial intelligence
(LRIA) and is held for the second time at USTHB. It aims at bringing
together Ph.D. students with leading intellectuals in the field of
artificial intelligence research. It is expected that AID 2012 offers them a
special opportunity to discuss their doctoral works and get from
professionals interesting feedbacks with new ideas and hints to
undertake their thesis in an efficient way. In addition it helps to keep
them abreast of the latest developments in the area of artificial
intelligence.
As we have a busy schedule during these two days, let me ask you
please to take a few minutes to read the program and be on time at
each activity. On the other hand, if we can do anything to make your
stay more pleasant, please don’t hesitate to let us know.
At last, let me express my profound gratitude to the organizing group
for having used their best endeavors to the success of the event. I also
thank the program committee and the external reviewers for their
contribution to evaluate the submissions. My special thanks go to the
keynote speakers Daniel Boley, Brahim Chaib Draa, Maria Gini, Nadjet
Kamel, Slimane Larabi, Farid Meziane and Mathieu Raffinot for the
quality of their talks and the authors for their hard work. Thanks also to
USTHB leaders who helped in terms of logistics.
Finally we look forward to spending this happy event with you at
USTHB. Thank you for joining AID 2012, we sincerely hope you will
enjoy your stay and wish you a fruitful scientific meeting.
Conference Chair.
I
Prof. Habiba DRIASLRIA, USTHB, Algiers.
Conference Chair
7
AID’2012 May 20-21, 2012
Message from the program chair
Dear AID’2012 participants,
t gives me great pleasure to welcome you all to the 2nd Artificial
Intelligence Doctorials held at the University of Science and
Technology Houari Boumediene, Algiers, Algeria.
This conference has been designed to give doctoral students an
opportunity to broaden their scientific horizons by attending lectures
given by invited speakers on varied topics, to present their own
research work, and, not least, get a chance to interact with researchers
in AI and exchange ideas about their research work and problems of
interest.
I am delighted that the invited speakers for this year are very
impressive, each of them having an excellent track record in his or her
own field of research. Professor Maria Gini, from the University of
Minnesota, is a distinguished researcher, well known for her work on
Autonomous Agents. Professor Daniel Boley, also from the University
of Minnesota, is known for his work on numerical linear algebra
methods for control problems and has more recently been involved in
research on computational methods in statistical machine learning,
data mining, and bioinformatics. Professor Brahim Chaib-draa from
Laval University, Québec, currently works on prediction and estimation
for dynamic systems, Bayesian reasoning and machine learning, and
game theory. Professor Farid Meziane from Salford University focuses
on data mining, mainly in business intelligence and the semantic Web.
Dr. Mathieu Raffinot is a researcher at the Laboratoire d'Informatique
Algorithmique: Fondements et Applications (LIAFA) in Paris. His main
research interests are algorithmics and computational biology. Two of
the invited speakers come from Algeria. Professor Larabi from USTHB
does research on Image processing and video Analysis, including
aspects of human action recognition, knowledge modeling and
representation for computer vision. Dr. Nadjet Kamel from the
University Farhat Abbes of Setif has a long experience in research on
Artificial Intelligence techniques and formal methods.
I
Prof. Ahmed
GuessoumLRIA, USTHB, Algiers.
Program Chair

8
AID’2012 May 20-21, 2012
You can clearly see that one could not easily bring together such a
distinguished group of speakers to talk about such thrilling research
topics. On behalf of the program Committee, I thank them all most
sincerely for having accepted our invitation and wish them a
memorable stay in Algeria and a most productive conference.
As to the doctoral student presentations, they have indeed been
planned to be an encouragement to some of them to present their
research work and discuss it with the experts present at the conference.
It is true that we have given a sizeable part of the conference to the
invited speakers, but this has been planned so for the benefit of the
doctoral students, and the rest of us. Nevertheless, we have also
planned for 10 doctoral student presentations and 5 papers to be
presented as posters. These papers have been selected out of 20 papers
that were submitted to the conference.We should point out that we did
not intend to get a large number of papers, and have thus limited the
publicity effort to its strict minimum. In spite of this, we have received
papers from nine different universities!
The reviewers have done an excellent work in terms of the feed-back
they have given to the paper authors, although the decisions were not
meant to be very strict, so as to give a chance to the doctoral students
to gain from the experience. The quality of the papers remains overall
good! I hope AID’2012 will have been a success on this front, making the
students fully benefit from both the process and the outcome.
Last but not least, I would like to express my deepest gratitude to each
of the Program Committee members as well as the additional reviewers,
who have patiently worked under strict time constraints and have been
very helpful and constructive.
We all look forward to having very enriching days of scientific
interaction as well as very pleasant moments in Algiers.
Program Committee Chair.

9
AID’2012 May 20-21, 2012
Program and Organizing Committees
Conference Chair
Prof. Habiba Drias, LRIA, USTHB, Algeria.
Program Committee Chair Prof. Ahmed Guessoum, LRIA, USTHB, Algeria.
Program Committee
Dr. Saliha Aouat Dr. Fatima Zohra Belkredim
Dr. Nacera Bensaou Dr. Thouraya Bouabana Tebibel (ESI, Algiers)
Dr. Dalila Boughaci Dr. Narhimene Boustia
Prof. Habiba Drias Dr. Mohamed Feredj
Prof. Ahmed Guessoum Dr. Nadjet Kamel Dr. Samir Kechid
Dr. Faiza Khellaf-Haned Prof. Slimane Larabi Dr. Fatiha Mamache
Prof. Aicha Mokhtari-Aissani
Additional Reviewers Dr. Hakim Ait Zai
Mrs. Sadjia Baba-Ali Prof. Youcef Chibani Mr. Boualem Laichi
Mr. Hamid Necir Mrs. Zahia Tamen
Organizing Committee Chair
Dr. SalihaAouat, LRIA, USTHB, Algeria.
Organizing Committee Co-Chair Ms. Hadia Mosteghanemi, LRIA, USTHB, Algeria.
Organizing Committee Mr. Riadh Belkebir
Mr. Yakoub Bouchenine Ms. Aicha Boutorh
Mr. Mohamed Lamine Chemchem Mr. Youcef Djenouri
Mr. Izem Hamouchene Mr. Ilyes Khennak
Ms. Hadjer Lacheheb Ms. Samia Meddour

10
Invited Speakers AID’2012

11
AID’2012
May 20-21, 2012
Scalable Exploration of Large Datasets
Abstract With the explosive growth of data sets, semi-automated methods to explore
and visualize large unstructured data sets are essential. We present some
techniques to explore such data sets to find hidden structures, patterns,
and/or anomalies. Some examples from the author's own work in text data-
mining and bioinformatics are used to illustrate the methods.
Biography
aniel Boley received his Ph.D. degree in Computer Science from Stanford University
in 1981. Since then, he has been on the faculty of the Department of Computer
Science and Engineering at the University of Minnesota, where he is now a full
professor.
Dr. Boley is known for his past work on numerical linear algebra methods for control
problems, parallel algorithms, iterative methods for matrix eigenproblems, inverse problems
in linear algebra, as well as his more recent work on computational methods in statistical
machine learning, data mining, and bioinformatics. His current interests include the analysis
of networks and graphs as those arising from metabolic biochemical networks and networks
of wireless devices.
He has been an associate editor for the SIAM Journal of Matrix Analysis and has chaired
several technical symposia at major conferences.
D
Prof. Daniel BOLEY University of
Minnesota, USA.

12
AID’2012
May 20-21, 2012
Planning and Learning in Multi-Agent
Environments: Theory and Practice
Abstract This talk will cover a large part of the research that we did in the context of
multiagent systems where different agents interact so that they can
cooperate, compete or simply coexist. In particular, I will focus on (i)
Coordination between agents; (ii) Communication among agents and (iii)
Planning and Learning in multiagent environments. For each of these
aspects, I will present the methods that we developed, the applications that
we addressed and the experimental results that we get.
Since our current work is on repeated games, I will dedicate a part of the talk
to our recent result on approximating the set of subgame-perfect equilibria
(SPE) in discounted repeated game. I will explain the algorithm sustaining
this approximation and how it has been extended so that it can embrace all
equilibria. Finally I will show experimental results and explain how our
approach can be used for (i) collusion between agents; (ii) bargaining and
negotiation; (iii) emergence and maintenance of cooperation; (iv) prediction
of artificial and human players’ behavior.
Biography
rahim Chaib-draa received the "Ingénieur" degree from ÉcoleSupérieured'Électricité
(SUPELEC) Paris (France) in 1978, and the PhD degree from Université du Hainaut-
Cambrésis, Valenciennes (France) in 1990. He has been employed on many projects in
Europe, Africa and in North America. In 1990, he joined the Computer Science & Software
Engineering (CSSE) Department of Laval University, Québec, Canada, where he is Professor
and Leader of the Decision, Adaptation, Multi-Agents (DAMAS) group. His current research
interests turn around, prediction and estimation for dynamic systems, Bayesian reasoning and
machine learning, game theory.
B
Prof. Brahim
CHAIB-DRAA LavalUniversity,
Québec, Canada.

13
AID’2012
May 20-21, 2012
Allocation of time-extended tasks via auctions
Abstract Auctions are commonly used to buy and sell items, but traditional auctions
are not set up to account for time, location or interdependence constraints.
In this talk we explore how to extend auctions for allocating tasks to several
roving agents, where the tasks must be carried out (1) within specified time
windows, (2) at specific locations, and/or (3) in a certain partial order. We
show how adding these constraints increases the computational complexity,
both for the bidders who must formulate bids consistent with their own
time and space constraints, and for the auctioneer who must select winning
bids that collectively satisfy the constraints. We cover different ways of
conducting auctions ranging from auctioning all the tasks at once to
auctioning them one at a time and present experimental results.
Biography
aria Gini is a Professor in the Department of Computer Science and Engineering
at the University of Minnesota.
Her specialty is the study of the design of autonomous systems that are capable of making
intelligent decisions. This includes autonomous economic agents, allocation of tasks to agents
and robots, learning of opponent behaviors, and teamwork among agents.
She has coauthored over 200 technical papers. She is on the editorial board of numerous
journals, including the Journal of Autonomous Agents & Multi-Agent Systems, Web
Intelligence and Agent Systems, Robotics and Autonomous Systems, and Integrated
Computer-Aided Engineering. She is a Fellow of the Association for the Advancement of
Artificial Intelligence, a Distinguished Scientist of the Association for Computing Machinery,
and a Distinguished Professor of the College of Science and Engineering at the University of
Minnesota.
M
Prof. Maria GINI University of
Minnesota, USA.

14
AID’2012
May 20-21, 2012
Clustering Algorithms
Abstract Clustering is an unsupervised learning problem. It deals with finding groups
of similar objects in a collection of unlabelled data. These groups are called
clusters. Objects in the same cluster are similar and those of different
clusters are dissimilar. The problem of clustering is seen as a multi-objective
optimization problem that minimizes the distance between the objects of
the same cluster and maximizes the distance between objects of different
clusters. These clustering algorithms are widely used in many fields such as
information retrieval, image analysis, social networks, etc… They use
features to represent objects, and a distance to measure the similarity
between these objects. Many clustering algorithms are proposed in the
literature. They are classified, mainly, into hierarchical and partitioning
algorithms. This talk will introduce the clustering algorithms by illustrating
the principal concepts such as distance and similarity, and giving some
examples of hierarchical and partitioning algorithms.
Biography
adjet Kamel is an associate professor at the department of computer sciences of the
University Farhat Abbes of Setif (UFAS), Algeria, since September 2011. She received
her Magister and the PhD degrees in Computer Science from the University of
Science and Technology Houari Boumediene (USTHB), Algeria, respectively in 1995 and 2007.
She has been a Postdoctoral Researcher at the University of Moncton, in Canada from August
2007 to August 2009 and a Lecturer at the USTHB from 1995 to 2007. From 2009 to 2011 she
was an associate professor at the same university. She has been involved in many research
projects. Since 2011, she is the head of the team research “Data Mining and Machine Learning”
at the Laboratory of Research in Artificial Intelligence (LRIA-USTHB) at USTHB. Her main
interests are related to Artificial Intelligence techniques and formal methods. She participated
to the organisation of many international conferences and workshops (ICMWI’10,
CCECE’2008, CCECE’2009, SEPS’08, SOMITAS’08, …).
N
Dr. Nadjet KAMEL Ferhat AbbasUniversity,
Setif,Algeria.

15
AID’2012
May 20-21, 2012
Image Analogies
Abstract Contour detection is an important task in many computer vision
applications such as object recognition, motion, medical image analysis,
image enhancement and image compression. There is wide range of
methods in the literature devoted to contour detection [Ziou and Tabbone
1998], [Freixenet et al 2002], [Suri et al 2002], [Papari and Petkov 2011]. The
main problem that has been dealt with in the literature is the modeling of
the contour pixel. However, humans can do easily this and results are known
to be very similar from person-to-person.
Image analogies has been successfully used for super-resolution, texture and
curves synthesis and interactive editing constitutes a natural means of
specifying filters and image transformations [Hertzmann et al 2001]. The aim
of this work is to introduce image analogies in early stages of computer
vision, to model human expertise and to pass it to the computer for contour
detection.
Given such a reference image, we present a new method based on the
learning of this expertise to locate outlines of a query image in the same way
that it is done for the reference (i.e. by analogy). We then show that
generated patterns used as reference images (instead of real images alone)
enable contour location at different scales independently of the light
conditions present in the real images. Comprehensive experiments are
conducted on different data sets (BSD, CAVIAR and PETS 2009). The
obtained results show superior performance via precision and recall vs.
hand- drawn contours at multiple resolutions to the reported state of the
art.
Biography
limane Larabi received Ph.D. in Computer Science from the National Institute
Polytechnic of Toulouse, France, 1991. In January 1992, he joined the computer Science
Department of the University of Science and Technology Houari Boumediene, Algiers,
Algeria where he is currently Professor and leads research in Computer Vision Group of the
Laboratory of Artificial Intelligence Research.
His work spans a range of topics in vision including Image description, Human action
recognition, Head and Body pose estimation, Video Analysis, Knowledge modeling and
representation for computer vision. He has written several research papers and supervised
several PhD. He has also conducted several national research projects.
S
Prof. Slimane
LARABI U.S.T.H.B., Algeria.

16
AID’2012
May 20-21, 2012
Data Intensive Computing
Abstract It was argued that the fourth paradigm of scientific discovery is dealing with
large sets of data. In the last few years, large amounts of data are collected
and produced on a 24/7 basis from various instruments, computer systems
and models, organisations and the society in general. Unfortunately, our
capacity to generate data far outstrips our ability to analyse and exploit it.
The collected data requires validation, tagging, analysis and integration to
add an economic value and to fuel scientific and economic growth. In order
to achieve these goals, tools to exploit, visualise and incorporate data in
decision making processes need to be developed. In general, Data intensive
computing aims at developing systems that have the ability to infer meaning
from data and allow stakeholders to take action based on that meaning.
Some application include the use of data mining to identify diseases using
for example patients diseases; The use of data to model global warming and
predict future patterns and business intelligence. This seminar will
introduce the concept of data intensive computing and explore applications
in the fields of marketing and economic growth, interoperability between
systems and application in large cities management.
Biography
arid Meziane is a Reader in computer science, head of the data mining and pattern
recognition research centre and the associate head of school international in the
school of computing, Science and Engineering, the at the University of Salford, United
Kingdom. He received the Ingénieur d’état degree in computer science from the National
Institute for Computer Science and a PhD in Computer Science from the University of Salford
in 1994. His research interests are in the areas of software engineering and data mining. In
software engineering, his interest is on the integration of formal methods in the software
development process and in data mining his research is mainly in business intelligence and
semantic Web. His research is published in journals that include the Annals of Software
Engineering, the Computer Journal and the Journal of the Operational Research Society. He
was awarded the highly commended award from the literati club in 2001 for a paper published
in the Integrated Manufacturing Systems Journal. He is in the programme committee of many
international conferences, a reviewer for the data and knowledge engineering journal and in
the editorial board of the International Journal of Information Technology and Web
Engineering.
He was the programme chair and the organiser of the 9th International Conference on the
Application of Natural Language to Information Systems (NLDB04). He is a fellow of the
British Computer Society.
F
Prof. Farid
MEZIANE Salford
University,United

17
AID’2012
May 20-21, 2012
Bioinformatics: past, present and (likely) short
term future
Abstract Bioinformatics is a research field which is growing from the early 1970's since
its brings many new computational techniques that are of main importance
in many of the result obtained in molecular biology and pharmacology these
last years. In this talk I will present a global picture of the state of
bioinformatics and computational biology field, from the early 1970's to
nowadays. I will then outline research avenues that should become very
important in the near future.
Biography
athieu Raffinot received his Ph.D. in theoretical computer science at the
University of Marne-la-Vallée in 1999.
Since October 2000 he has worked as a CNRS bioinformatics researcher, at the Laboratoire
Génome et Informatique first, then from 2005 to 2007 at the Laboratoire Poncelet in the
Independent University of Moscow and eventually in the Laboratoire d'Informatique
Algorithmique: Fondements et Applications (LIAFA) in Paris. His interest include design and
analysis of algorithms, pattern matching, and computational biology. He is the co-author of
numerous articles in international conferences and journals in computer science and
bioinformatics, and he also has worked as an expert for bionformatics companies, including
GenomeQuest.
M
Dr. Mathieu
RAFFINOT Université Paris
Diderot, France.

18
Student Long Papers AID’2012

19
AID’2012
May 20-21, 2012
A Feature Generation Method Based on the Contourlet Transform for Offline Handwritten Signature
Verificationé
Assia HAMADENE and Youcef CHIBANI
Speech Communication and Signal Processing Laboratory Faculty of Electronics and Computer Science
University of Science and Technology Houari Boumediene (USTHB) 32, El Alia, Bab Ezzouar, 16111, Algiers, Algeria
[email protected] , [email protected]
[email protected],[email protected]
Abstract. We propose in this work a new feature generation method based on the contourlet transform (CT) for offline handwritten signature verification (HSV). CT allows generating coefficients that inform on the importance of the contours on each direction. In order to generate a reduced size of the feature vector, we exploit the handwriting style directions using both structural and statistical features without preprocessing. The CT allows characterizing the structural features to capture the smooth contours in several directions. While, the statistical features are defined via normalized energies which describe the level of information contained in each direction of the signature. The resulting feature vector size equals the direction’s number used while generating CT coefficients. Experiments are conducted on the well known CEDAR database. Efficiency of the proposed method is evaluated through the support vector machines (SVM) classifier. The obtained results show that our approach is more effective compared to the state of the art.
Keywords.Image and signal processing, Contourlet transform, offline handwritten signature verification, Support Vector Machines, normalized energy.
1 Introduction
The handwritten signature verification (HSV) is a discipline which aims to validate the identity of writers according to the handwriting styles (Xu et al, 2007). It is one of the most widely used for being simple, inexpensive, and acceptable from society. However, it also represents one of the easiest breakable security systems compared to the physiological biometric ones, since signatures can easily be imitated. Hence, the signature verification is still an open problem because a signature is judged to be genuine or a forgery only on the basis of a few reference specimens (Pourreza et al, 2009; Pirlo and Impedovo, 2008). Furthermore, a same writer can sign differently depending on his or her state of emotion.

20
AID’2012
May 20-21, 2012
The design of a Handwritten Signature Verification System depends on the acquisition mode of the signature. The first mode, called on-line or dynamic acquisition, allows capturing some dynamic characteristics of the written style such as velocity, pressure, and acceleration. The second mode, called off-line or static acquisition allows generating an image, which represents a more difficult task due to the disappearance of dynamic features. However, this mode is still the most applicable in daily cases.
Generally, the signature verification has three main stages :data acquisition and preprocessing, feature generation, and classification.During the classification stage , personal features generated from an acquired signature are compared against features of the reference signatures stored in the database in order to judge its authenticity (Pirlo and Impedovo, 2008). Hence, the feature generation stage plays an important role for the robustness of a HSVS.
Various methods have been developed for generating features from the signature image, which can be grouped into two categories: direct methods and transform methods. Direct methods allow generating features directly from image pixels such as grid-based information, pixel density, gray-level intensity, texture… etc. In contrast, transform methods need a transformation of the image into another domain in which features could be generated. Fourier, Wavelet, Radon transforms are the most popular methods for generating features (Pirlo and Impedovo, 2008; Chibani and Nemmour, 2011). The main drawback of these methods is that they don’t allow capturing contours contained into an image. Hence, a sophisticated transform has been proposed more recently namely the contourlet transform (CT) (Vetterli and Do, 2005). The main advantage of the CT is the ability to capture significant information about an object and offers a flexible multiresolution, local, and directional image expansion (Vetterli and Do, 2005). This property is interesting to exploit more specifically for the handwritten signature verification since the signature contains often special characters and flourishes (Moreno et al, 2003). The contourlet transform has successfully been used for many applications such as vehicle recognition (Kazemi et al, 2008). feature extraction on texture images (Liangzheng and Yifan, 2008). face recognition (Liu et al, 2008), image retrieval (Gao et al, 2009) (Bui-Thu et al, 2010), and also for handwritten signature verification (Xu et al, 2007;Pourreza et al, 2009).
The main drawback of the CT is the important number of coefficients generated (up to 33%). Hence, we propose in this paper a new feature generation method based on the contourlet transform for handwritten signature verification. The feature vector is composed of normalized energies, each one is deduced from a specified direction. This approach allows thus capturing all information contained into a signature image.
The remaining of the paper is organized as follows: the contourlet transform is presented in section 2. Then, a new feature generation method is defined in section 3.

21
AID’2012
May 20-21, 2012
The experimental results are given and compared in section 4. Finally, we will conclude the whole paper and present some future works.
2 Contourlet Transform
The Contourlet Transform has been proposed by Do and Vetterli (Vetterli and Do, 2005) in order to obtain sparse expansions of an image having smooth contours through a double filter bank structure. Hence, the Laplacian pyramid is firstly used to capture the point discontinuities, and then followed by a directional filter bank to link point discontinuities into linear structures. The Laplacian Pyramid analyzes the two dimensional image into low pass and high pass sub-bands. Details provided from the high pass sub-band are filtered by the directional filter bank into directional subbands. The resulting image expansion uses basic elements like contour segments and supports different scales, directions and ratios (Sani et al, 2011).
We briefly review the main properties of the Laplacian pyramid and the directional filter bank.
2.1 Laplacian Pyramid
Laplacian Pyramid introduced by Burt and Adelson is a multi-scale decomposition (Adelson and Burt, 1983), which provides a downsampled lowpass version of the original image at each level convolved with a Gaussian kernel. The difference between the original and the prediction allows generating details, which correspond to contours. The process is iterated by decomposing the coarse version repeatedly and the image size is halved at each scale. Figure 1 illustrates the Laplacian pyramid structure. Fig. 1.Laplacian Pyramid Structure.
2.2 Directional Filter Bank
The Directional Filter Bank (DFB), developed by Bamberger and Smith (Smith and Bamberger, 1992), has the ability to receive high frequencies of the input image, which contains some information about directions. This is permitted by the

22
AID’2012
May 20-21, 2012
Laplacian decomposition by removing low frequencies before DFB so that the directional information can be captured efficiently. The DFB is a critically sampled filter bank that has the ability to decompose images into any power of two’s number of directions. The DFB is efficiently implemented
via al-level tree-structured decomposition that leads to l2 subbands. Figure 2 shows the frequency partition map for eight band directional filter bank and positions of the decomposed sub-band images (Xu et al, 2007; Sani et al, 2011).
Fig. 2.Frequency partition map for eight-band directional filter bank such that l=3 corresponding to sub-bands or directions. Sub-bands 0-3 correspond to the mostly horizontal directions, while sub-bands 4-7 correspond to the mostly vertical directions. (Sani et al, 2011).
3 Feature Generation
In many HSV systems, the rotation of the signature image is a required preprocessing in order to achieve acceptable results. In our approach, we consider orientations as a main characteristic of writing style that allows separating more efficiently between writers. Hence, we propose a method that uses both structural and statistical features without preprocessing. The contourlet transform allows characterizing the structural features to capture the smooth contours in several directions. While, the statistical features are defined via normalized energies which describe the level of information contained in each direction of the signature. More precisely, the proposed method is divided into two steps: Firstly, the CT is applied on the original signature image, which is decomposed onto only one pyramidal level with four directional subbands.
0 1
2 3
4 5 6 7
4 0 1 2 3
7 1 0
5
2
5 6
3 4
6
7

23
AID’2012
May 20-21, 2012
Fig.3. Contourlet transform applied on a signature image for 4 directions at the first level.
Figure 3 illustrates an example of applying the CT on a handwritten signature image for four directions at the first decomposition level. Small coefficients are shown in black while large coefficients are shown in white.
∑∑
∑∑
= =
= ==I
i
J
jdr
N
n
M
mdr
dr
jiC
mnC
E
1 1,
1 1,
,
),(
),(
(1)
),(, ••drC represents the contourlet coefficients at the resolution r for the direction
d (N,M) correspond to the size of contourlet coefficients at each direction while (I,J) correspond to the size of the whole coefficient image. The resulting feature vector is then:
].......[ ,,1,1 NdNrdr EEEV = (2)
Nr andNd define the numbers of resolutions and directions, respectively. The feature vector informs on the amount of information contained in each direction, which allows a characterization of the signature written style.

24
AID’2012
May 20-21, 2012
4 Experimental Results
4.1 Dataset and Validation criteria
The Center of Excellence for Document Analysis and Recognition (CEDAR) signature dataset (Xu et al, 2004) is a commonly used dataset for off-line signature verification. The CEDAR signature database contains signatures from 55 signers. Each one signed 24 genuine signatures and simulated 24 forged signatures for other signers. Therefore the database contains 1320 genuine and 1320 forged signatures, respectively. In order to evaluate the performance of the proposed method, we use three standard evaluation criteria: False Acceptance Rate (FAR) allowstaking into account only skilled forgeries; False RejectionRate (FRR) allows taking into account only genuinesignatures; and the Average Error Rate (AER) allows taking the average of both FAR and FRR. The AER constitutes a good criterion for evaluating the accuracy of a method. Hence, a method can be considered accurate when the AER is lower as much as possible.
4.2 SVM Classification
To evaluate performances of our approach, we use the SVM classifier, which is designed to separate genuine from forgery signatures. Results are obtained using the cross-validation approach involving training, validation and testing steps (Liu et al, 2009). The training and validation steps consist to find the optimal parameters of the SVM classifier, which are the regularization parameter and the kernel parameter. These parameters are found experimentally depending on the dataset. The final step is testing that consists to evaluate the robustness of the proposed method.
4.3 Quantitative Results
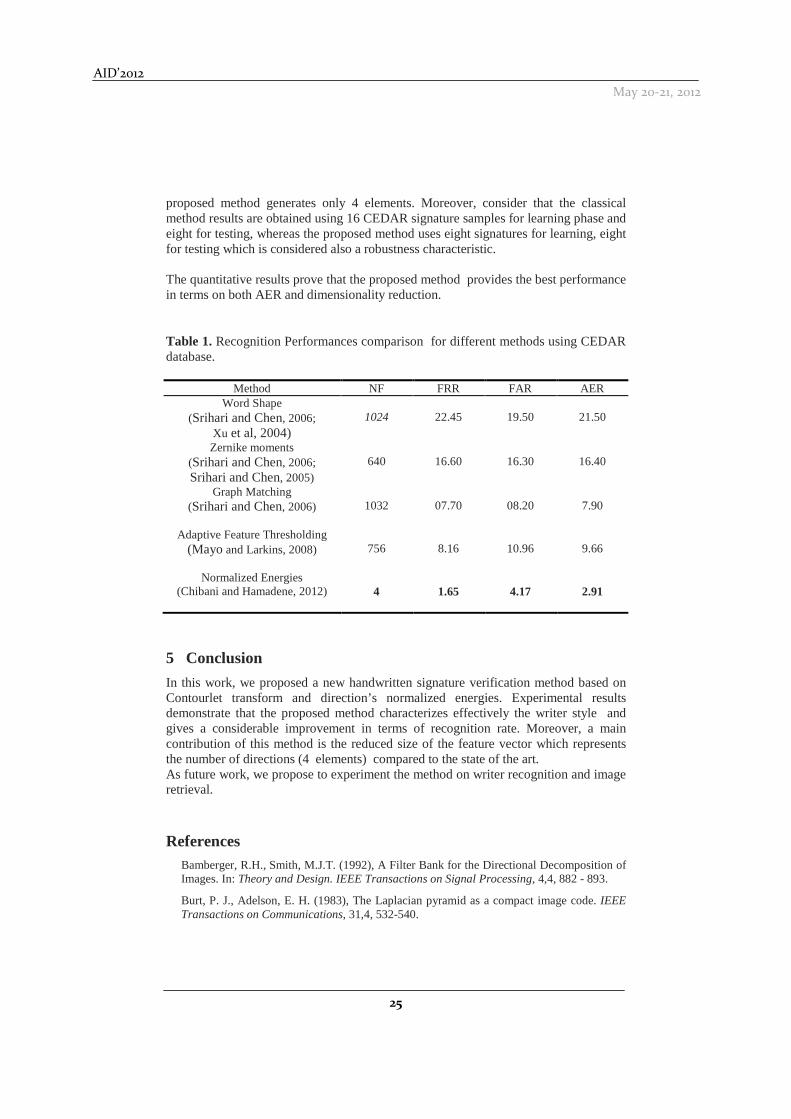
Experiments are conducted by using 6-fold cross-validation. Thus, the database is divided into three sets, which are permuted successively. Furthermore, the signature is decomposed onto one resolution and four directions. This leads to generate a feature vector having only four normalized energy components. In order to appreciate the effective use of our method, various methods are selected for comparison, which are Word Shape (Srihari and Chen , 2006; Xu et al, 2004), Zernike moments (Srihari and Chen , 2006; Srihari and Chen, 2005), Graph Matching (Srihari and Chen , 2006), and Adaptive Feature Thresholding (Mayo and Larkins, 2008). These methods have been selected since experimental results have been conducted on the same CEDAR database. Table 1 reports the Number of Features (NF) composed the feature vector, FAR, FRR and AER, respectively. We can clearly note that the best performance is reached by our method (AER = 2.91%) which is lower by 4.99% compared to the smallest AER obtained by Graph Matching method (AER=7.90%). Further, the smallest number of feature obtained by the method based on the Zernike moments contains 640 elements whereas the
25
AID’2012
May 20-21, 2012
proposed method generates only 4 elements. Moreover, consider that the classical method results are obtained using 16 CEDAR signature samples for learning phase and eight for testing, whereas the proposed method uses eight signatures for learning, eight for testing which is considered also a robustness characteristic. The quantitative results prove that the proposed method provides the best performance in terms on both AER and dimensionality reduction.
Table 1. Recognition Performances comparison for different methods using CEDAR database.
Method NF FRR FAR AER Word Shape
(Srihari and Chen, 2006; Xu et al, 2004)
1024
22.45
19.50
21.50
Zernike moments (Srihari and Chen, 2006; Srihari and Chen, 2005)
640
16.60
16.30
16.40
Graph Matching (Srihari and Chen, 2006)
1032
07.70
08.20
7.90
Adaptive Feature Thresholding (Mayo and Larkins, 2008)
756
8.16
10.96
9.66
Normalized Energies (Chibani and Hamadene, 2012)
4
1.65
4.17
2.91
5 Conclusion
In this work, we proposed a new handwritten signature verification method based on Contourlet transform and direction’s normalized energies. Experimental results demonstrate that the proposed method characterizes effectively the writer style and gives a considerable improvement in terms of recognition rate. Moreover, a main contribution of this method is the reduced size of the feature vector which represents the number of directions (4 elements) compared to the state of the art. As future work, we propose to experiment the method on writer recognition and image retrieval.
References Bamberger, R.H., Smith, M.J.T. (1992), A Filter Bank for the Directional Decomposition of Images. In: Theory and Design. IEEE Transactions on Signal Processing, 4,4, 882 - 893.
Burt, P. J., Adelson, E. H. (1983), The Laplacian pyramid as a compact image code. IEEE Transactions on Communications, 31,4, 532-540.

26
AID’2012
May 20-21, 2012
Chen, S., Srihari, S. (2005), Use of Exterior Contours and Shape Features in Off-line Signature Verification. In: International Conference on Document Analysis and Recognition, 2, pp. 1280-1284, New York.
Chen, S., Srihari, S. (2006), A New Off-line Signature Verification Method based on Graph Matching. In: 18th International Conference on Pattern Recognition, pp. 869–872, Hong Kong, China.
Do, M. N. Vetterli, M. (2005), The Contourlet Transform: An Efficient Directional Multi resolution Image Representation. Image Processing, 14, 2091-2106.
Hamadene, A., Chibani, Y., (2012). A Feature Generation Method Based on the Contourlet Transform for Offline Handwritten Signature Verification.International Conference on Multimedia Information Processing CITIM’2012.Algeria.
Impedovo, D., Pirlo, G. (2008).Automatic Signature Verification: The State of the Art. IEEETransactions on Systems, Man, and Cybernetics, Part C: Applications and Reviews, 38,5,609-635.
Kalera, M. K., Srihari, S., Xu, A. (2004), Offline Signature Verification and Identification Using Distance Statistics. International Journal of Pattern Recognition and Artifcial Intelligence, 18,7,1339-1360.
Larkins, R., Mayo, M. (2008), Adaptive Feature Thresholding for Off-line Signature verification. In: 23rd International Conference Image and Vision Computing , pp.1–6 , Christchurch, New Zealand.
Nemmour, H., Chibani, Y.(2011). Handwritten Arabic word recognition based on Ridgelet transform and support vector machines. In: International Conference on High Performance Computing and Simulation (HPCS),pp. 357-361, Istanbul, Turkey.
Nguyen-Duc, H., Do-Hong, T., Le-Tien, T., Bui-Thu, C. (2010), A New Descriptor for Image Retrieval Using Contourlet Co-occurrence. In; Third International Conference on Communications and Electronics,pp. 169-174, Nha Trang, Vietnam.
Pourshahabi, M. R., Sigari, M. H., Pourreza, H. R. (2009), Offline Handwritten Signature Identification and Verification Using Contourlet Transform. In: International Conference of Soft Computing and Pattern Recognition, pp. 670-673, Malacca, Malaysia.
Rahati, S., Moravejian, R., Kazemi, E. M., Kazemi, F. M. (2008), Vehicle Recognition Using Contourlet Transform and SVM.Fifth International Conference on Information Technology, pp. 894–898, Las Vegas, USA.
Refaeilzadeh, P., Tang, L., Liu, H. (2009), Cross Validation. In Encyclopedia of Database Systems, M. Tamer Ozsu and Ling Liu.Springer.
Shahi, L. P., Behnam, H., Shalbaf, A., Sani. Z. A. (2011),Noise Reduction In Echocardigraphy Images Using Contourlet Transform. In: 1st Middle East Conference on Biomedical Engineering, pp. 420–423, Sharjah, UAE.
Vélez, J, F., Sanchez, Á., Moreno, A, B. (2003),Robust Off-Line Signature Verification Using Compression Networks And Positional Cuttings. The 13th IEEE Workshop on Neural Networks for Signal Processing, 1, 627-636.
Wang, Y., Li, J., Lin, J., Liu, L.(2008), The Contourlet Transform and SVM Classification for Face Recognition. Apperceiving Computing and Intelligence Analysis.pp. 208-211, Chengdu, China.

27
AID’2012
May 20-21, 2012
Yang, M. Yin, Z., Zhong, Z., Wang, S., Chen, P. Xu, Y. (2007), A Contourlet-based Method for Handwritten Signature Verification. In: International Conference on Automation and Logistics, pp. 1561-1566, Jinan, China.
Yifan, Z., Liangzheng, X. (2008), Contourlet-based Feature Extraction on Texture Images. International Conference on Computer Science and Software Engineering, pp.221-224, Wuhan, China.
Zhang, Q., Wu, J., Gao, L. (2009), Image Retrieval Based on Contourlet Transform and Local Binary Patterns. Industrial Electronics and Applications, pp. 2682-2685, Xi'an, China.


29
AID’2012
May 20-21, 2012
A Similarity Distances and DTW in Handwritten Arabi c Word Image Retrieval by Word Spotting
Youcef BRIK and Youcef CHIBANI
Speech Communication and Signal Processing Laboratory
Faculty of Electronics and Computer Sciences University of Sciences and Technology Houari Boumediene
EL-Alia B. P. 32, 16111, Algiers, Algeria
[email protected], [email protected]
Abstract.In this paper, we describe a word spotting approach which involves grouping word images into clusters of similar words by using image matching to find similarity. We use the Dynamic Time Warping (DTW) for computing an Arabic word image similarities where the similarity metrics play an important role. Usually, the Euclidean distance is used in DTW matching. However, this metric has some limitations and it leads us to find other effective distances. Hence, this paper compares five image similarity measures such as Euclidean, Manhattan, Canberra, Bray-Curtis and Squared Chi-Squared distances for Arabic word image retrieval. First, each word image creates a feature sequences. The spotting is performed using five distances measure enhanced by a dynamic time warping technique. Experimental results conducted on IFN/ENIT datasets indicate that a word spotting performance can be improved significantly by using Canberra and Bray-Curtis distance metric compared to usual Euclidean, Manhattan and Squared Chi-Squared distances based approach.
Keywords.Information retrieval, Handwritten Arabic document, word spotting, Dynamic Time Warping, Distance metrics.
1 Introduction
The analysis of handwritten Arabic document images has attracted growing interest in the last years. Mass digitization and document image understanding allow the preservation, access and indexation of this cultural and technical heritage. The problem in this field consists in querying a dataset of handwritten documents with a query word image and retrieving word images that belong to the same word class (Lu and Tan, 2004). This task is very popular in the domain of digital libraries, where documents can be represented as sets of word images (Manmatha and Rothfeder, 2005). Nowadays, obtaining a transcription can be costly and Optical Character Recognition (OCR) systems for handwritten text do not yet show satisfactory accuracy (Manmatha and Rothfeder, 2005; Rath and Manmatha, 2007).

30
AID’2012
May 20-21, 2012
Word spotting, which was initially proposed by (Manmatha et al., 1996), treats a collection of documents as a collection of word images (Rath and Manmatha, 2003). The idea is to retrieve all the relevant document images which contain similar words to the input query word. The query word image is compared to all the candidate words using image matching in order to find all similar words in all the indexed documents. This approach allows performing a spotting in the document images with acceptable results. In (Srihari et al., 2005), handwritten Arabic Word Spotting was developed. Where, a two-step approach was employed in performing the search, prototype selection and word matching, the prototypes are used to spot each occurrence of those words in the indexed document database. The most popular method for retrieving a word image is based on the use of the Dynamic Time Warping (DTW), which consists to find an optimal path between the query word and the word to be spot (Manmatha and Rothfeder, 2005; Balasubramanian et al., 2006; Rath and Manmatha, 2007). Usually, the Euclidian distance is used as a metric for computing the similarity measures in DTW. However, the Euclidian distance has some limitations as reported in (Hatzigiorgaki and Skodras, 2003). Hence, it is important to explore different similarity measures in order to improve retrieval accuracy. In this paper, we propose a comparative study of various similarity measures that can be used in Dynamic Time Warping. Indeed, various studies show that the choice of an appropriate distance allows significantly improving the accuracy in various applications (Hatzigiorgaki and Skodras, 2003; Kokare et al., 2003). The paper is then organized as follows. In section 2, we briefly review the main concept of the DTW and the distance metrics for word spotting. Experimental results conducted on the standard database IFN/ENIT are given in section 3. Finally, a conclusion is presented in section 4.
2 Word Spotting Based on the Dynamic Time Warping
The overall structure of the word spotting system is presented in Fig. 1. In this section, we focus on the concept of the DTW for the word image matching.
Fig. 1.Word spotting system based on DTW.

31
AID’2012
May 20-21, 2012
2.1 Word image matching based on DTW One of the key parts of the word spotting approach is the image matching technique for comparing word images. Several techniques have been investigated, (Rath and Manmatha, 2003; Rothfeder et al., 2003) showing that the best technique being Dynamic Time Warping (DTW) matching. The DTW is a dynamic programming algorithm, which consists to find an optimal path between two profile features. It allows taking into account the writing variations, which cause the profile features to be compressed and stretched nonlinearly with respect to one another. The advantage of DTW over simple distance measures such as linear scaling followed by a Euclidean distance calculation is that it determines a common “time axis” (hence the term time warping) for the compared profiles, on which a corresponding profile locations appear at the same time (Rath and Manmatha, 2003). Due to the variations in handwriting, two profiles of the same word do not generally line up very well if they are just scaled linearly (see Fig. 2).
Fig. 2. Two profiles aligned using (a) linear scaling (b) dynamic time warping (DTW) (Rath
and Manmatha, 2003).
2.2 Mathematical formulation of the DTW
DTW is an elastic distance between vector sequences. Let us consider two sequences of vectors X = (x1, . . . ,xM) and Y = (y1, . . . , yN). DTW considers all possible alignments between the sequences, where an alignment is a set of correspondences between vectors such that certain conditions are satisfied. For each alignment, Rath (Rath and Manmatha, 2003) determine the sum of the vector-to-vector distances and define the DTW distance as the minimum of these distances or, in other words, the distance along the best alignment, also referred to as warping path. The direct evaluation of all possible alignments is prohibitively expensive, and, in practice, a dynamic programming algorithm is used to compute a distance in quadratic time (Rath and Manmatha, 2007; Rath and Manmatha, 2003; Rothfeder et al., 2003). A matrix D ∈IRM×Nis built, where each entry D(i, j)(1 ≤ i ≤ M, 1 ≤ j ≤ N) is the cost of aligning the subsequences X1:iand Y1:j. Each entry D(i, j) is calculated from some D(i ', j') plus an additional cost d, which is usually the distance between the samples xiand yi. In our case, we use the local continuity constraint defined by the following formulation:
���, �� = � � ���, � − 1���� − 1, ����� − 1, � − 1�� + ���� , ���(1)
(a) (b)

32
AID’2012
May 20-21, 2012
whered(xi, yj) is the vector-to-vector distance between xi and yj.
Once all necessary values of D have been calculated, the warping path can be determined by backtracking along the minimum cost path starting from (M,N). We just are interested in the accumulated cost along the warping path, which is stored in D(M,N). Since, this matching cost would be lower for shorter sequences, hence, we offset this bias by dividing the total matching cost by the length K of the warping path, yielding:
dist(X,Y) = D(M,N)/K. (2)
Table 1 contains pseudo-code of the DTW algorithm (adapted from (Rath and Manmatha, 2007)) using the local continuity constraint.
Table 1.The DTW algorithm.
The main difficulty of using the DTW is the appropriate choice of the distance metric. Usually, the Euclidean distance is the most popular metric used for comparing two sequences. However, recent works show that the Euclidean distance is not adequate and more sophisticated distances have been defined for improving the matching between two sequences. Hence, we present the different distances used in this work.
2.3 Distance metrics
In order to use DTW to match such profiles, we need to define a distance measure d(x, y) that determines the (local) distance of two samples in a profile.
Input: � = ���, … , ��� and � = ���, … , ��� distance function d(.,.) Output: DTW matrix D Algorithm: 1. ��1,1� = ����, ���; 2. for m = 1 : M 3. ��, 1� = �� − 1,1� + ����, ���; 4. for n = 1 : N 5. ��1, � = ��1, − 1� + ����, ���; 6. for m = 2 : M 7. for n = 2 : N
8. ��, � = � � ���, � − 1���� − 1, ����� − 1, � − 1�� + ����, ���

33
AID’2012
May 20-21, 2012
We denote ���� , ��� the distance between i th column and j th column of a query word and candidate word multidimensional features respectively. The index k is used to refer to the kth dimension of xiand yj. In our case, five different distances are used, which are defined as follows:
• Euclidean distance (dE) One of the commonest distance metrics in image retrieval literature is the Euclidean distance, which is defined as: � ��� , ��� = !∑ ���,# − ��,#�$# (3)
• Manhattan distance (dM) The Manhattandistance function requires less computations than many other distance metrics, which is defined as: ����� , ��� = ∑ %��,# − ��,#%# (4)
• Canberra distance (dC) Canberrametric is very popular in similarity matching. It has the advantage of a relatively low computational complexity and high retrieval efficiency (Hatzigiorgaki and Skodras, 2003). It is defined as: �&��� , ��� = ∑ %'(,)*+,,)%%'(,)%-%+,,)%# (5)
• Bray-Curtis distance (dBC)
Bray Curtisdistance is quite similar to Canberra metric. It is defined as: �.&��� , ��� = ∑ %'(,)*+,,)%'(,)-+,,)# (6)
• Square Chi-Squared distance (dChi)
The Square Chi-Squared distance is defined as: �&/���� , ��� = ∑ �'(,)*+,,)�0'(,)-+,,)# (7)
With this distance measure defined, we can now calculate the matching distance between two word images by comparing their profile features using DTW.
3 Experimental Results
The proposed matching method is evaluated in the context of an Arabic handwritten word image retrieval task. Hence, we use the DTW measure for image matching

34
AID’2012
May 20-21, 2012
purposes. We compare the query word image to all the candidate words using image feature matching with different distances.
3.1 Dataset
The image words that are included in the database are created from various Arabic word images extracted from a IFN-ENIT dataset. This dataset contain 823 word images of 18 Arabic city nouns. Therefore, this is real data and such a challenging spotting task because of the variety of writing.
3.2 Feature generation
Features are generated from every word capable of capturing the word similarities and discarding the small differences due to remaining noise or different style of writing. They are carefully selected in order to describe the contour and region shape of the word. Three features are then selected, which are :
Fig. 3. An original word image and three features used in word image matching: (a) original word image (b) vertical projection feature
(c) upper profile feature (d) lower profile feature.
1) Vertical projection: Projection profile captures the distribution of ink along one of
the two dimensions in a binary word image. A vertical projection is computed by summing the intensity values in each image column separately (see Fig. 3-b).
2) Upper word profile: the upper word profile can be considered as a signature of the word shape. This signature leads to a feature vector. In order to calculate the upper profile, the word image is scanned from top to bottom. The first time a
0 50 100 1500
0.5
1
0 50 100 1500
0.5
1
0 50 100 1500
0.5
1
(a)
(b)

35
AID’2012
May 20-21, 2012
black pixel is found, all the following pixels of the same column are converted to black (see Fig. 3-c).
3) Lower word profile: The Lower word profile is found similarly. The word image is scanned from bottom to top and all the pixels are converted to black until a black pixel is found (Fig. 3-d).
Due to the variations in quality (e.g. font size, faded ink) of the scanned images, different projection profiles do not generally vary in the same range. To make them comparable, the vertical projection and upper-lower word profiles are normalized in the range [0...1] by the word height (Fig. 3).
3.3 Evaluation
The recall and the precision metrics have been used to evaluate the performance of the proposed system. Recall is defined as the ratio of the number of relevant records retrieved to the total number of relevant records in the database. While, the precision is defined as the ratio of the number of relevant records retrieved to the total number of irrelevant and relevant retrieved records (Zagoris et al., 2010). In our evaluation, the precision and recall values are expressed in percentage. In order to calculate the precision and recall values, 8 different query words (see Tab. 1) having 256 instances in total are selected randomly, based on their varied lengths and styles. Hence, each query word image is compared to all word image candidates and select the smallest one. Fig. 4 shows the precision and recall values obtained for different distances.
Fig. 4.Recall and Precision rates for different similarity distances on our dataset.
We clearly see from Fig. 4 that conventional distance metrics like Euclidean and Manhattan distances do not perform well. Indeed, maximum retrieval recall obtained with those metrics are 61.16% and 64.43%, respectively. In contrast, the Canberra and Bray-Curtis distance metrics seem more accurate comparatively to other distance metrics since the precision and recall are 72.87% and 68.11%, respectively. These performances are due to the term in the numerator, which means the difference between two words while the denominator normalizes the difference. Thus, distance

36
AID’2012
May 20-21, 2012
values will never exceed one, being equal to one whenever either of the attributes is zero. Thus, it would seem to be a good expression to use, which avoids scaling effect. The Squared-Chi Squared distance also seems better compared to conventional distance metrics.
Table 2.The 8 query words selected for evaluating the performances of the distance metrics.
1. 2.
3. 4.
5. 6.
7. 8.
4 Conclusion and Future Work The objective of this work is to study the influence of the distance when using the DTW for Arabic word spotting. Thus, three meaningful features were used based on the vertical projection, upper word profile and lower word profile. The comparative analysis shows that the choice of an appropriate distance is important to ensure a better retrieving of a word from a database. Canberra and Bray- Curtis distances seem more adequate for Arabic image word spotting.
Our future work will focus by optimizing the implementation of the dynamic time warping algorithm, as well as looking at related computational techniques to minimize the number of possible matches in large datasets.
References Balasubramanian A., Meshesha M., Jawahar C.V. (2006), Retrieval Form Document Image Collections. Proc. DAS2006, pp. 1-12.
Hatzigiorgaki, M., N. Skodras, A.(2003), Compressed domain image retrieval: a comparative study of similarity metrics.Visual Communications and Image Processing (VCIP'03). pp. 439-448.
Kokare, M., Chatterji, B.N., Biswas, P.K. (2003), Comparison of similarity metrics for texture image retrieval.TENCON 2003.Conference on Convergent Technologies for Asia-Pacific Region. Vol. 2, pp. 571 - 575.
Lu Y., Tan C.L. (2004), Information Retrieval in Document Image Databases.IEEE Trans. Knowledge and Data Engineering, vol.16, no.11, pp. 1398-1410.

37
AID’2012
May 20-21, 2012
Manmatha, R., Han, C., Riseman, E.M., Croft, W.B.(1996), Indexing handwriting using word matching. In: Digital Libraries. 1st ACM International Conference on Digital Libraries Bethesda, pp. 151–159.
Manmatha, R., Rothfeder, J. (2005), A scale space approach for automatically segmenting words from historical handwritten documents. IEEE Trans. Pattern Anal. Mach. Intell. 27 (8), pp. 1212-1225.
Rath, T.M., Manmatha, R. (2003), Word image matching using dynamic time warping. Proceedings of the Conference on Computer Vision and Pattern Recognition, Madison vol. 2, pp. 521–527.
Rath, T.M, Manmatha, R.(2007), Word spotting for historical documents.International Journal of Document Analysis and Recognition (IJDAR), Vol. 9, No. 2, pp. 139-152.
Rothfeder, J.L., Feng, S., Rath, T.M. (2003), Using corner feature correspondences to rank word images by similarity.Proceedings of the Workshop on Document Image Analysis and Retrieval (electronically published) , Madison, pp. 30-35.
Srihari, S. N., Srinivasan, H., Babu, P., and Bhole, C. (2005), Handwritten Arabic word spotting using the cedarabic document analysis system. Proceedings Symposium on Document Image Understanding Technology (SDIUT 2005), pp. 123-132.
Zagoris, K., Kavallieratou, E., Papamarkos, N. (2010), A Document Image Retrieval System. Engineering Applications of Artificial Intelligence. 23 (6), pp. 872-879.


39
AID’2012
May 20-21, 2012
A Hybrid Approach to Arabic Text Categorization
Riadh BELKEBIR1, Ahmed GUESSOUM2
1, 2 USTHB, Computer Science department,
Laboratory of research in Artificial Intelligence,
BP 32 El-Alia Bab-Ezzouar, 16111 Algiers, Algeria
[email protected], [email protected]
Abstract. Automatic categorization of documents has become an important task, especially with the rapid growth of the number of documents available online. Automatic categorization of documents is to assign a category to a text based on the information it contains. It aims to automate the association of a document to a category. Thanks to the automatic categorization, technology can solve several problems such as identifying the language of a document, the filtering and detection of spam (junk mail), the routing and forwarding of e-mails to their recipients, etc. In this paper, we present the results of Arabic text categorization based on three different approaches: artificial neural networks, support vector machines (SVM) and a hybrid approach BSO-CHI-SVM. We explain the approach and present the results of the implementation and evaluation using two types of representations: root-based stemming and light stemming. The evaluation in each case was done with the use of Accuracy as a measure of performance on the Open Source Arabic Corpora (OSAC).
Keywords. Automatic Categorization; SVM; Neural Networks; BSO-CHI-SVM; Accuracy; Root-Based Stemming; Light Stemming.
1 Introduction
Automatic categorization of documents in Arabic has become very important, especially with the rapid growth of online materials present in Arabic. Information overload can lead users to a glut of content. Automatic text categorization is to assign it automatically to a predefined category. Several research projects were conducted in the categorization of documents in English. In addition to the English language, there has been a number of studies on European languages like French, German and Spanish and Asian languages like Chinese and Japanese. By contrast, and despite the rich morphology and complex spelling of the Arabic language, there is little research underway on the categorization of Arabic documents. Through supervised machine learning, automatic text categorization has become possible. A training program is conducted on a set of documents to which category labels have been assigned by human experts. The techniques of automatic text categorization can solve problems such as the identification of the language of a document, filtering and detection of spam (junk mail) (Kessler et. al., 2004), routing and forwarding of emails to recipients, categorization of multimedia documents,

40
AID’2012
May 20-21, 2012
automatic indexing of texts (Tzeras and Hartmann, 1993), and disambiguation of words (Sebastiani, 2005), etc.
In this paper we compare three different approaches using two modes of representation (root-based stemmer, light stemmer) to address the problem of automatic Arabic text categorization. The first approach is based on neural networks and the second on support vector machines (SVM) In the third approach, we introduce a hybrid approach that combines the SVM learning algorithm with the bee swarm optimization algorithm BSO (Drias et. al., 2005) and the statistical method X2 (Chisquare).
The remainder of this paper is organized as follows: section 2 presents some related work. Section 3 deals with the general process of automatic text categorization presenting its different facets. Section 4 presents the dimensionality reduction. Section 5 considers the design of the proposed solutions. Section 6 presents the obtained results and a comparison between the different approaches. Section 7 concludes the work.
2 Related Work
(Mesleh, 2008) lists the main work done in the field of automatic categorization of Arabic texts. Among these we can mention the most relevant ones. (El-Kourdi et. al. , 2004) have used a Naive Bayesian classifier and concluded that there is an indication that the results of the Naive Bayesian algorithm in the classification of Arabic documents is not sensitive to the root extraction. (Al-Shalabi et. al., 2006) used the k-Nearest neighbors (k-NN) algorithm with the frequency of documents (DF) as a method of vocabulary reduction before the classification of Arabic documents. In a similar study, (Kanaan et. al., 2006) have used the kNN algorithm with information gain to classify Arabic documents. In Arabic natural language processing, few publications have used the SVM classifier. (Mesleh, 2007) used SVM with Chi-square FSS (Mesleh, 2007) to classify Arabic documents. He reported that the SVM classifier outperforms the Naive Bayesian and kNN classifiers. (Al-Harbi et. al, 2008) evaluated the performance of SVM and C5.0 for the classification of Arabic documents. They presented the results given in (Al-Harbi et. al, 2008) of the classification of seven different Arabic corpora, and concluded that the decision tree algorithm C5.0 outperforms SVM in terms of accuracy. However, the authors did not consider other performance measures such as recall and F-measure. (Hmeidi et. al., 2008) reported a comparative study of SVM and KNN classifiers on the classification of Arabic documents. (Harrag et. al., 2011) made a comparative study of SVMs and neural networks with three modes of representation: root-based stemmer, light stemmer and a dictionary-based representation, and they concluded that the performance of neural networks is superior to that of SVMs, and that the representation with the light stemmer is more beneficial than the other two.

41
AID’2012
May 20-21, 2012
3 Text Categorization Process
The goal of automatic text categorization is to classify text into the correct category based on its content. Usually, the categories refer to text, but for specific applications, they can take other forms. Indeed, we can solve by categorization techniques problems such as the identification of the language of a document, the filtering of relevant or undesirable email, or the disambiguation of terms. In case the categories refer to text topics: the classification is akin to the problem of extracting the semantics of a text, since the membership of a document to a category is closely related to the meaning of this text. This is partly what makes it difficult since the treatment of the semantics of a document written in natural language is still a complex problem (Jalam, 2003). In general, the categorization process includes the construction of a prediction model that receives an input text and associates a label output to it.
To identify the category or class to which a text is associated with, a set of steps is usually followed to ensure a good generalization of the learned model: document representation and feature selection, pre-learning algorithm and Evaluation of results.
4 Dimensionality Reduction
To overcome the problem of high dimensionality in the case of automatic text categorization, the notion of reduced dimensionality was introduced. Some reduction methods focus on the selection of features (filters); they aim at suggesting a new set of features with size | N1 | <| N0 |, the original size of the features. Among these techniques one finds the X2 method, the calculation of mutual information, information gain, and entropy. Moreover, theoretically, the problem of selecting the set of attributes has been shown to be NP-hard (Blum and Rivest, 1992). This important result has led researchers to think about automatically building the features set (wrapper). Thus, research in this area has become very active. On the other hand, we see that several algorithms such as genetic algorithms (GA), optimization by ant colonies (ACO), swarms of particles (PSO), etc., have proved their robustness in several optimization problems. These algorithms were used in several fields such as the problem of feature selection, information retrieval, etc. For these reasons the community is interested in Machine Learning within which to consider the problem of feature selection as an optimization problem.
5 Classifiers
5.1 Support Vector Machine Classifier
Support Vector Machines (SVMs) are a machine learning model proposed by V. N. Vapnik. The purpose of this technique is to find a model from the observation of a number of pairs of input-output. The problem amounts to finding a decision boundary that separates the space into two regions, through the hyper-plane that correctly
42
AID’2012
May 20-21, 2012
classifies the data and that is as far as possible from all the examples. They say they want to maximize the margin where the margin is the distance of the nearest point to the hyperplane .
An efficient algorithm is presented in (Platt, 1999). An interesting property of SVM is that the decision surface is determined solely by the points that are closest, called support vectors. In the presence of only these training examples, the same function will be learned. This is different from algorithms like kNN with which all the training examples are used during the learning process (Yang, 1999). Even if the SVMs seek the hyper-plane that separates the vector space into two, their advantage is that they are easily adaptable to non-linearly separable problems. Prior to learning the best linear separation, we transform the input vectors into feature vectors of higher dimension. In this way a linear separator found by an SVM in this new vector space becomes a non-linear separator in the original space. This vector transformation is done using the "kernel".
In the case of text classification, documents are inputs and categories are the outputs. Considering a binary classifier, we want it to learn the hyper-plane that separates the documents belonging to the category and those that do not belong there. According to (Joachims, 1998), SVMs are well suited for text classification because; first, a high dimension does not affect them because they protect against overfitting. Likewise, he claims that some attributes are completely useless to the task of classification by SVMs, thereby avoiding a strict selection of attributes that will result in a loss of information. We can also afford to keep more attributes. Indeed a characteristic of text documents is that when they are represented by vectors, a majority of the entries are zero. However, SVM is well suited for so-called sparse vectors.
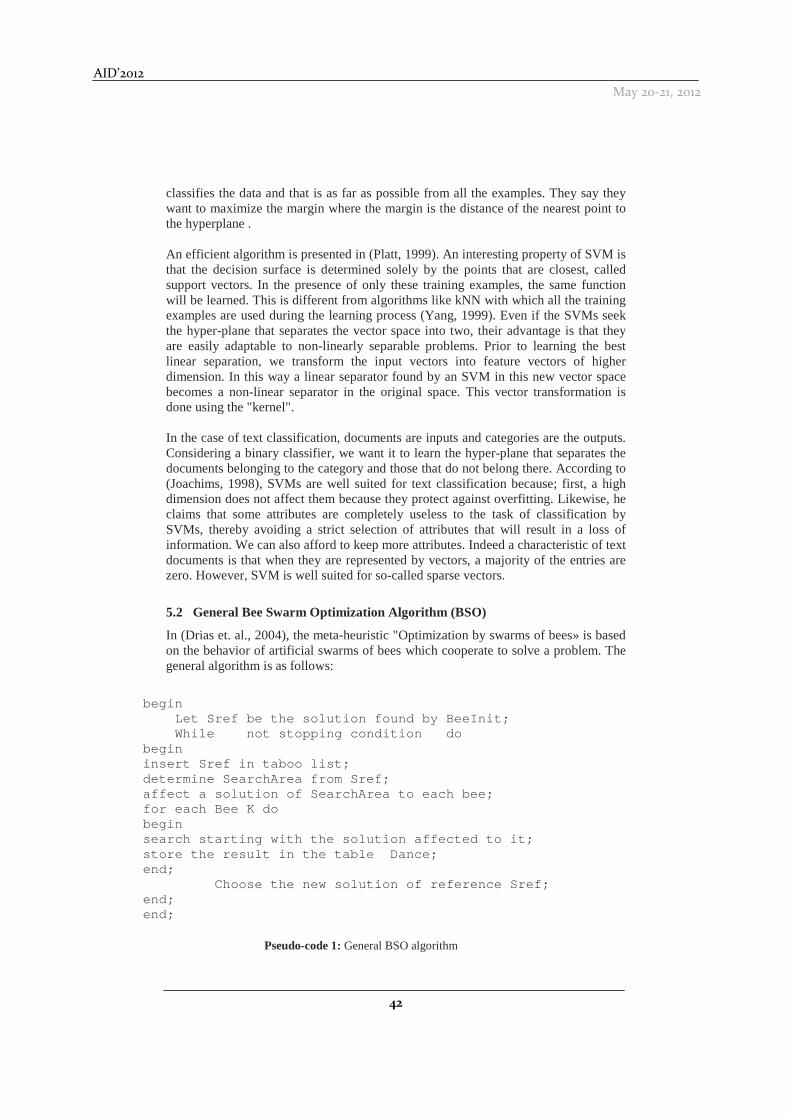
5.2 General Bee Swarm Optimization Algorithm (BSO)
In (Drias et. al., 2004), the meta-heuristic "Optimization by swarms of bees» is based on the behavior of artificial swarms of bees which cooperate to solve a problem. The general algorithm is as follows:
. Hybrid Approach BSO-CHI-SVM
Pseudo-code 1: General BSO algorithm
begin Let Sref be the solution found by BeeInit; While not stopping condition do begin insert Sref in taboo list; determine SearchArea from Sref; affect a solution of SearchArea to each bee; for each Bee K do begin search starting with the solution affected to it; store the result in the table Dance; end; Choose the new solution of reference Sref; end; end;

43
AID’2012
May 20-21, 2012
We have mentioned earlier that the problem of selecting the set of attributes is NP-hard. On the other hand, meta-heuristics have proved their robustness in several optimization problems. Among these meta heuristics, we can cite Genetic Algorithms (GA), Particle Swarm Otimisation (PSO), Tabu Search, etc. In the area of automatic classification, although the methods based on meta-heuristics are very powerful, little research has addressed the problem of feature selection using these approaches. Researchers avoid using these methods (metaheuristic) for reasons related to computation time which is extremely high when compared with methods based on filters (Chi-square, information gain, mutual information, etc.). Indeed, when dealing with the problem of meta-heuristics, it is necessary to repeat the learning process after the generation of any solution and hence learning time becomes very expensive. As a solution to this, a meta-heuristic that exploits the parallelism on a large scale can be adopted, hence the choice of BSO. Moreover, we must find a way to guide the search to avoid bad solutions which explains the choice of Chi-square (X2).
5.3 BSO-CHI-SVM Algorithm : bee swarm optimization (BSO) hybridized with X2 (chisquare) and the SVM classifier
• Size of the problem The problem size is equal to the vocabulary size, i.e. the set of terms that appear at least once in the training corpus. The size of the search space is equal to 2N, where N is the size of the vocabulary. • Coding of the solution The solution is represented by a binary vector of size N, where: N: Size of vocabulary 0: Means that the attribute (feature) must be removed from the vocabulary, the training set and the test set. 1: Means that the attribute (feature) must be kept. • Fitness The role of fitness is to evaluate a solution
Fitness (solution): begin:
1. Create the model from the solution. 2. Evaluation of the model Accuracy Return Accuracy end
Pseudo-code 2: Fitness for a beei
This pseudo-code is used to evaluate a solution. It receives as input the solution carried by the bee and returns as output the accuracy that shall be attributed to the solution. In our approach each bee will itself create the training and test sets based on the solution that is assigned to it. In the training phase, the bee generates a model from the training set. The last phase is to evaluate the model generated by the bee to determine its quality.

44
AID’2012
May 20-21, 2012
• Diversification generator: (Drias et. al., 2004) the diversification generator assigns to each bee a different solution that may take as a basis for its local search.
begin h ← 0 WHILE SearchArea size is not reached and h < Flip S ← Sref k ← 0 repeat Reverse S [h + k * Flip] k ← k +1 until Flip * k + h ≥ n SearchArea ← SearchArea U {S} h ← h +1 EndWhile end
Pseudo-code 3: generator of diversification
Example: Flip = 4, n (size of the solution) = 14 Sref: 101101011001001 G1: [0] 0110 [0] 0110 [1] 1001 G2: 1 [1] 1101 [1] 1100 [0] 001 G3: 101 [0] 0101 [0] 0010 [1] 1 • Calculation of the neighborhood
Pseudo-code 4: Pseudo-code that calculates the neighborhood This pseudo-code receives as input the solution carried by the bee and vocabulary size and returns as output a neighbor of the solution. For this pseudo code we have considered that the chisquare was already calculated and normalized their values are
generate Neighbor(solution, numberOfFeatures): begin: NeighborSolution←solution for i=1 tonumberOfFeatures generatea random value between0 and 1 (randomVal) if(solution [i] =1 andrandomVal >Chisquare[i]): NeighborSolution[i] ←0 endIf; if(solution [i] =0 andrandomVal<Chisquare [i]): NeighborSolution[i] ←1 endIf; EndFor; ReturnNeighborSolution end

45
AID’2012
May 20-21, 2012
between 0 and 1. The chisquare is computed only once and its value will be fixed throughout the process; the chisquare size equals the size of the vocabulary. This method allows the generation of a neighbor so as to avoid assessing bad solutions, i.e. through chisquare we accept only solutions of a certain quality. • Criteria for the termination of the algorithm
The algorithm stops if one of two conditions is satisfied:
1. After a number of iterations is reached. 2. A solution of a good quality has been found
6 Experimentation
6.1 Presentation of the Experimental Corpus
We have used the OSAC1 corpus (Open Source Arabic Corpora). This corpus is collected from several web sites (BBC Arabic, CNN Arabic, etc.). It includes 22,429 textual records. Each text document belongs to a category (Business, History, Religion, Health, Education, Sports, Astronomy, Law, Conte, and Kitchen).
Table 1. Experimental corpus
Category # Training Files # Test Files Trade 70 30
History 70 30 Religion 70 30
Education 70 30 Sport 70 30 Health 70 30 Law 70 30
Astronomy 70 30 Conte 70 30
Kitchen 70 30
6.2 Pre-treatment of the Arabic Language
This is a very important phase in the learning process. It consists in cleaning the texts to improve the results of their treatment:
• Removal of digits (numbers): We have removed all sequences located between two
characters and spaces containing numbers. • Removal of Latin alphabet: We have eliminated the Latin alphabet "A... Z, a ... z".
1 http://sourceforge.net/projects/ar-text-mining/files/Arabic-Corpora/

46
AID’2012
May 20-21, 2012
• Removal of isolated letters: We have removed all isolated letters as ب (with), و (and), ف (then, then), ل (so to), ك (such as), since they do not add any relevant information to the categorization process.
• Removal of punctuation marks: We have removed any sequence of characters delimited by punctuation letters or spaces such as comma and semicolon, etc.
• Removal of stopwords: Like for other languages, Arabic contains function words (words or tools) that do not convey any particular meaning in the text. Therefore, it is necessary to eliminate these words before the learning phase. These words are also called "Stop Words". Examples: the words "ن�" (because), ن (as), �� (below) are considered as empty words.
6.3 Standardization
This step is specific to the Arabic language; it comes as part of the pre-treatments dealing with the morphological normalization of certain Arabic characters. Here are the normalizations we have conducted: Removal of "tashkyl" We have removed the following vowels: • Fatha, Damma, Kasra • Sukun • Shadda •FATHATAN (double Fatha), DAMMATAN (double Damma), KASRATAN (double Kasra), Example: The word اْ�َ�َ��ِ�ّ�ُ " becomes ا������ Removal of "TATWEEL" (Elongation , purely aesthetic, letters) Example: The word ا��ـــــ���� "" becomesا������ Normalization of "HAMZA" • The following letters are converted to ALEF by systematically removing the Hamza: ALEF_MADDA, ALEF_HAMZA_ ABOVE, BELOW ALEF_HAMZA_, HAMZA_ ABOVE, BELOW_HAMZA Example: �ء"��ء becomes "أھ� اھ
6.4 Representation of Documents
The document representation is an important step in automated text categorization. In the sequel, we will present the representation methods and the coding mode that we used. These modes are the same for all approaches presented in this paper (neural network, support vector machine and our hybrid approach BSO-CHI-SVM).
6.5 Representation of Documents after Stemming
For the representation of the documents we have used two different Stemmers, a Light Stemmer and a Root-Based Stemmer. The Light Stemmer removes only prefixes and suffixes while the Root-Based Stemmer removes prefixes, suffixes and infixes.
47
AID’2012
May 20-21, 2012
TFIDF The TFIDF representation is widely known in the field of information retrieval. The formula used is:
doclengthavr
doclengthfreq
freqtf
__
_*5.15.0.
.
++=
(1)
=
in
NIDF log (2)
Where: tf : term frequency IDF: Inverse Document Frequency
freq: the frequency of the word in the document length_doc: the document length avr_length_doc: the average length of training documents N: the number of training documents ni: the number of documents containing the term
Table 2. Number of features
Representation method Root-Based Stemmer Light Stemmer
# Features 12490 15460
6.5 Classification
To test and compare the effectiveness and performance of the proposed approaches, we will perform a series of tests on all the programmed algorithms with different parameters that are summarized in this section. First, we will test the approach based on SVMs, then that based on neural networks and, finally, we will test the hybrid approach BSO-CHI-SVM.Individual tests on each approach will be carried out to determine the best parameters for each algorithm. The performance (execution time, quality of results, etc.) will be measured for all approaches in order to make a comparison. For the implementation we have used lib-SVM 2 to develop solutions that are based on SVMs and we used the toolbox nnet 3 (Neural Network Toolbox) to develop our network of neurons.The following parameters: Kernel Type, Cost, Degree, Gamma, Coef0, Compute probability Estimates, Use shrinking heuristics are experimental parameters of SVMs. We set these parameters by experimentation.
2 http://www.csie.ntu.edu.tw/~cjlin/libsvm/ 3 http://www.mathworks.com/help/toolbox/nnet/
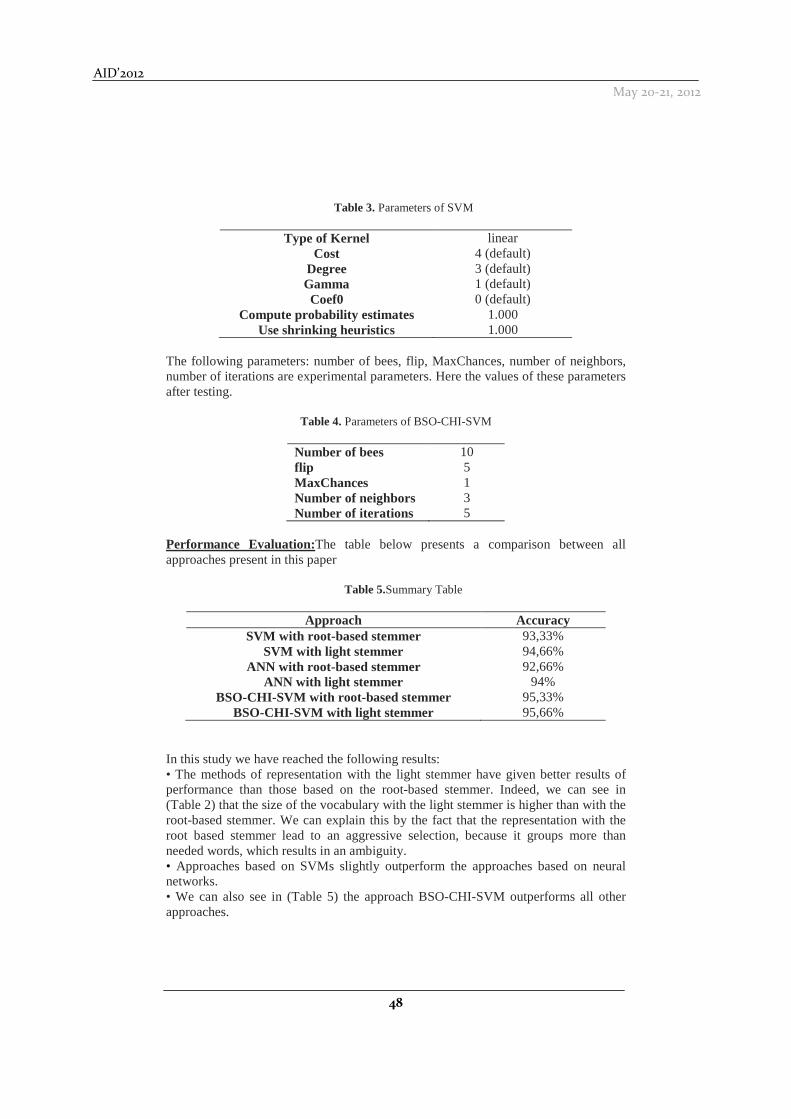
48
AID’2012
May 20-21, 2012
Table 3. Parameters of SVM
Type of Kernel linear
Cost 4 (default) Degree 3 (default) Gamma 1 (default) Coef0 0 (default)
Compute probability estimates 1.000 Use shrinking heuristics 1.000
The following parameters: number of bees, flip, MaxChances, number of neighbors, number of iterations are experimental parameters. Here the values of these parameters after testing.
Table 4. Parameters of BSO-CHI-SVM
Number of bees 10 flip 5 MaxChances 1 Number of neighbors 3 Number of iterations 5
Performance Evaluation:The table below presents a comparison between all approaches present in this paper
Table 5.Summary Table
Approach Accuracy SVM with root-based stemmer 93,33%
SVM with light stemmer 94,66% ANN with root-based stemmer 92,66%
ANN with light stemmer 94% BSO-CHI-SVM with root-based stemmer 95,33%
BSO-CHI-SVM with light stemmer 95,66% In this study we have reached the following results: • The methods of representation with the light stemmer have given better results of performance than those based on the root-based stemmer. Indeed, we can see in (Table 2) that the size of the vocabulary with the light stemmer is higher than with the root-based stemmer. We can explain this by the fact that the representation with the root based stemmer lead to an aggressive selection, because it groups more than needed words, which results in an ambiguity. • Approaches based on SVMs slightly outperform the approaches based on neural networks. • We can also see in (Table 5) the approach BSO-CHI-SVM outperforms all other approaches.

49
AID’2012
May 20-21, 2012
• The execution time for the approach of SVMs is lower than that of neural networks. • Despite that, the approach BSO-CHI-SVM is the most effective though it requires more learning time than the other approaches. But we notice that in the case of the automatic classification of documents, the learning time is not very important. Indeed, after the learning takes place, we save the learned model. This model will later allow us to predict the class membership of new documents.
7 Conclusion
We have presented in this paper the results of using three approaches for the automatic categorization of Arabic texts: neural networks, support vector machines and a hybrid approach BSO, Chi Square, SVM. We explained the approaches and presented the results of the implementation using two modes of representation: root-based stemming and light stemming. The evaluation was done with the accuracy as a measure of performance on the Open Source Arabic Corpora (OSAC). We have implemented all three approaches and showed that the approaches based on the representation with a light stemmer slightly outperform those based on a Root-Based stemmer. The results of the evaluation of these approaches have also shown that the approaches based on SVMs outperform those based on neural networks. In particular, the hybrid approach BSO-CHI-SVM has proven to be the most efficient. Indeed with this approach we achieved a degree of accuracy of 95.67%.
We believe we have largely accomplished our goal and we sincerely hope that our achievement be the basis of further research. We envision the further development of this work in several directions. We intend to evaluate these approaches on other corpora. We also want to use other modes of text representation such as n-grams or representation by concepts. Another interesting direction is to use other methods of dimensionality reduction such as information gain or mutual information. It will also be interesting to use other learning algorithms such as k-Nearest Neighbors, decision trees, and Hidden Markov Models. The hybrid approach BSO-CHI-SVM can also be assessed using other classifiers, e.g. the C4.5 algorithm and/or with another method of reducing the vocabulary, for example with mutual information. Lastly, we can consider the use of other meta-heuristics, such as optimization by particle swarm (PSO).
References
Al-Harbi, S., Almuhareb, A., Al-Thubaity, A., Khorsheed, M. S., & Al-Rajeh, A. (2008).Automatic Arabic Text Classification.Text, 77-84. Retrieved from http://eprints.ecs.soton.ac.uk/22254/
Al-shalabi, R., Kanaan, G., & H. Gharaibeh, M. (2006).Arabic Text Categorization Using kNN Algorithm.4th International Multiconference on Computer Science and Information Technology (CSIT 2006). Amman, Jordan.
Blum, A. L., & Rivest, R. L. (1992). Training a 3-node neural network is NP-complete. Neural Networks, 5(1), 117-127. Elsevier.doi:10.1016/S0893-6080(05)80010-3

50
AID’2012
May 20-21, 2012
Drias H, Sadeg S, Y. S. (2005). Cooperative bees swarm for solving the maximum weighted satisfiability problem. he 8th International Workshop on Artificial Neural Networks, IWANN. Barcelona, Spain.
Fouzi Harrag, Eyas El-Qawasmah, Abdul Malik, S. A.-S. (2011). Stemming as Feature Reduction Technique for Arabic Text Categorization. 10th International Symposium on Programming and Systems (ISPS) (pp. 128-133).
Hmeidi I., Hawashin B., E.-Q. E. (2008).Performance of KNN and SVM classifiers on full word Arabic articles.Advanced Engineering Informatics, 22(1), 106-111.
Jalam, R., & Chauchat, J.-hugues. (2003). Pourquoi les n-grammes permettent de classer des textes ? Recherche de mots-clefs pertinents à l’aide des n-grammes caractéristiques. 6èmes Journées internationales d’Analyse statistique des Données Textuelles (pp. 381-390). Malo France.
Joachims, T. (1998). Text Categorization with Support Vector Machines : Learning with Many Relevant Features. ECML-98, 10th European Conference on Machine Learning (pp. 137-142). Springer Verlag, Heidelberg.
Kanaan, G, Al-Shalabi, R., & Al-Akhras, A. (2006).KNN Arabic Text Categorization Using IG Feature Selection.the 4th International Multiconference on Computer Science and Information Technology (CSIT 2006),. Amman, Jordan.
Kessler, R., Manuel, J., Marc, T.-moreno, & EL-BEZE, M. (2004).Classification thématique de courriels avec apprentissage supervisé , semi supervisé et non supervisé. Laboratoire d’Informatique d’Avignon – Universite d’Avignon.
Kourdi, M. E. L., Elkourdi, M., Bensaid, A., & Rachidi, T. (2004). Automatic Arabic Document Categorization Based on the Naïve Bayes Algorithm.Proceedings of COLING 20th Workshop on Computational Approaches to Arabic Script-based Language (pp. 51-58). Geneva: Association for Computational Linguistics. doi:10.3115/1621804.1621819
Mesleh, A. M. (2008). Support Vector Machine Text Classifier for Arabic Articles: Ant Colony Optimization Based Feature Subset Selection. the Arab Academy for Banking and Financial sciences.
Platt, J. C. (1999). Fast Training of Support Vector Machines.Advances in Kernel Methods - Support Vector Learning,MIT Press, 185-208.
Saldarriaga, S. P. (2005). Approches textuelles pour la catégorisation et la recherche de documents manuscrits en-ligne. Université de Nantes.
Sciences, F. (2007). Chi Square Feature Extraction Based Svms Arabic Language Text Categorization System. Journal of Computer Science, 3(6), 430-435.
Tzeras, K., Hartmann, S., Darmstadt, T. H., Informatik, F., & Darmstadt, W.-. (1993). Automatic Indexing Based on Bayesian Inference Networks. 16th ACM International Conference on Research and Development in Information Retrieval (pp. 22-34). New York, US: ACM Press. Retrieved from http://www.darmstadt.gmd.de/~tzeras/FullPapers/gz/
Yang, Y. (1999).An Evaluation of Statistical Approaches to Text Categorization.Information Retrieval, 1, 69-90.

51
AID’2012
May 20-21, 2012
Genetic, Immune and Classification Algorithms for Bitmap Join Index Selection
Amina GACEM1, Billel SAM2, Kouceyla HADJI2 and Kamel BOUKHALFA2
1ESI, Algiers, Algeria
2USTHB, Algiers, Algeria
[email protected], [email protected], [email protected], [email protected]
Abstract.Bitmap join indexes are designed to prejoin the facts and dimension tables in data warehouses modeled by a star schema. Bitmap join indexes are defined on the fact table using attributes which belong to one or many dimension tables. The index selection process has become an important issue regarding the complexity of the search space to explore. Thus, the indexes can be defined on several attributes from several dimension tables (that may contain hundreds of attributes). However, only a few selection algorithms were proposed. In this article, we present a bitmap join indexes selection approach based on three algorithms: genetic, immune and clustering algorithms. An experimental study was conducted on the dataset generated from APB-1 benchmark in order to compare the proposed algorithms.
1 Introduction
The data warehouses (DW) are generally modeled by a star schema which contains a central and large fact table, and dimension tables describing the facts [Kimball and Strehlo, 1995]. The fact table contains the dimension tables keys (foreign keys) and measures. Data warehouses are used in an on-line analysis processing (OLAP) to perform complex decision queries. These queries require the execution of a multitude of joins between the fact and dimension tables, therefore making the execution more costly. The cost becomes more prohibitive when huge data are accessed by those queries. So, in order to reduce the execution time of queries, the loading data cost during performing queries has to be reduced. The query optimization is obtained by selecting optimization structures during the physical design phase. Indexes have already shown their performance in the traditional databases. We can mention B-trees and their variants [Comer, 1979], and join indexes [Valduriez, 1987]. However, the indexing techniques used in databases are not adapted to data warehouse environments [Bellatreche et al., 2007]. Therefore, many indexation techniques dedicated to data warehouses have emerged like bitmap indexes [Chan and Ioannidis, 1998] which optimize the selection operations defined on attributes belongingto dimension tables, star join indexes which store the result of executing a join between many tables [Systems, 1997] and the bitmap join indexes (BJI) [O’Neil and Graefe,

52
AID’2012
May 20-21, 2012
1995] which best fit the DW because they optimize the star joins and selection operations defined on dimension tables.
When selecting a BJI, many configurations are possible. We can create as much indexes as existing attributes in the dimension tables. However, indexes require enough space storage, so not all attributes can be indexed, thus, only indexes that improve significantly the queries performance must be chosen. There is a multitude of work that aim to automate the selection of BJI, they consist of two phases: (1) pruning search space to reduce the selection problem’s complexity by using data mining algorithms [Aouiche et al., 2005,Bellatreche et al., 2008] or algorithms based on other optimization structures as horizontal partitioning [Bellatreche et al., 2007,Stöhr et al., 2000] and (2) Execution of greedy algorithm to determine a final configuration of indexes [Bouchakri et al., 2011,Bellatreche and Boukhalfa, 2010,Bellatreche et al., 2007,Aouiche et al., 2005]. These approximate algorithms can be divided into two categories: greedy algorithms, and complex algorithms such as heuristics, genetic algorithms, artificial immune algorithms and data mining algorithms. The cost-based greedy algorithms used to select a configuration of BJI were the subject of many works [Aouiche et al.,2005, Bellatreche et al., 2007,Bellatreche and Boukhalfa, 2010]. The selection of a BJI using a genetic algorithm was mentioned in [Bouchakri et al., 2011]. Our analysis of the literature leads us to conclude only a few works focus on complex algorithms. Thus, we propose in this article to use complex algorithms such as the genetic algorithms, artificial immune algorithms, datamining algorithms, more specifically, k-means. This paper is organized as follows: section 2 explains the BJI selection problem and its principle. Section 3 presents our BJI selection approach with specific details for each complex algorithm. Following that, in the section 4, we describe our experimental study to compare the results obtained by the algorithms. We conclude the paper in the section 5.
2 BJI Selection: Principle and Problem
BJI are defined on the fact table using attributes that reference one or many dimension tables in order to make the join operations more efficient in the star schema. A bitmap representing the fact table’s rows is created for each distinct value of the attribute that belongs to the dimension table on which the index is defined. The bit I of the bitmap equals 1 if the row that corresponds to the value of the indexed attribute can be joined with the row I of the fact table. Otherwise, the bit equals 0. Many BJI are eligible, so the Data Warehouse Administrator (DWA) has to choose one configuration, which is a complex task.
The binary nature of BJI improves query performance by allowing to apply logical operations AND, OR, NOT, etc. BJI are also very helpful for Count(*) queries since only BJI have to be interrogated to answer those queries. We can illustrate this property in the example below: figure 1 represents a star schema with the fact table sales and the dimension table customer. Let’s have the query Q1:

53
AID’2012
May 20-21, 2012
SELECT count(*) FROM Sales S,Customer C WHERE S.SID=C.SID AND C.Gender=’F ’ To improve execution time of this query, the DWA creates a BJI on the attribute gender with the following SQL command:
CREATE BITMAP INDEX BJI_Gender ON Sales(Customer.Gender) FROM Sales S, Customer C WHERE S.SID=C.SID
When executing the query Q1, the optimizer reads the bit vectors associated to the value ’F’ and computes the number of ’1’ in the result vector.
The BJI Selection Problem (BJISP) is known NP-complete [Aouiche et al.,2005, Boukhalfa et al., 2010]. We can formalize the problem as follows: given a DW with d dimension tables D={D 1,D2, ...,Dd}and a fact table F, a workload Q={Q1,Q2, ...,Qm}where each query has a frequency Fj , a set of indexable candidates attributes AS= {A1,A2, ...,An}and a storage space S. The BJISP intends to select a BJI configuration CI reducing the execution cost of Q and respecting the storage bound. If the DWA wishes to select one index amongst n indexable attributes, he must evaluate 2n−1 possible configurations [Bellatreche and Boukhalfa, 2010]. To select several BJI defined on one or more attributes, he must evaluate 22n−1 − 1 possible configurations [Bellatreche and Boukhalfa, 2010].
Fig. 1.an example of a bitmap join index
Several works in the literature propose BJI selection approaches. Authors in [Aouiche et al., 2005] propose BJI selection approach based on a datamining algorithm named Close [Pasquier et al., 1999]. Close is used to search closed frequent itemset in order to prune the search space. A greedy algorithm is then executed to select a final

54
AID’2012
May 20-21, 2012
configuration of BJI. Authors in [Aouiche et al., 2005] took into account the frequencies of accessing attributes as the only criteria to generate frequent itemset, which do not allow the selection of an efficient BJI set. To solve this problem, authors in [Bellatreche et al., 2008] present the DynaClose algorithm which enriches the Close algorithm by adding new parameters like the size of the dimension tables, the size of the system page, etc. Following that, a greedy algorithm is used to select a final BJI configuration. [Bellatreche et al., 2007,Stöhr et al., 2000] select an indexation schema by selecting at first a horizontal partitioning schema, which decreases the number of eligible indexes and hence the complexity of BJISP, then a BJI configuration is selected using a greedy algorithm over attributes not used to partition the DW. Authors in [Bouchakri et al., 2011] use a genetic algorithm to select BJI. The following section details the proposed approach based on three algorithms genetic, artificial immune and datamining algorithms.
3 Our approach to select BJI configurations
We have defined approaches that exploit a workload consisting of frequent queries and output a configuration of indexes reducing the execution cost of this workload. We began by extracting indexable attributes from the workload. We then prune the set of these attributes to determine eligible attributes. These attributes are used to build a query-attributes matrix. This matrix is then employed by our algorithms. The generation of BJI schema is done by exploiting the analysis of the algorithms and the metadata. Figure 2 shows the principle of our approaches. Much more details of our approaches are available below.
Fig. 2.our BJI selection approaches architecture
55
AID’2012
May 20-21, 2012
3.1 BJI Selection with Genetic Algorithm
Genetic algorithms were the subject of many works about optimization techniques in DW such as horizontal partitioning [Bellatreche and Boukhalfa, 2005] and bitmap join indexes [Bouchakri et al., 2010]. Genetic Algorithms (GA) are search methods based on the concept of evolutionary natural mutation and survival of those most suitable individuals. They provide solutions for problems with no computable solutions in reasonable time. An initial population of chromosomes is created randomly and then submitted to an evaluation process that aims to improve its quality. The GA employs basically three operations: selection, crossover and mutation. In each step, also called generation, a new population is produced, made up of individuals that are better adapted to their environments; their adaptation is estimated with an objective function. As the generations follow one another, the individuals tend to approach the objective function optimum.
The most difficult thing in a GA is to determine the structure of the chromosome which impacts significantly its efficiency. In our approach, every chromosome represents a potential BJI defined on one or more attributes. Let A be a set of indexable attributes A={a1, a2, ..., an}. From this set will be created several indexes where each chromosome contains a group of columns used to define BJI. Therefore, the size of each chromosome that belongs to a same population is not equal, it is valued between 1 and the cardinality of A. Nonetheless, every chromosome has to check the following condition: let I a BJI, ∀ (ai, aj) ∈I, {ai≠ aj}.
For instance, let A be the set of indexable attributes A = {a1, a2, a3, a5, a7, a6, a8}, the figure 3 shows 3 populations: PA contains 3 chromosomes (3 BJI), PB contains 2 chromosomes and PC one chromosome. We indicate that the PC population is forbidden because it does not follow the rule on the chromosomes. Selecting the individuals is led through a tournament selection. An individual is selected randomly in the population and the strongest individuals are elected to participate in the next generation, thus, in each generation, the weakest individuals are eliminated. Crossover is a genetic operator that combines two chromosomes (parents) to produce a new chromosome (child). The idea behind crossover is that the new chromosome may be better than both of the parents if it takes the best characteristics from each of the parents. Crossover occurs during evolution according to a user-definable crossover probability. In our problem, we use the cross operator with this strategy: when the algorithm iterates, child1 inherits the genes from two parents that possess the best affinity, the child2 inherits genes from one parent with low affinity and another parent with high affinity. These new individuals replace the weakest individuals. Mutation is a genetic operator that alters one ore more gene values in a chromosome from its initial state. This can result in entirely new gene values being added to the gene pool. With these new gene values, the genetic algorithm may be able to arrive at a better solution than was previously possible. In our mutation method, a column is chosen and altered randomly on an individual.

56
AID’2012
May 20-21, 2012
Fig. 3.example of a chromosome coding
3.2 BJI Selection with K-means Classification Algorithm
K-means [MacQueen, 1967] is the most known algorithm in the data classification community. This algorithm is iterative. It starts up with a set of reference points. At the beginning, the points are partitioned into K classes. A point belongs to a class if the class’s reference point is the nearest reference point to it. The update of reference points and the assignments of data points to the classes are made during the iterations. Finally, the algorithm tends to minimize an objective function (squared error function). K-means offers the opportunity to converge rapidly to the solution. It avoids scanning the different observations and compares only with the classes centers. This algorithm is able to deal with a huge amount of data and can detect the extreme values and isolate them. We have adapted K-means to our problem as follows: let A be a set of indexable attributes extracted from the queries A={a1, a2, ..., an}and S a constraint that defines a bound on the storage space. Our goal is to determine a disjoint distribution of all indexable columns in A, in order to determine an optimal index configuration that does not violate the condition S. K is the number of indexes to manage. The columns are classified according to their affinities. Once K-means has been executed on the set A, one configuration consisting of K indexes will be created. In the case where size of selected BJI exceeds S, a cost-based greedy algorithm refines the solution by keeping efficient BJI that improve the performance without violation of the storage condition.
3.3 BJI Selection with Artificial Immune System
To resolve complex problems, many ideas inspired from natural mechanisms were exploited in order to develop heuristics. The Artificial Immune System (AIS) is a meta-heuristic that combines features of natural immune systems such as memorization, learning and adaptations. Unlike some other bio-inspired techniques, such as genetic algorithms and neural networks, the field of AIS encompasses a spectrum of algorithms that exist because different algorithms implement different properties of different cells. All AIS algorithms mimic the behavior and properties of immunological cells, specifically B-cells, T-cells and dendritic cells (DCs), but the resultant algorithms exhibit differing levels of complexity and can perform a range of tasks [Ishida, 2004]. The immune learning algorithm requires the use of antigens as learning data, the system has to produce antibodies. In the context of our work, we have considered BJI as antibodies, and the queries as antigens. The general schema of the selection by AIS is illustrated in the figure 4. The selection consists of two phases: initialization and

57
AID’2012
May 20-21, 2012
antigen presentation. In the first phase, an initial BJI configuration is generated randomly. In the second phase, a succession of immune operators is applied iteratively to sharpen the configuration.
1) Initialization: Each BJI is coded as a series of numbers where each number represents an attribute with a size that cannot exceed the number of indexable attributes. Let have the following three queries:
Q1: SELECT * FROM ACTVARS A,PRODLEVEL P, TIMELEVEL T WHERE A.TIME =T.TID AND A.PRODUCT= P.CODE AND T.YEA R> 2000 AND P.RETAILER= ’value1’ AND P.LINE =’value2’; Q2: SELECT * FROM ACTVARS A,PRODLEVEL P, TIMELEVEL T WHERE A.TIME =T.TID AND A.PRODUCT= P.CODE AND T.QUARTER= ’trim1’ AND T.WEEK= 4 AND P.CLASS=’class1’ AND P.DIVISION= ’div12’;
Fig. 4.our AIS based approach for BJI selection
Q3 : SELECT * FROM ACTVARS A,CHANLEVEL C, TIMELEVEL T WHERE A.TIME =T.TID AND A.CHANNEL=C.BASE AND T.DAY= 24 AND C.ALL= ’tte’ AND C.GROUP=’G1’; The indexable attributes are: A0 : Retailer, A1 : Line, A2 : Year, A3 :Quarter, A4 : Week, A5 : Class, A6 : Division, A7 : Day, A8 : All, A9 :Group. For example, we have an BJI coded as (4,9,1) (which means the index is defined on Week, Group and Line. Let POP be the list of BJI to create.
2) Antigen presentation: for each query Qi, do: (a) Clonal selection and expansion: computes the affinity of each BJI of the
POP list with the query R by building a query-attribute matrix MUA. If the affinity overtakes a threshold defined at the beginning, the BJI will be elected and duplicated following the affinity value. Thus, BJI that appears

58
AID’2012
May 20-21, 2012
most in the maximum of queries will be the most duplicated index. Let CLN be the list of chosen and cloned BJI.
(b) Maturation affinity: each clone in CLM is muted inversely to its affinity. The number of mutations to do equals the size of BJI - its affinity. In the previous example, the size of BJI (4,9,1) equals 3 and the affinity is 1. Hence, the number of mutation is 3 - 1= 2.
(c) Clonal interactions: represents in our problem the network interaction or affinities between BJI. The affinity between two BJI is computed by summing the affinities between all their attributes, this by building an attributes affinity matrix AAM.
(d) Clonal deletion: removes BJI that have all their affinities with other BJI inferior to predefined threshold (computed experimentally) and store the rest of indexes in a MEM list. To define the affinity between a BJI and other BJI, we sum the affinities of the BJI with others indexes that belong to MEM.
(e) Meta-dynamic: eliminates the BJI that have their affinity with antigen Qi inferior to predefined threshold from MEM (the affinity of BJIi with Qi is already defined in the point a).
(f) Network Construction: incorporates the remaining BJI of MEM with the BJI of the network, this new list is RES, and it was initially empty.
(g) Network Interactions: determines the similarity between each pair of BJI of the network from the matrix AAM by computing the affinity between two BJI as seen in point c.
3) Cycle: repeats these steps until the end. MEM contains the BJI selected according to a query Qi. RES contains the best elements of MEM, and then, every MEM query will be initialized at null value, in contrast with RES which will be initialized at the launch of the process.
Fig. 5.performance of proposed Fig. 6.storage cost : case 5 BJI algorithms: case 5 BJI
3.4 Cost Model
To guide the selection of BJI by the algorithms described above, we use a cost model that calculates the cost of executing the queries in the context of a given indexes configuration. This cost model relies on an objective function which evaluates all solutions generated by our algorithms. The cost model is presented in [Aouiche et al., 2005]. Let Configci and Nci be selected BJI and their cardinalities respectively. In order to evaluate the quality of this configuration of indexes, two cost models are used: the
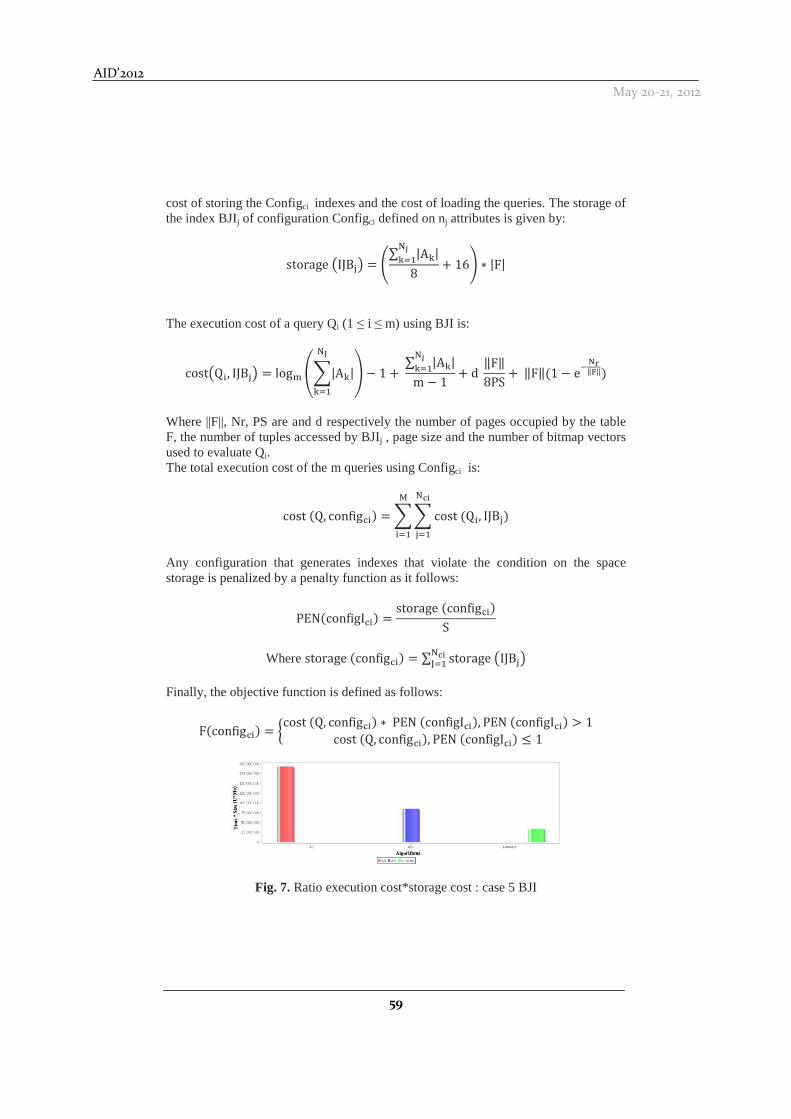
59
AID’2012
May 20-21, 2012
cost of storing the Configci indexes and the cost of loading the queries. The storage of the index BJIj of configuration Configci defined on nj attributes is given by:
storage�IJB>� = ?∑ |AB|CDBE�8 + 16H ∗ |F| The execution cost of a query Qi (1 ≤ i ≤ m) using BJI is:
cost�QM, IJB>� = logO PQ|AB|CRBE� S − 1 +∑ |AB|CDBE�m− 1 + d ‖F‖8PS +‖F‖�1 − e*YZ‖[‖�
Where ||F||, Nr, PS are and d respectively the number of pages occupied by the table F, the number of tuples accessed by BJIj , page size and the number of bitmap vectors used to evaluate Qi. The total execution cost of the m queries using Configci is:
cost�Q, config_M� = QQcost�QM, IJB>�C`a>E�
bME�
Any configuration that generates indexes that violate the condition on the space storage is penalized by a penalty function as it follows: PEN�configI_M� = storage�config_M�S
Where storage�config_M� = ∑ storage�IJB>�C`aeE�
Finally, the objective function is defined as follows: F�config_M� = fcost�Q, config_M� ∗ PEN�configI_M�, PEN�configI_M� > 1cost�Q, config_M�, PEN�configI_M� ≤ 1
Fig. 7. Ratio execution cost*storage cost : case 5 BJI

60
AID’2012
May 20-21, 2012
4 Experiments
We conduct an experimental study to compare our different algorithms by using the mathematical cost model defined in [Aouiche et al., 2005]. Hence, we have tested these algorithms on an Intel machine Core I3 with 3 GB of memory and storage disks of 500 GB. On this machine we have installed an APB1 [Council, 1998] benchmark with Oracle DBMS 11g. The APB benchmark contains a star schema with a fact table Actvars (24 786 000 rows), Prodlevel (9000 rows), Custlevel (900 rows), Timelevel (24 rows) and Chanlevel (9 rows). We decide to run the five most frequent queries. In our experiment, we execute each selection algorithm: GA, AIS, K-means under a constraint on the storage space = 3 GB (parameters of GA are: crossover rate = 1, Mutation Rate = 0.3, size of population = 50, number of generations = 50). Each algorithm generates a set of 5 BJI. In the first test, for each query and each selection algorithm, we measure the execution cost of each query using BJI selected by each algorithm (figure 5) and the storage cost of generated BJI costs (figure 6). From the figure 5, we observe that the genetic algorithm generates a configuration that makes it possible for every query to run faster. But the storage rate (figure 6) of indexes created by GA is dramatically higher than storage rates of indexes obtained with other algorithms (AIS and K-means). So the GA generates large BJI which reduce the execution cost of queries. Consequently, a compromise has to be made between both execution and storage cost. To achieve this, we have defined a variable that combines these two parameters by multiplying the execution and storage costs. The results are presented in figure 7. The immune algorithm AIS gives better results than GA and K-means. To test the efficiency of the algorithms when the constraint on the storage space is relaxed, we set a value of 5 GB to the storage space. The execution of every algorithm has induced to the creation of 10 BJI. The figures 8 and 9 show respectively the execution cost of queries in the presence of 10 BJI produced by each algorithm and the ratio of execution cost to the storage cost of BJI. We notice that the immune algorithm AIS has generated a configuration that reduces the execution cost of all queries while optimizing the required storage space. This algorithm provides better results than GA and K-means. Thus, the DWA can use it in the case he has sufficient storage space available to implement indexes.
Fig. 8.Performance of proposed Fig. 9. Ratio execution cost*storage cost algorithms: case 10 BJI : case of 10 BJI

61
AID’2012
May 20-21, 2012
5 Conclusion
In this paper, we focus on the optimization of complex queries defined on star schema DWs and propose new approaches to select BJI. Nonetheless, it is absolutely impossible to select all eligible indexes because of the storage space. Therefore, we employed datamining techniques and meta-heuristics that bring solutions which tend to approach the optima and decreases the complexity of this problem. We have presented three algorithms to select BJI: genetic algorithms, immune algorithms and datamining algorithm (K-means). All the algorithms aim to reduce the time needed to execute the queries load without any violation of the condition on storage space by using mathematical cost model. At the end, we described the tests made to compare these algorithms. We suggest as a continuation of this work (1) configure empirically the parameters of the algorithms to achieve better results, (2) introduce an intelligent agent that prunes automatically the attributes and the queries, (3) integrate these approaches with others optimization techniques such as horizontal and vertical partitioning, (4)consider a large query load to scaling.
References [Aouiche et al., 2005] Aouiche, K., Boussaid, O., and Bentayeb, F. (2005).Automatic Selection of Bitmap Join Indexes in Data Warehouses. pages 64–73. [Bellatreche and Boukhalfa, 2005] Bellatreche, L. and Boukhalfa, K. (2005).An evolutionary approach to schema partitioning selection in a data warehouse environment.Proceeding of the International Conference on Data Warehousing and Knowledge Discovery (DAWAK’2005), pages 115–125. [Bellatreche and Boukhalfa, 2010] Bellatreche, L. and Boukhalfa, K. (2010). Yet another algorithms for selecting bitmap join indexes. In In International Conference on Data Warehousing and Knowledge Discovery (DaWaK’2010), pages 105–116. [Bellatreche et al., 2007] Bellatreche, L., Boukhalfa, K., and Mohania, M. (2007). Pruning search space of physical database design. In 18th International Conference On Database and Expert Systems Applications (DEXA’07), pages 479–488. [Bellatreche et al., 2008] Bellatreche, L., Missaoui, R., Necir, H., and Drias, H. (2008). A data mining approach for selecting bitmap join indices.Journal of Computing Science and Engineering, 2(1):206–223. [Bouchakri et al., 2010] Bouchakri, R., Bellatreche, L., and Boukhalfa, K. (2010). Une approche par k-means de s´election multiple de structures d’optimisation dans les entrepôts de données. In 6ème Journée Francophone sur les Entrepôts de données et l’Analyse en ligne (EDA’10), Revue des Nouvelles Technologies. [Bouchakri et al., 2011] Bouchakri, R., Bellatreche, L., and Boukhalfa, K. (2011). Sélection statique et incrémentale des index de jointure binaires multiples. In 7ème Journée Francophone sur les Entrepôts de données et l’Analyse en ligne (EDA’11),Revue des Nouvelles Technologies RNTI, France. [Boukhalfa et al., 2010] Boukhalfa, K., Bellatreche, L., and Ziani, B. (2010). Index de jointure binaires: Stratégies de sélection et étude de performances. In 6ème JournéesFrancophone sur les Entrepôts de données et l’Analyse en ligne (EDA’10), Revue des Nouvelles Technologies.

62
AID’2012
May 20-21, 2012
[Chan and Ioannidis, 1998] Chan, C. Y. and Ioannidis, Y. E. (1998).Bitmap index design and evaluation.Proceedings of the ACM SIGMOD International Conferenceon Management of Data, pages 355–366. [Comer, 1979] Comer, D. (1979).The ubiquitous b-tree.ACM Comput. Surv.,11(2):121–137. [Council, 1998] Council, O. (1998).Apb-1 olap benchmark, release ii.http://www.olapcouncil.org/research/bmarkly.htm. [Ishida, 2004] Ishida, Y. (2004). Immunity-Based-Systems: A Design Perspective. Verlag/ Jahr: Springer. [Kimball and Strehlo, 1995] Kimball, R. and Strehlo, K. (1995). Why decision support fails and how to fix it. SIGMOD Record, 24(3):92–97. [MacQueen, 1967] MacQueen, J. B. (1967). Some methods for classification and analysis of multivariate observations. In Proceedings of 5th Berkeley Symposium on Mathematical Statistics and Probability”, Berkeley, University of California Press, pages 281–297. [O’Neil and Graefe, 1995] O’Neil, P. and Graefe, G. (1995). Multi-table joins through bitmapped join indices. SIGMOD Record, 24(3):8–11. [Pasquier et al., 1999] Pasquier, N., Bastide, Y., Taouil, R., and Lakhal, L. (1999). Discovering frequent closed itemsets. ICDT, pages 398–416. [Stöhr et al., 2000] St¨ohr, T., M¨artens, H., and Rahm, E. (2000).Multi-dimensional database allocation for parallel data warehouses. In Proceedings of the International Conference on Very Large Databases, pages 273–284. [Systems, 1997] Systems, R. B. (1997). Star schema processing for complex queries. White Paper. [Valduriez, 1987] Valduriez, P. (1987). Join indices. ACM Transactions on Database Systems, 12(2):218–246.

63
AID’2012
May 20-21, 2012
A Genetic Algorithm to Solve University Timetabling Problem
Alaa Eddine BELFEDHAL1
1Djillali Liabes University of Sidi Bel-Abbes
Abstract.The timetabling problem is a well-known NP-hard combinatorial optimization problem. It consists in scheduling a number of lecturers within a limited number of time periods (per week) and rooms, respecting some hard and soft constraints. A timetable must satisfy all hard constraints to be feasible, and must comply whenever possible with the soft constraints. In this paper we proposed a genetic algorithm to solve the university timetabling problem. The proposed algorithm uses genetic operators adapted to the timetabling problem that always generate feasible timetables. Experimental results have shown that the proposed genetic algorithm is able to produce promising results.
Keywords.Timetabling, Genetic Algorithms, Combinatorial Optimization, Hard and soft constraints.
1 Introduction
Recently, the automatic generation of university timetables has received particular attention from researchers. This is mainly due to the fact that manual generation of timetables is very time and resources consuming (Manar and Shameem, 2011). Many different methods have being proposed in literature to resolve automated timetabling problem, including TABU Search (Alvarez-Valdés et al, 2001), Simulated Annealing (Abramson, 1991), Graph Coloring (Burke et al, 1993), Linear Programming (Boland et al, 2004) and Constraint Logic Programming (Gueret et al, 1995). Among the popular methods are Genetic Algorithms (GAs), which are an optimization technique that is suitable for solving hard and highly constrained problems. A growing number of researchers are now turning to GAs, as a powerful method of solving difficult timetabling problems (Manar and Shameem, 2011).
In this paper, we present a genetic algorithm to solve the timetabling problem. The general idea inspired by the work of Erben W. and Keppler J. (Erben and Keppler, 1995), is to generate an initial population where all individuals (timetables) meet hard constraints, then define genetic operators that generate always feasible individuals, the selection is then based on fulfillment of only soft constraints (hard constraints will always be respected). Unlike other approaches, like the approaches used by Colin D. Green (Colin, 1998), and S. Yangand (Yang and Jat, 2011) that consist of using random genetic operators, which often generate infeasible individuals, and selection is

64
AID’2012
May 20-21, 2012
based on fulfillment of both soft and hard constraints, this method and even after many iterations may give an end result that contains conflicts (which necessitates repair algorithms to have feasible solutions).
So the main contribution of this work is to propose specific genetic operators adapted to the timetabling problem, which generates only feasible timetables.
2 Related Works
GAs have been widely used in literature to solve timetabling problems. And researchers have proposed various GAs based timetabling approaches. For example, Sadaf N.J. and Shengxiang Y. (Jat and Yang, 2009) proposed a GA with a guided search strategy used to create offspring based on a data structure that stores information extracted from previous good individuals. They used also a local search technique to improve the quality of individuals by removing the hard constraints violations. The initial population is generated by randomly assigning events to timeslots and rooms and the objective function is a weighted sum of hard constraints and soft constraints violations.
Kanoh H. and Sakamoto Y. (Kanoh and Sakamoto, 2008) proposed a solution based on a GA which uses an knowledge base and an infection operation introduced by the use of Virus GA (Kanoh et al, 1997). The knowledge base consists on a set of candidate partial solutions of the final solution, and is built from timetables used in past years. Consequently, the timetable obtained can preserve the advantages of past timetables.
M.S. Kohshoriand M.S. Abadeh (Kohshoriand and Abadeh, 2012) presented three hybrid GAs for solving the university timetabling problem. In the proposed algorithms, fuzzy logic is used to measure violation of soft constraints in fitness function to deal uncertainly involved in real life data. Also, randomized iterative local search, simulated annealing and tabu search are applied, to improve exploitive search ability and prevent GA to be trapped in local optimum.
Abdullah et al (Abdullah et al, 2009), investigated a GA combined with a sequential local search for the timetabling problem. The proposed algorithm is divided into two phases: the construction phase and the improvement phase. The construction phase creates initial population, using three consecutive heuristics: a large degree heuristic, a neighborhood search and a Tabu Search. Timetables created through the construction phase are feasible timetables. The improvement phase then follows using a GA, in which the crossover technique used is a single point crossover. After the recombination process, a repair method is applied to transform an infeasible solution to a feasible one. Finally, a local search algorithm is applied to improve the timetable, before moving to the next generation.
65
AID’2012
May 20-21, 2012
3 Description of University Timetable Problem
The timetabling problem consists in scheduling a number of sessions (Lessons, Classes of students, Teachers) in a number of time periods (per week) and a number of rooms, satisfying a set of constraints of various types. These constraints can be divided into two categories:
Hard Constraints
These constraints are commons to all timetable problems, and they must be satisfied to obtain feasible solution. These constraints are:
No teacher can teach more than one course at the same time. No student can assist to more than one course at the same time. No room should be occupied by more than one class of students or more than one teacher simultaneously. All program courses must be ensured. Each course should be scheduled in an adequate room (e.g. labs), and rooms capacities must be taken into account.
Soft Constraints
These constraints must be respected as much as possible; it could be pedagogical constraints or constraints related to lecturers or students wishes. These constraints vary from one institution to another. Our constraints are:
Avoid empty periods (between two lessons), for students and teachers. Best respond to teachers wishes (free days or time periods). Group lecturer’s lessons over bounded periods. For a student section, the number of lessons 'lectures' is bounded by three per day (not consecutive).
Only one lesson 'lecture' during specific periods (after noon).
4 The Algorithm
4.1 Chromosomes Representation
A timetable ii is defined as a sub set of the Cartesian productj, Wherej = k × m × n × o × p and: k : The set of time periods. m : The set of all rooms. n : The set of all student classes (sections or groups). i : The set of all teachers.
p : The set of all lessons (lectures, labs and tutorials).
ii = { �r, s, t, u, v� ∈ k × m × n × i × p / Teacher u teach lesson v to the class t in the room s at the time period r. }

66
AID’2012
May 20-21, 2012
So a gene y is represented as a list of alphanumeric strings, such as: y� = �rzs�{�1, tv|}}4, s{{47, uz|tℎzs2, vz}}{5� A chromosome will be a set of these genes.
4.2 Generating the Initial Population
We have built an initialization procedure that randomly generates an initial population of feasible solutions (satisfying all hard constraints).
To generate each individual the procedure takes as input three lists, a list that contains the set of all sessions (the triplets (class, teacher, lesson)), another containing all rooms, and a third containing the set of all periods. The procedure takes each time an unscheduled session, this session is assigned to a time period and a room both selected randomly, without violating any physical constraints. The general algorithm is the following:
For� = 1 to population size do Generate an individual � as follows: While there are still unscheduled sessions do
1. Select an unscheduled session�t, z, v�, 2. Compute the set of periods k where the session can be scheduled without
creating conflict; 3. Calculate the set m of all adequate rooms where the session can be
programmed; 4. Construct a list p� that contains the pairs �r, s� constructed by the product k × m; 5. Construct a list p�′by removing from p� all pairs already occupied by other
sessions; 6. Choose a pair �r, s�randomly from p�′, then schedule the session �t, z, v�in
the periodr and the room s constructing the gene �r, s, t, z, v�; End While; End For.
Note that the initialization procedure takes into account only hard constraints, soft constraints will be taken in consideration by the selection process.
4.3 Evaluation and Selection
The evaluation function �is calculated as follows (Corne et al 1994): �:Set of solutions ⟶[0, 1]

67
AID’2012
May 20-21, 2012
���������|v� = 11 + ∑ rz|vu�� × �z�yℎu�#�E�
(1)
Where� : is the number of soft constraints.
Penalties are attributed to individuals for each unsatisfied soft constraints (Erben and Keppler, 1995). A penalty rz|vu�� is assigned when the constraint � is not satisfied. For example the penalty rz|vu�� may be the number of empty periods ‘holes’, penalty rz|vu��may be the number of times a section of students attend more than three sessions ‘lectures’ per day, etc..A weight �z�yℎu� is associated to each constraint � (depending to the importance of the constraint).
Note that we do not need to assign penalties to the violation of hard constraints, because our genetic operators generate only feasible timetables.
The evaluation function � takes values between 0 and 1, and our GA search for a timetable that maximizes this function. We still yet experience with different weights values �z�yℎu� because it's hard to decide which softconstraints are more important.
4.4 The Crossover
After having selecting two timetables j and � to crossing them, we generate two children n� and n$ by taking a portion of genes fromj and another portion from � to build n� and the rest to buildn$. But the question is how to realize this operation in such a way that the generated sons n� and n$be feasible timetables. Our proposal is as follows:
Build a bipartite undirected graph, whose vertices are the genes of j on one side and the genes of � on the other side. Vertices will be connected as follows (see Fig. 1):
For all gene y��r' , s' , t' , u', v'� of j establish edges between y�and following genes of �:
• The gene that contains the same time period and the same room as y� i.e. the
gene y.�r' , s' , −, −, −�, if it exists (there exists at most one).
• The gene that contains the same time period and the same student class as y� i.e. the gene y.�r', −, t' , −, −� , if it exists (there exists at most one).
• If t' is a student section, construct the set ��� containing groups of t', and
for each group �� ∈ ���establish an edge betweeny�and the gene which
contains �� and the same period as y� i.e. the gene y.�r', −, �� , −, −�, if it exists (there exists at most one).
• If t' is a student group (subgroup), establish an edge between y� and the gene which contains }' (Where }' is the section of the group t' ) and the

68
AID’2012
May 20-21, 2012
same time period as y� i.e. the gene y.�r' , −, }' , −, −� , if it exists (there exists at most one).
• The gene that contains the same time period and the same teacher as y� i.e. the gene y.�r' , −, −, u', −� , if it exists (there exists at most one).
• The gene that contains the same student class, the same teacher and the same lesson as y� i.e. the gene y.�−,−, t', u' , v'�, and if there are several genes, choose one of them randomly, and put it in a list to not choose it several times.
After having constructed the graph we obtain separate sub-graphs, we construct from these graphs two sets of partitions {j�} ,{��}, from j and � as follows : � = number of sub-graphs
For� = 1 to �do:
1. Put in j�all the genes of j that exists in the graph �; 2. Put in ��all the genes of� that exists in the graph �;
Then we built the first son n� by parts from jand �, by alternate the partsj� and ��(the first part of n� will bej�, the second part will be �$, the third part will be j� , and so on until �). The second son n$will be built by the remains parts (the first part of n$ will be ��, the second part will be j$, the third part will be �� , and so on until �)(see Fig. 2).
This crossover method will generate only feasible timetables. There will be no conflict because all the genes of j and�that cannot coexist in the same timetable (because of conflicts) will be in the same sub-graph and therefore cannot be in the same son. Also all sessions will be scheduled because each session in program is taken either fromj or from �(because each gene of j will be connected with a gene of �that contains the same session (the triple (class, teacher, lesson)).

69
AID’2012
May 20-21, 2012
Fig. 1.Example of a graph constructed from two timetables jand �.
Fig. 2. The two sons n� and n$ generated from jand �.

70
AID’2012
May 20-21, 2012
4.5 The Mutation
After having selecting a timetable ii to be mutated, a number is randomly chosen, then genes are randomly chosen to be removed from ii, the sessions of these genes will be put in a list p. This list is given to the initialization procedure with the rest of ii, so that sessions of the list p are reprogrammed in ii (randomly) to have a mutated timetable ii� . Since the initialization procedure generates only feasible timetables this mutation also generates only feasible timetables.
Another method that was used for the mutation is to exchange between two time periods. We randomly choose two time periods r�and r$, then we replace r�byr$in all genes containing r�, and vice versa. It is also clear that this method generates only legal timetables, since conflicts are connected to time, and since we replace all sessions of a period by all sessions of another period and vice versa, we are not going to create any conflict. And also the number of sessions is the same, so every session will be scheduled.
5 Implementation and Results
To test our proposition, a prototype was implemented using C++, and simulation experiments were done with a sub set of real data of our faculty, with incorporating all types of constraints. The results we obtained are good, but we still have a number of refinements, in particular we have to find the optimal parameters of the GA that was used.
Fig. 3 show the result of a test run that was performed, with the following parameters: population size 200 individuals, number of iterations 1500, crossover probability 0.8 and mutation probability 0.1. Execution time was about 2 hours.
Recall that our evaluation function takes values between 0 and 1, and must be maximized. The value of this function was between 0.38 and 0.49 for individuals of the initial population and after 1500 iteration between 0.82 and 0.88.

71
AID’2012
May 20-21, 2012
Fig. 3. Results of a run test.
6 Conclusion
Genetic algorithms are very promising approach to solve university timetabling, particularly because of their ability to consider, and optimize, the wide variety of different constraints and to explore efficiently the search space. In this paper we proposed a genetic algorithm to solve university timetabling. The proposed algorithm produces an initial population of feasible timetables, and uses specific adapted genetic operators to produce only feasible timetables across all generations. The experimental result shows that the proposed algorithm is able to produce good timetables.
References Abdullah, S., Turabieh, H., McCollum, B., Burke, E.K. (2009), An Investigation of Genetic Algorithm and Sequential Local Search Approach for Curriculum-based Course Timetabling Problems, In: Proc. Multidisciplinary International Conference on Scheduling: Theory and Applications (MISTA 2009), Dublin, Ireland, pp. 727-731.
Abramson, D. (1991) Constructing School Timetables using Simulated Annealing: Sequential and Parallel Algorithms. Management Science Vol. 37, No. 1 (Jan., 1991), pp. 98-113.
Alvarez-Valdés, R., Crespo, E., Tamarit, J.M. (2001), Tabu Search: An Efficient Metaheuristic For University Organization Problems. Revista Investigacion Operacional. Vol. 22, No. 2, 2001.
Boland, N., Hughes, B.D., Merlot, L.T.G., Stuckey, P.J..(2004), New Integer Linear Programming Approaches forCourse Timetabling.Journal of Computers and Operations Research.
0
0,1
0,2
0,3
0,4
0,5
0,6
0,7
0,8
0,9
1
0
10
0
20
0
30
0
40
0
50
0
60
0
70
0
80
0
90
0
10
00
11
00
12
00
13
00
14
00
15
00
be
st f
itn
ess
va
lue
s
Number of iterations

72
AID’2012
May 20-21, 2012
Burke, E.K., Elliman D.G., Weare, R. (1993), A University Timetabling System based on Graph Colouring and Constraint Manipulation. Journal of Research on Computing in Education.
Colin, D.G. (1998), Practical Handbook of Genetic Algorithms Complex Coding Systems, Volume III, Chapter 2. The Generalization and Solving of Timetable Scheduling Problems, Edited by Lance Chambers CRC Press 1998, ISBN: 978-0-8493-2539-7.
Corne, D., Ross, P., Fang, H.L. (1994), Fast Practical Evolutionary Timetabling. In Fogarty, T.C. :Evolutionary Computing. AISB Workshop, Leeds, U.K., April 11 13.Selected Papers.LNCS 865. Springer, Berlin: 250-263.
Erben, W., Keppler, J. (1995), A Genetic Algorithm Solving a Weekly Course-Timetabling Problem. PATAT 1995.
Gueret, C., Jussien, N., Boizumault, P., Prins, C. (1995), Building university timetables using constraint logic programming. In: Proc. of the 1st Int. Conf. on the Practiceand Theory of Automated Timetabling, pages 393-408.
Jat, S.N., Yang, S. (2009), A Guided Search Genetic Algorithm for the University CourseTimetabling Problem.The 4th Multidisciplinary International Scheduling Conference: Theory and Applications (MISTA 2009), Dublin, Ireland: 180 - 191, 10 - 12 Aug 2009.
Kanoh, H., Matsumoto, M., Hasegawa, K., Kato, N., Nishihara, S. (1997), Solving constraint-satisfaction problems by a genetic algorithm adopting viral infection, International Journal on Engineering Applications of Artificial Intelligence (1997),531–537.
Kanoh, H., Sakamoto, Y. (2008), Knowledge-based genetic algorithm for university course timetabling problems. International Journal of Knowledge-based and Intelligent Engineering Systems 12 (2008) 283–294.
Kohshoriand, M.S., Abadeh M.S. (2012), Hybrid Genetic Algorithms for University Course Timetabling. International Journal of Computer Science Issues, Vol. 9, Issue 2, No 2, March 2012.
Manar, H., Shameem, F. (2011), A Survey of Genetic Algorithms for the University Timetabling Problem. International Conference on Future Information Technology IPCSIT vol.13.
Yang, S., Jat, S.N. (2011), Genetic Algorithms and Local Search Strategies for University Course Timetabling, IEEE Transactions on Systems, Man, and Cybernetics, Part C: Applications and Reviews, Vol. 41, no. 1, pp. 93-106.
73
AID’2012
May 20-21, 2012
Economic Power Dispatching with Firefly Algorithm
Latifa DEKHICI 1, Khaled BELKADI 1, Abdelmoumene DEKHICI2
1 LAMOSI, computer sciences department, University of Sciences and the Technology
(USTOMB), Oran, Algeria
2 Maintenance department GP1/Z SONATRACH, Oran, Algeria
[email protected], [email protected], d.abdelmoumene@gmail
Abstract. Bio-inspired algorithms become among the most powerful algorithms for optimization. In this paper, we intend to provide an optimization of power dispatching by a Firefly Algorithm (FF). The application is done on an IEEE-14 nodes network with two generators by taking into account a constant power lost and on a CS4 power network. This recent metaheuristic can reach the best cost in few time.
Keywords. Firefly Algorithm, Power Dispatching, Otpimization, IEEE-14 nodes, cs4 power network.
1 Introduction
Currently, a set of bio-inspired metaheuristics based on the natural behavior of swarms, of bees, birds, and ants had emerged as an alternative to overcome the difficulties presented by conventional methods in the optimization. An economic power dispatching is one of the difficult optimization problems. Resolution by metaheuristics can avoid significant financial loss. In this paper, we adapt the firefly algorithm to economic dispatching problem. For this, we describe in the second section the given problem and its formulation. In the third section, we present the metaheuristic, its origin and its parameters. In the last section, we discuss the results of the metaheuristic on a sample network. Finally, we give a conclusion.
2 Power Economic Dispatching
2.1 Description
Economic dispatch problem has become a crucial task in the operation and planning of power system. The objective is to schedule the committed generating units output so as to meet the required load demand at minimum cost satisfying all unit and system operational constraints. Improvement can lead to significant cost saving (entre 0,03 $ et 0,20 $ per kWh) (Dahmane, 2011). Many methods were applied to this problem

74
AID’2012
May 20-21, 2012
and the most successful are metaheuristics as the neural network (Yalcinoz et Short,1998) and particle swarm optimization(Yu et al.,2007; Zhao et Jia Cao,2005).
2.2 Formulation
Having a network with N generators nodes where: r�) : Power of generator k
r� : Lost power.
r� : requested power.
Economic dispatch problem can be represented as a quadratic fuel cost objective function as described in (1).
��r�� = Q �#�r�)��
#E� . (1)
� : total cost
�# : Cost of node k
With considering equality constraint (2) to demand and inequality constraint (3).
Q r�) − r� = r��
#E�.
(2)
k�,OM� ≤ r�) ≤ k�,��' . (3)
A generator cost can be formulated by (4) �#�r�)� = |# + �#r�) + t#r�)
$ . (4)
So that: |# : Cost per hour of generator k
�# : Cost per hour and per Megawatt of generator k
t# : Cost per hour and per Megawatt of generator k
3 FireFly Algorithm
3.1 Inspiration
Fireflies, belong with family of Lampyridae, are small winged beetles capable of producing a cold light flashes in order to attract mates. They are believed to have a capacitor-like mechanism, that slowly charges until the certain threshold is reached, at which they release the energy in the form of light, after which the cycle repeats (Durkota,2011). Firefly algorithm, developed by (Yang, 2008) is inspired by the light attenuation over the distance and fireflies mutual attraction, rather than by the phenomenon of the

75
AID’2012
May 20-21, 2012
fireflies’ light flashing. Algorithm considers what each firefly observes at the point of its position, when trying to move to a greater light-source, than is his own. Cold light is a light producing little or no heat.
3.2 Algorithm
The Firefly Algorithm is one of the newest meta-heuristics developed by Yang (2008, 2009, 2010a, 2010b). One can find few articles concerning the continuous firefly algorithm (Aungkulanon,2011, Fizazi and Beghoura,2011; Gandomi et al,2011; Horng and Jiang 2010; Lukasik et Zak,2009). A validation of continuous firefly algorithm with functions optimization is given in (Yang, 2010a). Sayadi et al. (2010) proposed the first discrete version for permutation flow shop problem using a binary coding of solution and a probability formula for discretization. We can also find other discretization for economic problem such as (Basu and Mahanti,2011; Jati et al.,2011; Durkota,2011). Pseudo-code of the Firefly Algorithm (FF) may look as follows:
Algorithm 1.Pseudo code of the FF Metaheuristic. Procedure FF Metaheuristic (Nbr_gen: the maximal number
of generations) Begin γ: the light absorption coefficient Define the objective function of
f( x),where x=(x 1,....,x d) in domain d Generate the initial population of fireflies or xi (i=1,
.., nb) Determine the light intensity I i at xi via f( xi ) While (t<Nbr_Gen) For i = 1 to nb //all nb fireflies) For j=1 to nb //nb fireflies) if(I j > I i ) Attractiveness βi,j varies with distance r i,j move firefly i towards j with attractiveness βi,j else move firefly i randomly end if Evaluate new solutions update light intensity I i End for j End for i Rank the fireflies and find the current best t++ End while End procedure

76
AID’2012
May 20-21, 2012
3.3 Parameters
In the firefly algorithm, there are five important issues:
Light Intensity. In the simplest case for minimum optimization problems, the brightness I of a firefly at a particular location x can be chosen as I(x) ∝ 1/f(x)
Attractiveness.In the firefly algorithm, the main form of attractiveness function can be any monotonically decreasing functions such as the following generalized form: βM,> = ��∗z*��(,,� . (5)
Where r is the distance between two fireflies,��∗is the attractiveness at r = 0 and γ is a fixed light absorption coefficient.
Distance.The distance between any two fireflies i and j at xiand xj can be the Cartesian distance as follows: s�,� = �∑ ���,# − ��,#�$ #E� . (6)
wherexi,k is the kth component of the i th firefly.
Movement.The movement of a firefly i attracted to another more attractive (brighter) firefly j, is determined by
�� = �1 − ��,���� + ��,��� + ¡�s|� − 1 2¢ � . (7) where the first and second term is due to the attraction while the third term is randomization with α being the randomization parameter and “rand” is a random number generator uniformly distributed in [0, 1].
3.4 Application to power economic dispatching
To accelerate the FF algorithm, we suggest that alpha parameter increase following the formula (11): α = �¤¥¦§*¤¥a¨�×M©ª«O¬_¯ª� − αO¬ . (11)
Fireflies’ attractiveness and randomly movements provide float variables which sometimes do not respect constraints. We add before the intensity update two functions: The first corrects firefly position so that it stays in the domain [pmin, pmax]. The second corrects it so that the total power will be equal to request power. As we said before, we don’t admit any violation of loss and demand constraint.

77
AID’2012
May 20-21, 2012
4 Computational Results
4.1 Data
In a first example, we consider a IEEE network of 14 nodes (Rahli and Pirotte, 1999) with two generators G1 and G2 .There costs are:
f1(Pg1) = 0.006 Pg12 + 1.5 Pg1 + 100
f2(Pg2) = 0.009 Pg22 + 2.1 Pg2 + 130
under equality constraint: Pg1+Pg2 – PD– PL = 0
And inequality constraint : 135 ≤ Pg1 ≤ 195 (MW) 70 ≤ Pg2 ≤ 145 (MW)
Requested Power is fixed to: PD=259 (MW) Lost power is constant and equal to: PL=16.2 (MW)
In a second example, we consider a four unit thermal plant system (CS4). It has 4 generators where the total power losses PL are considered 0. The data for the 4 generators (cost coefficients and limits of generated powers) are presented in Table 1. The total power demanded in the system is PD=520 MW.
Table 1.Data of a CS4 thermal plant power Sytem. 2nd exemple.
Generator
a($/MW2) b($/MW) c($) pmax
(MW) pmax
(MW) 1 0.00875 18.24 750 30 120 2 0.00754 18.87 680 50 160 3 0.0031 19.05 650 50 200 4 0.00423 17.9 900 100 300
FF parameters are αO¬ = 10, αOM� = 0.02, ��∗ = 0.5, γ = 0.1.
4.2 Results
We optimize the first system with 10 fireflies in 50 iterations. We Remarque as shown in figure 1 that the firefly algorithm reach a good cost of 790,48 $/h since the 16th iteration and its reach an optimum 781,95 $/h at the 21th iteration .

78
AID’2012
May 20-21, 2012
Fig. 1. Improvement of total cost with 10 fireflies in 50 iteration.1st Exemple
The table 2 shows the average CPU time, average total cost and minimum cost found in a simulation of 20 replications.
Table 2.the average and minimum output found in 20 trials with the best generators
powers.1st Example. Trials Nb. F avg. CPU time
(hs.) F min Pg1(of fmin) Pg2 (of fmin)
10 783,26 0 781,958 195 80,2
In another simulation, we optimize IEEE-14 dispatching using 20 fireflies. We can observe from figure 2 that since initial solution of the first population at iteration 0 has the cost of 784,1 $/h. AT the 3rd iteration the optimizer can reach the optimum of 781,95 $/h.
Fig. 2. Improvement of total cost with 20 fireflies in 50 iteration.1st example.
The firefly algorithm can find a cost function equal to 781,958 $/h at 20th iteration environ with only 10 fireflies and in a CPU time below 1 hundredth second. This result seem to be better than the one found in (Benayed et al., 2011) for the same problem and parameters using harmony search with 35000 iterations and with was 963,714 $/h.
776778780782784786788790792794
0 1 2 3 4 5 6 7 8 9 10 11 12 13 14 15 16 17 18 19 20 21
f($
)
Iterations
Improvement of cost
780
781
782
783
784
785
0 1 2 3 4 5
Cost improvementCost(f $/h)

79
AID’2012
May 20-21, 2012
We compare in the example 2, the performance of Firefly algorithm with particles swarm optimization on the CS4 economic dispatching. The table 3 shows The average , best and worst Costs as the average of CPU times in 100 trials using 15 fireflies and 50 iterations for the CS4 example. The results can confirm that firefly algorithm get the best cost of 12919.7871 $ when the best cost found by PSO is 12920.0117 $. Firefly algorithm average and worst costs are also better than particle swarm optimization costs. The rounded best powers are 91.3108 and 64.8567 MW
Table 3.Comparison of average, worst and best value, 2nd example, number of trials=100,number of iteration=50, number of particles=15.
Method
Avg. CPU time (hs.)
Avg. Cost ($)
Best Cost($/h)
Worst Cost($/h)
FF 0,8339 12922,3349 12919,7871 12928,1582 PSO 0,2619 12928,9853 12920,0117 12959,0576
Firefly algorithm needs more time to get the best but it still be up to 1 hundredth second. This is due that the firefly algorithm is based on the comparison of fireflies together so it has a complexity of O(N2) while the PSO algorithm is based only on the comparison of each particle with its best position in history so it has a complexity of O(N).
5 Conclusion
In this paper we demonstrate the feasibility and the efficiency of the recent bio-inspired metaheuristic which is the firefly algorithm to solve economic power dispatching problem. This problem with nonlinear function has also the particularity to have some constraints to be satisfied in each population generation. However, the firefly algorithm based on a comparison of fireflies together and the movements of them even if they are good increase the chance to find the optimum. That why the algorithm allows us to find easily a best cost for IEEE-14 and CS4 dispatching problems. Our Future works will focus in other variants of problem and other constrains such us those related to environment.
References
Aungkulanon, P., Chai-Ead N., and Luangpaiboon P. (2011):” Simulated Manufacturing Process Improvement via Particle Swarm optimization and Firefly Algorithms”. In Proc. International Multi Conference of Engineers and Computer Scientists IMECS’11,Hong Kong,pp.1123-1128.
Basu B. and Mahanti G. K. (2011): “Firefly and artificial bees colony algorithm for synthesis of scanned and broadside linear array antenna”, Progress In Electromagnetics Research, Vol.32,pp.169-190.

80
AID’2012
May 20-21, 2012
Benayed FZ, Rahli M., Abdelhakem Koridak L. ,(2011): ”Optimisation du dispatching economique par l’algorithme de harmony search”, Acta electrotehnica, vol.53 no.1.
Dahmane M., 2009.Repartition economique de charge,Chapitre IV. dans cours IAP,
Durkota K. .(2011): “Implementation of a discrete firefly algorithm for the QAP problem within the sage framework”, BSc thesis, Czech Technical University
Fizazi H., Beghoura M.A. .(2011): “Segmentation des Images Satellitaires par l’Algorithme Firefly flou“, journée du laboratoire d’informatique d’Oran JDLIO, Oran
Gandomi A.H., Yang X-S., Alavi A.H(2011)..: “Mixed variable structural optimization using Firefly Algorithm”, Computers & Structures,Vol.89, pp. 23-24.
Horng M-H. and T-W. Jiang(2010): “The Codebook Design of Image Vector Quantization Based on the Firefly Algorithm”, Lecture Notes in Computer Science, Vol. 6423/2010,pp.438-447.
Jati G. K. and Suyanto S. (2011): “Evolutionary discrete firefly algorithm for travelling salesman problem”, ICAIS2011, Lecture Notes in Artificial Intelligence (LNAI 6943), pp. 393-403.
Lukasik, S. and Zak, S (2009): ”Firefly Algorithm for Continuous Constrained Optimization Tasks”, Lecture Notes in Computer Science, 5796/2009: 97-106.
Rahli M, P. Pirotte, Optimal loadflow using sequential unconstraine d minimization technique SUMT method under power transmission losses minimization, Electric Power Research, 1999 Elsevier Science.
Sayadi M. K., R. Ramezanian, N. Ghaffari-Nasab(2010): “A Discrete Firefly Meta-heuristic with Local Search for Make span Minimisation in Permutation Flow Shop Scheduling Problems”, International Journal of Industrial Engineering Computations, Vol. 1,pp.1–10.
Yang X.S. (2008) :Nature-Inspired Metaheuristic Algorithms. Luniver Press, UK.
Yang X.S. (2009): Firefly Algorithms for Multimodal Optimization, Stochastic Algorithms: Foundations and Applications, SAGA 2009, Lecture Notes in Computer Science, Springer-Verlag, Berlin, 5792, pp.169-178.
Yang X.S. (2010): “Firefly algorithm, stochastic test functions and design optimization”, International Journal of Bio-Inspired Computation, 2(2),pp.78-84.
Yang X.S. (2010): Firefly algorithm, Lévy flights and global optimization, in: Research and Development in Intelligent Systems XXVI (Eds M. Bramer, R. Ellis, M. Petridis), Springer London, pp.209-218
Yalcinoz T, Short MJ. (1998) :Neural network approach for solving economic dispatch problem with transmission capacity constraints. IEEE Transaction on Power System;13:307–13.
Yu B, Yuan X, Wang J, (2007):Short term hydro-thermal scheduling using particle swarm optimization method, Energy Conversion and Management;48(7):pp1902– 1908.
Zhao B, Jia Yi Cao, (2005):Multiple objective particle swarm optimization technique for economic load dispatch, Journal of Zhejiang University Science:,6(5):pp420–427.

81
AID’2012
May 20-21, 2012
Robust Particle Filtering with Multiple-Cues for Non-rigid object Tracking
Fouad BOUSETOUANE and Lynda DIB
LASE Laboratory, Badji Mokhtar University, Annaba, Algeria
[email protected], [email protected]
Abstract. Real time visual tracking has become an important and a critical task in many computer vision applications. In this paper, we present an adaptive particle filter integrating multi-cues to non-rigid object tracking, designed to handle illumination variation, scale change and complex non-rigid target motions. For this purpose, texture based so-scaled Haralick texture features and a color cues are combined into a model describing the appearance of the target. The likelihood of each cue is calculated and the algorithm relies on likelihood factorization as a product of the likelihoods of the cues. Moving object extraction is performed at each frame for adapting the search space of each particle with the real extracted motion mask of the tracked target. Experimental results of applying this framework show improvement in tracking and robustness in recovering from very complex conditions.
Keywords.Visual Tracking,Non-rigid Target, Particle Filter, Moving Object Detection, Haralick Texture Features.
1 Introduction
Recently, real time visual tracking has become a critical and very important task in many computer vision applications; in human computer interface, pedestrian protection systems, virtual reality, visual robots navigation, to enable robots and automated systems accomplished its tasks. Tracking object based on visual observations defined as the problem of estimating the trajectory of an object as it moves in a specific area (a comprehensive survey is proposed in (Yilmaz et al., 2006)). Color-based Particle Filtering algorithm for tracking the location of an object using a color model its one of the most used algorithm in many sub-field of visual tracking problem, in multi-object tracking, distributed tracking, face and eye tracking, etc; and this due to its robustness and consistency against Non-linear/Non-Gaussian problems. Particle Filter based on the Bayes principle implemented through random measurement density approximated by a set of weighted particles. Probabilistic methods based color cue for object tracking have been proposed in (Perez et al., 2002). In which, authors suggested to use the color histogram as a target observation model for calculating the set of samples (particles) weights at over time as a similarity between the candidate and reference target histograms. The color-based particle filtering method still limited around the color aberration, which is caused by: light

82
AID’2012
May 20-21, 2012
changing, clutter, scale changing, textured background, etc. The insufficiency of color model for target description will seriously interfere with the accurate target locating and lead to tracking failure. Recently, several attempts have been made by many researchers to improve the basic color-based particle filtering algorithm for object tracking, with one purpose; that is to find the best way to combine most appropriate cues. We can notice that in the recent following works: (Erdem et al., 2010) presented a new idea for data fusion approach for multi-cues tracking based particle filter, but to incorporate fusion data in prediction and update step and to associate each particle with a specific cue at over time requiring a new particles management process, which is computationally complex especially for real time applications. (Khan et al., 2010) proposed a visual object tracking scheme based multi-cues that exploits the dynamics of object shape and appearance similarity using a particle filter object tracking method where a multi-mode anisotropic mean shift algorithm is embedded to improve the initial particles propagation. Although, that is a good idea but still complex especially in real time applications and limited in several conditions, because authors have used only a color model as an appearance target information, which is insufficient in many conditions (i.e. color limitations have been previously cited in this introduction).(Ying et al., 2010) proposed a particle filtering object tracking based on texture and color features, in which authors proposed a combination of LBP histogram in texture space and color histogram as a target observation. (Fazli et al., 2009) suggested a color based-Particle filter tracking enhanced by a scale invariant feature transform (SIFT). (Brasnett et al., 2005) suggested a particle filtering algorithm for object tracking using multiple cues (color, shape and texture based on discrete wavelet transform). In spite of all attempts employed by many researchers to improve the color-based particle filtering method for object tracking, the complex conditions of the real world remain the biggest challenge. Until now, the proposed improvement into particle filter framework remain in target description by isolated pixels such as color histogram and texture that lacks of spatial relation between pixels, which is insufficient and often invalid in practice, mainly in presence of noise, clutter, illumination change and local deformation (i.e the fusion of several poor cues still poor regardless of the used data fusion strategy). We believe that one way to improve the visual tracking in complex conditions is not by using direct information from isolated pixels as the color histogram but through increasing the level of the visual target description. This level can be described through the exploitation of discriminating and invariant internal targets’ properties computed from local dependencies between a set of pixels within the target region, such as: local variation, degrees of texture organization, rate of homogeneity, disorder degrees, edge direction, spatial context, color context, etc. In this paper we propose a robust adaptive particle filtering object tracking algorithm based multiple cues, in which we suggest a new idea for using low-level contextual information (invariant pattern) based on co-occurrence distribution and spatial dependencies between pixels within interest target region computed through so-scaled Haralick texture features combined with color model describing the appearance of the target to improve color-based particle filter for object tracking. The likelihood of each cue is calculated and the algorithm relies on likelihood factorization as a product of the likelihoods of the cues. The proposed overall likelihood model based on low-level contextual information and color model is more informative, because it exploits very well the internal propriety of the target

83
AID’2012
May 20-21, 2012
(color and texture). To be consistent to the scale change and complex non-rigid target motions we propose to adapt the search space of each particle at each frame using the dimension of the extracted motion mask of the target. Many experiments proved that, the proposed target representation model (i.e weighted combination of Haralick texture features and color histogram) help the set of particles to escape from local minimum (i.e false positive positions) and can track the target more efficiently. Meanwhile, the proposed idea for adapting the search space of each particle provides more simulation of the complex target behavior and makes the particle filter more robust and intelligent. The main contribution of this work is to introduce a new idea to integrate low-level contextual information computed through Haralick texture features into particle filter framework and adapting the search space of each particle at tracking over time. The proposed adaptive particle filter enables a more efficient redistribution of particles at over time towards locations associated with large weights. This paper is organized as follows: in section 2 we explain in detail the basic particle filter for object tracking. In section 3 we explain in detail the used cues for target description. In section 4 we describe the proposed adaptive particle filtering object tracking algorithm integrating multiple cues. Finally, in section 5 a set of experiments will be presented and discussed.
2 Particle Filtering Object Tracking
Particles filter also known as condensation; have proved to be a powerful tool for image tracking (Perez et al., 2002). Particle Filter (PF) is a probabilistic technique developed method for solving the problem that posterior probability density and observation process probability density are non-Gaussian, which is based on random measurement density approximated by a set of weighted particles. Each particle is a two-tuple consisting the state domains and its corresponding probability (weight)
denoted by , where i is the particle number and N is the number of particles. Particle filtering also known as Monte-Carlo filter, it implements recursive Bayes filter through non-parameter Monte-Carlo technique (a comprehensive tutorial of Non-Gaussian and non-Linear system state filtering is presented in (Arulampalam et al., 2002)). Object tracking can be treated as estimation of object statement (i.e object trajectory at over times). Particle Filter requires two models to be defined: an evolution (transition) model for the state dynamics p(xt|xt-1) and a likelihood model for the observations (measurement, in relation with information extracted from the image) p(zt|xt ). These models are denoted as:
�² = �²��²*�, �²*�� (2)
³² � �²��² , �²� (2)
Where, xt is the state vector of system at time t, zt is measurement vector (observation) at time t. vt-1 and wt are system noise and observation noise of independent identity distribution. Assuming xt= {x0, x1, ...,xt }, Zt={z1, z2, ..., zt}, and xt obey first-order Markov process, the prior distribution of initial status x0 is p(x0). The principal goal of
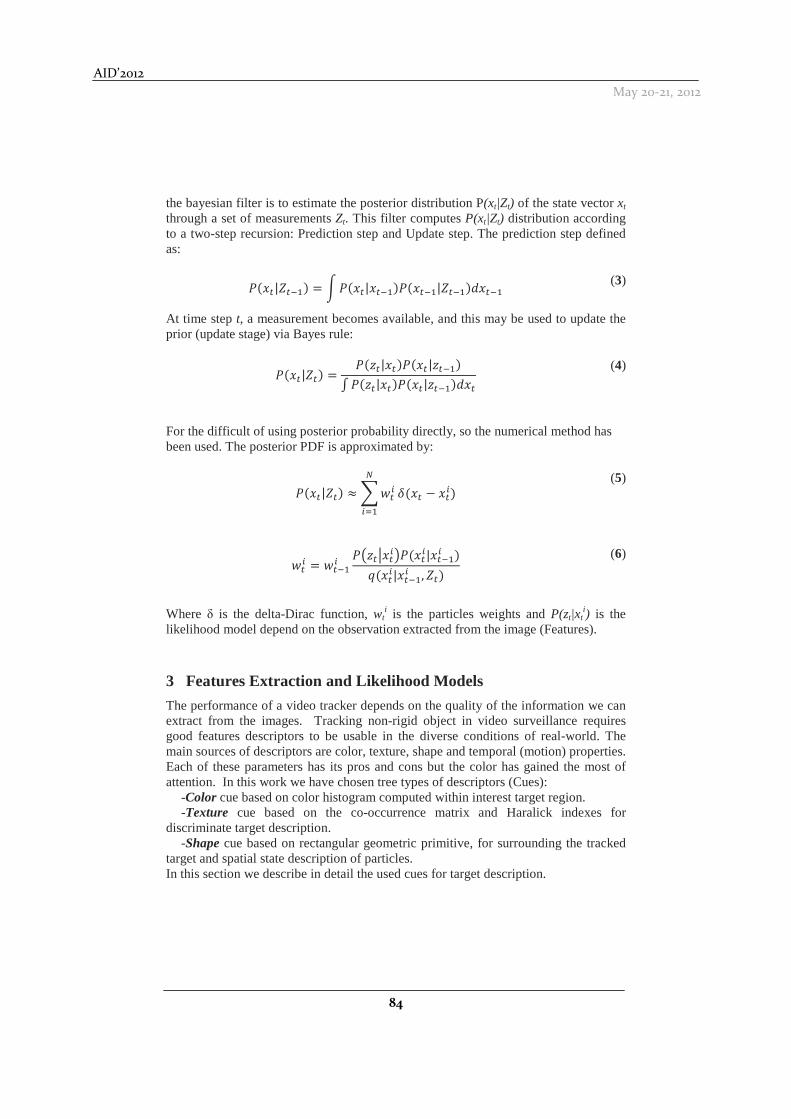
84
AID’2012
May 20-21, 2012
the bayesian filter is to estimate the posterior distribution P(xt|Zt) of the state vector xt through a set of measurements Zt. This filter computes P(xt|Zt) distribution according to a two-step recursion: Prediction step and Update step. The prediction step defined as:
k��²|´²*�� = µk��²|�²*��k��²*�|´²*����²*� (3)
At time step t, a measurement becomes available, and this may be used to update the prior (update stage) via Bayes rule:
k��²|´²� = k�³²|�²�k��²|³²*��¶ k�³²|�²�k��²|³²*����² (4)
For the difficult of using posterior probability directly, so the numerical method has been used. The posterior PDF is approximated by:
k��²|´²� ≈ Q�²���E� ¸��² − �²�� (5)
�²� = �²*�� k�³²%�²��k��²�|�²*�� �¹��²�|�²*�� , ´²� (6)
Where δ is the delta-Dirac function, wt
i is the particles weights and P(zt|xti) is the
likelihood model depend on the observation extracted from the image (Features).
3 Features Extraction and Likelihood Models
The performance of a video tracker depends on the quality of the information we can extract from the images. Tracking non-rigid object in video surveillance requires good features descriptors to be usable in the diverse conditions of real-world. The main sources of descriptors are color, texture, shape and temporal (motion) properties. Each of these parameters has its pros and cons but the color has gained the most of attention. In this work we have chosen tree types of descriptors (Cues):
-Color cue based on color histogram computed within interest target region. -Texture cue based on the co-occurrence matrix and Haralick indexes for
discriminate target description. -Shape cue based on rectangular geometric primitive, for surrounding the tracked
target and spatial state description of particles. In this section we describe in detail the used cues for target description.

85
AID’2012
May 20-21, 2012
3.1 Color Cue
The appearance of the target is represented by an N-bin RGB color histogram extracted from interest target region R(x,t) which is centered in x at time t-1. If we define the reference target in region R(x,t) where the RGB histogram is formulate as Hrgb, so the color density {qu} u=1...S which estimates the color distribution at time t-1, in region R(x,t) is given by:
¹º = � Q »�� �¸[�²�� − ��] ∈¾¿ÀÁ��Â�
(7)
Where, δ is the Kronecker delta function, xd is the location of any pixel in Hrbg, w is a normalized constant and K is a kernel profile used to weight the region that contains the target. At time t, the color model pu computed within target region will be compared to the reference color model qu for samples (particles) convergence. The color likelihood must focus on candidate color histograms close to the reference histogram; to ensure this the Bhattacharyya distance is used. Assuming two histograms: {qu} u=1…S is the reference target histogram computed at time t-1 within interest target region R(x,t-1). {pu} u=1…S is the candidate target histogram computed at time t within interest target region R(x,t). Their similarity can be described by the Bhattacharyya distance:
�� = !1 − Ã[r, ¹] (8)
Based on this distance, the color likelihood model can be defined by:
p¾¿ÀÁ�´¾¿ÀÁ , u|�²� ∝ zÄÅÆ0�ÇÂÄÈ,ÇÂ�
0ɲ (9)
Where, σ is the standard deviation specifies the Gaussian noise in the measurements, Ht-1is the reference target histogram at time t-1 and Ht is the current target histogram computed at time t.
3.2 Texture Cue
Texture is one common feature used in image analysis. It is often used in conjunction with color information to achieve better object recognition or segmentation results. Among the various techniques of texture analysis in image, we have chosen Haralick texture features computed from co-occurrence matrix for its robustness, representative capacity and ability for describing the spatial context (i.e invariant pattern). Haralick texture features have been recently used in inter-frames target correspondence problem by (Bousetouane et al., 2011), in which, authors suggested a texture-based target description model based on three Haralick metrics to improve inter-frames region matching problems with very significant results. The same authors and in

86
AID’2012
May 20-21, 2012
(Bousetouane et al., 2012) proposed a new target appearance description model based on seven Haralick texture metrics computed from co-occurrence matrix for improving the convergence ability of the mean shift tracker, in the same paper authors proved that six of Haralick texture metrics are invariants inter-frames and discriminate inter-objects. Gray Level Co-occurrence Matrix algorithm (GLCM) has been proposed by (Haralick et al., 1970s). The co-occurrence matrix explores the grey level spatial dependence of texture. A mathematical definition of the co-occurrence matrix is given by:
Ë��', �+���, �� = QQ f1Ì��r, ¹� = �|�Ì�r + �', ¹ + �+�0Íuℎzs��}z�ÎE�
�ÏE�
(10)
Where, (n,m) is the target size, (i,j) is the gray-scale target and I is the gray level image. This matrix is defined on a pair (D, O°). Where, D represents the distance between two pixels. O° represents the orientation of the vector constructed by two pixels. This matrix contains a considerable mass of information difficult to handle, for this why it’s not used directly but through Haralick texture features (Haralick et al., 1970s). In this work we have chosen two orientations 0° and 45° with the distance between pixel D=1, relative to the computation time reason. Fig.1 (d) illustrates the co-occurrence matrix computed within interest target region.
Fig.1. (a) Frame 154, (b) Moving Object Detection, (c) Moving Object Extraction, (d) Co-occurrence Matrix computed within moving object region (c).
For target description based texture cue we propose to use six of these metrics proved as discriminant (Bousetouane et al., 2012) including: entropy, correlation, dissimilarity, angular second moment, average and standard deviation, computed within interest target region R(x,t) centered in x. The proposed texture-based target representation is denoted as:
Ð��, u − 1� =ÑÒÒÒÓnÍmm�r�,� , u − 1��ÌÔÔ�r�,�, u − 1�Õ�r�,�, u − 1�Ö�r�,� , u − 1�jÔË�r�,� , u − 1�o×i�r�,� , u − 1� Ø
ÙÙÙÚ , Ð��, u� =
ÑÒÒÒÓnÍmm�r�,� , u��ÌÔÔ�r�,� , u�Õ�r�,� , u�Ö�r�,� , u�jÔË�r�,� , u�o×i�r�,� , u� Ø
ÙÙÙÚ
(11)
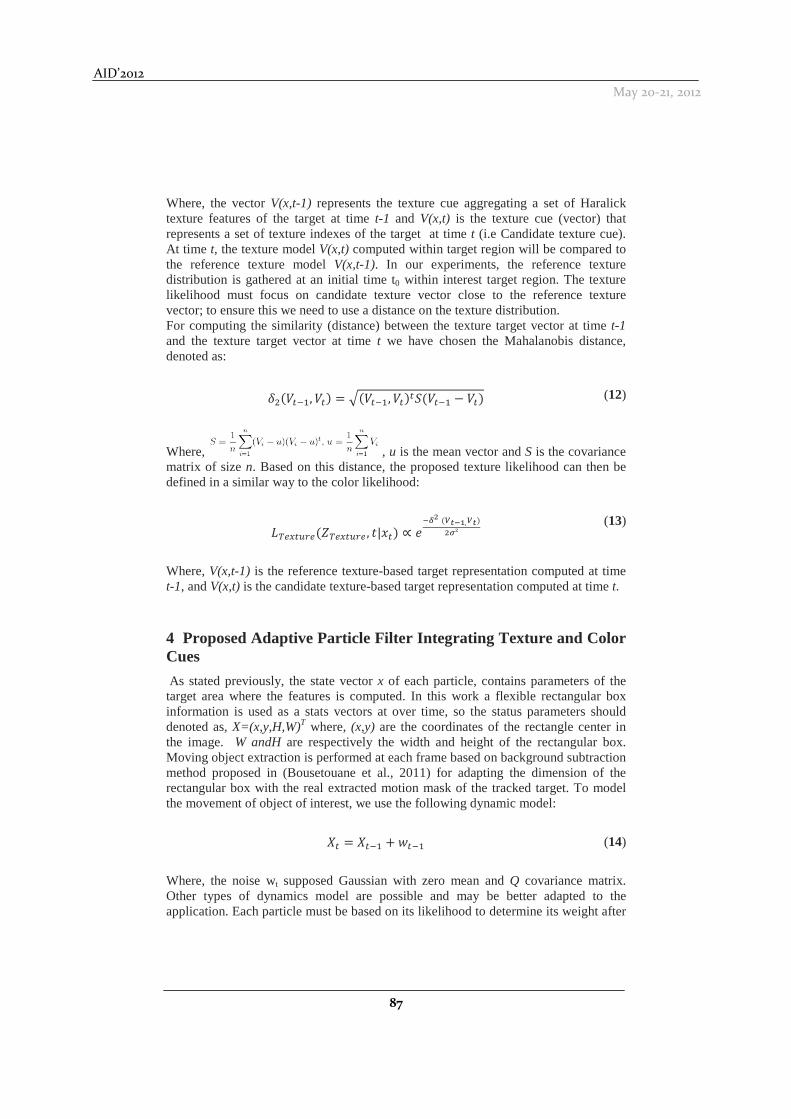
87
AID’2012
May 20-21, 2012
Where, the vector V(x,t-1) represents the texture cue aggregating a set of Haralick texture features of the target at time t-1 and V(x,t) is the texture cue (vector) that represents a set of texture indexes of the target at time t (i.e Candidate texture cue). At time t, the texture model V(x,t) computed within target region will be compared to the reference texture model V(x,t-1). In our experiments, the reference texture distribution is gathered at an initial time t0 within interest target region. The texture likelihood must focus on candidate texture vector close to the reference texture vector; to ensure this we need to use a distance on the texture distribution. For computing the similarity (distance) between the texture target vector at time t-1 and the texture target vector at time t we have chosen the Mahalanobis distance, denoted as:
¸$�в*�, в� � !�в*�, в�²Ô�в*� � в� (12)
Where, , u is the mean vector and S is the covariance matrix of size n. Based on this distance, the proposed texture likelihood can then be defined in a similar way to the color likelihood:
pÛÜ'²º�Ü�´ÛÜ'²º�Ü , u|�²� ∝ zÄÝ0 �ÞÂÄÈ,ÞÂ�
0ɲ (13)
Where, V(x,t-1) is the reference texture-based target representation computed at time t-1, and V(x,t) is the candidate texture-based target representation computed at time t.
4 Proposed Adaptive Particle Filter Integrating Texture and Color Cues
As stated previously, the state vector x of each particle, contains parameters of the target area where the features is computed. In this work a flexible rectangular box information is used as a stats vectors at over time, so the status parameters should denoted as, X=(x,y,H,W)T where, (x,y) are the coordinates of the rectangle center in the image. W andH are respectively the width and height of the rectangular box. Moving object extraction is performed at each frame based on background subtraction method proposed in (Bousetouane et al., 2011) for adapting the dimension of the rectangular box with the real extracted motion mask of the tracked target. To model the movement of object of interest, we use the following dynamic model:
�² � �²*� ��²*� (14)
Where, the noise wt supposed Gaussian with zero mean and Q covariance matrix. Other types of dynamics model are possible and may be better adapted to the application. Each particle must be based on its likelihood to determine its weight after

88
AID’2012
May 20-21, 2012
the state equation transferring. Under the assumption that the features being used as cues are independent, the proposed overall likelihood is a weighted product of the likelihoods of the separate cues; color cue and texture cue, is defined as:
p�³²|�²� = ¡p¾¿ÀÁ ß´¾¿ÀÁ, uà�²á ∗ �pÛÜ'²º�Ü�´ÛÜ'²º�Ü , u|�²� (15)
Where, α and β are a predetermined weighted significance of features. The weight
of each particle becomes: ŵ=L({zt}|xt). Practically, to converge exactly to the best target position (region) in the current frame the set of interest particles of the proposed algorithm must have a large weights ŵ (i.e minimizing the Bhattacharyya distances and minimizing the Mahalanobis distance between the reference and the candidate target cues computed using equation.15). The proposed adaptive particle filtering tracking algorithm based texture and color feature decomposes into six steps:
1. in the first video frame: -Automatic extraction of the interest region, using moving object detection method (Bousetouane et al., 2011). - Computing the proposed texture cue and color histogram of the extracted Region.
2. Initializing the particle filter according to the interest target region:
Setting the initial state parameters x, noise, color histogram, proposed texture cue, α, β, N, σ.
3. Particles propagation from the last time according to equation.14. Estimating the current particles stats xi, i:1,...,N.
4. Computing the particles weights ŵi (i=1,…N) according to equations (9,11,12,13,15)
5. Computing the current posterior mean
�â =Qŵ²���E� �²� (16)
6. Re-sampling particles and adapting the size of the rectangle box of each particle with the size of the extracted mask of motion in the current frame, then return to step 3 until the target is in stationary state.
In the next section we present a set of experimental results using the proposed adaptive particle filtering object tracking algorithm integrating multiple cues.

89
AID’2012
May 20-21, 2012
5 Experimental Results
In order to evaluate the efficient of the proposed adaptive particle filtering tracking algorithm based texture and color cues, presented in this paper; many surveillance video image sequences was taken from CAVIAR Dataset1. This sequence consist of walking pedestrian object in conditions of moving non-rigid object, scale change and illumination change, where the tracking in such condition remains a great challenge. From the obtained results using the proposed algorithm (Fig.2), we find that a large number of particles converge very well to the most appropriate positions of the tracked target at over time, this due to the representative capacity of the proposed likelihood model combining multiple cues and the proposed idea for adapting the search space of each particle with the mask of motion of the tracked target at each frame in re-sampling step. These results proved the capacity and the quality of our tracking algorithm even in scale change condition, where the visual signature of the tracked target changes suddenly. Without code optimization, the program runs comfortably at 15 to 28 fps on average. More experiments using PETS² and other surveillance video benchmark are available on the author’s website: http://bousfouad.webatu.com/.
Fig. 2. Tracking results using the proposed Adaptive Particle filter object tracking algorithm integrating multiple cues, with just 25 particles (N=25).
6 Conclusion
In this paper we have presented a robust adaptive particle filter tracking algorithm based multiple cues for object tracking. The presented algorithm was fully evaluated in many scenarios and conditions such as: non-rigid object, scale change, illumination
_______________________________ 1CAVIAR Test Case Scenarios, http://groups.inf.ed.ac.uk/vision/CAVIAR/ 2 Pests 2009 Benchmark Data, http://www.cvg.rdg.ac.uk/PETS2009/a.html

90
AID’2012
May 20-21, 2012
variation, etc. The proposed likelihood model combining multiple cues and the proposed idea for adapting the search space of each particle at each frame in re-sampling step makes color-based particle filter more robust and invariant against very complex conditions. Future work includes exploring new criteria to measure the reliability of each cue and extending this framework to multiple object tracking.
References Arulampalam, M.S., Maskell, S., Gordon, N., Clapp, T. (2002), A tutorial on particle filters for online nonlinear/non-Gaussian Bayesian tracking, IEEE Transactions on Signal Processing, 2(50), pp. 174--188.
Bousetouane, F., Dib, L., Snoussi, H.(2012), Improved mean shift integrating texture and color features for robust real time object tracking, The Visual Computer Journal, Springer; doi:10.1007/s00371-012-0677-0.
Bousetouane, F., Dib, L., Snoussi, H.(2011), Robust detection and tracking pedestrian object for real time surveillance applications, Proc. SPIE 8285, 828508; doi: 10.1117/12.913034.
Brasnett, P.A., Mihaylova, L., Canagarajahn N., Bull, D. (2005), Particle filtering with multiple cues for object tracking in video sequences, Proc. SPIE 5685, 430; doi: 10.1117/12.585882.
Erdem, E., Dubuisson, S., Bloch, I. (2010), Particle Filter-Based Visual Tracking by Fusing Multiple Cues with Context-Sensitive Reliabilities, TR2010D002, ParisTech.
Fazli, S., Pour, H.M., Bouzari, H. (2009), Particle Filter Based Object Tracking with Sift and Color Feature, In: II ICMV, pp. 89-93.
Haralick, R.M., and Shanmugam, K. (1973), Computer Classification of Reservoir Sandstones, IEEE Transaction on Information Theory, 11(4), pp. 171-177.
Khan, Z.H., Gu, I.G., Backhouse, A.G. (2010), A Robust Particle Filter-Based Method for Tracking Single Visual Object Through Complex Scenes Using Dynamical Object Shape and Appearance Similarity, In: J Sign Process Syst, Springer.
Pérez, P., Hue. C, Vermaak, J., Gangnet, M. (2002), Color-Based Probabilistic Tracking.European Conference on Computer Vision.
Yilmaz, A., Javed, O., Shah, M. (2006), Object Tracking: A Survey, ACM Computing Surveys, 38(4), pp. 1-45.
Ying, H., Qiu, X., Song, J., Ren, X., (2010), Particle Filtering Object Tracking Based on Texture and Color. In: Int Sym on Intelligence Information Processing and Trusted Computing, pp. 626-630.