these de doctorat conjoint telecom sudparis et l ... · these de doctorat conjoint telecom sudparis...
TRANSCRIPT
THESE DE DOCTORAT CONJOINT TELECOM SUDPARIS et L’UNIVERSITE PIERRE ET MARIE CURIE
Thèse n°2013TELE0008
Spécialité : Informatique et Télécommunication
Ecole doctorale : Informatique, Télécommunications et Electronique de Paris
Méthodes de tatouage robuste pour la protection de l'imagerie numérique 3D
Présentée par
Afef Chammem
Soutenu le 27 Mai 2013 à paris
Devant le jury composé de :
Prof. Touradj Ebrahimi Head of the MMSPG, EPFL Rapporteur
Prof. Laurent Lucas Head of the SIC Group, URCA Rapporteur
Prof. Patrick Gallinari Head of the LIP6, UPMC Président
Dr. Frédéric Dufaux CNRS Research Director, TelecomParisTech Examinateur
Prof. Faouzi Ghorbel Head of the CRISTAL Lab, ENSI Examinateur
Mme. Maryline Clare Head of the New Formats and New Coding Project,
Orange Labs Examinateur
Prof. Françoise Preteux Deputy Scientific Director, Mines ParisTech Directeur de thèse
HDR. Mihai Mitrea Associate Professor, Telecom SudParis Co-Directeur de thèse

Table of Contents
i
Table of Contents
Abstract ...................................................................................................................................................... 1
Chapter 1 Context ................................................................................................................................... 5
1.1. Stereoscopic content .......................................................................................................................................... 7
1.1.1. Content proliferation .................................................................................................... 8
1.1.2. Device explosion ......................................................................................................... 14
1.1.3. Potential protection techniques .................................................................................. 17
1.2. Watermarking properties .............................................................................................................................. 18
1.2.1. Watermarking applicative panorama ......................................................................... 18
1.2.2. Main watermarking constraints ................................................................................. 20
1.2.3. From 2D to stereoscopic video watermarking ........................................................... 26
1.2.4. Theoretical framework for stereo watermarking ...................................................... 28
1.3. Thesis structure ................................................................................................................................................. 30
Chapter 2 Objectives ........................................................................................................................... 31
2.1. Disparity maps computation ........................................................................................................................ 33
2.1.1. Basic concepts ............................................................................................................. 33
2.1.2. Block matching disparity map computation in the literature .................................... 33
2.1.3. Conclusion ................................................................................................................... 38
2.2. Watermarking embedding techniques..................................................................................................... 38
2.2.1. Principles ..................................................................................................................... 38
2.2.2. State-of-the-art ............................................................................................................ 39
2.2.3. Discussion ................................................................................................................... 43
2.3. Conclusion and thesis objectives ................................................................................................................ 48
Chapter 3 A new insertion domain: 3D Video-New Three Step Search ............................ 51
3.1. Method presentation ....................................................................................................................................... 53
3.1.1. Principles ..................................................................................................................... 53
3.1.2. Pseudo-code and flowchart......................................................................................... 53
3.2. Experimental validation ................................................................................................................................. 58
3.2.1. Test bed ....................................................................................................................... 58
3.2.2. Horizontal and vertical displacements tendency ....................................................... 59
3.2.3. Visual investigation of the disparity maps.................................................................. 60
3.2.4. Reconstructed image quality assessment ................................................................... 62
3.2.5. Computational cost ..................................................................................................... 67
3.3. Discussion ............................................................................................................................................................ 70
3.4. Conclusion ............................................................................................................................................................ 70

A.Chammem, Robust watermarking techniques for stereoscopic content protection
ii
Chapter 4 A reliable watermarking technique: Fast-IProtect ............................................. 71
4.1. IProtect: hybrid embedding technique .................................................................................................... 73
4.1.1. IProtect embedding scheme ....................................................................................... 73
4.1.2. IProtect detection ........................................................................................................ 78
4.2. Towards Fast-IProtect .................................................................................................................................... 78
4.2.1. Statistical models for watermarking attacks .............................................................. 80
4.2.2. Monte Carlo simulation for watermarking attacks ..................................................... 83
4.2.3. Experimental validation .............................................................................................. 86
4.3. Conclusion ............................................................................................................................................................ 87
Chapter 5 Stereoscopic watermarking benchmark ................................................................ 89
5.1. Embedding procedure .................................................................................................................................... 92
5.2. Embedding domains ........................................................................................................................................ 94
5.3. Transparency evaluation ............................................................................................................................... 96
5.3.1. Subjective protocol ..................................................................................................... 96
5.3.2. Objective assessment ................................................................................................ 104
5.4. Robustness evaluation .................................................................................................................................. 107
5.5. Computational cost ........................................................................................................................................ 110
5.5.1. Processing time ......................................................................................................... 110
5.5.2. Algorithmic complexity ............................................................................................. 110
5.6. Discussion .......................................................................................................................................................... 111
Chapter 6 Conclusion and future work ...................................................................................... 113
6.1. Conclusion .......................................................................................................................................................... 115
6.2. Future work ....................................................................................................................................................... 116
Appendix ............................................................................................................................................... 117
A.1 Processed corpora ................................................................................................................................................... 119
A.2 The considered embedding techniques ......................................................................................................... 124
A.3 Transparency evaluation...................................................................................................................................... 126
A.4 Robustness evaluation .......................................................................................................................................... 132
References ............................................................................................................................................ 135
List of acronyms ................................................................................................................................. 143
List of publications ............................................................................................................................ 147
List of figures
iii
List of figures Figure 1.1 Binocular human vision vs. stereoscopic content acquisition. ............................................................................... 7
Figure 1.2 Stereoscopic content display. ................................................................................................................................................ 8
Figure 1.3 Content market value in the stereo 3D technology segment. ................................................................................. 9
Figure 1.4 Timeline of 3D movies releases [Kun11]. ..................................................................................................................... 10
Figure 1.5 Overall TV and 3D TV sales 2009-2014 [Kin11]. ....................................................................................................... 12
Figure 1.6 3D TV content need [Teu10]. ............................................................................................................................................. 12
Figure 1.7 3D TV channel in the world [Teu10] [Kun11]. ........................................................................................................... 13
Figure 1.8 Professional technologies for 3D TV [3DF13]............................................................................................................. 14
Figure 1.9 Digital personal stereo vision systems [Koc10]. ........................................................................................................ 15
Figure 1.10 Global 3D-enabled devices sales forecast from 2010 to 2014. ......................................................................... 15
Figure 1.11 Samples of passive and active glasses for 3D viewer technologies [Kaw02] [Kun11]. ......................... 16
Figure 1.12 Lenticular lens and parallax barrier for autostereoscopic displays [Dod05]. ........................................... 17
Figure 1.13 Samples of autostereoscopic displays [Kun11]. ...................................................................................................... 17
Figure 1.14 The watermarking workflow. .......................................................................................................................................... 19
Figure 1.15 “Big Buck Bunny” [Ble08], original frame with samples of its attacked versions. ................................... 24
Figure 1.16 Test image with samples of its corresponding attacked versions. ................................................................. 25
Figure 1.17 Watermarking as a noisy channel. ................................................................................................................................ 29
Figure 1.18 The theoretical model for stereo noisy channel. ..................................................................................................... 29
Figure 2.1 Stereo matching. ....................................................................................................................................................................... 33
Figure 2.2 Block searching strategies: (a) ES, (b) NTSS, and (c) FS –MPEG. ....................................................................... 35
Figure 2.3. Synoptic representation of the state-of-the-art studies. ....................................................................................... 37
Figure 2.4 The watermarking embedder scheme. ............................................................................................................................... 39
Figure 2.5 Synoptic overview of the state of the art of the stereoscopic watermarking approaches. ..................... 40
Figure 2.6 Synoptic representation of the state-of-the-art studies. ........................................................................................ 45
Figure 3.1 Block searching strategies: (a) NTSS, and (b) 3DV-NTSS. ..................................................................................... 53
Figure 3.2 The 3DV-NTSS algorithm flowchart. ............................................................................................................................... 56
Figure 3.3 The main three steps of the 3DV-NTSS algorithm. ................................................................................................... 57
Figure 3.4 Left and right views sampled from the 3DLive corpus. .......................................................................................... 58
Figure 3.5 Left and right views sampled from the MPEG corpus. ............................................................................................ 58
Figure 3.6 Search area weights variation ( and ) for 3DLive and MPEG corpora. ...................................................... 59
Figure 3.7 NTSS (a), FS-MPEG (b) and 3DV-NTSS (c) disparity maps. ................................................................................... 60
A.Chammem, Robust watermarking techniques for stereoscopic content protection
iv
Figure 3.8 NTSS (a), FS-MPEG (b), and 3DV-NTSS (c) disparity maps. .................................................................................. 61
Figure 3.9 NTSS (a), FS-MPEG (b), and 3DV-NTSS (c) disparity maps. .................................................................................. 61
Figure 3.10 NTSS (a), FS-MPEG (b), and 3DV-NTSS (c) disparity maps. ............................................................................... 62
Figure 3.11 Objective evaluation of the reconstructed image quality. .................................................................................. 66
Figure 4.1 The watermarking method synopsis. ............................................................................................................................. 73
Figure 4.2 Treillis representation. Each row corresponds to one of the K states. ............................................................ 74
Figure 4.3 The selected sub-bands. ........................................................................................................................................................ 75
Figure 4.4 The embedded ARTEMIS logo............................................................................................................................................ 75
Figure 4.5 The IProtect embedding algorithm synopsis. ............................................................................................................. 77
Figure 4.6 IProtect time processing....................................................................................................................................................... 79
Figure 4.7 The five steps undergone when applying an attack procedure. ......................................................................... 79
Figure 4.8 Fast-IProtect embedding algorithm synopsis. ............................................................................................................ 80
Figure 4.9 The Monte Carlo attack simulation algorithm flowchart. ...................................................................................... 85
Figure 4.10 The quality of the Monte Carlo generators for the StirMark attack. .............................................................. 86
Figure 4.11 The attack procedure during the embedding process.......................................................................................... 87
Figure 4.12 Time processing for different watermarking operations. .................................................................................. 87
Figure 5.1 The watermarking assessment procedure. .................................................................................................................. 91
Figure 5.2 View-based watermarking scheme. ................................................................................................................................ 95
Figure 5.3 Disparity-based watermarking scheme. ........................................................................................................................ 96
Figure 5.4 Presentation structure of the assessment session. ................................................................................................... 99
Figure 5.5 Side-by-side spread spectrum watermarked samples. ........................................................................................... 99
Figure 5.6 Side-by-side 2-QIM watermarked samples. .............................................................................................................. 100
Figure 5.7 Side-by-side 5-QIM watermarked samples. .............................................................................................................. 101
Figure 5.8 Side-by-side Fast-IProtect watermarked samples. ................................................................................................ 101
Figure 5.9 Subjective evaluations for image quality, depth perception and visual comfort. .................................... 104
Figure 5.10 Objective evaluation of the watermarked content visual quality................................................................. 106
Figure 5.11 Watermark robustness against five different attacks. ...................................................................................... 108
Figure 5.12. Watermarking chain computational cost. .............................................................................................................. 110
Figure A.1.1 Left and right views sampled from the 3DLive corpus. ................................................................................... 119
Figure A.1.2 Left and right views sampled from the MPEG corpus. ..................................................................................... 120
Figure A.1.3 Experimental HD3D² database. .................................................................................................................................. 121
Figure A.1.4 Experimental EPFL database. ...................................................................................................................................... 121
Figure A.1.5 Experimental ARTEMIS database. ............................................................................................................................. 122
List of tables
v
List of tables Table 1.1 The highest-grossing 3D films: Costs vs. incomes (in USD million). ................................................................... 11
Table 1.2 Data payload requirements for some examples of watermarking applications. .......................................... 26
Table 2.1 Performance evaluation between the state of the art algorithms. ...................................................................... 36
Table 2.2 A comparative view on the state of the art of stereoscopic image/video watermarking methods. ..... 46
Table 2.3 The thesis main challenges, the underlying current limitations and the thesis objectives. ..................... 49
Table 3.1 Reconstructed image visual quality, expressed by PSNR, IF, NCC, SC and SSIM. .......................................... 64
Table 3.2 95% error limits in reconstructed image quality assessment. ............................................................................. 65
Table 3.3 Computational cost expressed in number of search points per 16x16 block. ............................................... 68
Table 3.4 Gain factor on computational cost 3DV-NTSS vs. NTSS and 3DV-NTSS vs. FS-MPEG. ................................ 69
Table 4.1 Attacks statistical models in the (9,7) hierarchy. ............................................................................................ 82
Table 5.1 The considered insertion methods and their main parameters. .......................................................................... 93
Table 5.2 General viewing conditions for subjective assessments at the ARTEMIS laboratory environment. ... 97
Table 5.3 Preferred Viewing Distance-PVD for moving image. ................................................................................................. 98
Table 5.4 A sample of a transparency: subjective evaluation sheet. ............................................................................................ 98
Table 5.5 Computational complexity of the watermarking modules involved in Fast-IProtect/3DV-NTSS...... 111
Table A.3.1 The considered attacks and their main parameters. .......................................................................................... 127
Table A.3.2 The Mean Opinion Score values for a valid number of 25 subjects. ............................................................ 128
Table A.3.3 95% error of the MOS for a valid number of 25 subjects. ................................................................................ 129
Table A.3.4 Watermarking transparency: 3DV-NTSS vs. NTSS vs. FS-MPEG, see Figure 5.10. ................................ 130
Table A.3.5 95% error in watermarked transparency: 3DV-NTSS vs. NTSS vs. FS-MPEG, see Figure 5.10. ...... 131


Abstract

Abstract
1
Context
Coined in the mid‘ 50s for audio signals, the stereoscopic world is nowadays the challenge in
image/video processing. On the one hand, medical diagnosis, fault detection in manufactory industry,
army, arts all of them consider multi-view imaging as a key enabler for professional added value services.
On the other hand, the worldwide success of movie releases (Avatar, Alice in Wonderland) and the
deployment of 3D TV chains made the non-professional user aware about a new type of multimedia
entertainment experience.
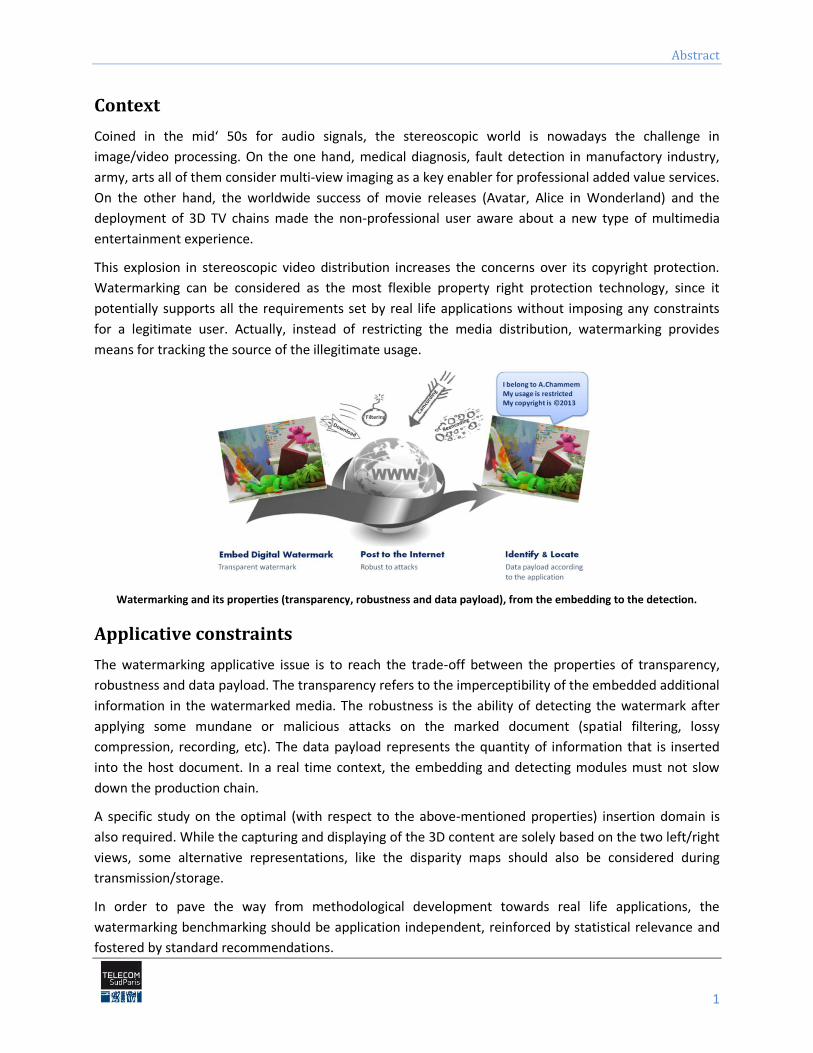
This explosion in stereoscopic video distribution increases the concerns over its copyright protection.
Watermarking can be considered as the most flexible property right protection technology, since it
potentially supports all the requirements set by real life applications without imposing any constraints
for a legitimate user. Actually, instead of restricting the media distribution, watermarking provides
means for tracking the source of the illegitimate usage.
Watermarking and its properties (transparency, robustness and data payload), from the embedding to the detection.
Applicative constraints
The watermarking applicative issue is to reach the trade-off between the properties of transparency,
robustness and data payload. The transparency refers to the imperceptibility of the embedded additional
information in the watermarked media. The robustness is the ability of detecting the watermark after
applying some mundane or malicious attacks on the marked document (spatial filtering, lossy
compression, recording, etc). The data payload represents the quantity of information that is inserted
into the host document. In a real time context, the embedding and detecting modules must not slow
down the production chain.
A specific study on the optimal (with respect to the above-mentioned properties) insertion domain is
also required. While the capturing and displaying of the 3D content are solely based on the two left/right
views, some alternative representations, like the disparity maps should also be considered during
transmission/storage.
In order to pave the way from methodological development towards real life applications, the
watermarking benchmarking should be application independent, reinforced by statistical relevance and
fostered by standard recommendations.
A.Chammem, Robust watermarking techniques for stereoscopic content protection
2
Scientific and technical challenges
For 2D video watermarking applications, several classes of insertion techniques already proved their
efficiency. For instance, SS (Spread Spectrum) techniques are generally connected to excellent
transparency properties while ensuring good robustness for a quite small size of the mark. Conversely, SI
(Side Information) techniques result in large sizes of the inserted marks, while decreasing the
transparency/robustness properties. These two directions have been also extended for stereoscopic
watermarking system. However, they still lack in achieving good transparency, they deal only with a
restricted class of attacks and fail in embedding the required amount of data payload. Moreover, the
transparency evaluation was solely guided by the PSNR values; no other objective transparency metrics
or subjective evaluation protocols have been deployed. Consequently, specifying a watermarking
method able to reach this three-folded trade-off is still an open issue. Such a study should also be
accompanied by an evaluation of the computational cost.
Nowadays, stereoscopic video watermarking studies let the insertion domain selection to the
experimenter’s choice rather than identifying it by objective studies. This way, the disparity maps are
directly inherited from 2D video and simply neglect the stereoscopic video peculiarities. For such a
content, the disparities between the left and the right views are predominant on the horizontal direction
(where the very depth information is conveyed) while the vertical disparities, although non-zero, are
mainly connected to the video shooting errors. Moreover, in the block matching stage, basic visual
quality metrics like mean squared error – MSE or sum of absolute differences - SAD are considered. As
such metrics are unrelated to the human visual system, the obtained results are sub-optimal from a
quality of experience perspective. Consequently, specifying a disparity map, jointly exploiting the
horizontal/vertical peculiarities of the stereoscopic content and a visual quality metric related to the HVS
remains a challenging research topic.
Concerning the experimental validation, the processed data sets are restricted in their content
heterogeneity and their size. Consequently, constructing a large and representative corpus to ensure
statistical relevance for the results and performing the evaluation protocol according to some referenced
standards are still desiderata.
Methodological contributions and achievements
The present thesis tackles the three above-mentioned challenges.
First, by reconsidering some 2D video inherited approaches and by adapting them to the stereoscopic
video content and to the human visual system peculiarities, a new disparity map (3D video-New Three
Step Search - 3DV-NTSS) is designed. The inner relation between the left and the right views is modeled
by some weights discriminating between the horizontal and vertical disparities. The block matching
operation is achieved by considering a visual related measure, namely the normalized cross correlation -
NCC. The performances of the 3DV-NTSS were evaluated in terms of visual quality of the reconstructed
image and computational cost. When compared with state of the art methods (New three step search
NTSS and FS-MPEG) average gains of dB in PSNR and in SSIM are obtained. The computational cost
is reduced by average factors between and .
Abstract
3
Second, a comparative study on the main classes of 2D inherited watermarking methods and on their
related optimal stereoscopic insertion domains is carried out. Four insertion methods are considered;
they belong to the SS, SI (binary QIM and -symbols QIM) and hybrid (Fast-IProtect) families. The fast-
IProtect establishes synergies between SS and SI in order to achieve the transparency/robustness/data
payload trade-off and relays on Monte Carlo generators, following the attack theoretical models, in
order to meet time constraints. Each of these four methods is successively applied on the left view of the
video sequences as well as on three disparity maps, computed according to the NTSS, FS-MPEG and
3DV-NTSS disparity map algorithms. The experiments brought to light that the Fast-IProtect performed
in the new disparity map domain (3DV-NTSS) would be generic enough so as to serve a large variety of
applications:
it ensures the imperceptibility according to subjective tests preformed based on three different
criteria: image quality, depth perception and visual comfort;
it offers PSNR> dB and IF, NCC; SC and SSIM values larger than 1;
it ensures robustness expressed by a BER lower than after filtering and JPEG compression
and lower than after the geometric random bending attacks;
it features a non-prohibitive computational cost (e.g. insertion time lower than the frame rate in
video, Tinsertion= ms, obtained on a Core2 PC, [email protected], RAM 2 Go).
Finally, concerning the performance evaluation, all the quantitative results are obtained by processing
two corpora (3DLive and MPEG) of stereoscopic visual content, organized according to three general
criteria: significance, acceptability and exploitability. Each of these two corpora combines
indoor/outdoor, unstable and arbitrary lighting, still and high motion scenes. The 3DLive corpus sums up
about hours of HD 3D TV content captured by French professionals. The MPEG 3D video reference
corpus is composed of minutes of video sequences provided by both academic/industry and encoded
at different resolutions (from to pixels).
The statistical relevance of the results is given by the confidence limits computed for all the values
reported in our study (for both transparency and robustness), and by their underlying the relative errors
which were lower than .
Two standards have been considered in our study. The transparency of the watermarked content is
subjectively assessed according to the ITU-R BT , and BT recommendations. The
robustness and data payload were considered so as to comply with the Digital Cinema Initiatives (DCI)
prescriptions.
1 Ideal transparency is given by , image fidelity , normalized cross correlation , structural content
and structural similarity .
A.Chammem, Robust watermarking techniques for stereoscopic content protection
4
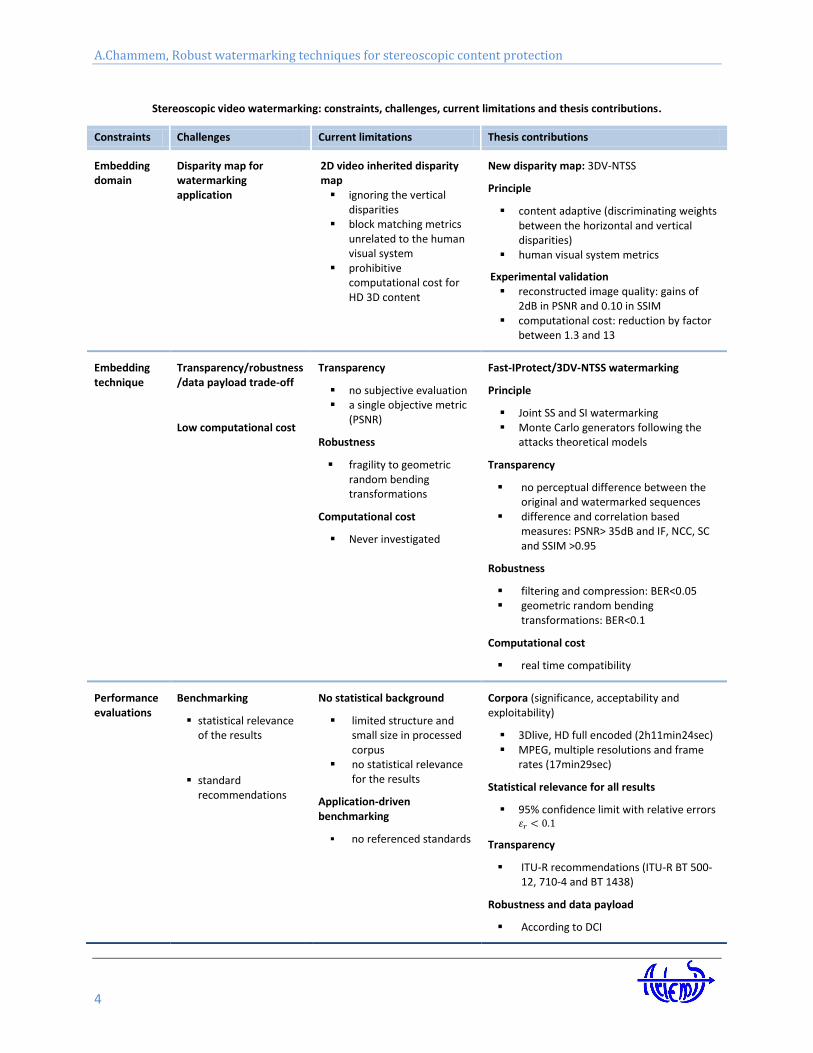
Stereoscopic video watermarking: constraints, challenges, current limitations and thesis contributions.
Constraints Challenges Current limitations Thesis contributions
Embedding domain
Disparity map for watermarking application
2D video inherited disparity map ignoring the vertical
disparities block matching metrics
unrelated to the human visual system
prohibitive computational cost for HD 3D content
New disparity map: 3DV-NTSS
Principle
content adaptive (discriminating weights between the horizontal and vertical disparities)
human visual system metrics
Experimental validation reconstructed image quality: gains of
2dB in PSNR and 0.10 in SSIM computational cost: reduction by factor
between 1.3 and 13
Embedding technique
Transparency/robustness/data payload trade-off
Low computational cost
Transparency
no subjective evaluation a single objective metric
(PSNR)
Robustness
fragility to geometric random bending transformations
Computational cost
Never investigated
Fast-IProtect/3DV-NTSS watermarking
Principle
Joint SS and SI watermarking Monte Carlo generators following the
attacks theoretical models
Transparency
no perceptual difference between the original and watermarked sequences
difference and correlation based measures: PSNR> 35dB and IF, NCC, SC and SSIM >0.95
Robustness
filtering and compression: BER<0.05 geometric random bending
transformations: BER<0.1
Computational cost
real time compatibility
Performance evaluations
Benchmarking
statistical relevance of the results
standard recommendations
No statistical background
limited structure and small size in processed corpus
no statistical relevance for the results
Application-driven benchmarking
no referenced standards
Corpora (significance, acceptability and exploitability)
3Dlive, HD full encoded (2h11min24sec) MPEG, multiple resolutions and frame
rates (17min29sec)
Statistical relevance for all results
95% confidence limit with relative errors
Transparency
ITU-R recommendations (ITU-R BT 500-12, 710-4 and BT 1438)
Robustness and data payload
According to DCI

Chapter 1 Context
A.Chammem, Robust watermarking techniques for stereoscopic content protection
6
Abstract
This Chapter browses the thesis basis, from the advent of the video stereoscopic content to the watermarking potentiality to solve issues related to copyright protection. Finally, the thesis structure is identified by facing the stereoscopic video protection to the main watermarking properties.
Chapter 1: Context
7
1.1. Stereoscopic content
From the etymological point of view, the word stereopsis derives from the Greek words “stereo”
meaning solid and “opsis” meaning appearance or sight [May81] [Rog82] [Pog84].
Under the image processing framework, the word stereoscopy encompasses the research and
technological efforts related to the design and deployment of tools able to create/enhance the illusion of
depth in image [Rog82] [Pog84].
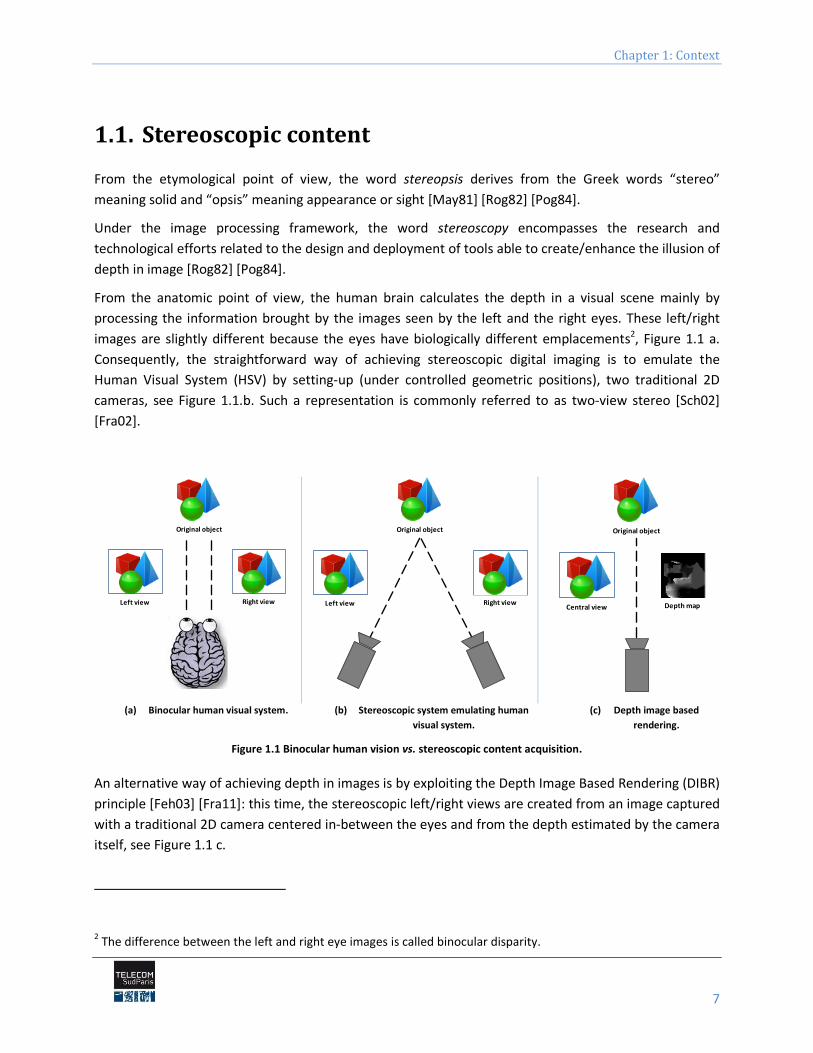
From the anatomic point of view, the human brain calculates the depth in a visual scene mainly by
processing the information brought by the images seen by the left and the right eyes. These left/right
images are slightly different because the eyes have biologically different emplacements2, Figure 1.1 a.
Consequently, the straightforward way of achieving stereoscopic digital imaging is to emulate the
Human Visual System (HSV) by setting-up (under controlled geometric positions), two traditional 2D
cameras, see Figure 1.1.b. Such a representation is commonly referred to as two-view stereo [Sch02]
[Fra02].
(a) Binocular human visual system. (b) Stereoscopic system emulating human
visual system.
(c) Depth image based
rendering.
Figure 1.1 Binocular human vision vs. stereoscopic content acquisition.
An alternative way of achieving depth in images is by exploiting the Depth Image Based Rendering (DIBR)
principle [Feh03] [Fra11]: this time, the stereoscopic left/right views are created from an image captured
with a traditional 2D camera centered in-between the eyes and from the depth estimated by the camera
itself, see Figure 1.1 c.
2 The difference between the left and right eye images is called binocular disparity.
Original object
Left view Right view
Original object
Left view Right view
Original object
Central view Depth map
A.Chammem, Robust watermarking techniques for stereoscopic content protection
8
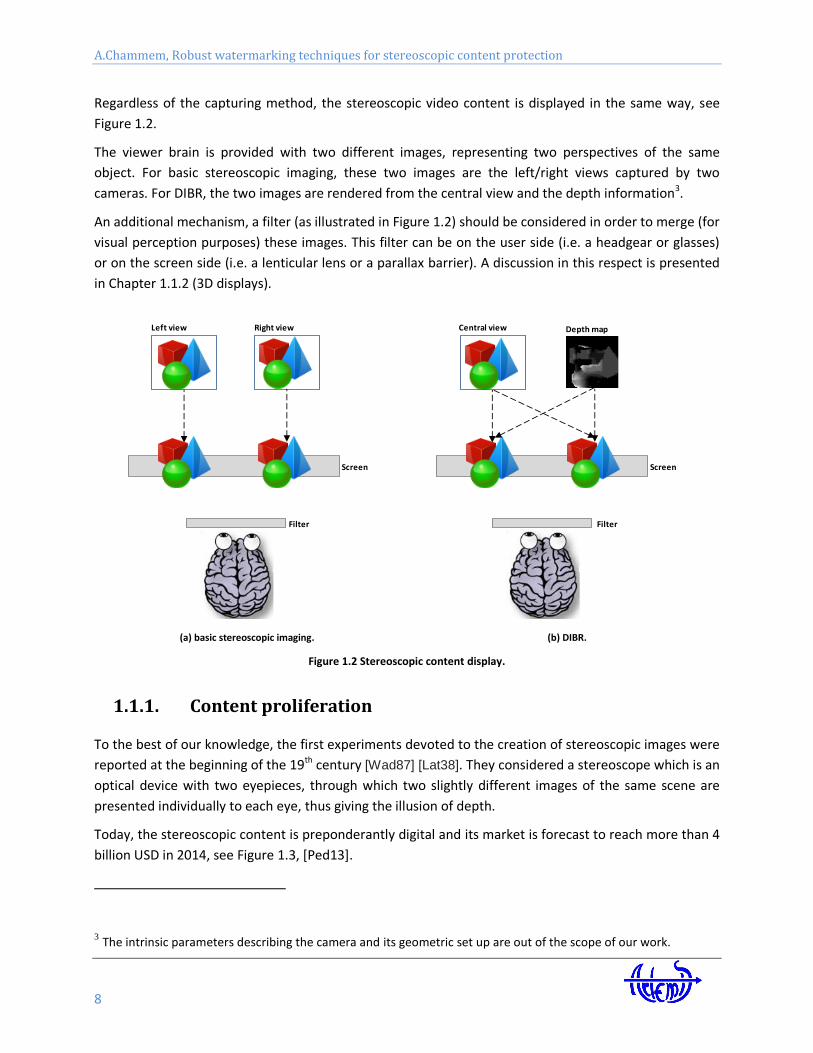
Regardless of the capturing method, the stereoscopic video content is displayed in the same way, see
Figure 1.2.
The viewer brain is provided with two different images, representing two perspectives of the same
object. For basic stereoscopic imaging, these two images are the left/right views captured by two
cameras. For DIBR, the two images are rendered from the central view and the depth information3.
An additional mechanism, a filter (as illustrated in Figure 1.2) should be considered in order to merge (for
visual perception purposes) these images. This filter can be on the user side (i.e. a headgear or glasses)
or on the screen side (i.e. a lenticular lens or a parallax barrier). A discussion in this respect is presented
in Chapter 1.1.2 (3D displays).
(a) basic stereoscopic imaging. (b) DIBR.
Figure 1.2 Stereoscopic content display.
1.1.1. Content proliferation
To the best of our knowledge, the first experiments devoted to the creation of stereoscopic images were
reported at the beginning of the 19th century [Wad87] [Lat38]. They considered a stereoscope which is an
optical device with two eyepieces, through which two slightly different images of the same scene are
presented individually to each eye, thus giving the illusion of depth.
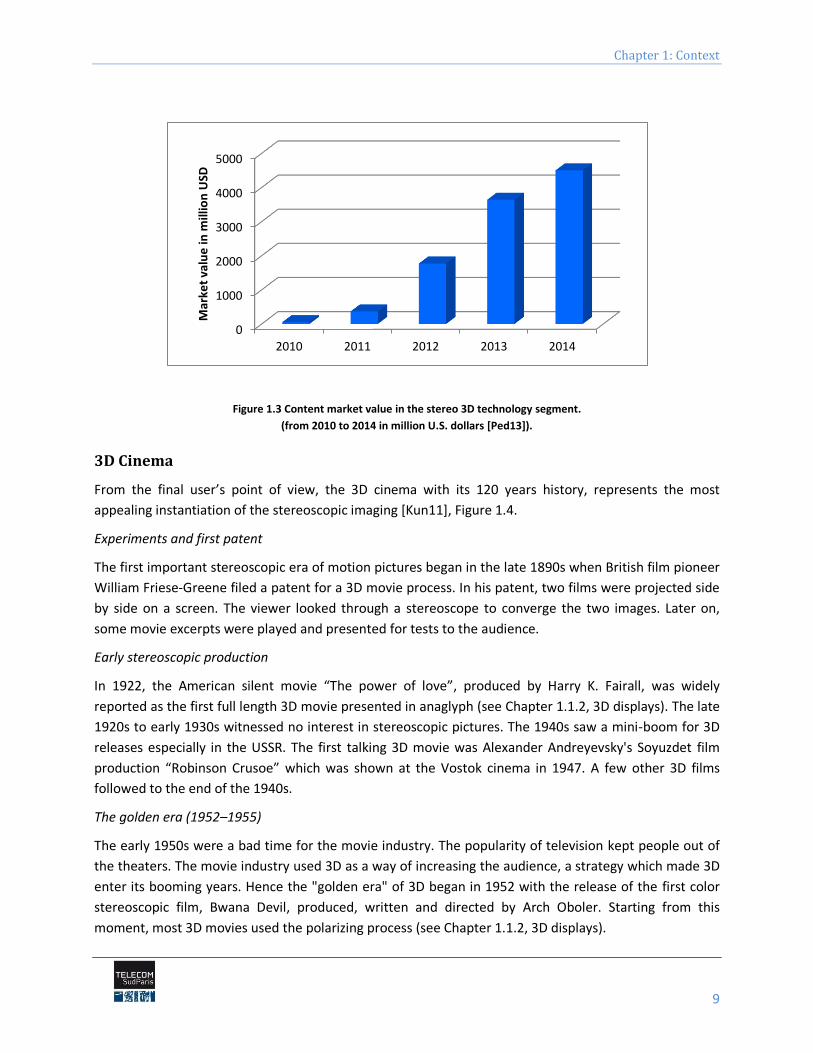
Today, the stereoscopic content is preponderantly digital and its market is forecast to reach more than 4
billion USD in 2014, see Figure 1.3, [Ped13].
3 The intrinsic parameters describing the camera and its geometric set up are out of the scope of our work.
Screen
Left view Right view
Filter
Screen
Central view
Filter
Depth map
Chapter 1: Context
9
Figure 1.3 Content market value in the stereo 3D technology segment.
(from 2010 to 2014 in million U.S. dollars [Ped13]).
3D Cinema
From the final user’s point of view, the 3D cinema with its 120 years history, represents the most
appealing instantiation of the stereoscopic imaging [Kun11], Figure 1.4.
Experiments and first patent
The first important stereoscopic era of motion pictures began in the late 1890s when British film pioneer
William Friese-Greene filed a patent for a 3D movie process. In his patent, two films were projected side
by side on a screen. The viewer looked through a stereoscope to converge the two images. Later on,
some movie excerpts were played and presented for tests to the audience.
Early stereoscopic production
In 1922, the American silent movie “The power of love”, produced by Harry K. Fairall, was widely
reported as the first full length 3D movie presented in anaglyph (see Chapter 1.1.2, 3D displays). The late
1920s to early 1930s witnessed no interest in stereoscopic pictures. The 1940s saw a mini-boom for 3D
releases especially in the USSR. The first talking 3D movie was Alexander Andreyevsky's Soyuzdet film
production “Robinson Crusoe” which was shown at the Vostok cinema in 1947. A few other 3D films
followed to the end of the 1940s.
The golden era (1952–1955)
The early 1950s were a bad time for the movie industry. The popularity of television kept people out of
the theaters. The movie industry used 3D as a way of increasing the audience, a strategy which made 3D
enter its booming years. Hence the "golden era" of 3D began in 1952 with the release of the first color
stereoscopic film, Bwana Devil, produced, written and directed by Arch Oboler. Starting from this
moment, most 3D movies used the polarizing process (see Chapter 1.1.2, 3D displays).
0
1000
2000
3000
4000
5000
2010 2011 2012 2013 2014
Mar
ket
valu
e in
mill
ion
USD
A.Chammem, Robust watermarking techniques for stereoscopic content protection
10
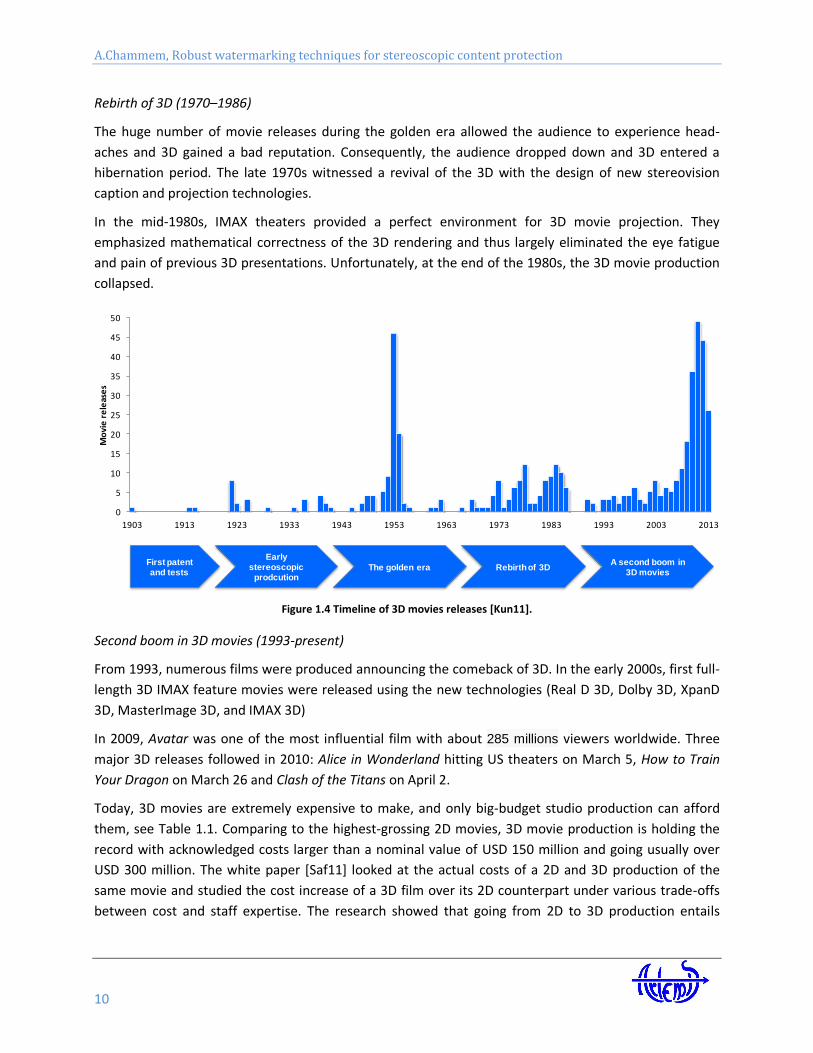
Rebirth of 3D (1970–1986)
The huge number of movie releases during the golden era allowed the audience to experience head-
aches and 3D gained a bad reputation. Consequently, the audience dropped down and 3D entered a
hibernation period. The late 1970s witnessed a revival of the 3D with the design of new stereovision
caption and projection technologies.
In the mid-1980s, IMAX theaters provided a perfect environment for 3D movie projection. They
emphasized mathematical correctness of the 3D rendering and thus largely eliminated the eye fatigue
and pain of previous 3D presentations. Unfortunately, at the end of the 1980s, the 3D movie production
collapsed.
Figure 1.4 Timeline of 3D movies releases [Kun11].
Second boom in 3D movies (1993-present)
From 1993, numerous films were produced announcing the comeback of 3D. In the early 2000s, first full-
length 3D IMAX feature movies were released using the new technologies (Real D 3D, Dolby 3D, XpanD
3D, MasterImage 3D, and IMAX 3D)
In 2009, Avatar was one of the most influential film with about 285 millions viewers worldwide. Three
major 3D releases followed in 2010: Alice in Wonderland hitting US theaters on March 5, How to Train
Your Dragon on March 26 and Clash of the Titans on April 2.
Today, 3D movies are extremely expensive to make, and only big-budget studio production can afford
them, see Table 1.1. Comparing to the highest-grossing 2D movies, 3D movie production is holding the
record with acknowledged costs larger than a nominal value of USD 150 million and going usually over
USD 300 million. The white paper [Saf11] looked at the actual costs of a 2D and 3D production of the
same movie and studied the cost increase of a 3D film over its 2D counterpart under various trade-offs
between cost and staff expertise. The research showed that going from 2D to 3D production entails
0
5
10
15
20
25
30
35
40
45
50
1903 1913 1923 1933 1943 1953 1963 1973 1983 1993 2003 2013
Mo
vie
re
leas
es
First patent and tests
A second boom in 3D movies
The golden era
Early stereoscopic
prodcutionRebirthof 3D
Chapter 1: Context
11
average increase cost of 18%. The vast majority of cost increases comes from the increase in 3D cameras
rental costs and from the addition of staff members.
3D movies are not only on the top of cost production but also on the top of the highest grossing films,
see Table 1.1. For instance, with a worldwide box-office gross of about USD 2.8 billion, Avatar is often
proclaimed to be the highest-grossing film ever. The Transformer comes in the second place with about
USD billion. Alice in wonderland gross reached USD 1.024 billion. The incomes above include revenue
coming from theatrical exhibition, home video, television broadcast rights and merchandising.
The releases in multiple formats impacts the number of people purchasing movie tickets. Almost two-
thirds of the tickets sold were for 3D showings with an average price of USD 10.
Table 1.1 The highest-grossing 3D films: Costs vs. incomes (in USD million).
Movie Avatar Alice in
Wonderland
Toy Story 3 Transformers:
Dark of the
Moon
Year 2009 2010 2010 2011
Cost 280 236 200 195
Worldwide gross 2782 1024 1063 1123
3D Television
The awareness about the 3D movie experience is currently extended and promoted from theater to
homes.
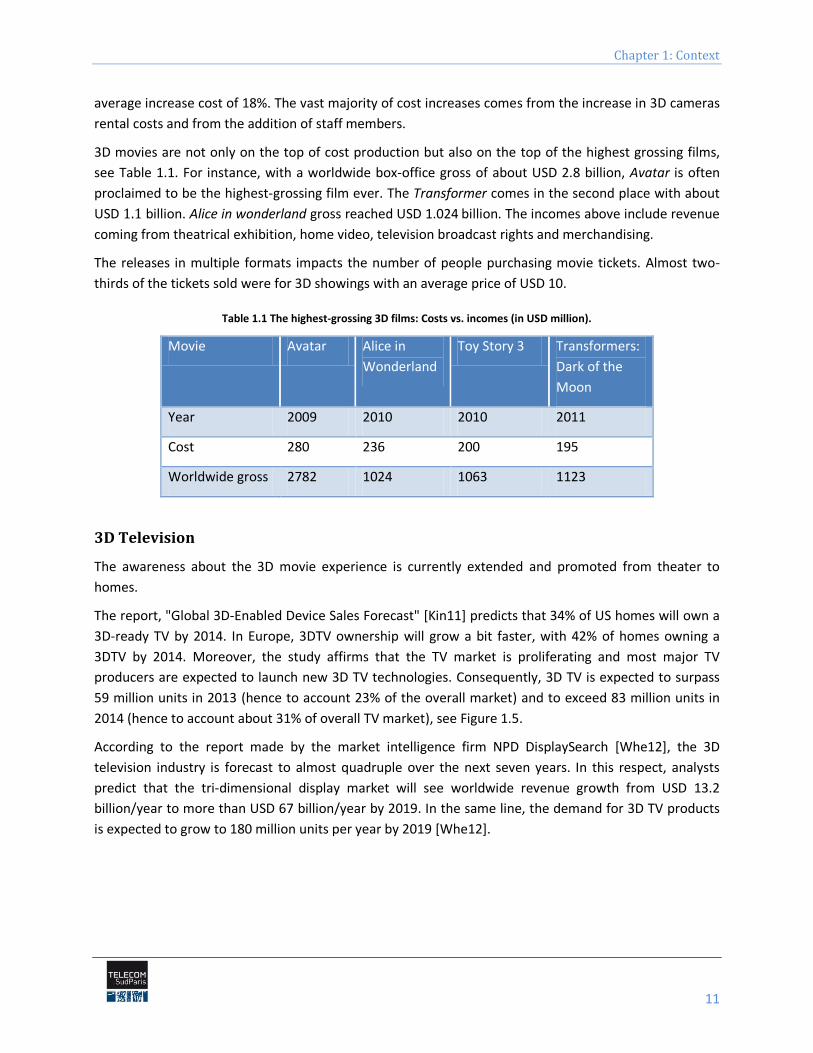
The report, "Global 3D-Enabled Device Sales Forecast" [Kin11] predicts that 34% of US homes will own a
3D-ready TV by 2014. In Europe, 3DTV ownership will grow a bit faster, with 42% of homes owning a
3DTV by 2014. Moreover, the study affirms that the TV market is proliferating and most major TV
producers are expected to launch new 3D TV technologies. Consequently, 3D TV is expected to surpass
59 million units in 2013 (hence to account 23% of the overall market) and to exceed 83 million units in
2014 (hence to account about 31% of overall TV market), see Figure 1.5.
According to the report made by the market intelligence firm NPD DisplaySearch [Whe12], the 3D
television industry is forecast to almost quadruple over the next seven years. In this respect, analysts
predict that the tri-dimensional display market will see worldwide revenue growth from USD 13.2
billion/year to more than USD 67 billion/year by 2019. In the same line, the demand for 3D TV products
is expected to grow to 180 million units per year by 2019 [Whe12].
A.Chammem, Robust watermarking techniques for stereoscopic content protection
12
Figure 1.5 Overall TV and 3D TV sales 2009-2014 [Kin11].
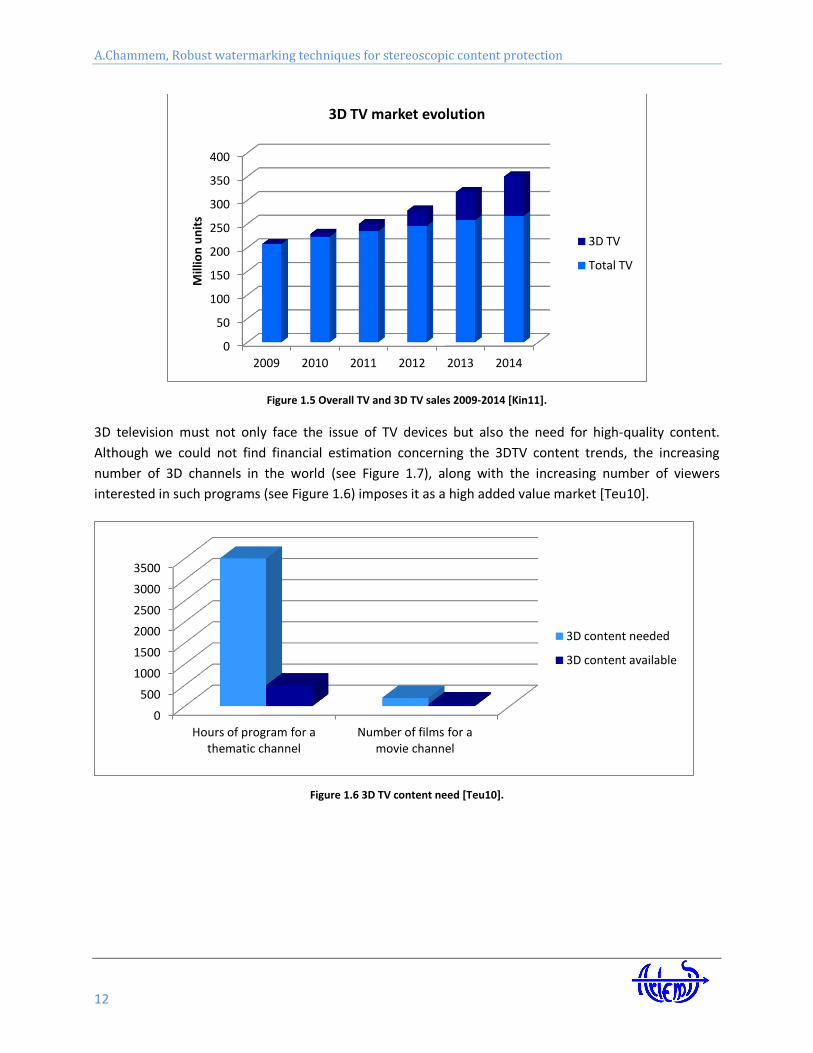
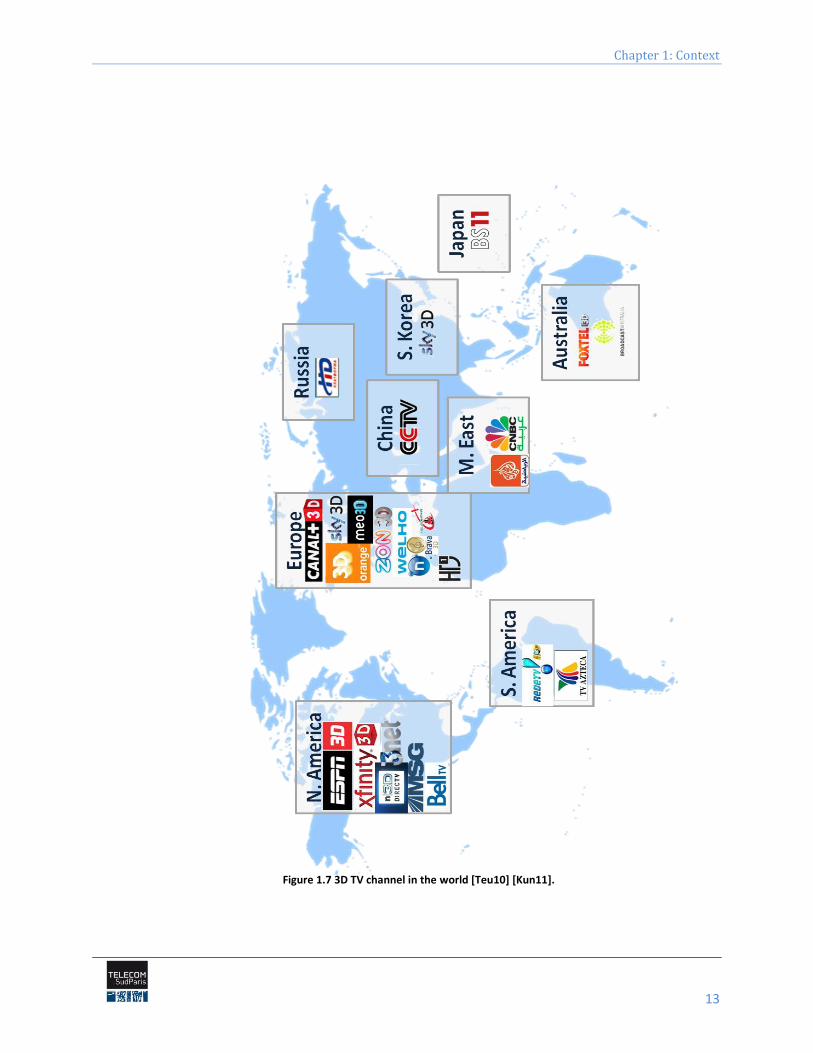
3D television must not only face the issue of TV devices but also the need for high-quality content.
Although we could not find financial estimation concerning the 3DTV content trends, the increasing
number of 3D channels in the world (see Figure 1.7), along with the increasing number of viewers
interested in such programs (see Figure 1.6) imposes it as a high added value market [Teu10].
Figure 1.6 3D TV content need [Teu10].
0
50
100
150
200
250
300
350
400
2009 2010 2011 2012 2013 2014
Mill
ion
un
its
3D TV market evolution
3D TV
Total TV
0
500
1000
1500
2000
2500
3000
3500
Hours of program for a thematic channel
Number of films for a movie channel
3D content needed
3D content available
Chapter 1: Context
13
Figure 1.7 3D TV channel in the world [Teu10] [Kun11].
A.Chammem, Robust watermarking techniques for stereoscopic content protection
14
1.1.2. Device explosion
The content proliferation is supported by explosive effort in 3D devices manufacturing:
3D capturing devices
For side-by-side stereoscopic shooting, two synchronized cameras must be used. The distance between
the center of the lenses of the two cameras is called the interaxial, and the cameras' convergence, is
called the angulation. These two parameters can be modified according to the expected content
peculiarities.
The two cameras must be correctly aligned, identically calibrated (i.e. brightness, color, etc…) and
perfectly synchronized (frame-rate and scan-wise).
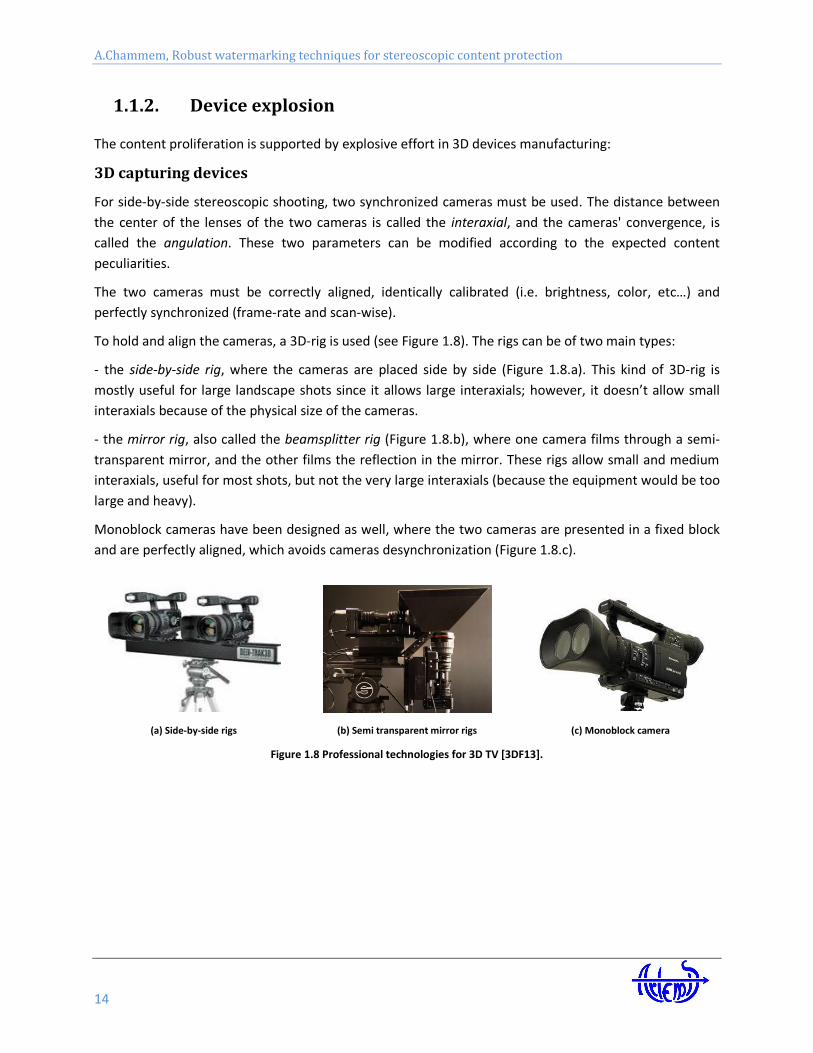
To hold and align the cameras, a 3D-rig is used (see Figure 1.8). The rigs can be of two main types:
- the side-by-side rig, where the cameras are placed side by side (Figure 1.8.a). This kind of 3D-rig is
mostly useful for large landscape shots since it allows large interaxials; however, it doesn’t allow small
interaxials because of the physical size of the cameras.
- the mirror rig, also called the beamsplitter rig (Figure 1.8.b), where one camera films through a semi-
transparent mirror, and the other films the reflection in the mirror. These rigs allow small and medium
interaxials, useful for most shots, but not the very large interaxials (because the equipment would be too
large and heavy).
Monoblock cameras have been designed as well, where the two cameras are presented in a fixed block
and are perfectly aligned, which avoids cameras desynchronization (Figure 1.8.c).
(a) Side-by-side rigs (b) Semi transparent mirror rigs (c) Monoblock camera
Figure 1.8 Professional technologies for 3D TV [3DF13].
Chapter 1: Context
15
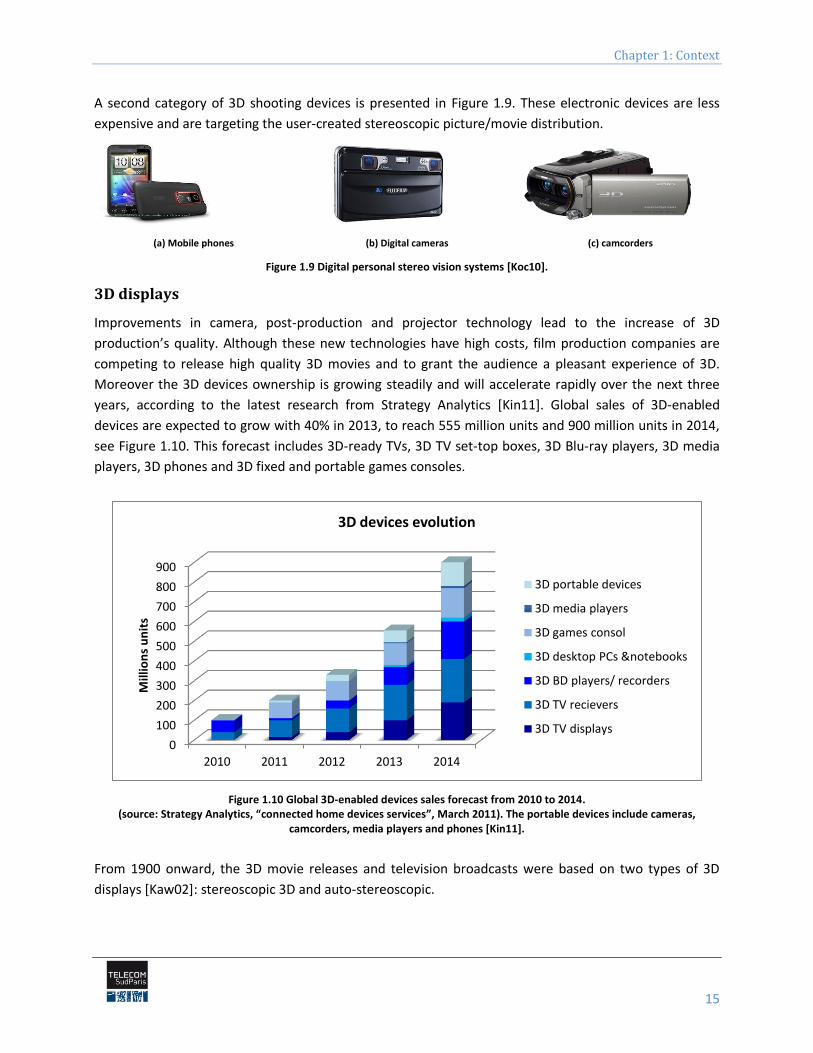
A second category of 3D shooting devices is presented in Figure 1.9. These electronic devices are less
expensive and are targeting the user-created stereoscopic picture/movie distribution.
(a) Mobile phones (b) Digital cameras (c) camcorders
Figure 1.9 Digital personal stereo vision systems [Koc10].
3D displays
Improvements in camera, post-production and projector technology lead to the increase of 3D
production’s quality. Although these new technologies have high costs, film production companies are
competing to release high quality 3D movies and to grant the audience a pleasant experience of 3D.
Moreover the 3D devices ownership is growing steadily and will accelerate rapidly over the next three
years, according to the latest research from Strategy Analytics [Kin11]. Global sales of 3D-enabled
devices are expected to grow with 40% in 2013, to reach 555 million units and 900 million units in 2014,
see Figure 1.10. This forecast includes 3D-ready TVs, 3D TV set-top boxes, 3D Blu-ray players, 3D media
players, 3D phones and 3D fixed and portable games consoles.
Figure 1.10 Global 3D-enabled devices sales forecast from 2010 to 2014. (source: Strategy Analytics, “connected home devices services”, March 2011). The portable devices include cameras,
camcorders, media players and phones [Kin11].
From 1900 onward, the 3D movie releases and television broadcasts were based on two types of 3D
displays [Kaw02]: stereoscopic 3D and auto-stereoscopic.
0
100
200
300
400
500
600
700
800
900
2010 2011 2012 2013 2014
Mill
ion
s u
nit
s
3D devices evolution
3D portable devices
3D media players
3D games consol
3D desktop PCs ¬ebooks
3D BD players/ recorders
3D TV recievers
3D TV displays

A.Chammem, Robust watermarking techniques for stereoscopic content protection
16
For the first category (stereoscopic 3D displays), the viewer needs to wear special glasses which separate
the views of the stereoscopic image for the left and the right eye. These 3D glasses can be active or
passive.
On the one hand, active glasses are controlled by a timing signal that allows to alternatively darken one
eye glass, and then the other, in synchronization with the refresh rate of the screen. Hence presenting
the image intended for the left eye while blocking the right eye's view, then presenting the right-eye
image while blocking the left eye, and repeating the process at a high speed which gives the perception
of a single 3D image. This technology generally uses liquid crystal shutter glasses, see Figure 1.11.a.
On the other hand, passive glasses are polarization-based systems [Kaw02] and contain a pair of
opposite polarizing filters; each of them passes light with similar polarization and blocks the opposite
polarized light (Figure 1.11.b). The polarized glasses are associated with a display with polarized filters,
providing each eye with the appropriate image.
The color anaglyph-based systems are a particular case of the passive glasses and use a color filter for
each eye, typically red and cyan, Figure 1.11.c. The anaglyph 3D image contains two images encoded
using the same color filter, thus ensuring that each image reaches only one eye.
(a) LCD shutter glasses (b) Polarized glasses (c) Anaglyph glasses
Figure 1.11 Samples of passive and active glasses for 3D viewer technologies [Kaw02] [Kun11].
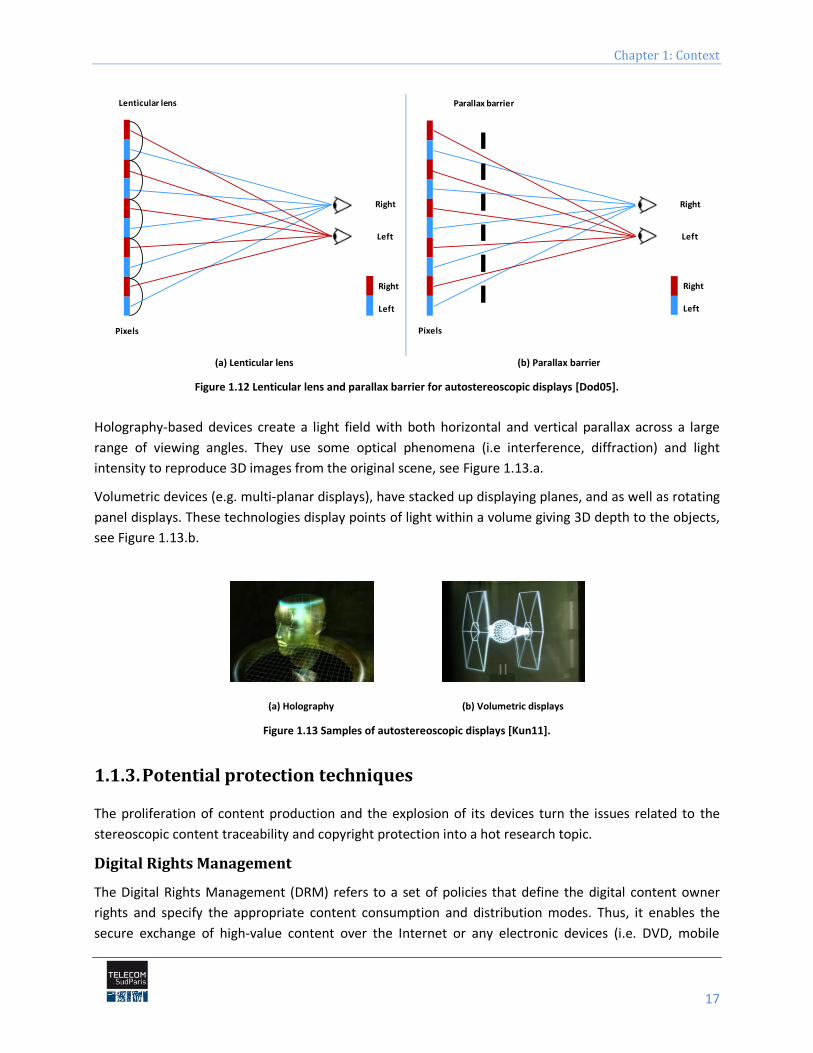
For the second category (auto-stereoscopic), the viewer doesn’t need to use any headgear or glasses.
This category called also glasses-free 3D includes lenticular lens, parallax barrier, holography and
volumetric displays [Dod05] [Hal05] [Kun11], Figure 1.12.
The lenticular lens and the parallax barrier are devices placed in front of an image source, such as a
projector or an LCD monitor, to allow it to discriminate between the content to be presented to the
left/right eyes.
The lenticular lens is a layer of lenses, designed so that when viewed from slightly different angles,
different images are magnified, Figure 1.12.a. However, the parallax barrier consists of a layer of
material with a series of precision slits, allowing each eye to see a different set of pixels, therefore
creating a sense of depth through the parallax, Figure 1.12.b. This technology is used in some auto-
stereoscopic phones and video game consoles such as the Nintendo 3DS. Their major limitation lies in
the so-called sweet-spot which represents the region where the viewer must be placed to perceive the
3D effect. This region can be very narrow depending on the technology, and if the viewer changes
position, he/she will not be able to see the stereoscopic image any more.
Chapter 1: Context
17
(a) Lenticular lens (b) Parallax barrier
Figure 1.12 Lenticular lens and parallax barrier for autostereoscopic displays [Dod05].
Holography-based devices create a light field with both horizontal and vertical parallax across a large
range of viewing angles. They use some optical phenomena (i.e interference, diffraction) and light
intensity to reproduce 3D images from the original scene, see Figure 1.13.a.
Volumetric devices (e.g. multi-planar displays), have stacked up displaying planes, and as well as rotating
panel displays. These technologies display points of light within a volume giving 3D depth to the objects,
see Figure 1.13.b.
(a) Holography (b) Volumetric displays
Figure 1.13 Samples of autostereoscopic displays [Kun11].
1.1.3. Potential protection techniques
The proliferation of content production and the explosion of its devices turn the issues related to the
stereoscopic content traceability and copyright protection into a hot research topic.
Digital Rights Management
The Digital Rights Management (DRM) refers to a set of policies that define the digital content owner
rights and specify the appropriate content consumption and distribution modes. Thus, it enables the
secure exchange of high-value content over the Internet or any electronic devices (i.e. DVD, mobile
Lenticular lens
Right
Left
Right
Left
Pixels
Parallax barrier
Right
Left
Right
Left
Pixels
A.Chammem, Robust watermarking techniques for stereoscopic content protection
18
network, etc). Unfortunately, the restrictions imposed by DRM have made people uncomfortable when
using digital medias [Sub06] [Har00].
Cryptography
Cryptography is a term derived from the Greek words cryptos, which means hiding or secret, and
graphei, which means writting. Cryptography is the most common method of protecting digital content,
and consists in encrypting the content with an encryption key that is later provided only for legitimate
users for decryption. The content can be uploaded on the Internet without any risk of piracy as long as
the key is not provided. Unfortunately, once the pirate has access to the decryption key after a
legitimate purchase of the product, he/she is able to distribute illicit copies. Hence, cryptography is a
good mean of data protection during its transmission, but once the content is decrypted, no further
protection is ensured [Cox02].
Steganography
Steganography is also of Greek origin, derived from steganos, meaning covered or protected, and
graphei which means writing. It is the art of writing hidden messages in a way that no one but the sender
and the receiver know about the existence of the message. Hence, a secret message is encoded in a
manner that its very existence is covered. The main goal of steganography is to communicate securely in
a completely undetectable manner. The security of steganography systems relies on the security of the
data encoding system. Once this later is known, the steganogrpahy system is defeated. Moreover, the
hidden message can be easily removed after applying some common multimedia operations on the host-
media content [Cox02].
Digital watermarking
Watermarking can be considered as the most flexible property right protection technology, since it
potentially supports all the requirements set by real life applications without imposing any constraints
for a legitimate user. This technology adds some information (a mark, i.e. copyright information) in the
original content without altering its visual quality. Such a marked content can be further
distributed/consumed by another user without any restriction. Still, the legitimate/illegitimate usage can
be determined at any moment by detecting the mark. Actually, the watermarking protection mechanism,
instead of restricting the media copy/distribution/consumption, provides means for tracking the source
of the content illegitimate usage [Cox02] [Mit07].
1.2. Watermarking properties
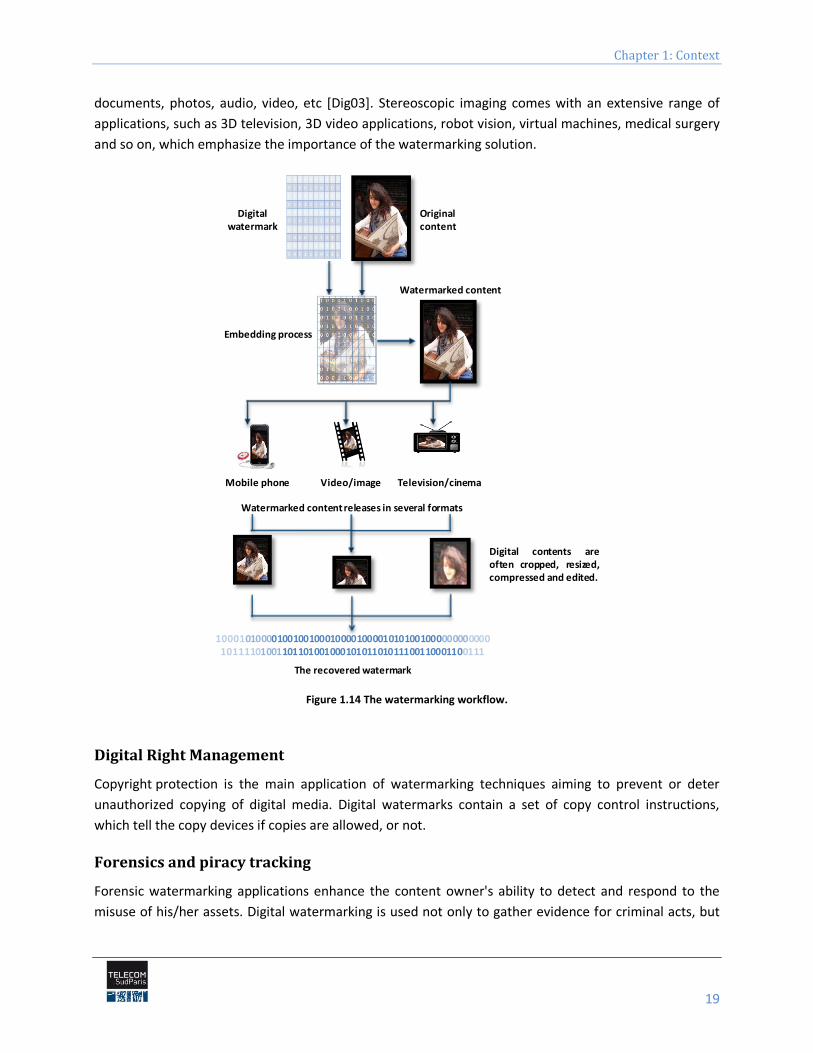
A watermarking technique [Cox02] [Mit07] consists in imperceptibly (transparently) and persistently
(robustly) associating some extra information (a watermark) with some original content. A synopsis of
the watermarking process is presented in Figure 1.14.
1.2.1. Watermarking applicative panorama
Initially devoted to fighting piracy, nowadays watermarking can be the core of a large variety of
applications for each type of media content, and for both analogous and digital formats: secure
Chapter 1: Context
19
documents, photos, audio, video, etc [Dig03]. Stereoscopic imaging comes with an extensive range of
applications, such as 3D television, 3D video applications, robot vision, virtual machines, medical surgery
and so on, which emphasize the importance of the watermarking solution.
Figure 1.14 The watermarking workflow.
Digital Right Management
Copyright protection is the main application of watermarking techniques aiming to prevent or deter
unauthorized copying of digital media. Digital watermarks contain a set of copy control instructions,
which tell the copy devices if copies are allowed, or not.
Forensics and piracy tracking
Forensic watermarking applications enhance the content owner's ability to detect and respond to the
misuse of his/her assets. Digital watermarking is used not only to gather evidence for criminal acts, but
Original content
Digital watermark
Embedding process
Watermarked content
The recovered watermark
Watermarked content releases in several formats
Mobile phone Video/image Television/cinema
1000101000010010010001000010000101010010000000000001011110100110110100100010101101011100110001100111
Digital contents areoften cropped, resized,compressed and edited.
A.Chammem, Robust watermarking techniques for stereoscopic content protection
20
also to enforce contractual usage agreements between a content owner and the customers. It provides
positive, irrefutable evidence of misuse for leaked content assets [Dig03].
Authentication and integrity
Digital watermarks are imperceptibly embedded into all forms of media content, be they individually or
aggregately distributed/stored. The watermark can uniquely identify each specific item or instance of
content and carry information about its consumption chain and intended destinations. Watermarks can
be encrypted and secured so that only authorized reading devices can detect and access the data.
Altering a watermark is virtually impossible and the carried data can immediately indicate if the content
is genuine or a counterfeit [Sam09].
Broadcast and Internet monitoring
Over the last few years, the amount of content flowing through television/radio channels continues to
grow exponentially. Watermarking techniques offer the best solution to automate the monitoring of
digital content. The original content, which has been embedded conveys a unique identifier (owner,
distributor, data/time information) allowing the content owners and distributors to track their media
[Sam09].
Asset and content management
Watermarking techniques enable effective content identification by giving a unique digital identity to any
type of media content and by embedding this identity as additional hidden information [Sam09]. The
watermarks have to be imperceptible and to have minimal or no impact on the visual quality of the
original content. Hence they can be used as a persistent tag, acting as keys into a digital asset
management system (DAM). Tagged content can lead back to the original content stored in the DAM
system; it can also be linked to metadata in the DAM, such as keywords, rights and permissions.
Filtering/classification
Digital watermarks offer new opportunities for content owners, advertisers and more generally
marketers searching for new ways to engage consumers in richer media experiences. In fact, the
embedded information enables the identification, classification and filtering of multimedia content. The
watermarking systems are able to selectively filter potential inappropriate content (e.g. parental
control).
1.2.2. Main watermarking constraints
To assess the performances of a watermarking technique, the following main properties are generally
considered: transparency, robustness, data payload, false positive rate and computational cost.
According to the targeted application, different constraints are set on these properties.
Chapter 1: Context
21
1.2.2.1. Transparency
Transparency can be defined as the imperceptibility of the embedded additional information in the
watermarked media. This may signify either that the user is not disturbed by the artefacts induced by the
watermark in the host document or that the user cannot identify any difference between the marked
and the unmarked document.
Subjective evaluation
In order to assess the impact of these artefacts from the human visual point of view, subjective protocol
and objective quality measures can be considered.
The International Telecommunication Union (ITU) defined some recommendations to be followed for the
subjective evaluation [BT98] [BT00] [BT02]. First, it states the required material for the test, such as the
monitor and its calibration parameters and defines the environment conditions such as the testing room
luminance in order to ensure the reproducibility of results. Second, the panel size is designed depending
on the sensitivity and reliability of the test procedure adopted and upon the anticipated size of the effect
sought. The minimum number of observers is fixed at 15. The observer’s visual acuity and color vision
have to be tested according to Snellen chart and Ishihara test, respectively. Other tests are required for
different types of content (i.e. fine stereopsis and dynamic stereopsis tests for stereoscopic content
assessment).
The ITU-R BT.500-12 also describes methods for subjective quality assessment of the quality of television
pictures. Among these, the research community considers the Double-Stimulus Continuous Quality-Scale
(DSCQS), the Double-Stimulus Impairment Scale (DSIS) and the single Stimulus for Continuous Quality
Evaluation (SSCQE).
Finally, rules for score computation and results analysis were defined.
Objective quality metrics
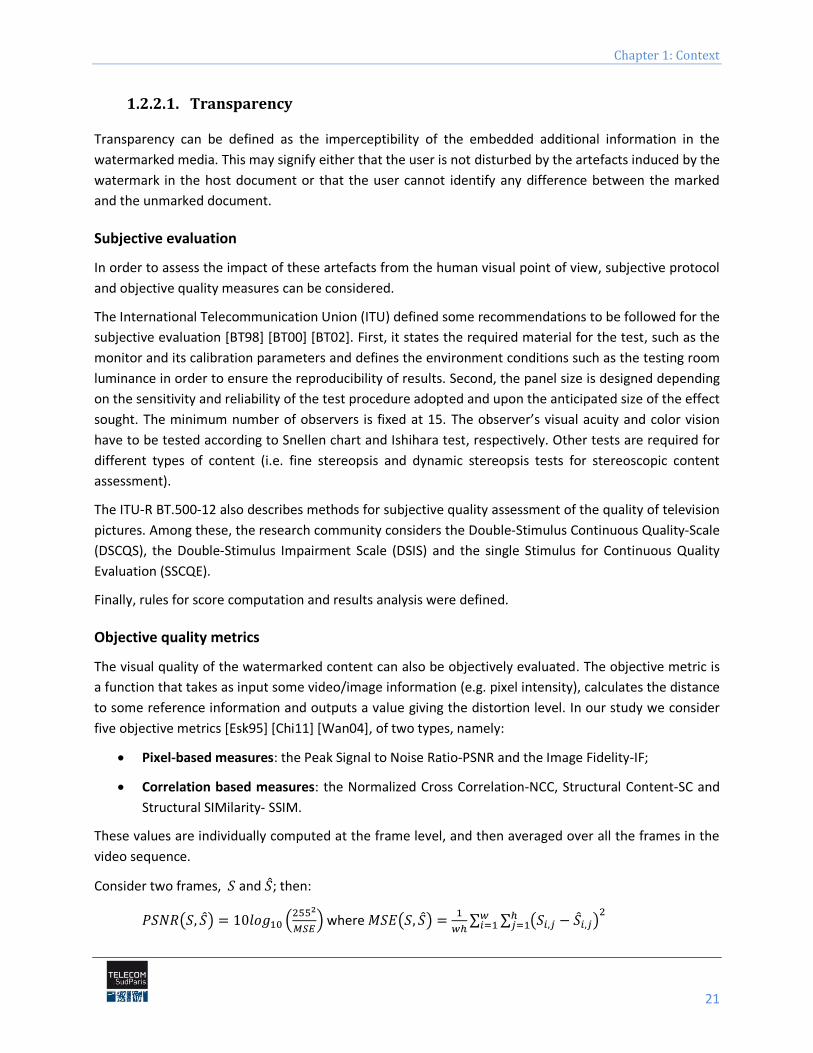
The visual quality of the watermarked content can also be objectively evaluated. The objective metric is
a function that takes as input some video/image information (e.g. pixel intensity), calculates the distance
to some reference information and outputs a value giving the distortion level. In our study we consider
five objective metrics [Esk95] [Chi11] [Wan04], of two types, namely:
Pixel-based measures: the Peak Signal to Noise Ratio-PSNR and the Image Fidelity-IF;
Correlation based measures: the Normalized Cross Correlation-NCC, Structural Content-SC and
Structural SIMilarity- SSIM.
These values are individually computed at the frame level, and then averaged over all the frames in the
video sequence.
Consider two frames, and ; then:
where
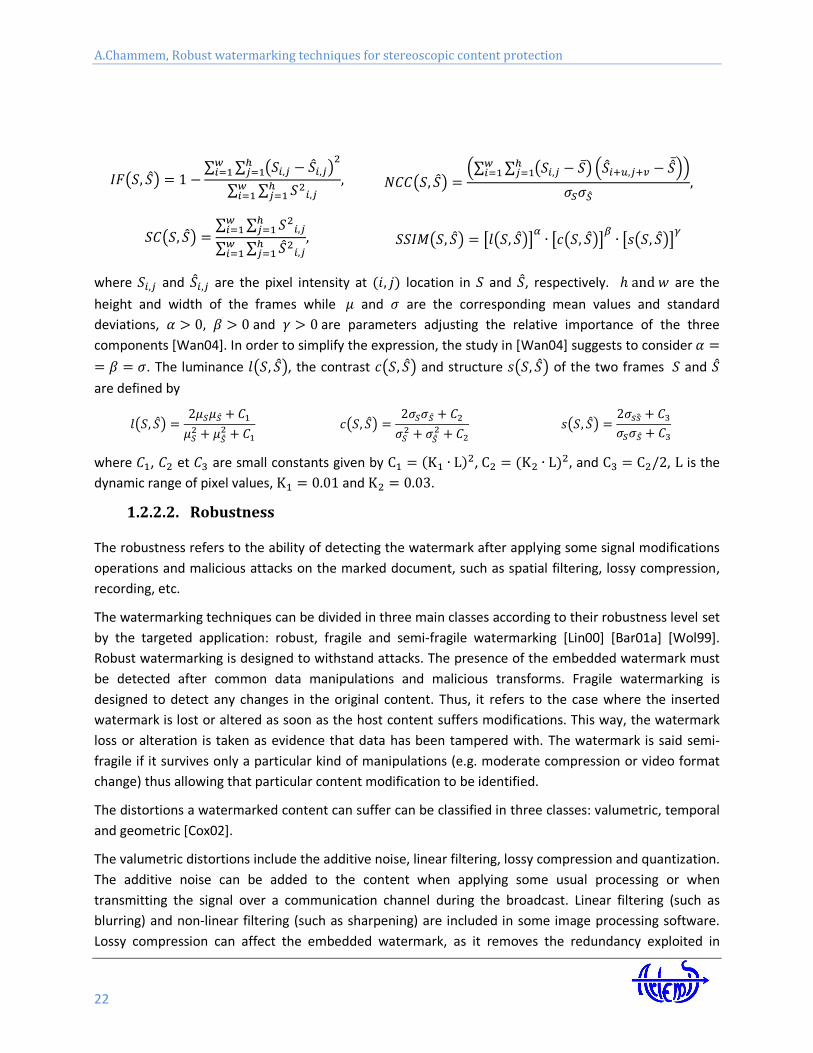
A.Chammem, Robust watermarking techniques for stereoscopic content protection
22
where and are the pixel intensity at location in and , respectively. are the
height and width of the frames while and are the corresponding mean values and standard
deviations, and are parameters adjusting the relative importance of the three
components [Wan04]. In order to simplify the expression, the study in [Wan04] suggests to consider
. The luminance , the contrast and structure of the two frames and
are defined by
where , et are small constants given by ,
and , is the
dynamic range of pixel values, and .
1.2.2.2. Robustness
The robustness refers to the ability of detecting the watermark after applying some signal modifications
operations and malicious attacks on the marked document, such as spatial filtering, lossy compression,
recording, etc.
The watermarking techniques can be divided in three main classes according to their robustness level set
by the targeted application: robust, fragile and semi-fragile watermarking [Lin00] [Bar01a] [Wol99].
Robust watermarking is designed to withstand attacks. The presence of the embedded watermark must
be detected after common data manipulations and malicious transforms. Fragile watermarking is
designed to detect any changes in the original content. Thus, it refers to the case where the inserted
watermark is lost or altered as soon as the host content suffers modifications. This way, the watermark
loss or alteration is taken as evidence that data has been tampered with. The watermark is said semi-
fragile if it survives only a particular kind of manipulations (e.g. moderate compression or video format
change) thus allowing that particular content modification to be identified.
The distortions a watermarked content can suffer can be classified in three classes: valumetric, temporal
and geometric [Cox02].
The valumetric distortions include the additive noise, linear filtering, lossy compression and quantization.
The additive noise can be added to the content when applying some usual processing or when
transmitting the signal over a communication channel during the broadcast. Linear filtering (such as
blurring) and non-linear filtering (such as sharpening) are included in some image processing software.
Lossy compression can affect the embedded watermark, as it removes the redundancy exploited in
Chapter 1: Context
23
watermarking schemes. Finally, a good watermarking system has to survive the quantization which
generally occurs during a Discrete Cosine Transform (DCT) or Discrete Wavelet Transform (DWT) used for
compression purposes.
The temporal distortions include delay and temporal scaling. This type of attacks often occurs during the
conversions between different television standards, for example the frame-rate changes.
The geometric distortions include rotations, translations, spatial scaling, cropping and changes in aspect
ratio.
All these types of distortions are considered as malicious attacks and can occur due to user
manipulations. For images, such manipulations can be printing and scanning. However, for video
content, geometric distortions commonly occur during format changes.
Attacks are very likely to appear during the stereoscopic content processing workflow and it is hard to
design a watermarking system able to survive all types of distortions while preserving the watermarked
content‘ s fidelity.
StirMark is a generic tool developed for robustness assessment of image watermarking algorithms
[Pet98] [Pet00]. Among a large class of attacks, it also includes StirMark random bending, a simulator of
the random errors induced when printing the image on a high quality printer and then scanning it with a
low quality scanner. It also applies minor geometric distortions: the image is slightly stretched, sheared
shifted and rotated by a random amount and the re-sampled by using Nyquist interpolation, see Figure
1.15.c (right) and Figure 1.16.c (right)4.
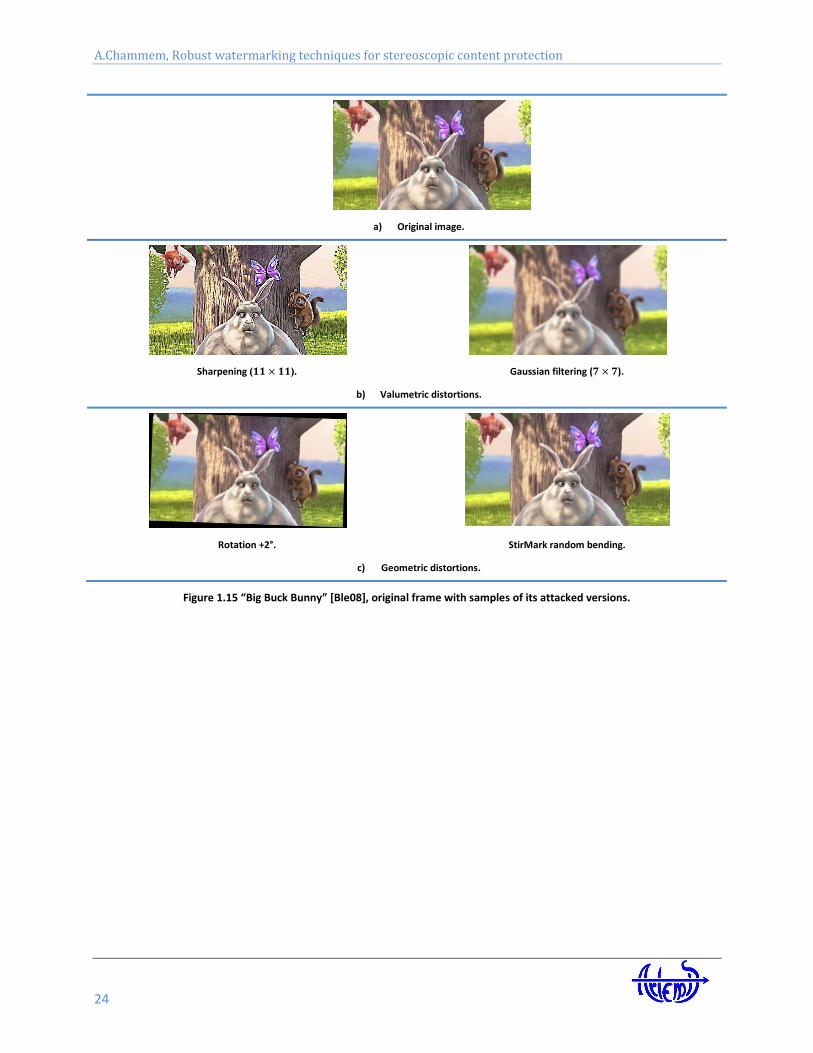
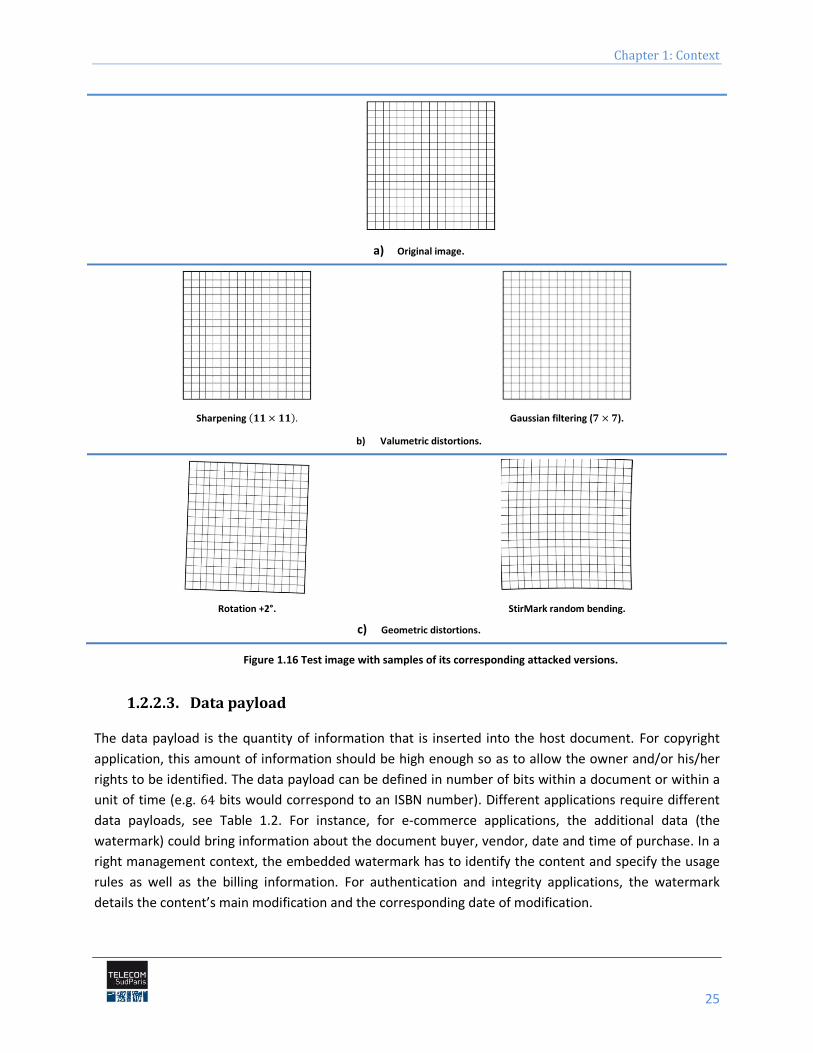
Figures 1.15 and 1.16 show some of the most common attack effects on one image taken from the
corpus processed in the thesis, see Appendix A.1 and on a test image respectively. The distorted versions
of the original image are represented in the second and the third row according to the type of the
applied attack.
4 All through this thesis, the StirMark random bending attack is considered.
A.Chammem, Robust watermarking techniques for stereoscopic content protection
24
a) Original image.
Sharpening ( ). Gaussian filtering ( ).
b) Valumetric distortions.
Rotation +2°. StirMark random bending.
c) Geometric distortions.
Figure 1.15 “Big Buck Bunny” [Ble08], original frame with samples of its attacked versions.
Chapter 1: Context
25
a) Original image.
Sharpening Gaussian filtering ( ).
b) Valumetric distortions.
Rotation +2°. StirMark random bending.
c) Geometric distortions.
Figure 1.16 Test image with samples of its corresponding attacked versions.
1.2.2.3. Data payload
The data payload is the quantity of information that is inserted into the host document. For copyright
application, this amount of information should be high enough so as to allow the owner and/or his/her
rights to be identified. The data payload can be defined in number of bits within a document or within a
unit of time (e.g. bits would correspond to an ISBN number). Different applications require different
data payloads, see Table 1.2. For instance, for e-commerce applications, the additional data (the
watermark) could bring information about the document buyer, vendor, date and time of purchase. In a
right management context, the embedded watermark has to identify the content and specify the usage
rules as well as the billing information. For authentication and integrity applications, the watermark
details the content’s main modification and the corresponding date of modification.
A.Chammem, Robust watermarking techniques for stereoscopic content protection
26
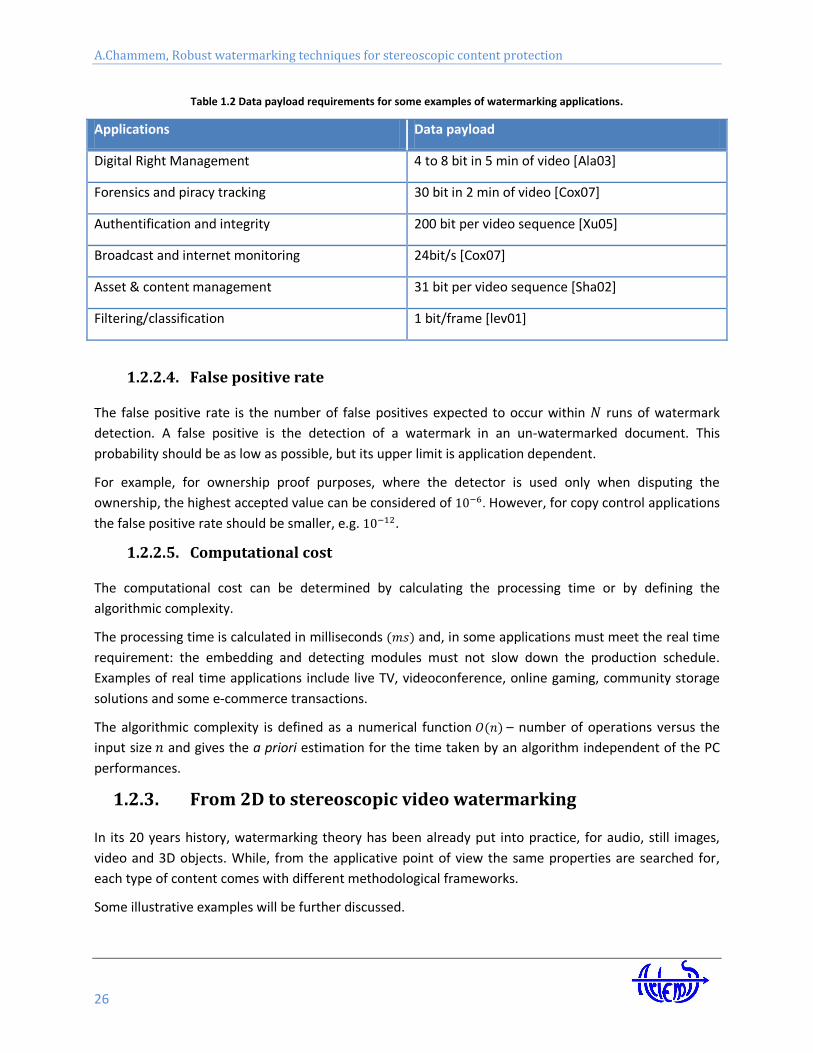
Table 1.2 Data payload requirements for some examples of watermarking applications.
Applications Data payload
Digital Right Management 4 to 8 bit in 5 min of video [Ala03]
Forensics and piracy tracking 30 bit in 2 min of video [Cox07]
Authentification and integrity 200 bit per video sequence [Xu05]
Broadcast and internet monitoring 24bit/s [Cox07]
Asset & content management 31 bit per video sequence [Sha02]
Filtering/classification 1 bit/frame [lev01]
1.2.2.4. False positive rate
The false positive rate is the number of false positives expected to occur within runs of watermark
detection. A false positive is the detection of a watermark in an un-watermarked document. This
probability should be as low as possible, but its upper limit is application dependent.
For example, for ownership proof purposes, where the detector is used only when disputing the
ownership, the highest accepted value can be considered of . However, for copy control applications
the false positive rate should be smaller, e.g. .
1.2.2.5. Computational cost
The computational cost can be determined by calculating the processing time or by defining the
algorithmic complexity.
The processing time is calculated in milliseconds and, in some applications must meet the real time
requirement: the embedding and detecting modules must not slow down the production schedule.
Examples of real time applications include live TV, videoconference, online gaming, community storage
solutions and some e-commerce transactions.
The algorithmic complexity is defined as a numerical function – number of operations versus the
input size and gives the a priori estimation for the time taken by an algorithm independent of the PC
performances.
1.2.3. From 2D to stereoscopic video watermarking
In its 20 years history, watermarking theory has been already put into practice, for audio, still images,
video and 3D objects. While, from the applicative point of view the same properties are searched for,
each type of content comes with different methodological frameworks.
Some illustrative examples will be further discussed.
Chapter 1: Context
27
Image watermarking
Digital images are often printed and scanned again, downloaded and reused for illustrations.
Consequently, many watermarking algorithms have been advanced to protect them from illicit use
[Nik98] [Gro01].
The visual quality is obviously crucial in image watermarking which leads to a limited data payload. When
used as illustrations, images are often compressed by lossy compression algorithms like JPEG and
undergo many other common processing operations including softening, sharpening, denoising, scaling,
cropping and colour corrections.
Currently, the most challenging attacks on the robustness of image watermarks are nonlinear
transformations, which make the watermark undetectable for the detection algorithm. But even
common image processing operations, like scaling and rotations, can be serious challenges for the re-
synchronisation of an image watermark.
Another important aspect of image watermarking is the broad variety of image types. There are photos,
figures based on line drawings, rendered synthetic images, bitmap representations of textual
information, etc… Challenges with respect to transparency and robustness often depend on the
characteristics of these image types.
Video watermarking
In the literature, video watermarking has been initially approached as a direct extension of still image
watermarking, i.e. by considering a video as a set of still images which are individually protected [Kal99].
However, such straightforward application does not consider the peculiarities of the video content. First,
with respect to still images, a larger variety of both hostile and non-hostile processing, such as video
editing, lossy compression, filtering, chrominance re-sampling, change of the frame rate during
transmission, and formats interchanging, have to be considered. Secondly, in digital video the content is
usually dynamic and the human attention cannot focus on all the areas of the video frame
simultaneously.
Consequently, for video watermarking, it is of paramount importance to select proper frame regions that
can guarantee the data masking, and it is crucial to decide the embedding technique (frame by frame
[Bar00], or multiple frames [Kal99]). Given that some particular frame-based attacks (frame dropping,
frame exchanging, and frame rate variation) can occur, it seems that frame by frame techniques are
preferable, since, in this case, each frame contains the entire watermark, and time synchronization is not
needed. Nevertheless, the watermark embedding and recovery can greatly benefit from exploiting the
information which is contained in a sequence of frames, i.e. watermark recovery should be performed
on a video sequence basis.
Another important issue regarding the video content is related to the possibility of embedding the same
watermark in every frame, thus obtaining a system which is sensible to statistical attacks. The other
option is to change the watermark from frame to frame with the risk of producing visible temporal
artefacts [Hol00].
A.Chammem, Robust watermarking techniques for stereoscopic content protection
28
3D watermarking
3D data is mainly represented by meshes and Non-Uniform Rational Basis Spline (NURBS); these two
representations also define the classes of 3D watermarking techniques.
The largest part (more than ) of the studies on 3D data watermarking are mesh-based [Yeo99], no
matter if they are devoted to fragile watermarking or to robust watermarking [Lin00] [Bar01a] [Wol99].
Generally, the mesh-based techniques embed the watermark into the vertex positions. Their main
problem remains always the robustness. When dealing with NURBS representations, the main advantage
is the availability of a natural 2D surface parameterization which makes it possible to extend the 2D
watermarking techniques to 3D data. As far as we know, [Lee02] is the first study which exploits the
NURBS parametric definition. In this respect the authors advanced a method where the mark is not
embedded directly into the 3D model but into some virtual images derived from the 3D model. They
propose two methods, the first for steganography and the second for watermarking. For the latter
method, three virtual images are obtained by uniformly sampling the 3D model and by recording the ,
and co-ordinates of the sampled images.
Streoscopic visual content
In the watermarking context, the stereo data can be represented in two modalities. The first one simply
considers the right and the left views as two independent images. This way, the stereo data can be
straightforward exploited with basic 2D methods. However, such an approach has no guaranteed success
in the stereoscopic image processing, since it neglects the very intimate mechanisms governing their
interdependence. The second modality considers derived representations from the stereo pair, as a
disparity map, for instance. Consequently, the stereo watermarking scheme can be classified according
to these two directions: view based stereo approaches [Don03a] [Don03b] [Bha09] [Ell09] and disparity
based stereo approaches [Zen07].
1.2.4. Theoretical framework for stereo watermarking
From the theoretical point of view, and independently on the protected data peculiarities, a
watermarking technique can be identified within the communication theory as a noisy channel, Figure
1.17: the mark is sampled from the information source and should be sent through a channel where a
strong noise (the original content and the malicious attacks) acts. The watermarking challenge consists of
optimizing the transmission through this channel, i.e. specifying a method achieving prescribed
transparency and robustness while maximizing the data payload. This model shows that transparency,
robustness and data payload properties are three-folded antagonistic constraints in the design of a
watermarking scheme. First, for a fixed data payload, the more transparent the mark, the lower its
power at the transmitter, hence the lower its robustness. Second, for a fixed robustness, the larger
embedded amount of data, the lower watermark transparency. Third, for a fixed transparency, the more
robust the mark, the lower the data payload.
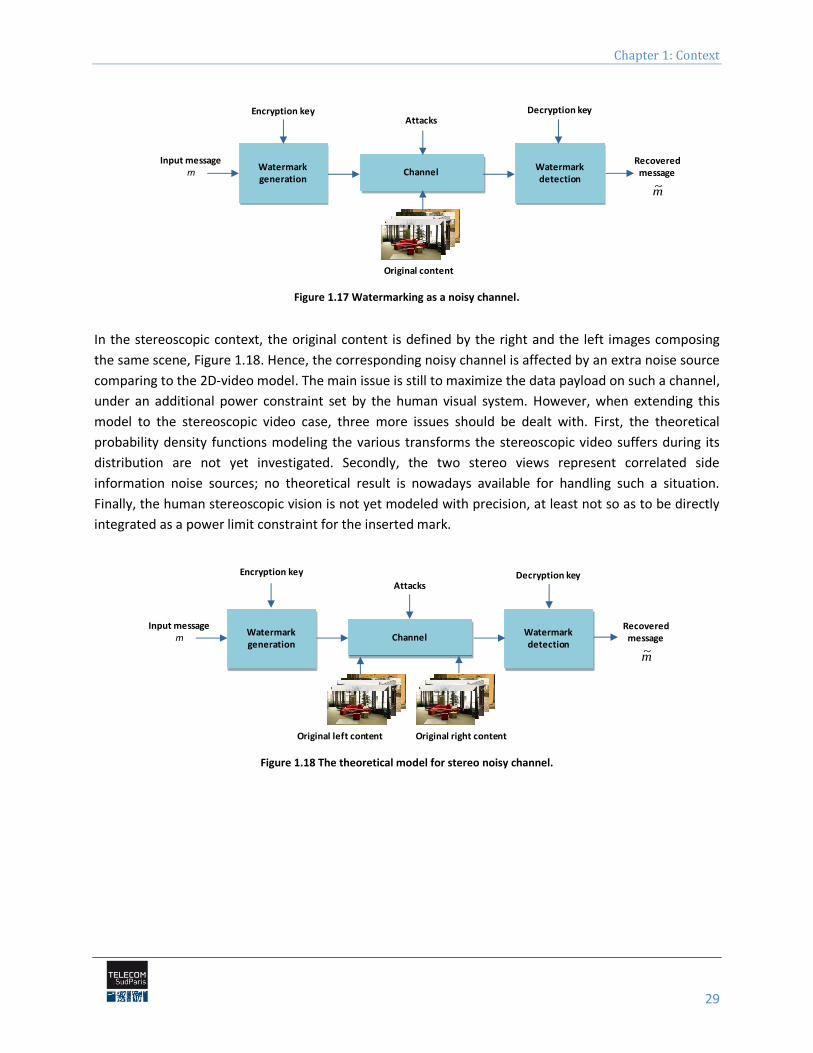
Chapter 1: Context
29
Figure 1.17 Watermarking as a noisy channel.
In the stereoscopic context, the original content is defined by the right and the left images composing
the same scene, Figure 1.18. Hence, the corresponding noisy channel is affected by an extra noise source
comparing to the 2D-video model. The main issue is still to maximize the data payload on such a channel,
under an additional power constraint set by the human visual system. However, when extending this
model to the stereoscopic video case, three more issues should be dealt with. First, the theoretical
probability density functions modeling the various transforms the stereoscopic video suffers during its
distribution are not yet investigated. Secondly, the two stereo views represent correlated side
information noise sources; no theoretical result is nowadays available for handling such a situation.
Finally, the human stereoscopic vision is not yet modeled with precision, at least not so as to be directly
integrated as a power limit constraint for the inserted mark.
Figure 1.18 The theoretical model for stereo noisy channel.
Recoveredmessage
m~
Decryption keyEncryption key
Input messagem Channel
Attacks
Watermarkdetection
Original content
Watermarkgeneration
Recoveredmessage
m~
Decryption keyEncryption key
Input messagem Channel
Attacks
Watermarkdetection
Original right contentOriginal left content
Watermarkgeneration
A.Chammem, Robust watermarking techniques for stereoscopic content protection
30
1.3. Thesis structure
In order to investigate the practical impact the watermarking technique can have for stereoscopic video
content protection, this thesis is structured as follow.
The second Chapter is composed of two main parts. The first stands for a state-of-the-art of the disparity
map computation algorithms and the second presents a critical overview of stereoscopic watermarking
approaches.
Chapter 3 introduces a new disparity map for stereo watermarking scheme. First, the new disparity map
algorithm (further referred to as the 3DV-NTSS) is presented and the experimental validation is
described.
Chapter 4 explicitly describes the Fast-IProtect stereo embedding technique. First, it introduces the
hybrid watermarking technique IProtect and presents its advantage and main drawbacks. Second, it
presents the advanced solution to enhance the IProtect performances in terms of computational cost.
In Chapter 5, a benchmark of four class of embedding technique applied on four insertion domains is
presented.
The last Chapter is devoted to concluding remarks and perspectives.
The thesis has four appendixes. Appendix 1 is devoted to the processed corpora. Appendix 2 presents
the considered embedding techniques. The results on the subjective and objective evaluation of the
watermarked videos transparency and their corresponding 95% error limits are detailed in Appendix 3.
Appendix 4 details the numerical values of the robustness evaluation and their corresponding 95% error
limits.

Chapter 2 Objectives
A.Chammem, Robust watermarking techniques for stereoscopic content protection
32
Abstract
This Chapter contains two main parts. The first part presents the state of the art for the disparity map
computation methods and compares their performances. The second part introduces the two main
directions in watermarking (Spread Spectrum and Side Information) and presents a critical overview of
the underlying stereo watermarking approaches. This makes it possible for the thesis main objectives to
be identified and positioned with respect to the current day methodological limitations.
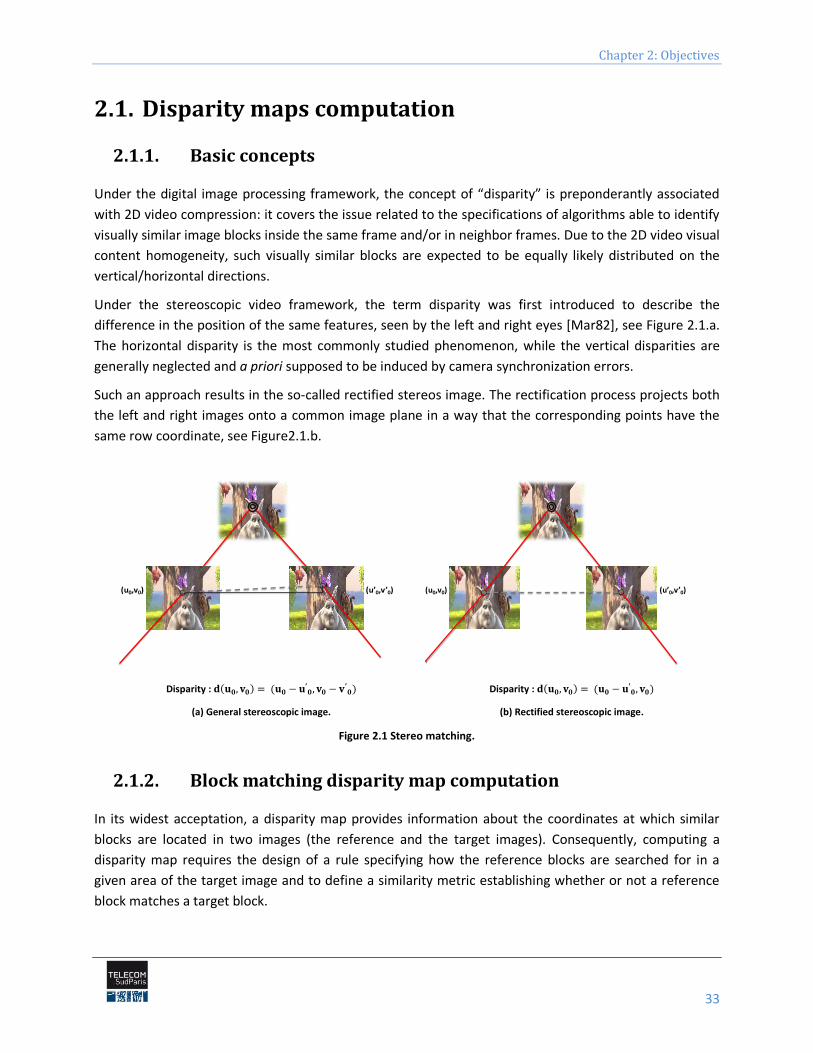
Chapter 2: Objectives
33
2.1. Disparity maps computation
2.1.1. Basic concepts
Under the digital image processing framework, the concept of “disparity” is preponderantly associated
with 2D video compression: it covers the issue related to the specifications of algorithms able to identify
visually similar image blocks inside the same frame and/or in neighbor frames. Due to the 2D video visual
content homogeneity, such visually similar blocks are expected to be equally likely distributed on the
vertical/horizontal directions.
Under the stereoscopic video framework, the term disparity was first introduced to describe the
difference in the position of the same features, seen by the left and right eyes [Mar82], see Figure 2.1.a.
The horizontal disparity is the most commonly studied phenomenon, while the vertical disparities are
generally neglected and a priori supposed to be induced by camera synchronization errors.
Such an approach results in the so-called rectified stereos image. The rectification process projects both
the left and right images onto a common image plane in a way that the corresponding points have the
same row coordinate, see Figure2.1.b.
Disparity :
Disparity :
(a) General stereoscopic image. (b) Rectified stereoscopic image.
Figure 2.1 Stereo matching.
2.1.2. Block matching disparity map computation
In its widest acceptation, a disparity map provides information about the coordinates at which similar
blocks are located in two images (the reference and the target images). Consequently, computing a
disparity map requires the design of a rule specifying how the reference blocks are searched for in a
given area of the target image and to define a similarity metric establishing whether or not a reference
block matches a target block.
(u0,v0) (u’0,v’0) (u0,v0) (u’0,v’0)
A.Chammem, Robust watermarking techniques for stereoscopic content protection
34
By exploiting the spatio/temporal correlation between successive frames in 2D video content, several
disparity maps have already been advanced and proved their efficiency in various research fields, like
compression, indexing or segmentation. They generally assumed that the differences between the target
and reference frames are homogeneous on the two directions and they performed the block matching
by measures based on the differences between the values in the two blocks (e.g. Mean Squared Error –
MSE or Sum of Absolute Differences – SAD).
The Exhaustive Search (ES) algorithm [Kua99] is widely used for block motion estimation in video coding
in order to determine effective similarity while providing minimal error estimation for a fixed search
window size, see Figure 2.2.a. The estimated MSE provided by the ES algorithm for content of medium to
high motion is of ; this value decreases to for content with small motion. The main
disadvantage of ES is the massive computation required for running the full search window. The average
search points is estimated to be for a block of pixels and the algorithm complexity is of
, where is the searching distance.
Several fast algorithms were developed to reduce the computation cost and to remedy the huge time
consumption issue. The Three Step Search (TSS) was advanced by Koga et al. [Kog81] and consists of
three evaluation steps, each of which composed of nine uniformly spaced search points. The best
candidate search point in a step becomes the center of the following step. In the first step, a nine-point
search pattern on a grid is considered. TSS requires a fixed search points per block,
which leads to a speedup ratio of over the ES in a block of pixels. The algorithm complexity is
logarithmic: . However the visual quality is degraded comparing to the ES algorithm;
the estimated MSE values for medium/large motion content and for small motion content being of
and , respectively. The main drawback of TSS is the relatively large search pattern
considered in the first step, which makes it inefficient for finding blocks with small motions.
The Four Step Search (4SS) [Jai81] was introduced to reduce the average computational cost and to give
better motion estimation. 4SS requires four search steps for the same search window. It reduces
the initial step size comparing to the TSS algorithm by considering a nine-point search pattern on a
grid in the first step. Hence, it increased efficiency for small motions, but it is more complex than TSS.
4SS gave less compensation errors than TSS: the estimated MSE values being of and for
medium/large motion content and for small motion content, respectively.
The conjugate Directional Search (CDS) [Sri85] is advanced to offer less motion estimations errors since
it considers multiple search directions. The search starts initially in the vertical and horizontal axis
directions of the center of the search area. Each new minimum leads to a new search line joining the
previous and the new minima. The average MSE for medium/high motion content and small motion
content are of and , respectively. The CDS algorithm complexity is of .
Zeng and Liou [Li94] advanced the New Three Step Search (NTSS) algorithm (Figure 2.2.b) for fast block
matching estimation and showed that it provides smaller motion compensation errors than the state of
the art given by the TSS, the 4SS and the CDS. NTSS requires three search steps. In the first step, it
considers two search patterns: nine-points at a grid of and eight-points on a grid of . The
algorithm complexity is of and the average search point number is for a
pixel search area. The estimated MSE values for medium/large motion content and for small motion
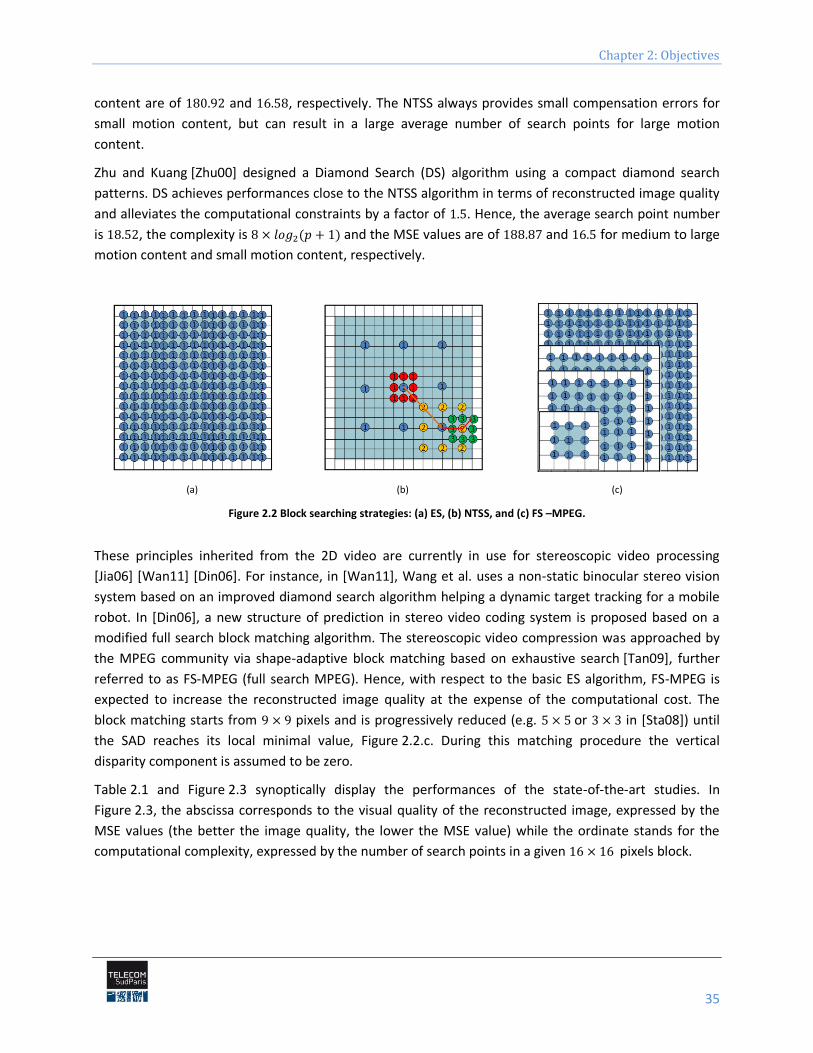
Chapter 2: Objectives
35
content are of and , respectively. The NTSS always provides small compensation errors for
small motion content, but can result in a large average number of search points for large motion
content.
Zhu and Kuang [Zhu00] designed a Diamond Search (DS) algorithm using a compact diamond search
patterns. DS achieves performances close to the NTSS algorithm in terms of reconstructed image quality
and alleviates the computational constraints by a factor of . Hence, the average search point number
is , the complexity is and the MSE values are of and for medium to large
motion content and small motion content, respectively.
(a) (b) (c)
Figure 2.2 Block searching strategies: (a) ES, (b) NTSS, and (c) FS –MPEG.
These principles inherited from the 2D video are currently in use for stereoscopic video processing
[Jia06] [Wan11] [Din06]. For instance, in [Wan11], Wang et al. uses a non-static binocular stereo vision
system based on an improved diamond search algorithm helping a dynamic target tracking for a mobile
robot. In [Din06], a new structure of prediction in stereo video coding system is proposed based on a
modified full search block matching algorithm. The stereoscopic video compression was approached by
the MPEG community via shape-adaptive block matching based on exhaustive search [Tan09], further
referred to as FS-MPEG (full search MPEG). Hence, with respect to the basic ES algorithm, FS-MPEG is
expected to increase the reconstructed image quality at the expense of the computational cost. The
block matching starts from pixels and is progressively reduced (e.g. or in [Sta08]) until
the SAD reaches its local minimal value, Figure 2.2.c. During this matching procedure the vertical
disparity component is assumed to be zero.
Table 2.1 and Figure 2.3 synoptically display the performances of the state-of-the-art studies. In
Figure 2.3, the abscissa corresponds to the visual quality of the reconstructed image, expressed by the
MSE values (the better the image quality, the lower the MSE value) while the ordinate stands for the
computational complexity, expressed by the number of search points in a given pixels block.
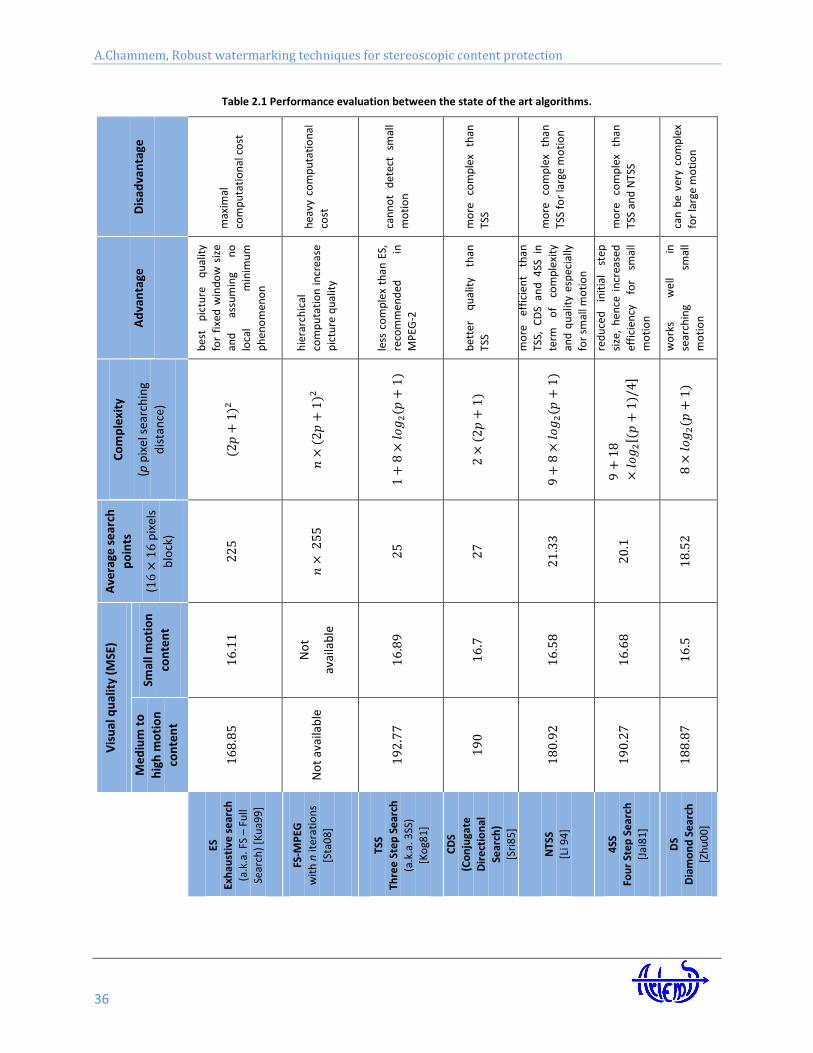
A.Chammem, Robust watermarking techniques for stereoscopic content protection
36
Table 2.1 Performance evaluation between the state of the art algorithms.
Dis
adva
nta
ge
max
imal
com
pu
tati
on
al c
ost
hea
vy c
om
pu
tati
on
al
cost
can
no
t d
etec
t sm
all
mo
tio
n
mo
re
com
ple
x th
an
TSS
mo
re
com
ple
x th
an
TSS
for
larg
e m
oti
on
mo
re
com
ple
x th
an
TSS
and
NTS
S
can
be
ver
y co
mp
lex
for
larg
e m
oti
on
Ad
van
tage
bes
t p
ictu
re
qu
alit
y
for
fixe
d w
ind
ow
siz
e
and
as
sum
ing
no
lo
cal
min
imu
m
ph
en
om
eno
n
hie
rarc
hic
al
com
pu
tati
on
in
crea
se
pic
ture
qu
alit
y
less
co
mp
lex
than
ES,
reco
mm
end
ed
in
MP
EG-2
bet
ter
qu
alit
y th
an
TSS
mo
re
effi
cien
t th
an
TSS,
CD
S an
d 4
SS i
n
term
o
f co
mp
lexi
ty
and
qu
alit
y es
pec
ially
for
smal
l mo
tio
n
red
uce
d
init
ial
step
si
ze,
he
nce
in
crea
sed
effi
cien
cy
for
smal
l
mo
tio
n
wo
rks
wel
l in
sear
chin
g sm
all
mo
tio
n
Co
mp
lexi
ty
(p p
ixel
sea
rch
ing
dis
tan
ce)
Ave
rage
se
arch
po
ints
(
pix
els
blo
ck)
Vis
ual
qu
alit
y (M
SE)
Smal
l mo
tio
n
con
ten
t
No
t
avai
lab
le
Me
diu
m t
o
hig
h m
oti
on
con
ten
t
No
t av
aila
ble
ES
Exh
aust
ive
se
arch
(a.k
.a. F
S –
Full
Sear
ch)
[Ku
a99
]
FS-M
PEG
wit
h n
iter
atio
ns
[Sta
08
]
TSS
Thre
e S
tep
Se
arch
(a.k
.a. 3
SS)
[Ko
g81
]
CD
S
(Co
nju
gate
Dir
ect
ion
al
Sear
ch)
[Sri
85
]
NTS
S
[Li 9
4]
4SS
Fo
ur
Ste
p S
ear
ch
[Jai
81
]
DS
Dia
mo
nd
Se
arch
[Zh
u0
0]
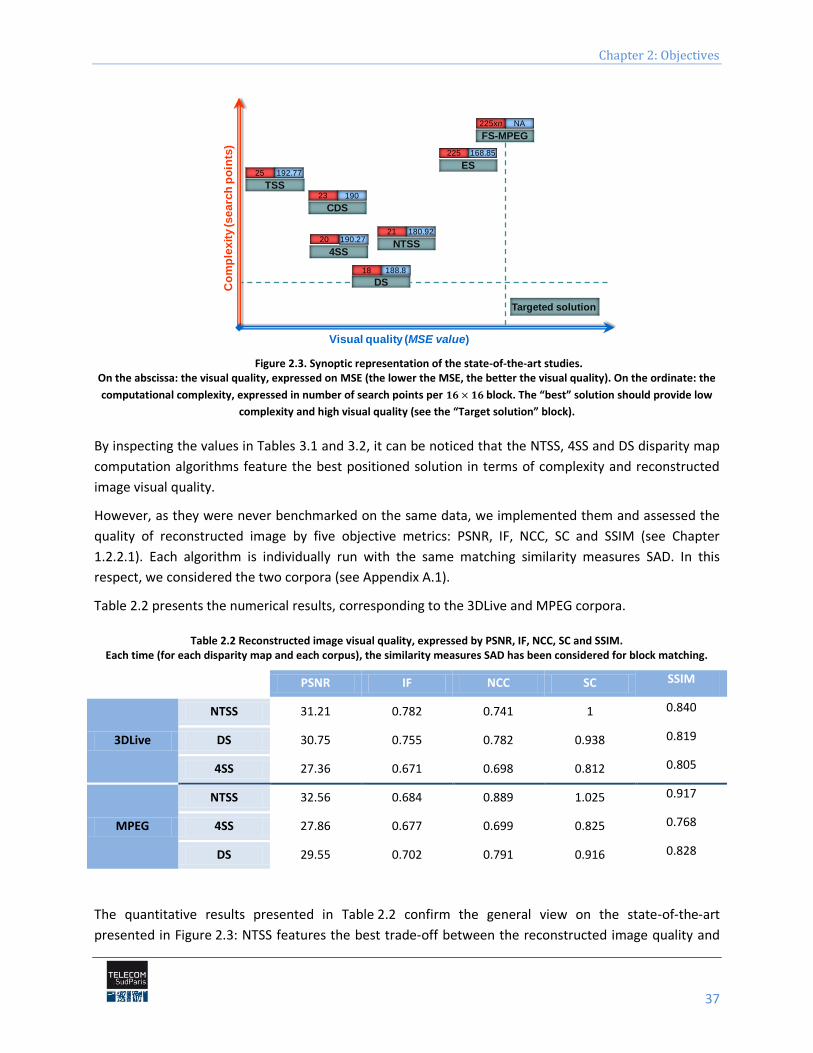
Chapter 2: Objectives
37
Figure 2.3. Synoptic representation of the state-of-the-art studies.
On the abscissa: the visual quality, expressed on MSE (the lower the MSE, the better the visual quality). On the ordinate: the
computational complexity, expressed in number of search points per block. The “best” solution should provide low
complexity and high visual quality (see the “Target solution” block).
By inspecting the values in Tables 3.1 and 3.2, it can be noticed that the NTSS, 4SS and DS disparity map
computation algorithms feature the best positioned solution in terms of complexity and reconstructed
image visual quality.
However, as they were never benchmarked on the same data, we implemented them and assessed the
quality of reconstructed image by five objective metrics: PSNR, IF, NCC, SC and SSIM (see Chapter
1.2.2.1). Each algorithm is individually run with the same matching similarity measures SAD. In this
respect, we considered the two corpora (see Appendix A.1).
Table 2.2 presents the numerical results, corresponding to the 3DLive and MPEG corpora.
Table 2.2 Reconstructed image visual quality, expressed by PSNR, IF, NCC, SC and SSIM. Each time (for each disparity map and each corpus), the similarity measures SAD has been considered for block matching.
PSNR IF NCC SC SSIM
3DLive
NTSS 31.21 0.782 0.741 1 0.840
DS 30.75 0.755 0.782 0.938 0.819
4SS 27.36 0.671 0.698 0.812 0.805
MPEG
NTSS 32.56 0.684 0.889 1.025 0.917
4SS 27.86 0.677 0.699 0.825 0.768
DS 29.55 0.702 0.791 0.916 0.828
The quantitative results presented in Table 2.2 confirm the general view on the state-of-the-art
presented in Figure 2.3: NTSS features the best trade-off between the reconstructed image quality and
ES
Visual quality (MSE value)
Co
mp
lex
ity (s
earc
h p
oin
ts)
FS-MPEG
CDS
4SS
TSS
NTSS
DS
23 190
225 168.85
225xn NA
21 180.92
18 188.8
20 190.27
25 192.77
Targeted solution
A.Chammem, Robust watermarking techniques for stereoscopic content protection
38
the computational complexity among the fast algorithms and can be considered together with the FS-
MPEG as comparative basis in our work.
2.1.3. Conclusion
The state-of-the-art approaches presented in the previous section can be suboptimal when computing
the disparity map for live 3D HD television. First, the disparities between the left and the right views are
predominant on the horizontal direction (where the very depth information is conveyed) while the
vertical disparities, although non-zero, are mainly connected with the video shooting errors (the so-
called rig errors). Secondly, basic metrics like MSE or SAD are unrelated to the human visual system and
would a priori lack in achieving visually good block matching. Finally, note that none of the experiments
reported in the above-mentioned studies considered HD stereoscopic image databases.
The present work takes the challenge of designing a new disparity map so as to reach the trade-off
between visual quality and computational complexity when processing HD 3D TV (high definition
stereoscopic television) content [3Dl12], see “Targeted solution” in Figure 2.3.
2.2. Watermarking embedding techniques
The basic watermarking theoretical model (see Chapter 1.2.4) points at two main directions in
watermarking: spread spectrum (SS) [Cox97] [Cox02] and side information (SI) [Cox02] [Cos83]. The
former considers the original content as a random noise source and maximizes the quantity of inserted
data under joint constraints of noise (original content and malicious attacks) and inserted signal power.
The latter considers the original content as a noise source known at the embedder [Sha58] and
maximizes the quantity of inserted data accordingly.
2.2.1. Principles
Spread spectrum
The SS methods have already been used in telecommunication applications (e.g. CDMA) and provided a
good solution for very low power signal transmission over noisy channels [Cox97] [Cox02]. Their principle
consists in spreading the signal over a very large band (e.g. 100 to 10000 times larger than the signal
band), thus inserting a very low power signal in any frequency sub-band. Figure 2.4.a illustrates a simple
spread spectrum watermarking system.
The spread spectrum communications have two major benefits. First, the signal energy inserted into any
frequency sub-band is very small, thus reducing the signal-to-noise ratio and the risk of perceptible
artifacts. Secondly, the redundant watermark spreading over such a large band of frequencies provides
robustness to many common signal distortions such as band-pass filter or addition of band-limited noise
[Cox97].
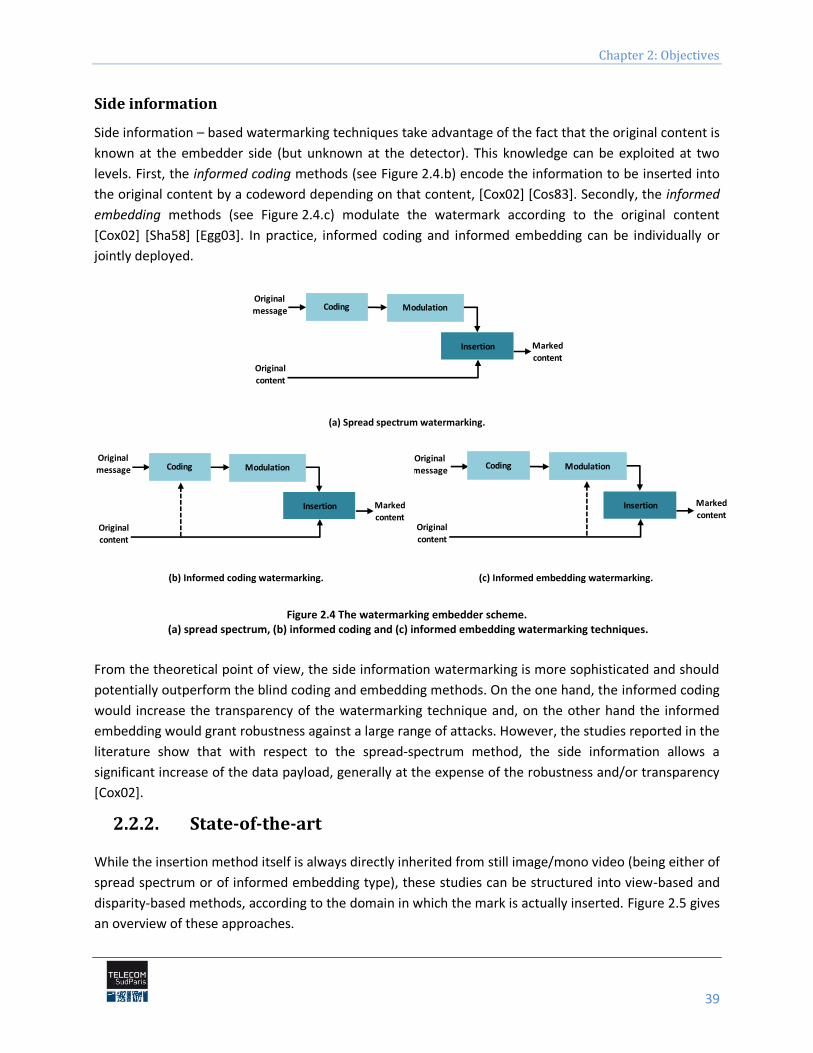
Chapter 2: Objectives
39
Side information
Side information – based watermarking techniques take advantage of the fact that the original content is
known at the embedder side (but unknown at the detector). This knowledge can be exploited at two
levels. First, the informed coding methods (see Figure 2.4.b) encode the information to be inserted into
the original content by a codeword depending on that content, [Cox02] [Cos83]. Secondly, the informed
embedding methods (see Figure 2.4.c) modulate the watermark according to the original content
[Cox02] [Sha58] [Egg03]. In practice, informed coding and informed embedding can be individually or
jointly deployed.
(a) Spread spectrum watermarking.
(b) Informed coding watermarking. (c) Informed embedding watermarking.
Figure 2.4 The watermarking embedder scheme. (a) spread spectrum, (b) informed coding and (c) informed embedding watermarking techniques.
From the theoretical point of view, the side information watermarking is more sophisticated and should
potentially outperform the blind coding and embedding methods. On the one hand, the informed coding
would increase the transparency of the watermarking technique and, on the other hand the informed
embedding would grant robustness against a large range of attacks. However, the studies reported in the
literature show that with respect to the spread-spectrum method, the side information allows a
significant increase of the data payload, generally at the expense of the robustness and/or transparency
[Cox02].
2.2.2. State-of-the-art
While the insertion method itself is always directly inherited from still image/mono video (being either of
spread spectrum or of informed embedding type), these studies can be structured into view-based and
disparity-based methods, according to the domain in which the mark is actually inserted. Figure 2.5 gives
an overview of these approaches.
Original
content
Original message ModulationCoding
Insertion Marked
content
Original content
Original
message ModulationCoding
Insertion Marked
contentOriginal
content
Original message ModulationCoding
Insertion Markedcontent
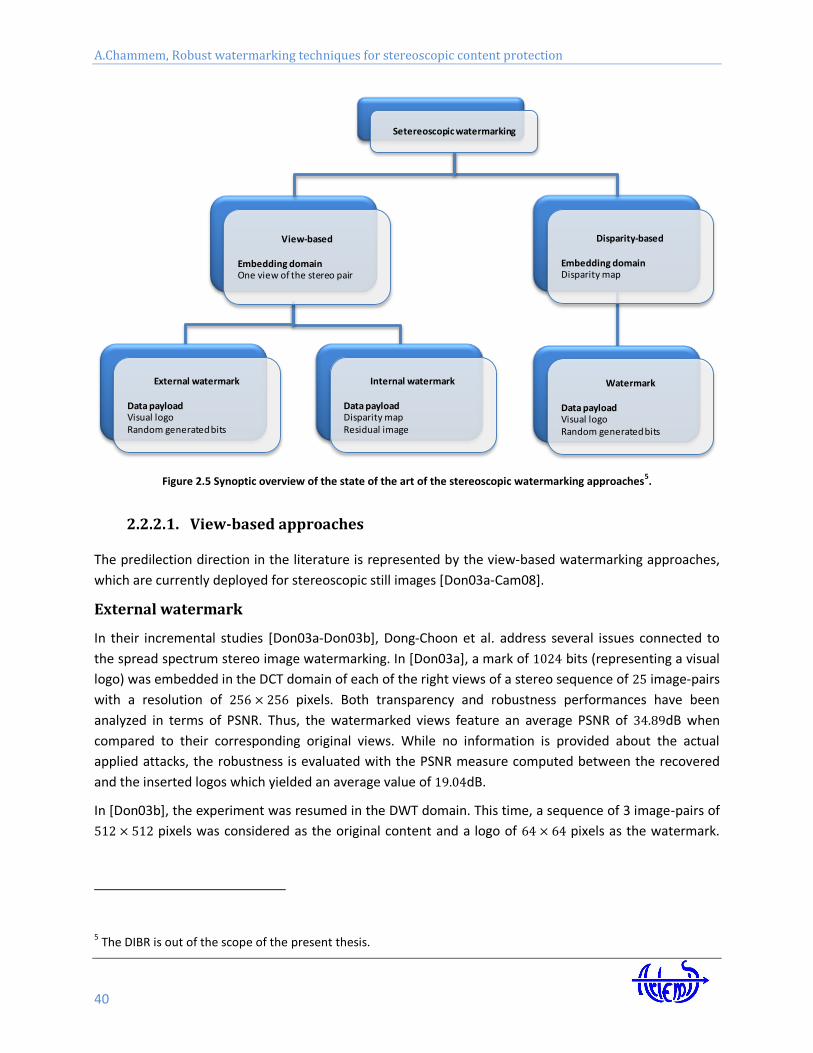
A.Chammem, Robust watermarking techniques for stereoscopic content protection
40
Figure 2.5 Synoptic overview of the state of the art of the stereoscopic watermarking approaches5.
2.2.2.1. View-based approaches
The predilection direction in the literature is represented by the view-based watermarking approaches,
which are currently deployed for stereoscopic still images [Don03a-Cam08].
External watermark
In their incremental studies [Don03a-Don03b], Dong-Choon et al. address several issues connected to
the spread spectrum stereo image watermarking. In [Don03a], a mark of bits (representing a visual
logo) was embedded in the DCT domain of each of the right views of a stereo sequence of image-pairs
with a resolution of pixels. Both transparency and robustness performances have been
analyzed in terms of PSNR. Thus, the watermarked views feature an average PSNR of dB when
compared to their corresponding original views. While no information is provided about the actual
applied attacks, the robustness is evaluated with the PSNR measure computed between the recovered
and the inserted logos which yielded an average value of dB.
In [Don03b], the experiment was resumed in the DWT domain. This time, a sequence of 3 image-pairs of
pixels was considered as the original content and a logo of pixels as the watermark.
5 The DIBR is out of the scope of the present thesis.
Setereoscopic watermarking
Disparity-based
Embedding domainDisparity map
View-based
Embedding domainOne view of the stereo pair
Internal watermark
Data payloadDisparity mapResidual image
External watermark
Data payloadVisual logoRandom generated bits
Watermark
Data payloadVisual logoRandom generated bits
Chapter 2: Objectives
41
While the average transparency was increased by dB (reaching now the limit of dB), the
robustness was decreased by dB (i.e. lowered at dB).
Campisi [Cam08] advances a semi-fragile stereo watermarking approach based on the Quantization
Index Modulation-QIM insertion method performed in the DWT domain. The embedding scheme relies
on the use of the depth information, extracted from the stereo pair, to determine the region where the
watermark will be embedded. The depth information is extracted from the low pass-subband (LL) of the
selected DWT decomposition level. The watermark payload is bits per frame and is embedded in
the high level subbands (HL, LH and HH) of the wavelet decomposition. Experiments show that the
advanced method is robust to JPEG and JPEG2000 compression and fragile with respect to other signal
manipulations (like Row/Colum removal and small rotations). The fragility property was assessed by
computing the values of BER (bit error rate); the following numerical values are obtained: after
Gaussian filtering, after median filtering, after row/column removal, after a degree
rotation and after degree rotation. No information concerning the transparency property or the
experimental database is provided.
The study advanced by Yu et al. [Yu11] embeds the watermark into both the left and the right views of
the stereo pair, by taking into account some intra and inter-blocks statistical relationships established by
combining the DWT and DCT. A parity quantization is also designed for handling the cases in which such
a relationship does not hold. During the experiments, a binary logo of pixels is embedded in a
stereo frame of pixels. The transparency is evaluated by the PSNR value between the original
and the watermarked images; values of dB and dB are obtained for the left and the right
views, respectively. The robustness was evaluated in terms of the Watermark Recovering Rates (WRR)
(referred to as HC in the [Yu11]) given by: , where is exclusive-OR,
denotes the original binary watermark of size, and denotes the recovered watermark. Values of
of , , and are obtained after applying a JPEG compression, a salt and pepper noise,
a median filtering, and a cropping, respectively. Note that .
In Ntalianis et al.’s study [Nta02], a grayscale image of pixels is redundantly embedded in the
coefficients of the highest energy of the video objects. Initially, the video objects are extracted using a
segmentation process based on a depth segments map, and then are decomposed into three levels using
the 2D-DWT. Later on, a Qualified Significant Wavelet Tree (QSWT) is constructed, including the highest
energy coefficient given by the 2D-DWT. Once the QSWTs of the video sequence objects are created, the
watermark of size is repeatedly embedded in the top of the QSWTs. The embedding process
is spread spectrum based. The performances of the watermarking system are assessed in terms of
imperceptibility and robustness. The obtained PSNR value of the watermarked video object is dB.
The robustness has been investigated under five different types of attacks: salt & pepper noise, Gaussian
noise, blurring, sharpening and JPEG lossy compression. The obtained PSNR values of the recovered
watermark are of , and dB, respectively.
Internal watermark
In this category of view-based stereo watermarking methods, the disparity map is used as a watermark
and embedded in one view of the stereo pair. Two major contributions are discussed in the sequel.
A.Chammem, Robust watermarking techniques for stereoscopic content protection
42
Kumar et al [Kum09] also considered a spread spectrum based watermarking method. The disparity map
is first estimated in the DWT domain and then embedded as a mark in the left view. The embedding
procedure is optimized by a genetic algorithm and takes place in the singular value decomposition (SVD)
domain of the left DWT image. Before the insertion process, the image undergoes an Arnold Transform.
A genetic algorithm is used to estimate the optimal order of the Arnold Transform and the watermark’s
strength. The experiments have been performed on five gray level stereo images with a resolution of
pixels. The watermark image is one fourth of the host image. The obtained transparency was
expressed by a PSNR of dB. The robustness against average filtering, rotations, resizing and
Gaussian noise addition was assessed by computing the normalized cross correlation (NCC) value
between the original and the extracted watermarks, namely , , and , respectively.
In Bhatnager et al.’s study [Bha09], the watermark is represented by the disparity map, computed this
time directly in the pixel domain. This disparity map is further inserted by a SS technique applied in the
SVD domain of the Discrete Fractional Fourier Transform (DFrFT) of the left image. Before the insertion
procedure, the watermark’s strength parameter was defined according to an iterative experimental
process. The selection is achieved between different values going from to with a step size of
. A Performance Index (PI) is calculated to define the appropriate value. PI is based on the PSNR
value computed between the original and the watermarked image and the NCC between the original and
recovered watermark.
The experimental validation considered a corpus of three stereo images (two image pairs of
pixels and one image pair of pixels). The transparency evaluation shows an average PSNR of
dB. This excellent value is obtained at the expense of the robustness which is now reduced at NCC
(between the original and the extracted watermark) values of , , , , , and for
the average filtering, median filtering, resizing, JPEG compression, cropping, rotation and additive noise
attacks, respectively.
A particular case of the internal watermarking is represented by the reversible watermarking. Actually,
reversible watermarking is rather a compression technique than a copyright protection tool. Its aim is to
reduce the bandwidth consumption when transmitting/storing stereoscopic video content. In this
respect, one of the two views is kept as reference and the difference with respect to the second view are
inserted as a watermark. From the applicative point of view, such an approach strengthens the data
payload requirements while completely relaxing the robustness constraints (compression is the only
investigated attack).
In his study, Coltuc [Col07] embeds the compressed normalized residual in the left view. The
watermarking scheme starts by partitioning the image into pairs of pixels, where the watermark will be
inserted by a simple addition. The experimental test considered two images and measured the
robustness against JPEG compression. The PSNR of the recovered images are of dB and dB,
respectively. The bit rate needed to embed the lossy compressed residual image is bpp (bit per
pixel) for an image of pixels. According to the obtained value of PSNR and the considered
image content, it has been proven that, the less complex textured the image, the better the quality of
the recovered image versus the compression ratio.
Chapter 2: Objectives
43
Ellinas 2009 [Ell09] embeds the normalized compressed residual frame and the disparity vector in the
left view of the stereo pair. The considered embedding algorithm is Pixel Value Difference (PVD), which
partitions the reference frame (the left view in this study) into blocks of two consecutive non-overlapped
pixels according to a scan order. Then, it embeds the watermark in each pair of pixels. The experimental
validation considered a corpus of two stereoscopic image sequences of images each, with a resolution
of pixels. The algorithm performances are evaluated in terms of PSNR average values of the
watermarked frames given by the PSNRw and the recovered right frames PSNRr. The obtained values are
of dB and dB, respectively. The average embedding capacity is evaluated for the test sequences at
bits. However, the actual data payload accounts for bits.
Chen et al.[Che12] embed the compressed residual error image and the compressed disparity vector
field into the right frame. The stereo image is then coded as a watermarked 2D image and transmitted to
the receiver. Two stereo images are used to evaluate the performance of the suggested scheme, with a
size of and pixels. Their maximum embedding capacities are of bpp and
bpp respectively. The obtained average PSNR for the watermarked right frame is dB and for
the reconstructed left frame is dB.
2.2.2.2. Disparity-based approach
The disparity-based stereoscopic watermarking schemes can be represented by the study reported in
[Zen07]. The insertion technique combines spread spectrum principles and Low Density Parity Check
(LDPC) error correcting codes. The experiments are performed on four video sequences: three of them
are composed of stereo frames of pixels while the forth one has frames of
pixels. The transparency is assessed by computing the average image degradation index . This
index is defined by , where and denote the average PSNRs of the non-watermarked and
watermarked video images respectively (no details are provided on how the non-watermarked sequence
average PSNR is computed). The robustness is assessed in terms of the Watermark Detection Ratio
(WDR), evaluated for each video and defined by: , where and are the numbers
of and of the original watermark respectively, while and are the numbers of the extracted
and from the recovered watermark, respectively. The reported WDR values are larger than
after recoding and after both recoding and noise addition.
2.2.3. Discussion
Table 2.3 and Figure 2.6 present a general view on these various approaches. When considering them for
real life applications (e.g. HD 3D TV real time content protection) the following main limitations can be
identified:
the structure and the size of the processed corpora are too small to ensure generality and
statistical relevance for the results;
the selection of the insertion domain was rather the experimenter’s choice than the result of an
objective study;
A.Chammem, Robust watermarking techniques for stereoscopic content protection
44
the transparency evaluation was solely guided by the PSNR values; no other objective
transparency method nor subjective evaluation are reported;
the robustness against geometric attacks is not yet achieved;
the computational cost was never investigated.
The present study addresses these above-mentioned issues:
all the results consider two corpora, further referred to as 3DLive [3Dl12] and MPEG [Hoi11];
a new 3D video disparity map is considered and its watermarking usefulness is objectively
investigated in terms of transparency, robustness and computational cost;
the transparency evaluation is carried out on both subjective and objective basis;
the robustness is objectively expressed by means of the watermarked detection BER against
several classes of attacks, such as linear and non-linear filtering, compression and geometric
transformations;
the computational cost is estimated for each and every processing step involved in the
watermarking chain.
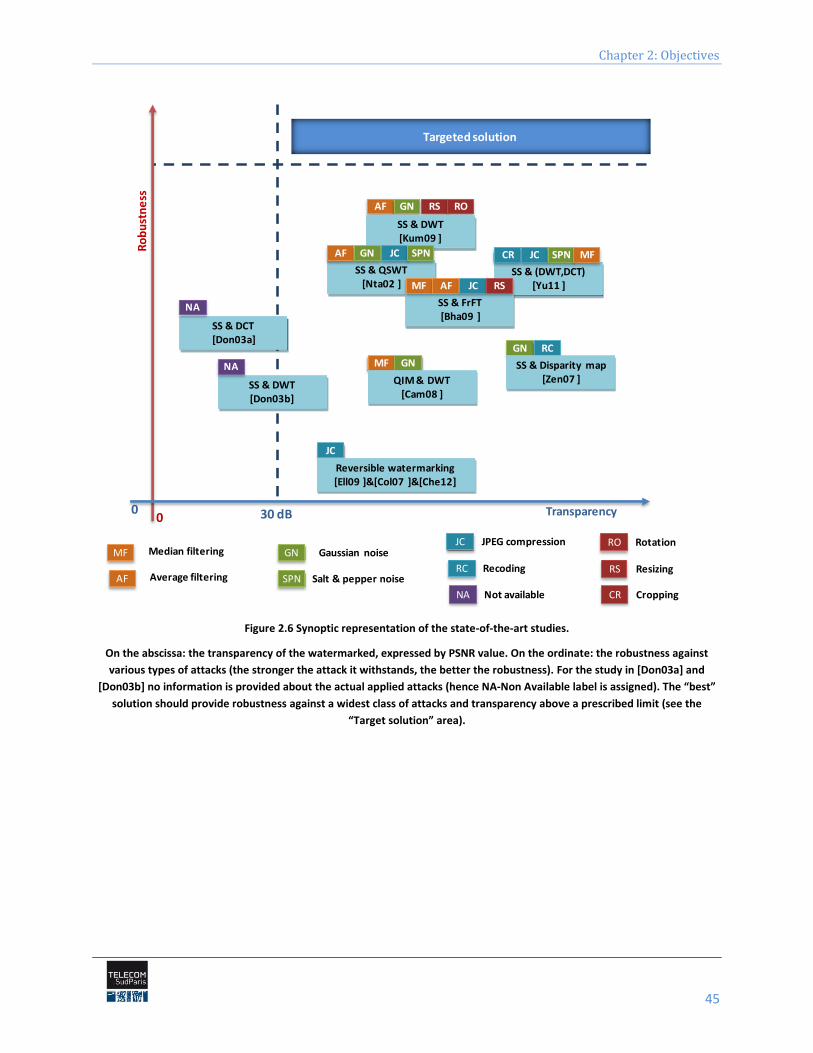
Chapter 2: Objectives
45
Figure 2.6 Synoptic representation of the state-of-the-art studies.
On the abscissa: the transparency of the watermarked, expressed by PSNR value. On the ordinate: the robustness against
various types of attacks (the stronger the attack it withstands, the better the robustness). For the study in [Don03a] and
[Don03b] no information is provided about the actual applied attacks (hence NA-Non Available label is assigned). The “best”
solution should provide robustness against a widest class of attacks and transparency above a prescribed limit (see the
“Target solution” area).
Transparency
MF Median filtering GN Gaussian noise
SPN Salt & pepper noise
JC JPEG compression
RC RecodingAverage filteringAF
RS Resizing
CR Cropping
RO Rotation
0
Targeted solution R
ob
ust
ne
ss
0
SS & DCT[Don03a]
AF GN RS RO
SS & DWT[Kum09 ]
SS & DWT[Don03b]
SS & (DWT,DCT) [Yu11 ]
CR JC SPN MF
GN RC
SS & Disparity map[Zen07 ]
MF GN
QIM & DWT[Cam08 ]
30 dB
JC
Reversible watermarking[Ell09 ]&[Col07 ]&[Che12]
SS & QSWT[Nta02 ]
AF GN JC SPN
SS & FrFT[Bha09 ]
MF AF JC RS
NA Not available
NA
NA
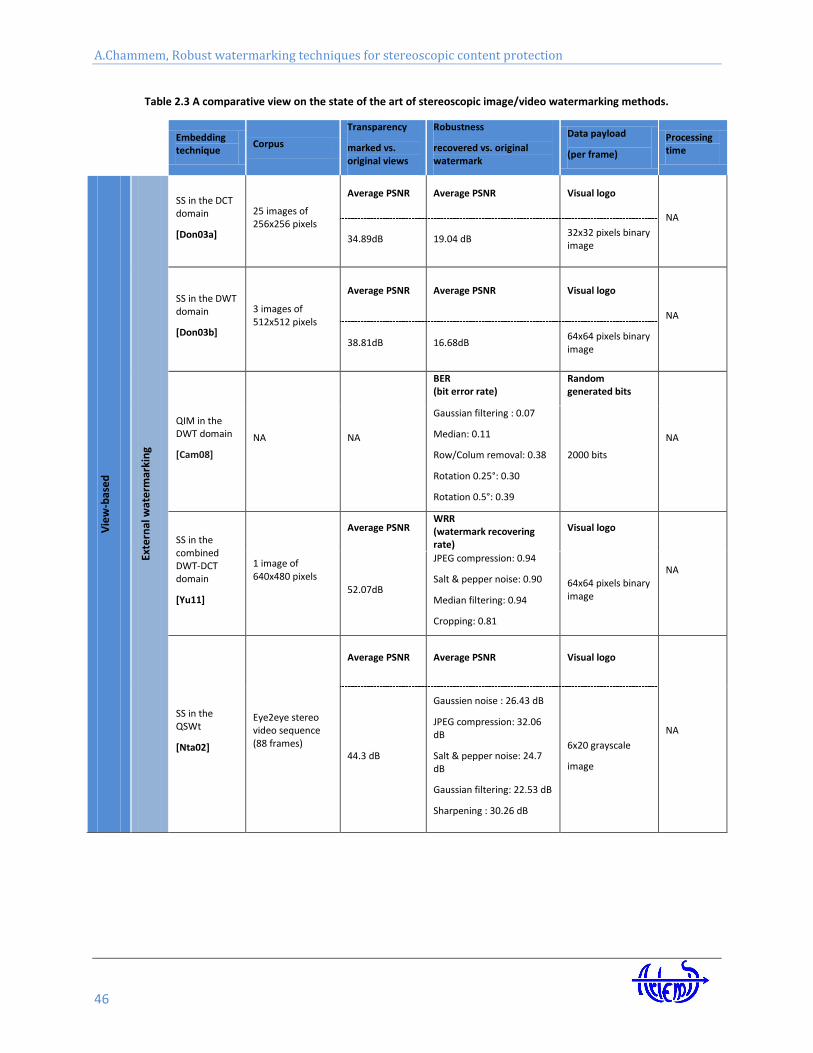
A.Chammem, Robust watermarking techniques for stereoscopic content protection
46
Table 2.3 A comparative view on the state of the art of stereoscopic image/video watermarking methods.
Embedding technique
Corpus
Transparency
marked vs. original views
Robustness
recovered vs. original watermark
Data payload
(per frame)
Processing time
Vie
w-b
ase
d
Exte
rnal
wat
erm
arki
ng
SS in the DCT domain
[Don03a]
25 images of 256x256 pixels
Average PSNR Average PSNR Visual logo
NA
34.89dB 19.04 dB 32x32 pixels binary image
SS in the DWT domain
[Don03b]
3 images of 512x512 pixels
Average PSNR Average PSNR Visual logo
NA
38.81dB 16.68dB 64x64 pixels binary image
QIM in the DWT domain
[Cam08]
NA NA
BER (bit error rate)
Random generated bits
NA
Gaussian filtering : 0.07
Median: 0.11
Row/Colum removal: 0.38
Rotation 0.25°: 0.30
Rotation 0.5°: 0.39
2000 bits
SS in the combined DWT-DCT domain
[Yu11]
1 image of 640x480 pixels
Average PSNR WRR (watermark recovering rate)
Visual logo
NA
52.07dB
JPEG compression: 0.94
Salt & pepper noise: 0.90
Median filtering: 0.94
Cropping: 0.81
64x64 pixels binary image
SS in the QSWt
[Nta02]
Eye2eye stereo video sequence (88 frames)
Average PSNR Average PSNR Visual logo
NA
44.3 dB
Gaussien noise : 26.43 dB
JPEG compression: 32.06 dB
Salt & pepper noise: 24.7 dB
Gaussian filtering: 22.53 dB
Sharpening : 30.26 dB
6x20 grayscale
image
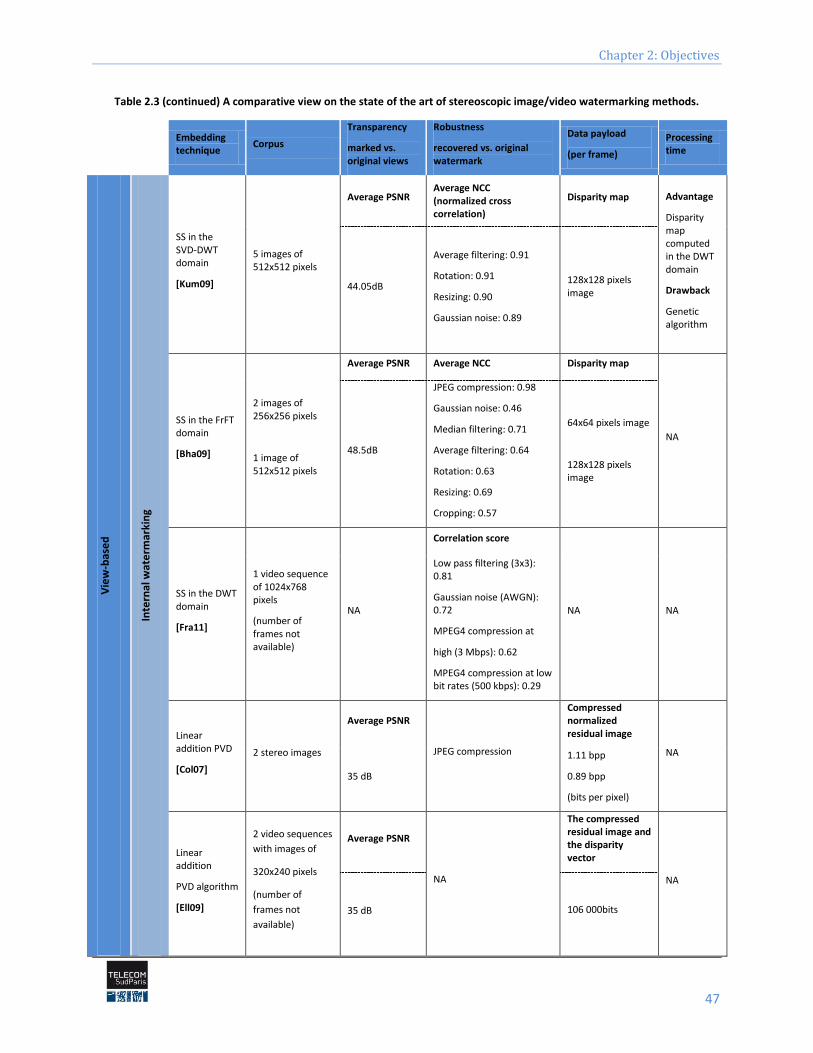
Chapter 2: Objectives
47
Table 2.3 (continued) A comparative view on the state of the art of stereoscopic image/video watermarking methods.
Embedding technique
Corpus
Transparency
marked vs. original views
Robustness
recovered vs. original watermark
Data payload
(per frame)
Processing time
Vie
w-b
ase
d
Inte
rnal
wat
erm
arki
ng
SS in the SVD-DWT domain
[Kum09]
5 images of 512x512 pixels
Average PSNR Average NCC (normalized cross correlation)
Disparity map Advantage
Disparity map computed in the DWT domain
Drawback
Genetic algorithm
44.05dB
Average filtering: 0.91
Rotation: 0.91
Resizing: 0.90
Gaussian noise: 0.89
128x128 pixels image
SS in the FrFT domain
[Bha09]
2 images of 256x256 pixels
1 image of 512x512 pixels
Average PSNR Average NCC Disparity map
NA 48.5dB
JPEG compression: 0.98
Gaussian noise: 0.46
Median filtering: 0.71
Average filtering: 0.64
Rotation: 0.63
Resizing: 0.69
Cropping: 0.57
64x64 pixels image
128x128 pixels image
SS in the DWT domain
[Fra11]
1 video sequence of 1024x768 pixels
(number of frames not available)
NA
Correlation score
NA NA
Low pass filtering (3x3): 0.81
Gaussian noise (AWGN): 0.72
MPEG4 compression at
high (3 Mbps): 0.62
MPEG4 compression at low bit rates (500 kbps): 0.29
Linear addition PVD
[Col07]
2 stereo images
Average PSNR
JPEG compression
Compressed normalized residual image
NA
35 dB
1.11 bpp
0.89 bpp
(bits per pixel)
Linear addition
PVD algorithm
[Ell09]
2 video sequences
with images of
320x240 pixels
(number of
frames not
available)
Average PSNR
NA
The compressed residual image and the disparity vector
NA
35 dB 106 000bits
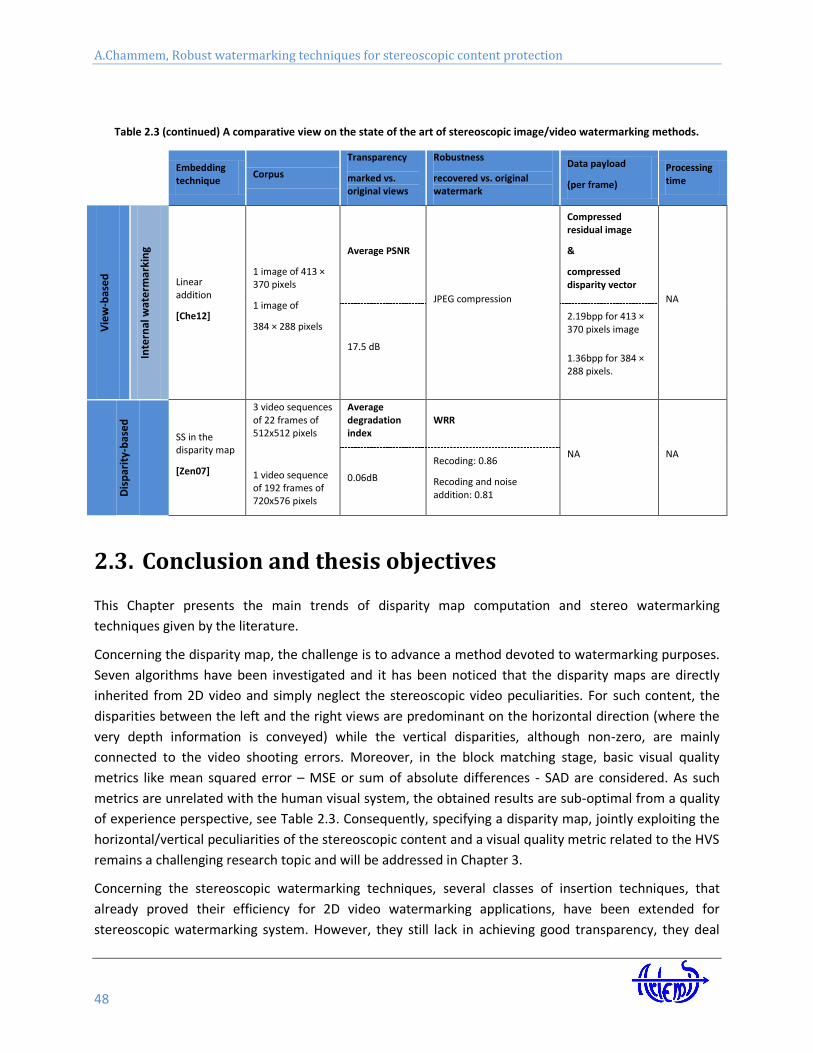
A.Chammem, Robust watermarking techniques for stereoscopic content protection
48
Table 2.3 (continued) A comparative view on the state of the art of stereoscopic image/video watermarking methods.
Embedding technique
Corpus
Transparency
marked vs. original views
Robustness
recovered vs. original watermark
Data payload
(per frame)
Processing time
Vie
w-b
ase
d
Inte
rnal
wat
erm
arki
ng
Linear addition
[Che12]
1 image of 413 × 370 pixels
1 image of
384 × 288 pixels
Average PSNR
JPEG compression
Compressed residual image
&
compressed disparity vector
NA
17.5 dB
2.19bpp for 413 × 370 pixels image
1.36bpp for 384 × 288 pixels.
Dis
par
ity-
bas
ed
SS in the disparity map
[Zen07]
3 video sequences of 22 frames of 512x512 pixels
1 video sequence of 192 frames of 720x576 pixels
Average degradation index
WRR
NA NA
0.06dB
Recoding: 0.86
Recoding and noise addition: 0.81
2.3. Conclusion and thesis objectives
This Chapter presents the main trends of disparity map computation and stereo watermarking
techniques given by the literature.
Concerning the disparity map, the challenge is to advance a method devoted to watermarking purposes.
Seven algorithms have been investigated and it has been noticed that the disparity maps are directly
inherited from 2D video and simply neglect the stereoscopic video peculiarities. For such content, the
disparities between the left and the right views are predominant on the horizontal direction (where the
very depth information is conveyed) while the vertical disparities, although non-zero, are mainly
connected to the video shooting errors. Moreover, in the block matching stage, basic visual quality
metrics like mean squared error – MSE or sum of absolute differences - SAD are considered. As such
metrics are unrelated with the human visual system, the obtained results are sub-optimal from a quality
of experience perspective, see Table 2.3. Consequently, specifying a disparity map, jointly exploiting the
horizontal/vertical peculiarities of the stereoscopic content and a visual quality metric related to the HVS
remains a challenging research topic and will be addressed in Chapter 3.
Concerning the stereoscopic watermarking techniques, several classes of insertion techniques, that
already proved their efficiency for 2D video watermarking applications, have been extended for
stereoscopic watermarking system. However, they still lack in achieving good transparency, they deal
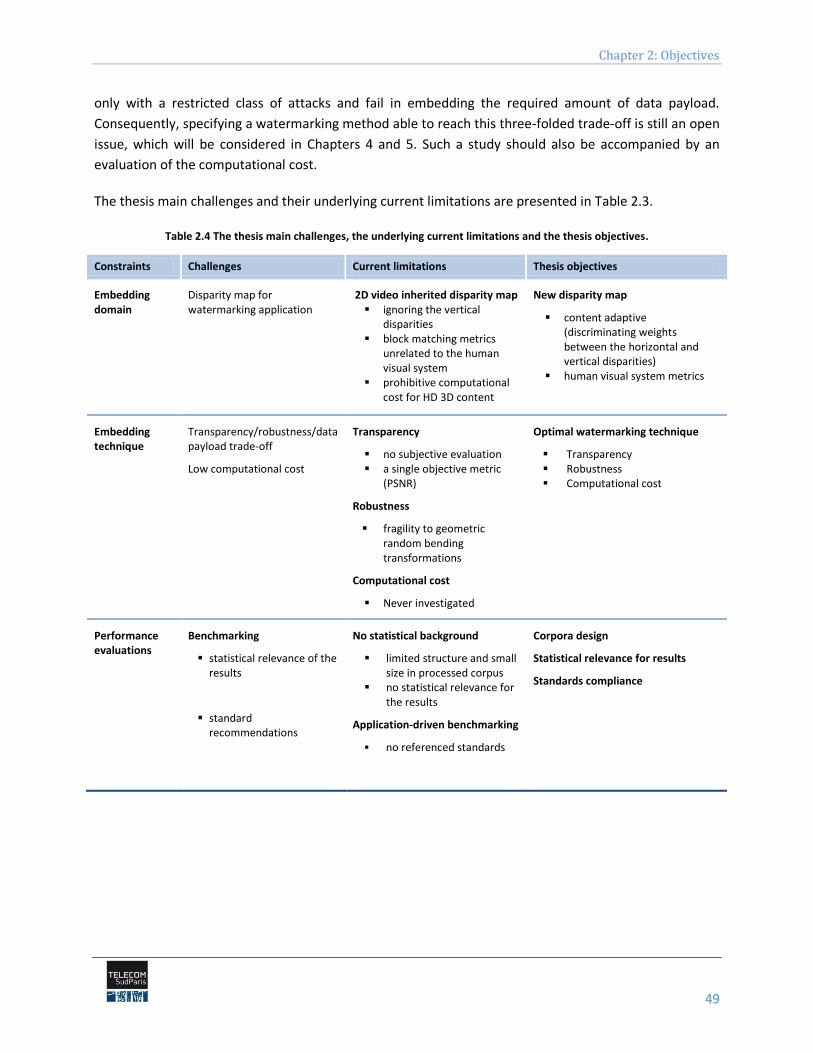
Chapter 2: Objectives
49
only with a restricted class of attacks and fail in embedding the required amount of data payload.
Consequently, specifying a watermarking method able to reach this three-folded trade-off is still an open
issue, which will be considered in Chapters 4 and 5. Such a study should also be accompanied by an
evaluation of the computational cost.
The thesis main challenges and their underlying current limitations are presented in Table 2.3.
Table 2.4 The thesis main challenges, the underlying current limitations and the thesis objectives.
Constraints Challenges Current limitations Thesis objectives
Embedding domain
Disparity map for watermarking application
2D video inherited disparity map ignoring the vertical
disparities block matching metrics
unrelated to the human visual system
prohibitive computational cost for HD 3D content
New disparity map
content adaptive (discriminating weights between the horizontal and vertical disparities)
human visual system metrics
Embedding technique
Transparency/robustness/data payload trade-off
Low computational cost
Transparency
no subjective evaluation a single objective metric
(PSNR)
Robustness
fragility to geometric random bending transformations
Computational cost
Never investigated
Optimal watermarking technique
Transparency Robustness Computational cost
Performance evaluations
Benchmarking
statistical relevance of the results
standard recommendations
No statistical background
limited structure and small size in processed corpus
no statistical relevance for the results
Application-driven benchmarking
no referenced standards
Corpora design
Statistical relevance for results
Standards compliance


Chapter 3 A new insertion domain: 3D Video-New Three Step Search
A.Chammem, Robust watermarking techniques for stereoscopic content protection
52
Abstract
This Chapter presents the newly designed disparity map (the 3D video-New Three Step Search - 3DV-
NTSS). 3DV-NTSS reconsiders some 2D video inherited approaches and adapts them to the stereoscopic
video content and to the human visual system peculiarities. The inner relation between the left and the
right views is modeled by some weights discriminating between the horizontal and vertical disparities.
First, the Chapter introduces the advanced disparity map. Second, it describes the experimental
validations and demonstrate the 3DV-NTSS effectiveness in both reconstructed image quality (average
gains between 3% and 7% in both PSNR and SSIM) and computational cost (search operation number
reduced by average factors between 1.3 and 13).
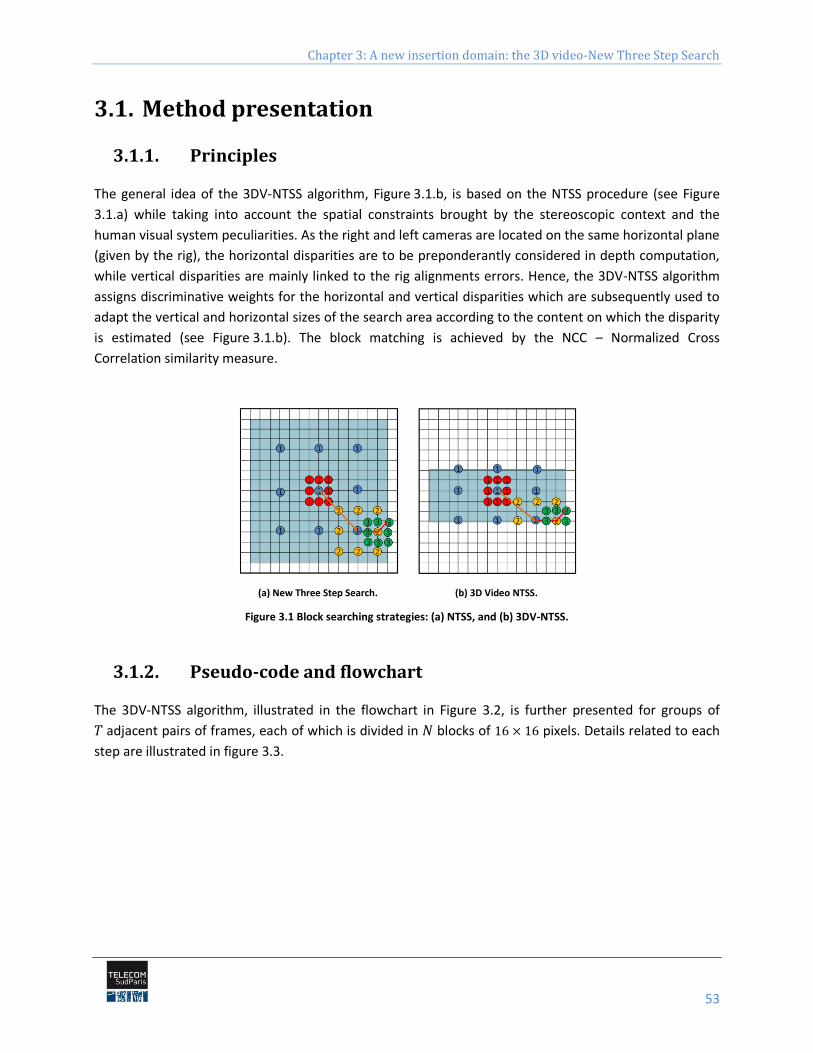
Chapter 3: A new insertion domain: the 3D video-New Three Step Search
53
3.1. Method presentation
3.1.1. Principles
The general idea of the 3DV-NTSS algorithm, Figure 3.1.b, is based on the NTSS procedure (see Figure
3.1.a) while taking into account the spatial constraints brought by the stereoscopic context and the
human visual system peculiarities. As the right and left cameras are located on the same horizontal plane
(given by the rig), the horizontal disparities are to be preponderantly considered in depth computation,
while vertical disparities are mainly linked to the rig alignments errors. Hence, the 3DV-NTSS algorithm
assigns discriminative weights for the horizontal and vertical disparities which are subsequently used to
adapt the vertical and horizontal sizes of the search area according to the content on which the disparity
is estimated (see Figure 3.1.b). The block matching is achieved by the NCC – Normalized Cross
Correlation similarity measure.
(a) New Three Step Search. (b) 3D Video NTSS.
Figure 3.1 Block searching strategies: (a) NTSS, and (b) 3DV-NTSS.
3.1.2. Pseudo-code and flowchart
The 3DV-NTSS algorithm, illustrated in the flowchart in Figure 3.2, is further presented for groups of
adjacent pairs of frames, each of which is divided in blocks of pixels. Details related to each
step are illustrated in figure 3.3.
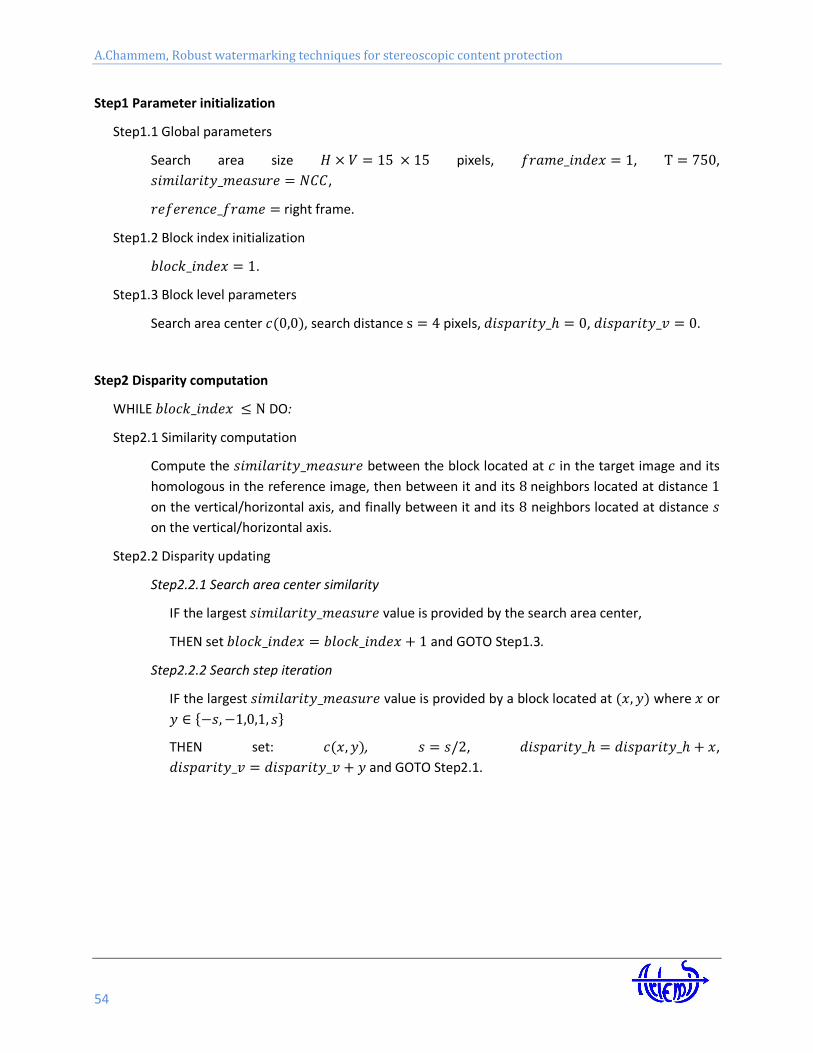
A.Chammem, Robust watermarking techniques for stereoscopic content protection
54
Step1 Parameter initialization
Step1.1 Global parameters
Search area size pixels, , ,
,
right frame.
Step1.2 Block index initialization
.
Step1.3 Block level parameters
Search area center , search distance pixels, , .
Step2 Disparity computation
WHILE DO:
Step2.1 Similarity computation
Compute the between the block located at in the target image and its
homologous in the reference image, then between it and its neighbors located at distance
on the vertical/horizontal axis, and finally between it and its neighbors located at distance
on the vertical/horizontal axis.
Step2.2 Disparity updating
Step2.2.1 Search area center similarity
IF the largest value is provided by the search area center,
THEN set and GOTO Step1.3.
Step2.2.2 Search step iteration
IF the largest value is provided by a block located at where or
THEN set: , , ,
and GOTO Step2.1.
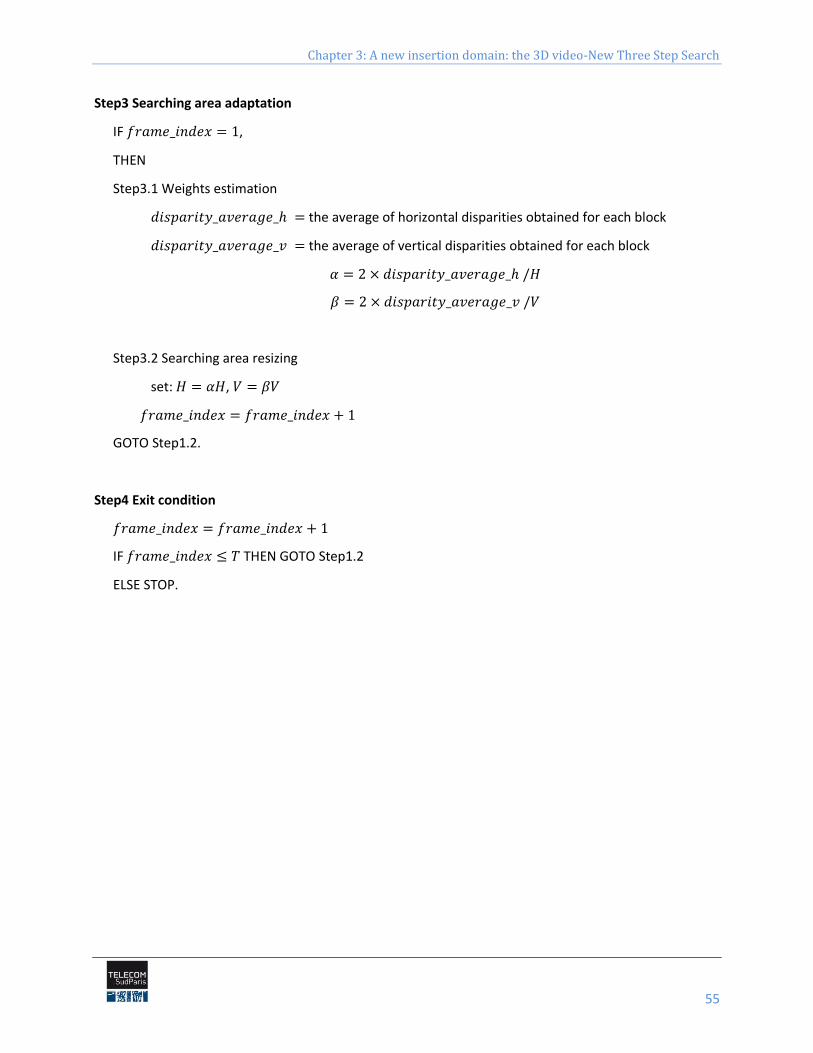
Chapter 3: A new insertion domain: the 3D video-New Three Step Search
55
Step3 Searching area adaptation
IF ,
THEN
Step3.1 Weights estimation
the average of horizontal disparities obtained for each block
the average of vertical disparities obtained for each block
Step3.2 Searching area resizing
set: ,
GOTO Step1.2.
Step4 Exit condition
IF THEN GOTO Step1.2
ELSE STOP.
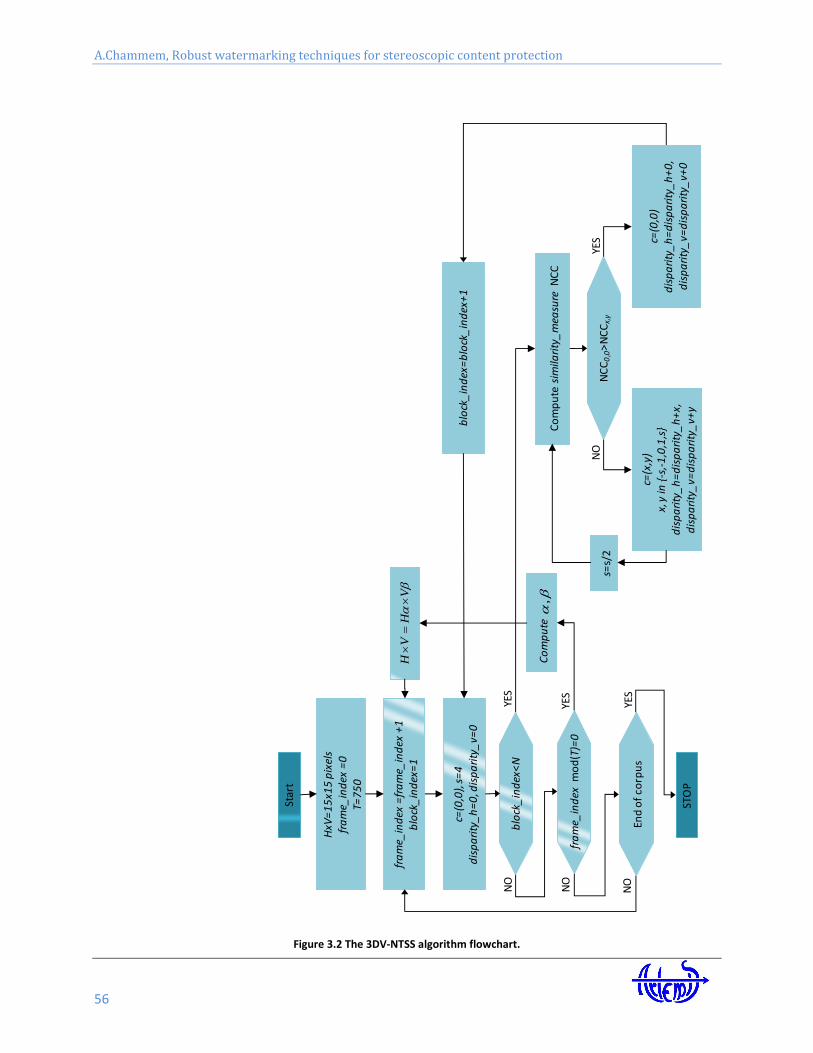
A.Chammem, Robust watermarking techniques for stereoscopic content protection
56
Figure 3.2 The 3DV-NTSS algorithm flowchart.
fra
me_
ind
ex=
fra
me_
ind
ex+
1b
lock
_in
dex
=1
HxV
=1
5x1
5 p
ixel
sfr
am
e_in
dex
=0
T=7
50
c=(0
,0),
s=
4d
isp
ari
ty_
h=
0, d
isp
ari
ty_
v=0
blo
ck_
ind
ex<
N
Co
mp
ute
sim
ilari
ty_
mea
sure
NC
C
NC
C0
,0>
NC
Cx,
y
blo
ck_
ind
ex=
blo
ck_
ind
ex+
1
s=s/
2
Co
mp
ute
c=(x
,y)
x, y
in {
-s,-
1,0
,1,s
}d
isp
ari
ty_
h=
dis
pa
rity
_h
+x,
dis
pa
rity
_v=
dis
pa
rity
_v+
y
Star
t
NO
YES
YES
NO
NO
c=(0
,0)
dis
pa
rity
_h
=d
isp
ari
ty_
h+
0,
dis
pa
rity
_v=
dis
pa
rity
_v+
0
YES
VH
VH
End
of
corp
us
STO
P
NO
YES
,
fra
me_
ind
exm
od
(T)=
0
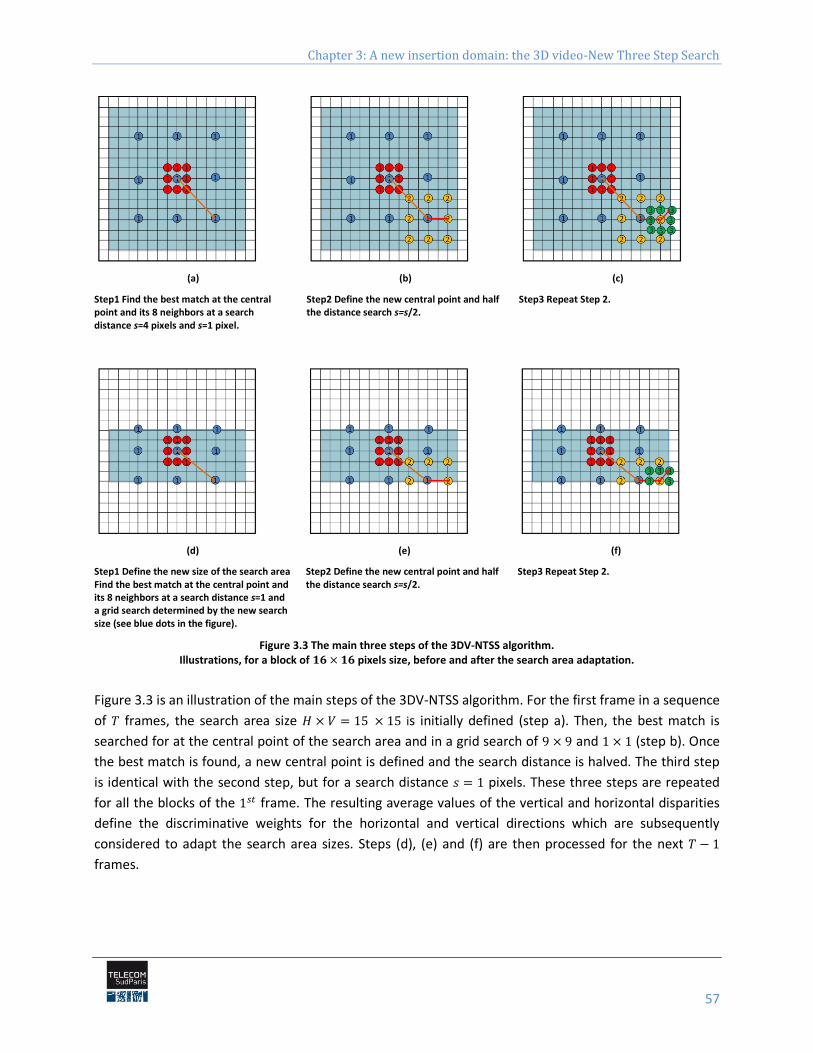
Chapter 3: A new insertion domain: the 3D video-New Three Step Search
57
(a) (b) (c)
Step1 Find the best match at the central point and its 8 neighbors at a search distance s=4 pixels and s=1 pixel.
Step2 Define the new central point and half the distance search s=s/2.
Step3 Repeat Step 2.
(d) (e) (f)
Step1 Define the new size of the search area Find the best match at the central point and its 8 neighbors at a search distance s=1 and a grid search determined by the new search size (see blue dots in the figure).
Step2 Define the new central point and half the distance search s=s/2.
Step3 Repeat Step 2.
Figure 3.3 The main three steps of the 3DV-NTSS algorithm. Illustrations, for a block of pixels size, before and after the search area adaptation.
Figure 3.3 is an illustration of the main steps of the 3DV-NTSS algorithm. For the first frame in a sequence
of frames, the search area size is initially defined (step a). Then, the best match is
searched for at the central point of the search area and in a grid search of and (step b). Once
the best match is found, a new central point is defined and the search distance is halved. The third step
is identical with the second step, but for a search distance pixels. These three steps are repeated
for all the blocks of the frame. The resulting average values of the vertical and horizontal disparities
define the discriminative weights for the horizontal and vertical directions which are subsequently
considered to adapt the search area sizes. Steps (d), (e) and (f) are then processed for the next
frames.
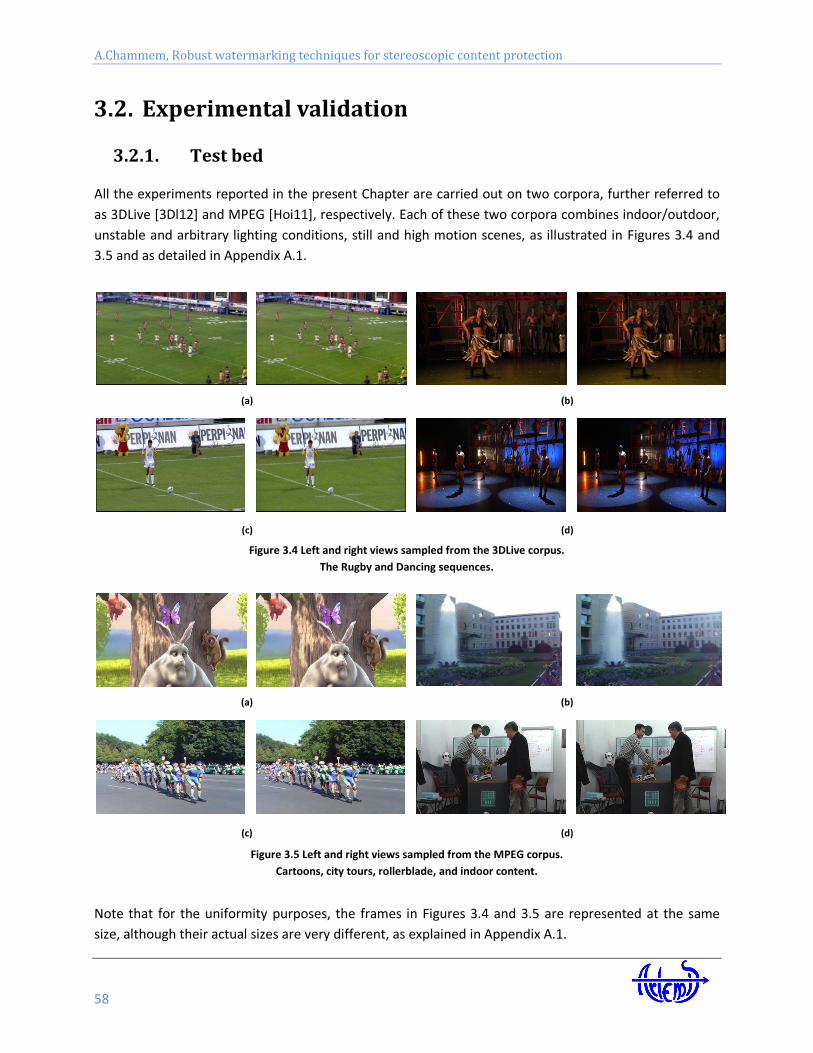
A.Chammem, Robust watermarking techniques for stereoscopic content protection
58
3.2. Experimental validation
3.2.1. Test bed
All the experiments reported in the present Chapter are carried out on two corpora, further referred to
as 3DLive [3Dl12] and MPEG [Hoi11], respectively. Each of these two corpora combines indoor/outdoor,
unstable and arbitrary lighting conditions, still and high motion scenes, as illustrated in Figures 3.4 and
3.5 and as detailed in Appendix A.1.
(a) (b)
(c) (d)
Figure 3.4 Left and right views sampled from the 3DLive corpus.
The Rugby and Dancing sequences.
(a) (b)
(c) (d)
Figure 3.5 Left and right views sampled from the MPEG corpus.
Cartoons, city tours, rollerblade, and indoor content.
Note that for the uniformity purposes, the frames in Figures 3.4 and 3.5 are represented at the same
size, although their actual sizes are very different, as explained in Appendix A.1.
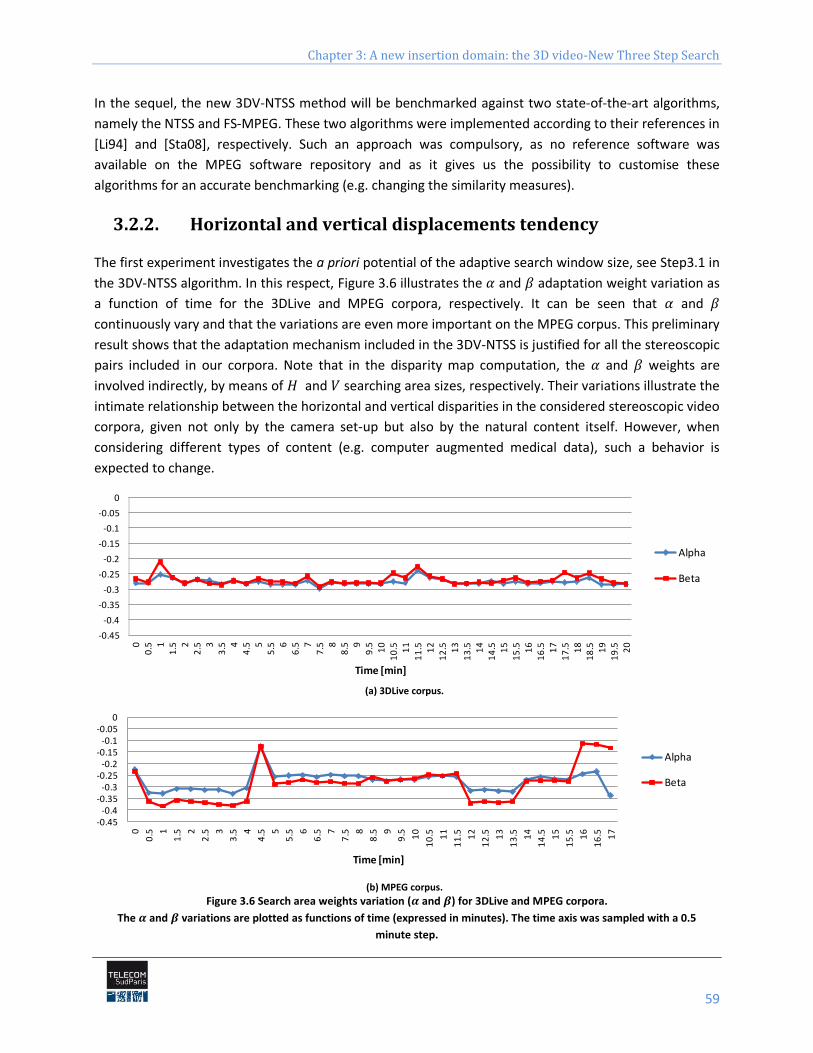
Chapter 3: A new insertion domain: the 3D video-New Three Step Search
59
In the sequel, the new 3DV-NTSS method will be benchmarked against two state-of-the-art algorithms,
namely the NTSS and FS-MPEG. These two algorithms were implemented according to their references in
[Li94] and [Sta08], respectively. Such an approach was compulsory, as no reference software was
available on the MPEG software repository and as it gives us the possibility to customise these
algorithms for an accurate benchmarking (e.g. changing the similarity measures).
3.2.2. Horizontal and vertical displacements tendency
The first experiment investigates the a priori potential of the adaptive search window size, see Step3.1 in
the 3DV-NTSS algorithm. In this respect, Figure 3.6 illustrates the and adaptation weight variation as
a function of time for the 3DLive and MPEG corpora, respectively. It can be seen that and
continuously vary and that the variations are even more important on the MPEG corpus. This preliminary
result shows that the adaptation mechanism included in the 3DV-NTSS is justified for all the stereoscopic
pairs included in our corpora. Note that in the disparity map computation, the and weights are
involved indirectly, by means of and searching area sizes, respectively. Their variations illustrate the
intimate relationship between the horizontal and vertical disparities in the considered stereoscopic video
corpora, given not only by the camera set-up but also by the natural content itself. However, when
considering different types of content (e.g. computer augmented medical data), such a behavior is
expected to change.
(a) 3DLive corpus.
(b) MPEG corpus.
Figure 3.6 Search area weights variation ( and ) for 3DLive and MPEG corpora.
The and variations are plotted as functions of time (expressed in minutes). The time axis was sampled with a 0.5
minute step.
-0.45
-0.4
-0.35
-0.3
-0.25
-0.2
-0.15
-0.1
-0.05
0
00
.5 11
.5 22
.5 33
.5 44
.5 55
.5 66
.5 77
.5 88
.5 99
.5 10
10
.5 11
11
.5 12
12
.5 13
13
.5 14
14
.5 15
15
.5 16
16
.5 17
17
.5 18
18
.5 19
19
.5 20
Time [min]
Alpha and Beta variation, 3DLive corpus
Alpha
Beta
-0.45-0.4
-0.35-0.3
-0.25-0.2
-0.15-0.1
-0.050
0
0.5 1
1.5 2
2.5 3
3.5 4
4.5 5
5.5 6
6.5 7
7.5 8
8.5 9
9.5 10
10
.5 11
11
.5 12
12
.5 13
13
.5 14
14
.5 15
15
.5 16
16
.5 17
Time [min]
Alpha and Beta variation, MEPG corpus
Alpha
Beta
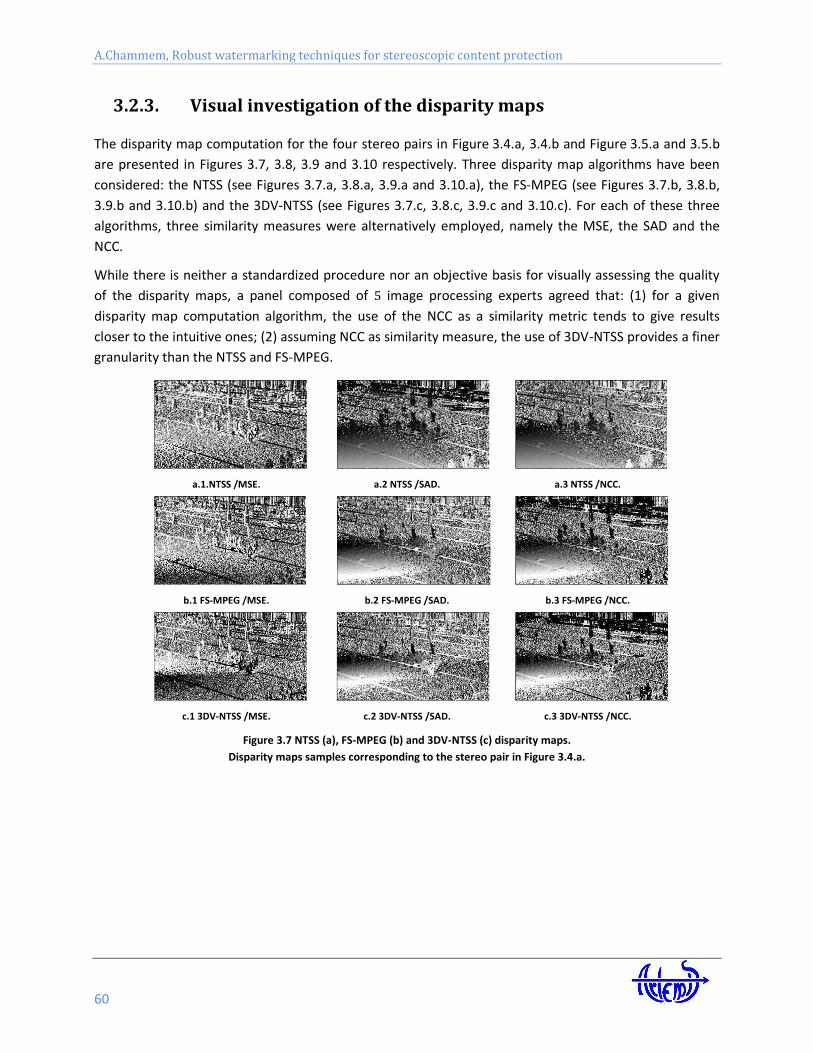
A.Chammem, Robust watermarking techniques for stereoscopic content protection
60
3.2.3. Visual investigation of the disparity maps
The disparity map computation for the four stereo pairs in Figure 3.4.a, 3.4.b and Figure 3.5.a and 3.5.b
are presented in Figures 3.7, 3.8, 3.9 and 3.10 respectively. Three disparity map algorithms have been
considered: the NTSS (see Figures 3.7.a, 3.8.a, 3.9.a and 3.10.a), the FS-MPEG (see Figures 3.7.b, 3.8.b,
3.9.b and 3.10.b) and the 3DV-NTSS (see Figures 3.7.c, 3.8.c, 3.9.c and 3.10.c). For each of these three
algorithms, three similarity measures were alternatively employed, namely the MSE, the SAD and the
NCC.
While there is neither a standardized procedure nor an objective basis for visually assessing the quality
of the disparity maps, a panel composed of image processing experts agreed that: (1) for a given
disparity map computation algorithm, the use of the NCC as a similarity metric tends to give results
closer to the intuitive ones; (2) assuming NCC as similarity measure, the use of 3DV-NTSS provides a finer
granularity than the NTSS and FS-MPEG.
a.1.NTSS /MSE. a.2 NTSS /SAD. a.3 NTSS /NCC.
b.1 FS-MPEG /MSE. b.2 FS-MPEG /SAD. b.3 FS-MPEG /NCC.
c.1 3DV-NTSS /MSE. c.2 3DV-NTSS /SAD. c.3 3DV-NTSS /NCC.
Figure 3.7 NTSS (a), FS-MPEG (b) and 3DV-NTSS (c) disparity maps.
Disparity maps samples corresponding to the stereo pair in Figure 3.4.a.
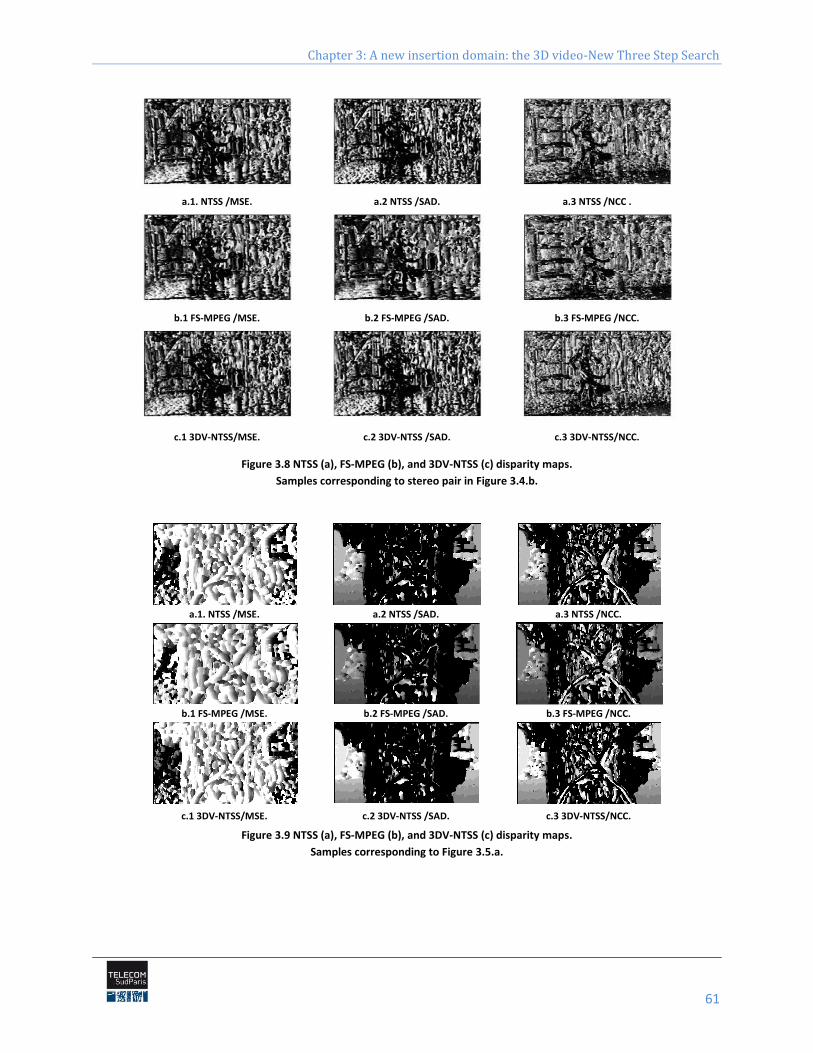
Chapter 3: A new insertion domain: the 3D video-New Three Step Search
61
a.1. NTSS /MSE. a.2 NTSS /SAD. a.3 NTSS /NCC .
b.1 FS-MPEG /MSE. b.2 FS-MPEG /SAD. b.3 FS-MPEG /NCC.
c.1 3DV-NTSS/MSE. c.2 3DV-NTSS /SAD. c.3 3DV-NTSS/NCC.
Figure 3.8 NTSS (a), FS-MPEG (b), and 3DV-NTSS (c) disparity maps.
Samples corresponding to stereo pair in Figure 3.4.b.
a.1. NTSS /MSE. a.2 NTSS /SAD. a.3 NTSS /NCC.
b.1 FS-MPEG /MSE. b.2 FS-MPEG /SAD. b.3 FS-MPEG /NCC.
c.1 3DV-NTSS/MSE. c.2 3DV-NTSS /SAD. c.3 3DV-NTSS/NCC.
Figure 3.9 NTSS (a), FS-MPEG (b), and 3DV-NTSS (c) disparity maps.
Samples corresponding to Figure 3.5.a.
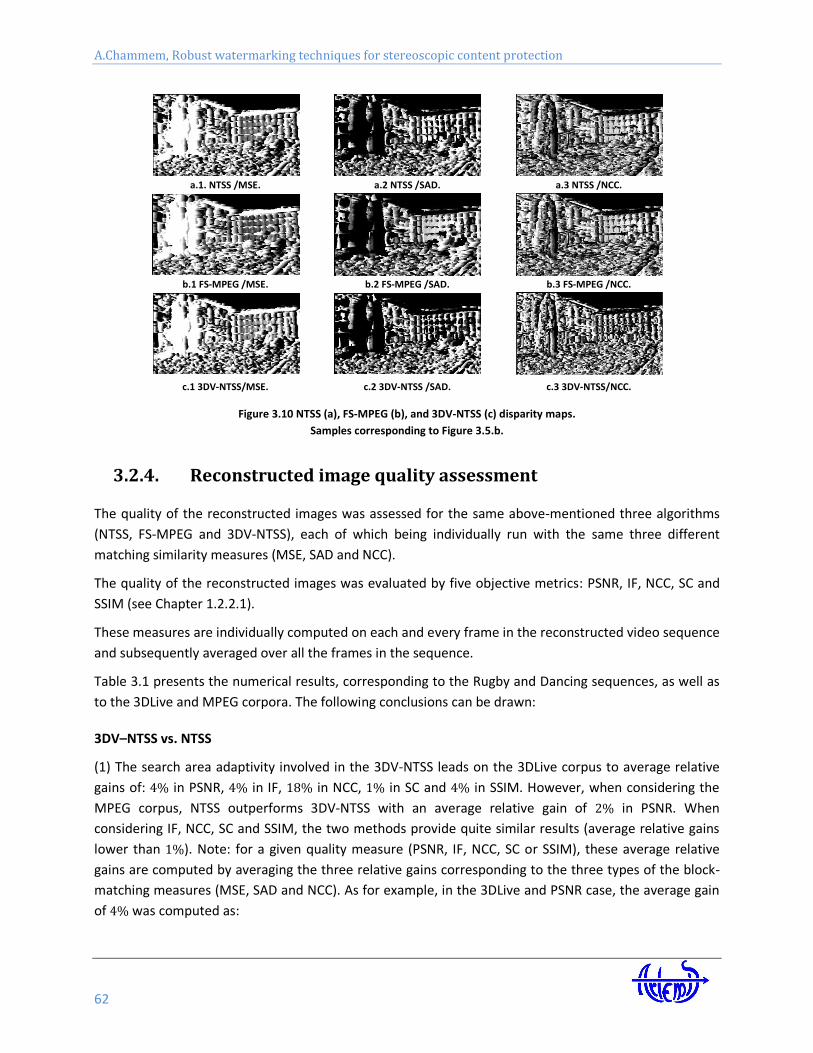
A.Chammem, Robust watermarking techniques for stereoscopic content protection
62
a.1. NTSS /MSE. a.2 NTSS /SAD. a.3 NTSS /NCC.
b.1 FS-MPEG /MSE. b.2 FS-MPEG /SAD. b.3 FS-MPEG /NCC.
c.1 3DV-NTSS/MSE. c.2 3DV-NTSS /SAD. c.3 3DV-NTSS/NCC.
Figure 3.10 NTSS (a), FS-MPEG (b), and 3DV-NTSS (c) disparity maps.
Samples corresponding to Figure 3.5.b.
3.2.4. Reconstructed image quality assessment
The quality of the reconstructed images was assessed for the same above-mentioned three algorithms
(NTSS, FS-MPEG and 3DV-NTSS), each of which being individually run with the same three different
matching similarity measures (MSE, SAD and NCC).
The quality of the reconstructed images was evaluated by five objective metrics: PSNR, IF, NCC, SC and
SSIM (see Chapter 1.2.2.1).
These measures are individually computed on each and every frame in the reconstructed video sequence
and subsequently averaged over all the frames in the sequence.
Table 3.1 presents the numerical results, corresponding to the Rugby and Dancing sequences, as well as
to the 3DLive and MPEG corpora. The following conclusions can be drawn:
3DV–NTSS vs. NTSS
(1) The search area adaptivity involved in the 3DV-NTSS leads on the 3DLive corpus to average relative
gains of: in PSNR, in IF, in NCC, in SC and in SSIM. However, when considering the
MPEG corpus, NTSS outperforms 3DV-NTSS with an average relative gain of in PSNR. When
considering IF, NCC, SC and SSIM, the two methods provide quite similar results (average relative gains
lower than ). Note: for a given quality measure (PSNR, IF, NCC, SC or SSIM), these average relative
gains are computed by averaging the three relative gains corresponding to the three types of the block-
matching measures (MSE, SAD and NCC). As for example, in the 3DLive and PSNR case, the average gain
of was computed as:
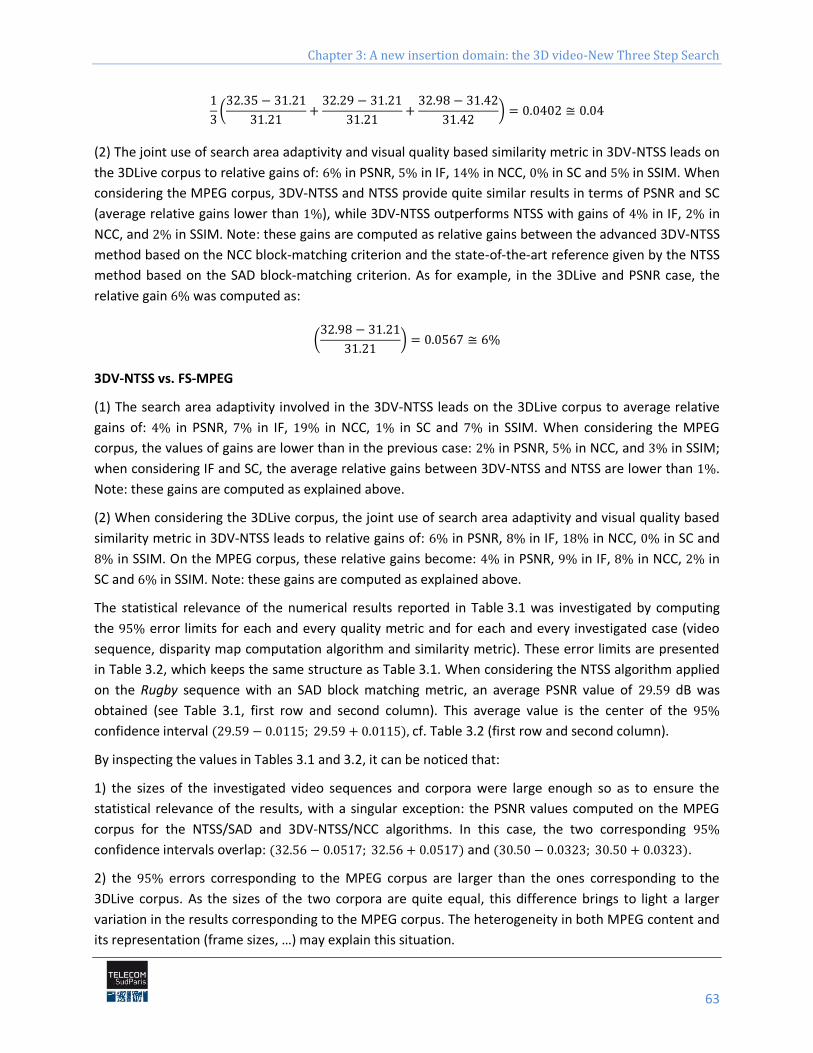
Chapter 3: A new insertion domain: the 3D video-New Three Step Search
63
(2) The joint use of search area adaptivity and visual quality based similarity metric in 3DV-NTSS leads on
the 3DLive corpus to relative gains of: in PSNR, in IF, in NCC, in SC and in SSIM. When
considering the MPEG corpus, 3DV-NTSS and NTSS provide quite similar results in terms of PSNR and SC
(average relative gains lower than ), while 3DV-NTSS outperforms NTSS with gains of in IF, in
NCC, and in SSIM. Note: these gains are computed as relative gains between the advanced 3DV-NTSS
method based on the NCC block-matching criterion and the state-of-the-art reference given by the NTSS
method based on the SAD block-matching criterion. As for example, in the 3DLive and PSNR case, the
relative gain was computed as:
3DV-NTSS vs. FS-MPEG
(1) The search area adaptivity involved in the 3DV-NTSS leads on the 3DLive corpus to average relative
gains of: in PSNR, in IF, in NCC, in SC and in SSIM. When considering the MPEG
corpus, the values of gains are lower than in the previous case: in PSNR, in NCC, and in SSIM;
when considering IF and SC, the average relative gains between 3DV-NTSS and NTSS are lower than .
Note: these gains are computed as explained above.
(2) When considering the 3DLive corpus, the joint use of search area adaptivity and visual quality based
similarity metric in 3DV-NTSS leads to relative gains of: in PSNR, in IF, in NCC, in SC and
in SSIM. On the MPEG corpus, these relative gains become: in PSNR, in IF, in NCC, in
SC and in SSIM. Note: these gains are computed as explained above.
The statistical relevance of the numerical results reported in Table 3.1 was investigated by computing
the error limits for each and every quality metric and for each and every investigated case (video
sequence, disparity map computation algorithm and similarity metric). These error limits are presented
in Table 3.2, which keeps the same structure as Table 3.1. When considering the NTSS algorithm applied
on the Rugby sequence with an SAD block matching metric, an average PSNR value of dB was
obtained (see Table 3.1, first row and second column). This average value is the center of the
confidence interval cf. Table 3.2 (first row and second column).
By inspecting the values in Tables 3.1 and 3.2, it can be noticed that:
1) the sizes of the investigated video sequences and corpora were large enough so as to ensure the
statistical relevance of the results, with a singular exception: the PSNR values computed on the MPEG
corpus for the NTSS/SAD and 3DV-NTSS/NCC algorithms. In this case, the two corresponding
confidence intervals overlap: and .
2) the errors corresponding to the MPEG corpus are larger than the ones corresponding to the
3DLive corpus. As the sizes of the two corpora are quite equal, this difference brings to light a larger
variation in the results corresponding to the MPEG corpus. The heterogeneity in both MPEG content and
its representation (frame sizes, …) may explain this situation.
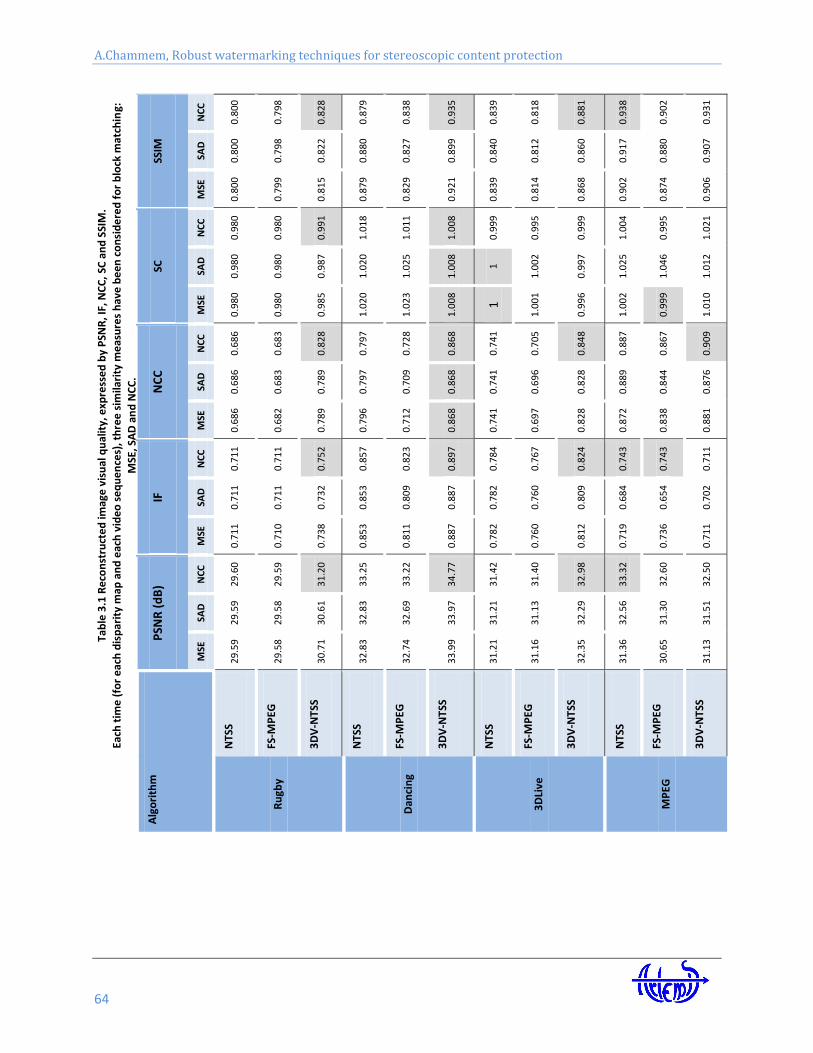
A.Chammem, Robust watermarking techniques for stereoscopic content protection
64
Tab
le 3
.1 R
eco
nst
ruct
ed
imag
e v
isu
al q
ual
ity,
exp
ress
ed
by
PSN
R, I
F, N
CC
, SC
an
d S
SIM
.
Each
tim
e (
for
eac
h d
isp
arit
y m
ap a
nd
eac
h v
ide
o s
eq
ue
nce
s), t
hre
e s
imila
rity
me
asu
res
hav
e b
een
co
nsi
de
red
fo
r b
lock
mat
chin
g:
MSE
, SA
D a
nd
NC
C.
SS
IM
NC
C
0.8
00
0.7
98
0.8
28
0.8
79
0.8
38
0.9
35
0.8
39
0.8
18
0.8
81
0.9
38
0.9
02
0.9
31
SAD
0.8
00
0.7
98
0.8
22
0.8
80
0.8
27
0.8
99
0.8
40
0.8
12
0.8
60
0.9
17
0.8
80
0.9
07
MSE
0.8
00
0.7
99
0.8
15
0.8
79
0.8
29
0.9
21
0.8
39
0.8
14
0.8
68
0.9
02
0.8
74
0.9
06
SC
NC
C
0.9
80
0.9
80
0.9
91
1.0
18
1.0
11
1.0
08
0.9
99
0.9
95
0.9
99
1.0
04
0.9
95
1.0
21
SAD
0.9
80
0.9
80
0.9
87
1.0
20
1.0
25
1.0
08
1
1.0
02
0.9
97
1.0
25
1.0
46
1.0
12
MSE
0.9
80
0.9
80
0.9
85
1.0
20
1.0
23
1.0
08
1
1.0
01
0.9
96
1.0
02
0.9
99
1.0
10
NC
C
NC
C
0.6
86
0.6
83
0.8
28
0.7
97
0.7
28
0.8
68
0.7
41
0.7
05
0.8
48
0.8
87
0.8
67
0.9
09
SAD
0.6
86
0.6
83
0.7
89
0.7
97
0.7
09
0.8
68
0.7
41
0.6
96
0.8
28
0.8
89
0.8
44
0.8
76
MSE
0.6
86
0.6
82
0.7
89
0.7
96
0.7
12
0.8
68
0.7
41
0.6
97
0.8
28
0.8
72
0.8
38
0.8
81
IF
NC
C
0.7
11
0.7
11
0.7
52
0.8
57
0.8
23
0.8
97
0.7
84
0.7
67
0.8
24
0.7
43
0.7
43
0.7
11
SAD
0.7
11
0.7
11
0.7
32
0.8
53
0.8
09
0.8
87
0.7
82
0.7
60
0.8
09
0.6
84
0.6
54
0.7
02
MSE
0.7
11
0.7
10
0.7
38
0.8
53
0.8
11
0.8
87
0.7
82
0.7
60
0.8
12
0.7
19
0.7
36
0.7
11
PSN
R (
dB
) NC
C
29
.60
29
.59
31
.20
33
.25
33
.22
34
.77
31
.42
31
.40
32
.98
33
.32
32
.60
32
.50
SAD
29
.59
29
.58
30
.61
32
.83
32
.69
33
.97
31
.21
31
.13
32
.29
32
.56
31
.30
31
.51
MSE
29
.59
29
.58
30
.71
32
.83
32
.74
33
.99
31
.21
31
.16
32
.35
31
.36
30
.65
31
.13
Alg
ori
thm
NTS
S
FS-M
PEG
3D
V-N
TSS
NTS
S
FS-M
PEG
3D
V-N
TSS
NTS
S
FS-M
PEG
3D
V-N
TSS
NTS
S
FS-M
PEG
3D
V-N
TSS
Ru
gby
Dan
cin
g
3D
Live
MP
EG
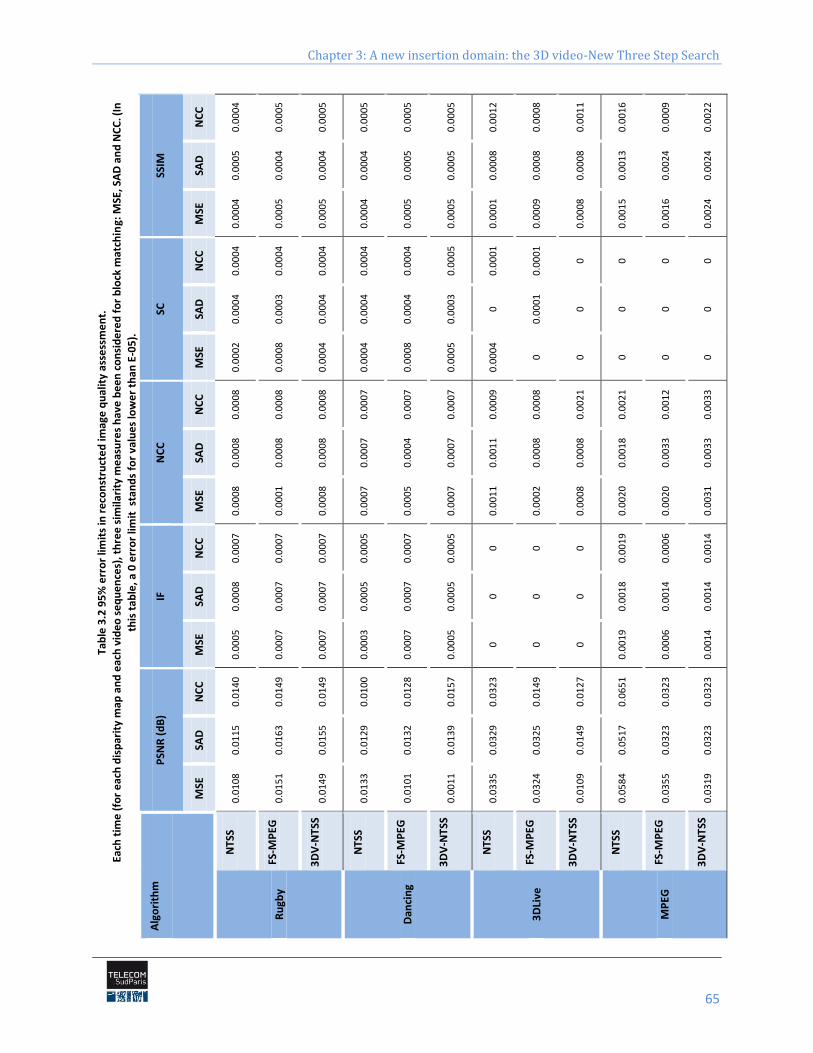
Chapter 3: A new insertion domain: the 3D video-New Three Step Search
65
Tab
le 3
.2 9
5%
err
or
limit
s in
re
con
stru
cte
d im
age
qu
alit
y as
sess
me
nt.
Each
tim
e (
for
eac
h d
isp
arit
y m
ap a
nd
eac
h v
ide
o s
eq
ue
nce
s), t
hre
e s
imila
rity
me
asu
res
hav
e b
een
co
nsi
de
red
fo
r b
lock
mat
chin
g: M
SE, S
AD
an
d N
CC
. (In
this
tab
le, a
0 e
rro
r lim
it s
tan
ds
for
valu
es
low
er
than
E-0
5).
SS
IM
NC
C
0.0
00
4
0.0
00
5
0.0
00
5
0.0
00
5
0.0
00
5
0.0
00
5
0.0
01
2
0.0
00
8
0.0
01
1
0.0
01
6
0.0
00
9
0.0
02
2
SAD
0.0
00
5
0.0
00
4
0.0
00
4
0.0
00
4
0.0
00
5
0.0
00
5
0.0
00
8
0.0
00
8
0.0
00
8
0.0
01
3
0.0
02
4
0.0
02
4
MSE
0.0
00
4
0.0
00
5
0.0
00
5
0.0
00
4
0.0
00
5
0.0
00
5
0.0
00
1
0.0
00
9
0.0
00
8
0.0
01
5
0.0
01
6
0.0
02
4
SC
NC
C
0.0
00
4
0.0
00
4
0.0
00
4
0.0
00
4
0.0
00
4
0.0
00
5
0.0
00
1
0.0
00
1
0
0
0
0
SAD
0.0
00
4
0.0
00
3
0.0
00
4
0.0
00
4
0.0
00
4
0.0
00
3
0
0.0
00
1
0
0
0
0
MSE
0.0
00
2
0.0
00
8
0.0
00
4
0.0
00
4
0.0
00
8
0.0
00
5
0.0
00
4
0
0
0
0
0
NC
C
NC
C
0.0
00
8
0.0
00
8
0.0
00
8
0.0
00
7
0.0
00
7
0.0
00
7
0.0
00
9
0.0
00
8
0.0
02
1
0.0
02
1
0.0
01
2
0.0
03
3
SAD
0.0
00
8
0.0
00
8
0.0
00
8
0.0
00
7
0.0
00
4
0.0
00
7
0.0
01
1
0.0
00
8
0.0
00
8
0.0
01
8
0.0
03
3
0.0
03
3
MSE
0.0
00
8
0.0
00
1
0.0
00
8
0.0
00
7
0.0
00
5
0.0
00
7
0.0
01
1
0.0
00
2
0.0
00
8
0.0
02
0
0.0
02
0
0.0
03
1
IF
NC
C
0.0
00
7
0.0
00
7
0.0
00
7
0.0
00
5
0.0
00
7
0.0
00
5
0
0
0
0.0
01
9
0.0
00
6
0.0
01
4
SAD
0.0
00
8
0.0
00
7
0.0
00
7
0.0
00
5
0.0
00
7
0.0
00
5
0
0
0
0.0
01
8
0.0
01
4
0.0
01
4
MSE
0.0
00
5
0.0
00
7
0.0
00
7
0.0
00
3
0.0
00
7
0.0
00
5
0
0
0
0.0
01
9
0.0
00
6
0.0
01
4
PSN
R (
dB
)
NC
C
0.0
14
0
0.0
14
9
0.0
14
9
0.0
10
0
0.0
12
8
0.0
15
7
0.0
32
3
0.0
14
9
0.0
12
7
0.0
65
1
0.0
32
3
0.0
32
3
SAD
0.0
11
5
0.0
16
3
0.0
15
5
0.0
12
9
0.0
13
2
0.0
13
9
0.0
32
9
0.0
32
5
0.0
14
9
0.0
51
7
0.0
32
3
0.0
32
3
MSE
0.0
10
8
0.0
15
1
0.0
14
9
0.0
13
3
0.0
10
1
0.0
01
1
0.0
33
5
0.0
32
4
0.0
10
9
0.0
58
4
0.0
35
5
0.0
31
9
Alg
ori
thm
NTS
S
FS-M
PEG
3D
V-N
TSS
NTS
S
FS-M
PEG
3D
V-N
TSS
NTS
S
FS-M
PEG
3D
V-N
TSS
NTS
S
FS-M
PEG
3D
V-N
TSS
Ru
gby
Dan
cin
g
3D
Live
MP
EG
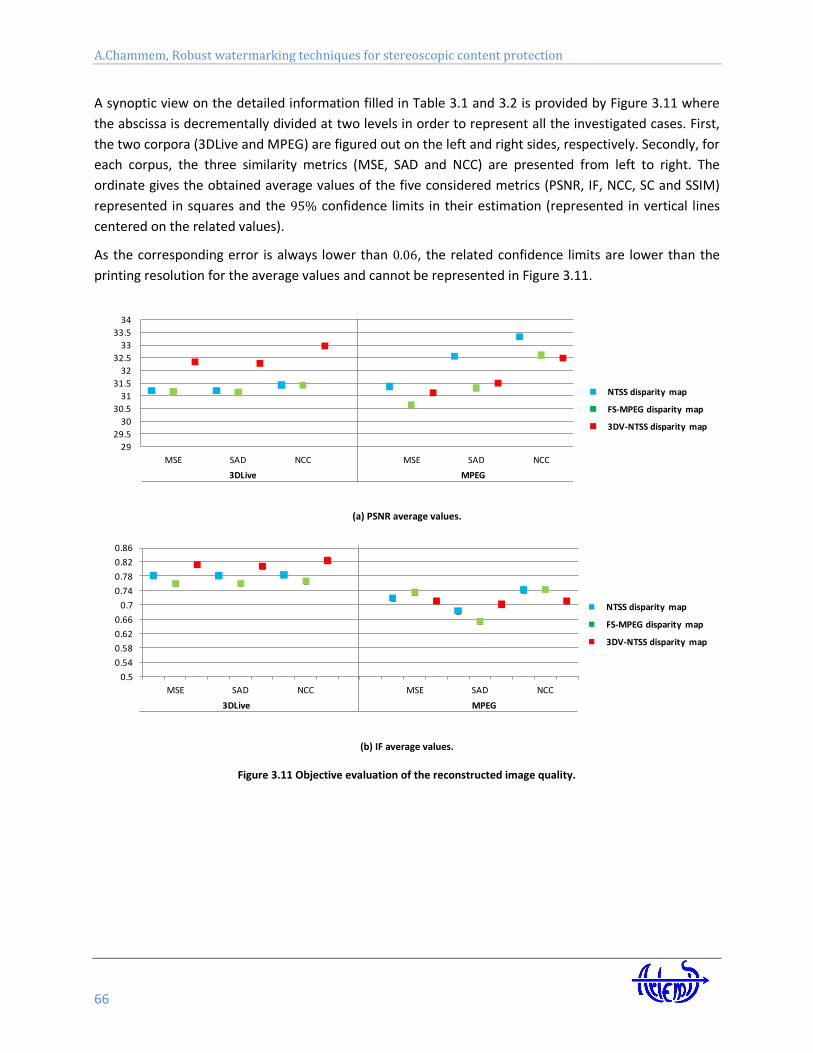
A.Chammem, Robust watermarking techniques for stereoscopic content protection
66
A synoptic view on the detailed information filled in Table 3.1 and 3.2 is provided by Figure 3.11 where
the abscissa is decrementally divided at two levels in order to represent all the investigated cases. First,
the two corpora (3DLive and MPEG) are figured out on the left and right sides, respectively. Secondly, for
each corpus, the three similarity metrics (MSE, SAD and NCC) are presented from left to right. The
ordinate gives the obtained average values of the five considered metrics (PSNR, IF, NCC, SC and SSIM)
represented in squares and the confidence limits in their estimation (represented in vertical lines
centered on the related values).
As the corresponding error is always lower than , the related confidence limits are lower than the
printing resolution for the average values and cannot be represented in Figure 3.11.
(a) PSNR average values.
(b) IF average values.
Figure 3.11 Objective evaluation of the reconstructed image quality.
29
29.5
30
30.5
31
31.5
32
32.5
33
33.5
34
MSE SAD NCC MSE SAD NCC
3DLive MPEG
PSNR
FS-MPEG disparity map
NTSS disparity map
3DV-NTSS disparity map
0.5
0.54
0.58
0.62
0.66
0.7
0.74
0.78
0.82
0.86
MSE SAD NCC MSE SAD NCC
3DLive MPEG
IF
FS-MPEG disparity map
NTSS disparity map
3DV-NTSS disparity map
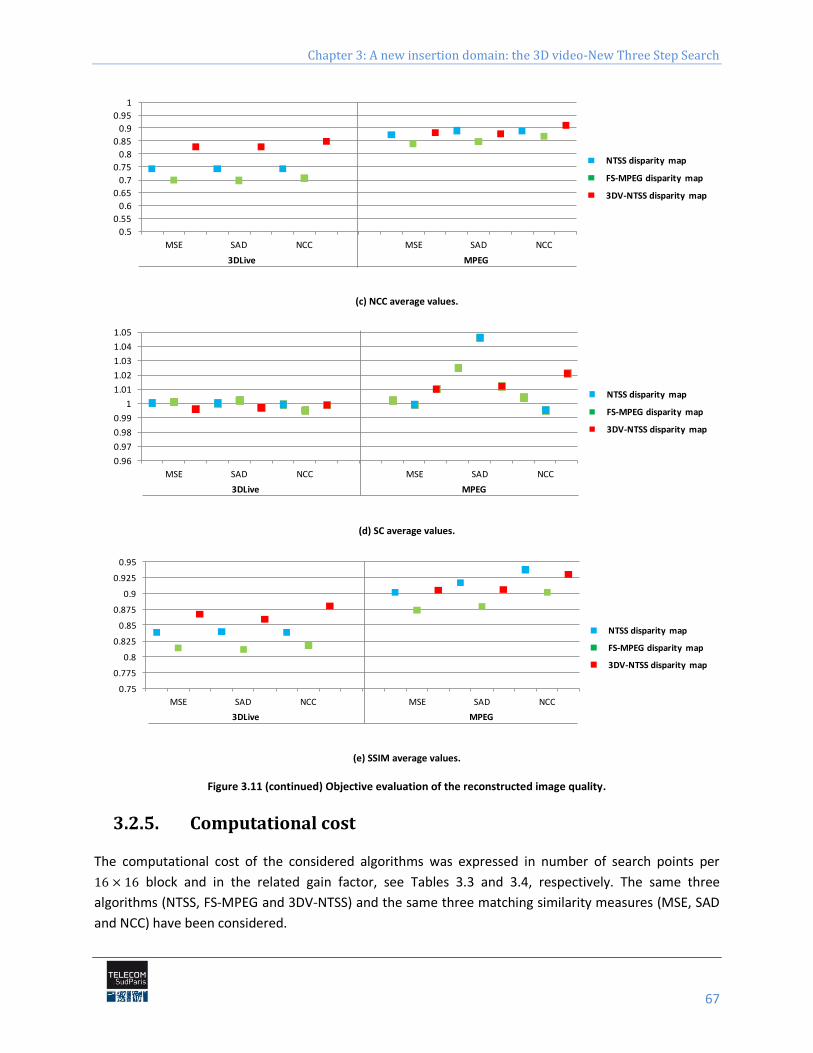
Chapter 3: A new insertion domain: the 3D video-New Three Step Search
67
(c) NCC average values.
(d) SC average values.
(e) SSIM average values.
Figure 3.11 (continued) Objective evaluation of the reconstructed image quality.
3.2.5. Computational cost
The computational cost of the considered algorithms was expressed in number of search points per
block and in the related gain factor, see Tables 3.3 and 3.4, respectively. The same three
algorithms (NTSS, FS-MPEG and 3DV-NTSS) and the same three matching similarity measures (MSE, SAD
and NCC) have been considered.
0.5
0.55
0.6
0.65
0.7
0.75
0.8
0.85
0.9
0.95
1
MSE SAD NCC MSE SAD NCC
3DLive MPEG
NCC
FS-MPEG disparity map
NTSS disparity map
3DV-NTSS disparity map
0.96
0.97
0.98
0.99
1
1.01
1.02
1.03
1.04
1.05
MSE SAD NCC MSE SAD NCC
3DLive MPEG
SC
FS-MPEG disparity map
NTSS disparity map
3DV-NTSS disparity map
0.75
0.775
0.8
0.825
0.85
0.875
0.9
0.925
0.95
MSE SAD NCC MSE SAD NCC
3DLive MPEG
SSIM
FS-MPEG disparity map
NTSS disparity map
3DV-NTSS disparity map
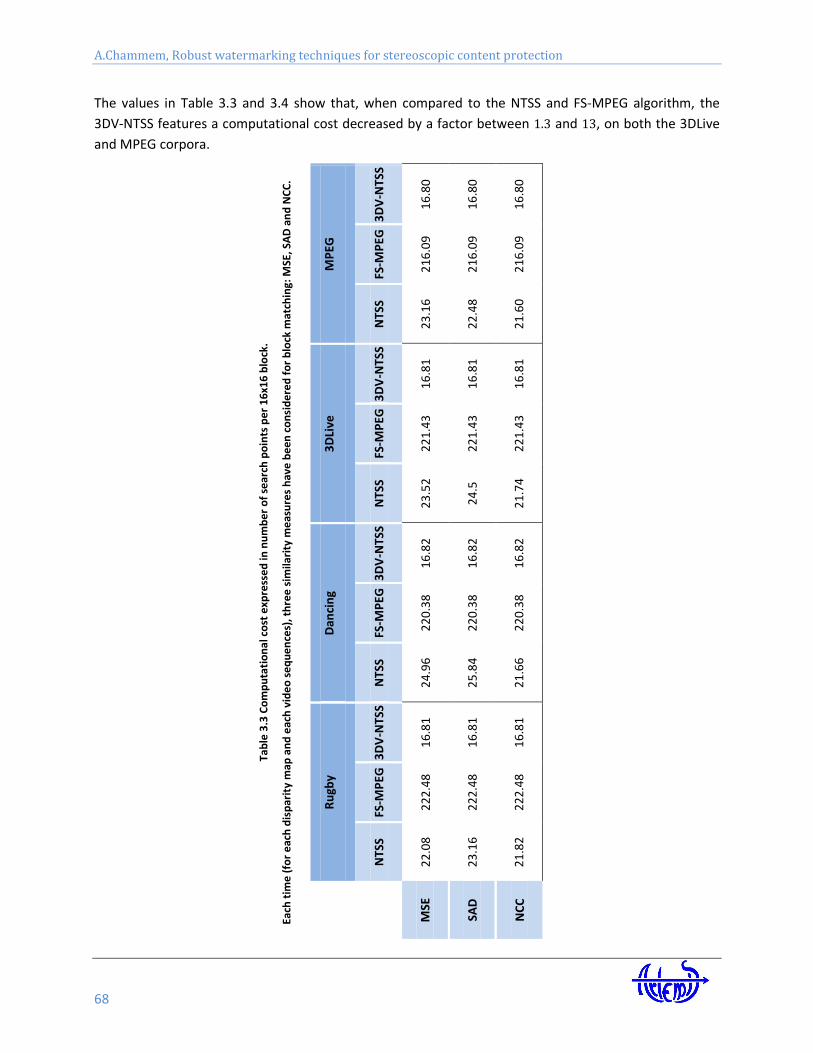
A.Chammem, Robust watermarking techniques for stereoscopic content protection
68
The values in Table 3.3 and 3.4 show that, when compared to the NTSS and FS-MPEG algorithm, the
3DV-NTSS features a computational cost decreased by a factor between and , on both the 3DLive
and MPEG corpora.
Tab
le 3
.3 C
om
pu
tati
on
al c
ost
exp
ress
ed
in n
um
be
r o
f se
arch
po
ints
pe
r 1
6x1
6 b
lock
.
Each
tim
e (
for
eac
h d
isp
arit
y m
ap a
nd
eac
h v
ide
o s
eq
ue
nce
s), t
hre
e s
imila
rity
me
asu
res
hav
e b
een
co
nsi
de
red
fo
r b
lock
mat
chin
g: M
SE, S
AD
an
d N
CC
.
MP
EG
3D
V-N
TSS
16
.80
16
.80
16
.80
FS-M
PEG
21
6.0
9
21
6.0
9
21
6.0
9
NTS
S
23
.16
22
.48
21
.60
3D
Live
3D
V-N
TSS
16
.81
16
.81
16
.81
FS-M
PEG
22
1.4
3
22
1.4
3
22
1.4
3
NTS
S
23
.52
24
.5
21
.74
Dan
cin
g
3D
V-N
TSS
16
.82
16
.82
16
.82
FS-M
PEG
22
0.3
8
22
0.3
8
22
0.3
8
NTS
S
24
.96
25
.84
21
.66
Ru
gby
3D
V-N
TSS
16
.81
16
.81
16
.81
FS-M
PEG
22
2.4
8
22
2.4
8
22
2.4
8
NTS
S
22
.08
23
.16
21
.82
MSE
SAD
NC
C
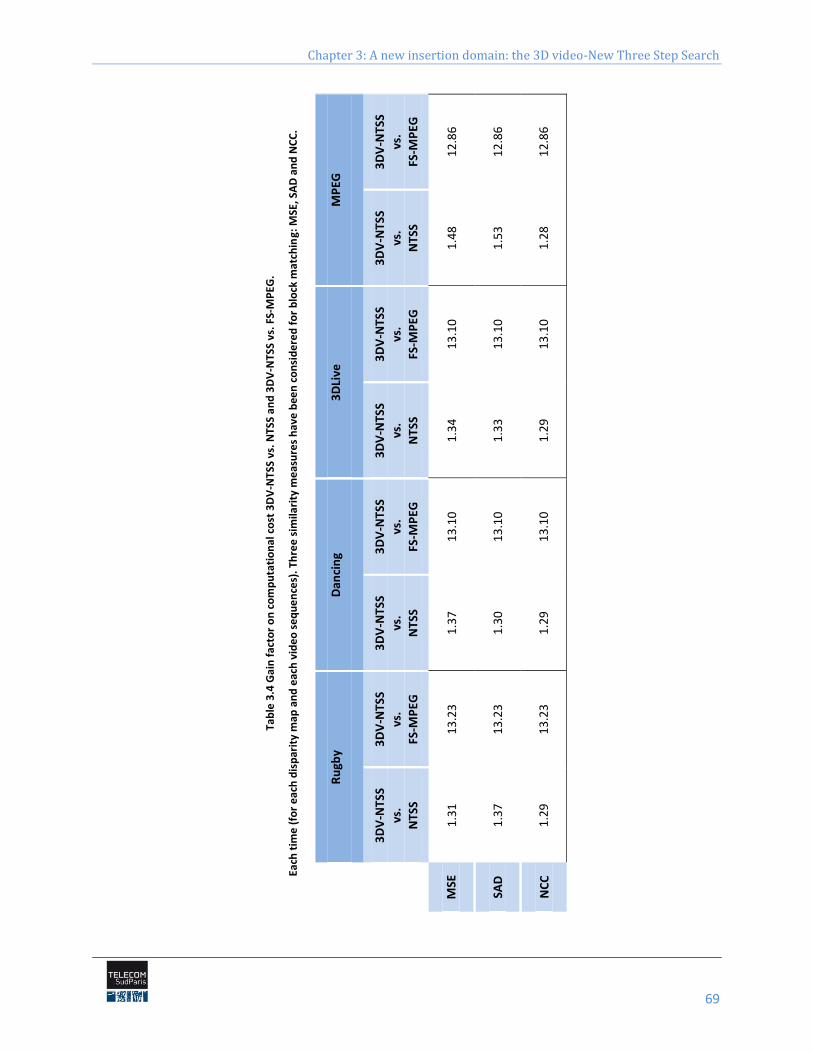
Chapter 3: A new insertion domain: the 3D video-New Three Step Search
69
Tab
le 3
.4 G
ain
fac
tor
on
co
mp
uta
tio
nal
co
st 3
DV
-NT
SS v
s. N
TSS
an
d 3
DV
-NTS
S vs
. FS-
MP
EG.
Each
tim
e (
for
eac
h d
isp
arit
y m
ap a
nd
eac
h v
ide
o s
eq
ue
nce
s). T
hre
e s
imila
rity
me
asu
res
hav
e b
een
co
nsi
de
red
fo
r b
lock
mat
chin
g: M
SE, S
AD
an
d N
CC
.
MP
EG 3
DV
-NTS
S
vs.
FS-M
PEG
12
.86
12
.86
12
.86
3D
V-N
TSS
vs.
NTS
S
1.4
8
1.5
3
1.2
8
3D
Live
3D
V-N
TSS
vs.
FS-M
PEG
13
.10
13
.10
13
.10
3D
V-N
TSS
vs.
NTS
S
1.3
4
1.3
3
1.2
9
Dan
cin
g 3D
V-N
TSS
vs.
FS-M
PEG
13
.10
13
.10
13
.10
3D
V-N
TSS
vs.
NTS
S
1.3
7
1.3
0
1.2
9
Ru
gby
3D
V-N
TSS
vs.
FS-M
PEG
13
.23
13
.23
13
.23
3D
V-N
TSS
vs.
NTS
S
1.3
1
1.3
7
1.2
9
MSE
SAD
NC
C
A.Chammem, Robust watermarking techniques for stereoscopic content protection
70
3.3. Discussion
The present study advances 3DV-NTSS, a new method for disparity map computation for stereoscopic
video. When applied on HD 3D TV content, it outperforms state-of-the-art algorithms (like NTSS or
FS-MPEG) in terms of reconstructed image quality, computational cost and watermarking effectiveness.
When considering stereoscopic video content encoded at lower quality (e.g. the MPEG stereoscopic
video dataset), 3DV-NTSS features significant gains in computational cost and watermarking
performances at the expense of a slight reduction in reconstructed image quality.
In order to obtain these results, two mechanisms were considered in the 3DV-NTSS design: the
adaptation of the searching area according to the stereoscopic content itself and the use of a human
visual system based metric in the matching decision. The former alleviates the problem of local minima
reported in [Zhu00] were it is stated that: “Since the error surface is usually not
monotonic, multiple local minimum points generally exist in the search
window especially for those image sequences with large motion content.
Therefore, searching with small search pattern, such as the one used in
DS with size , is quite likely to be trapped into local minimum for
those video sequences with large motion content. On the other hand, a
large search pattern with size and sparse checking points as
exploited in the first step of TSS is most likely to mislead the search
path to wrong direction and hence misses the optimum point.” Our
experiments confirmed this statement: from the visual quality point of view, 3DV-NTSS clearly
outperforms NTSS when considering HD content, with sharp details and high motion content. The latter
mechanism is devoted to a better identification of the blocks to be matched, in the sense of the human
visual system.
The quantitative results presented in sections 3.2.3 and 3.3.4 also confirm the general view on the
state-of-the-art presented in Figure 2.3 (Chapter 2), where NTSS and FS-MPEG were reported to feature
an image quality expressed by MSE larger than , a computational cost of and search points
per block, respectively. Our experiments show that NTSS and FS-MPEG feature MSE values of
and and computational cost of and , respectively. Finally, note that at least for the HD
3D TV, 3DV-NTSS can be figured in Figure 2.3 at the same position as the “Targeted solution”, featuring
an MSE of and a computational cost of search points.
3.4. Conclusion
With this Chapter, a new disparity map for HD 3D TV is advanced. By jointly exploiting the
horizontal/vertical peculiarities of this kind of content and a visual quality metric in the block matching
procedure, gains in both the reconstructed image quality and the computational cost are obtained with
respect to the state-of-the-art algorithms like NTSS and FS-MPEG. This disparity map was validated for
watermarking purposes under the framework of the 3DLive project. Automatically adapting the
3DV-NTSS parameters ( , block size …) and cross-checking its effectiveness on test (synthetic) content
are the main directions of our future work.
Chapter 4 A reliable watermarking technique: Fast-IProtect
A.Chammem, Robust watermarking techniques for stereoscopic content protection
72
Abstract
The watermarking state of the art exhibits the hybrid methods combining spread spectrum and side information
principles as the most efficient approaches. The present study is focussed on speeding up such an algorithm (jointly
patented by SFR – Vodafone Group and Institut Telecom), by deploying Monte Carlo generators accurately
representing the watermarking attacks. A gains factor of 80 in computational speed is thus obtained. In this
respect, two difficulties should be overcome. First, accurate statistical models for the watermarking attacks should
be obtained. Secondly, efficient Monte Carlo simulators should be deployed for these models. The last part of the
study is devoted to the experimental validations.
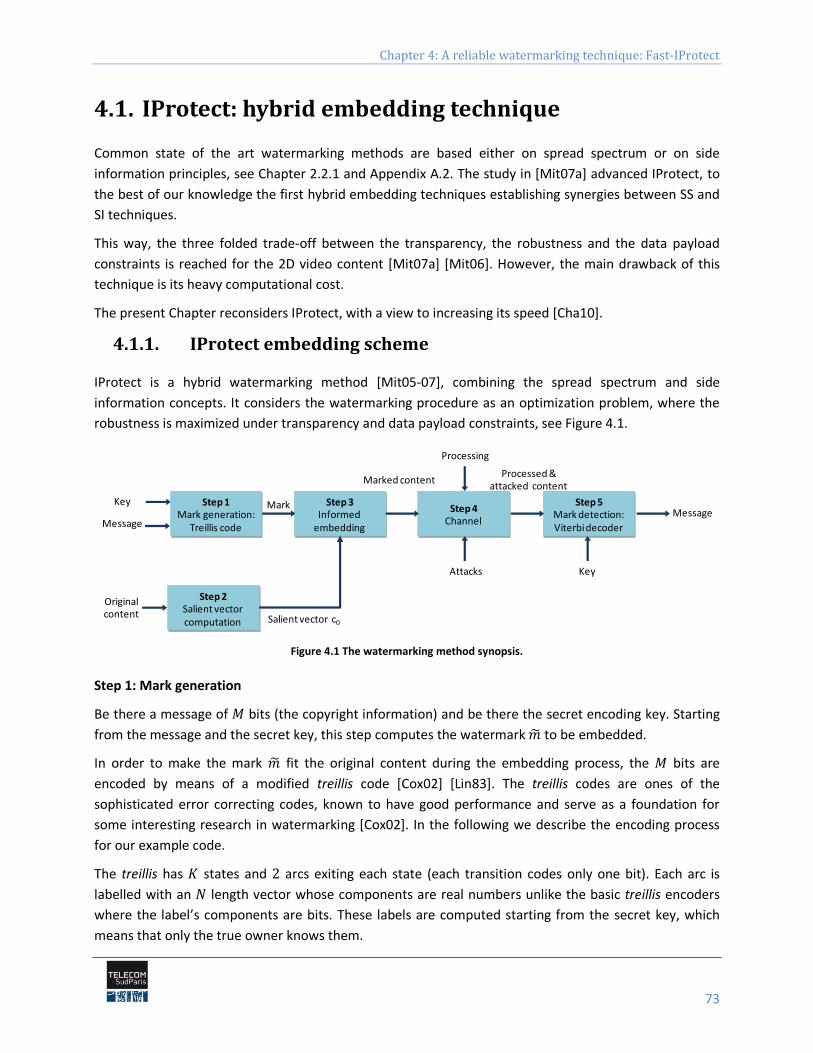
Chapter 4: A reliable watermarking technique: Fast-IProtect
73
4.1. IProtect: hybrid embedding technique
Common state of the art watermarking methods are based either on spread spectrum or on side
information principles, see Chapter 2.2.1 and Appendix A.2. The study in [Mit07a] advanced IProtect, to
the best of our knowledge the first hybrid embedding techniques establishing synergies between SS and
SI techniques.
This way, the three folded trade-off between the transparency, the robustness and the data payload
constraints is reached for the 2D video content [Mit07a] [Mit06]. However, the main drawback of this
technique is its heavy computational cost.
The present Chapter reconsiders IProtect, with a view to increasing its speed [Cha10].
4.1.1. IProtect embedding scheme
IProtect is a hybrid watermarking method [Mit05-07], combining the spread spectrum and side
information concepts. It considers the watermarking procedure as an optimization problem, where the
robustness is maximized under transparency and data payload constraints, see Figure 4.1.
Figure 4.1 The watermarking method synopsis.
Step 1: Mark generation
Be there a message of bits (the copyright information) and be there the secret encoding key. Starting
from the message and the secret key, this step computes the watermark to be embedded.
In order to make the mark fit the original content during the embedding process, the bits are
encoded by means of a modified treillis code [Cox02] [Lin83]. The treillis codes are ones of the
sophisticated error correcting codes, known to have good performance and serve as a foundation for
some interesting research in watermarking [Cox02]. In the following we describe the encoding process
for our example code.
The treillis has states and arcs exiting each state (each transition codes only one bit). Each arc is
labelled with an length vector whose components are real numbers unlike the basic treillis encoders
where the label’s components are bits. These labels are computed starting from the secret key, which
means that only the true owner knows them.
Step 1Mark generation:
Treillis code
Step 3Informed
embedding
Step 5Mark detection:Viterbidecoder
Step 4 Channel
Step 2Salient vector computation
Message
Key
Original content
Mark
Salient vector c0
Marked contentProcessed &
attacked content
Message
KeyAttacks
Processing
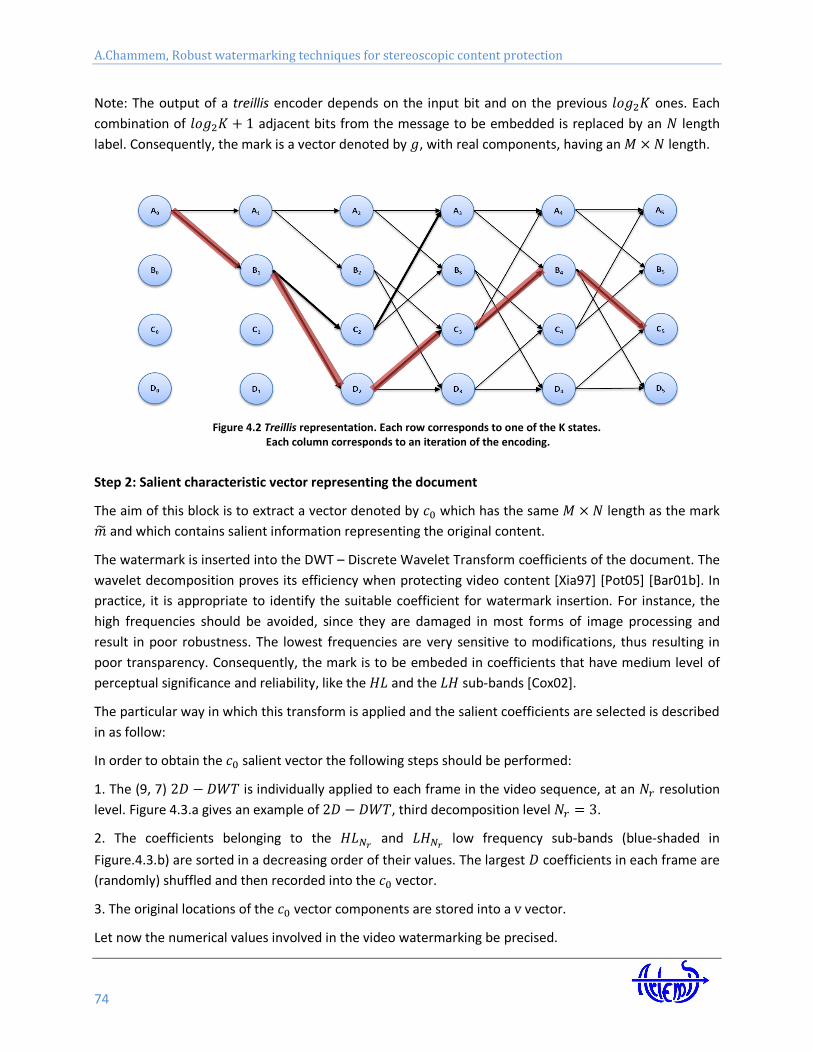
A.Chammem, Robust watermarking techniques for stereoscopic content protection
74
Note: The output of a treillis encoder depends on the input bit and on the previous ones. Each
combination of adjacent bits from the message to be embedded is replaced by an length
label. Consequently, the mark is a vector denoted by , with real components, having an length.
Figure 4.2 Treillis representation. Each row corresponds to one of the K states. Each column corresponds to an iteration of the encoding.
Step 2: Salient characteristic vector representing the document
The aim of this block is to extract a vector denoted by which has the same length as the mark
and which contains salient information representing the original content.
The watermark is inserted into the DWT – Discrete Wavelet Transform coefficients of the document. The
wavelet decomposition proves its efficiency when protecting video content [Xia97] [Pot05] [Bar01b]. In
practice, it is appropriate to identify the suitable coefficient for watermark insertion. For instance, the
high frequencies should be avoided, since they are damaged in most forms of image processing and
result in poor robustness. The lowest frequencies are very sensitive to modifications, thus resulting in
poor transparency. Consequently, the mark is to be embeded in coefficients that have medium level of
perceptual significance and reliability, like the and the sub-bands [Cox02].
The particular way in which this transform is applied and the salient coefficients are selected is described
in as follow:
In order to obtain the salient vector the following steps should be performed:
1. The (9, 7) is individually applied to each frame in the video sequence, at an resolution
level. Figure 4.3.a gives an example of , third decomposition level .
2. The coefficients belonging to the and low frequency sub-bands (blue-shaded in
Figure.4.3.b) are sorted in a decreasing order of their values. The largest coefficients in each frame are
(randomly) shuffled and then recorded into the vector.
3. The original locations of the vector components are stored into a vector.
Let now the numerical values involved in the video watermarking be precised.
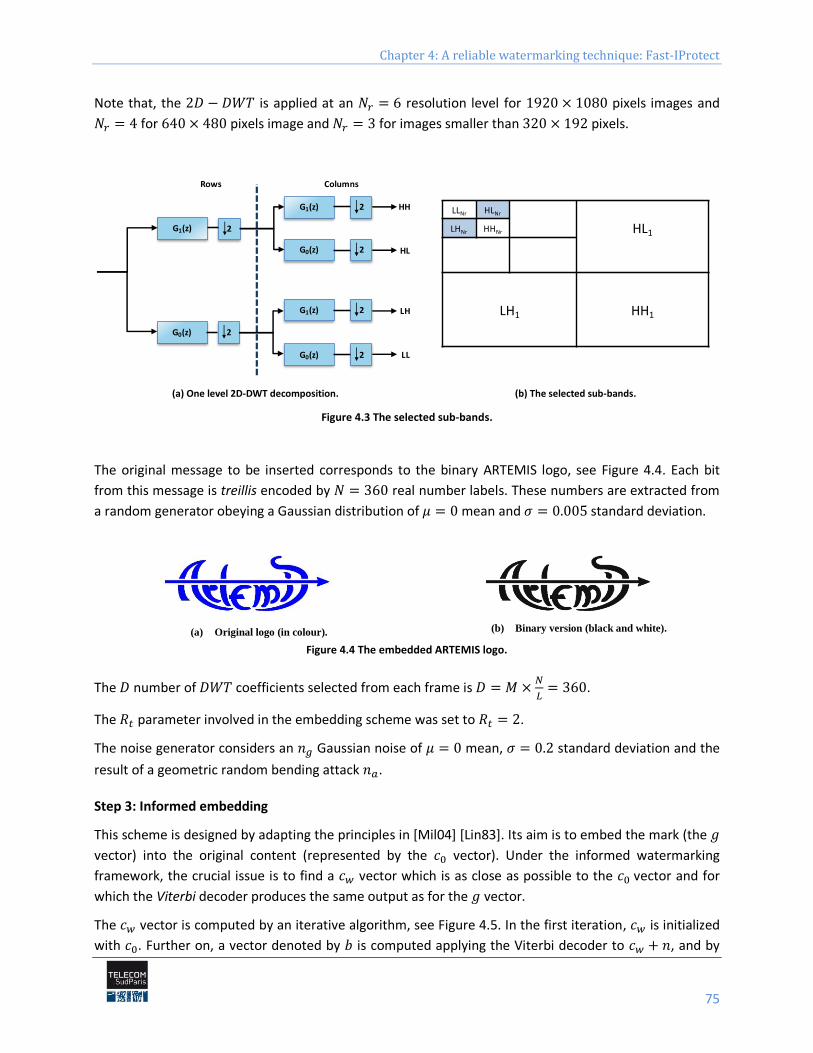
Chapter 4: A reliable watermarking technique: Fast-IProtect
75
Note that, the is applied at an resolution level for pixels images and
for pixels image and for images smaller than pixels.
(a) One level 2D-DWT decomposition. (b) The selected sub-bands.
Figure 4.3 The selected sub-bands.
The original message to be inserted corresponds to the binary ARTEMIS logo, see Figure 4.4. Each bit
from this message is treillis encoded by real number labels. These numbers are extracted from
a random generator obeying a Gaussian distribution of mean and standard deviation.
(a) Original logo (in colour). (b) Binary version (black and white).
Figure 4.4 The embedded ARTEMIS logo.
The number of coefficients selected from each frame is
.
The parameter involved in the embedding scheme was set to .
The noise generator considers an Gaussian noise of mean, standard deviation and the
result of a geometric random bending attack .
Step 3: Informed embedding
This scheme is designed by adapting the principles in [Mil04] [Lin83]. Its aim is to embed the mark (the
vector) into the original content (represented by the vector). Under the informed watermarking
framework, the crucial issue is to find a vector which is as close as possible to the vector and for
which the Viterbi decoder produces the same output as for the vector.
The vector is computed by an iterative algorithm, see Figure 4.5. In the first iteration, is initialized
with . Further on, a vector denoted by is computed applying the Viterbi decoder to , and by
G1(z)
G0(z)
G1(z)
G0(z)
G1(z)
G0(z)
Rows Columns
2
2
2
2
2
2
HH
HL
LL
LH
LLNr HLNr
HL1LHNr HHNr
LH1 HH1
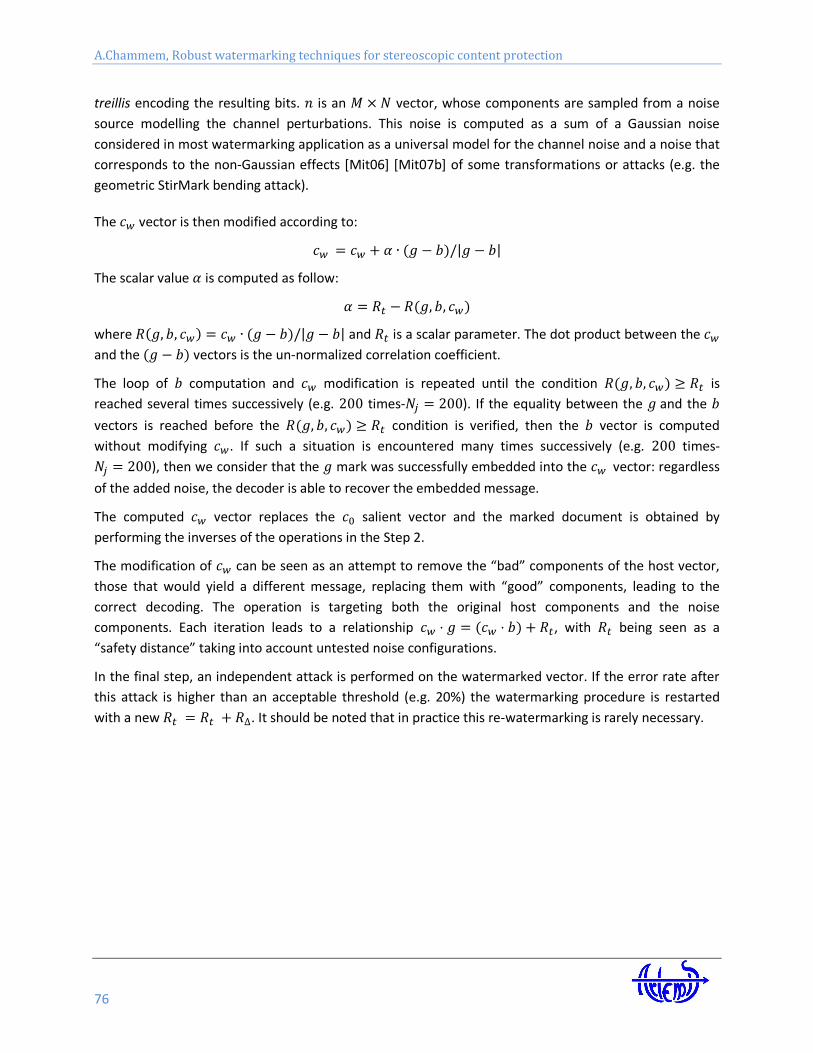
A.Chammem, Robust watermarking techniques for stereoscopic content protection
76
treillis encoding the resulting bits. is an vector, whose components are sampled from a noise
source modelling the channel perturbations. This noise is computed as a sum of a Gaussian noise
considered in most watermarking application as a universal model for the channel noise and a noise that
corresponds to the non-Gaussian effects [Mit06] [Mit07b] of some transformations or attacks (e.g. the
geometric StirMark bending attack).
The vector is then modified according to:
The scalar value is computed as follow:
where and is a scalar parameter. The dot product between the
and the vectors is the un-normalized correlation coefficient.
The loop of computation and modification is repeated until the condition is
reached several times successively (e.g. times- ). If the equality between the and the
vectors is reached before the condition is verified, then the vector is computed
without modifying . If such a situation is encountered many times successively (e.g. times-
), then we consider that the mark was successfully embedded into the vector: regardless
of the added noise, the decoder is able to recover the embedded message.
The computed vector replaces the salient vector and the marked document is obtained by
performing the inverses of the operations in the Step 2.
The modification of can be seen as an attempt to remove the “bad” components of the host vector,
those that would yield a different message, replacing them with “good” components, leading to the
correct decoding. The operation is targeting both the original host components and the noise
components. Each iteration leads to a relationship , with being seen as a
“safety distance” taking into account untested noise configurations.
In the final step, an independent attack is performed on the watermarked vector. If the error rate after
this attack is higher than an acceptable threshold (e.g. 20%) the watermarking procedure is restarted
with a new . It should be noted that in practice this re-watermarking is rarely necessary.
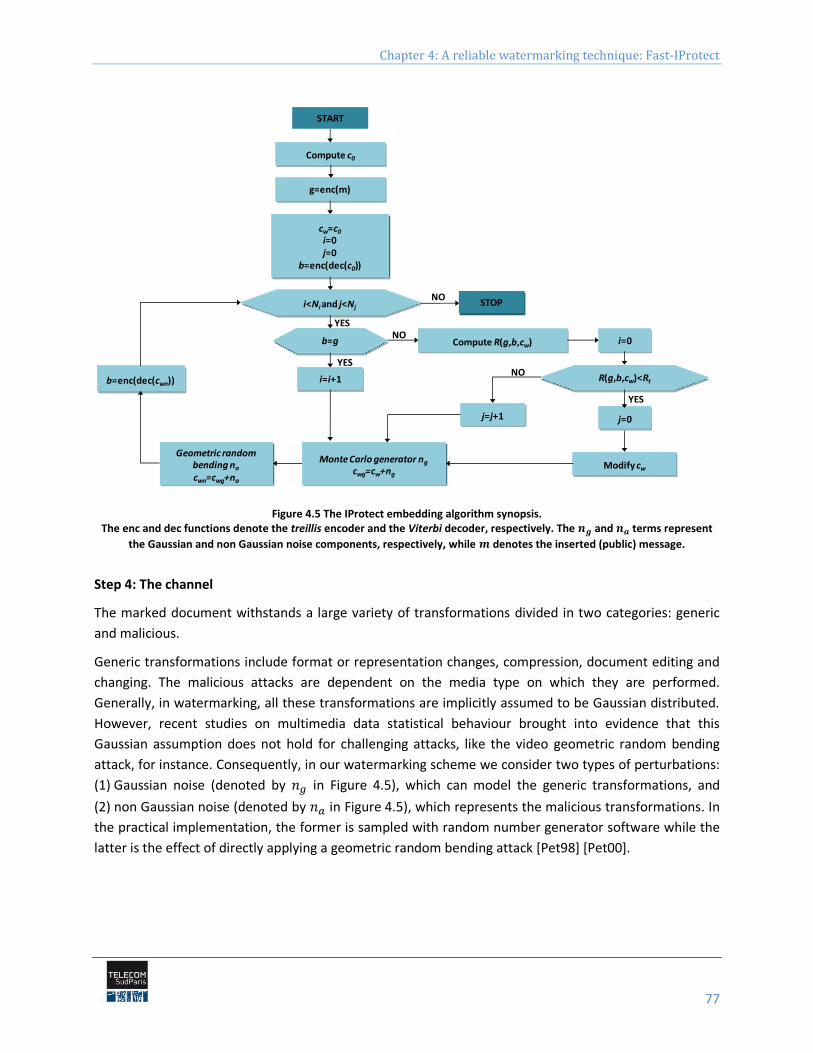
Chapter 4: A reliable watermarking technique: Fast-IProtect
77
Figure 4.5 The IProtect embedding algorithm synopsis. The enc and dec functions denote the treillis encoder and the Viterbi decoder, respectively. The and terms represent
the Gaussian and non Gaussian noise components, respectively, while denotes the inserted (public) message.
Step 4: The channel
The marked document withstands a large variety of transformations divided in two categories: generic
and malicious.
Generic transformations include format or representation changes, compression, document editing and
changing. The malicious attacks are dependent on the media type on which they are performed.
Generally, in watermarking, all these transformations are implicitly assumed to be Gaussian distributed.
However, recent studies on multimedia data statistical behaviour brought into evidence that this
Gaussian assumption does not hold for challenging attacks, like the video geometric random bending
attack, for instance. Consequently, in our watermarking scheme we consider two types of perturbations:
(1) Gaussian noise (denoted by in Figure 4.5), which can model the generic transformations, and
(2) non Gaussian noise (denoted by in Figure 4.5), which represents the malicious transformations. In
the practical implementation, the former is sampled with random number generator software while the
latter is the effect of directly applying a geometric random bending attack [Pet98] [Pet00].
Compute c0
g=enc(m)
cw=c0
i=0j=0
b=enc(dec(c0))
i<Ni and j<Nj
b=g Compute R(g,b,cw) i=0
R(g,b,cw)<Rti=i+1
j=j+1 j=0
Modify cwMonte Carlo generator ng
cwg=cw+ng
b=enc(dec(cwn))
STOP
START
YES
NO
YES
YES
NO
NO
Geometric random bending na
cwn=cwg+na
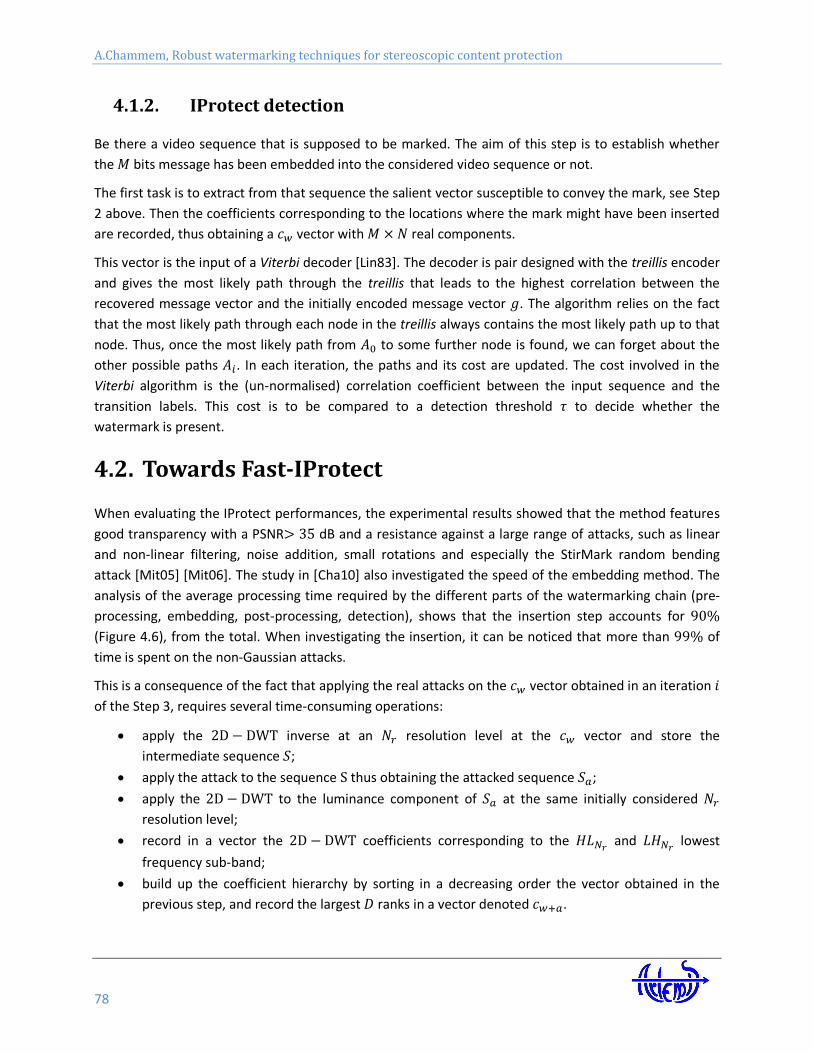
A.Chammem, Robust watermarking techniques for stereoscopic content protection
78
4.1.2. IProtect detection
Be there a video sequence that is supposed to be marked. The aim of this step is to establish whether
the bits message has been embedded into the considered video sequence or not.
The first task is to extract from that sequence the salient vector susceptible to convey the mark, see Step
2 above. Then the coefficients corresponding to the locations where the mark might have been inserted
are recorded, thus obtaining a vector with real components.
This vector is the input of a Viterbi decoder [Lin83]. The decoder is pair designed with the treillis encoder
and gives the most likely path through the treillis that leads to the highest correlation between the
recovered message vector and the initially encoded message vector . The algorithm relies on the fact
that the most likely path through each node in the treillis always contains the most likely path up to that
node. Thus, once the most likely path from to some further node is found, we can forget about the
other possible paths . In each iteration, the paths and its cost are updated. The cost involved in the
Viterbi algorithm is the (un-normalised) correlation coefficient between the input sequence and the
transition labels. This cost is to be compared to a detection threshold to decide whether the
watermark is present.
4.2. Towards Fast-IProtect
When evaluating the IProtect performances, the experimental results showed that the method features
good transparency with a PSNR dB and a resistance against a large range of attacks, such as linear
and non-linear filtering, noise addition, small rotations and especially the StirMark random bending
attack [Mit05] [Mit06]. The study in [Cha10] also investigated the speed of the embedding method. The
analysis of the average processing time required by the different parts of the watermarking chain (pre-
processing, embedding, post-processing, detection), shows that the insertion step accounts for
(Figure 4.6), from the total. When investigating the insertion, it can be noticed that more than of
time is spent on the non-Gaussian attacks.
This is a consequence of the fact that applying the real attacks on the vector obtained in an iteration
of the Step 3, requires several time-consuming operations:
apply the inverse at an resolution level at the vector and store the
intermediate sequence ;
apply the attack to the sequence thus obtaining the attacked sequence ;
apply the to the luminance component of at the same initially considered
resolution level;
record in a vector the coefficients corresponding to the and lowest
frequency sub-band;
build up the coefficient hierarchy by sorting in a decreasing order the vector obtained in the
previous step, and record the largest ranks in a vector denoted .
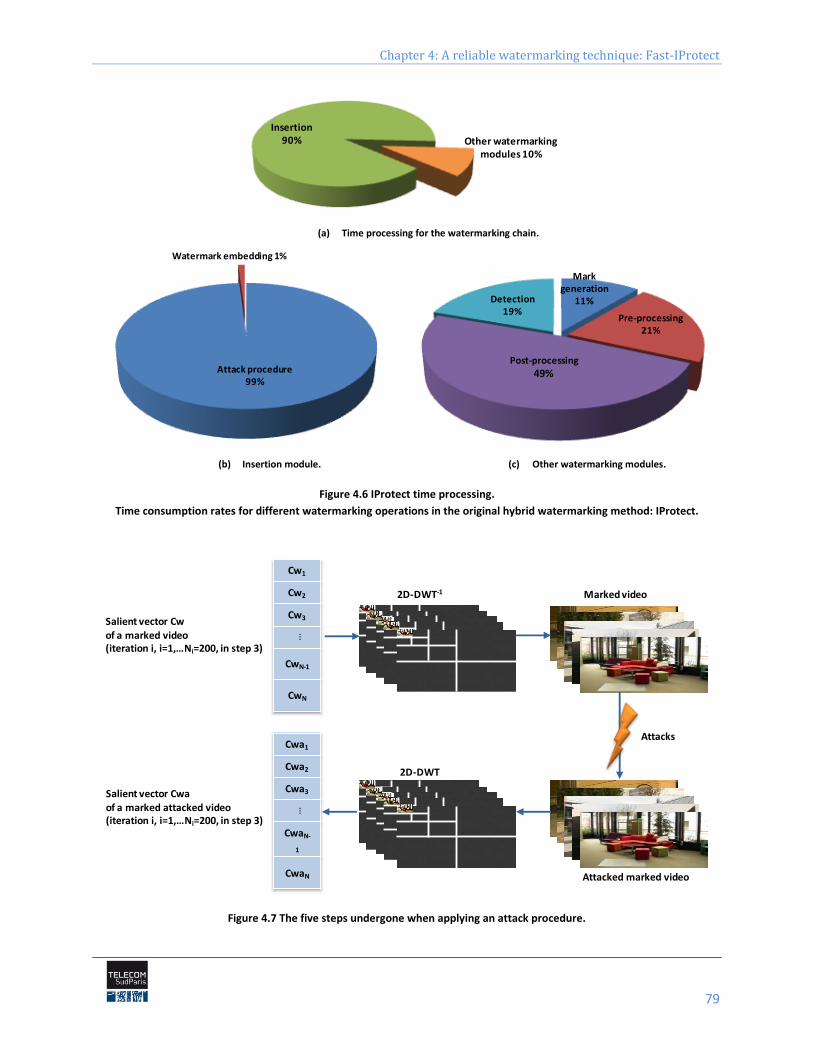
Chapter 4: A reliable watermarking technique: Fast-IProtect
79
(a) Time processing for the watermarking chain.
(b) Insertion module. (c) Other watermarking modules.
Figure 4.6 IProtect time processing.
Time consumption rates for different watermarking operations in the original hybrid watermarking method: IProtect.
Figure 4.7 The five steps undergone when applying an attack procedure.
Insertion 90% Other watermarking
modules 10%
Watermark embedding 1%
Attack procedure99%
Mark generation
11%Detection 19%
Pre-processing21%
Post-processing
49%
Salient vector Cwof a marked video(iteration i, i=1,…Ni=200, in step 3)
Marked video
Cw1
Cw2
Cw3
…
CwN-1
CwN
2D-DWT-1
2D-DWT
Attacked marked video
AttacksCwa1
Cwa2
Cwa3
…
CwaN-
1
CwaN
Salient vector Cwa of a marked attacked video(iteration i, i=1,…Ni=200, in step 3)
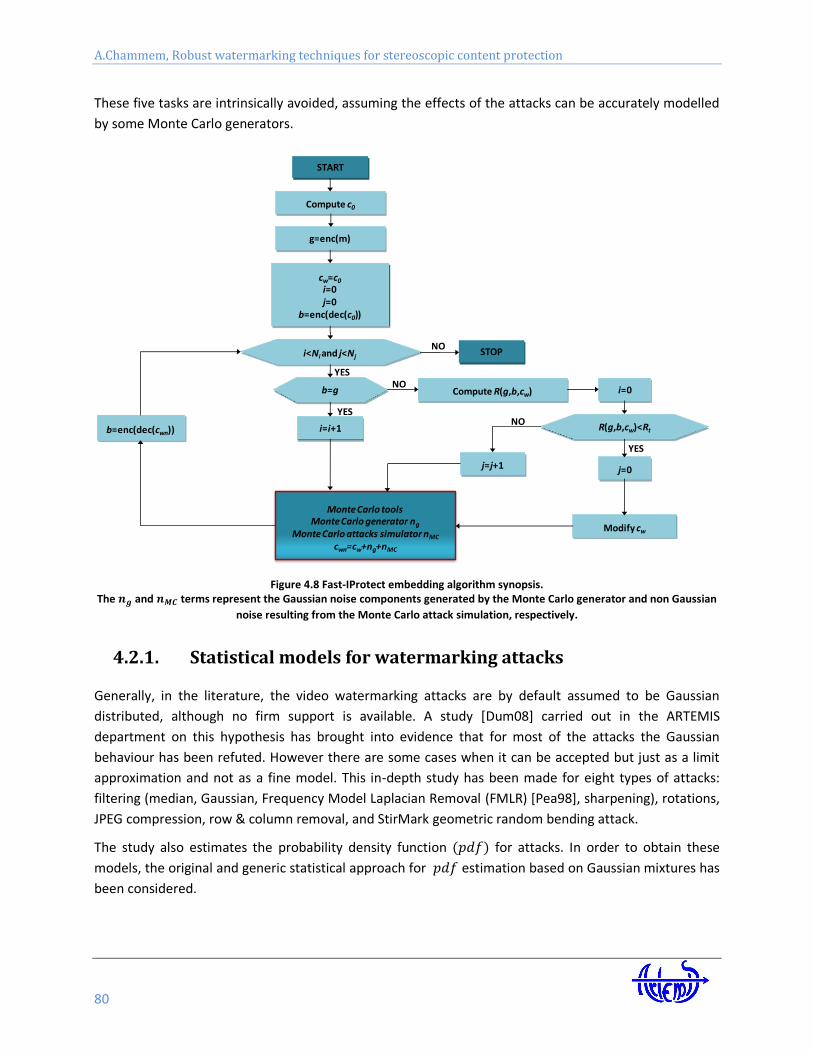
A.Chammem, Robust watermarking techniques for stereoscopic content protection
80
These five tasks are intrinsically avoided, assuming the effects of the attacks can be accurately modelled
by some Monte Carlo generators.
Figure 4.8 Fast-IProtect embedding algorithm synopsis. The and terms represent the Gaussian noise components generated by the Monte Carlo generator and non Gaussian
noise resulting from the Monte Carlo attack simulation, respectively.
4.2.1. Statistical models for watermarking attacks
Generally, in the literature, the video watermarking attacks are by default assumed to be Gaussian
distributed, although no firm support is available. A study [Dum08] carried out in the ARTEMIS
department on this hypothesis has brought into evidence that for most of the attacks the Gaussian
behaviour has been refuted. However there are some cases when it can be accepted but just as a limit
approximation and not as a fine model. This in-depth study has been made for eight types of attacks:
filtering (median, Gaussian, Frequency Model Laplacian Removal (FMLR) [Pea98], sharpening), rotations,
JPEG compression, row & column removal, and StirMark geometric random bending attack.
The study also estimates the probability density function for attacks. In order to obtain these
models, the original and generic statistical approach for estimation based on Gaussian mixtures has
been considered.
Compute c0
g=enc(m)
cw=c0
i=0j=0
b=enc(dec(c0))
i<Ni and j<Nj
b=g Compute R(g,b,cw) i=0
R(g,b,cw)<Rti=i+1
j=j+1 j=0
Modify cw
Monte Carlo toolsMonte Carlo generator ng
Monte Carlo attacks simulator nMC
cwn=cw+ng+nMC
b=enc(dec(cwn))
STOP
START
YES
NO
YES
YES
NO
NO
Chapter 4: A reliable watermarking technique: Fast-IProtect
81
Finite Gaussian mixture can approximate any continuous , provided the model has a sufficient
number of components and provided the parameters of the model are chosen correctly [Bis95]. The true
is approximated by a linear combination of component densities:
In this equation is the probability of given the component distribution and are the
mixture proportions or weights. The weights are non-negative and sum up to one. A popular technique
for approximating iteratively the maximum likelihood estimates of the model parameters
is the Expectation-Maximization (EM) algorithm [Dem77]. The likelihood function is
given by:
Maximizing the likelihood function is equivalent to finding the most probable estimate provided the
data set. The operates in two stages. First, in the , the expected value of some unobserved
data are the data labels of the samples. They correspond to the identification number of the different
mixture components and specify which one generated each datum. Subsequently, during the ,
they are used to update the model parameters accordingly. Each iteration step can be summarized as
follows [Pee00]:
a) E-step,
b) M-step,
c)
d)
Table 4.1 gives an exemple of statistical models for some watermarking attacks (i.e. Gaussian filtering,
sharpening and Stirmark random bending) in the (9,7) DWT hierarchy.
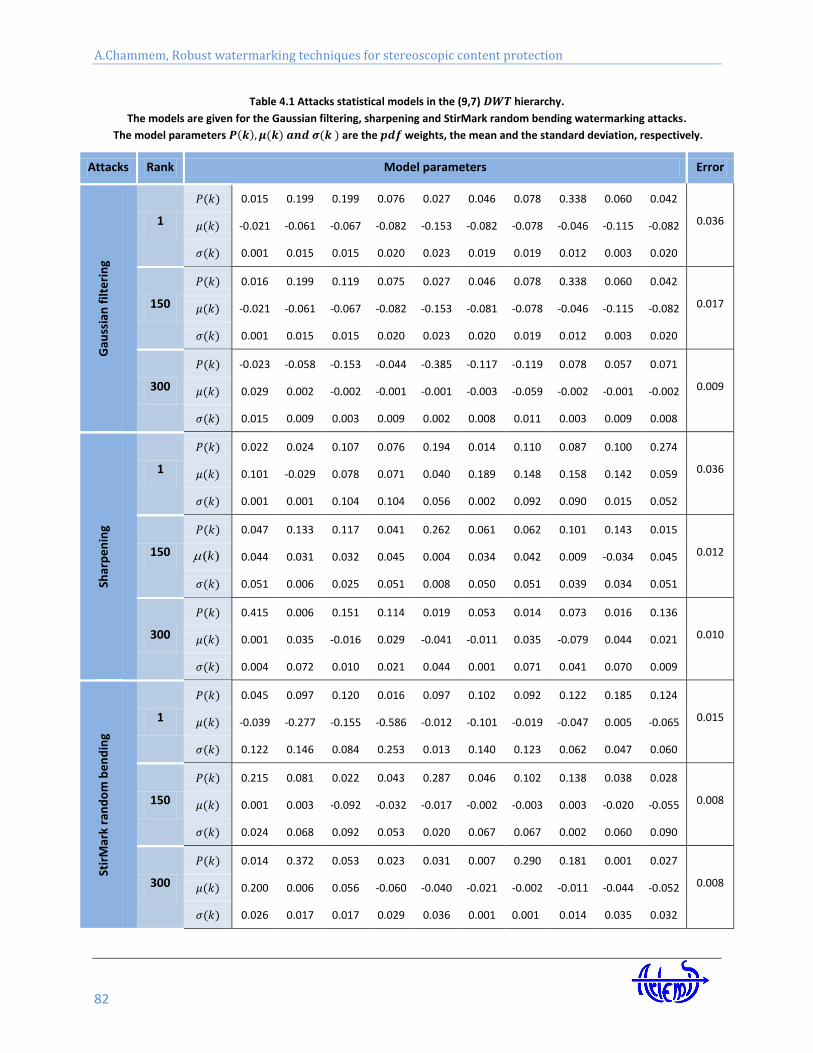
A.Chammem, Robust watermarking techniques for stereoscopic content protection
82
Table 4.1 Attacks statistical models in the (9,7) hierarchy.
The models are given for the Gaussian filtering, sharpening and StirMark random bending watermarking attacks.
The model parameters are the weights, the mean and the standard deviation, respectively.
Attacks Rank Model parameters Error
Gau
ssia
n f
ilte
rin
g
1
0.015 0.199 0.199 0.076 0.027 0.046 0.078 0.338 0.060 0.042
0.036 -0.021 -0.061 -0.067 -0.082 -0.153 -0.082 -0.078 -0.046 -0.115 -0.082
0.001 0.015 0.015 0.020 0.023 0.019 0.019 0.012 0.003 0.020
150
0.016 0.199 0.119 0.075 0.027 0.046 0.078 0.338 0.060 0.042
0.017 -0.021 -0.061 -0.067 -0.082 -0.153 -0.081 -0.078 -0.046 -0.115 -0.082
0.001 0.015 0.015 0.020 0.023 0.020 0.019 0.012 0.003 0.020
300
-0.023 -0.058 -0.153 -0.044 -0.385 -0.117 -0.119 0.078 0.057 0.071
0.009 0.029 0.002 -0.002 -0.001 -0.001 -0.003 -0.059 -0.002 -0.001 -0.002
0.015 0.009 0.003 0.009 0.002 0.008 0.011 0.003 0.009 0.008
Shar
pe
nin
g
1
0.022 0.024 0.107 0.076 0.194 0.014 0.110 0.087 0.100 0.274
0.036 0.101 -0.029 0.078 0.071 0.040 0.189 0.148 0.158 0.142 0.059
0.001 0.001 0.104 0.104 0.056 0.002 0.092 0.090 0.015 0.052
150
0.047 0.133 0.117 0.041 0.262 0.061 0.062 0.101 0.143 0.015
0.012 0.044 0.031 0.032 0.045 0.004 0.034 0.042 0.009 -0.034 0.045
0.051 0.006 0.025 0.051 0.008 0.050 0.051 0.039 0.034 0.051
300
0.415 0.006 0.151 0.114 0.019 0.053 0.014 0.073 0.016 0.136
0.010 0.001 0.035 -0.016 0.029 -0.041 -0.011 0.035 -0.079 0.044 0.021
0.004 0.072 0.010 0.021 0.044 0.001 0.071 0.041 0.070 0.009
Stir
Mar
k ra
nd
om
be
nd
ing
1
0.045 0.097 0.120 0.016 0.097 0.102 0.092 0.122 0.185 0.124
0.015 -0.039 -0.277 -0.155 -0.586 -0.012 -0.101 -0.019 -0.047 0.005 -0.065
0.122 0.146 0.084 0.253 0.013 0.140 0.123 0.062 0.047 0.060
150
0.215 0.081 0.022 0.043 0.287 0.046 0.102 0.138 0.038 0.028
0.008 0.001 0.003 -0.092 -0.032 -0.017 -0.002 -0.003 0.003 -0.020 -0.055
0.024 0.068 0.092 0.053 0.020 0.067 0.067 0.002 0.060 0.090
300
0.014 0.372 0.053 0.023 0.031 0.007 0.290 0.181 0.001 0.027
0.008 0.200 0.006 0.056 -0.060 -0.040 -0.021 -0.002 -0.011 -0.044 -0.052
0.026 0.017 0.017 0.029 0.036 0.001 0.001 0.014 0.035 0.032
)(k
Chapter 4: A reliable watermarking technique: Fast-IProtect
83
4.2.2. Monte Carlo simulation for watermarking attacks
The simulation of a random variable with known probability law is generally achieved by inverting the
corresponding cumulative distribution function ( ). This inversion method is based upon the following
theorem:
Be there a one-to-one mapping and be a random variable defined on a given probability
field; than, the random variable will be defined on the same probability field and will be
characterised by the following :
When considering the particular case of , i.e. when the transform function is the very
of , becomes uniform distributed.
From the practical point of view, this means that arbitrary random variables of can be
simulated by applying to a uniform random variable a transform described by :
.
Although very simple from the conceptual point of view, this method cannot be directly deployed in the
watermarking case, where the attack statistical models are available as finite Gaussian mixtures. On the
one hand, in such a case, the cannot be analytically computed. On the other hand, the
numerical computation should be properly handled, as it requires integral evaluation and function
inversions. Consequently, the Monte Carlo generator developed in our study follows a different
approach: It is based on the very principle of the finite Gaussian mixture: which combines two random
phenomena: the choice of a Gaussian law among the composing the mixture then the selection of one
value for that law.

A.Chammem, Robust watermarking techniques for stereoscopic content protection
84
From the applicative point of view, to apply the attacks effects on the vector obtained in the
iteration of step 3 of Chapter 4.1.1, the following steps are to be performed:
Step1 Parameters initialization
Step1.1 Global parameters
The attacked and watermarked vector size , a new vector representing the
attack component is created.
Step1.2 Component index initialization
Component index
Gaussian pdf index k=0
Step2 Watermarked and attacked vector computation
WHILE DO:
Step2.1 Attack components computation
Step2.1.1 pdf selection
Generate a uniform random number denoted by , where
IF THEN
ELSE
FOR
IF
THEN .
Step2.1.2 Gaussian Mixture sample estimation
Generate two uniform random numbers and , where and
Be and the selected parameters. The component
is:
Step2.2 computation
Step3 Exit condition
IF THEN STOP
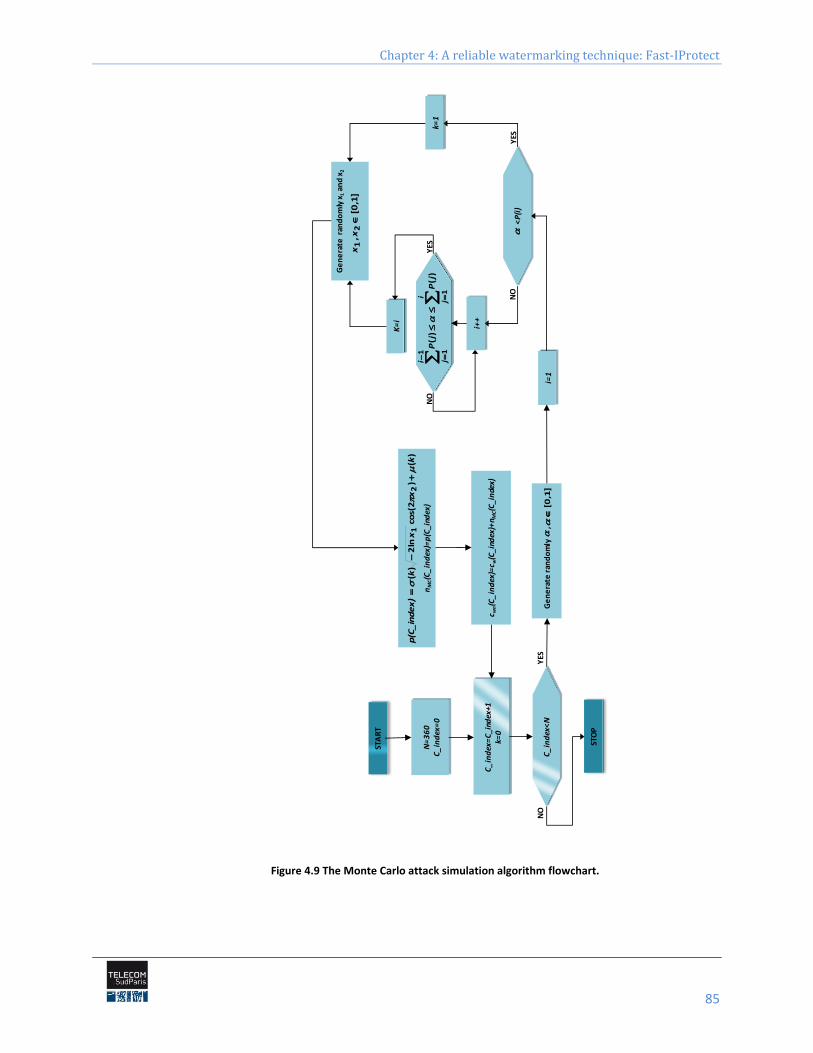
Chapter 4: A reliable watermarking technique: Fast-IProtect
85
Figure 4.9 The Monte Carlo attack simulation algorithm flowchart.
C_
ind
ex=
C_i
ndex
+1k=
0
N=
36
0C
_in
dex
=0
C_
ind
ex<
N
STA
RT
NO
STO
P
Ge
ne
rate
ran
do
mly
,
.
]1,
0[
<P
(i)
Y
ES
NO
k=1
i
j
i j
jP
jP
1
1 1
)(
)(
Y
ES
K=
i
i++
Ge
ne
rate
ran
do
mly
x1
and
x2
]1,
0[,
21
x
x
c wn(C
_in
dex
)=c w
(C_i
ndex
)+n M
C(C
_in
dex)
nM
C(C
_in
dex
)=p
(C_i
ndex
)
)(
)2
cos(
ln2
)(
21
kx
xk
p(C
_in
de
x)
NO
i=1
YES
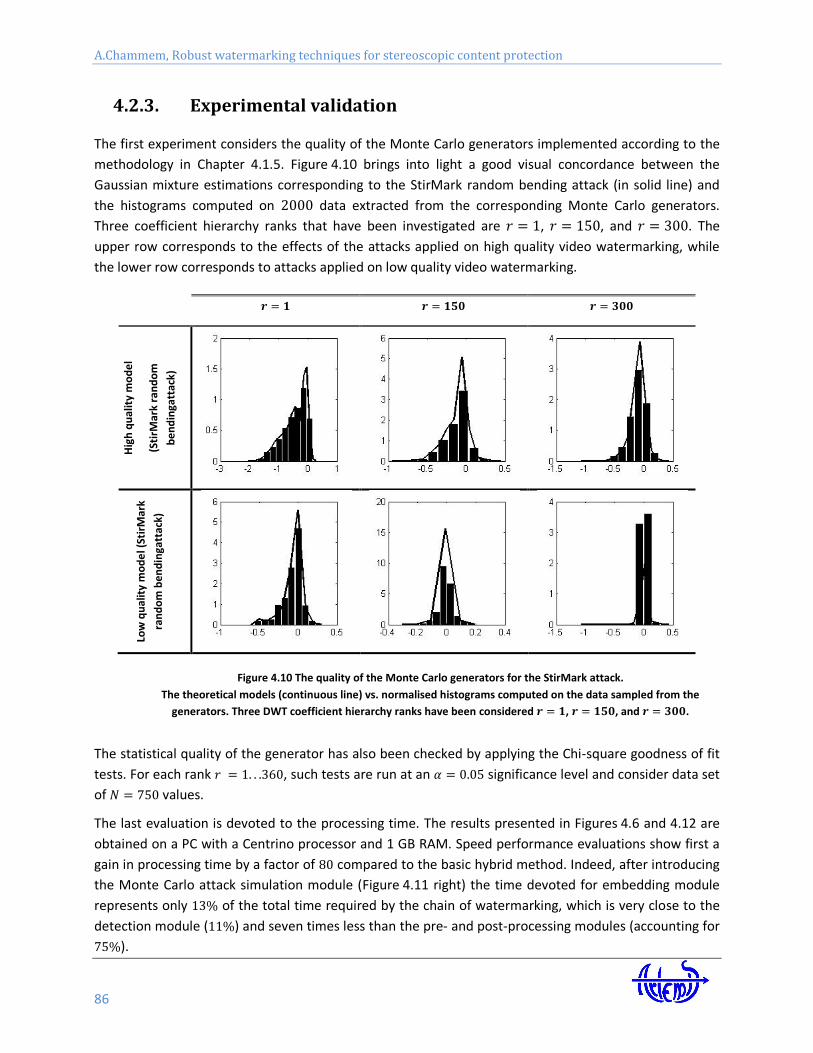
A.Chammem, Robust watermarking techniques for stereoscopic content protection
86
4.2.3. Experimental validation
The first experiment considers the quality of the Monte Carlo generators implemented according to the
methodology in Chapter 4.1.5. Figure 4.10 brings into light a good visual concordance between the
Gaussian mixture estimations corresponding to the StirMark random bending attack (in solid line) and
the histograms computed on data extracted from the corresponding Monte Carlo generators.
Three coefficient hierarchy ranks that have been investigated are , , and . The
upper row corresponds to the effects of the attacks applied on high quality video watermarking, while
the lower row corresponds to attacks applied on low quality video watermarking.
Hig
h q
ual
ity
mo
de
l
(Sti
rMar
k ra
nd
om
be
nd
inga
ttac
k)
Low
qu
alit
y m
od
el (
Stir
Mar
k
ran
do
m b
en
din
gatt
ack)
Figure 4.10 The quality of the Monte Carlo generators for the StirMark attack.
The theoretical models (continuous line) vs. normalised histograms computed on the data sampled from the
generators. Three DWT coefficient hierarchy ranks have been considered , , and .
The statistical quality of the generator has also been checked by applying the Chi-square goodness of fit
tests. For each rank , such tests are run at an significance level and consider data set
of values.
The last evaluation is devoted to the processing time. The results presented in Figures 4.6 and 4.12 are
obtained on a PC with a Centrino processor and 1 GB RAM. Speed performance evaluations show first a
gain in processing time by a factor of compared to the basic hybrid method. Indeed, after introducing
the Monte Carlo attack simulation module (Figure 4.11 right) the time devoted for embedding module
represents only of the total time required by the chain of watermarking, which is very close to the
detection module ( ) and seven times less than the pre- and post-processing modules (accounting for
).
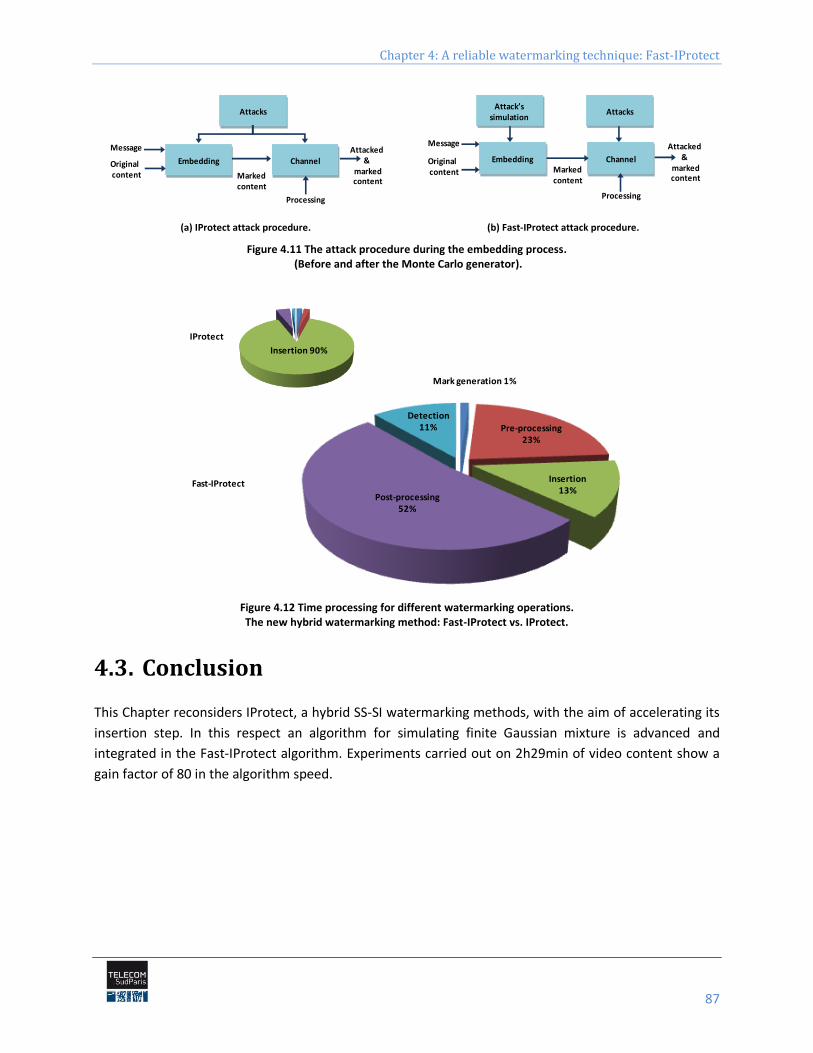
Chapter 4: A reliable watermarking technique: Fast-IProtect
87
(a) IProtect attack procedure. (b) Fast-IProtect attack procedure.
Figure 4.11 The attack procedure during the embedding process. (Before and after the Monte Carlo generator).
Figure 4.12 Time processing for different watermarking operations. The new hybrid watermarking method: Fast-IProtect vs. IProtect.
4.3. Conclusion
This Chapter reconsiders IProtect, a hybrid SS-SI watermarking methods, with the aim of accelerating its
insertion step. In this respect an algorithm for simulating finite Gaussian mixture is advanced and
integrated in the Fast-IProtect algorithm. Experiments carried out on 2h29min of video content show a
gain factor of 80 in the algorithm speed.
Embedding Channel
Message Attacked &
markedcontent
Processing
Attacks
Originalcontent Marked
contentProcessing
Embedding Channel
Message Attacked &
markedcontent
Attack’ssimulation
Originalcontent Marked
content
Attacks
Mark generation 1%
Pre-processing 23%
Insertion 13%
Post-processing52%
Detection 11%
IProtect
Fast-IProtect
Insertion 90%

Chapter 5 Stereoscopic watermarking benchmark
A.Chammem, Robust watermarking techniques for stereoscopic content protection
90
Abstract
In this Chapter, a comparative study on the main classes of 2D inherited watermarking methods and on
their related optimal stereoscopic insertion domains is carried out. Four insertion methods are
considered; they belong to the SS, SI (binary QIM and 5-symbols QIM) and hybrid (Fast-IProtect) families.
First, this Chapter describes the experimental protocol. Second, it presents the obtained results. Thirdly, it
discusses the benchmarked methods performances. It was thus demonstrated that Fast-IProtect applied
on the 3DV-NTSS is the best solution because it is the only insertion method ensuring: (1) the
imperceptibility of the watermark according to subjective tests and objective metrics with limits PSNR>
35dB and IF, NCC, SC and SSIM larger than ; (2) robustness expressed by BER lower than after
filtering and JPEG compression and lower than after the geometric random bending attacks. Finally,
Fast-IProtect features a non-prohibitive computational complexity, compatible to real time applications.
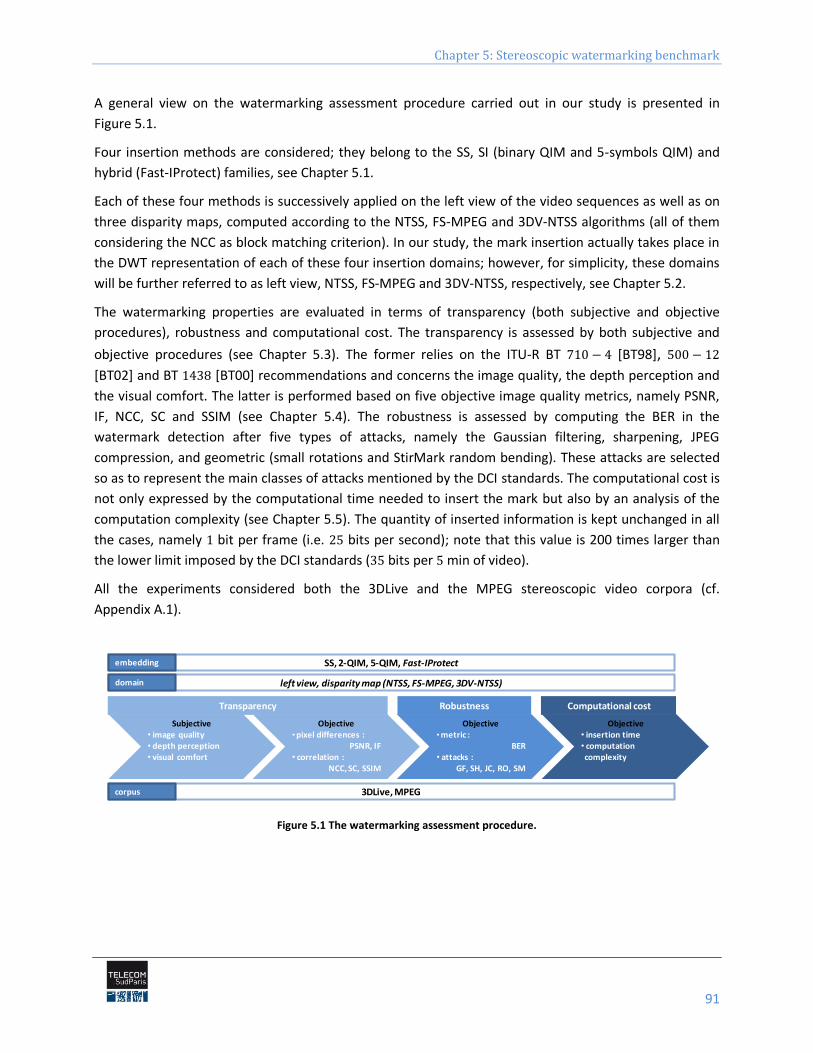
Chapter 5: Stereoscopic watermarking benchmark
91
A general view on the watermarking assessment procedure carried out in our study is presented in
Figure 5.1.
Four insertion methods are considered; they belong to the SS, SI (binary QIM and 5-symbols QIM) and
hybrid (Fast-IProtect) families, see Chapter 5.1.
Each of these four methods is successively applied on the left view of the video sequences as well as on
three disparity maps, computed according to the NTSS, FS-MPEG and 3DV-NTSS algorithms (all of them
considering the NCC as block matching criterion). In our study, the mark insertion actually takes place in
the DWT representation of each of these four insertion domains; however, for simplicity, these domains
will be further referred to as left view, NTSS, FS-MPEG and 3DV-NTSS, respectively, see Chapter 5.2.
The watermarking properties are evaluated in terms of transparency (both subjective and objective
procedures), robustness and computational cost. The transparency is assessed by both subjective and
objective procedures (see Chapter 5.3). The former relies on the ITU-R BT [BT98],
[BT02] and BT [BT00] recommendations and concerns the image quality, the depth perception and
the visual comfort. The latter is performed based on five objective image quality metrics, namely PSNR,
IF, NCC, SC and SSIM (see Chapter 5.4). The robustness is assessed by computing the BER in the
watermark detection after five types of attacks, namely the Gaussian filtering, sharpening, JPEG
compression, and geometric (small rotations and StirMark random bending). These attacks are selected
so as to represent the main classes of attacks mentioned by the DCI standards. The computational cost is
not only expressed by the computational time needed to insert the mark but also by an analysis of the
computation complexity (see Chapter 5.5). The quantity of inserted information is kept unchanged in all
the cases, namely bit per frame (i.e. bits per second); note that this value is 200 times larger than
the lower limit imposed by the DCI standards ( bits per min of video).
All the experiments considered both the 3DLive and the MPEG stereoscopic video corpora (cf.
Appendix A.1).
Figure 5.1 The watermarking assessment procedure.
Subjective• image quality• depth perception • visual comfort
Objective•pixel differences :
PSNR, IF• correlation :
NCC, SC, SSIM
Objective •metric :
BER• attacks :
GF, SH, JC, RO, SM
Objective• insertion time• computationcomplexity
3DLive, MPEG
SS, 2-QIM, 5-QIM, Fast-IProtect
left view, disparity map (NTSS, FS-MPEG, 3DV-NTSS)
Transparency Robustness Computational cost
corpus
embedding
domain
A.Chammem, Robust watermarking techniques for stereoscopic content protection
92
5.1. Embedding procedure
The embedding procedure in our study inserts the watermark in the 2D-DWT coefficients of the
stereoscopic content. The insertion is performed according to the four pre-mentioned insertion
methods: SS, binary QIM (referred to 2-QIM), 5-symbols QIM (referred to 5-QIM) and Fast-IProtect, see
Appendix A.2 and Chapter 4. All these insertion methods have the same input, the salient vector
extracted from the original video sequence to be watermarked.
The salient vector computation algorithm is given by:
Step 1 Parameter initialization
The DWT resolution level , Number of frames , the size of the salient vector extracted from
each frame Size_ ,
Step 2 Video salient vector computation
WHILE Do
Step 2.1 Coefficients extraction
Apply the (9, 7) at the resolution level.
Extract the coefficients belonging to the and low frequency sub-bands and store
them in a vector
Sort in a decreasing order the components.
Step 2.2 Coefficients storage
The largest Size_ coefficients from are (randomly) shuffled and then recorded into the
vector.
The original locations of the vector components are stored into a vector.
The considered insertion techniques have different parameters setting, whose values are synoptically
displayed in Table 5.1.
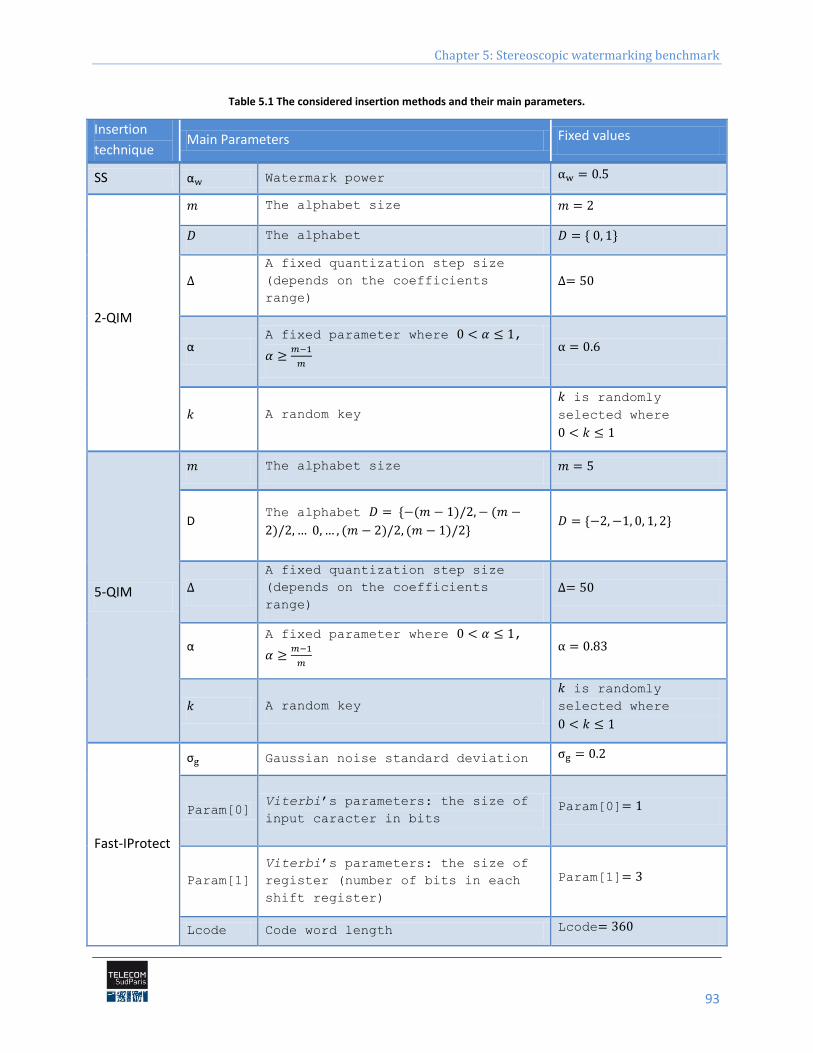
Chapter 5: Stereoscopic watermarking benchmark
93
Table 5.1 The considered insertion methods and their main parameters.
Insertion
technique Main Parameters Fixed values
SS Watermark power
2-QIM
The alphabet size
The alphabet
A fixed quantization step size
(depends on the coefficients
range)
A fixed parameter where ,
A random key
is randomly
selected where
5-QIM
The alphabet size
D The alphabet
A fixed quantization step size
(depends on the coefficients
range)
A fixed parameter where ,
A random key
is randomly
selected where
Fast-IProtect
Gaussian noise standard deviation
Param[0] Viterbi’s parameters: the size of
input caracter in bits Param[0]
Param[1]
Viterbi’s parameters: the size of
register (number of bits in each
shift register)
Param[1]
Lcode Code word length Lcode
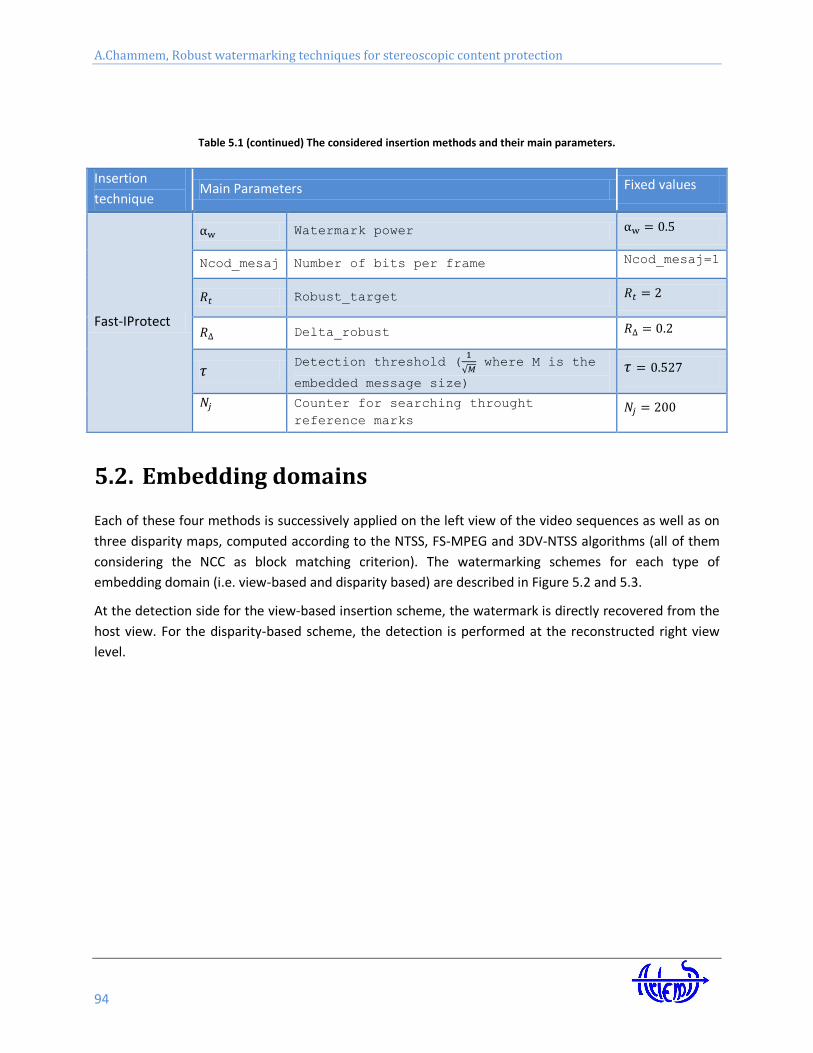
A.Chammem, Robust watermarking techniques for stereoscopic content protection
94
Table 5.1 (continued) The considered insertion methods and their main parameters.
Insertion
technique Main Parameters Fixed values
Fast-IProtect
Watermark power
Ncod_mesaj Number of bits per frame Ncod_mesaj=1
Robust_target
Delta_robust
Detection threshold (
where M is the
embedded message size)
Counter for searching throught
reference marks
5.2. Embedding domains
Each of these four methods is successively applied on the left view of the video sequences as well as on
three disparity maps, computed according to the NTSS, FS-MPEG and 3DV-NTSS algorithms (all of them
considering the NCC as block matching criterion). The watermarking schemes for each type of
embedding domain (i.e. view-based and disparity based) are described in Figure 5.2 and 5.3.
At the detection side for the view-based insertion scheme, the watermark is directly recovered from the
host view. For the disparity-based scheme, the detection is performed at the reconstructed right view
level.
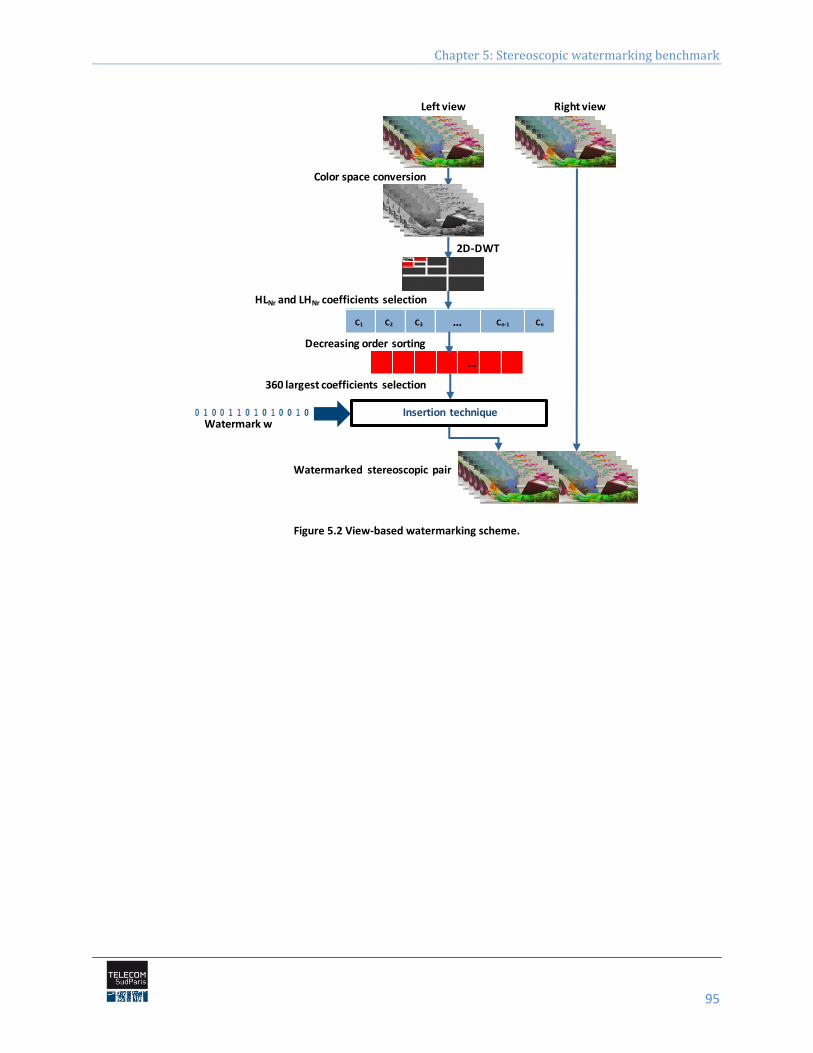
Chapter 5: Stereoscopic watermarking benchmark
95
Figure 5.2 View-based watermarking scheme.
2D-DWT
Color space conversion
Watermark w
HLNr and LHNr coefficients selection
Decreasing order sorting
C1 C2 C3 … Cn-1 Cn
…
360 largest coefficients selection
Left view Right view
Watermarked stereoscopic pair
Insertion technique
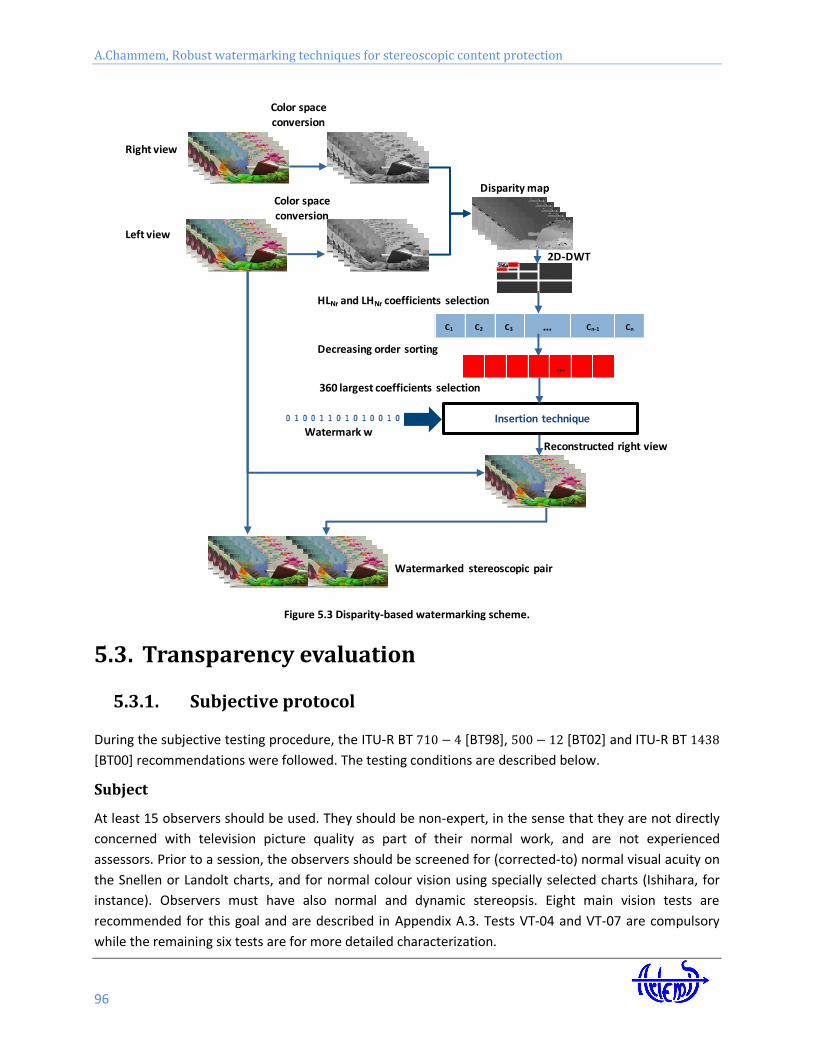
A.Chammem, Robust watermarking techniques for stereoscopic content protection
96
Figure 5.3 Disparity-based watermarking scheme.
5.3. Transparency evaluation
5.3.1. Subjective protocol
During the subjective testing procedure, the ITU-R BT [BT98], [BT02] and ITU-R BT
[BT00] recommendations were followed. The testing conditions are described below.
Subject
At least 15 observers should be used. They should be non-expert, in the sense that they are not directly
concerned with television picture quality as part of their normal work, and are not experienced
assessors. Prior to a session, the observers should be screened for (corrected-to) normal visual acuity on
the Snellen or Landolt charts, and for normal colour vision using specially selected charts (Ishihara, for
instance). Observers must have also normal and dynamic stereopsis. Eight main vision tests are
recommended for this goal and are described in Appendix A.3. Tests VT-04 and VT-07 are compulsory
while the remaining six tests are for more detailed characterization.
Insertion technique
Color space
conversion
Watermark w
Color spaceconversion
Disparity map
2D-DWT
HLNr and LHNr coefficients selection
Decreasing order sorting
C1 C2 C3 … Cn-1 Cn
…
360 largest coefficients selection
Watermarked stereoscopic pair
Left view
Right view
Reconstructed right view
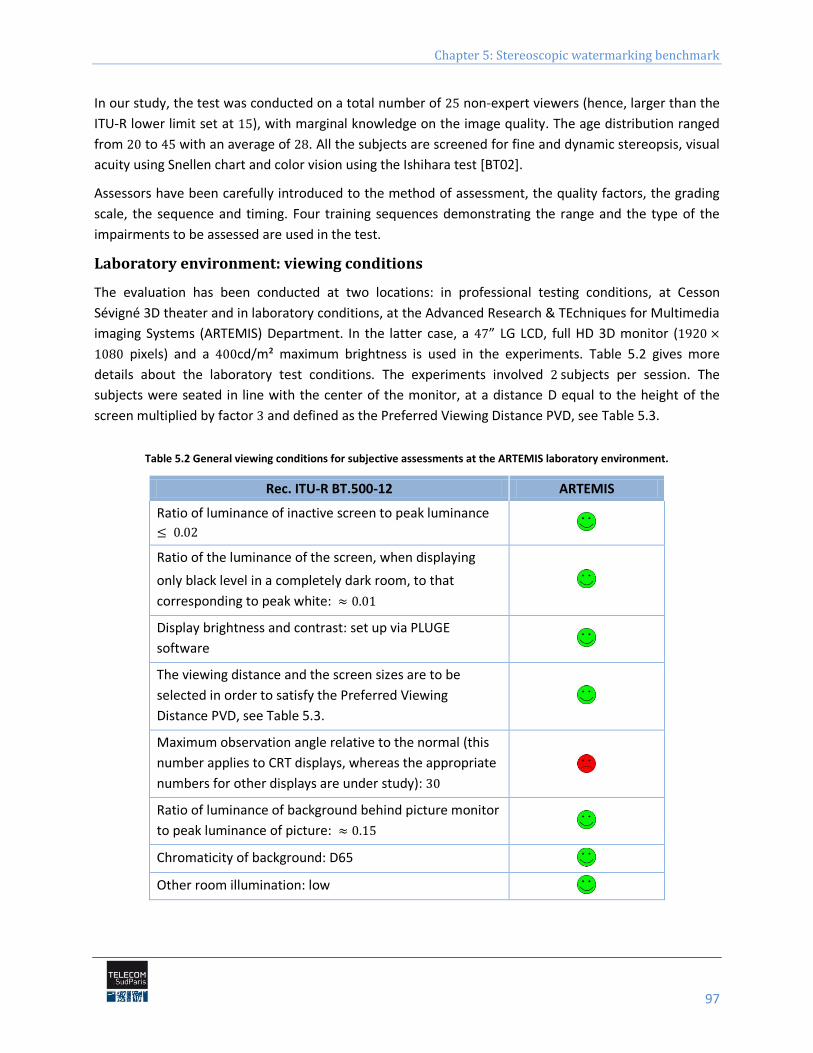
Chapter 5: Stereoscopic watermarking benchmark
97
In our study, the test was conducted on a total number of non-expert viewers (hence, larger than the
ITU-R lower limit set at ), with marginal knowledge on the image quality. The age distribution ranged
from to with an average of . All the subjects are screened for fine and dynamic stereopsis, visual
acuity using Snellen chart and color vision using the Ishihara test [BT02].
Assessors have been carefully introduced to the method of assessment, the quality factors, the grading
scale, the sequence and timing. Four training sequences demonstrating the range and the type of the
impairments to be assessed are used in the test.
Laboratory environment: viewing conditions
The evaluation has been conducted at two locations: in professional testing conditions, at Cesson
Sévigné 3D theater and in laboratory conditions, at the Advanced Research & TEchniques for Multimedia
imaging Systems (ARTEMIS) Department. In the latter case, a ” LG LCD, full HD 3D monitor (
pixels) and a cd/m² maximum brightness is used in the experiments. Table 5.2 gives more
details about the laboratory test conditions. The experiments involved subjects per session. The
subjects were seated in line with the center of the monitor, at a distance D equal to the height of the
screen multiplied by factor and defined as the Preferred Viewing Distance PVD, see Table 5.3.
Table 5.2 General viewing conditions for subjective assessments at the ARTEMIS laboratory environment.
Rec. ITU-R BT.500-12 ARTEMIS
Ratio of luminance of inactive screen to peak luminance
Ratio of the luminance of the screen, when displaying
only black level in a completely dark room, to that
corresponding to peak white:
Display brightness and contrast: set up via PLUGE
software
The viewing distance and the screen sizes are to be
selected in order to satisfy the Preferred Viewing
Distance PVD, see Table 5.3.
Maximum observation angle relative to the normal (this
number applies to CRT displays, whereas the appropriate
numbers for other displays are under study):
Ratio of luminance of background behind picture monitor
to peak luminance of picture:
Chromaticity of background: D65
Other room illumination: low
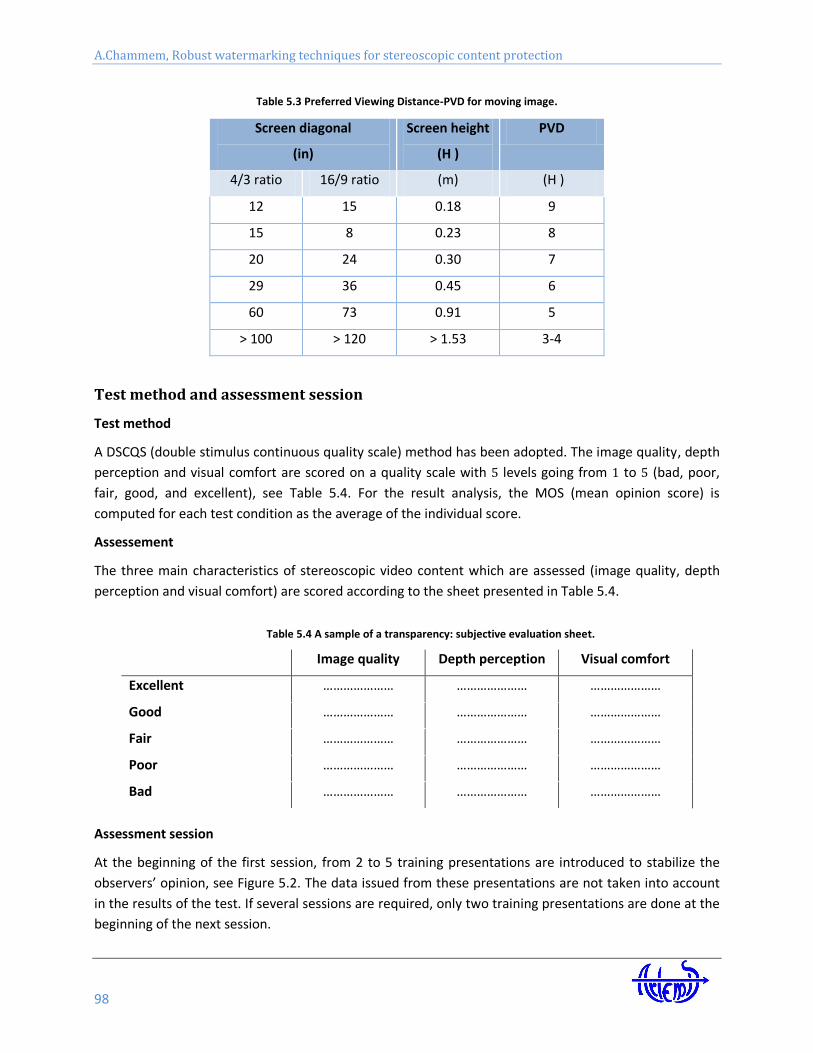
A.Chammem, Robust watermarking techniques for stereoscopic content protection
98
Table 5.3 Preferred Viewing Distance-PVD for moving image.
Screen diagonal
(in)
Screen height
(H )
PVD
4/3 ratio 16/9 ratio (m) (H )
12 15 0.18 9
15 8 0.23 8
20 24 0.30 7
29 36 0.45 6
60 73 0.91 5
> 100 > 120 > 1.53 3-4
Test method and assessment session
Test method
A DSCQS (double stimulus continuous quality scale) method has been adopted. The image quality, depth
perception and visual comfort are scored on a quality scale with levels going from to (bad, poor,
fair, good, and excellent), see Table 5.4. For the result analysis, the MOS (mean opinion score) is
computed for each test condition as the average of the individual score.
Assessement
The three main characteristics of stereoscopic video content which are assessed (image quality, depth
perception and visual comfort) are scored according to the sheet presented in Table 5.4.
Table 5.4 A sample of a transparency: subjective evaluation sheet.
Image quality Depth perception Visual comfort
Excellent ………………… ………………… …………………
Good ………………… ………………… …………………
Fair ………………… ………………… …………………
Poor ………………… ………………… …………………
Bad ………………… ………………… …………………
Assessment session
At the beginning of the first session, from 2 to 5 training presentations are introduced to stabilize the
observers’ opinion, see Figure 5.2. The data issued from these presentations are not taken into account
in the results of the test. If several sessions are required, only two training presentations are done at the
beginning of the next session.
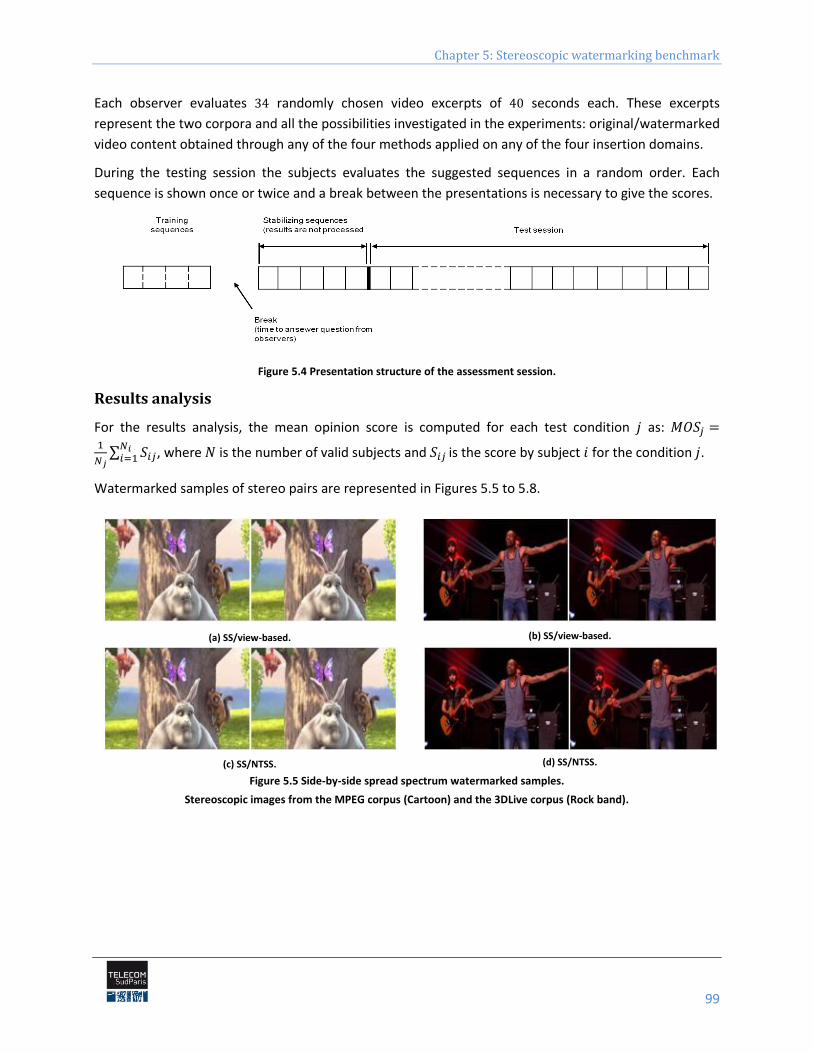
Chapter 5: Stereoscopic watermarking benchmark
99
Each observer evaluates randomly chosen video excerpts of seconds each. These excerpts
represent the two corpora and all the possibilities investigated in the experiments: original/watermarked
video content obtained through any of the four methods applied on any of the four insertion domains.
During the testing session the subjects evaluates the suggested sequences in a random order. Each
sequence is shown once or twice and a break between the presentations is necessary to give the scores.
Figure 5.4 Presentation structure of the assessment session.
Results analysis
For the results analysis, the mean opinion score is computed for each test condition as:
, where is the number of valid subjects and is the score by subject for the condition .
Watermarked samples of stereo pairs are represented in Figures 5.5 to 5.8.
(a) SS/view-based. (b) SS/view-based.
(c) SS/NTSS. (d) SS/NTSS.
Figure 5.5 Side-by-side spread spectrum watermarked samples.
Stereoscopic images from the MPEG corpus (Cartoon) and the 3DLive corpus (Rock band).
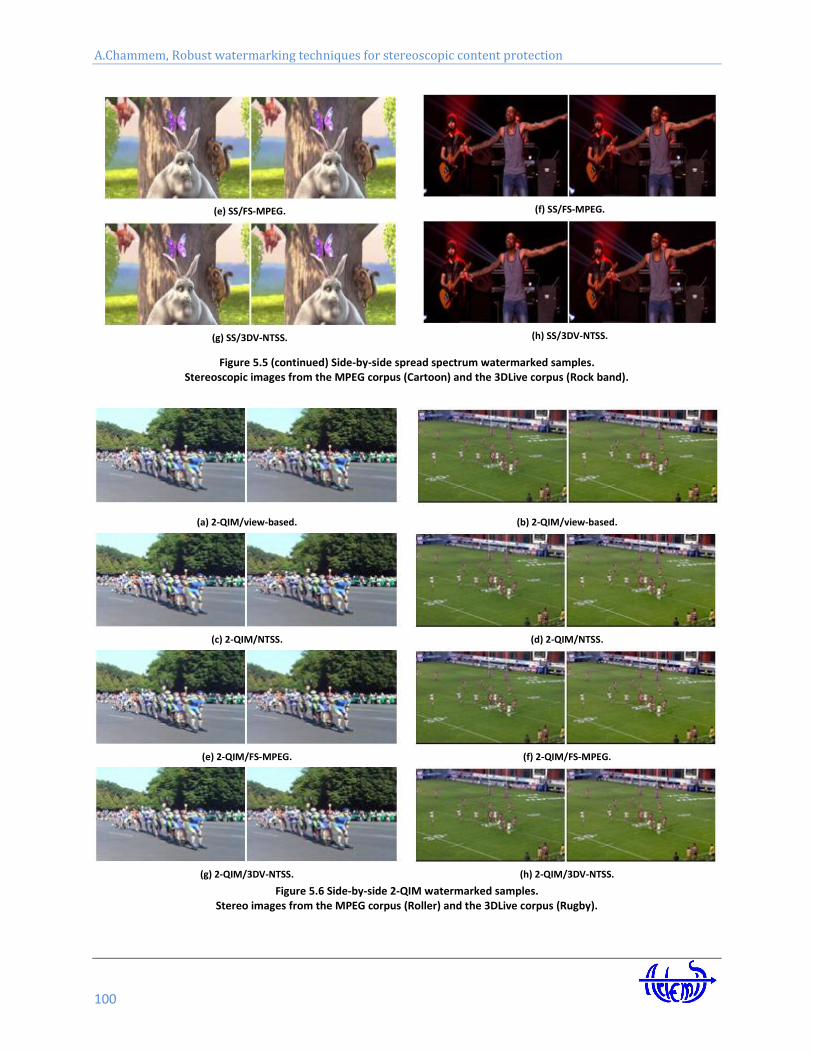
A.Chammem, Robust watermarking techniques for stereoscopic content protection
100
(e) SS/FS-MPEG. (f) SS/FS-MPEG.
(g) SS/3DV-NTSS. (h) SS/3DV-NTSS.
Figure 5.5 (continued) Side-by-side spread spectrum watermarked samples. Stereoscopic images from the MPEG corpus (Cartoon) and the 3DLive corpus (Rock band).
(a) 2-QIM/view-based. (b) 2-QIM/view-based.
(c) 2-QIM/NTSS. (d) 2-QIM/NTSS.
(e) 2-QIM/FS-MPEG. (f) 2-QIM/FS-MPEG.
(g) 2-QIM/3DV-NTSS. (h) 2-QIM/3DV-NTSS.
Figure 5.6 Side-by-side 2-QIM watermarked samples. Stereo images from the MPEG corpus (Roller) and the 3DLive corpus (Rugby).
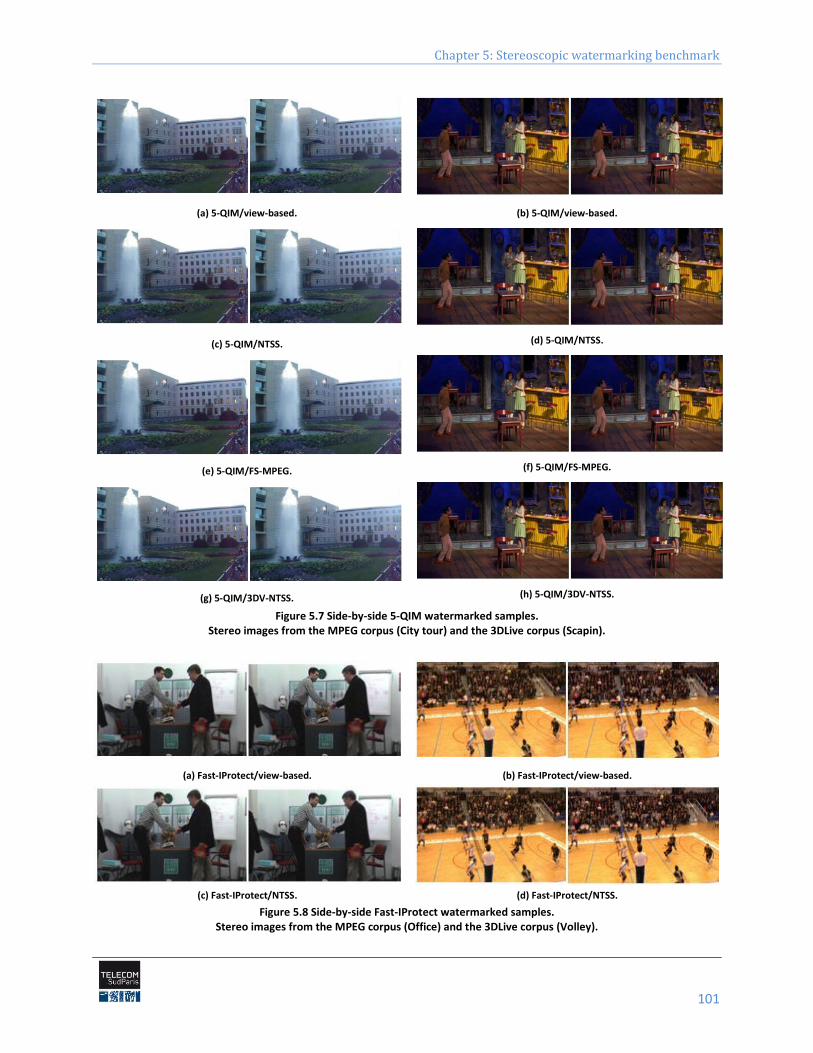
Chapter 5: Stereoscopic watermarking benchmark
101
(a) 5-QIM/view-based. (b) 5-QIM/view-based.
(c) 5-QIM/NTSS. (d) 5-QIM/NTSS.
(e) 5-QIM/FS-MPEG. (f) 5-QIM/FS-MPEG.
(g) 5-QIM/3DV-NTSS. (h) 5-QIM/3DV-NTSS.
Figure 5.7 Side-by-side 5-QIM watermarked samples. Stereo images from the MPEG corpus (City tour) and the 3DLive corpus (Scapin).
(a) Fast-IProtect/view-based. (b) Fast-IProtect/view-based.
(c) Fast-IProtect/NTSS. (d) Fast-IProtect/NTSS.
Figure 5.8 Side-by-side Fast-IProtect watermarked samples. Stereo images from the MPEG corpus (Office) and the 3DLive corpus (Volley).
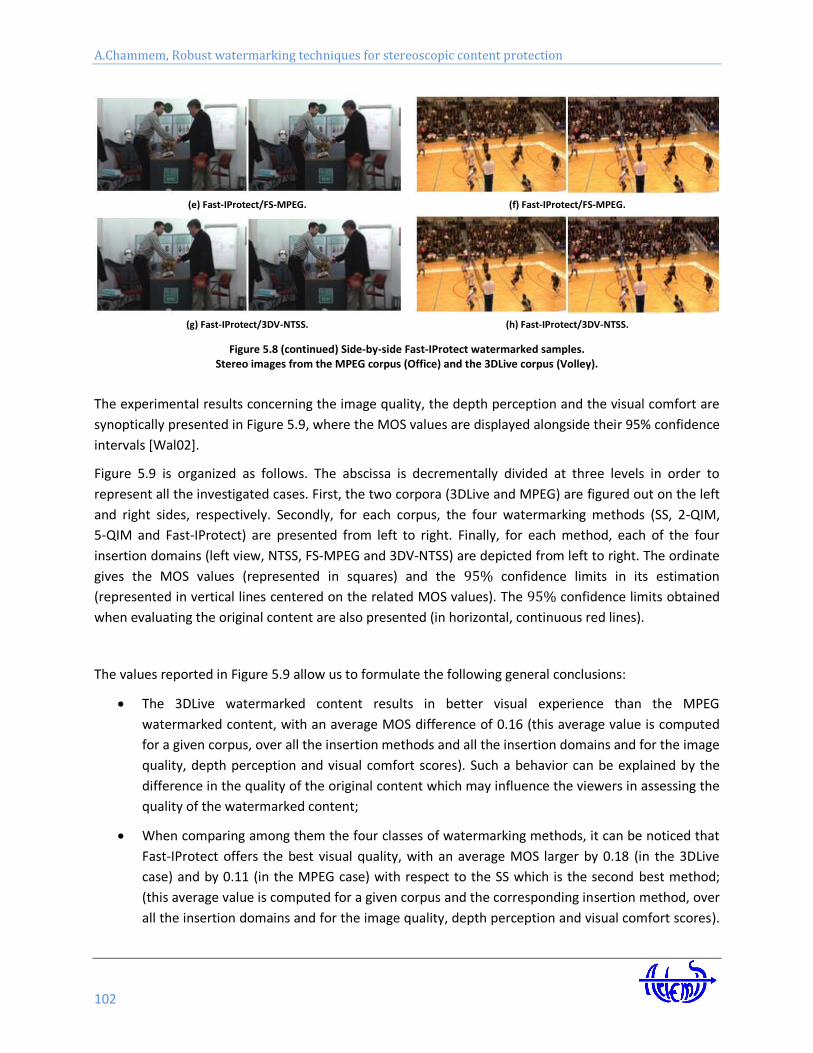
A.Chammem, Robust watermarking techniques for stereoscopic content protection
102
(e) Fast-IProtect/FS-MPEG. (f) Fast-IProtect/FS-MPEG.
(g) Fast-IProtect/3DV-NTSS. (h) Fast-IProtect/3DV-NTSS.
Figure 5.8 (continued) Side-by-side Fast-IProtect watermarked samples. Stereo images from the MPEG corpus (Office) and the 3DLive corpus (Volley).
The experimental results concerning the image quality, the depth perception and the visual comfort are
synoptically presented in Figure 5.9, where the MOS values are displayed alongside their 95% confidence
intervals [Wal02].
Figure 5.9 is organized as follows. The abscissa is decrementally divided at three levels in order to
represent all the investigated cases. First, the two corpora (3DLive and MPEG) are figured out on the left
and right sides, respectively. Secondly, for each corpus, the four watermarking methods (SS, 2-QIM,
5-QIM and Fast-IProtect) are presented from left to right. Finally, for each method, each of the four
insertion domains (left view, NTSS, FS-MPEG and 3DV-NTSS) are depicted from left to right. The ordinate
gives the MOS values (represented in squares) and the confidence limits in its estimation
(represented in vertical lines centered on the related MOS values). The confidence limits obtained
when evaluating the original content are also presented (in horizontal, continuous red lines).
The values reported in Figure 5.9 allow us to formulate the following general conclusions:
The 3DLive watermarked content results in better visual experience than the MPEG
watermarked content, with an average MOS difference of 0.16 (this average value is computed
for a given corpus, over all the insertion methods and all the insertion domains and for the image
quality, depth perception and visual comfort scores). Such a behavior can be explained by the
difference in the quality of the original content which may influence the viewers in assessing the
quality of the watermarked content;
When comparing among them the four classes of watermarking methods, it can be noticed that
Fast-IProtect offers the best visual quality, with an average MOS larger by 0.18 (in the 3DLive
case) and by 0.11 (in the MPEG case) with respect to the SS which is the second best method;
(this average value is computed for a given corpus and the corresponding insertion method, over
all the insertion domains and for the image quality, depth perception and visual comfort scores).
Chapter 5: Stereoscopic watermarking benchmark
103
This result is unexpected, as for the 2D video content, the SS methods were reported to have the
best visual quality;
When comparing among them the four insertion domains, it can be noticed that 3DV-NTSS offers
the best visual quality, with an average MOS larger by 0.06 (in the 3DLive case) and by 0.12 (in
the MPEG case) with respect to the NTSS which is the second best domain (this average value is
computed for a given corpus and the corresponding insertion domain, over all the insertion
methods and for the image quality, depth perception and visual comfort scores). This result
enforces the usefulness of the 3DV-NTSS disparity map for watermarking applications;
The Fast-IProtect method applied in the 3DV-NTSS domain is the only solution for achieving
visually imperceptibly watermarking insertion. Actually, the Fast-IProtect/3DV-NTSS is the only
combination ensuring for both corpora (3DLive and MPEG) and for the three evaluation criteria
(image quality, depth perception and visual comfort) confidence limits inside the confidence
limits corresponding to the original content. There is only one exception (the 3DLive corpus and
the visual comfort) for which the lower limit of the Fast-IProtect/3DV-NTSS confidence interval is
outside the confidence limits of the original content; even in this case, the Fast-
IProtect/3DV-NTSS provides the best results.
Note that the conclusions above are meant to be general. However, several types of methods/insertion
domains may be alternatively considered in order to solve particular applications defined by a particular
type of content/targeted quality criterion. For instance, the protection of some low quality MPEG
content can be achieved under the depth perception constraints by three types of solutions: SS/NTSS,
Fast-IProtect/FS-MPEG and Fast-IProtect/3DV-NTSS (cf. Figure 5.9.b).
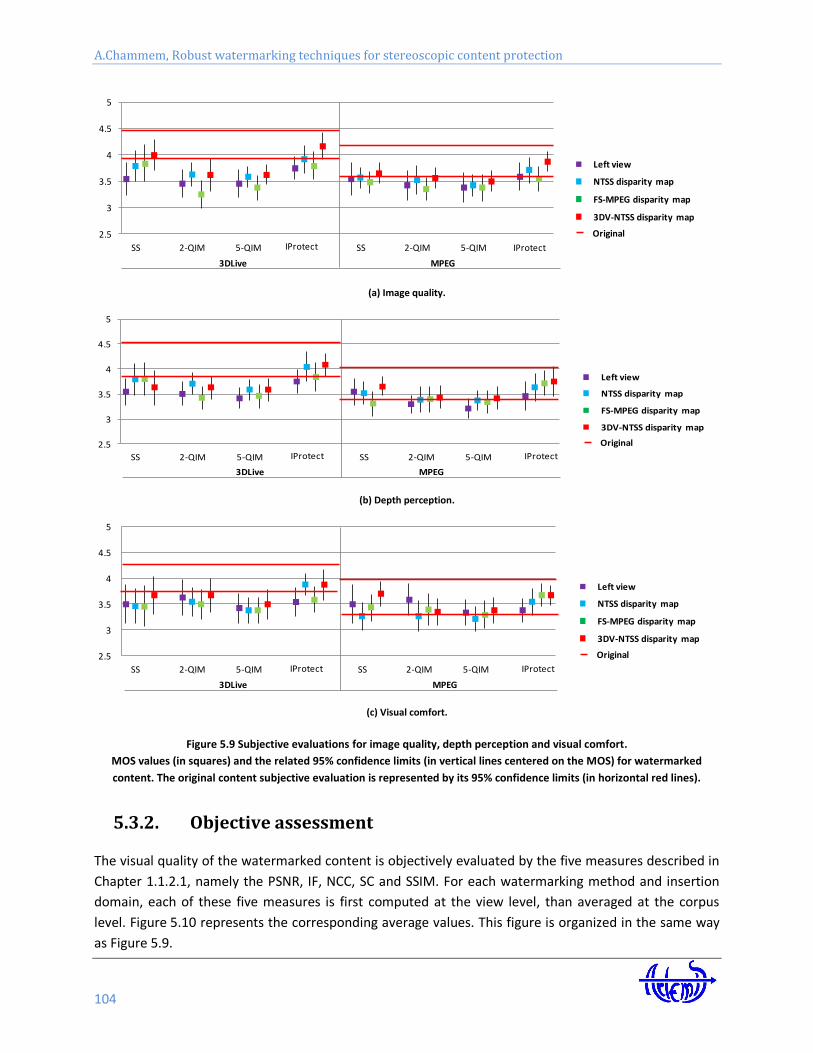
A.Chammem, Robust watermarking techniques for stereoscopic content protection
104
(a) Image quality.
(b) Depth perception.
(c) Visual comfort.
Figure 5.9 Subjective evaluations for image quality, depth perception and visual comfort.
MOS values (in squares) and the related 95% confidence limits (in vertical lines centered on the MOS) for watermarked
content. The original content subjective evaluation is represented by its 95% confidence limits (in horizontal red lines).
5.3.2. Objective assessment
The visual quality of the watermarked content is objectively evaluated by the five measures described in
Chapter 1.1.2.1, namely the PSNR, IF, NCC, SC and SSIM. For each watermarking method and insertion
domain, each of these five measures is first computed at the view level, than averaged at the corpus
level. Figure 5.10 represents the corresponding average values. This figure is organized in the same way
as Figure 5.9.
2.5
3
3.5
4
4.5
5
SS 2-QIM 5-QIM IProtect SS 2-QIM 5-QIM IProtect
3DLive MPEG
Image quality
Left view
FS-MPEG disparity map
NTSS disparity map
3DV-NTSS disparity map
Original
IProtect
2.5
3
3.5
4
4.5
5
SS 2-QIM 5-QIM Iprotect SS 2-QIM 5-QIM Iprotect
3DLive MPEG
Depth percetion
Left view
FS-MPEG disparity map
NTSS disparity map
3DV-NTSS disparity map
Original
IProtect IProtect
2.5
3
3.5
4
4.5
5
SS 2-QIM 5-QIM Iprotect SS 2-QIM 5-QIM Iprotect
3DLive MPEG
Visual comfort
Left view
FS-MPEG disparity map
NTSS disparity map
3DV-NTSS disparity map
Original
IProtect IProtect
Chapter 5: Stereoscopic watermarking benchmark
105
The 95% confidence limits are also computed for each experiment (each corpus, watermarking method
and insertion domain). As the corresponding error is always lower than 0.45dB in the PSNR case and
0.001 in the IF, NCC, SC and SSIM cases, the related confidence limits cannot be represented in Figure
5.10, being lower than the printing resolution for the average values. There is only one exception: for the
3DLive corpus, the Fast-IProtect method and the view-based domain, the 95% error in SC estimation is
0.015 and is represented in Figure 5.10.d.
The values reported in Figure 5.10 allow us to formulate the following general conclusions:
For a given measure and insertion domain, very few differences can be noticed between the
3DLive and MPEG corpora. This result validates the fairness of the benchmarking conditions (i.e.
the parameters of the investigated watermarking methods were set so as to ensure a
transparency independent with respect to the original data and dependent only on the
method/insertion domain);
The PSNR average values are always larger than 30dB (with a singular exception, namely the
5-QIM method applied to the left views of the 3DLive corpus). Consequently, all the considered
watermarking methods/insertion domains can ensure basic transparency properties. However,
very good transparency (larger than 35dB) can be achieved only by the SS (for all insertion
domains and for the two corpora) and by the Fast-IProtect (3DV-NTSS in the 3DLive case and all
the four insertion domains in the MPEG case). According to the PSNR values, SS would be the
best watermarking method, followed by Fast-IProtect;
The IF, NCC, SC and SSIM values also support the idea that basic transparency (i.e. values
between 0.95 and 1.05) can be virtually ensured by all the considered watermarking methods
(with some constraints in the choice of the insertion domain). There is one exception,
represented by the SS method which is refuted by the IF measures estimated on the MPEG
corpus. Here again, the SS and Fast-IProtect identified themselves as the best solutions;
For each watermarking method and for each corpus, all the five objective quality metrics select
the 3DV-NTSS disparity map as the optimal insertion domain, with a singular exception (the NCC
values computed for the 5-QIM insertion method applied to the 3DLive corpus).
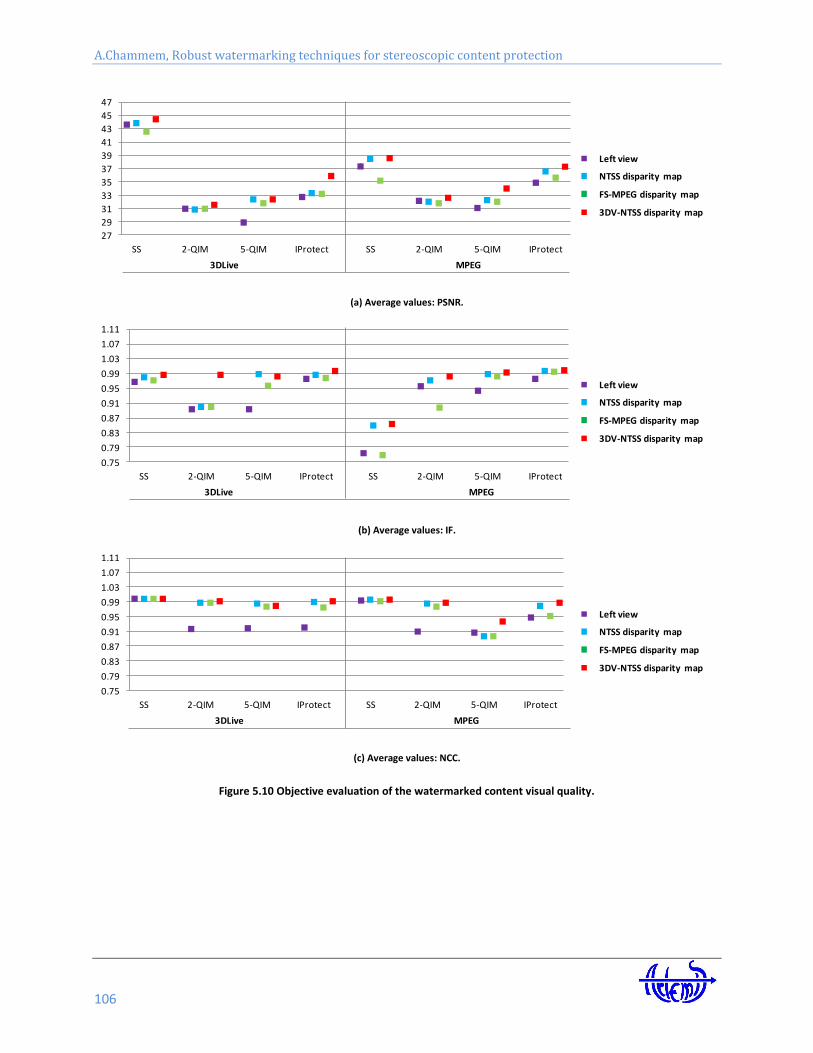
A.Chammem, Robust watermarking techniques for stereoscopic content protection
106
(a) Average values: PSNR.
(b) Average values: IF.
(c) Average values: NCC.
Figure 5.10 Objective evaluation of the watermarked content visual quality.
27
29
31
33
35
37
39
41
43
45
47
SS 2-QIM 5-QIM IProtect SS 2-QIM 5-QIM IProtect
3DLive MPEG
PSNR
Left view
FS-MPEG disparity map
NTSS disparity map
3DV-NTSS disparity map
Left view
FS-MPEG disparity map
NTSS disparity map
3DV-NTSS disparity map
0.75
0.79
0.83
0.87
0.91
0.95
0.99
1.03
1.07
1.11
SS 2-QIM 5-QIM IProtect SS 2-QIM 5-QIM IProtect
3DLive MPEG
IF
0.75
0.79
0.83
0.87
0.91
0.95
0.99
1.03
1.07
1.11
SS 2-QIM 5-QIM IProtect SS 2-QIM 5-QIM IProtect
3DLive MPEG
NCC
Left view
FS-MPEG disparity map
NTSS disparity map
3DV-NTSS disparity map
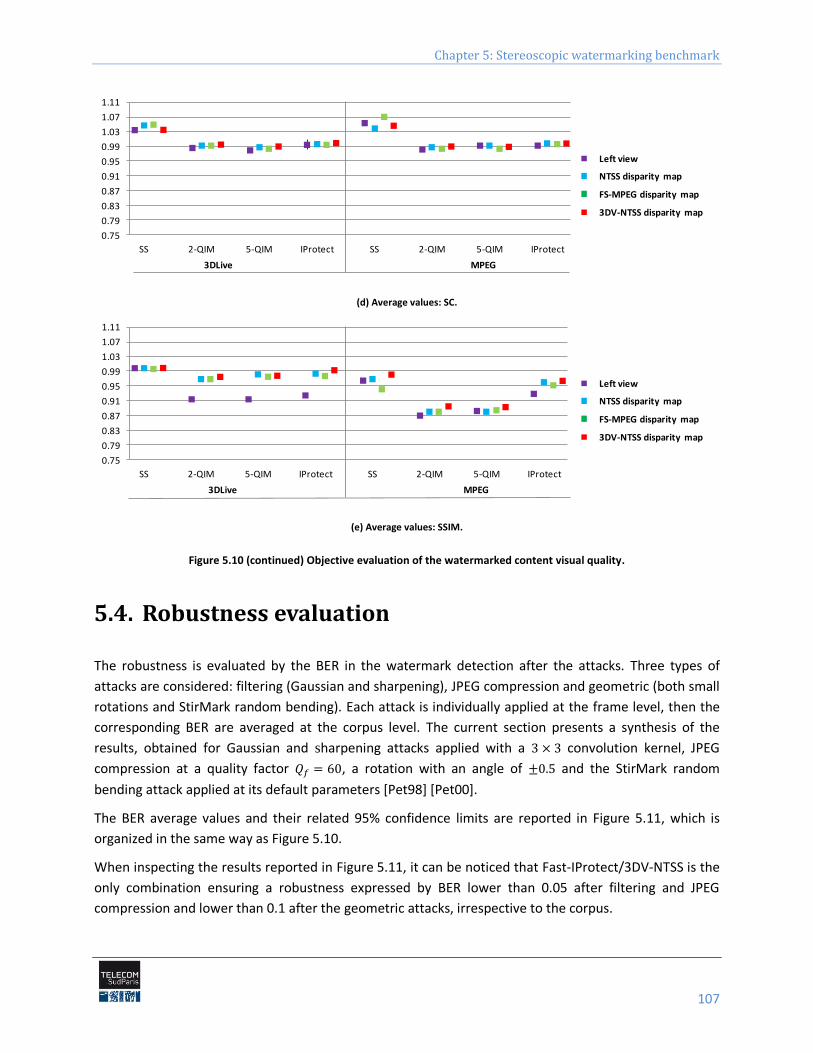
Chapter 5: Stereoscopic watermarking benchmark
107
(d) Average values: SC.
(e) Average values: SSIM.
Figure 5.10 (continued) Objective evaluation of the watermarked content visual quality.
5.4. Robustness evaluation
The robustness is evaluated by the BER in the watermark detection after the attacks. Three types of
attacks are considered: filtering (Gaussian and sharpening), JPEG compression and geometric (both small
rotations and StirMark random bending). Each attack is individually applied at the frame level, then the
corresponding BER are averaged at the corpus level. The current section presents a synthesis of the
results, obtained for Gaussian and sharpening attacks applied with a convolution kernel, JPEG
compression at a quality factor , a rotation with an angle of and the StirMark random
bending attack applied at its default parameters [Pet98] [Pet00].
The BER average values and their related 95% confidence limits are reported in Figure 5.11, which is
organized in the same way as Figure 5.10.
When inspecting the results reported in Figure 5.11, it can be noticed that Fast-IProtect/3DV-NTSS is the
only combination ensuring a robustness expressed by BER lower than 0.05 after filtering and JPEG
compression and lower than 0.1 after the geometric attacks, irrespective to the corpus.
0.75
0.79
0.83
0.87
0.91
0.95
0.99
1.03
1.07
1.11
SS 2-QIM 5-QIM IProtect SS 2-QIM 5-QIM IProtect
3DLive MPEG
SC
Left view
FS-MPEG disparity map
NTSS disparity map
3DV-NTSS disparity map
0.75
0.79
0.83
0.87
0.91
0.95
0.99
1.03
1.07
1.11
SS 2-QIM 5-QIM IProtect SS 2-QIM 5-QIM IProtect
3DLive MPEG
SSIM
Left view
FS-MPEG disparity map
NTSS disparity map
3DV-NTSS disparity map
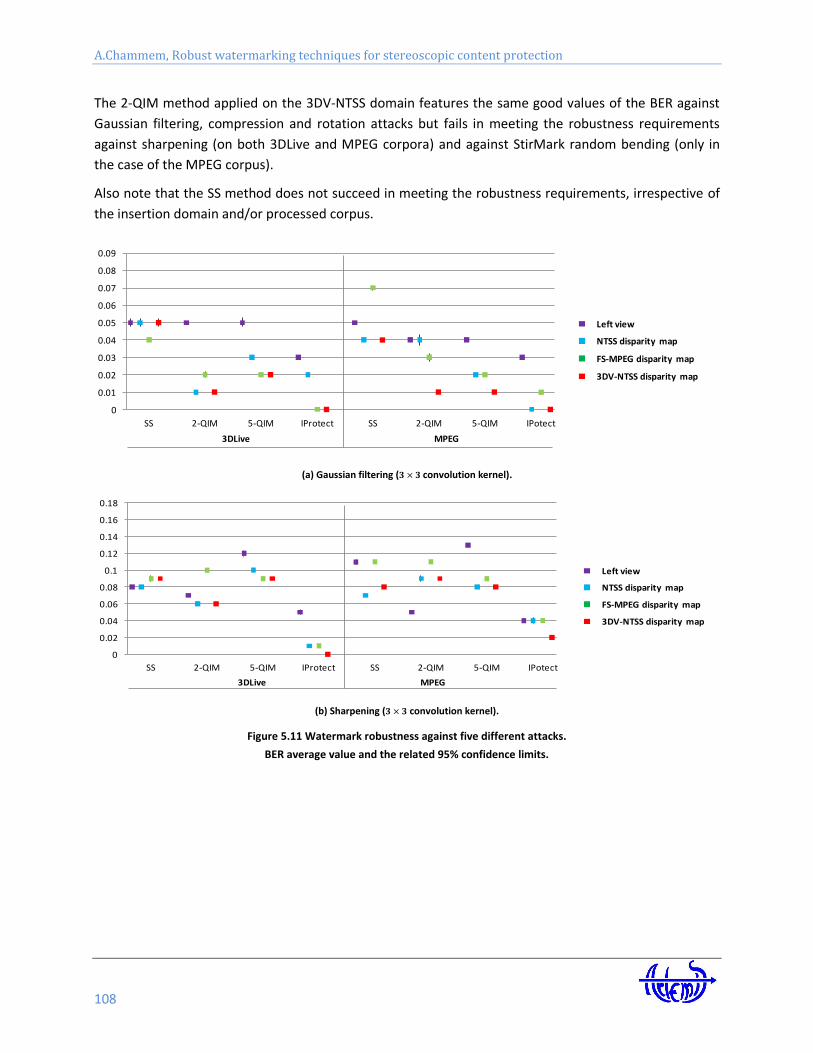
A.Chammem, Robust watermarking techniques for stereoscopic content protection
108
The 2-QIM method applied on the 3DV-NTSS domain features the same good values of the BER against
Gaussian filtering, compression and rotation attacks but fails in meeting the robustness requirements
against sharpening (on both 3DLive and MPEG corpora) and against StirMark random bending (only in
the case of the MPEG corpus).
Also note that the SS method does not succeed in meeting the robustness requirements, irrespective of
the insertion domain and/or processed corpus.
(a) Gaussian filtering ( convolution kernel).
(b) Sharpening ( convolution kernel).
Figure 5.11 Watermark robustness against five different attacks.
BER average value and the related 95% confidence limits.
0
0.01
0.02
0.03
0.04
0.05
0.06
0.07
0.08
0.09
SS 2-QIM 5-QIM IProtect SS 2-QIM 5-QIM IPotect
3DLive MPEG
Gaussian filtering
Left view
FS-MPEG disparity map
NTSS disparity map
3DV-NTSS disparity map
0
0.02
0.04
0.06
0.08
0.1
0.12
0.14
0.16
0.18
SS 2-QIM 5-QIM IProtect SS 2-QIM 5-QIM IPotect
3DLive MPEG
Sharpening
Left view
FS-MPEG disparity map
NTSS disparity map
3DV-NTSS disparity map

Chapter 5: Stereoscopic watermarking benchmark
109
(c) JPEG compression (Quality factor Qf ).
(d) Small rotations
(e) Geometric attacks (StirMark random bending).
Figure 5.11 (continued) Watermark robustness against five different attacks.
BER average value and the related 95% confidence limits.
0
0.01
0.02
0.03
0.04
0.05
0.06
0.07
0.08
0.09
SS 2-QIM 5-QIM IProtect SS 2-QIM 5-QIM IPotect
3DLive MPEG
JPEG compression
Left view
FS-MPEG disparity map
NTSS disparity map
3DV-NTSS disparity map
0
0.03
0.06
0.09
0.12
0.15
0.18
0.21
0.24
0.27
SS 2-QIM 5-QIM IProtect SS 2-QIM 5-QIM IPotect
3DLive MPEG
Rotation +/- 0.5
Left view
FS-MPEG disparity map
NTSS disparity map
3DV-NTSS disparity map
0
0.03
0.06
0.09
0.12
0.15
0.18
0.21
0.24
0.27
SS 2-QIM 5-QIM IProtect SS 2-QIM 5-QIM IPotect
3DLive MPEG
StirMark
Left view
FS-MPEG disparity map
NTSS disparity map
3DV-NTSS disparity map
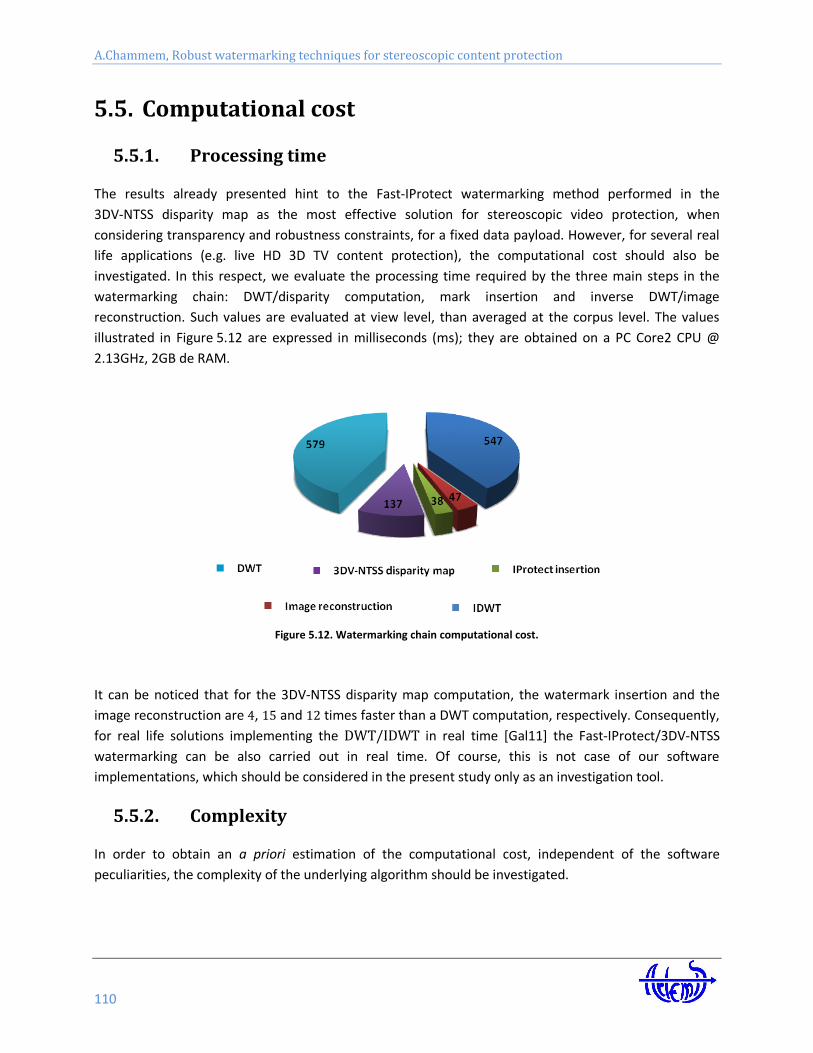
A.Chammem, Robust watermarking techniques for stereoscopic content protection
110
5.5. Computational cost
5.5.1. Processing time
The results already presented hint to the Fast-IProtect watermarking method performed in the
3DV-NTSS disparity map as the most effective solution for stereoscopic video protection, when
considering transparency and robustness constraints, for a fixed data payload. However, for several real
life applications (e.g. live HD 3D TV content protection), the computational cost should also be
investigated. In this respect, we evaluate the processing time required by the three main steps in the
watermarking chain: DWT/disparity computation, mark insertion and inverse DWT/image
reconstruction. Such values are evaluated at view level, than averaged at the corpus level. The values
illustrated in Figure 5.12 are expressed in milliseconds (ms); they are obtained on a PC Core2 CPU @
2.13GHz, 2GB de RAM.
Figure 5.12. Watermarking chain computational cost.
It can be noticed that for the 3DV-NTSS disparity map computation, the watermark insertion and the
image reconstruction are , and times faster than a DWT computation, respectively. Consequently,
for real life solutions implementing the in real time [Gal11] the Fast-IProtect/3DV-NTSS
watermarking can be also carried out in real time. Of course, this is not case of our software
implementations, which should be considered in the present study only as an investigation tool.
5.5.2. Complexity
In order to obtain an a priori estimation of the computational cost, independent of the software
peculiarities, the complexity of the underlying algorithm should be investigated.
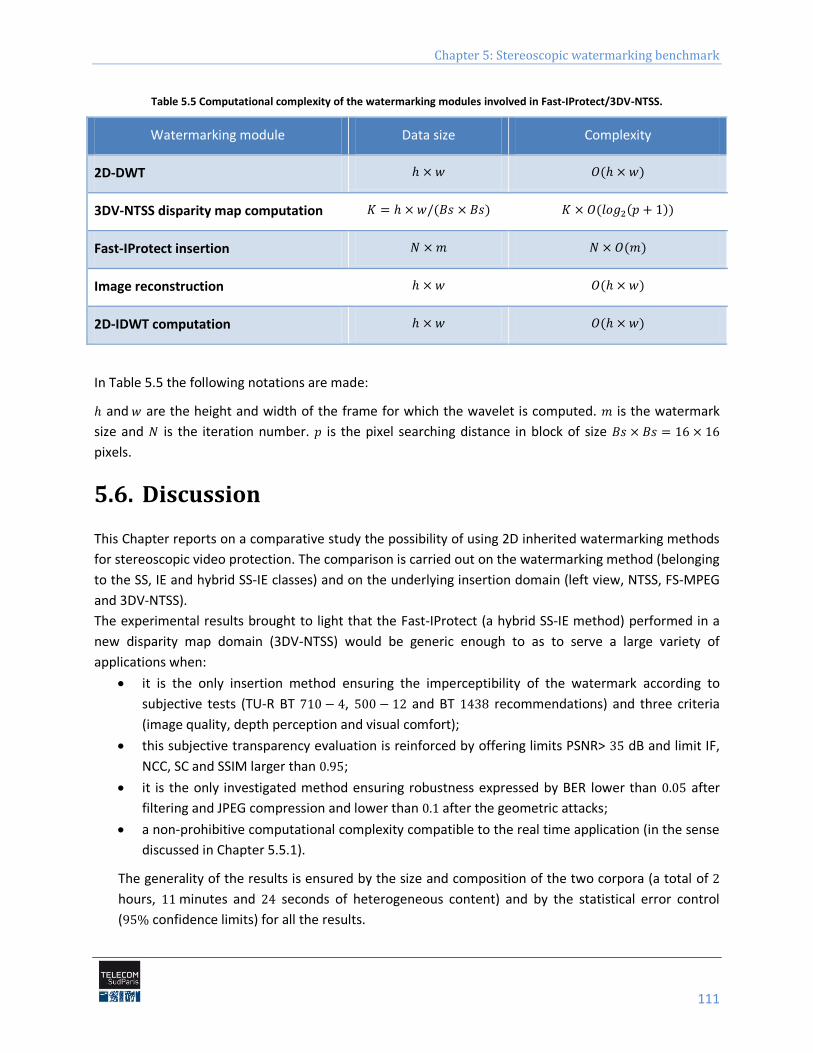
Chapter 5: Stereoscopic watermarking benchmark
111
Table 5.5 Computational complexity of the watermarking modules involved in Fast-IProtect/3DV-NTSS.
Watermarking module Data size Complexity
2D-DWT
3DV-NTSS disparity map computation
Fast-IProtect insertion
Image reconstruction
2D-IDWT computation
In Table 5.5 the following notations are made:
and are the height and width of the frame for which the wavelet is computed. is the watermark
size and is the iteration number. is the pixel searching distance in block of size
pixels.
5.6. Discussion
This Chapter reports on a comparative study the possibility of using 2D inherited watermarking methods
for stereoscopic video protection. The comparison is carried out on the watermarking method (belonging
to the SS, IE and hybrid SS-IE classes) and on the underlying insertion domain (left view, NTSS, FS-MPEG
and 3DV-NTSS).
The experimental results brought to light that the Fast-IProtect (a hybrid SS-IE method) performed in a
new disparity map domain (3DV-NTSS) would be generic enough to as to serve a large variety of
applications when:
it is the only insertion method ensuring the imperceptibility of the watermark according to
subjective tests (TU-R BT , and BT recommendations) and three criteria
(image quality, depth perception and visual comfort);
this subjective transparency evaluation is reinforced by offering limits PSNR> dB and limit IF,
NCC, SC and SSIM larger than ;
it is the only investigated method ensuring robustness expressed by BER lower than after
filtering and JPEG compression and lower than after the geometric attacks;
a non-prohibitive computational complexity compatible to the real time application (in the sense
discussed in Chapter 5.5.1).
The generality of the results is ensured by the size and composition of the two corpora (a total of
hours, minutes and seconds of heterogeneous content) and by the statistical error control
( confidence limits) for all the results.


Chapter 6 Conclusion and future work

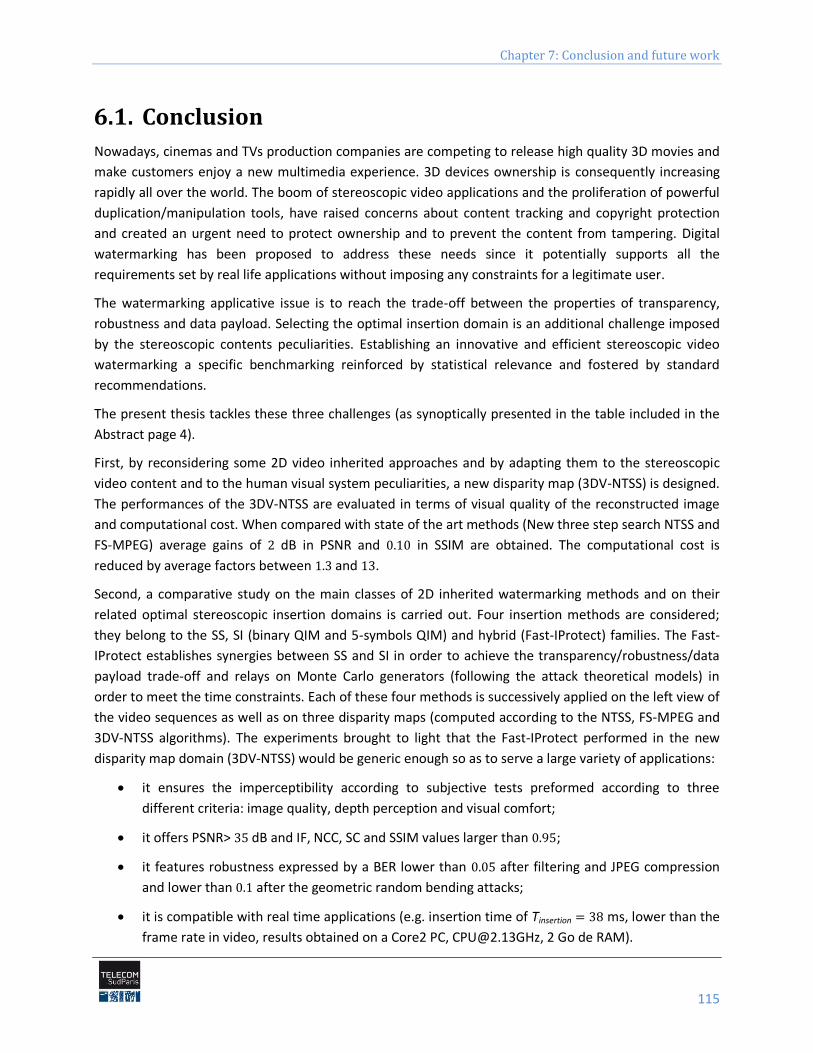
Chapter 7: Conclusion and future work
115
6.1. Conclusion
Nowadays, cinemas and TVs production companies are competing to release high quality 3D movies and
make customers enjoy a new multimedia experience. 3D devices ownership is consequently increasing
rapidly all over the world. The boom of stereoscopic video applications and the proliferation of powerful
duplication/manipulation tools, have raised concerns about content tracking and copyright protection
and created an urgent need to protect ownership and to prevent the content from tampering. Digital
watermarking has been proposed to address these needs since it potentially supports all the
requirements set by real life applications without imposing any constraints for a legitimate user.
The watermarking applicative issue is to reach the trade-off between the properties of transparency,
robustness and data payload. Selecting the optimal insertion domain is an additional challenge imposed
by the stereoscopic contents peculiarities. Establishing an innovative and efficient stereoscopic video
watermarking a specific benchmarking reinforced by statistical relevance and fostered by standard
recommendations.
The present thesis tackles these three challenges (as synoptically presented in the table included in the
Abstract page 4).
First, by reconsidering some 2D video inherited approaches and by adapting them to the stereoscopic
video content and to the human visual system peculiarities, a new disparity map (3DV-NTSS) is designed.
The performances of the 3DV-NTSS are evaluated in terms of visual quality of the reconstructed image
and computational cost. When compared with state of the art methods (New three step search NTSS and
FS-MPEG) average gains of dB in PSNR and in SSIM are obtained. The computational cost is
reduced by average factors between and .
Second, a comparative study on the main classes of 2D inherited watermarking methods and on their
related optimal stereoscopic insertion domains is carried out. Four insertion methods are considered;
they belong to the SS, SI (binary QIM and 5-symbols QIM) and hybrid (Fast-IProtect) families. The Fast-
IProtect establishes synergies between SS and SI in order to achieve the transparency/robustness/data
payload trade-off and relays on Monte Carlo generators (following the attack theoretical models) in
order to meet the time constraints. Each of these four methods is successively applied on the left view of
the video sequences as well as on three disparity maps (computed according to the NTSS, FS-MPEG and
3DV-NTSS algorithms). The experiments brought to light that the Fast-IProtect performed in the new
disparity map domain (3DV-NTSS) would be generic enough so as to serve a large variety of applications:
it ensures the imperceptibility according to subjective tests preformed according to three
different criteria: image quality, depth perception and visual comfort;
it offers PSNR> dB and IF, NCC, SC and SSIM values larger than ;
it features robustness expressed by a BER lower than after filtering and JPEG compression
and lower than after the geometric random bending attacks;
it is compatible with real time applications (e.g. insertion time of Tinsertion ms, lower than the
frame rate in video, results obtained on a Core2 PC, [email protected], 2 Go de RAM).
A.Chammem, Robust watermarking techniques for stereoscopic content protection
116
Finally, concerning the performance evaluation, all the quantitative results are obtained out of
processing two corpora (3DLive and MPEG) of stereoscopic visual content, organized according to three
general criteria: significance, acceptability and exploitability. Each of these two corpora combines
indoor/outdoor, unstable and arbitrary lighting, still and high motion scenes. The 3DLive corpus sums up
about hours of HD 3D TV content captured by French professionals. The MPEG 3D video reference
corpus is composed of minutes of video provided by both academic/industry and encoded at different
resolutions (from to pixels).
The statistical relevance of the results is given by the confidence limits computed for all the values
reported in our study (for both transparency and robustness), and by their underlying the relative errors
which are lower than .
Two standards have been considered in our study. The transparency of the watermarked content is
subjectively assessed according to the ITU-R BT , and BT recommendations. The
robustness and data payload are considered so as to comply with the Digital Cinema Initiatives (DCI)
prescriptions.
6.2. Future work
This thesis represents the proof of concepts for stereoscopic video robust watermarking: by developing a
new disparity map and by combining spread spectrum with side information principles, the
transparency/robustness/data payload balance can be reached in real time.
The perspectives open towards the specification of the theoretical model for stereoscopic watermarking.
The 2D-video inherited model is defined by a noisy channel where the attacks act as a general noise
source while the original content stands for a side information (a noise source known at the embedder).
The issue is to maximize the data payload on such a channel, under an additional power constraint set by
the human visual system.
When extending this model to the stereoscopic video case, three issues should be dealt with. First, the
theoretical probability density functions modeling the various transforms the stereoscopic video suffers
during its distribution are not yet investigated. Secondly, the two stereo views represent correlated side
information noise sources; no theoretical result is nowadays available for handling such a situation.
Finally, the human stereoscopic vision is not yet modeled with precision, at least not so as to be directly
integrated as a power limit constraint for the inserted mark.

Appendix

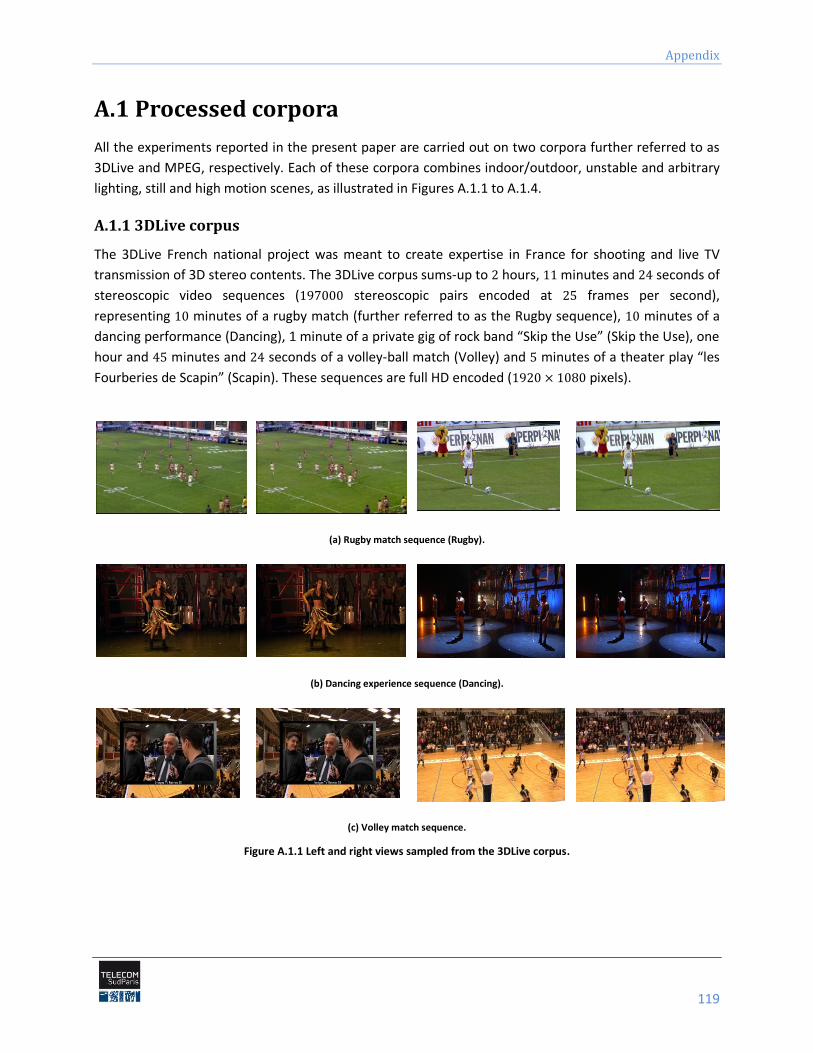
Appendix
119
A.1 Processed corpora
All the experiments reported in the present paper are carried out on two corpora further referred to as
3DLive and MPEG, respectively. Each of these corpora combines indoor/outdoor, unstable and arbitrary
lighting, still and high motion scenes, as illustrated in Figures A.1.1 to A.1.4.
A.1.1 3DLive corpus
The 3DLive French national project was meant to create expertise in France for shooting and live TV
transmission of 3D stereo contents. The 3DLive corpus sums-up to hours, minutes and seconds of
stereoscopic video sequences ( stereoscopic pairs encoded at frames per second),
representing minutes of a rugby match (further referred to as the Rugby sequence), minutes of a
dancing performance (Dancing), 1 minute of a private gig of rock band “Skip the Use” (Skip the Use), one
hour and minutes and seconds of a volley-ball match (Volley) and minutes of a theater play “les
Fourberies de Scapin” (Scapin). These sequences are full HD encoded ( pixels).
(a) Rugby match sequence (Rugby).
(b) Dancing experience sequence (Dancing).
(c) Volley match sequence.
Figure A.1.1 Left and right views sampled from the 3DLive corpus.
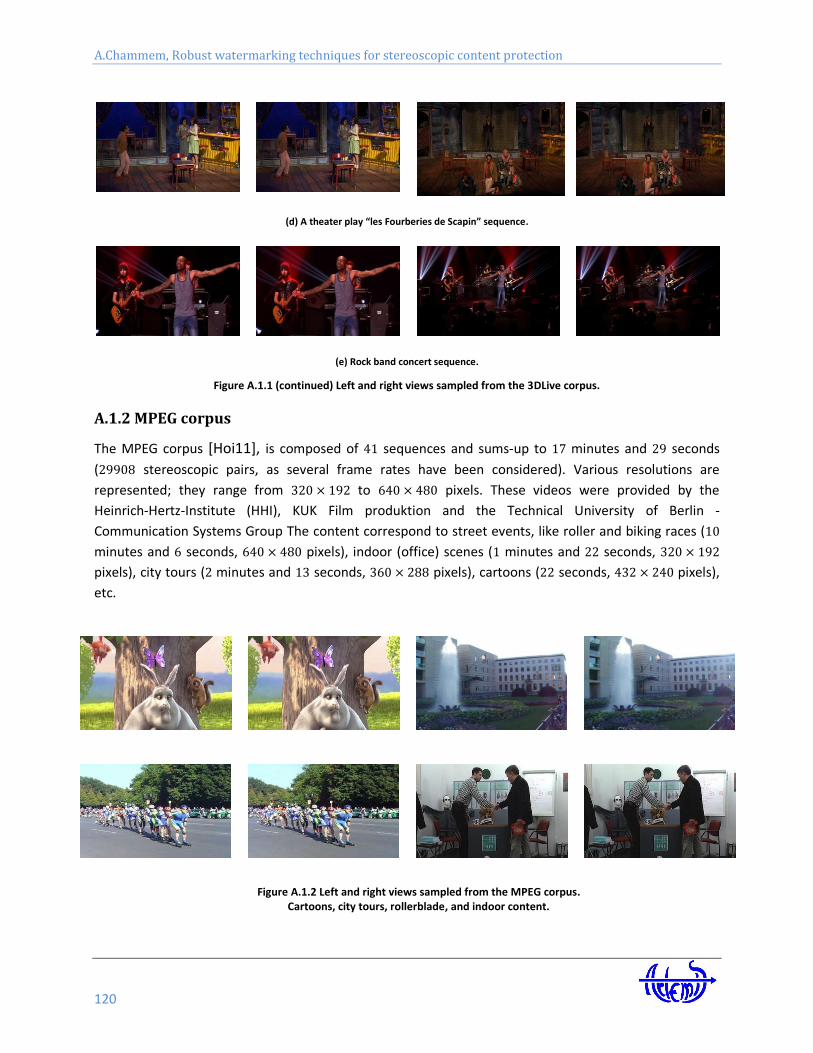
A.Chammem, Robust watermarking techniques for stereoscopic content protection
120
(d) A theater play “les Fourberies de Scapin” sequence.
(e) Rock band concert sequence.
Figure A.1.1 (continued) Left and right views sampled from the 3DLive corpus.
A.1.2 MPEG corpus
The MPEG corpus [Hoi11], is composed of sequences and sums-up to minutes and seconds
( stereoscopic pairs, as several frame rates have been considered). Various resolutions are
represented; they range from to pixels. These videos were provided by the
Heinrich-Hertz-Institute (HHI), KUK Film produktion and the Technical University of Berlin -
Communication Systems Group The content correspond to street events, like roller and biking races (
minutes and seconds, pixels), indoor (office) scenes ( minutes and seconds,
pixels), city tours ( minutes and seconds, pixels), cartoons ( seconds, pixels),
etc.
Figure A.1.2 Left and right views sampled from the MPEG corpus. Cartoons, city tours, rollerblade, and indoor content.
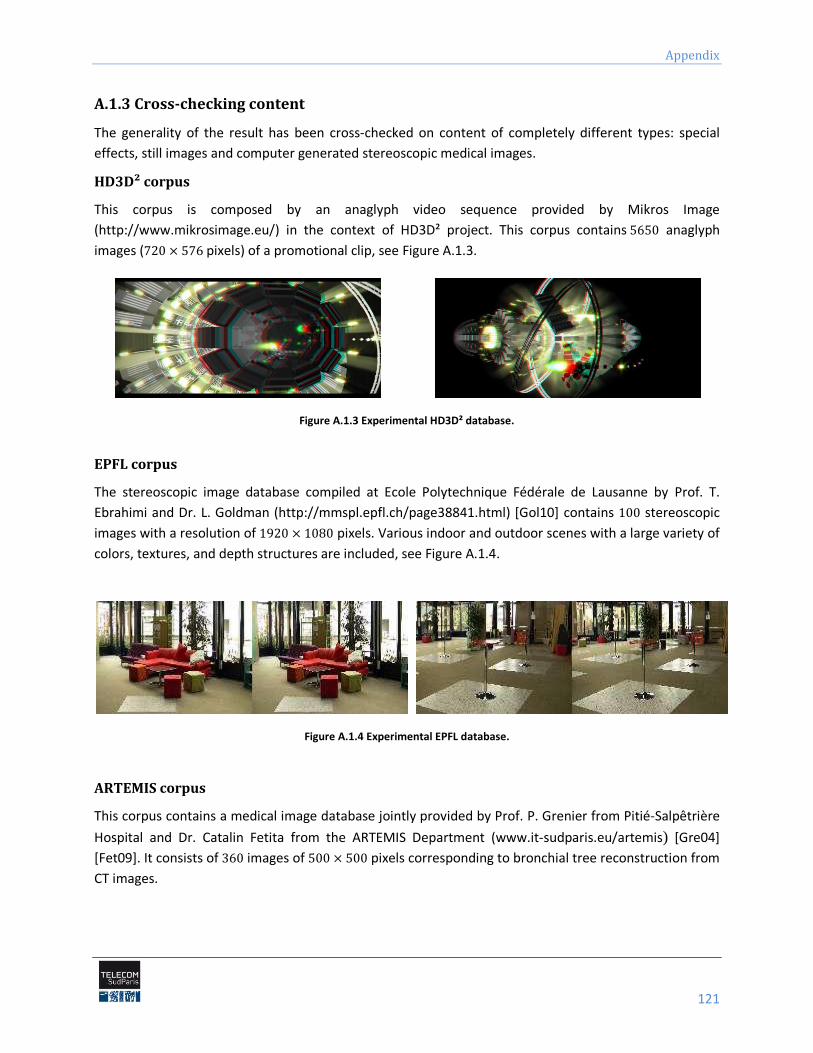
Appendix
121
A.1.3 Cross-checking content
The generality of the result has been cross-checked on content of completely different types: special
effects, still images and computer generated stereoscopic medical images.
HD3D² corpus
This corpus is composed by an anaglyph video sequence provided by Mikros Image
(http://www.mikrosimage.eu/) in the context of HD3D² project. This corpus contains anaglyph
images ( pixels) of a promotional clip, see Figure A.1.3.
Figure A.1.3 Experimental HD3D² database.
EPFL corpus
The stereoscopic image database compiled at Ecole Polytechnique Fédérale de Lausanne by Prof. T.
Ebrahimi and Dr. L. Goldman (http://mmspl.epfl.ch/page38841.html) [Gol10] contains stereoscopic
images with a resolution of pixels. Various indoor and outdoor scenes with a large variety of
colors, textures, and depth structures are included, see Figure A.1.4.
Figure A.1.4 Experimental EPFL database.
ARTEMIS corpus
This corpus contains a medical image database jointly provided by Prof. P. Grenier from Pitié-Salpêtrière
Hospital and Dr. Catalin Fetita from the ARTEMIS Department (www.it-sudparis.eu/artemis) [Gre04]
[Fet09]. It consists of images of pixels corresponding to bronchial tree reconstruction from
CT images.
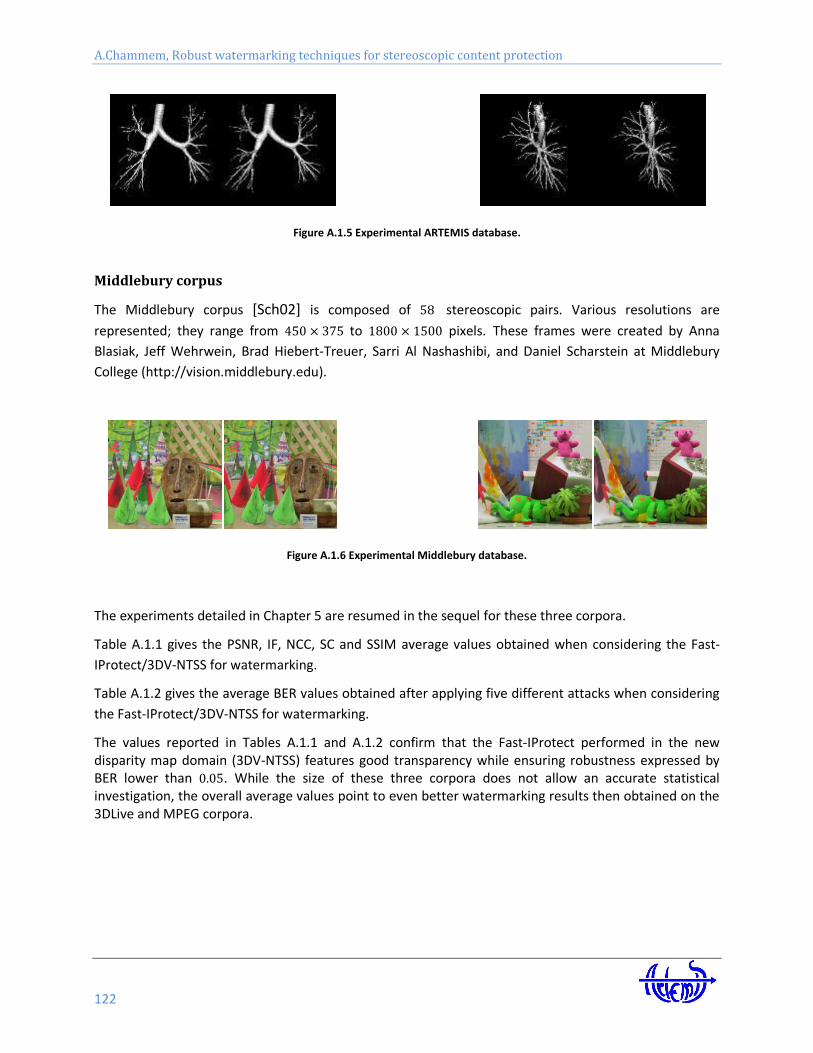
A.Chammem, Robust watermarking techniques for stereoscopic content protection
122
Figure A.1.5 Experimental ARTEMIS database.
Middlebury corpus
The Middlebury corpus [Sch02] is composed of stereoscopic pairs. Various resolutions are
represented; they range from to pixels. These frames were created by Anna
Blasiak, Jeff Wehrwein, Brad Hiebert-Treuer, Sarri Al Nashashibi, and Daniel Scharstein at Middlebury
College (http://vision.middlebury.edu).
Figure A.1.6 Experimental Middlebury database.
The experiments detailed in Chapter 5 are resumed in the sequel for these three corpora.
Table A.1.1 gives the PSNR, IF, NCC, SC and SSIM average values obtained when considering the Fast-
IProtect/3DV-NTSS for watermarking.
Table A.1.2 gives the average BER values obtained after applying five different attacks when considering
the Fast-IProtect/3DV-NTSS for watermarking.
The values reported in Tables A.1.1 and A.1.2 confirm that the Fast-IProtect performed in the new disparity map domain (3DV-NTSS) features good transparency while ensuring robustness expressed by BER lower than . While the size of these three corpora does not allow an accurate statistical investigation, the overall average values point to even better watermarking results then obtained on the 3DLive and MPEG corpora.
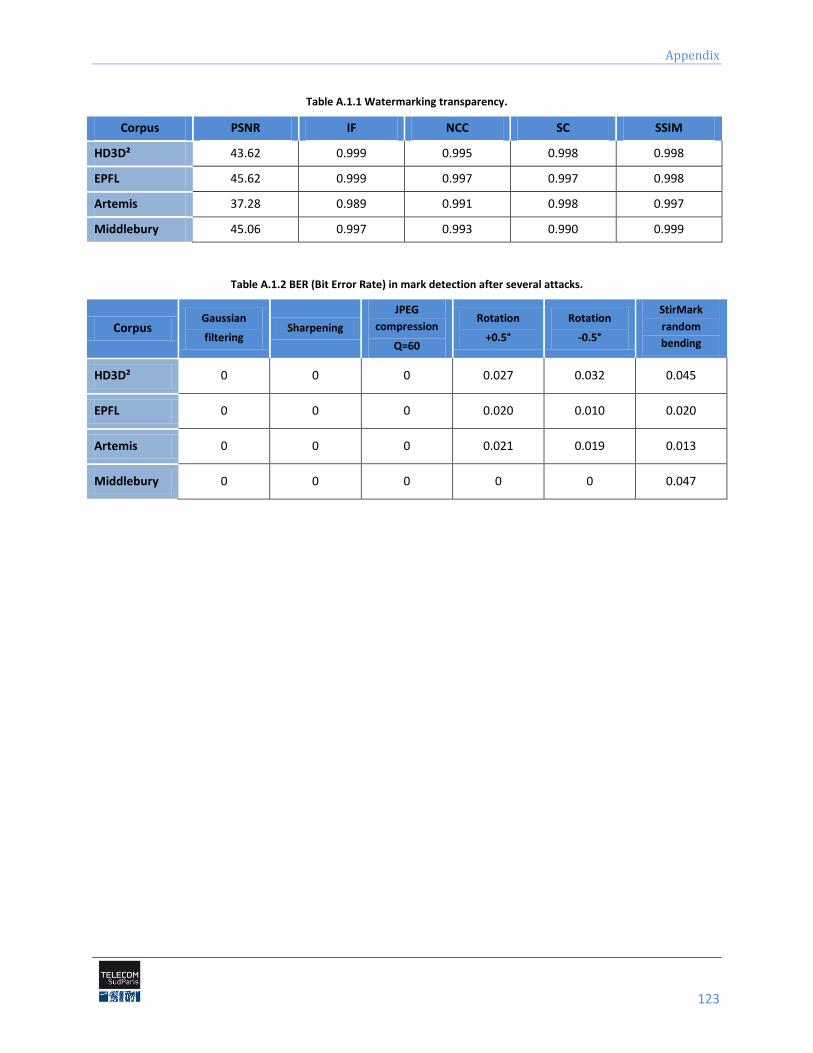
Appendix
123
Table A.1.1 Watermarking transparency.
Corpus PSNR IF NCC SC SSIM
HD3D² 43.62 0.999 0.995 0.998 0.998
EPFL 45.62 0.999 0.997 0.997 0.998
Artemis 37.28 0.989 0.991 0.998 0.997
Middlebury 45.06 0.997 0.993 0.990 0.999
Table A.1.2 BER (Bit Error Rate) in mark detection after several attacks.
Corpus Gaussian
filtering Sharpening
JPEG
compression
Q=60
Rotation
+0.5°
Rotation
-0.5°
StirMark
random
bending
HD3D² 0 0 0 0.027 0.032 0.045
EPFL 0 0 0 0.020 0.010 0.020
Artemis 0 0 0 0.021 0.019 0.013
Middlebury 0 0 0 0 0 0.047
A.Chammem, Robust watermarking techniques for stereoscopic content protection
124
A.2 Considered embedding techniques
This Appendix presents details related to the SS and QIM insertion techniques.
A.2.1 Spread spectrum
Amongst the large family of watermarking techniques, our study considers the method reported in
[Cox97], because of its well recognized transparency and robustness properties. Let be the additional information to be inserted in the original frame. Each bit is spread by a large factor
(the so-called chip-rate), to obtain the spread sequence: . The watermark is added to image
yielding a watermarked image , where is the watermark strength.
A.2.2 Quantization index modulation
The Quantization Index Modulation (QIM) is an informed embedding watermarking method which
proved its effectiveness for mono video watermarking techniques, by achieving good robustness while
keeping the practical limits of the perceptual distortions [Has11] [Bel10]. The method starts by
modulating an index or a sequence of indexes with the message to be embedded and then quantizes
the host data by using the associated quantizer or sequence of quantizers.
Initially designed under the binary framework, the QIM methods were generalized to multisymbol QIM in
[Has11] Be there a binary message to be inserted; instead of directly inserting it, a message encoded
into an s-ary alphabet is considered so as to
increase the data payload by a factor of .
For a host signal and a message , the watermarked signal sample y is computed by:
and
where is a fixed quantization step size, a random key and a fixed parameter, . The
standard quantization operation is defined as:
At the decoder, the embedded message bit is recovered by a scalar quantization of the received signal
sample, (a corrupted version of ).
The detection variable is computed as follows:
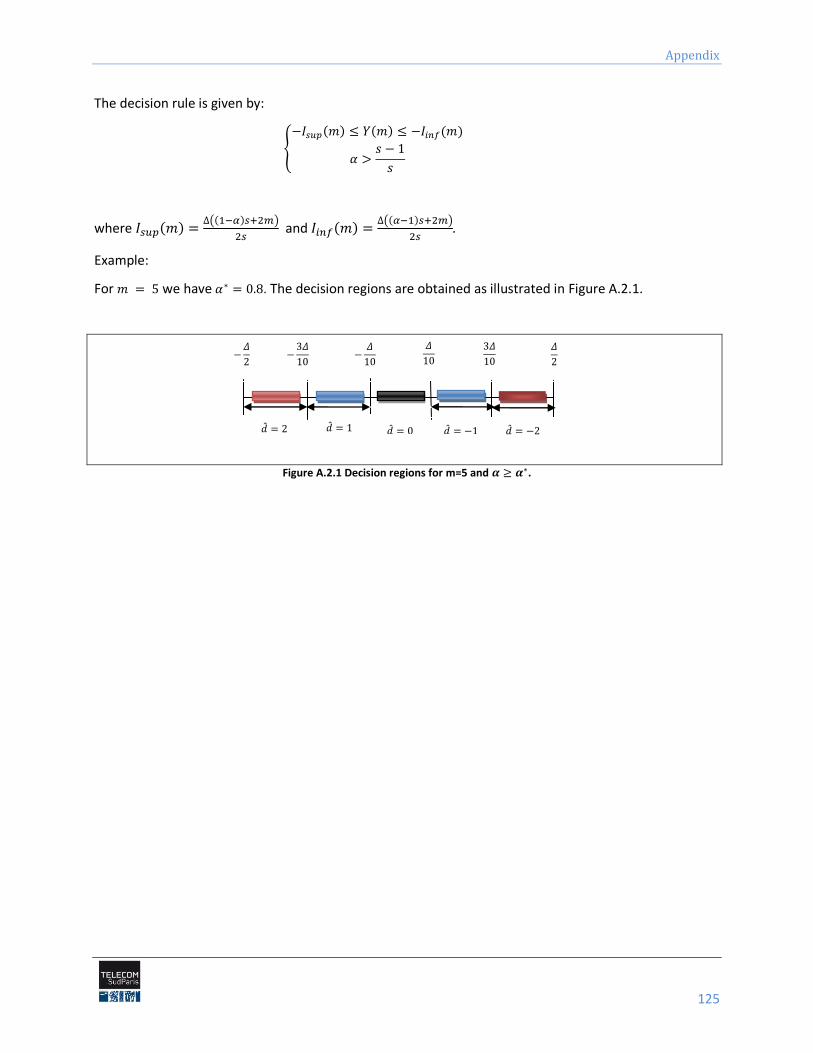
Appendix
125
The decision rule is given by:
where
and
.
Example:
For we have . The decision regions are obtained as illustrated in Figure A.2.1.
Figure A.2.1 Decision regions for m=5 and .
A.Chammem, Robust watermarking techniques for stereoscopic content protection
126
A.3 Transparency evaluation
Subjective evaluation
Table A.3.1 describes the main 8 vision tests (VTs) for good stereopsis as recommended by ITUR- .
Observers must have normal stereopsis, meaning that they must pass test VT-04 for fine stereopsis and
test VT-07 for dynamic stereopsis. The remaining six tests are for more detailed characterization. The
test charts should be viewed from three times the height of the display screen. Below, right and left
thumbnail images are put side by side for crossed free fusion for explanatory purposes.
Tables A.3.2 and A.3.3 give the Mean Opinion Score values for a valid number of subjects and their
error limits, respectively. These values are given for image quality, depth perception and visual
comfort criteria.
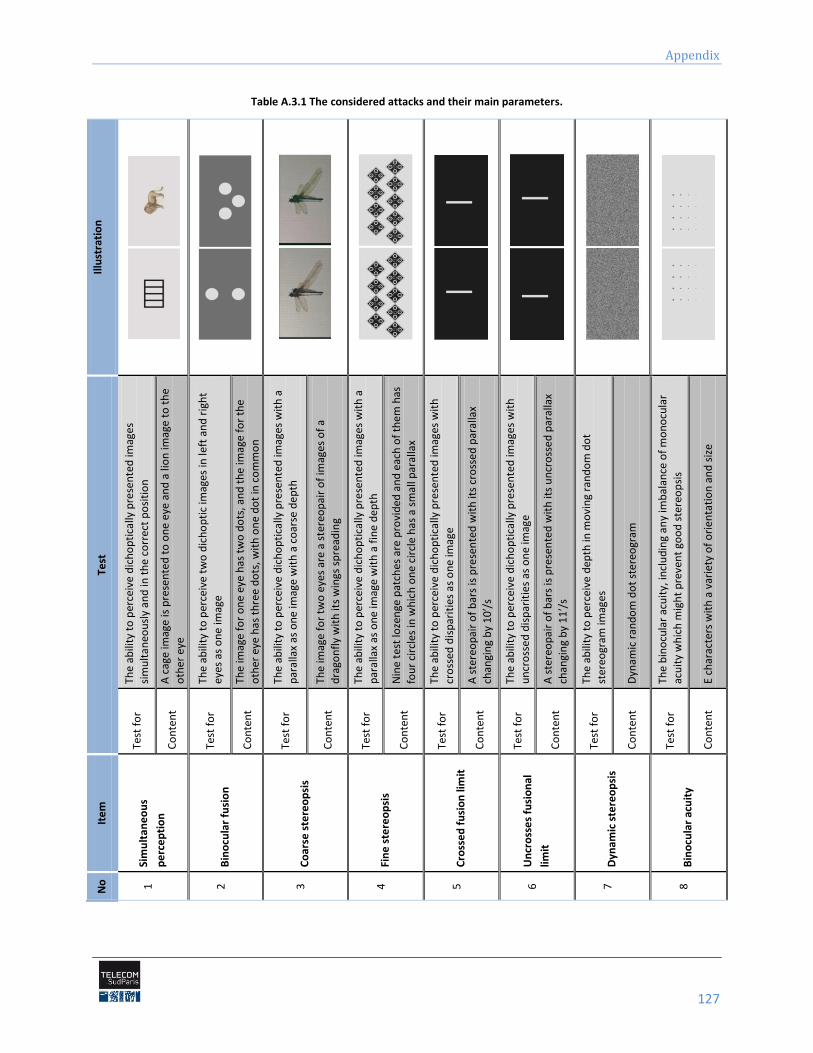
Appendix
127
Table A.3.1 The considered attacks and their main parameters. Il
lust
rati
on
Test
The
abili
ty t
o p
erce
ive
dic
ho
pti
cally
pre
sen
ted
imag
es
sim
ult
aneo
usl
y an
d in
th
e co
rrec
t p
osi
tio
n
A c
age
imag
e is
pre
sen
ted
to
on
e ey
e an
d a
lio
n im
age
to t
he
oth
er e
ye
The
abili
ty t
o p
erce
ive
two
dic
ho
pti
c im
ages
in le
ft a
nd
rig
ht
eyes
as
on
e im
age
The
imag
e fo
r o
ne
eye
has
tw
o d
ots
, an
d t
he
imag
e fo
r th
e
oth
er e
ye h
as t
hre
e d
ots
, wit
h o
ne
do
t in
co
mm
on
The
abili
ty t
o p
erce
ive
dic
ho
pti
cally
pre
sen
ted
imag
es w
ith
a
par
alla
x as
on
e im
age
wit
h a
co
arse
de
pth
The
imag
e fo
r tw
o e
yes
are
a st
ereo
pai
r o
f im
ages
of
a
dra
gon
fly
wit
h it
s w
ings
sp
read
ing
The
abili
ty t
o p
erce
ive
dic
ho
pti
cally
pre
sen
ted
imag
es w
ith
a
par
alla
x as
on
e im
age
wit
h a
fin
e d
epth
Nin
e te
st lo
zen
ge p
atch
es a
re p
rovi
ded
an
d e
ach
of
them
has
fou
r ci
rcle
s in
wh
ich
on
e ci
rcle
has
a s
mal
l par
alla
x
The
abili
ty t
o p
erce
ive
dic
ho
pti
cally
pre
sen
ted
imag
es w
ith
cro
ssed
dis
par
itie
s as
on
e im
age
A s
tere
op
air
of
bar
s is
pre
sen
ted
wit
h it
s cr
oss
ed
par
alla
x
changing by 10′/s
The
abili
ty t
o p
erce
ive
dic
ho
pti
cally
pre
sen
ted
imag
es w
ith
un
cro
sse
d d
isp
arit
ies
as o
ne
imag
e
A s
tere
op
air
of
bar
s is
pre
sen
ted
wit
h it
s u
ncr
oss
ed
par
alla
x
changing by 11′/s
The
abili
ty t
o p
erce
ive
dep
th in
mo
vin
g ra
nd
om
do
t
ster
eogr
am im
ages
Dyn
amic
ran
do
m d
ot
ste
reo
gram
The
bin
ocu
lar
acu
ity,
incl
ud
ing
any
imb
alan
ce o
f m
on
ocu
lar
acu
ity
wh
ich
mig
ht
pre
ven
t go
od
ste
reo
psi
s
E ch
arac
ters
wit
h a
var
iety
of
ori
en
tati
on
an
d s
ize
Test
fo
r
Co
nte
nt
Test
fo
r
Co
nte
nt
Test
fo
r
Co
nte
nt
Test
fo
r
Co
nte
nt
Test
fo
r
Co
nte
nt
Test
fo
r
Co
nte
nt
Test
fo
r
Co
nte
nt
Test
fo
r
Co
nte
nt
Ite
m
Sim
ult
ane
ou
s
pe
rce
pti
on
Bin
ocu
lar
fusi
on
Co
arse
ste
reo
psi
s
Fin
e s
tere
op
sis
Cro
sse
d f
usi
on
lim
it
Un
cro
sse
s fu
sio
nal
limit
Dyn
amic
ste
reo
psi
s
Bin
ocu
lar
acu
ity
No
1
2
3
4
5
6
7
8
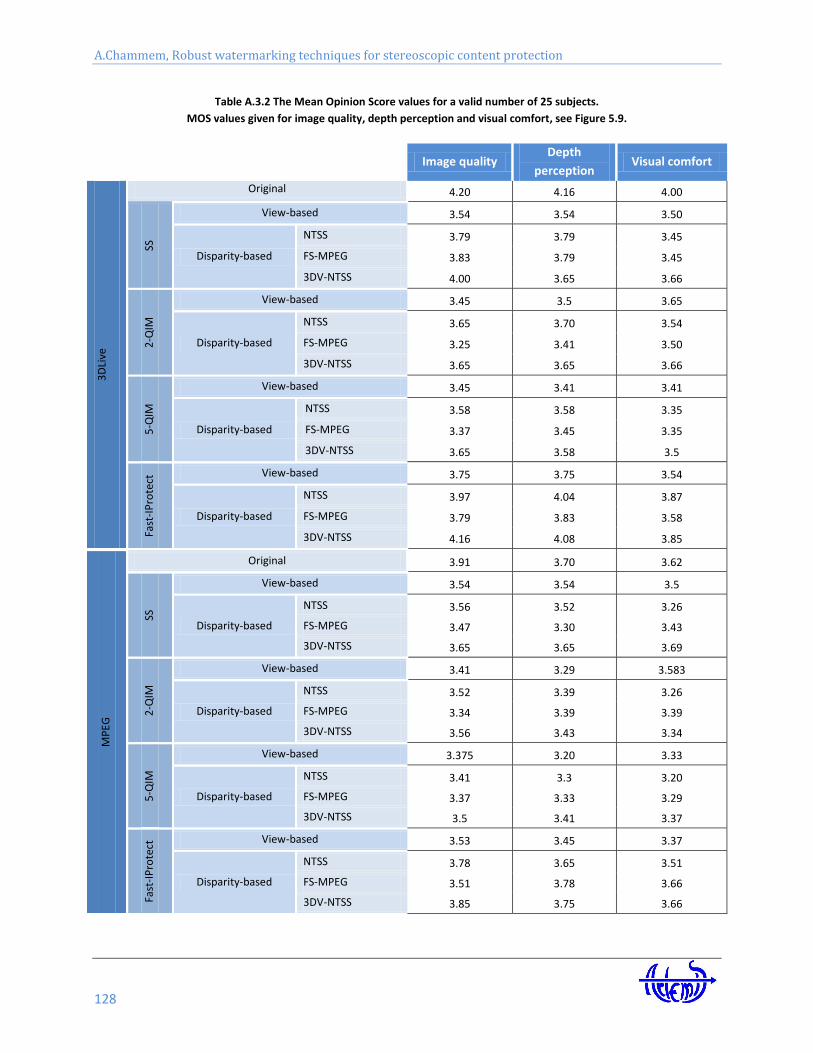
A.Chammem, Robust watermarking techniques for stereoscopic content protection
128
Table A.3.2 The Mean Opinion Score values for a valid number of 25 subjects.
MOS values given for image quality, depth perception and visual comfort, see Figure 5.9.
Image quality
Depth
perception Visual comfort
3D
Live
Original 4.20 4.16 4.00
SS
View-based 3.54 3.54 3.50
Disparity-based
NTSS 3.79 3.79 3.45
FS-MPEG 3.83 3.79 3.45
3DV-NTSS 4.00 3.65 3.66
2-Q
IM
View-based 3.45 3.5 3.65
Disparity-based
NTSS 3.65 3.70 3.54
FS-MPEG 3.25 3.41 3.50
3DV-NTSS 3.65 3.65 3.66
5-Q
IM
View-based 3.45 3.41 3.41
Disparity-based
NTSS 3.58 3.58 3.35
FS-MPEG 3.37 3.45 3.35
3DV-NTSS 3.65 3.58 3.5
Fast
-IP
rote
ct View-based 3.75 3.75 3.54
Disparity-based
NTSS 3.97 4.04 3.87
FS-MPEG 3.79 3.83 3.58
3DV-NTSS 4.16 4.08 3.85
MP
EG
Original 3.91 3.70 3.62
SS
View-based 3.54 3.54 3.5
Disparity-based
NTSS 3.56 3.52 3.26
FS-MPEG 3.47 3.30 3.43
3DV-NTSS 3.65 3.65 3.69
2-Q
IM
View-based 3.41 3.29 3.583
Disparity-based
NTSS 3.52 3.39 3.26
FS-MPEG 3.34 3.39 3.39
3DV-NTSS 3.56 3.43 3.34
5-Q
IM
View-based 3.375 3.20 3.33
Disparity-based
NTSS 3.41 3.3 3.20
FS-MPEG 3.37 3.33 3.29
3DV-NTSS 3.5 3.41 3.37
Fast
-IP
rote
ct View-based 3.53 3.45 3.37
Disparity-based
NTSS 3.78 3.65 3.51
FS-MPEG 3.51 3.78 3.66
3DV-NTSS 3.85 3.75 3.66
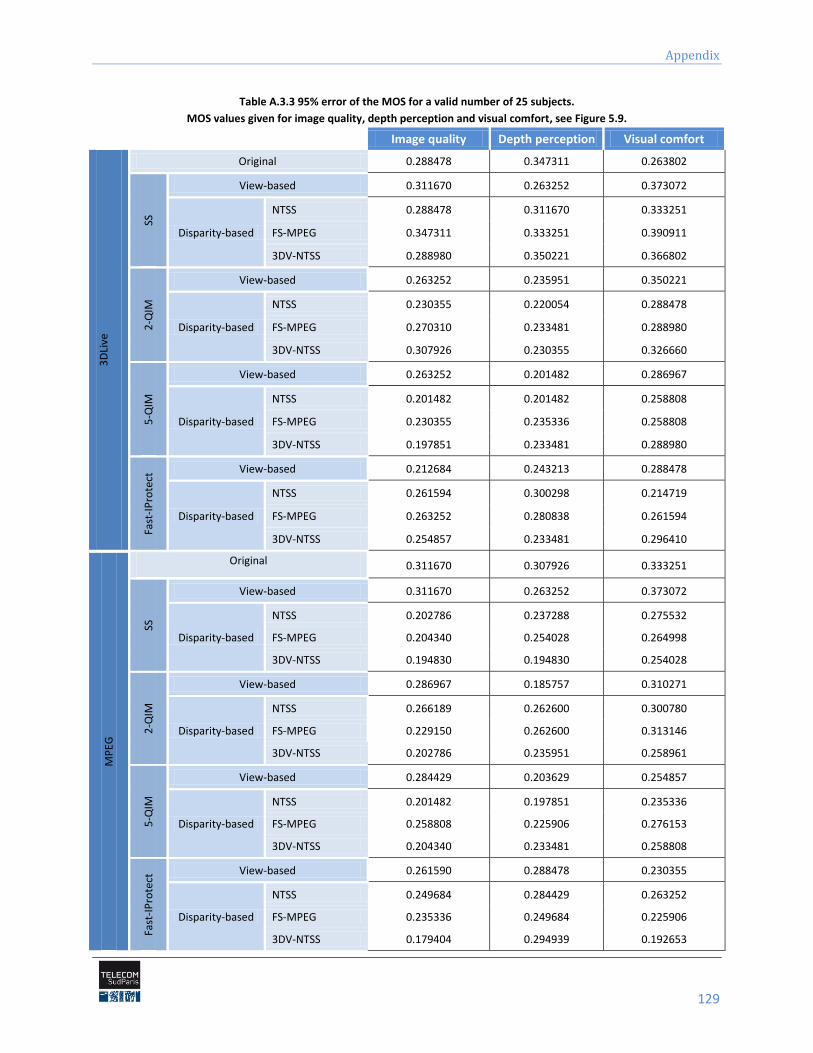
Appendix
129
Table A.3.3 95% error of the MOS for a valid number of 25 subjects.
MOS values given for image quality, depth perception and visual comfort, see Figure 5.9.
Image quality Depth perception Visual comfort
3D
Live
Original 0.288478 0.347311 0.263802 SS
View-based 0.311670 0.263252 0.373072
Disparity-based
NTSS 0.288478 0.311670 0.333251
FS-MPEG 0.347311 0.333251 0.390911
3DV-NTSS 0.288980 0.350221 0.366802
2-Q
IM
View-based 0.263252 0.235951 0.350221
Disparity-based
NTSS 0.230355 0.220054 0.288478
FS-MPEG 0.270310 0.233481 0.288980
3DV-NTSS 0.307926 0.230355 0.326660
5-Q
IM
View-based 0.263252 0.201482 0.286967
Disparity-based
NTSS 0.201482 0.201482 0.258808
FS-MPEG 0.230355 0.235336 0.258808
3DV-NTSS 0.197851 0.233481 0.288980
Fast
-IP
rote
ct View-based 0.212684 0.243213 0.288478
Disparity-based
NTSS 0.261594 0.300298 0.214719
FS-MPEG 0.263252 0.280838 0.261594
3DV-NTSS 0.254857 0.233481 0.296410
MP
EG
Original 0.311670 0.307926 0.333251
SS
View-based 0.311670 0.263252 0.373072
Disparity-based
NTSS 0.202786 0.237288 0.275532
FS-MPEG 0.204340 0.254028 0.264998
3DV-NTSS 0.194830 0.194830 0.254028
2-Q
IM
View-based 0.286967 0.185757 0.310271
Disparity-based
NTSS 0.266189 0.262600 0.300780
FS-MPEG 0.229150 0.262600 0.313146
3DV-NTSS 0.202786 0.235951 0.258961
5-Q
IM
View-based 0.284429 0.203629 0.254857
Disparity-based
NTSS 0.201482 0.197851 0.235336
FS-MPEG 0.258808 0.225906 0.276153
3DV-NTSS 0.204340 0.233481 0.258808
Fast
-IP
rote
ct View-based 0.261590 0.288478 0.230355
Disparity-based
NTSS 0.249684 0.284429 0.263252
FS-MPEG 0.235336 0.249684 0.225906
3DV-NTSS 0.179404 0.294939 0.192653
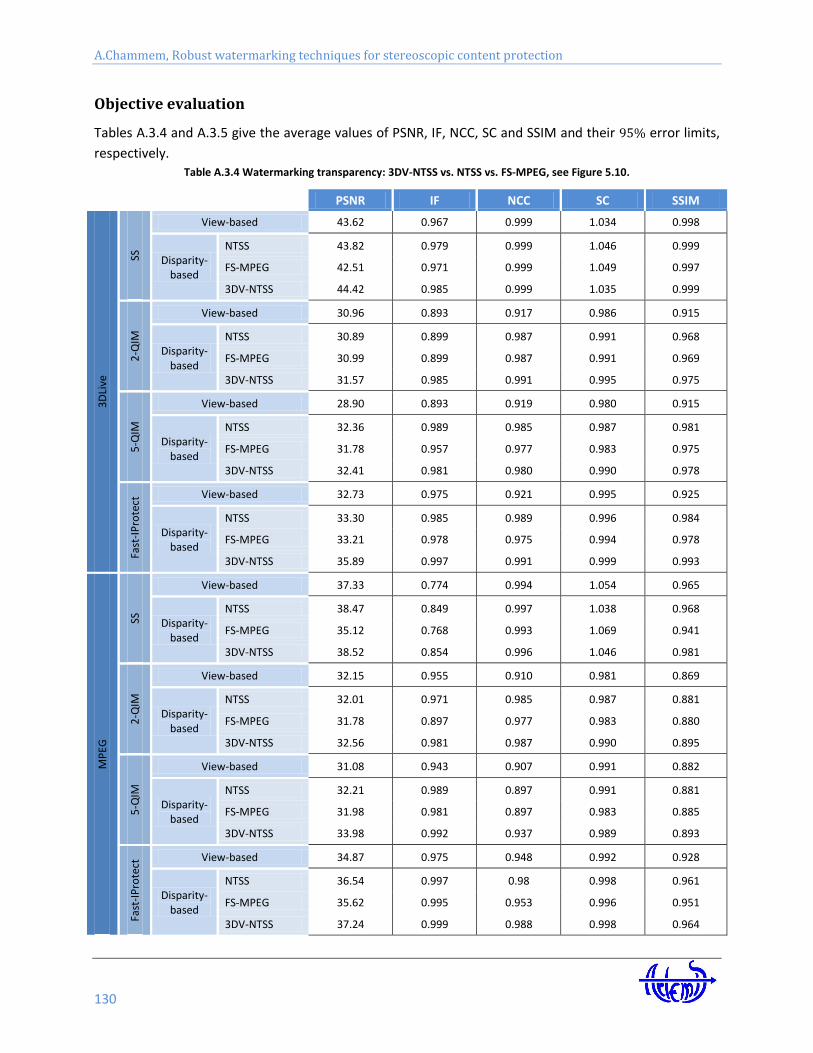
A.Chammem, Robust watermarking techniques for stereoscopic content protection
130
Objective evaluation
Tables A.3.4 and A.3.5 give the average values of PSNR, IF, NCC, SC and SSIM and their error limits,
respectively. Table A.3.4 Watermarking transparency: 3DV-NTSS vs. NTSS vs. FS-MPEG, see Figure 5.10.
PSNR IF NCC SC SSIM
3D
Live
SS
View-based 43.62 0.967 0.999 1.034 0.998
Disparity-based
NTSS 43.82 0.979 0.999 1.046 0.999
FS-MPEG 42.51 0.971 0.999 1.049 0.997
3DV-NTSS 44.42 0.985 0.999 1.035 0.999
2-Q
IM
View-based 30.96 0.893 0.917 0.986 0.915
Disparity-based
NTSS 30.89 0.899 0.987 0.991 0.968
FS-MPEG 30.99 0.899 0.987 0.991 0.969
3DV-NTSS 31.57 0.985 0.991 0.995 0.975
5-Q
IM
View-based 28.90 0.893 0.919 0.980 0.915
Disparity-based
NTSS 32.36 0.989 0.985 0.987 0.981
FS-MPEG 31.78 0.957 0.977 0.983 0.975
3DV-NTSS 32.41 0.981 0.980 0.990 0.978
Fast
-IP
rote
ct View-based 32.73 0.975 0.921 0.995 0.925
Disparity-based
NTSS 33.30 0.985 0.989 0.996 0.984
FS-MPEG 33.21 0.978 0.975 0.994 0.978
3DV-NTSS 35.89 0.997 0.991 0.999 0.993
MP
EG
SS
View-based 37.33 0.774 0.994 1.054 0.965
Disparity-based
NTSS 38.47 0.849 0.997 1.038 0.968
FS-MPEG 35.12 0.768 0.993 1.069 0.941
3DV-NTSS 38.52 0.854 0.996 1.046 0.981
2-Q
IM
View-based 32.15 0.955 0.910 0.981 0.869
Disparity-based
NTSS 32.01 0.971 0.985 0.987 0.881
FS-MPEG 31.78 0.897 0.977 0.983 0.880
3DV-NTSS 32.56 0.981 0.987 0.990 0.895
5-Q
IM
View-based 31.08 0.943 0.907 0.991 0.882
Disparity-based
NTSS 32.21 0.989 0.897 0.991 0.881
FS-MPEG 31.98 0.981 0.897 0.983 0.885
3DV-NTSS 33.98 0.992 0.937 0.989 0.893
Fast
-IP
rote
ct View-based 34.87 0.975 0.948 0.992 0.928
Disparity-based
NTSS 36.54 0.997 0.98 0.998 0.961
FS-MPEG 35.62 0.995 0.953 0.996 0.951
3DV-NTSS 37.24 0.999 0.988 0.998 0.964
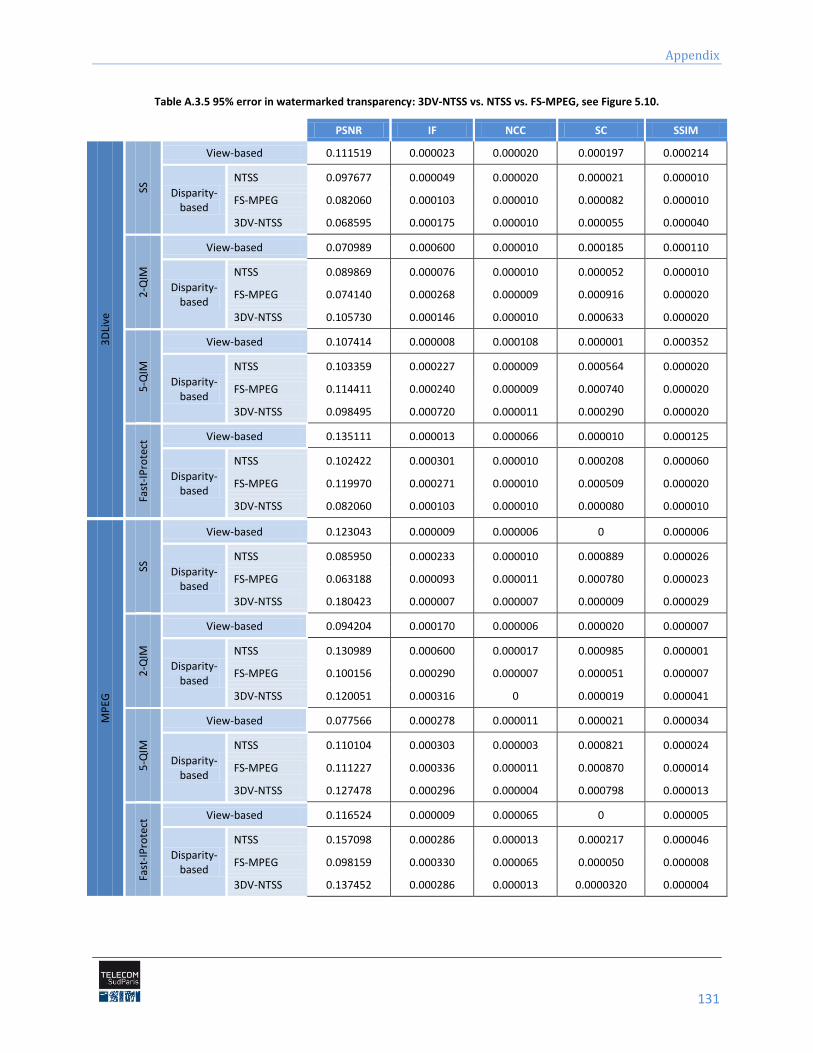
Appendix
131
Table A.3.5 95% error in watermarked transparency: 3DV-NTSS vs. NTSS vs. FS-MPEG, see Figure 5.10.
PSNR IF NCC SC SSIM
3D
Live
SS
View-based 0.111519 0.000023 0.000020 0.000197 0.000214
Disparity-based
NTSS 0.097677 0.000049 0.000020 0.000021 0.000010
FS-MPEG 0.082060 0.000103 0.000010 0.000082 0.000010
3DV-NTSS 0.068595 0.000175 0.000010 0.000055 0.000040
2-Q
IM
View-based 0.070989 0.000600 0.000010 0.000185 0.000110
Disparity-based
NTSS 0.089869 0.000076 0.000010 0.000052 0.000010
FS-MPEG 0.074140 0.000268 0.000009 0.000916 0.000020
3DV-NTSS 0.105730 0.000146 0.000010 0.000633 0.000020
5-Q
IM
View-based 0.107414 0.000008 0.000108 0.000001 0.000352
Disparity-based
NTSS 0.103359 0.000227 0.000009 0.000564 0.000020
FS-MPEG 0.114411 0.000240 0.000009 0.000740 0.000020
3DV-NTSS 0.098495 0.000720 0.000011 0.000290 0.000020
Fast
-IP
rote
ct View-based 0.135111 0.000013 0.000066 0.000010 0.000125
Disparity-based
NTSS 0.102422 0.000301 0.000010 0.000208 0.000060
FS-MPEG 0.119970 0.000271 0.000010 0.000509 0.000020
3DV-NTSS 0.082060 0.000103 0.000010 0.000080 0.000010
MP
EG
SS
View-based 0.123043 0.000009 0.000006 0 0.000006
Disparity-based
NTSS 0.085950 0.000233 0.000010 0.000889 0.000026
FS-MPEG 0.063188 0.000093 0.000011 0.000780 0.000023
3DV-NTSS 0.180423 0.000007 0.000007 0.000009 0.000029
2-Q
IM
View-based 0.094204 0.000170 0.000006 0.000020 0.000007
Disparity-based
NTSS 0.130989 0.000600 0.000017 0.000985 0.000001
FS-MPEG 0.100156 0.000290 0.000007 0.000051 0.000007
3DV-NTSS 0.120051 0.000316 0 0.000019 0.000041
5-Q
IM
View-based 0.077566 0.000278 0.000011 0.000021 0.000034
Disparity-based
NTSS 0.110104 0.000303 0.000003 0.000821 0.000024
FS-MPEG 0.111227 0.000336 0.000011 0.000870 0.000014
3DV-NTSS 0.127478 0.000296 0.000004 0.000798 0.000013
Fast
-IP
rote
ct View-based 0.116524 0.000009 0.000065 0 0.000005
Disparity-based
NTSS 0.157098 0.000286 0.000013 0.000217 0.000046
FS-MPEG 0.098159 0.000330 0.000065 0.000050 0.000008
3DV-NTSS 0.137452 0.000286 0.000013 0.0000320 0.000004
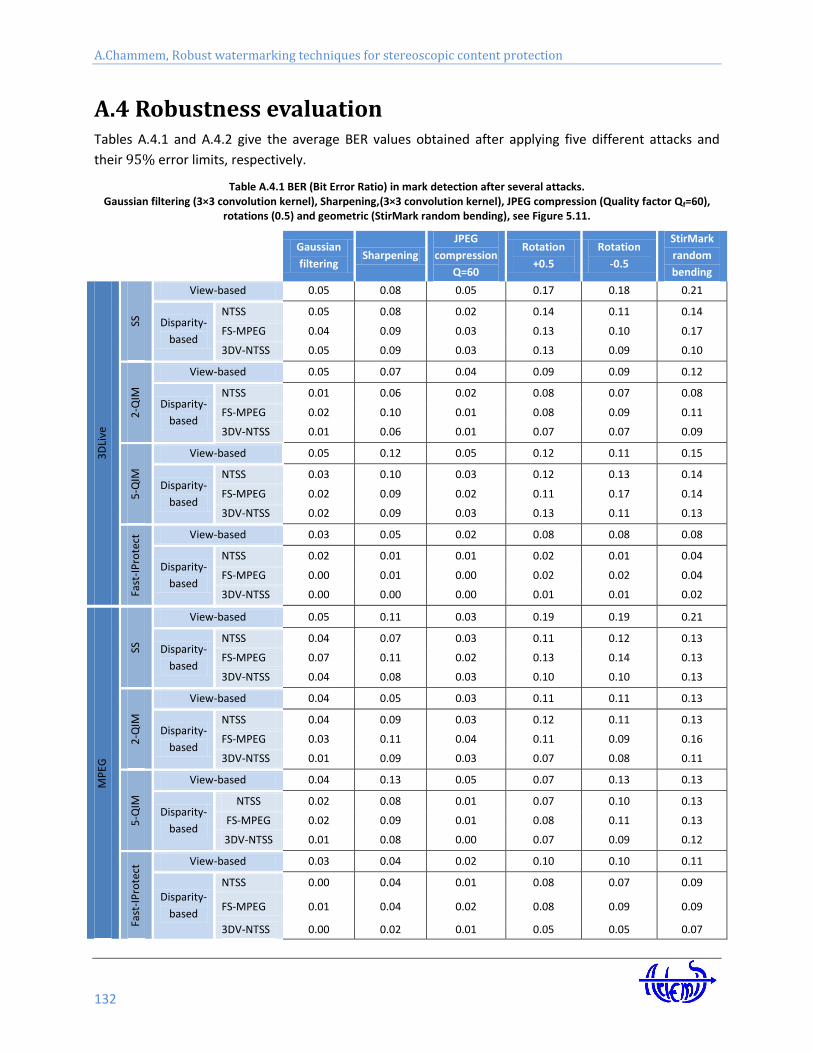
A.Chammem, Robust watermarking techniques for stereoscopic content protection
132
A.4 Robustness evaluation Tables A.4.1 and A.4.2 give the average BER values obtained after applying five different attacks and
their error limits, respectively.
Table A.4.1 BER (Bit Error Ratio) in mark detection after several attacks. Gaussian filtering (3×3 convolution kernel), Sharpening,(3×3 convolution kernel), JPEG compression (Quality factor Qf=60),
rotations (0.5) and geometric (StirMark random bending), see Figure 5.11.
Gaussian
filtering Sharpening
JPEG
compression
Q=60
Rotation
+0.5
Rotation
-0.5
StirMark
random
bending
3D
Live
SS
View-based 0.05 0.08 0.05 0.17 0.18 0.21
Disparity-
based
NTSS 0.05 0.08 0.02 0.14 0.11 0.14
FS-MPEG 0.04 0.09 0.03 0.13 0.10 0.17
3DV-NTSS 0.05 0.09 0.03 0.13 0.09 0.10
2-Q
IM
View-based 0.05 0.07 0.04 0.09 0.09 0.12
Disparity-
based
NTSS 0.01 0.06 0.02 0.08 0.07 0.08
FS-MPEG 0.02 0.10 0.01 0.08 0.09 0.11
3DV-NTSS 0.01 0.06 0.01 0.07 0.07 0.09
5-Q
IM
View-based 0.05 0.12 0.05 0.12 0.11 0.15
Disparity-
based
NTSS 0.03 0.10 0.03 0.12 0.13 0.14
FS-MPEG 0.02 0.09 0.02 0.11 0.17 0.14
3DV-NTSS 0.02 0.09 0.03 0.13 0.11 0.13
Fast
-IP
rote
ct View-based 0.03 0.05 0.02 0.08 0.08 0.08
Disparity-
based
NTSS 0.02 0.01 0.01 0.02 0.01 0.04
FS-MPEG 0.00 0.01 0.00 0.02 0.02 0.04
3DV-NTSS 0.00 0.00 0.00 0.01 0.01 0.02
MP
EG
SS
View-based 0.05 0.11 0.03 0.19 0.19 0.21
Disparity-
based
NTSS 0.04 0.07 0.03 0.11 0.12 0.13
FS-MPEG 0.07 0.11 0.02 0.13 0.14 0.13
3DV-NTSS 0.04 0.08 0.03 0.10 0.10 0.13
2-Q
IM
View-based 0.04 0.05 0.03 0.11 0.11 0.13
Disparity-
based
NTSS 0.04 0.09 0.03 0.12 0.11 0.13
FS-MPEG 0.03 0.11 0.04 0.11 0.09 0.16
3DV-NTSS 0.01 0.09 0.03 0.07 0.08 0.11
5-Q
IM
View-based 0.04 0.13 0.05 0.07 0.13 0.13
Disparity-
based
NTSS 0.02 0.08 0.01 0.07 0.10 0.13
FS-MPEG 0.02 0.09 0.01 0.08 0.11 0.13
3DV-NTSS 0.01 0.08 0.00 0.07 0.09 0.12
Fast
-IP
rote
ct View-based 0.03 0.04 0.02 0.10 0.10 0.11
Disparity-
based
NTSS 0.00 0.04 0.01 0.08 0.07 0.09
FS-MPEG 0.01 0.04 0.02 0.08 0.09 0.09
3DV-NTSS 0.00 0.02 0.01 0.05 0.05 0.07
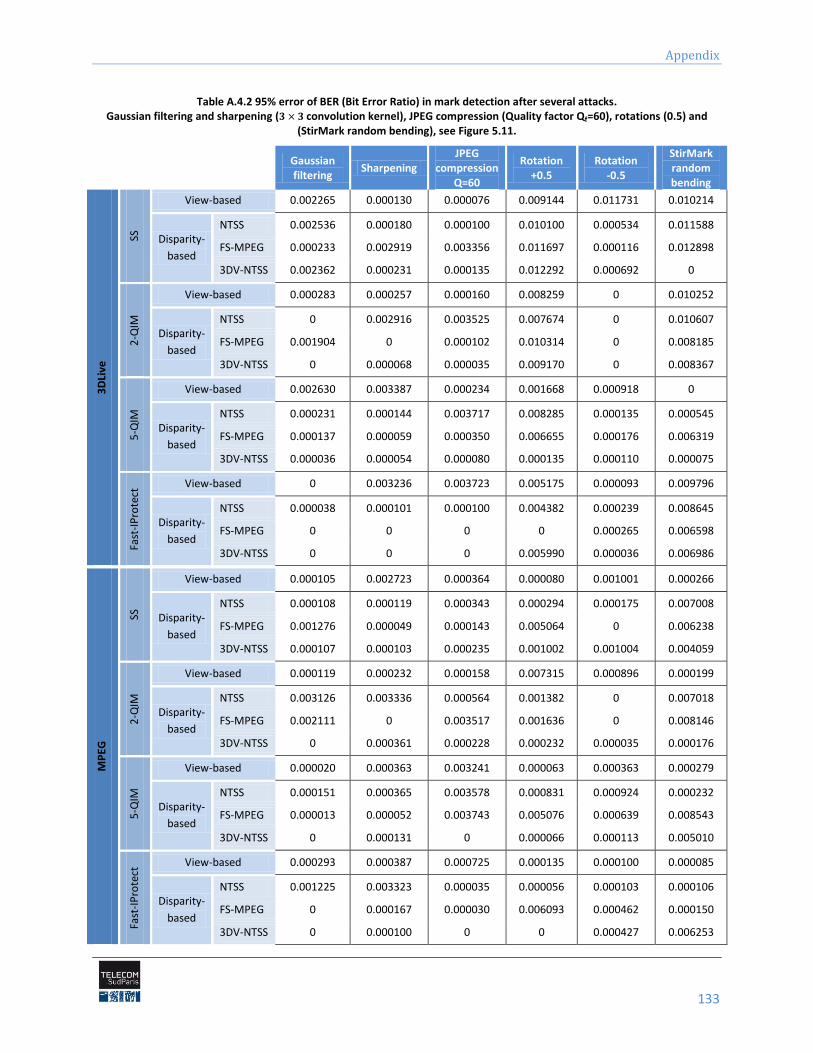
Appendix
133
Table A.4.2 95% error of BER (Bit Error Ratio) in mark detection after several attacks. Gaussian filtering and sharpening ( convolution kernel), JPEG compression (Quality factor Qf=60), rotations (0.5) and
(StirMark random bending), see Figure 5.11.
Gaussian filtering
Sharpening JPEG
compression Q=60
Rotation +0.5
Rotation -0.5
StirMark random bending
3D
Live
SS
View-based 0.002265 0.000130 0.000076 0.009144 0.011731 0.010214
Disparity-
based
NTSS 0.002536 0.000180 0.000100 0.010100 0.000534 0.011588
FS-MPEG 0.000233 0.002919 0.003356 0.011697 0.000116 0.012898
3DV-NTSS 0.002362 0.000231 0.000135 0.012292 0.000692 0
2-Q
IM
View-based 0.000283 0.000257 0.000160 0.008259 0 0.010252
Disparity-
based
NTSS 0 0.002916 0.003525 0.007674 0 0.010607
FS-MPEG 0.001904 0 0.000102 0.010314 0 0.008185
3DV-NTSS 0 0.000068 0.000035 0.009170 0 0.008367
5-Q
IM
View-based 0.002630 0.003387 0.000234 0.001668 0.000918 0
Disparity-
based
NTSS 0.000231 0.000144 0.003717 0.008285 0.000135 0.000545
FS-MPEG 0.000137 0.000059 0.000350 0.006655 0.000176 0.006319
3DV-NTSS 0.000036 0.000054 0.000080 0.000135 0.000110 0.000075
Fast
-IP
rote
ct View-based 0 0.003236 0.003723 0.005175 0.000093 0.009796
Disparity-
based
NTSS 0.000038 0.000101 0.000100 0.004382 0.000239 0.008645
FS-MPEG 0 0 0 0 0.000265 0.006598
3DV-NTSS 0 0 0 0.005990 0.000036 0.006986
MP
EG
SS
View-based 0.000105 0.002723 0.000364 0.000080 0.001001 0.000266
Disparity-
based
NTSS 0.000108 0.000119 0.000343 0.000294 0.000175 0.007008
FS-MPEG 0.001276 0.000049 0.000143 0.005064 0 0.006238
3DV-NTSS 0.000107 0.000103 0.000235 0.001002 0.001004 0.004059
2-Q
IM
View-based 0.000119 0.000232 0.000158 0.007315 0.000896 0.000199
Disparity-
based
NTSS 0.003126 0.003336 0.000564 0.001382 0 0.007018
FS-MPEG 0.002111 0 0.003517 0.001636 0 0.008146
3DV-NTSS 0 0.000361 0.000228 0.000232 0.000035 0.000176
5-Q
IM
View-based 0.000020 0.000363 0.003241 0.000063 0.000363 0.000279
Disparity-
based
NTSS 0.000151 0.000365 0.003578 0.000831 0.000924 0.000232
FS-MPEG 0.000013 0.000052 0.003743 0.005076 0.000639 0.008543
3DV-NTSS 0 0.000131 0 0.000066 0.000113 0.005010
Fast
-IP
rote
ct View-based 0.000293 0.000387 0.000725 0.000135 0.000100 0.000085
Disparity-
based
NTSS 0.001225 0.003323 0.000035 0.000056 0.000103 0.000106
FS-MPEG 0 0.000167 0.000030 0.006093 0.000462 0.000150
3DV-NTSS 0 0.000100 0 0 0.000427 0.006253

References
135
References
[3DF13] 3D Film Factory, “Cameras Rigs, 3D Production, 3D Training”, (2013).
http://www.3dfilmfactory.com-3D
[3Dl12] http://3dlive-project.com.
[Ala03] Alattar, A. M., Lin, E. T., Celik, M. U., “Watermarking low bit-rate advanced simple profile MPEG-4
bitstreams”, IEEE International Conference on Acoustics, Speech, and Signal Processing,
Proc.(ICASSP'03), Vol. 3, pp. III-513, (2003).
[Bar00] M. Barni, F. Bartolini, N. Checcacci, V. Cappellini, “Object watermarking for MPEG4 video streams
copyright protection in Security and Watermarking of Multimedia Contents”, Proc. SPIE Vol. 3971,
(2000).
[Bar01a] Bartolini F., Tefas A., Barni M., Pitas I., "Image authentication techniques for surveillance applications",
IEEE Proc., Vol. 89 No. 10, pp. 1403-1418, (2001).
[Bar01b] Barni M., Bartolini F., Piva A. “Improved wavelet-based watermarking through pixel-wise masking,”
IEEE Trans on Image Processing, Vol.10 No.5, pp. 783-791, (2001).
[Bel10] Belhaj M., Mitrea M., Duta S., Prêteux F., "MPEG-4 AVC robust video watermarking based on QIM and
perceptual masking", Int. Conf. on Communication, Bucharest, (2010).
[Bha09] Bhatnager G., Kumar S., Raman B., Sukavanam N., "Stereo coding via digital watermarking", Journal of
Electronic Imaging, Vol. 18 No. 3, (2009).
[Bis95] Bishop C. M., Neural Networks for Pattern Recognition, Oxford University Press, Oxford, (1995).
[Ble08] Blender Foundation / www.bigbuckbunny.org, copyright 2008, (2008).
[Blo99] Bloom J., Cox I., Kalker T., Linnartz J., Miller M., Traw C., "Copy protection for dvd video", IEEE Proc.,
Vol. 87 No. 7, pp. 1267-1276, (1999).
[BT00] ITU-R, "Subjective assessment of stereoscopic television pictures", Tech. Rep. BT.1438, (2000).
[BT02] ITU-R, "Methodology for the subjective assessment of the quality of television pictures", Tech.Rep.
BT.500-11, ITU-R, (2002).
[BT98] ITU-R, "Subjective assessment methods for image quality in high-definition television", Tech. Rep.
BT.710-4, ITU-R, (1998).
[Cha10] Chammem A., Mitrea M., Prêteux F., "Speeding-up the hybrid video watermarking techniques in the
DWT domain", Proc. SPIE Electronic Imaging (2010), Vol. 6845, (2010).
A.Chammem, Robust watermarking techniques for stereoscopic content protection
136
[Cha11] Chammem A., Mitrea M., Prêteux F., "DWT based stereoscopic image watermarking", Proc. SPIE, Vol.
7863 No. 26, (2011).
[Che12] Chen H., Zhu Y., "An Effective Stereo Image Coding Method with Reversible Watermarking", Journal of
Computational Information Systems, Vol. 8 No.7, pp. 2761-2768, (2012).
[Chi11] Chikkerur S., Sundaram V., Reisslein M., Karam L. J., "Objective video quality assessment method: A
Classification, Review, and Performance Comparison", School of Electrical, Computer & Energy
Engineering, Journal & Magazines, Vol. 57 No. 2, pp. 165-182, (2011).
[Col07] Coltuc D., "On stereo embedding by reversible watermarking", IEEE Int. Symposium on Signals, Circuits
and Systems, Vol. 2, (2007).
[Cos83] Costa M. H. M., "Writing on dirty paper", IEEE Trans. on Information Theory, Vol. 29 No. 3, pp. 439-
441, (1983).
[Cox02] Cox I., Miller M., Bloom J., Digital watermarking, Morgan Kaufmann, (2002).
[Cox07] Cox, I., Miller, M., Bloom, J., Fridrich, J., & Kalker, T., Digital watermarking and steganography. Morgan
Kaufmann, (2007).
[Cox97] Cox I., KIian .J, Leighton F.T., Shamoon T., "Secure Spread Spectrum watermarking for multimedia",
IEEE Trans. on Image Processing, Vol. 6 No. 12, (1997).
[Dem77] Dempster A. P., Laird N. M., Rubin D.B., "Maximum Likelihood from Incomplete Data via the EM
algorithm", J. Roy. Stat. Soc. (B), pp. 38-39, (1977).
[Dig03] Digimarc Corporation, "Digimarc Comments to USPTO Regarding Technological Protection Systemd for
Digitized Copyrighted Works", (2003).
[Din06] Ding L., Chien S., Chen L., "Joint prediction algorithm and architecture for stereo video hybrid coding
systems", IEEE Trans. on Circuits Syst. Video Technol., Vol.16 No. 11, pp. 1324-1337, (2006).
[Dod05] Dodgson N. A., "Autostereoscopic 3D displays", Computer, Vol. 38 No. 8, pp. 31-36, (2005).
[Don03a] Dong-Choon H., Kyung-Hoon B., Eun-Soo K., "Stereo image watermarking scheme based-on discrete
wavelet transform and adaptive disparity estimation", Mathematics of data/image coding,
compression, and encryption, with applications. Conf. No. 6, pp. 196-205, (2003).
[Don03b] Dong-Choon H., Kyung-Hoon B., Eun-Soo K. , "Real-time stereo image watermarking using discrete
cosine transform and adaptive disparity maps", Proc. SPIE, Multimedia Systems and Applications VI,
Vol. 5241 No. 233, (2003).
[Dum08] Dumitru O., Mitrea M., Prêteux F., "Video Modeling in the DWT Domain", Proc. SPIE, Vol. 7000, (2008).
References
137
[Egg03] Eggers J. J., Bäuml R., Tzschoppe R., Girod B., "Scalar Costa scheme for information embedding", IEEE
Trans. on Signal Processing, Vol. 51 No. 4, (2003).
[Ell09] Ellinas J. N., "Reversible Watermarking on Stereo Image Sequences", Int. journal of Signal processing,
(2009).
[Esk95] Eskicioglu M. A., Fisher P. S., "Image Quality Measures and their performance", IEEE Trans. on
Communications, Vol. 43 No. 12, (1995).
[Feh03] Fehn C., "A 3D-TV approach using depth-image-based rendering (DIBR)", Proc. of IASTED Conf. on
Visualization, Imaging and Image Processing, pp. 482-487, (2003).
[Fet09] Fetita, C., Ortner, M., Brillet, P.-Y., Preteux, F. and Grenier, P., “A morphological-aggregative approach
for 3D segmentation of pulmonary airways from generic MSCT acquisitions”, Second International
Workshop on Pulmonary Image Analysis, MICCAI 09, pp.215-226 (2009).
[Fra02] François, A. R., Medioni, G. G., & Waupotitsch, R., "Reconstructing mirror symmetric scenes from a
single view using 2-view stereo geometry". IEEE Proc. of the 16th Int. Conf. In Pattern Recognition, Vol.
4, pp. 12-16, (2002).
[Fra11] Franco-Contreras J., Baudry S., Doërr G., "Virtual view invariant domain for 3D video blind
watermarking", IEEE Int. Conf. on Image Processing, (2011).
[Gal11] Galiano V., Lopez O., Malumbres M. P., Migallon H., "Improving the discrete wavelet transform
computation from multicore to GPU-based algorithms", Proc. of the 11th Int. Conf. on Computational
and Mathematical Methods in Science and Engineering, (2011).
[Gol10] Goldmann L., De Simone F., Ebrahimi T., "A comprehensive database and subjective evaluation
methodology for quality of experience in stereoscopic video", Proc. SPIE, Vol. 7526, (2010).
[Gre04] Grenier P., Beigelman-Aubry, C., Fetita, C., Martin-Bouyer, Y., “Multi-Detector-row CT of the airways in
U.J. Schoepf (Ed.)”, Multi-detector-Row CT of the Thorax, Springer-Verlag, pp.63-80, (2004).
[Gro01] Grosbois R., Ebrahimi T., "Watermarking in the JPEG 2000 domain". IEEE 4th Workshop In Multimedia
Signal Processing, pp. 339-344, (2001).
[Hal05] Halle M., "Auto-stereoscopic displays and computer graphics", ACM SIGGRAPH 2005 Courses. ACM,
(2005).
[Har00] Hartung F., Ramme F., "Digital rights management and watermarking of multimedia content for m-
commerce applications", IEEE Communications Magazine, Vol. 38 No. 11, pp. 78-84, (2000).
[Has11] Hasnaoui M., Belhaj M., Mitrea M., Prêteux F., "mQIM principles for MPEG-4 AVC watermarking", SPIE
Photonics West, (2011).
A.Chammem, Robust watermarking techniques for stereoscopic content protection
138
[Hoi11] Hoikkala S., "Mobile3DTVcontent delivery optimization over DVB-H system", (2011).
http://sp.cs.tut.fi/mobile3dtv/stereo-video/.
[Hol00] M. Holliman, W. Macy, and M. Y. Yeung, “Robust frame dependent video watermarking,” in Security
and Watermarking of Multimedia Contents, Proc. SPIE Vol. 3971, (2000).
[Jai81] Jain J. R., "Displacement measurement and its application in inter-frame image coding", IEEE Trans.
Communication, Vol. 29 No. 12, pp. 1799-1808, (1981).
[Jia06] Jiang G, Yu M., Shao F., Yang Y., Dong H., "Fast multi-view disparity estimation for multi-view video
systems", in 8th Int. Conf. Advanced Concepts for Intelligent Vision Systems, ACIVS, Vol. 4179, pp. 493-
500, Springer, (2006).
[Kal99] Kalker T., Depovere G., Haitsma J., Maes M., "A video watermarking system for broadcast monitoring",
Proc. SPIE in Security and Watermarking of Multimedia Contents, Vol. 3657, pp. 103-112, (1999).
[Kaw02] Kawai T., "3D displays and applications", Displays, Vol. 23 No. 1, pp. 49-56, (2002).
[Kin11] King P., "Global 3D Enabled Device Sales Forecast", Strategy Analytics, (2011).
http://www.strategyanalytics.com
[Koc10] Kockoth B., “White paper for digital Stereo System’, media systems, (2010).
[Kog81] Koga T., "Motion compensated inter-frame coding for video conferencing", Proc. in National
Telecommunications Conf., NTC ‘81, pp.G5.3.1–G5.3.5, (1981).
[Kua99] Kuang K., Hosur P. I., "Core experimental results of fast motion estimation based on new test
conditions (Q4a)", ISO/IEC JTC1/SC29/WG11/M4934, (1999).
[Kum09] Kumar S., Raman B., Thakur M., "Real coded genetic algorithm based stereo image watermarking",
IJSDA Int. Journal of Secure Digital Information Age, Vol. 1 No. 1, (2009).
[Kun11] Kunic S., Sego Z., "3D television", Proc. IEEE ELMAR, (2011).
[Lat38] Lateltin H. "Stereoscope", U.S. Patent No. 2, pp. 131-444, (27 Sep. 1938).
[Lee02] Lee J.J., Cho N.I., Kim J.W., “Watermarking for 3D NURBS graphic data”. In Proc of the IEEE Workshop
on Multimedia Signal Processing, pp. 304-307, (2002).
[Lee12] Lee J. W., Kim H. D., Choi H. Y., Choi S. H., Lee H. K., "Stereoscopic watermarking by horizontal noise
mean shifting.", SPIE Society of Photo-Optical Instrumentation Engineers Conf. Series. Vol. 8303,
(2012).
[Lev01] Levy K. L., Hiatt R. S., Rhoads G. B. (2001). U.S. Patent Application 10/017,679.
References
139
[Li94] Li R., Zeng B., Liou M. L., "A new three-step search algorithm for block motion estimation", IEEE Trans.
on Circuits Syst. Video Technol., Vol. 4 No. 4, pp. 438-442, (1994).
[Lin00] Lin E. T., Podilchuk C. I., Delp E. J., "Detection of image alterations using semi-fragile watermarks", Int.
Society for Optics and Photonics In Electronic Imaging, pp. 152-163, (2000).
[Lin83] Lin S., Costello D. J. Jr., Error Control Coding: Fundamentals and Applications, Prentice-Hall, (1983).
[May81] Mayhew J. E., Frisby J. P., "Psychophysical and computational studies towards a theory of human
stereopsis". Artificial Intelligence, Vol. 17 No. 1, pp. 349-385, (1981).
[Mil04] Miller L., Doêrr G., Cox I., "Applying Informed Coding and Embedding to Design a Robust High-Capacity
Watermark", IEEE Trans. on Image Processing, Vol. 13 No. 6, (2004).
[Mit05] Mitrea M., Prêteux F., Petrescu M., Vlad A., "The StirMark Watermarking Attack in the DWT Domain",
Proc. of the 12th Int. Workshop on Systems, Signals and Image Processing, Vol. 2, (2005).
[Mit05-
07]
Mitrea M., Prêteux F., Nunez J., (for SFR and GET), "Procédé de tatouage d’une séquence video",
French patent no. 05 54132 (29/12/2005), and EU patent no. 1804213 (04/07/2007).
[Mit06] Mitrea M., Duta S., Prêteux F., "A unified approach to multimedia content watermarking", Proc. of 3rd
Taiwanese-French Conf. on Information Technology (TFIT'2006), pp. 275-289, (2006).
[Mit07a] Mitrea M., Prêteux, F., “Tatouage robuste des contenus multimédias”, in H. Chaouchi, M. Laurent-
Maknavicius, La sécurité dans les réseaux sans fil et mobiles, Lavoisier, Paris (2007).
[Mit07b] Mitrea M., Dumitru O., Prêteux F., Vlad A., "Zero Memory Information Sources Approximating to Video
Watermarking Attacks", Lecture Notes in Computer Science, Vol. 4705, pp. 409-423, (2007).
[Nik98]. Nikolaidis N., Pitas I., "Robust image watermarking in the spatial domain". Signal Processing, Vol. 66
No. 3, pp. 385-403, (1998).
[Nta02] Ntalianis K. S., Doulamis N. D., Doulamis A. D., Kollias S. D., "Automatic stereoscopic video object-based
watermarking using qualified significant wavelet trees", Int. Conf. Of Consumer Electronics, IEEE Int.
Conf. on Digest of Technical Papers, pp. 188-189, (2002).
[Ped13] Peddie J., “Stereo 3D - content market value 2010-2014”, Statista, (2013).
http://www.statista.com
[Pet00] Petitcolas F., "Watermarking schemes evaluation", IEEE Signal Processing, Vol. 17 No. 5, pp. 58-64,
(2000).
[Pet98] Petitcolas F., Ross J. A., Markus G. K., "Attacks on copyright marking systems", Proc. on Information
Hiding, Second Int. Workshop, IH’98, , LNCS 1525, Springer-Verlag, ISBN 3-540-65386-4, pp. 219-239,
(1998)
A.Chammem, Robust watermarking techniques for stereoscopic content protection
140
[Pog84] Poggio, G. F., & Poggio, T., "The analysis of stereopsis". Annual review of neuro-science, Vol. 7 No. 1,
pp. 379-412, (1984).
[Pot05] Potdar V. M., Han S., Chang E., “A survey of digital image watermarking techniques”, 3rd IEEE
International Conference on Industrial Informatics, INDIN'05, pp. 709-716, (2005)
[Rog82] Rogers B., Graham M., "Similarities between motion parallax and stereopsis in human depth
perception". Vision research, Vol. 22 No. 2, pp. 261-270, (1982).
[Saf11] Safonova A., “Cost of filming 3D Movie vs. 2D movie”, False Greek white Paper, (2011).
http://falsecreekproductions.com
[Sam09] Samtani, R., "Ongoing innovation in digital watermarking." Computer 42, No. 3, pp. 92-94, (2009).
[Sch02] Scharstein D., Szeliski R., "A taxonomy and evaluation of dense two-frame stereo correspondence
algorithms", Int. journal of Computer Vision, Vol. 47 No. 1-3, pp. 7-42, (2002).
http://vision.middlebury.edu
[Sha02] Sharma R. K., Decker S., “Practical challenges for digital watermarking applications”, EURASIP Journal
on Applied Signal Processing, Vol.1, pp. 133-139, (2002).
[Sha58] Shannon C.E., "Channel with Side Information at the Transmitter", IBM Journal, pp. 289-293, (1958).
[Sri85] Srinivasan R., Rao K. R., "Predictive coding based on efficient motion estimation", IEEE Trans. Commun.
Vol. 33 No. 8, pp. 888-896, (1985).
[Sta08] Stankiewics O., Wegner K., "Depth map estimation software", ISO/IEC JTC1/SC29/WG11
MPEG/M15175, Antalya, (2008).
[Sub06] Subramanya S. R., Byung K. Yi, "Digital rights management", IEEE Potentials, Vol. 25 No. 2, pp. 31-34,
(2006).
[Tan09] Tanimoto M., Fujii T., Suzuki K., "Depth Estimation Reference Software (DERS) with Image
Segmentation and Block Matching", ISO/IEC JTC1/SC29/WG11 M16092, Lausanne, (2009).
[Teu10] Teulade V., Bothun D. K., "3D Here and Now… a goose that lays a golden egg?",
PricewaterhouseCoopers Communications, Entertainment & Media and Technology Practice Leaders.
http://www.pwc.de/de_DE/de/technologie-medien-und-telekommunikation/assets/3d-studie-
2010.pdf
[Wad87] Wade N.J. "On the late invention of the stereoscope", Perception, Vol.16 No. 6, pp. 785-818, (1987).
[Wal02] Walpole R. E., Myers R. H., Myers S. L., Ye K., "Probability & Statistics for Engineers and Scientists",
Pearson Educational Int., (2002).
References
141
[Wan04] Wang Z., Bovik A. C., Sheikh H. R., Simoncelli E. P., "Image quality assessment: from error visibility to
structural similarity", IEEE Trans. on Image Processing, Vol. 13, No. 4, (2004).
[Wan11] Wang H. Y., Chung H.Y., "Design and implementation of dynamic target tracking with stereo vision
system", in Proc. of the Int. MultiConf. of Engineers and Computer Scientist, IMECS, (2011). Int.
Association of Engineers, (2011).
[Whe12] Wheatley M., "3D TV Predicted To Spur 3-D Revenue Growth", (2012).
http://www.hdtvtest.co.uk/news/3d-tv-revenue-growth-201210012242.htm
[Wol99] Wolfgang R. B., Delp E.J., "Fragile watermarking using the VW2D watermark", Electronic Imaging'99,
International Society for Optics and Photonics, (1999).
[Xia97] Xia X. G., Boncelet C. G., Arce G. R.. A, “multi-resolution watermark for digital images”, Proc. IEEE.
International Conference on In Image Processing, Vol. 1, pp. 548-551, (1997).
[Xu05] Xu X., Tomlinson M., Ambroze M., Ahmed M., “Techniques to provide robust and high capacity data
hiding of id badges for increased security requirement”, 3rd International Conference: Science of
Electronics Technologies of Information and Telecommunication, (2005).
[Yan06] Yang Y. L., Cai N., Ni G. Q., "Digital image Scambing Technology Based on the Symmetry of Arnold
transform", Journal of Beijiing Institute of Technology, Vol. 15 No. 2, pp. 216-219, (2006).
[Yeo99] B-L Yeo, and M. Yeung, “Watermarking 3D object for verification”, in IEEE Computer Graphics and
Applications, Vol. 19, No. 1, pp. 36-45, (1999).
[You03] Kim Y. W., Moon K. A., Oh I. S., "A Text Watermarking Algorithm based on Word Classification and
Inter-word Space Statistics", IEEE Proc. of the 7th Int. Conf. on Document Analysis and Recognition,
(2003).
[Yu11] Yu M., Wang A., Luo T., Jiang G., Li F., Fu S. "New Block-Relationships Based Stereo Image
Watermarking Algorithm", in ICSNC 2011, the 6th Int. Conf. on Systems and Networks
Communications, pp. 171-174, (2011).
[Zen07] Zhang Z., Zhu Z., Xi L., "Novel Scheme for Watermarking Stereo Video", Int. Journal of Nonlinear
Science, Vol. 3 No. 1, pp.74-80, (2007).
[Zhu00] Zhu S., Kuang K., "A new diamond search algorithm for fast block matching motion estimation", IEEE
Trans. on Image Process., Vol. 9 No. 2, pp. 287-290, (2000).


List of acronyms
143
List of acronyms
3DV-NTSS 3 Dimension Video New Three Step Search
4SS Four Step Search
bpp bit per pixel
cdf Cumulative Distribution Function
CDMA Code Division Multiple Access
CDS Conjugate Directional Search
DAM Digital Asset Management
DCT Discrete Cosine Transform
DFrFT Discrete Fractional Fourier Transform
DIBR Depth Image Based Rendering
DRM Digital Rights Management
DSCQS Double Stimulus Continuous Quality Scale
DSIS Double Stimulus Impairment Scale
DWT Discrete Wavelet Transform
EM Expectation-Maximization
ES Exhaustive Search
FMLR Frequency Model Laplacian Removal
FS-MPEG Full Search MPEG
HD 3D TV High Definition 3 Dimension Television
HH High High
HL High Low
HSV Human Visual System
IF Image Fidelity
IMAX Image Maximum
A.Chammem, Robust watermarking techniques for stereoscopic content protection
144
ISBN International Standard Book Number
ITU International Telecommunication Union
JPEG Joint Photographic Experts Group
LCD Liquid crystal Display
LDPC Low Density Parity Check
LH Low High
LL Low Low
MC Monte Carlo
MOS Mean Opinion Scores-
MSE Mean Squared Error
NCC Normalized Cross Correlation
NTSS New Three Step Search
NURBS Non-uniform rational basis spline
pdf Probability Density Function
PI Performance Index
PSNR Signal to Noise Ratio
PSNRr Signal to Noise Ratio recovered
PSNRw Signal to Noise Ratio watermarked
PVD Pixel Value Difference
QIM Quantization Index Modulation-
QSWT Qualified Significant Wavelet Tree
RAM Random Access Memory
SAD Sum of Absolute Differences
SC Structural Content
SI Side Information
List of acronyms
145
SS Spread Spectrum
SSCQE Single Stimulus for Continuous Quality Evaluation
SSIM Structural SIMilarity
SVD singular value decomposition
TSS Three Step Search
USD United States dollar
USSR Union of Soviet Socialist Republics
WDR Watermark Detection Ratio
WRR Watermark Recovering Rates

List of publications
147
List of publications
Journal
A. Chammem, M. Mitrea, F. Prêteux, "High-definition three-dimensional television disparity map
computation", Journal of Electronic Imaging, vol 21, no 4, pp 043024-043024, (December 2012).
A. Chammem, M. Mitrea, F. Prêteux, "Stereoscopic video watermarking: a comparative study", Annals of
telecommunications, special issue on 3D video technologies and Services, guest editors: Béatrice Pesquet-
Popescu, Touradj Ebrahimi, Shipeng Li, Frédéric Dufaux, DOI: 10.1007/s12243-013-0384-5, (2013).
Book chapter
M. Mitrea, A. Chammem, F. Prêteux, "Tatouage stéréoscopique", Chapter 13 in "Vidéo et TVHD 3D ... de la
capture à la diffusion Principe, tendances et perspectives", Laurent LUCAS, Céline LOSCOS et Yannick REMION
Editors, Lavoisier, pp 251-271, Paris 2013.
International conferences
A. Chammem, M. Mitrea, F. Prêteux, "Speeding-up the hybrid video watermarking techniques in the DWT
domain", Proc. SPIE, vol. 6845, pp. 75350E-75358E, January 2010.
A. Chammem, M. Mitrea, F. Prêteux, "DWT-based stereoscopic image watermarking, " Proc. SPIE, vol. 7863,
pp. 786326-786334, January 2011.
A. Chammem, M. Mitrea, F. Prêteux, "Adaptive disparity map computation for stereoscopic video
watermarking", IEEE International Conference on Electronics, Circuits, and Systems (ICECS), Seville, Spain,
December 2012.
Other contribution
A. Chammem, M. Mitrea, F. Prêteux, "Tatouage stéréoscopique : du développement méthodologique au
protocole d’évaluation", Journée d’étude Vidéo 3D SI2D (Image/Transmission/Compression), January 2012.
R&D projects deliverables (contribution under the supervision of M. Mitrea)
HD3D2 project (April 2010 – October 2011)

A.Chammem, Robust watermarking techniques for stereoscopic content protection
148
D6.1.2 Sélection des méthodes de tatouage relief en conformité avec le CDC (October 2010)
D6.1.3 Briques logicielles pour le tatouage relief (May 2011)
D6.1.4 Méthode originale de tatouage relief (October 2011)
3DLive project (January 2010 – March 2012)
D4.4.2 Premier logiciel de tatouage stéréo non temps-réel (December 2010)
D4.4.3 Logiciel hybride fingerprint/tatouage temps réel et spécifications d’une approche tatouage hybride et
contextuelle (December 2011)