the architecture of intra-organism mutation rate variation
TRANSCRIPT
RESEARCH ARTICLE
The architecture of intra-organism mutation
rate variation in plants
Long Wang1☯, Yilun Ji1☯, Yingwen Hu1☯, Huaying Hu1, Xianqin Jia1, Mengmeng Jiang1,
Xiaohui Zhang1, Lina Zhao1, Yanchun Zhang1, Yanxiao Jia1, Chao Qin1, Luyao Yu1,
Ju Huang1, Sihai Yang1*, Laurence D. HurstID2*, Dacheng Tian1*
1 State Key Laboratory of Pharmaceutical Biotechnology, School of Life Sciences, Nanjing University,
Nanjing, China, 2 The Milner Centre for Evolution, Department of Biology and Biochemistry, University of
Bath, Bath, United Kingdom
☯ These authors contributed equally to this work.
* [email protected] (SY); [email protected] (LDH); [email protected] (DT)
Abstract
Given the disposability of somatic tissue, selection can favor a higher mutation rate in the
early segregating soma than in germline, as seen in some animals. Although in plants intra-
organismic mutation rate heterogeneity is poorly resolved, the same selectionist logic can
predict a lower rate in shoot than in root and in longer-lived terminal tissues (e.g., leaves)
than in ontogenetically similar short-lived ones (e.g., petals), and that mutation rate hetero-
geneity should be deterministic with no significant differences between biological replicates.
To address these expectations, we sequenced 754 genomes from various tissues of eight
plant species. Consistent with a selectionist model, the rate of mutation accumulation per
unit time in shoot apical meristem is lower than that in root apical tissues in perennials, in
which a high proportion of mutations in shoots are themselves transmissible, but not in
annuals, in which somatic mutations tend not to be transmissible. Similarly, the number of
mutations accumulated in leaves is commonly lower than that within a petal of the same
plant, and there is no more heterogeneity in accumulation rates between replicate branches
than expected by chance. High mutation accumulation in runners of strawberry is, we argue,
the exception that proves the rule, as mutation transmission patterns indicate that runner
has a restricted germline. However, we also find that in vitro callus tissue has a higher muta-
tion rate (per unit time) than the wild-grown comparator, suggesting nonadaptive mutational
“fragility”. As mutational fragility does not obviously explain why the shoot—root difference
varies with plant longevity, we conclude that some mutation rate variation between tissues
is consistent with selectionist theory but that a mechanistic null of mutational fragility should
be considered.
Author summary
Whereas there has been considerable attention paid to understanding differences in the
mutation rate between different species, much less is known about variation in the muta-
tion rate within individuals of multicellular species. In animals, evidence suggests that the
PLOS Biology | https://doi.org/10.1371/journal.pbio.3000191 April 9, 2019 1 / 29
a1111111111
a1111111111
a1111111111
a1111111111
a1111111111
OPEN ACCESS
Citation: Wang L, Ji Y, Hu Y, Hu H, Jia X, Jiang M,
et al. (2019) The architecture of intra-organism
mutation rate variation in plants. PLoS Biol 17(4):
e3000191. https://doi.org/10.1371/journal.
pbio.3000191
Academic Editor: Nick H. Barton, Institute of
Science and Technology Austria (IST Austria),
AUSTRIA
Received: November 14, 2018
Accepted: March 6, 2019
Published: April 9, 2019
Copyright: © 2019 Wang et al. This is an open
access article distributed under the terms of the
Creative Commons Attribution License, which
permits unrestricted use, distribution, and
reproduction in any medium, provided the original
author and source are credited.
Data Availability Statement: Raw sequencing
reads are at BioProject: PRJNA497989. Analysis
pipelines and accompany scripts have been
deposited at GitHub page https://github.com/wl13/
BioPipelines/tree/master/Mutation_Detection/
Somatic_Mutations.
Funding: This work was supported by a
grant from the European Research Council
(https://erc.europa.eu), grant ERC-2014-ADG
669207 to LDH and grants from the
National Natural Science Foundation of China
segregated germline has a lower mutation rate than somatic cells, which accords with an
adaptive model of intra-organism mutation rate variation. Here, we consider related ques-
tions in plants, which, although not having an early segregated germline, present numer-
ous opportunities to test such an adaptive model. In particular, such a model would
predict a lower rate in shoots than in roots and in relatively long-lived leaves compared
with ontogenetically related but more ephemeral petals. In addition, we expect that muta-
tion rate variation should be deterministic, such that there is no more heterogeneity in
mutation rates between similarly aged branches than expected by chance. By sequencing
several hundred genomes for numerous different species, we find all predictions to be
supported, with the proviso that the root—shoot difference is witnessed in perennials but
not in an annual. This last difference we show to be explicable, as annuals transmit rela-
tively few premeiotic mutations. Although the adaptive model is then parsimonious, we
caution that the mutation rate in plants can be easily affected by local conditions, as evi-
denced by large differences between lab-grown callus and field-grown plants.
Introduction
In some animals, the germline is segregated early in development, thereby preventing many
(i.e., somatic) mutations from being transmitted to progeny [1]. Given this, classical theory of
senescence posits that organisms have no vested interest in keeping the somatic mutation rate
under control after the age of reproduction [2]. The same logic predicts that, given the reduced
temporal longevity of any mutation, the shorter lived the organism, the higher the somatic
mutation rate could be [3]. A higher somatic rate in mouse than human [4], for example, is
consistent with such expectations. As the future potential longevity of new germline mutations
is longer than that of somatic ones, special protection for the germline from mutation can
sometimes be expected. In humans, for example, there is an unusually low per-cell-division
mutation rate in the male germline [5]. More generally, somatic rates are typically reported to
be higher than germline rates [4,6–9].
The extent to which such a theoretical framework, based on the potential longevity of a
mutation, enables understanding of the variation in mutation rates between tissues across
phyla is poorly understood, not least because of a dearth of data in many major groups
(somatic mutation rates, either per cell division or per unit time, are for example hard to mea-
sure [10]). Whether plants are potentially informative in this debate is at first sight doubtful,
not least because whether they have any clearly distinct soma and germline is contentious
[11,12]. Leaving this uncertainty to one side, plants provide some relatively clear predictions
and exceptional opportunities. We might, for example, expect a difference between root and
stem, as stem alone has the prospect of being a germline progenitor. The transmissibility of
mutations is not the only issue, however. Whereas germline mutations have a high prospective
temporal longevity (i.e., they can be passed to the next generation and thence onwards), pro-
spective longevity also varies between nongermline tissues. For example, petals and leaves,
although ontogenetically related, have different longevities, the petal being highly transient
and thus potentially under reduced selection to minimize mutation rates. Similarly, perennials
and annuals will differ in the longevity of true somatic mutations and might differ in the pro-
portion of premeiotic mutations that are transmissible. If so, annuals and perennials may differ
also in the extent to which the shoot might have a reduced mutation rate, much as short- and
long-lived mammals differ in their somatic rates [4].
Within-plant mutation rate variation
PLOS Biology | https://doi.org/10.1371/journal.pbio.3000191 April 9, 2019 2 / 29
(http://www.nsfc.gov.cn/english/site_1/index.
html), 91731308, 31601041, and 31671322 to LW,
DT and SY. It was further supported by a grant
(unnumbered) from Jiangsu Collaborative
Innovation Center for Modern Crop Production to
DT and SY. The funders had no role in study
design, data collection and analysis, decision to
publish, or preparation of the manuscript.
Competing interests: The authors have declared
that no competing interests exist.
Abbreviations: BM, Brunner-Munzel; RAM, root
apical meristem; SAM, shoot apical meristem.
Any model of selectively optimized mutation rate differences also predicts that variation
between samples is not simply owing to stochastic variation. Plants provide excellent opportu-
nities to test this given their branched structure and hence numerous biological replicates
whose age can be ascertained. In this context, although we expect different branches to harbor
different mutations [13–16], we do not necessarily expect some branches to be significantly
more or less mutagenic than others; i.e., we expect heterogeneity to be between different tis-
sues, not between biological replicates of the same tissues. The development of multiple
branches in any growing season from the same plant permits an unusually well-controlled
resource to test for homogeneity of mutation rates.
Between-branch differences are also important because bud breeding has long been a classi-
cal way to establish a good variety in perennial crops, especially in the important fruits and
ornamental plants [17–19]. Indeed, the plant has long been viewed as a metapopulation [20],
in which each branch evolves independently such that interbranch variation could prevent
pest populations from adapting to all branches on individual host trees [21]. In this context as
well, understanding the nature of between-branch mutation accumulation heterogeneity is of
importance.
Above, we presume one model for between-tissue differences in mutation rate, this being a
model in which the variation is understood as the product of selection on the rate of mutation
accumulation. An alternative possibility is that the mutation rate is “fragile”—i.e., easily per-
turbed by, for example, intra-organismic local environment or growth conditions [22], but not
necessarily in a selectively advantageous manner. If so, we might expect that the mutation rate
of artificial callus tissue, raised in the lab, might be mutationally different from a field-grown
comparator.
Here then, we attempt to define an extensive platform for consideration of the architecture
of intra-organismic mutation accumulation in plants. To this end, across numerous species we
ask whether roots and shoots have the same mutation rates, whether leaves and petals have dif-
ferent rates, whether we can detect between-branch heterogeneity, and whether tissue cultur-
ing modifies mutation rates. Consistent with an adaptive model, we find that roots commonly
have higher mutation rates (per unit time) than shoots in perennials but not in an annual, pet-
als have higher rates than leaves, and variation is between tissues rather than between biologi-
cal replicates. However, we also find that callus has very high mutation rates. In addition, we
assume that the apparent differences in mutation rate are just that and are not owing to differ-
ential degrees of purifying selection. We test for this possibility but find no support for it. In
sum, the in vivo evidence is largely consistent with an adaptive mutation rate model, but in
vitro data support the viability of a mechanistic null of context-dependent mutational fragility.
Note that we make no attempt to directly measure the per-cell-division rate, as the issue at
stake is the net mutation accumulation. That is, a system that reduces the number of cell divi-
sions in, for example, germline but not the per-cell-division mutation rate can be of equivalent
selective consequence as one that reduces the per-division rate but not the number of such
divisions. In this context, we measure net mutation accumulation with the “rates” being com-
parable between comparators but not necessarily defined in absolute terms (i.e., not per cell
division).
Results
A higher mutation rate in root compared with shoot is common in
perennial species
Prima facie, a selectionist model of mutation rate adaptation might predict a lower rate of
mutation in stem compared with root, as mutations (which are mostly deleterious) are more
Within-plant mutation rate variation
PLOS Biology | https://doi.org/10.1371/journal.pbio.3000191 April 9, 2019 3 / 29
likely to be transmissible to a subsequent generation if they occur in shoot. One could indeed
argue that the root—shoot difference is the closest many plants get to anything resembling an
unambiguous soma—germline distinction. Moreover, despite a distinct phenotype, the shoot
and root share much in common about their organization of stem cell niches [12,23], which
also resembles that of animal stem cell niches [23].
New leaf and new root at the terminal branch in a perennial plant are the best organs for
comparison because they have an equal separation age (i.e., time to common cell ancestor in
the embryo). If all else is equal, the average mutation number per leaf sample (or part leaf with
a total of>80 mg for genome sequencing) should be comparable with the number per root
sample with a similar weight from the same plant. Note that this assumes that their cell sizes
are similar, and hence, a similar number of cells are sampled. We note that 200–500 ng of
DNA per sample is used in library preparation and is sequenced. This ensures that even in tis-
sues where DNA is hard to extract (e.g., root) or where the ratio of DNA mass to tissue mass is
low, the total amount of sequenced DNA is approximately invariant.
Four pairs of leaf and root samples were collected from three perennials (Prunus persica,
P. mume, Salix suchowensis) and one annual (Brachypodium distachyon) species (Table 1). A
total of 96 leaf and 74 root samples were sequenced. Mutations were called following stringent
quality control and by reference to the ancestral state derived by the allelic state elsewhere in
the same plant (S1 Fig). To minimize miscalling, we employ two different calling methods and
require mutations to either be called by both or, if called by just one, to be confirmed by other
means (see Materials and methods).
We find that there are more mutations per sample in roots than in leaves in the perennials.
The mean mutations per root and per leaf sample are 29.8 versus 3.74 in peach (Brunner-Mun-
zel [BM] test, P< 2.2 × 10⁻¹⁶) and 25.4 versus 12.9 in plum, respectively (BM test, P = 3.8 ×10⁻⁵). This contrast was also evident in perennial shrub willow (2.24 in root versus 1.05 in leaf,
BM test, P = 0.01), which has exactly grouped roots and leaves from the same cuttings (S2 Fig
and S1 Table). However, although an absolutely higher number was also observed in the
annual B. distachyon (4.75 in root versus 3.17 in leaf), the ratio is more modest, and indeed the
difference is not significant (BM test, P = 0.48). It is notable that the ratio is most extreme in
one of the two long-lived species (peach), near parity for the annual, and intermediate for the
other perennials (relatively short-lived shrub willow and plum).
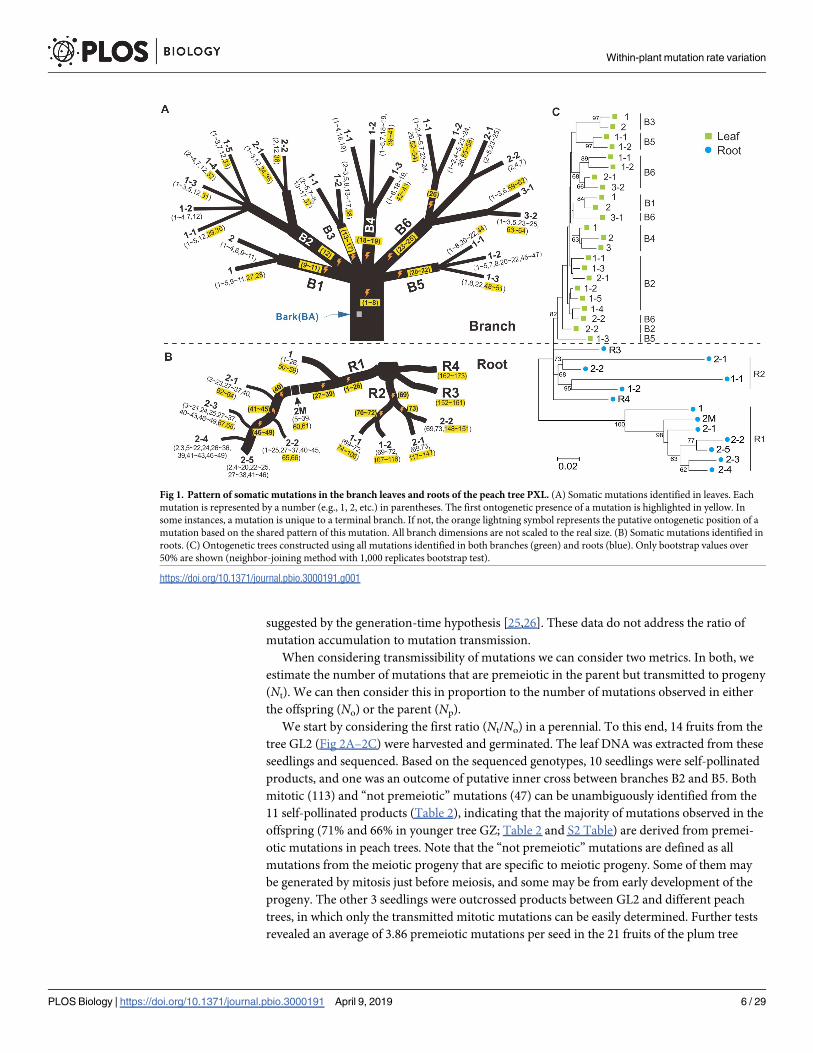
A visual way to observe the root—shoot difference is by observation of the topology of an
ontogenetic tree (like a phylogenetic tree but reflecting mutations through development) con-
structed from all the leaf and root mutations of peach tree PXL. This displays the very evident
differences of mutation patterns between the shoot apical meristems (SAMs) and root apical
meristems (RAMs) (Fig 1), with root having very long “branch” lengths, consistent with very
different mutation rates per unit time from the two tissues.
A low proportion of transmissible mutations in annuals compared to
perennials are somatic in origin
In the prior Results section, we found a general trend for relatively low stem mutation rates
(per unit time) in perennial species but not in an annual. Might there be a reason that annuals
and perennials are different in this regard? One possibility is that, as in animals, a short-lived
species has less interest in restraining the mutation rate of all somatic tissues [3,4]. However,
unlike soma in animals, stem mutations are potentially transmissible; thus, we might in addi-
tion predict that annuals should have a higher stem rate (and a stem—root relative rate near
parity) if they also transmit relatively few premeiotic mutations. Consistent with this possibil-
ity, theoretical models predict that the contribution of somatic (pregametic) mutation could
Within-plant mutation rate variation
PLOS Biology | https://doi.org/10.1371/journal.pbio.3000191 April 9, 2019 4 / 29
outweigh that of gametic mutation, especially in modular plants with small populations [14],
such as long-lived trees.
Prior data on the rate of evolution of perennials and annuals are undecisive on this issue, as
they do not assess the relationship between intra-organism mutation accumulation and the rel-
ative transmissibility of mutations. Whereas the per-generation mutation rate in long-lived
perennials could be as high as 25 times as that in short-lived annuals [24], on the per-year
scale, the long-lived perennials apparently evolved slower than short-lived annuals, as
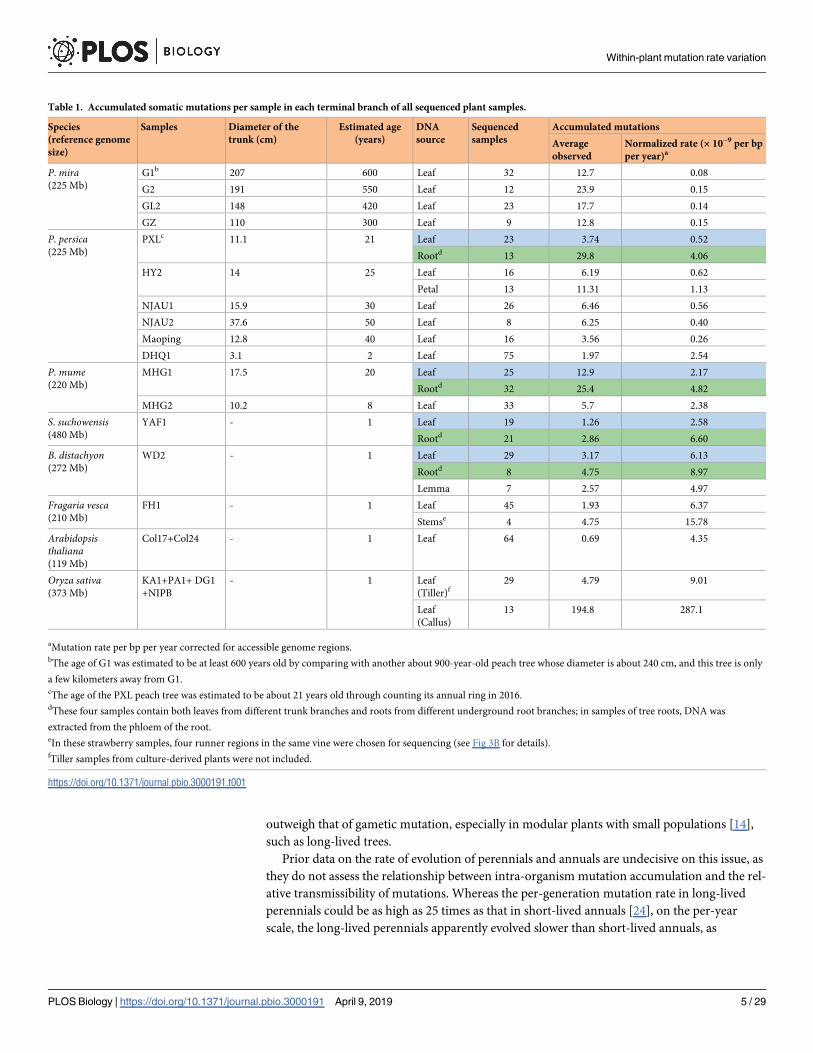
Table 1. Accumulated somatic mutations per sample in each terminal branch of all sequenced plant samples.
Species
(reference genome
size)
Samples Diameter of the
trunk (cm)
Estimated age
(years)
DNA
source
Sequenced
samples
Accumulated mutations
Average
observed
Normalized rate (× 10−9 per bp
per year)a
P. mira(225 Mb)
G1b 207 600 Leaf 32 12.7 0.08
G2 191 550 Leaf 12 23.9 0.15
GL2 148 420 Leaf 23 17.7 0.14
GZ 110 300 Leaf 9 12.8 0.15
P. persica(225 Mb)
PXLc 11.1 21 Leaf 23 3.74 0.52
Rootd 13 29.8 4.06
HY2 14 25 Leaf 16 6.19 0.62
Petal 13 11.31 1.13
NJAU1 15.9 30 Leaf 26 6.46 0.56
NJAU2 37.6 50 Leaf 8 6.25 0.40
Maoping 12.8 40 Leaf 16 3.56 0.26
DHQ1 3.1 2 Leaf 75 1.97 2.54
P. mume(220 Mb)
MHG1 17.5 20 Leaf 25 12.9 2.17
Rootd 32 25.4 4.82
MHG2 10.2 8 Leaf 33 5.7 2.38
S. suchowensis(480 Mb)
YAF1 - 1 Leaf 19 1.26 2.58
Rootd 21 2.86 6.60
B. distachyon(272 Mb)
WD2 - 1 Leaf 29 3.17 6.13
Rootd 8 4.75 8.97
Lemma 7 2.57 4.97
Fragaria vesca(210 Mb)
FH1 - 1 Leaf 45 1.93 6.37
Stemse 4 4.75 15.78
Arabidopsisthaliana(119 Mb)
Col17+Col24 - 1 Leaf 64 0.69 4.35
Oryza sativa(373 Mb)
KA1+PA1+ DG1
+NIPB
- 1 Leaf
(Tiller)f29 4.79 9.01
Leaf
(Callus)
13 194.8 287.1
aMutation rate per bp per year corrected for accessible genome regions.bThe age of G1 was estimated to be at least 600 years old by comparing with another about 900-year-old peach tree whose diameter is about 240 cm, and this tree is only
a few kilometers away from G1.cThe age of the PXL peach tree was estimated to be about 21 years old through counting its annual ring in 2016.dThese four samples contain both leaves from different trunk branches and roots from different underground root branches; in samples of tree roots, DNA was
extracted from the phloem of the root.eIn these strawberry samples, four runner regions in the same vine were chosen for sequencing (see Fig 3B for details).fTiller samples from culture-derived plants were not included.
https://doi.org/10.1371/journal.pbio.3000191.t001
Within-plant mutation rate variation
PLOS Biology | https://doi.org/10.1371/journal.pbio.3000191 April 9, 2019 5 / 29
suggested by the generation-time hypothesis [25,26]. These data do not address the ratio of
mutation accumulation to mutation transmission.
When considering transmissibility of mutations we can consider two metrics. In both, we
estimate the number of mutations that are premeiotic in the parent but transmitted to progeny
(Nt). We can then consider this in proportion to the number of mutations observed in either
the offspring (No) or the parent (Np).
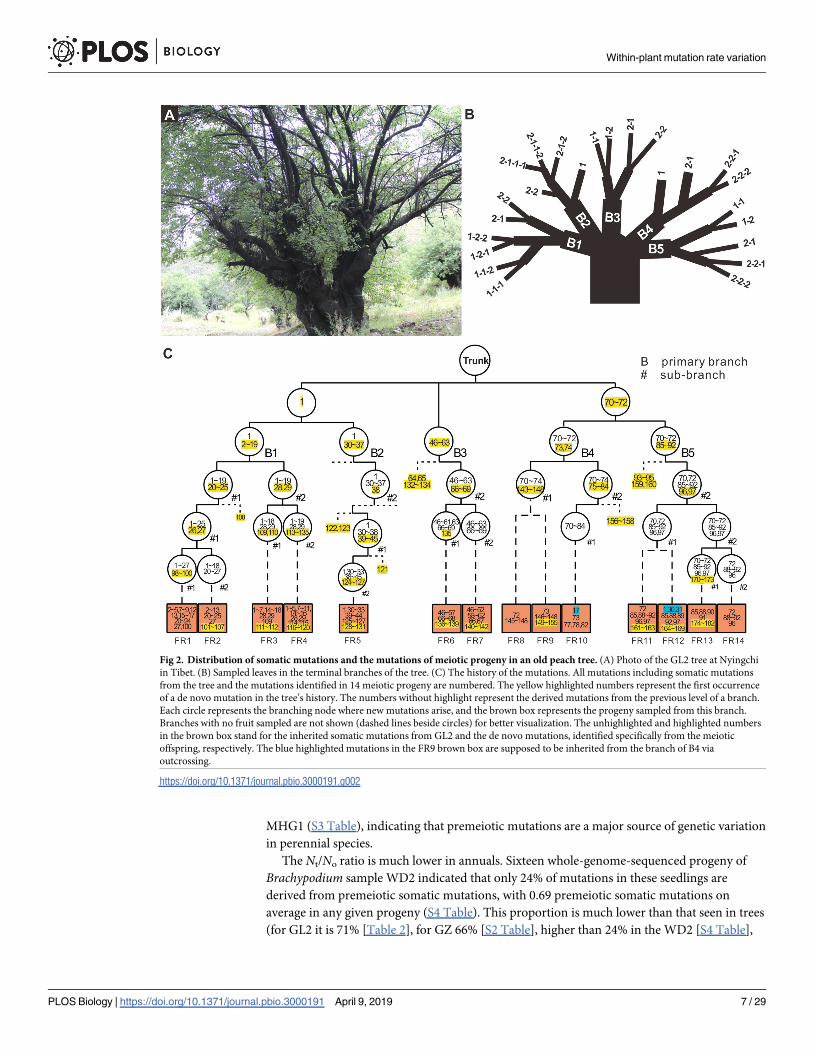
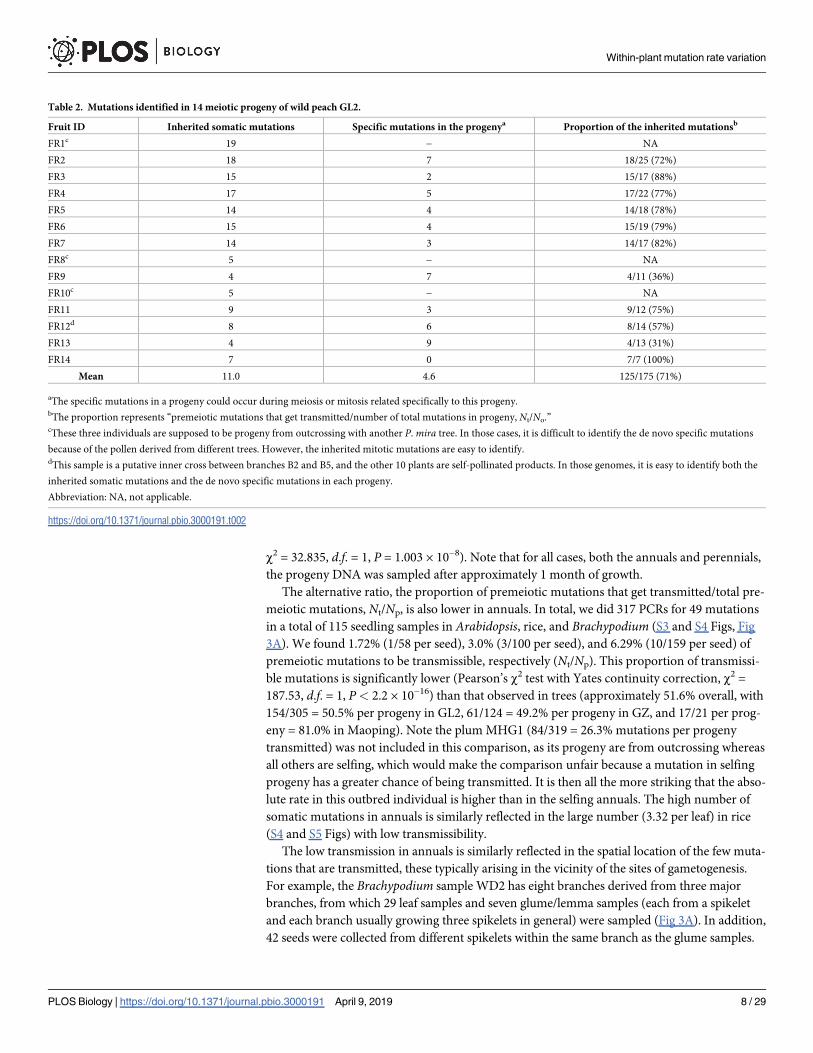
We start by considering the first ratio (Nt/No) in a perennial. To this end, 14 fruits from the
tree GL2 (Fig 2A–2C) were harvested and germinated. The leaf DNA was extracted from these
seedlings and sequenced. Based on the sequenced genotypes, 10 seedlings were self-pollinated
products, and one was an outcome of putative inner cross between branches B2 and B5. Both
mitotic (113) and “not premeiotic” mutations (47) can be unambiguously identified from the
11 self-pollinated products (Table 2), indicating that the majority of mutations observed in the
offspring (71% and 66% in younger tree GZ; Table 2 and S2 Table) are derived from premei-
otic mutations in peach trees. Note that the “not premeiotic” mutations are defined as all
mutations from the meiotic progeny that are specific to meiotic progeny. Some of them may
be generated by mitosis just before meiosis, and some may be from early development of the
progeny. The other 3 seedlings were outcrossed products between GL2 and different peach
trees, in which only the transmitted mitotic mutations can be easily determined. Further tests
revealed an average of 3.86 premeiotic mutations per seed in the 21 fruits of the plum tree
Fig 1. Pattern of somatic mutations in the branch leaves and roots of the peach tree PXL. (A) Somatic mutations identified in leaves. Each
mutation is represented by a number (e.g., 1, 2, etc.) in parentheses. The first ontogenetic presence of a mutation is highlighted in yellow. In
some instances, a mutation is unique to a terminal branch. If not, the orange lightning symbol represents the putative ontogenetic position of a
mutation based on the shared pattern of this mutation. All branch dimensions are not scaled to the real size. (B) Somatic mutations identified in
roots. (C) Ontogenetic trees constructed using all mutations identified in both branches (green) and roots (blue). Only bootstrap values over
50% are shown (neighbor-joining method with 1,000 replicates bootstrap test).
https://doi.org/10.1371/journal.pbio.3000191.g001
Within-plant mutation rate variation
PLOS Biology | https://doi.org/10.1371/journal.pbio.3000191 April 9, 2019 6 / 29
MHG1 (S3 Table), indicating that premeiotic mutations are a major source of genetic variation
in perennial species.
The Nt/No ratio is much lower in annuals. Sixteen whole-genome-sequenced progeny of
Brachypodium sample WD2 indicated that only 24% of mutations in these seedlings are
derived from premeiotic somatic mutations, with 0.69 premeiotic somatic mutations on
average in any given progeny (S4 Table). This proportion is much lower than that seen in trees
(for GL2 it is 71% [Table 2], for GZ 66% [S2 Table], higher than 24% in the WD2 [S4 Table],
Fig 2. Distribution of somatic mutations and the mutations of meiotic progeny in an old peach tree. (A) Photo of the GL2 tree at Nyingchi
in Tibet. (B) Sampled leaves in the terminal branches of the tree. (C) The history of the mutations. All mutations including somatic mutations
from the tree and the mutations identified in 14 meiotic progeny are numbered. The yellow highlighted numbers represent the first occurrence
of a de novo mutation in the tree’s history. The numbers without highlight represent the derived mutations from the previous level of a branch.
Each circle represents the branching node where new mutations arise, and the brown box represents the progeny sampled from this branch.
Branches with no fruit sampled are not shown (dashed lines beside circles) for better visualization. The unhighlighted and highlighted numbers
in the brown box stand for the inherited somatic mutations from GL2 and the de novo mutations, identified specifically from the meiotic
offspring, respectively. The blue highlighted mutations in the FR9 brown box are supposed to be inherited from the branch of B4 via
outcrossing.
https://doi.org/10.1371/journal.pbio.3000191.g002
Within-plant mutation rate variation
PLOS Biology | https://doi.org/10.1371/journal.pbio.3000191 April 9, 2019 7 / 29
χ2 = 32.835, d.f. = 1, P = 1.003 × 10⁻⁸). Note that for all cases, both the annuals and perennials,
the progeny DNA was sampled after approximately 1 month of growth.
The alternative ratio, the proportion of premeiotic mutations that get transmitted/total pre-
meiotic mutations, Nt/Np, is also lower in annuals. In total, we did 317 PCRs for 49 mutations
in a total of 115 seedling samples in Arabidopsis, rice, and Brachypodium (S3 and S4 Figs, Fig
3A). We found 1.72% (1/58 per seed), 3.0% (3/100 per seed), and 6.29% (10/159 per seed) of
premeiotic mutations to be transmissible, respectively (Nt/Np). This proportion of transmissi-
ble mutations is significantly lower (Pearson’s χ2 test with Yates continuity correction, χ2 =
187.53, d.f. = 1, P< 2.2 × 10⁻¹⁶) than that observed in trees (approximately 51.6% overall, with
154/305 = 50.5% per progeny in GL2, 61/124 = 49.2% per progeny in GZ, and 17/21 per prog-
eny = 81.0% in Maoping). Note the plum MHG1 (84/319 = 26.3% mutations per progeny
transmitted) was not included in this comparison, as its progeny are from outcrossing whereas
all others are selfing, which would make the comparison unfair because a mutation in selfing
progeny has a greater chance of being transmitted. It is then all the more striking that the abso-
lute rate in this outbred individual is higher than in the selfing annuals. The high number of
somatic mutations in annuals is similarly reflected in the large number (3.32 per leaf) in rice
(S4 and S5 Figs) with low transmissibility.
The low transmission in annuals is similarly reflected in the spatial location of the few muta-
tions that are transmitted, these typically arising in the vicinity of the sites of gametogenesis.
For example, the Brachypodium sample WD2 has eight branches derived from three major
branches, from which 29 leaf samples and seven glume/lemma samples (each from a spikelet
and each branch usually growing three spikelets in general) were sampled (Fig 3A). In addition,
42 seeds were collected from different spikelets within the same branch as the glume samples.
Table 2. Mutations identified in 14 meiotic progeny of wild peach GL2.
Fruit ID Inherited somatic mutations Specific mutations in the progenya Proportion of the inherited mutationsb
FR1c 19 − NA
FR2 18 7 18/25 (72%)
FR3 15 2 15/17 (88%)
FR4 17 5 17/22 (77%)
FR5 14 4 14/18 (78%)
FR6 15 4 15/19 (79%)
FR7 14 3 14/17 (82%)
FR8c 5 − NA
FR9 4 7 4/11 (36%)
FR10c 5 − NA
FR11 9 3 9/12 (75%)
FR12d 8 6 8/14 (57%)
FR13 4 9 4/13 (31%)
FR14 7 0 7/7 (100%)
Mean 11.0 4.6 125/175 (71%)
aThe specific mutations in a progeny could occur during meiosis or mitosis related specifically to this progeny.bThe proportion represents “premeiotic mutations that get transmitted/number of total mutations in progeny, Nt/No.”cThese three individuals are supposed to be progeny from outcrossing with another P. mira tree. In those cases, it is difficult to identify the de novo specific mutations
because of the pollen derived from different trees. However, the inherited mitotic mutations are easy to identify.dThis sample is a putative inner cross between branches B2 and B5, and the other 10 plants are self-pollinated products. In those genomes, it is easy to identify both the
inherited somatic mutations and the de novo specific mutations in each progeny.
Abbreviation: NA, not applicable.
https://doi.org/10.1371/journal.pbio.3000191.t002
Within-plant mutation rate variation
PLOS Biology | https://doi.org/10.1371/journal.pbio.3000191 April 9, 2019 8 / 29
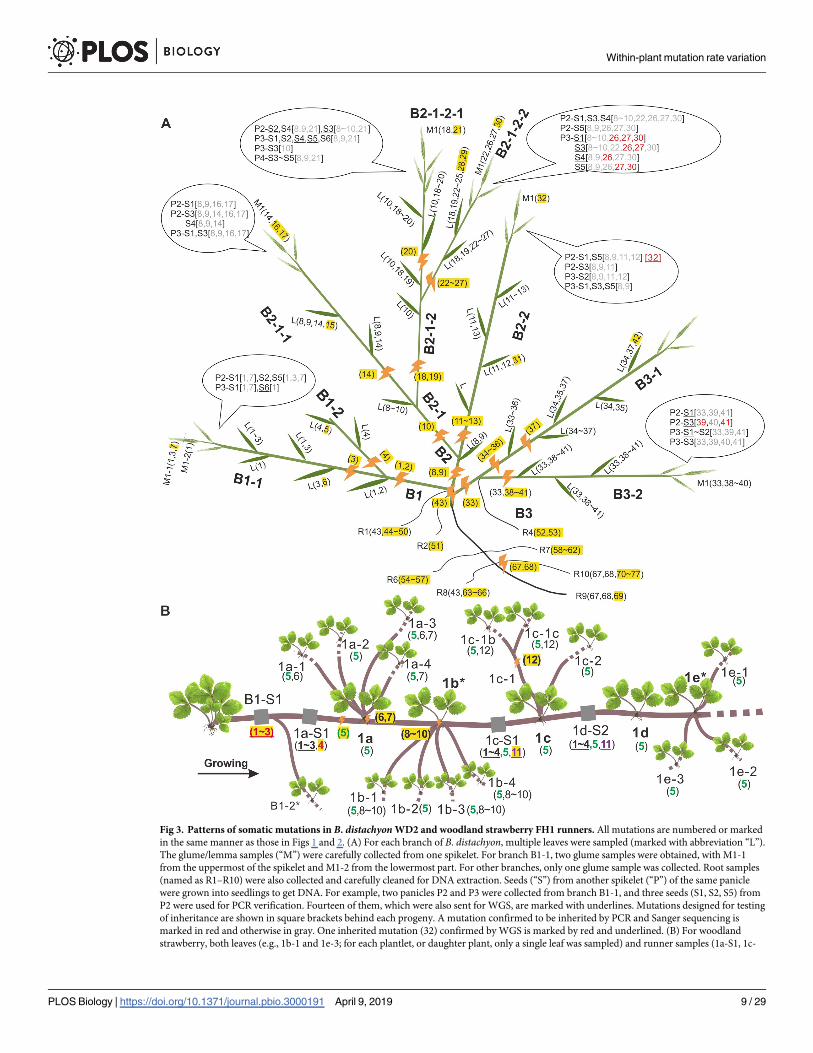
Fig 3. Patterns of somatic mutations in B. distachyon WD2 and woodland strawberry FH1 runners. All mutations are numbered or marked
in the same manner as those in Figs 1 and 2. (A) For each branch of B. distachyon, multiple leaves were sampled (marked with abbreviation “L”).
The glume/lemma samples (“M”) were carefully collected from one spikelet. For branch B1-1, two glume samples were obtained, with M1-1
from the uppermost of the spikelet and M1-2 from the lowermost part. For other branches, only one glume sample was collected. Root samples
(named as R1–R10) were also collected and carefully cleaned for DNA extraction. Seeds (“S”) from another spikelet (“P”) of the same panicle
were grown into seedlings to get DNA. For example, two panicles P2 and P3 were collected from branch B1-1, and three seeds (S1, S2, S5) from
P2 were used for PCR verification. Fourteen of them, which were also sent for WGS, are marked with underlines. Mutations designed for testing
of inheritance are shown in square brackets behind each progeny. A mutation confirmed to be inherited by PCR and Sanger sequencing is
marked in red and otherwise in gray. One inherited mutation (32) confirmed by WGS is marked by red and underlined. (B) For woodland
strawberry, both leaves (e.g., 1b-1 and 1e-3; for each plantlet, or daughter plant, only a single leaf was sampled) and runner samples (1a-S1, 1c-
Within-plant mutation rate variation
PLOS Biology | https://doi.org/10.1371/journal.pbio.3000191 April 9, 2019 9 / 29
In the 36 leaf and glume samples, 77 novel mutations were detected. Among the 77 mutations,
22 were selected for further PCR and Sanger sequencing to see if they were transmissible. Just
under one-quarter (5/22 = 23%) of them were confirmed to be present in any of the five seeds.
Further whole-genome sequencing of 16 progeny suggested this rate was actually lower (8%),
with only six mutations (five were those confirmed by PCR) present in any of six seeds among
40 mutations within the parental branches bearing those seeds (Fig 3A). Five out of the six
mutations are present in the seven glumes that have been sampled and sequenced. This indi-
cates that mutations physically closer to the site of gametogenesis (i.e., in glumes) have a greater
chance of being transmissible (χ2 test with Yates correction, χ2 = 16.9, d.f. = 1, P = 3.86 × 10⁻⁵).
As an independent assessment of quality control, we note that the transmitted mutations iden-
tified in the sequenced genomes exactly match the PCR-verified results.
We conclude that annuals transmit proportionally fewer of their premeiotic mutations than
do perennials and that a lower proportion of mutations reported in the progeny are premeiotic
in origin. This in turn could explain, from an adaptive model, why the root—shoot mutation
rate ratio is high in perennials but not in annuals: if premeiotic mutations have little chance of
transmission and there is no possible accumulation year on year (i.e., in annuals), then rela-
tively little is to be gained by reducing the shoot mutation rate.
Woodland strawberry as the exception that proves the rule
All the data presented here support an adaptive framework well. In perennials, the shoot muta-
tion rate is relatively constrained because they transmit shoot-accumulated mutations, whereas
the shoot mutation rate is relatively unconstrained in annuals because they transmit relatively
few mutations and the plant will shortly be dead. In this context, one observation appears,
prima facie, to be an exception and counter to the selectionist model. In woodland strawberry,
an initial plant sends out runners that can occasionally produce lateral buds that initiate new
plants with shoots, leaves, and fruit (Fig 3B). Thus, every gamete in a runner-propagated
mature plant has an ontogenetic cell lineage history that runs back through the runner to the
parent plant and thence to the initial seed. We might therefore expect that runner, as the pro-
genitor of all plants and hence of all seeds, to have an especially low mutation rate. However,
we find that there are 4.75 mutations accumulated per runner versus 1.93 per leaf (BM test,
P = 8.2 × 10⁻⁷; Table 1). Counting each mutation once, we find 0.67 mutations per daughter
plant, and 2.33 mutations per node for runners. Why is the runner rate higher?
The example of nontransmissibility of somatic mutations in annuals suggests a related
explanation. What if mutations that occur in runners are for the most part not passed on to
the lateral buds, as the cell lineage permitted to develop into lateral buds is spatially restricted?
Were this the case, most cells in the runner would be more like root in having no ontogenetic
future in gametes and hence would be under relatively relaxed selection. By contrast, cells of
the shoot of the plant would still have a potential future in gametes. Does then the runner con-
tain an effective germline?
Analysis of mutation accumulation patterns (Fig 3B) provides strong support for the possi-
bility of two separate cell lineages, one that is ontogenetically restricted to the runner and one
that is not. Because we know which was the first plant, we know both spatially and temporally
S1, etc.; gray, each about 15 cm in length) were sequenced. The mutation 5 is colored green to show its wide distribution in all samples
sequenced. Samples marked with asterisks (1b, 1e, etc.) were not sequenced because no qualified DNA was obtained. Note that the weight of the
approximately 15 cm of runner was about 100–150 mg, which was slightly higher than that of leaf (a single leaf sampled per daughter plant
roughly weighed 70–100 mg). The runner DNA is harder to extract, so the total DNA mass from the runner would be a little less than from leaf.
However, as usually only around 200 ng of DNA was used in library preparation, the mass of DNA that actually was sequenced should be
similar between leaf and runner. WGS, whole-genome sequencing.
https://doi.org/10.1371/journal.pbio.3000191.g003
Within-plant mutation rate variation
PLOS Biology | https://doi.org/10.1371/journal.pbio.3000191 April 9, 2019 10 / 29
where all the new mutations initially occurred and when they are subsequently found. We find
a pattern in which mutations found in the runners are normally restricted to the runner, but
with one exception. Consider the first three mutations (numbered 1 to 3 Fig 3B). These
appeared in runner site B1-S1 and can be detected in the subsequent runner sites of 1a-S1, 1c-
S1, and 1d-S2 but could not be detected in the subsequent shoots and leaves produced from
the lateral buds (lateral buds 1a to 1e, resultant shoot/leaves 1a-1, 1a-2, etc.). Similar ontoge-
netic restriction was also found for all subsequent runner mutations (4 and 11), bar one.
The one exception is mutation 5, which occurs prior to stem/runner 1a but is henceforth
seen everywhere: in all progeny runners and in the products of the five lateral buds (1a to 1e).
It is notable that at positions 1c-S1 and 1d-S1 in the runner, we find all of the runner mutations
(1–5 and 11), but in the lateral bud progeny (1c, 1d, 1e) mutation 5 alone is seen (excepting
mutations that arose in the shoots/leaves, e.g., mutation 12).
Providing a statistical test for the exceptionalism of mutation 5 requires a few assumptions.
But let us suppose that each lateral bud has, as observed, only one mutation seen in the runner
from which it is derived (this could be owing to a small initial cell population founding a lateral
bud). At 1a, there are five runner mutations, and we can then suppose that one (and only one)
of these was transmitted to descendent shoots and leaves. We attach no probability to this first
selected mutation being number 5, as this is only relevant post hoc. Instead, we ask what the
probability is that for the subsequent plants/lateral buds the same one mutation (whichever it
is) is selected at random, this being the null. At 1b, the runner has mutations 1 to 5, so the
probability of any prespecified mutation being the mutation in the lateral bud is 1/5. At 1c to
1e, these five mutations are joined by mutation 11. Thus for each of these, again, assuming one
successful mutation, the probability that the prespecified mutation is in the lateral bud is 1/6.
Thus, the probability of the initially successful mutation (in our case, mutation 5) alone being
selected at each lateral bud is 1/5 × (1/6)3 = 0.00093. This provides strong reason to reject the
null of random cell selection in the production of lateral buds and, conversely, supports the
possibility that in runner, there is a segregated germline.
Although highly significant, the above calculation comes with numerous caveats. We
assume only one mutation can be transmitted to lateral buds. However, a correct null of ran-
dom cell selection (rather than random mutation selection) would make it even less likely that
all subsequent lateral buds would have the same prespecified mutation, as nontransmission
must be an alternative part of parameter space under such a null, there being no reason to sup-
pose that every cell has a mutation. Inclusion of a nontransmission possibility thus renders the
likelihood of the same mutation being transmitted to the lateral bud every time even less likely.
However, we do not know the number of progenitor cells in the lateral bud or the proportion
of cells with at least one mutation and so cannot specify this null correctly. Furthermore, we
assume all mutations to have occurred in different cells and so are themselves independent in
any model of random cell selection. This need not be true.
Despite the above caveats, it is most parsimonious to suppose that one mutation (5)
uniquely occurred in a germline lineage within the runner and that only mutations in this cell
lineage make up the shoot derived from lateral buds. Other lineages may make up further run-
ners (1–4, 11) but are restricted from lateral buds and hence are not in shoots, leaves, and gam-
etes. Because of such a restriction, a relatively unconstrained mutation rate can be expected.
Thus, the one prima facie exception may be the exception that proves the rule.
A greater load of mutations in petal than in leaf
The stem—root difference is consistent with a selectionist view of mutation rate variation
within a plant. The same model could also predict that longer-lived terminal tissues might
Within-plant mutation rate variation
PLOS Biology | https://doi.org/10.1371/journal.pbio.3000191 April 9, 2019 11 / 29
have lower mutation rates than shorter-lived tissues, just as a soma in short-lived species has a
higher rate than a soma in longer-lived species. The leaf—petal difference is here a potentially
informative test. Petals comes from the second whorl formed by the floral meristems [27] and
have a similar cell division profile to leaves [28]. As the floral meristem shares a similar organi-
zation with SAM, it has been suggested that flowers and shoots are homologous structures,
with floral organs being viewed as modified leaves [27]. But differences do exist; for example,
unlike the stem cell fate in SAM, which is indeterminate (i.e., not determined by its cell lineage
but by its position) and grows indefinitely, the stem cells in floral meristem are determinate
and will cease growth upon the formation of four whorls [27].
We consider two sampling strategies to examine the leaf—petal difference. First, using whole
tissues, we observe that peach petals have a higher rate than leaf samples (11.31 versus 6.19; BM
test, P = 0.007). Second, we consider sampling of tissue by using microholes. To this end, two
peach leaves and four petals were sampled from different branches of the tree HY1. In two
leaves, 16 tiny holes, each containing about 1,000 cells, were punched (S6 Fig and S5 Table).
After amplifying and sequencing those samples, 59 mutations were identified, with an average
of 3.69 mutations per hole sample in leaves, much lower than 1,567 mutations per hole in petals.
Although this latter result agrees qualitatively with the prior result using whole peach leaf
and petal samples, the ratio is clearly much higher when using the microhole methodology.
The mutation number seen in petals is so high we must suspect a technical artifact. Our
method involves each petal sample being compared to all other petal and leaf samples (i.e.,
between different tissues) from the same tree, and the mutations being called are those unique
to a single hole sample and not in any other leaves or petals. This is potentially prone to false
positives, as it requires few consistency checks and could be liable to sequencing artifacts intro-
duced during amplification. We can be confident that the numbers are not sequencing errors,
as 39 mutations that we can retest via Sanger sequencing 36 (92%) are verifiable. However, we
may be doing little more than confirming amplification artifacts. To be confident of a qualita-
tive difference between leaf and petal, we therefore also ask about mutations that are shared
between different microholes but are specific to a single flower/leaf. Such mutations are
unlikely to be amplification or sequencing artifacts. We observed 73 and 16 mutations in two
flowers (the four petals belong to two flowers from two branches) that were present in at least
two microhole samples (both supported by at least five reads for the mutation allele). This
contrasts with 4 and 2 shared mutations in two leaf samples from two branches (one-sided
comparison of Poisson rates, P = 0.000974). Although this does not resolve the cause of the
remarkably high mutation number called singly in microholes of petals, it reinforces the con-
clusion that petal has more mutation accumulation than leaf and, as such, is consistent with
highly relaxed selection in very short-lived petals.
No evidence of excessive between-branch heterogeneity in mutation rate
We have provided evidence that different plant tissues have different rates of mutation accu-
mulation, the variation being consistent with an adaptive optimal allocation model. A further
prediction is that the variation should be deterministic and hence that between biological repli-
cates there should be no more heterogeneity than expected under a null of equal rates.
We address this issue by asking whether different branches also differ in their mutation
rates. A key problem in any such analysis is controlling for heterogeneity in the number of
new mutations held on a branch that results from something as trivial as different ages of
branches. To circumvent this, we consider 75 terminal branches on a young peach tree
(DHQ1) in which we can be confident that all the branches sampled are of approximately the
same age. We then consider the number of mutations that are unique to any given branch. If
Within-plant mutation rate variation
PLOS Biology | https://doi.org/10.1371/journal.pbio.3000191 April 9, 2019 12 / 29
the null model is correct, the distribution of these numbers should be a Poisson function, and
hence the dispersion (= Variance/Mean) should be no different from unity. We find the dis-
persion is D = 1.031. Significance we tested via simulation (10,000 replications), deriving a
mean D in simulants of 1.0 ± 0.162 (SD). The observed dispersion is thus no higher than
expected by chance (from simulation, P = 0.454). Although then branch-specific mutations
can be found (each branch has on average 0.45 branch-specific mutations), we see no evidence
for between-branch heterogeneity in rates.
Tissue culturing is associated with a high mutation rate
The in vivo evidence is broadly consistent with selectionist models in which we expect a lower
mutation rate in cells in which any mutation has a larger potential future impact (longer-lived
terminal tissues or potential germline tissue) and the variation observed is deterministic. But
might there also be variation that is nonadaptive and better explained by mutational fragility?
We address this by comparing plants grown under very different conditions but over the same
time span. The artificial condition is tissue culture, which we compare with the same plant
grown in the wild.
We considered a 1.1-mg callus derived from a single rice seed. This was cultured to 657.3
mg (about 10 cell divisions) and then divided into five groups with 10 seedlings regenerated
from each of them (S7 Fig). When the leaves were sequenced, the mutations specifically gener-
ated during culturing can be identified. This results in an average of 357 mutations for each
seedling (each regenerated plant was grown for approximately 2–3 months before sampling),
which is approximately 47-fold higher than the number of mutations accumulated among dif-
ferent tillers in the same plant (S6 Table and S7 Fig), even though the wild-grown plants are
possibly older (grown for about 3–4 months before sampling), indicating a high rate of muta-
tion per unit time in the callus.
No evidence for intra-organismic selection
We have presented evidence for differences in rates of mutation accumulation between differ-
ent tissues in the same plant that we have postulated to be owing to differences in the mutation
rate. However, an alternative possibility is that different tissues have the same mutation rate
but differential degrees of purifying selection. Although this is unlikely to explain more-
extreme differences, this has been a potential issue in the debate as to whether plants have a
mutationally protected germline: prior data suggesting this [11,12,29] have been argued to
alternatively be explained by purifying selection removing mutations, not by mutation not
generating them [16,30].
Here then, we ask whether intra-organismic purifying selection is an important problem
(nota bene: we do not attempt to directly ask if any putative germline has a low mutation rate).
We adopt two approaches. First, we ask whether the rate of mutational accumulation decreases
as a function of age, taking advantage of our ability to determine, given the branching structure
of a plant, when any given mutation arose. Second, we compare the transmissibility of harmful
(nonsynonymous) and less harmful mutations. In neither case do we detect a signal of purify-
ing selection. We thus presume that our measures of mutation accumulation are not pro-
foundly confounded by intra-organismic selection. In addition, this supports the evidence that
plants might have an effective germline [11,12,29,37]—i.e., an early segregating and slowly
dividing germline that accumulates few premeiotic mutations—as the low number of germline
mutations cannot be easily explained by purifying selection.
1. Somatic mutations accumulate at a constant rate. If purifying selection is an issue, we
might expect a decline in the rate of mutation accumulation year on year, under the premise
Within-plant mutation rate variation
PLOS Biology | https://doi.org/10.1371/journal.pbio.3000191 April 9, 2019 13 / 29

that selection takes time to weed out mutations or to let slightly fitter lineages dominate, much
as very recently diverged species have very high Ka/Ks ratios [31]. This test is, however, imper-
fect because it assumes that the underlying mutation rate is not an accelerating function with
respect to age, which could mask an apparent reduction caused by purifying selection. Accu-
mulation of somatic mutations is, however, thought to contribute to the ageing of plants
[22,24,32], and such accumulation could possibly result in more mutations that themselves
increase the mutation rate, thereby causing an accelerating function with age. Similarly, classi-
cal theories of senescence could predict that mutation rates might increase with increasing age,
thus leading to higher rates of mutations in older plants. Nonetheless, with this caveat, to sur-
vey the yearly variation of somatic mutation rates, we sequenced the leaves of a young tree so
as to estimate the number of new mutations per leaf per diploid genome per year and of accu-
mulated mutations per leaf per genome.
We harvested a fruit from a peach tree and germinated it in June 2015. This seedling
(DHQ1) had four branches in 2015 (B1-B4 in Fig 4) and more subbranches in 2016. Seventy-
five leaf samples collected in September of 2016 were sequenced. For these, we could identify
new mutations and can be confident that they must have occurred in 2015 if the mutation was
seen in different leaves on the same branch. The remainder we presume to have occurred in
2016. In total, 48 de novo mutations were identified (colored yellow in Fig 4). Out of these
mutations, 11 mutations were shared by leaves in a branch and so must have occurred in 2015.
From this, we can estimate the number of mutations that accumulated in 2015 per leaf. For
Fig 4. Somatic mutations in a 2-year-old peach tree DHQ1. This tree was from a seed germinated after gibberellin treatment from May to
June 2015 and grown outdoor on the campus. The leaves were sampled from the sapling on July 24, 2016. Seventy-five sequenced leaf samples
include 43 leaves from the base branch (shown in rectangle), and the others are from small branches.
https://doi.org/10.1371/journal.pbio.3000191.g004
Within-plant mutation rate variation
PLOS Biology | https://doi.org/10.1371/journal.pbio.3000191 April 9, 2019 14 / 29
example, the frequencies of mutations 1, 2, and 3 in B1 are 27/29, 14/29, and 8/29 in 29 leaves,
respectively, which results in 1.69 mutations or 1.44 on average in B1-B4 accumulated in 2015.
Similarly, mutations per leaf in 2016 can be calculated as 0.53. The sum of accumulated muta-
tions per leaf over 2 years is 1.97 (Table 1). The distribution of novel mutations, particularly
the 11 mutations that occurred in 2015, indicates that the mutation rate detected for the sec-
ond year may be only about one-third of that for the first year (the null expectation is that the
same number of mutations accumulated in all sampled leaves each year, observed = 108 muta-
tions accumulated in 2015 and 40 accumulated in 2016, χ2 with Yates correction = 30.3,
P = 3.64 × 10⁻⁸). This is not consistent with the possibility of an accelerating function with age,
the form that would mask apparent germline purifying selection.
Is the trend that we see for a young plant for fewer mutations later on than early on repli-
cated over broader time spans and in mature plants, or might this reflect a burst of mutations
early on? We find no evidence for anything other than a constant rate of mutation accumula-
tion. The net accumulated mutations (Table 1) range from 1.97 to 23.9 per leaf sample in four
old wild peach trees (P. mira; G1, G2, GL2, and GZ; about 200–600 years old [33]) and six
young peach trees (2–50 years old in P. persica). By using the diameter of a tree as a proxy for
its age, a positive correlation is obtained between age and base mutations accumulated
(y = 0.134x + 4.195; R2 = 0.838 and P< 0.001). There is a suggestion of an early accelerating
function (consistent with the above observation), but the intercept of the linear plot is not sig-
nificantly different from zero (P = 0.09), arguing against this being a strong effect. There is no
suggestion of an accelerating function with age, and indeed when we consider the difference in
the number of accumulated mutations per leaf per unit difference in trunk diameter as a func-
tion of trunk size, there is no significant correlation, consistent with rate constancy (Spearman
rho = −0.4, P = 0.29). An accelerating or decelerating function would predict a positive or neg-
ative correlation, respectively.
A problem with the above method is that we employ trunk diameter as a proxy for age. By
sampling young branches (a branch only grown for about 1–5 years), we can examine the
accumulation rate with greater certainty over age but over a shorter time span. When leaves
are sampled from any of those terminal branches, the mutations accumulated in a certain year
can be distinctly identified. From four peach trees for which we documented the age of several
of their branches (G1, G2, PXL, and NJAU1 in Table 1), we identified 1.64, 2.64, 3.76, 3.55,
and 5.83 mutations in 1–5 years of branches, respectively. A positive correlation is present
between the age (x) of a branch and the number of somatic mutations accumulated per leaf (y)
(y = 0.929x + 0.698; R2 = 0.890 and P = 0.016). The function is again well modeled as a linear
fit and the intercept not significantly different from zero (P = 0.35). The rate of mutation accu-
mulation per year as a function of age is also not different from a null of constancy (Spearman
rho = 0.4, P = 0.75) with a mean of 1.05 mutations per year. The constancy argues against puri-
fying selection as a confound, except if the true mutation rate is an accelerating function with
age, for which we find no support.
The profile of 29 mutations in young peach tree DHQ1 also sheds light on the cell processes
leading to the development of a branch. We find no shared mutations between branches (nota
bene: very early mutations shared between all branches would have been missed). This sug-
gests that each branch is derived from a specific area of SAM. The shared mutations within a
branch normally have different frequencies (e.g., 27/29, 14/29, and 8/29 in B1), which indicates
that at least three or more cell divisions in a hierarchical arrangement are necessary for the
development of a branch.
2. No evidence that mutations of stronger effect are less transmissible. We can also
ask whether our data are consistent with intra-organismic purifying selection by considering
the transmissibility of nonsynonymous mutations and those less likely to be deleterious
Within-plant mutation rate variation
PLOS Biology | https://doi.org/10.1371/journal.pbio.3000191 April 9, 2019 15 / 29
(synonymous, intronic, and intergenic). Under the null model that intra-organismic selection
is a negligible force, we expect the profile of somatic mutations to be the same as the profile for
mutations that were transmitted to the offspring. If selection on these timescales was impor-
tant, then we might expect transmissible mutations to be enriched for the mutations less likely
to be deleterious. We find no evidence for selection. Of all 132 somatic mutations identified in
GL2, 14 are nonsynonymous, and 118 are less harmful. No significant difference is found
between the transmissibility of nonsynonymous mutations and less harmful ones (observed 9
nonsynonymous mutations and 71 less harmful mutations are transmissible, expected 8.5 and
71.5, χ2 with Yates correction = 3.03 × 10⁻⁵, P = 0.996). We conclude that we find no evidence
for within-individual purifying selection.
Discussion
Is mutation rate variation owing to selection?
We postulate that if selection is acting on the rate of mutation accumulation in plants, then
stem should commonly have a lower rate than shoot; that highly ephemeral structures such as
petals should have higher rates than ontogenetically related but longer-lived structures (i.e.,
leaves); and that mutation accumulation rates should be deterministic (i.e., no more between
biological replicate variation than expected under a null). We find all to be upheld and, in
addition, that the one exception (runner mutation rates in strawberry) may well be the excep-
tion that proves the rule, as it appears to have a segregated germline. The high mutation rate in
tissue culture, however, suggests that mutation rate is quite easily altered by changes in local
environment. Evidence that stress can cause increases in the mutation rate may well partially
explain the callus result [34] and in turn suggests that we need to be cautious in our interpreta-
tion of between-tissue differences. The variation that we observe suggests that in plants, muta-
tion accumulation rates are deterministically variable between different parts of the same
plant. This does not argue in favor of either hypothesis (selection versus fragility), assuming
that given tissues have consistent mutational microenvironments.
Although then some of the heterogeneity that we observe is predictable from an adaptive
model (e.g., stems have lower rates than roots) and some predictable on anatomical grounds
(different mutations in different branches), we cannot definitely rule out nonadaptive muta-
tional fragility. We propose that in testing adaptive theories of intra-organismic mutation rate
variation, the alternative hypothesis should be that heterogeneity reflects mutational fragility
that is conditional on local context. The petal—leaf differences we see could, in principle, be
consistent with either hypothesis. By contrast, evidence for variation in the shoot—root differ-
ence as a function of the proportion of shoot mutations that are transmissible argues against
microenvironment and in favor of the adaptive hypothesis. This does not rule out the possibil-
ity that the root microenvironment is more mutagenic than the shoot environment, but any
such effect cannot obviously explain why the root/shoot ratio varies with the proportion of
shoot mutations that are transmissible. We conclude that prima facie, at least some of the
mutation rate variation observed best fits a selectively driven model, whereas some is just con-
sistent with such a model.
Are differences owing to the number of cell divisions or the rate per cell
division?
Regardless of whether the variation that we have observed is predictable in an adaptive frame-
work, we can in addition ask whether the difference in mutation rates (leaf—petal, root—
shoot) that we find reflects differences per cell division or differences in the number of cell
Within-plant mutation rate variation
PLOS Biology | https://doi.org/10.1371/journal.pbio.3000191 April 9, 2019 16 / 29
divisions [35]. As far as adaptive theories are concerned, reducing either parameter would be
an effective means to reduce the net rate of mutation accumulation.
The root—shoot differences we suggest probably reflect differences in rates per cell division.
Our strategy required a mutation to be called when the majority of a leaf (or a root) shares a
single given mutation. The requirement means that this mutation is most likely to be derived
from a single or a few cell divisions, and this division must occur at a very early stage of leaf (or
root) development. When defining a mutation with�5 reads in a total of 40× genome cover-
age (the maximal mutant reads is 20× in a diploid, assuming no bias), on average the mutation
must be shared by�25% of cells in a sample. In other words, our sampling strategy will detect
mutations that occur in one of a few early cell divisions for a leaf or root. Therefore, the muta-
tions observed from such samples most probably reflect the mutation rates of SAMs or RAMs
per cell division. Similarly, the high rate in the callus is probably best explained by an increased
mutation rate per cell division. Thus, although the concentration in focus has been on strate-
gies to minimize the number of cell divisions to protect the germline, the possibility of modifi-
cation of the per-cell-division mutation rate, as seen in humans [5], should not be discounted.
The suggestion that the differences between shoot and root might reflect per-cell-division
differences also accords with prior evidence suggesting that root and shoot have similar growth
profiles. Estimation of the mitotic index, for example, indicates that the duration of mitotic
cycle is roughly the same in shoots and roots [36]. This does not, however, take into account
the finding that both SAM and RAM contain some cells that divide much slower than others
[11,12]. This is likely to influence mutation accumulation because somatic mutation occur-
rence is correlated with the number of divisions [35], regardless of the per-cell-division rate.
Do plants have a germline: Woodland strawberry as a useful model?
Prior work has suggested that plants might have an effective germline [11,12,29,37], which
may be early segregating and slow dividing, thus accumulating few premeiotic mutations. We
did not seek to test this hypothesis directly, but our lack of evidence for intra-organismic selec-
tion argues against the hypothesis that the reduced mutation rate observed by others may be
more apparent than real.
Although we did not set out to test the germline hypothesis, our analysis of woodland straw-
berry strongly supports the possibility that runners in this species have two discrete cell line-
ages: one that can be propagated to future runners but not to lateral buds and one that can be
propagated to all (i.e., a germline). The relatively high mutation rate in runners makes sense, if
this is the case, as most of the runner is “root-like” in having no gametogenic future.
Our data, however, have little to say as to whether this germline is mutationally protected.
There is no further mutation in runner that cosegregates (ontogenetically) with the germline
one (mutation 5) that would be consistent with a low rate. However, after mutation 5 in runner,
we see only one further mutation (mutation 11), all others occurring after lateral bud develop-
ment. The chance that this new mutation would not be germline must be very high, even if
there is no mutation rate difference. We suggest that this system would be valuable for further
interrogation of the hypothesis of a mutationally protected germline and for mechanisms of
cell lineage sequestration, not least because runner also makes a helpful control for the possibil-
ity that root might have a high mutation rate owing to its subterranean environment.
Materials and methods
Sample preparation
We collected a total of 22 plant individuals, including seven peach (P. persica) and four wild
peach (P. mira) trees, two plum (P. mume) trees, one woodland strawberry (F. vesca), one
Within-plant mutation rate variation
PLOS Biology | https://doi.org/10.1371/journal.pbio.3000191 April 9, 2019 17 / 29
shrub willow (S. suchowensis), four rice (O. sativa), one B. distachyon, and two A. thalianaindividuals (S7 Table). The sampled individuals cover a life span range from several months
to hundreds of years and three distinct genera. One of the peach trees was sampled in Maop-
ing, Guizhou Province, China, and the others were from Nanjing, Jiangsu Province. The wild
peach trees were sampled in Nyingchi, Tibet. The A. thaliana individuals were derived from
two seeds of a single Col-0 plant. Three rice individuals, including one O. sativa L. cv. Pei-Ai
64s (PA1), two O. sativa ssp. indica cv. Kasalath (KA1), and cv. Dee-geo-woo-gen (DG1),
were obtained from the International Rice Research Institute (IRRI). The plum trees were
sampled in Nanjing. The shrub willow YAF1 was kindly provided by Jiangsu Forestry Science
Academe in China. The woodland strawberry was obtained from Nanjing Agricultural Uni-
versity, which was the same accession (Hawaii 4) as the reference genome. The seeds of B. dis-tachyon diploid inbred line Bd21 (WD2) were obtained from South China Agricultural
University.
In total, 480 leaves were sampled from the terminal branches of 21 plants. For rice DG1, B.
distachyon WD2, willow YAF1, plum MHG1, and peach PXL, 25, 8, 22, 32, and 13 root sam-
ples were collected, respectively. One bark sample was also prepared for PXL. Seven lemma
samples were collected for WD2 before maturing. Four stem samples were obtained from
strawberry FH1. For a wild peach tree GL2, 14 fruits were also sampled at the same date as its
leaves. Those fruits were treated with gibberellin to accelerate germination. For a plum tree
MHG1, 21 fruits were sampled 7 months after the leaf sampling.
The age of peach trees was estimated using a growth cone. The ages of wild peach trees
were estimated based on work by Wang and colleagues [33].
DNA was extracted using the CTAB method [38]. About three-quarters of leaf DNA sam-
ples were extracted using a single leaf or part of a single leaf, weighing approximately 0.08–0.7
g. DNA samples for fruits of MHG1 were extracted from the seeds after carefully removing the
seed coats. For progeny of GL2, the DNA samples were extracted from the leaves of seedlings
after growing for approximately 1–2 months. The root and bark DNA samples were extracted
after careful cleaning.
To obtain microscale plant samples, we used a Harris micropunch (0.5-mm diameter) to
harvest a defined area of leaf. Genomic DNA of microscale samples was amplified with a Qia-
gen REPL-g single-cell kit following the kit instructions.
All plant DNA was fragmented into an insert size of about 300–350 bp and sequenced on
the Illumina Hiseq4000 platform with 150-bp paired-end reads at BGI. Detailed statistics of
sequencing results are provided in S1 Data.
Sequencing and alignment
Whole-genome sequences and annotations for peach [39] and woodland strawberry [40] were
downloaded from Genome Database for Rosaceae (GDR, https://www.rosaceae.org, version
2.0.a1). Both peach and woodland strawberry have a compact genome (about 240–260 M) and
a qualified reference genome that is both of high accuracy and completeness. The peach
genome was initially sequenced using Sanger reads and assembled into eight chromosomes
[39], this being subsequently improved with additional linkage maps and NGS reads [41]. The
woodland strawberry was initially sequenced with NGS reads, assembled into seven chromo-
somes [42], and improved by dense targeted capture linkage maps [43]. The reference genome
and annotations for the plum tree [44] were downloaded from http://prunusmumegenome.
bjfu.edu.cn, mirrored at https://github.com/lileiting/prunusmumegenome. The rice reference
genome [45] was downloaded from the Rice Annotation Project Database (RAP-DB, http://
rapdb.dna.affrc.go.jp/, version IRGSP-1.0), and the Arabidopsis reference genome [46] was
Within-plant mutation rate variation
PLOS Biology | https://doi.org/10.1371/journal.pbio.3000191 April 9, 2019 18 / 29
obtained through The Arabidopsis Information Resource (TAIR, http://www.arabidopsis.org/,
version 10).
Each sample was sequenced to a cleaned depth over 40× with qualified bases (base
quality� 20) over 90% after removing adaptors and low-quality reads (i.e., reads containing
more than 50% low-quality bases). Cleaned reads were mapped to each reference genome
using BWA-mem 0.7.10-r789 [47] with default settings. The resulting BAM files were then
sorted and processed with MarkDuplicates in Picard package (version 1.114) to remove nonin-
formative PCR duplicates. A local realignment step was also implemented using RealignerTar-
getCreator and IndelRealigner in GATK package version 3.5.0 [48] to reduce false variant calls
due to alignment errors around insertions/deletions (indels).
The rice root samples were susceptible to bacterial contamination, which resulted in lower
effective coverage. We excluded those samples with extremely low coverage (<45%) from fur-
ther analysis and only used those samples to exclude false positives. The MHG1 individual was
found to be from grafting; thus, the branches and the root were analyzed separately as inde-
pendent systems.
De novo mutation identification
Single-nucleotide variants (SNVs) and small indels were called using two distinct algorithms
implemented in GATK: UnifiedGenotyper (UG) and HaplotypeCaller (HC). Only reads with
a mapping quality over 20 (i.e., less than 1% error rate) were considered.
The initial candidate mutations were called by comparing the samples within the same
branch against all other branches based on the branching topology (S1 Fig). A variant would
be called as a candidate mutation if the allele is different from that in the comparator branches,
which we presume reflects the ancestral state. This parallel comparison approach has been
demonstrated to be robust against sequencing or mapping artifacts and has a relative low false-
negative rate [26]. We compiled a series of criteria for filtering and evaluating the initial candi-
dates (S1 Fig). Those criteria deal with all respects of sequencing, mapping, or calling errors.
First, we filtered candidates with low variant quality (quality score < 50 given in VCF file),
low depth (no sample carries�5 putative mutated reads), or many missing calls (no variant
calls in more than 5 samples). For mutations only found in a single sample, we required the
focal sample (the sample assumed to carry a mutation) to contain at least five reads. For muta-
tions shared by>1 sample, at least one sample should fit this criteria, and other samples should
have no fewer than three reads carrying the same mutations. Variants that failed any of these
criteria were assumed to be sequencing errors. We also removed candidates that were biased
in read strands (only have forward or reverse strands), a signature of erroneous mapping arti-
facts from duplications. Second, we masked the remaining candidate sites that (1) have miss-
ing calls but no more than four samples, (2) have two or three reads with the same “mutated”
alleles of base quality over 20 (termed as “mimic reads” hereafter) among all compared (con-
trol) samples, or (3) could only be captured by UG caller, this having the higher false-positive
rate. Candidates passing all those criteria were considered the “confidence set,” otherwise they
were treated as the “evaluation set” (S1 Fig).
We further manually investigated all candidates in the confidence set and part of the evalua-
tion set, from most evidence to least. For each candidate mutation site, the Integrative Geno-
mics Viewer (IGV) was applied to review the mapping states across all related samples. Loci
found to have resulted from spurious mapping artifacts or contamination (detected by BLAST
search in NCBI Nucleotide collection database using the aligned reads) were discarded. An
additional round of inspection was performed for indels and SNVs around indels. We first
extracted reads mapping to each candidate region and then realigned them to the reference
Within-plant mutation rate variation
PLOS Biology | https://doi.org/10.1371/journal.pbio.3000191 April 9, 2019 19 / 29
sequence with ClustalW2. The regenerated alignments were saved in FASTA format and fur-
ther revised in MEGA6 to get the best possible alignments. From this, we confirmed whether
the candidate is a true variant or just a misalignment artifact. A candidate “mutation” is con-
sidered false if it (1) is an alignment artifact, mostly found in regions containing indels, regions
divergent between the reference genome and analyzed genome, regions harboring large geno-
mic rearrangements, duplications (which easily cause the wrong placement of reads), etc.; (2)
is a preexisting variant (i.e., one actually present in all other samples) but happened to be called
only in some samples (this situation is most likely due to some subtle differences in reads—
e.g., slightly more sequencing errors in some—covering the candidate site between different
samples, which cause some samples to pass the threshold and be called by the caller while oth-
ers happened to fail); (3) is a contamination artifact, either from impurities on the sample’s
surface or “sample bleeding (index hopping)” of multiplexed samples; or (4) resulted from
sequencing errors, mainly found in regions with homopolymers or tandem repeats, which
have dubious lengths among different samples and thus are less likely to be bona fide
mutations.
It was found that the false discovery rate increased rapidly with increasing numbers of
missed calls because there was more sequencing bias when relatively few samples were prop-
erly amplified and sequenced. The same situation was found for more “mimic reads.” Assum-
ing all “mimic reads” were only from sequencing errors, for two mimic reads to be present in
compared samples would require a probability less than (1% base error rate × 1/4 the same
allele by chance)2 = 6.24 × 10⁻⁶. In practice, we found that the presence of more than one
mimic read was mostly a signature of false mutation calls due to sequencing or mapping
artifacts.
Another false-positive source was from misalignments around indels, which could be wit-
nessed as a high error rate in candidates called by UG alone. The UG algorithm directly calls
variants from the alignments and thus is capable of capturing most SNVs but could have a
high false-positive call rate due to misalignment, especially around indel sites. The HC algo-
rithm has fewer positive SNV calls and performs better in indel detection compared to UG, as
HC implements a local reassembly algorithm. However, it was found that the HC caller occa-
sionally lost a few SNVs, possibly because of the non-lossless GVCF mode or the reassembly
process. We integrated results from the two callers in later analyses (S1 Fig). Through these
mechanisms, we minimized both the false-positive rate and false-negative rate caused by the
variant callers [49]. This was confirmed during the manual inspection stage. From the SNV
mutations identified in this study, we found around 95.5% of SNVs could be called by both
HC and UG callers, whereas 2.6% were only called by HC and 1.9% were only called by UG.
For indel mutations, around 83.4% of indels were found in both call sets, whereas 15.8% could
only be called by HC and 0.8% were only called by UG.
In general, the manual inspection suggested the confidence set could capture over 90% of
candidate callable mutations (calculated as “Manually confirmed mutations in confidence
set” / “Manually confirmed mutations in both confidence and evaluation set”) for base substi-
tutions within accessible regions, whereas ignoring the evaluation set would only cause a false-
negative rate of no more than 10%. As the evaluation set was manually investigated from
higher confidence to lower, it was mostly likely that all callable mutations were captured in our
analysis.
During the filtering stage, we also observed a certain number of cross-sample contamina-
tions. Those contaminations were only found within different individuals that were sequenced
in the same sequencing lane. A small number of reads that were believed to belong to one
individual could be observed in another individual, especially in genomic regions with ultra-
high read coverage (e.g., >100×). This contamination was unlikely to be owing to early
Within-plant mutation rate variation
PLOS Biology | https://doi.org/10.1371/journal.pbio.3000191 April 9, 2019 20 / 29
experimental mistakes, as each sample was processed independently during the DNA extrac-
tion and library construction stage. We could also rule out the possibility of read-assign errors,
as the barcodes used for each sample were very different. Therefore, we conclude that those
cross-contaminations are most likely a result of cluster-detection errors during the sequencing
stage, known as “sample bleeding” [50]. These contaminants were removed by comparing
against unrelated samples within the same lane.
The “topology-based” method could miss mutations that occurred originally in soma but
were fixed across different branches. We searched for these heterogeneous sites that have a var-
iant allele present in only some (“M”) of all “N” samples, hereafter referred as the frequency-
based method (S1 and S8 Figs). The frequency-based method then compares every possible
combination of M samples (focal samples supposed to carry the mutation allele) with the
remaining N-M samples (treated as “control” samples) using the same criteria used in the
“topology-based” method (like a comparison between two “branches”). Variant alleles present
in over 0.8 � N samples were not considered as mutations because they (1) could well be preex-
isting variants for which not all samples were properly genotyped, owing to sequencing/map-
ping/calling biases, and (2) could not be distinguished from somatic recombination events (for
further logic and illustration, see S8 Fig).
This method was more prone to various analytical errors, as the “control” samples were
often inaccurate, which could miss true mutations if mutated samples were included in the
control group (see Site4 in S8 Fig), while generating false candidates if insufficient samples
were included in the control group (see Site5 in S8 Fig). Therefore, we only considered the
most confident sites present in several samples defined as before but with no evidence in all
other samples (e.g., no mimic reads allowed). Results from the frequency-based method could
also be used to correct any errors in topology records (S1 Fig). For instance, the relationship of
five primary branches of GL2 tree are almost indistinguishable (Fig 2A) and could only be
treated as five independent branches, whereas, based on mutations shared between them, the
frequency-based analysis suggested the branches B1 and B2 are actually ontogenetically closer
(Fig 2B, same for B4 and B5).
Only substitutions and small indels (e.g., <100 bp) were investigated in this study. Substitu-
tions include SNV and multiple-nucleotide variants (MNVs), whereas indels contain pure
insertions (INSs), deletions (DELs), and complex replacements (RPLs; i.e., nonequal-size base
substitutions). A full list of all identified mutations can be found in S2 Data.
Although new mutations are expected to be heterozygous, we did not filter with heterozy-
gosity as a requirement; rather, we require a mutation to be different from the ancestral state.
This decision was based on the premise that there exist several situations that could cause real
mutations to be witnessed in an apparent or real “homozygous” state. These include subse-
quent somatic recombination leading to the loss of the nonmutated haplotype, sequencing
bias in which only the mutated haplotype gets sequenced, mapping issues in which only the
mutated haplotype is properly mapped, etc. As it happens, 99.0% of mutations we identified in
this study were heterozygous.
Estimation of false-negative/positive rates and callable sites
We used PCR and conventional Sanger sequencing to validate 89 mutations in 122 mutated
samples, 59 progeny samples, and 274 control samples. The mutated samples were confirmed
at a rate of 96.7% (118/122). The unconfirmed instances could reflect false positives or a failure
of the PCR to amplify the mutant allele. No mutant allele was found in control samples.
The number of callable sites and the false-negative rate were estimated using a simulation
method similar to that described previously [26,51]. The read-depth distribution for each
Within-plant mutation rate variation
PLOS Biology | https://doi.org/10.1371/journal.pbio.3000191 April 9, 2019 21 / 29
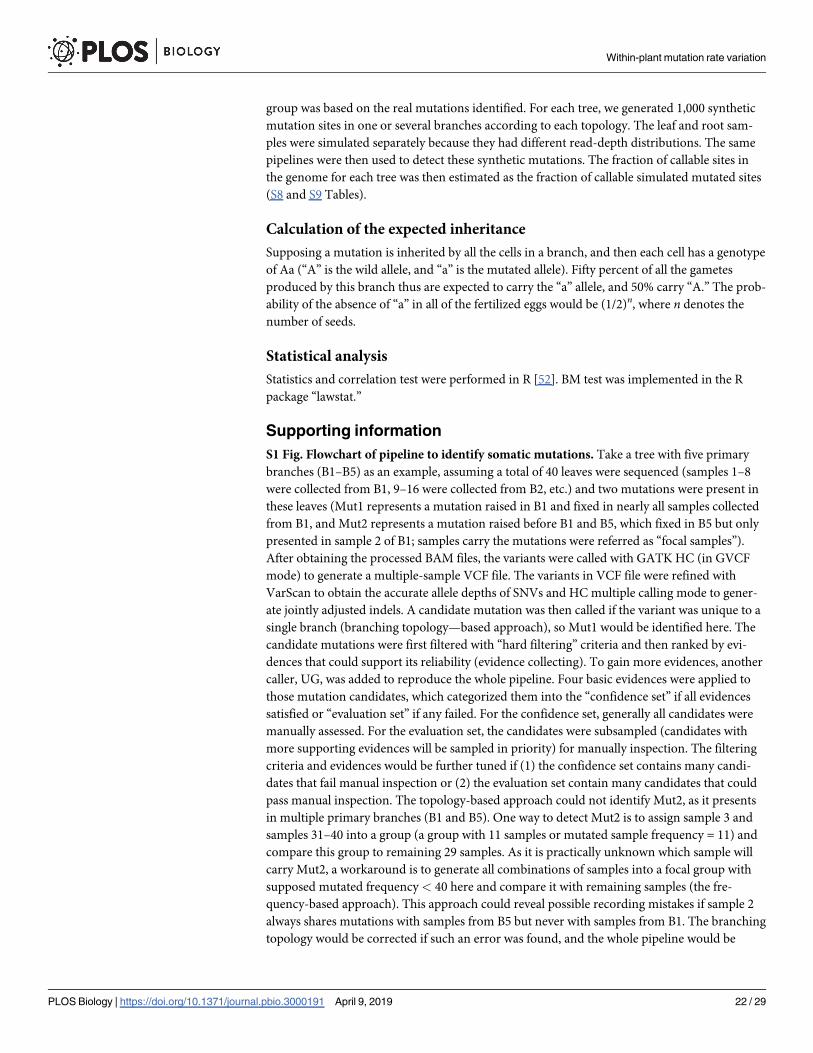
group was based on the real mutations identified. For each tree, we generated 1,000 synthetic
mutation sites in one or several branches according to each topology. The leaf and root sam-
ples were simulated separately because they had different read-depth distributions. The same
pipelines were then used to detect these synthetic mutations. The fraction of callable sites in
the genome for each tree was then estimated as the fraction of callable simulated mutated sites
(S8 and S9 Tables).
Calculation of the expected inheritance
Supposing a mutation is inherited by all the cells in a branch, and then each cell has a genotype
of Aa (“A” is the wild allele, and “a” is the mutated allele). Fifty percent of all the gametes
produced by this branch thus are expected to carry the “a” allele, and 50% carry “A.” The prob-
ability of the absence of “a” in all of the fertilized eggs would be (1/2)n, where n denotes the
number of seeds.
Statistical analysis
Statistics and correlation test were performed in R [52]. BM test was implemented in the R
package “lawstat.”
Supporting information
S1 Fig. Flowchart of pipeline to identify somatic mutations. Take a tree with five primary
branches (B1–B5) as an example, assuming a total of 40 leaves were sequenced (samples 1–8
were collected from B1, 9–16 were collected from B2, etc.) and two mutations were present in
these leaves (Mut1 represents a mutation raised in B1 and fixed in nearly all samples collected
from B1, and Mut2 represents a mutation raised before B1 and B5, which fixed in B5 but only
presented in sample 2 of B1; samples carry the mutations were referred as “focal samples”).
After obtaining the processed BAM files, the variants were called with GATK HC (in GVCF
mode) to generate a multiple-sample VCF file. The variants in VCF file were refined with
VarScan to obtain the accurate allele depths of SNVs and HC multiple calling mode to gener-
ate jointly adjusted indels. A candidate mutation was then called if the variant was unique to a
single branch (branching topology—based approach), so Mut1 would be identified here. The
candidate mutations were first filtered with “hard filtering” criteria and then ranked by evi-
dences that could support its reliability (evidence collecting). To gain more evidences, another
caller, UG, was added to reproduce the whole pipeline. Four basic evidences were applied to
those mutation candidates, which categorized them into the “confidence set” if all evidences
satisfied or “evaluation set” if any failed. For the confidence set, generally all candidates were
manually assessed. For the evaluation set, the candidates were subsampled (candidates with
more supporting evidences will be sampled in priority) for manually inspection. The filtering
criteria and evidences would be further tuned if (1) the confidence set contains many candi-
dates that fail manual inspection or (2) the evaluation set contain many candidates that could
pass manual inspection. The topology-based approach could not identify Mut2, as it presents
in multiple primary branches (B1 and B5). One way to detect Mut2 is to assign sample 3 and
samples 31–40 into a group (a group with 11 samples or mutated sample frequency = 11) and
compare this group to remaining 29 samples. As it is practically unknown which sample will
carry Mut2, a workaround is to generate all combinations of samples into a focal group with
supposed mutated frequency< 40 here and compare it with remaining samples (the fre-
quency-based approach). This approach could reveal possible recording mistakes if sample 2
always shares mutations with samples from B5 but never with samples from B1. The branching
topology would be corrected if such an error was found, and the whole pipeline would be
Within-plant mutation rate variation
PLOS Biology | https://doi.org/10.1371/journal.pbio.3000191 April 9, 2019 22 / 29
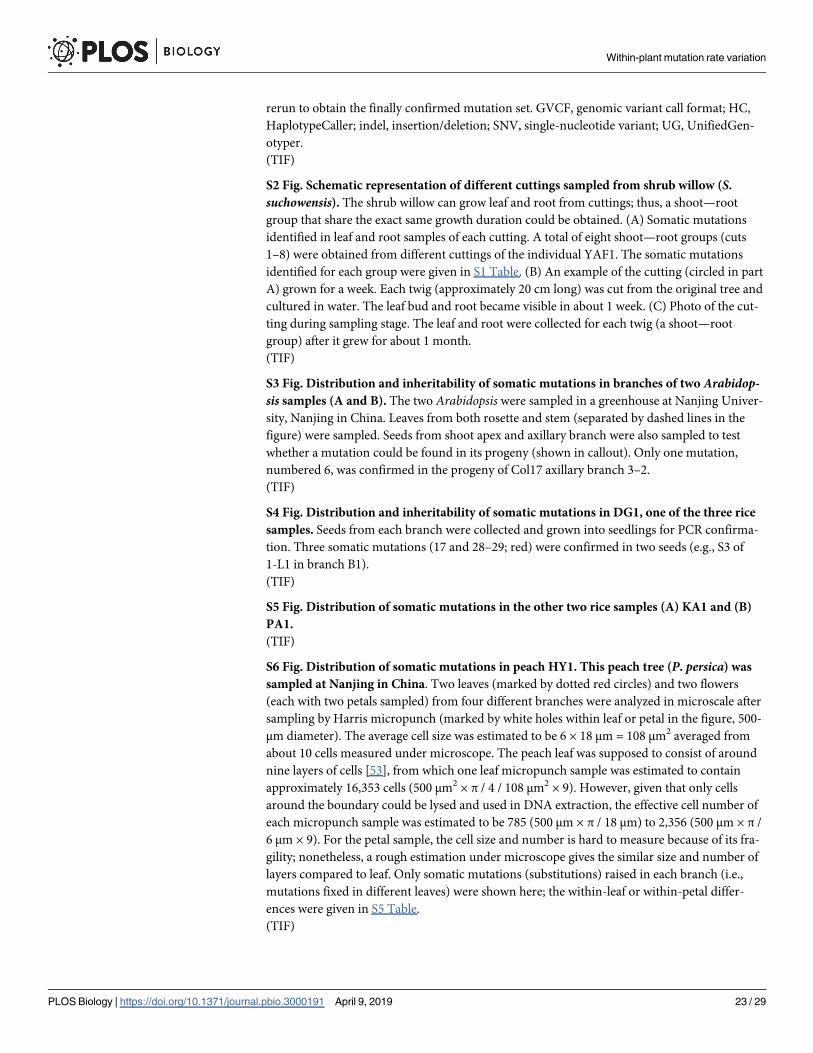
rerun to obtain the finally confirmed mutation set. GVCF, genomic variant call format; HC,
HaplotypeCaller; indel, insertion/deletion; SNV, single-nucleotide variant; UG, UnifiedGen-
otyper.
(TIF)
S2 Fig. Schematic representation of different cuttings sampled from shrub willow (S.
suchowensis). The shrub willow can grow leaf and root from cuttings; thus, a shoot—root
group that share the exact same growth duration could be obtained. (A) Somatic mutations
identified in leaf and root samples of each cutting. A total of eight shoot—root groups (cuts
1–8) were obtained from different cuttings of the individual YAF1. The somatic mutations
identified for each group were given in S1 Table. (B) An example of the cutting (circled in part
A) grown for a week. Each twig (approximately 20 cm long) was cut from the original tree and
cultured in water. The leaf bud and root became visible in about 1 week. (C) Photo of the cut-
ting during sampling stage. The leaf and root were collected for each twig (a shoot—root
group) after it grew for about 1 month.
(TIF)
S3 Fig. Distribution and inheritability of somatic mutations in branches of two Arabidop-sis samples (A and B). The two Arabidopsis were sampled in a greenhouse at Nanjing Univer-
sity, Nanjing in China. Leaves from both rosette and stem (separated by dashed lines in the
figure) were sampled. Seeds from shoot apex and axillary branch were also sampled to test
whether a mutation could be found in its progeny (shown in callout). Only one mutation,
numbered 6, was confirmed in the progeny of Col17 axillary branch 3–2.
(TIF)
S4 Fig. Distribution and inheritability of somatic mutations in DG1, one of the three rice
samples. Seeds from each branch were collected and grown into seedlings for PCR confirma-
tion. Three somatic mutations (17 and 28–29; red) were confirmed in two seeds (e.g., S3 of
1-L1 in branch B1).
(TIF)
S5 Fig. Distribution of somatic mutations in the other two rice samples (A) KA1 and (B)
PA1.
(TIF)
S6 Fig. Distribution of somatic mutations in peach HY1. This peach tree (P. persica) was
sampled at Nanjing in China. Two leaves (marked by dotted red circles) and two flowers
(each with two petals sampled) from four different branches were analyzed in microscale after
sampling by Harris micropunch (marked by white holes within leaf or petal in the figure, 500-
μm diameter). The average cell size was estimated to be 6 × 18 μm = 108 μm2 averaged from
about 10 cells measured under microscope. The peach leaf was supposed to consist of around
nine layers of cells [53], from which one leaf micropunch sample was estimated to contain
approximately 16,353 cells (500 μm2 × π / 4 / 108 μm2 × 9). However, given that only cells
around the boundary could be lysed and used in DNA extraction, the effective cell number of
each micropunch sample was estimated to be 785 (500 μm × π / 18 μm) to 2,356 (500 μm × π /
6 μm × 9). For the petal sample, the cell size and number is hard to measure because of its fra-
gility; nonetheless, a rough estimation under microscope gives the similar size and number of
layers compared to leaf. Only somatic mutations (substitutions) raised in each branch (i.e.,
mutations fixed in different leaves) were shown here; the within-leaf or within-petal differ-
ences were given in S5 Table.
(TIF)
Within-plant mutation rate variation
PLOS Biology | https://doi.org/10.1371/journal.pbio.3000191 April 9, 2019 23 / 29
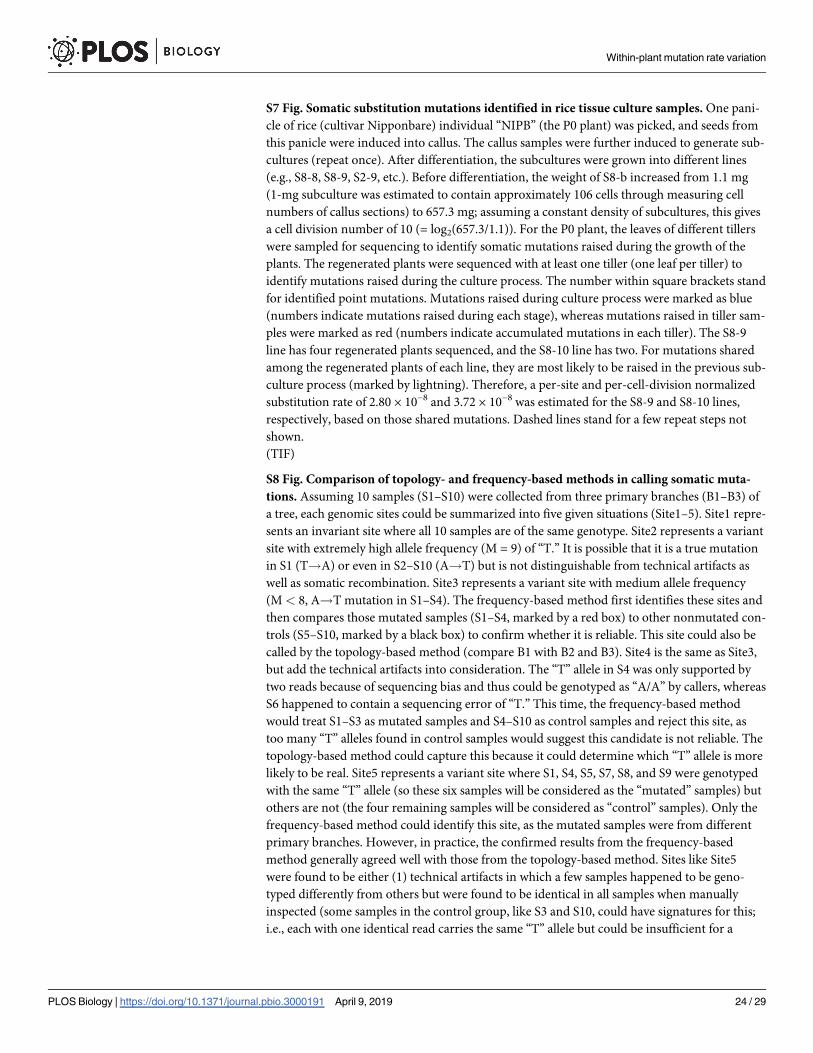
S7 Fig. Somatic substitution mutations identified in rice tissue culture samples. One pani-
cle of rice (cultivar Nipponbare) individual “NIPB” (the P0 plant) was picked, and seeds from
this panicle were induced into callus. The callus samples were further induced to generate sub-
cultures (repeat once). After differentiation, the subcultures were grown into different lines
(e.g., S8-8, S8-9, S2-9, etc.). Before differentiation, the weight of S8-b increased from 1.1 mg
(1-mg subculture was estimated to contain approximately 106 cells through measuring cell
numbers of callus sections) to 657.3 mg; assuming a constant density of subcultures, this gives
a cell division number of 10 (= log2(657.3/1.1)). For the P0 plant, the leaves of different tillers
were sampled for sequencing to identify somatic mutations raised during the growth of the
plants. The regenerated plants were sequenced with at least one tiller (one leaf per tiller) to
identify mutations raised during the culture process. The number within square brackets stand
for identified point mutations. Mutations raised during culture process were marked as blue
(numbers indicate mutations raised during each stage), whereas mutations raised in tiller sam-
ples were marked as red (numbers indicate accumulated mutations in each tiller). The S8-9
line has four regenerated plants sequenced, and the S8-10 line has two. For mutations shared
among the regenerated plants of each line, they are most likely to be raised in the previous sub-
culture process (marked by lightning). Therefore, a per-site and per-cell-division normalized
substitution rate of 2.80 × 10⁻⁸ and 3.72 × 10⁻⁸ was estimated for the S8-9 and S8-10 lines,
respectively, based on those shared mutations. Dashed lines stand for a few repeat steps not
shown.
(TIF)
S8 Fig. Comparison of topology- and frequency-based methods in calling somatic muta-
tions. Assuming 10 samples (S1–S10) were collected from three primary branches (B1–B3) of
a tree, each genomic sites could be summarized into five given situations (Site1–5). Site1 repre-
sents an invariant site where all 10 samples are of the same genotype. Site2 represents a variant
site with extremely high allele frequency (M = 9) of “T.” It is possible that it is a true mutation
in S1 (T!A) or even in S2–S10 (A!T) but is not distinguishable from technical artifacts as
well as somatic recombination. Site3 represents a variant site with medium allele frequency
(M< 8, A!T mutation in S1–S4). The frequency-based method first identifies these sites and
then compares those mutated samples (S1–S4, marked by a red box) to other nonmutated con-
trols (S5–S10, marked by a black box) to confirm whether it is reliable. This site could also be
called by the topology-based method (compare B1 with B2 and B3). Site4 is the same as Site3,
but add the technical artifacts into consideration. The “T” allele in S4 was only supported by
two reads because of sequencing bias and thus could be genotyped as “A/A” by callers, whereas
S6 happened to contain a sequencing error of “T.” This time, the frequency-based method
would treat S1–S3 as mutated samples and S4–S10 as control samples and reject this site, as
too many “T” alleles found in control samples would suggest this candidate is not reliable. The
topology-based method could capture this because it could determine which “T” allele is more
likely to be real. Site5 represents a variant site where S1, S4, S5, S7, S8, and S9 were genotyped
with the same “T” allele (so these six samples will be considered as the “mutated” samples) but
others are not (the four remaining samples will be considered as “control” samples). Only the
frequency-based method could identify this site, as the mutated samples were from different
primary branches. However, in practice, the confirmed results from the frequency-based
method generally agreed well with those from the topology-based method. Sites like Site5
were found to be either (1) technical artifacts in which a few samples happened to be geno-
typed differently from others but were found to be identical in all samples when manually
inspected (some samples in the control group, like S3 and S10, could have signatures for this;
i.e., each with one identical read carries the same “T” allele but could be insufficient for a
Within-plant mutation rate variation
PLOS Biology | https://doi.org/10.1371/journal.pbio.3000191 April 9, 2019 24 / 29
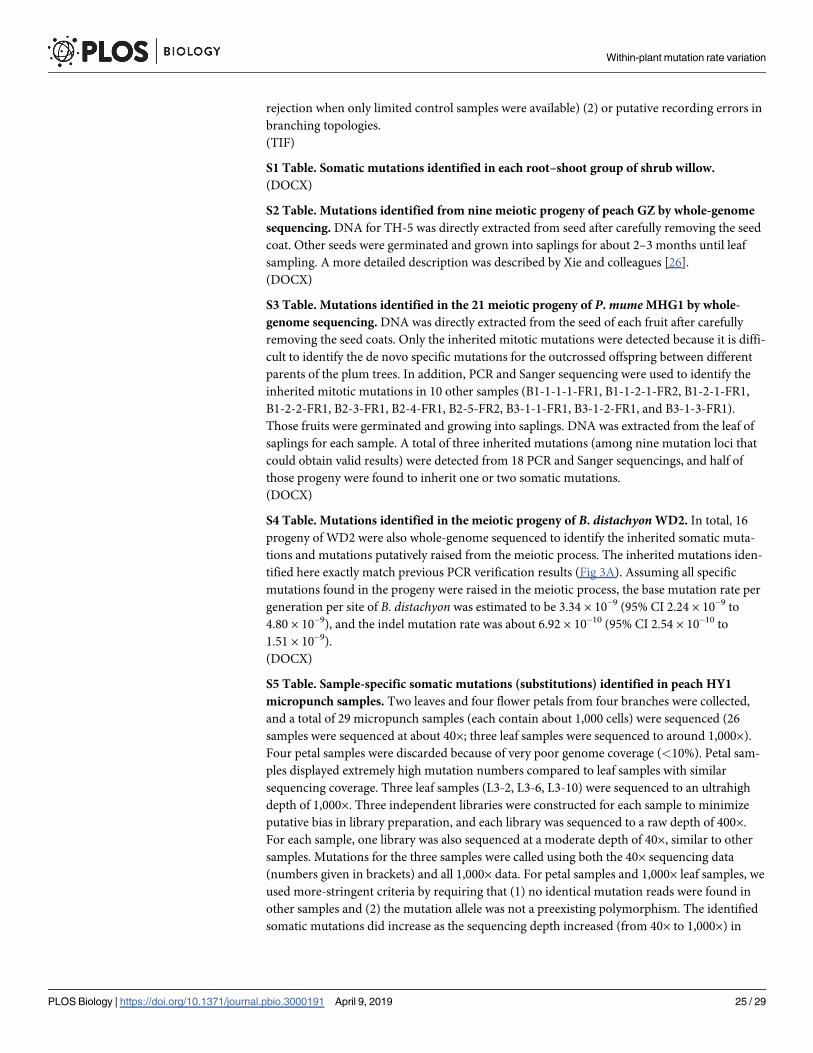
rejection when only limited control samples were available) (2) or putative recording errors in
branching topologies.
(TIF)
S1 Table. Somatic mutations identified in each root–shoot group of shrub willow.
(DOCX)
S2 Table. Mutations identified from nine meiotic progeny of peach GZ by whole-genome
sequencing. DNA for TH-5 was directly extracted from seed after carefully removing the seed
coat. Other seeds were germinated and grown into saplings for about 2–3 months until leaf
sampling. A more detailed description was described by Xie and colleagues [26].
(DOCX)
S3 Table. Mutations identified in the 21 meiotic progeny of P. mume MHG1 by whole-
genome sequencing. DNA was directly extracted from the seed of each fruit after carefully
removing the seed coats. Only the inherited mitotic mutations were detected because it is diffi-
cult to identify the de novo specific mutations for the outcrossed offspring between different
parents of the plum trees. In addition, PCR and Sanger sequencing were used to identify the
inherited mitotic mutations in 10 other samples (B1-1-1-1-FR1, B1-1-2-1-FR2, B1-2-1-FR1,
B1-2-2-FR1, B2-3-FR1, B2-4-FR1, B2-5-FR2, B3-1-1-FR1, B3-1-2-FR1, and B3-1-3-FR1).
Those fruits were germinated and growing into saplings. DNA was extracted from the leaf of
saplings for each sample. A total of three inherited mutations (among nine mutation loci that
could obtain valid results) were detected from 18 PCR and Sanger sequencings, and half of
those progeny were found to inherit one or two somatic mutations.
(DOCX)
S4 Table. Mutations identified in the meiotic progeny of B. distachyon WD2. In total, 16
progeny of WD2 were also whole-genome sequenced to identify the inherited somatic muta-
tions and mutations putatively raised from the meiotic process. The inherited mutations iden-
tified here exactly match previous PCR verification results (Fig 3A). Assuming all specific
mutations found in the progeny were raised in the meiotic process, the base mutation rate per
generation per site of B. distachyon was estimated to be 3.34 × 10⁻⁹ (95% CI 2.24 × 10⁻⁹ to
4.80 × 10⁻⁹), and the indel mutation rate was about 6.92 × 10⁻¹⁰ (95% CI 2.54 × 10⁻¹⁰ to
1.51 × 10⁻⁹).
(DOCX)
S5 Table. Sample-specific somatic mutations (substitutions) identified in peach HY1
micropunch samples. Two leaves and four flower petals from four branches were collected,
and a total of 29 micropunch samples (each contain about 1,000 cells) were sequenced (26
samples were sequenced at about 40×; three leaf samples were sequenced to around 1,000×).
Four petal samples were discarded because of very poor genome coverage (<10%). Petal sam-
ples displayed extremely high mutation numbers compared to leaf samples with similar
sequencing coverage. Three leaf samples (L3-2, L3-6, L3-10) were sequenced to an ultrahigh
depth of 1,000×. Three independent libraries were constructed for each sample to minimize
putative bias in library preparation, and each library was sequenced to a raw depth of 400×.
For each sample, one library was also sequenced at a moderate depth of 40×, similar to other
samples. Mutations for the three samples were called using both the 40× sequencing data
(numbers given in brackets) and all 1,000× data. For petal samples and 1,000× leaf samples, we
used more-stringent criteria by requiring that (1) no identical mutation reads were found in
other samples and (2) the mutation allele was not a preexisting polymorphism. The identified
somatic mutations did increase as the sequencing depth increased (from 40× to 1,000×) in
Within-plant mutation rate variation
PLOS Biology | https://doi.org/10.1371/journal.pbio.3000191 April 9, 2019 25 / 29
three leaf samples, but the total number was still very low, especially compared with petal sam-
ples.
(DOCX)
S6 Table. Mutations identified in rice tissue culture samples. Ten leaves (T1–T4, T5–T11,
one leaf per tiller) were sampled from the original parental plant. For regenerated plants, one
or more leaves (one leaf per tiller) from arbitrary chosen tillers were sampled. The mutations
were identified by comparing leaf between different tillers or different plants, as shown in
S7 Fig.
(DOCX)
S7 Table. Geographic location and sampling date of trees.
(DOCX)
S8 Table. Genome callable fractions of species with clear topologies.
(DOCX)
S9 Table. Genome callable fractions of species without clear topologies.
(DOCX)
S1 Data. Statistics of sequenced samples.
(XLSX)
S2 Data. List of identified mutation sites.
(XLSX)
Author Contributions
Conceptualization: Sihai Yang, Laurence D. Hurst, Dacheng Tian.
Data curation: Long Wang, Yilun Ji, Yingwen Hu, Huaying Hu, Xianqin Jia, Mengmeng
Jiang, Xiaohui Zhang, Lina Zhao, Yanchun Zhang, Yanxiao Jia, Chao Qin, Luyao Yu, Ju
Huang.
Formal analysis: Long Wang, Yilun Ji, Xianqin Jia, Yanchun Zhang, Chao Qin, Sihai Yang,
Laurence D. Hurst, Dacheng Tian.
Funding acquisition: Long Wang, Sihai Yang, Laurence D. Hurst, Dacheng Tian.
Investigation: Long Wang, Yilun Ji, Yingwen Hu, Huaying Hu, Xianqin Jia, Mengmeng Jiang,
Xiaohui Zhang, Lina Zhao, Yanchun Zhang, Yanxiao Jia, Chao Qin, Luyao Yu, Ju Huang,
Sihai Yang, Laurence D. Hurst.
Methodology: Long Wang, Yilun Ji, Sihai Yang, Dacheng Tian.
Project administration: Sihai Yang, Laurence D. Hurst, Dacheng Tian.
Resources: Long Wang, Yilun Ji, Yingwen Hu, Huaying Hu, Xiaohui Zhang, Lina Zhao, Yan-
xiao Jia, Sihai Yang, Dacheng Tian.
Supervision: Sihai Yang, Laurence D. Hurst, Dacheng Tian.
Validation: Long Wang, Yilun Ji, Yingwen Hu, Huaying Hu, Xianqin Jia, Yanchun Zhang,
Chao Qin, Luyao Yu.
Visualization: Long Wang, Xianqin Jia.
Writing – original draft: Sihai Yang, Laurence D. Hurst, Dacheng Tian.
Within-plant mutation rate variation
PLOS Biology | https://doi.org/10.1371/journal.pbio.3000191 April 9, 2019 26 / 29

Writing – review & editing: Long Wang, Sihai Yang, Laurence D. Hurst, Dacheng Tian.
References1. Weismann A. Das Keimplasma: eine Theorie der Vererbung. 1. Auflage. Jena: Fischer; 1892.
2. Kirkwood TBL. Evolution of ageing. Mech Ageing Dev. 2002; 123: 737–745. https://doi.org/10.1016/
S0047-6374(01)00419-5 PMID: 11869731
3. Vijg J. Aging of the genome: the dual role of the DNA in life and death. Oxford; New York: Oxford Uni-
versity Press; 2007.
4. Milholland B, Dong X, Zhang L, Hao X, Suh Y, Vijg J. Differences between germline and somatic muta-
tion rates in humans and mice. Nat Commun. 2017; 8: 15183. https://doi.org/10.1038/ncomms15183
PMID: 28485371
5. Lindsay SJ, Rahbari R, Kaplanis J, Keane T, Hurles M. Striking differences in patterns of germline muta-
tion between mice and humans. bioRxiv. 2018; 082297. https://doi.org/10.1101/082297
6. Lynch M. Evolution of the mutation rate. Trends Genet. 2010; 26: 345–352. https://doi.org/10.1016/j.tig.
2010.05.003 PMID: 20594608
7. Winn RN, Norris MB, Brayer KJ, Torres C, Muller SL. Detection of mutations in transgenic fish carrying
a bacteriophage λcII transgene target. Proc Natl Acad Sci. 2000; 97: 12655–12660. https://doi.org/10.
1073/pnas.220428097 PMID: 11035814
8. Garcia AM, Derventzi A, Busuttil R, Calder RB, Perez E Jr, Chadwell L, et al. A model system for analyz-
ing somatic mutations in Drosophila melanogaster. Nat Methods. 2007; 4: 401–403. https://doi.org/10.
1038/NMETH1027 PMID: 17435764
9. Edman U, Garcia AM, Busuttil RA, Sorensen D, Lundell M, Kapahi P, et al. Lifespan extension by die-
tary restriction is not linked to protection against somatic DNA damage in Drosophila melanogaster.
Aging Cell. 2009; 8: 331–338. https://doi.org/10.1111/j.1474-9726.2009.00480.x PMID: 19627272
10. Zhang L, Vijg J. Somatic Mutagenesis in Mammals and Its Implications for Human Disease and Aging.
Annu Rev Genet. 2018; 52: 397–419. https://doi.org/10.1146/annurev-genet-120417-031501 PMID:
30212236
11. Burian A, Barbier de Reuille P, Kuhlemeier C. Patterns of Stem Cell Divisions Contribute to Plant Lon-
gevity. Curr Biol. 2016; 26: 1385–1394. https://doi.org/10.1016/j.cub.2016.03.067 PMID: 27161504
12. Watson JM, Platzer A, Kazda A, Akimcheva S, Valuchova S, Nizhynska V, et al. Germline replications
and somatic mutation accumulation are independent of vegetative life span in Arabidopsis. Proc Natl
Acad Sci. 2016; 201609686. https://doi.org/10.1073/pnas.1609686113 PMID: 27729523
13. Sutherland WJ, Watkinson AR. Somatic mutation: Do plants evolve differently? Nature. 1986; 320:
305–305. https://doi.org/10.1038/320305a0
14. Gill D E, Chao L, Perkins S L, Wolf JB. Genetic Mosaicism in Plants and Clonal Animals. Annu Rev Ecol
Syst. 1995; 26: 423–444. https://doi.org/10.1146/annurev.es.26.110195.002231
15. Yong E. Tree’s leaves genetically different from its roots. Nat News. 2012. https://doi.org/10.1038/
nature.2012.11156
16. Bobiwash K, Schultz ST, Schoen DJ. Somatic deleterious mutation rate in a woody plant: estimation from
phenotypic data. Heredity. 2013; 111: 338–344. https://doi.org/10.1038/hdy.2013.57 PMID: 23778990
17. Benedict RC. New Bud Sports in Nephrolepis. Genetics. 1923; 8: 75–95. PMID: 17246002
18. Shamel AD, Pomeroy CS. Bud mutations in horticultural crops. J Hered. 1936; 27: 487–494. https://doi.
org/10.1093/oxfordjournals.jhered.a104171
19. Roest S, van Berkel MAE, Bokelmann GS, Broertjes C. The use of an in vitro adventitious bud tech-
nique for mutation breeding of Begonia x hiemalis. Euphytica. 1981; 30: 381–388. https://doi.org/10.
1007/BF00034000
20. White J. The Plant as a Metapopulation. Annu Rev Ecol Syst. 1979; 10: 109–145. https://doi.org/10.
1146/annurev.es.10.110179.000545
21. Antolin MF, Strobeck C. The Population Genetics of Somatic Mutation in Plants. Am Nat. 1985; 126:
52–62.
22. Dubrovina AS, Kiselev KV. Age-associated alterations in the somatic mutation and DNA methylation
levels in plants. Plant Biol. 2016; 18: 185–196. https://doi.org/10.1111/plb.12375 PMID: 26211365
23. Heidstra R, Sabatini S. Plant and animal stem cells: similar yet different. Nat Rev Mol Cell Biol. 2014;
15: 301–312. https://doi.org/10.1038/nrm3790 PMID: 24755933
24. Klekowski EJ Jr, Godfrey PJ. Ageing and mutation in plants. Nature. 1989; 340: 389–391. https://doi.
org/10.1038/340389a0
Within-plant mutation rate variation
PLOS Biology | https://doi.org/10.1371/journal.pbio.3000191 April 9, 2019 27 / 29
25. Smith SA, Donoghue MJ. Rates of Molecular Evolution Are Linked to Life History in Flowering Plants.
Science. 2008; 322: 86–89. https://doi.org/10.1126/science.1163197 PMID: 18832643
26. Xie Z, Wang L, Wang L, Wang Z, Lu Z, Tian D, et al. Mutation rate analysis via parent—progeny
sequencing of the perennial peach. I. A low rate in woody perennials and a higher mutagenicity in
hybrids. Proc R Soc B. 2016; 283: 20161016. https://doi.org/10.1098/rspb.2016.1016 PMID: 27798292
27. Fletcher JC. Shoot and Floral Meristem Maintenance in Arabidopsis. Annu Rev Plant Biol. 2002; 53:
45–66. https://doi.org/10.1146/annurev.arplant.53.092701.143332 PMID: 12221985
28. Sauret-Gueto S, Schiessl K, Bangham A, Sablowski R, Coen E. JAGGED Controls Arabidopsis Petal
Growth and Shape by Interacting with a Divergent Polarity Field. PLoS Biol. 2013; 11:4: e1001550.
https://doi.org/10.1371/journal.pbio.1001550 PMID: 23653565
29. Schmid-Siegert E, Sarkar N, Iseli C, Calderon S, Gouhier-Darimont C, Chrast J, et al. Low number of
fixed somatic mutations in a long-lived oak tree. Nat Plants. 2017; 3: 926. https://doi.org/10.1038/
s41477-017-0066-9 PMID: 29209081
30. Scofield DG. A definitive demonstration of fitness effects due to somatic mutation in a plant. Heredity.
2014; 112: 361–362. https://doi.org/10.1038/hdy.2013.114 PMID: 24193514
31. Rocha EPC, Smith JM, Hurst LD, Holden MTG, Cooper JE, Smith NH, et al. Comparisons of dN/dS are
time dependent for closely related bacterial genomes. J Theor Biol. 2006; 239: 226–235. https://doi.org/
10.1016/j.jtbi.2005.08.037 PMID: 16239014
32. Ally D, Ritland K, Otto SP. Aging in a Long-Lived Clonal Tree. PLoS Biol. 2010; 8:8: e1000454. https://
doi.org/10.1371/journal.pbio.1000454 PMID: 20808953
33. Wang L, Zhu G, Fang W. Peach Genetic Resources in China. Beijing: China Agricultural Press; 2012.
34. Jiang C, Mithani A, Belfield EJ, Mott R, Hurst LD, Harberd NP. Environmentally responsive genome-
wide accumulation of de novo Arabidopsis thaliana mutations and epimutations. Genome Res. 2014;
24: 1821–1829. https://doi.org/10.1101/gr.177659.114 PMID: 25314969
35. Behjati S, Huch M, van Boxtel R, Karthaus W, Wedge DC, Tamuri AU, et al. Genome sequencing of
normal cells reveals developmental lineages and mutational processes. Nature. 2014; 513: 422–425.
https://doi.org/10.1038/nature13448 PMID: 25043003
36. Stewart RN, Dermen H. Determination of Number and Mitotic Activity of Shoot Apical Initial Cells by
Analysis of Mericlinal Chimeras. Am J Bot. 1970; 57: 816–826. https://doi.org/10.2307/2441339
37. Lanfear R. Do plants have a segregated germline? PLoS Biol. 2018; 16:5: e2005439. https://doi.org/10.
1371/journal.pbio.2005439 PMID: 29768400
38. Murray MG, Thompson WF. Rapid isolation of high molecular weight plant DNA. Nucleic Acids Res.
1980; 8: 4321–4325. PMID: 7433111
39. The International Peach Genome Initiative, Verde I, Abbott AG, Scalabrin S, Jung S, Shu S, et al. The
high-quality draft genome of peach (Prunus persica) identifies unique patterns of genetic diversity,
domestication and genome evolution. Nat Genet. 2013; 45: 487–494. https://doi.org/10.1038/ng.2586
PMID: 23525075
40. Darwish O, Shahan R, Liu Z, Slovin JP, Alkharouf NW. Re-annotation of the woodland strawberry (Fra-
garia vesca) genome. BMC Genomics. 2015; 16: 29. https://doi.org/10.1186/s12864-015-1221-1
PMID: 25623424
41. Verde I, Jenkins J, Dondini L, Micali S, Pagliarani G, Vendramin E, et al. The Peach v2.0 release: high-
resolution linkage mapping and deep resequencing improve chromosome-scale assembly and contigu-
ity. BMC Genomics. 2017; 18: 225. https://doi.org/10.1186/s12864-017-3606-9 PMID: 28284188
42. Shulaev V, Sargent DJ, Crowhurst RN, Mockler TC, Folkerts O, Delcher AL, et al. The genome of wood-
land strawberry (Fragaria vesca). Nat Genet. 2011; 43: 109–116. https://doi.org/10.1038/ng.740 PMID:
21186353
43. Tennessen JA, Govindarajulu R, Ashman T-L, Liston A. Evolutionary Origins and Dynamics of Octo-
ploid Strawberry Subgenomes Revealed by Dense Targeted Capture Linkage Maps. Genome Biol
Evol. 2014; 6: 3295–3313. https://doi.org/10.1093/gbe/evu261 PMID: 25477420
44. Zhang Q, Chen W, Sun L, Zhao F, Huang B, Yang W, et al. The genome of Prunus mume. Nat Com-
mun. 2012; 3: 1318. https://doi.org/10.1038/ncomms2290 PMID: 23271652
45. Sakai H, Lee SS, Tanaka T, Numa H, Kim J, Kawahara Y, et al. Rice Annotation Project Database
(RAP-DB): An Integrative and Interactive Database for Rice Genomics. Plant Cell Physiol. 2013; 54:
e6–e6. https://doi.org/10.1093/pcp/pcs183 PMID: 23299411
46. Lamesch P, Berardini TZ, Li D, Swarbreck D, Wilks C, Sasidharan R, et al. The Arabidopsis Information
Resource (TAIR): improved gene annotation and new tools. Nucleic Acids Res. 2012; 40: D1202–
D1210. https://doi.org/10.1093/nar/gkr1090 PMID: 22140109
Within-plant mutation rate variation
PLOS Biology | https://doi.org/10.1371/journal.pbio.3000191 April 9, 2019 28 / 29
47. Li H. Aligning sequence reads, clone sequences and assembly contigs with BWA-MEM. ArXiv:13033997
Q-Bio. 2013 [cited 2016 Oct 5]; http://arxiv.org/abs/1303.3997
48. DePristo MA, Banks E, Poplin R, Garimella KV, Maguire JR, Hartl C, et al. A framework for variation dis-
covery and genotyping using next-generation DNA sequencing data. Nat Genet. 2011; 43: 491–498.
https://doi.org/10.1038/ng.806 PMID: 21478889
49. Alioto TS, Buchhalter I, Derdak S, Hutter B, Eldridge MD, Hovig E, et al. A comprehensive assessment
of somatic mutation detection in cancer using whole-genome sequencing. Nat Commun. 2015; 6:
10001. https://doi.org/10.1038/ncomms10001 PMID: 26647970
50. Mitra A, Skrzypczak M, Ginalski K, Rowicka M. Strategies for Achieving High Sequencing Accuracy for
Low Diversity Samples and Avoiding Sample Bleeding Using Illumina Platform. PLoS ONE. 2015; 10:4:
e0120520. https://doi.org/10.1371/journal.pone.0120520 PMID: 25860802
51. Keightley PD, Pinharanda A, Ness RW, Simpson F, Dasmahapatra KK, Mallet J, et al. Estimation of the
Spontaneous Mutation Rate in Heliconius melpomene. Mol Biol Evol. 2015; 32: 239–243. https://doi.
org/10.1093/molbev/msu302 PMID: 25371432
52. R Development Core Team. R: A language and environment for statistical computing. Vienna: R Foun-
dation for Statistical Computing; 2013. http://www.R-project.org.
53. Fernandez V, Eichert T, Rıo VD, Lopez-Casado G, Heredia-Guerrero JA, Abadıa A, et al. Leaf struc-
tural changes associated with iron deficiency chlorosis in field-grown pear and peach: physiological
implications. Plant Soil. 2008; 311: 161. https://doi.org/10.1007/s11104-008-9667-4
Within-plant mutation rate variation
PLOS Biology | https://doi.org/10.1371/journal.pbio.3000191 April 9, 2019 29 / 29