rticle - geoscience canada · température des roches métamorphiques, les utilisateurs les...
TRANSCRIPT
GEOSCIENCE CANADA
Applying Phase Equilibria Modelling toMetamorphic and Geological Processes:Recent Developments and Future Potential
Chris Yakymchuk
Department of Earth and Environmental SciencesUniversity of Waterloo, 200 University Ave WestWaterloo, Ontario, N2L 3G1, CanadaEmail: [email protected]
SUMMARYPhase equilibria modelling has played a key role in enhancingour understanding of metamorphic processes. An importantbreakthrough in the last three decades has been the ability toconstruct phase diagrams by integrating internally consistentdatasets of the thermodynamic properties of minerals, fluidsand melts with activity–composition models for mixed phasesthat calculate end-member activities from end-member pro-portions. A major advance in applying phase equilibria model-ling to natural rocks is using isochemical phase diagrams toexplore the phase assemblages and reaction sequences applica-ble for a particular sample. The chemical systems used formodelling phase equilibria are continually evolving to providecloser approximations to the natural compositions of rocksand allow wider varieties of compositions to be modelled.Phase diagrams are now routinely applied to metasedimentaryrocks, metabasites and intermediate to felsic intrusive rocksand more recently to ultramafic rocks and meteorites.
While the principal application of these phase diagrams isquantifying the pressure and temperature evolution of meta-morphic rocks, workers are now applying them to other fieldsacross the geosciences. For example, phase equilibria model-ling of hydrothermal alteration and the metamorphism ofhydrothermally altered rocks can be used to determine ‘alter-ation vectors’ to hydrothermal mineral deposits. Combiningthe results of phase equilibria of rock-forming minerals withsolubility equations of accessory minerals has provided newinsights into the geological significance of U–Pb ages ofaccessory minerals commonly used in geochronology (e.g. zir-con and monazite). Rheological models based on the results ofphase equilibria modelling can be used to evaluate how thestrength of the crust and mantle can change through meta-morphic and metasomatic processes, which has implicationsfor a range orogenic processes, including the localization ofearthquakes. Finally, phase equilibria modelling of fluid gener-ation and consumption during metamorphism can be used toexplore links between metamorphism and global geochemicalcycles of carbon and sulphur, which may provide new insightsinto the secular change of the lithosphere, hydrosphere andatmosphere.
RÉSUMÉLa modélisation des équilibres de phases a joué un rôle clédans l’amélioration de notre compréhension des processusmétamorphiques. Une percée importante au cours des troisdernières décennies a été la capacité de construire des dia-grammes de phase en y intégrant des ensembles de donnéescohérentes des propriétés thermodynamiques des minéraux,des fluides et des bains magmatiques avec des modèles d'activ-ité-composition pour des phases mixtes qui déduisent l’activitédes membres extrêmes à partir des proportions des membresextrêmes. Une avancée majeure dans l'application de la modéli-sation d'équilibre de phase aux roches naturelles consiste àutiliser des diagrammes de phases isochimiques pour étudierles assemblages de phase et les séquences de réaction applica-bles pour un échantillon particulier. Les systèmes chimiquesutilisés pour la modélisation des équilibres de phase évoluentcontinuellement pour fournir des approximations plus prochesdes compositions naturelles des roches et permettent de mod-éliser de plus grandes variétés de compositions. Les dia-grammes de phase sont maintenant appliqués de façon rou-tinière aux roches métasédimentaires, aux métabasites et auxroches intrusives intermédiaires à felsiques et plus récemmentaux roches ultramafiques et aux météorites.
Volume 44 2017 27
Geoscience Canada, v. 44, https://doi.org/10.12789/geocanj.2017.44.114 pages 27–45 © 2017 GAC/AGC®
ARTICLE
Bien que l'application principale de ces diagrammes dephase consiste à quantifier l'évolution de la pression et de latempérature des roches métamorphiques, les utilisateurs lesappliquent maintenant à d'autres spécialités des géosciences.Par exemple, la modélisation des équilibres de phase de l'altéra-tion hydrothermale et du métamorphisme des roches d’altéra-tion hydrothermale peut être utilisée pour déterminer les« vecteurs d'altération » des gisements minéraux hydrother-maux. La combinaison des résultats des équilibres de phase desminéraux constitutifs des roches avec des équations de solubil-ité des minéraux accessoires a permis d’en savoir davantage surla signification géologique des âges U–Pb des minéraux acces-soires couramment utilisés en géochronologie (par exemplezircon et monazite). Les modèles rhéologiques basés sur lesrésultats de la modélisation des équilibres de phase peuventêtre utilisés pour évaluer comment la résistance de la croûte etdu manteau peut changer à travers des processus métamor-phiques et métasomatiques, ce qui a des implications sur unegamme de processus orogéniques, y compris la localisation desséismes. Enfin, la modélisation des équilibres de phase de lagénération et de l’absorption des fluides pendant le métamor-phisme peut être utilisée pour explorer les liens entre le méta-morphisme et les cycles géochimiques globaux du carbone etdu soufre, ce qui peut fournir de nouvelles perspectives sur lechangement séculaire de la lithosphère, de l'hydrosphère et del'atmosphère.
Traduit par le Traducteur
INTRODUCTIONPhase diagrams are graphical representations of the phasesthat coexist in a system as a function of different thermody-namic variables. In metamorphic geology, phase diagrams arecommonly used to evaluate the absolute pressures (P) and tem-peratures (T) experienced by metamorphic rocks from whichtheir geodynamic settings can be inferred (e.g. England andThompson 1984; Spear 1995; Brown 2007, 2014). These dia-grams are also combined with the results of accessory ormajor mineral geochronology to elucidate the P–T–time(t)paths experienced by metamorphic rocks (e.g. petrochronolo-gy; Mottram et al. 2014; Ambrose et al. 2015; Stevens et al.2015; Dragovic et al. 2016). However, metamorphic phase dia-grams have much broader applications across the geosciences.
Here, I review some recent applications of phase equilibriamodelling of metamorphic rocks and processes and discusssome of the broader implications of these studies. First, Ireview some basics of phase equilibria modelling and phasediagrams. Second, I present some of the recent applications ofphase equilibria modelling to different fields of the geo-sciences, including tectonics, earthquakes, linking deep mantlepetrology with the observations from geophysics, mineraldeposits and hydrothermal alteration, the behaviour of acces-sory minerals, metamorphism of meteorites, and linking fluidproduction in metamorphic rocks to global geochemicalcycles. Finally, I discuss some of the assumptions and limita-tions of applying the equilibrium approach to understandingmetamorphic processes. A review by Spear et al. (2016) pro-
vides an excellent summary of additional advances in meta-morphic geology over the last 50 years and discusses someoutstanding questions to be addressed in this evolving field ofresearch.
PHASE DIAGRAMS
Phase Equilibria ModellingPhase equilibria modelling can be used to predict the stablemetamorphic phase assemblage in a rock for a set of thermo-dynamic variables (usually variations in P and T). Note that Iprefer the term phase assemblage to mineral assemblage becausemost metamorphic assemblages develop with a fluid and/ormelt phase in equilibrium with the mineral assemblage and thisneeds to be considered in phase equilibria modelling. Con-structing phase diagrams that display equilibrium phase assem-blages requires an understanding of the phase rule and ofequilibrium thermodynamics (e.g. Powell 1978; Spear 1995)that is beyond the scope of this contribution. There are severalresources that provide good introductions to the fundamentalsof phase equilibria including short-course notes by R. Powell(1991) on the THERMOCALC website (http://www.meta-morph.geo.uni-mainz.de/thermocalc/) and the textbooks bySpear (1995) and Vernon and Clarke (2008). Here, I provide ageneral overview of the common types of phase diagrams,discuss some recent examples, and explore how the results ofphase equilibria modelling can be linked to various geologicalprocesses. Throughout, I assume that the modelled system hasachieved equilibrium, meaning that the proportions and com-positions of all phases in a system (e.g. rock) at a given set ofconditions (usually P and T) reflect the minimum free energyconfiguration. This is a main principle of phase equilibriamodelling. The limitations of applying this approach to naturalsystems are discussed later.
Phase diagrams are graphical representations of the equi-librium phase assemblages in a system as a function of inten-sive and/or extensive variables (e.g. Powell et al. 2005). Intensivevariables are independent of the amount of material in a sys-tem, and are identical in all parts of an equilibrated system.Examples of these are temperature, pressure and chemicalpotential that are equalized in metamorphic systems throughconduction, deformation and diffusion, respectively. Extensivevariables depend on the number of moles of the componentsin the system (e.g. volume, entropy, composition).
The majority of metamorphic phase diagrams use intensivevariables as axes (mostly P and T) because these are the mostuseful diagrams for linking metamorphic phase assemblages totectonic processes and to tectonic models of orogenesis. Suchtectonic models can predict the pressure–temperature (P–T)paths of different tectonic processes and against which con-straints from phase equilibria modelling and geochronologycan be evaluated (e.g. England and Thompson 1984; Thomp-son and England 1984; Jamieson et al. 1996, 1998, 2004, 2010).Phase diagrams with extensive variables as axes are less commonbut are particularly useful for investigating metamorphicprocesses, such as evaluating volume changes in metamorphic
28 Chris Yakymchuk
http://www.geosciencecanada.ca
systems (e.g. Powell et al. 2005; Guiraud and Powell 2006) andmodelling the redox budget of metamorphic rocks (e.g. Evanset al. 2013).
Petrogenetic GridsMetamorphic phase diagrams have evolved in complexity sincetheir conception in the early half of the 20th century. Bowen(1940) was one of the first researchers to project a series of uni-variant equilibrium curves onto a P–T plane to evaluate themetamorphic reactions that can occur over a range of pres-sures and temperatures. The projection of all of these univari-ant curves onto a common surface results in a network of lines(and points) that define a petrogenetic grid for the modelledchemical system. The topology of these diagrams can be con-strained using the method of Schreinemakers (e.g. Zen 1966).
Bowen (1940) modelled the metamorphic reactions ofsiliceous limestone and dolostone in the relatively simpleCaO–MgO–SiO2–CO2 chemical system. Over the latter part ofthe 20th century, phase diagrams in larger chemical systemswere developed and applied to a wider variety of rock types.Petrogenetic grids were constructed and refined using a com-bination of experimental studies of metamorphic reactions(e.g. Carrington and Harley 1995) and natural equilibratedphase assemblages (e.g. Pattison and Harte 1985). Grids appli-cable to metapelitic rocks were constructed in the K2O–FeO–MgO–Al2O3–SiO2–H2O (KFMASH) system (e.g. Albee 1965).Following on from this work the chemical systems of petroge-netic grids continued to expand to become closer approxima-tions of the true chemical composition of metamorphic rocks.The KFMASH system was expanded to include Na2O(Thompson and Algor 1977) and later CaO (Thompson andTracy 1979), which were critical for modelling the anatexis ofpelitic rocks.
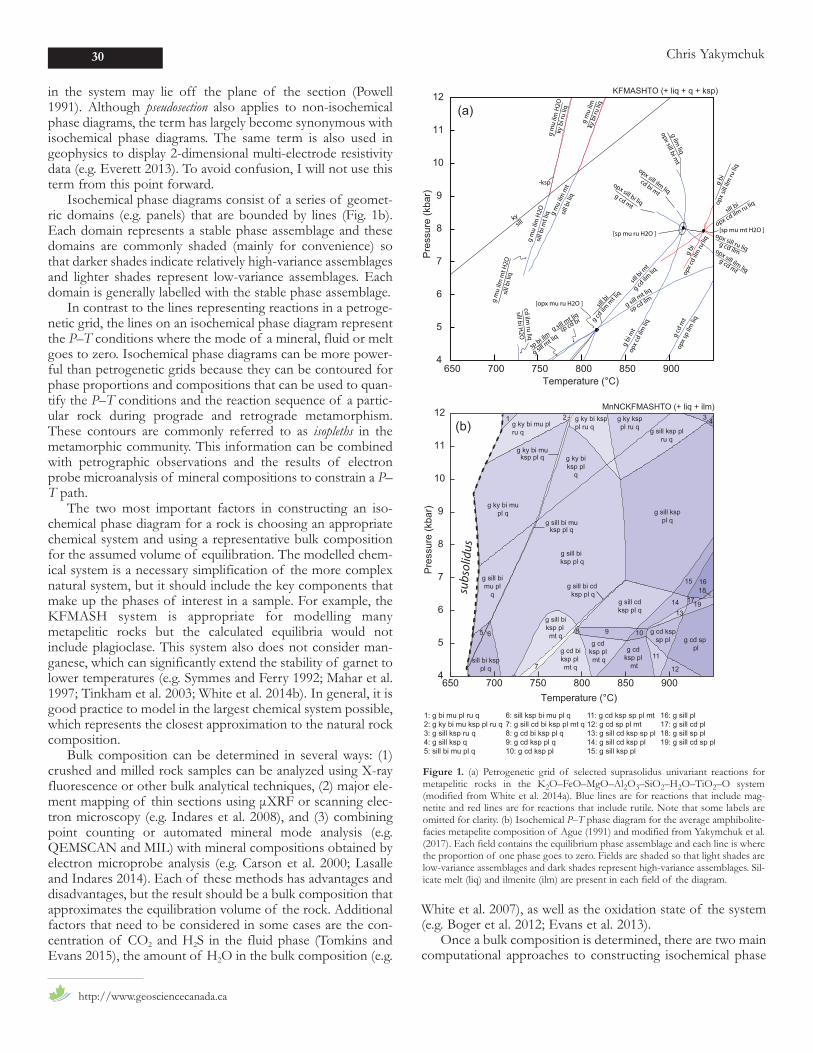
Other important components were later included in petro-genetic grids, such as manganese, which is of particular impor-tance for garnet-bearing univariant equilibria (e.g. Spear andCheney 1989; Symmes and Ferry 1992; Tinkham and Ghent2005; White et al. 2005), and ferric iron and titanium, whichallowed Fe-Ti oxides to be considered (e.g. White et al. 2007;White et al. 2014a). A wide variety of petrogenetic grids is nowavailable to investigate rocks from low to high grade (e.g.White et al. 2014a; Kelsey and Hand 2015) and for a range ofcompositions (e.g. Will et al. 1990; Frey et al. 1991; Riesco etal. 2004; White et al. 2007; Groppo et al. 2013). A recent exam-ple of a petrogenetic grid constructed in the KFMASHTOsystem applicable for suprasolidus rocks is shown in Figure 1a.Univariant reactions are displayed as lines that connect atinvariant points. All phase abbreviations in this figure and theremainder of this contribution are summarized in Table 1.
While petrogenetic grids provide an essential framework inwhich to understand the reactions that take place in metamor-phic systems, there are two main limitations when applyingthem to natural rocks. The first is that petrogenetic grids are aprojection of all possible univariant reactions in a specifiedchemical system onto a P–T plane. A specific rock will only‘see’ a subset of the total number of univariant reactions; thespecific reactions that are encountered depend on the particu-
lar bulk composition of the rock. While this can be accountedfor by using complementary chemographic diagrams in simplechemical systems (e.g. KFMASH; Thompson 1957), thisapproach does not easily lend itself to the larger chemical sys-tems (e.g. MnNCKFMASHTO) where higher-dimensionalchemographic diagrams would be required. The second limita-tion is that phase assemblages in metamorphic rocks generallychange through continuous or multivariant reactions ratherthan univariant (discontinuous) reactions (e.g. Stüwe and Pow-ell 1995). These multivariant reactions are not displayed onpetrogenetic grids. Furthermore, univariant reaction curves onpetrogenetic grids may yield the false impression that phaseassemblages change over narrow intervals in P–T space. Inreality, phase proportions (also known as modes) and composi-tions continuously change along a P–T evolution due to theoperation of multivariant reactions.
Isochemical Phase DiagramsOne of the most significant advances in metamorphic geologyin the last 30 years has been the development of isochemicalphase diagrams that are applicable to fixed bulk rock compo-sitions (e.g. individual rock samples). The concept goes back toHensen (1971) who constructed schematic P–T phase dia-grams for particular bulk rock compositions in the MgO–FeO–Al2O3–SiO2 chemical system. R. Powell and colleaguespopularized this approach by developing the THERMOCALCsoftware package that solves a set of independent non-linearequations to determine the stable phase assemblages (whichmay include minerals, fluids and/or melts) as well as their com-positions and modes across a P–T diagram for a fixed bulkcomposition (Powell et al. 1998). THERMOCALC calculates indi-vidual phase boundaries (and invariant points), which are thencombined manually into complete phase diagrams. As compu-tational power increased, automated software packages weredeveloped to generate similar diagrams, but using Gibbs freeenergy minimization as the numerical method to determine theequilibrium phase assemblage (e.g. Connolly and Petrini 2002;de Capitani and Petrakakis 2010).
Phase diagrams constructed for a fixed bulk compositionare called isochemical phase diagrams and have also beencalled pseudosections in the metamorphic literature. Pseudosec-tions are not true sections because the compositions of phases
GEOSCIENCE CANADA Volume 44 2017 29
https://doi.org/10.12789/geocanj.2017.44.114
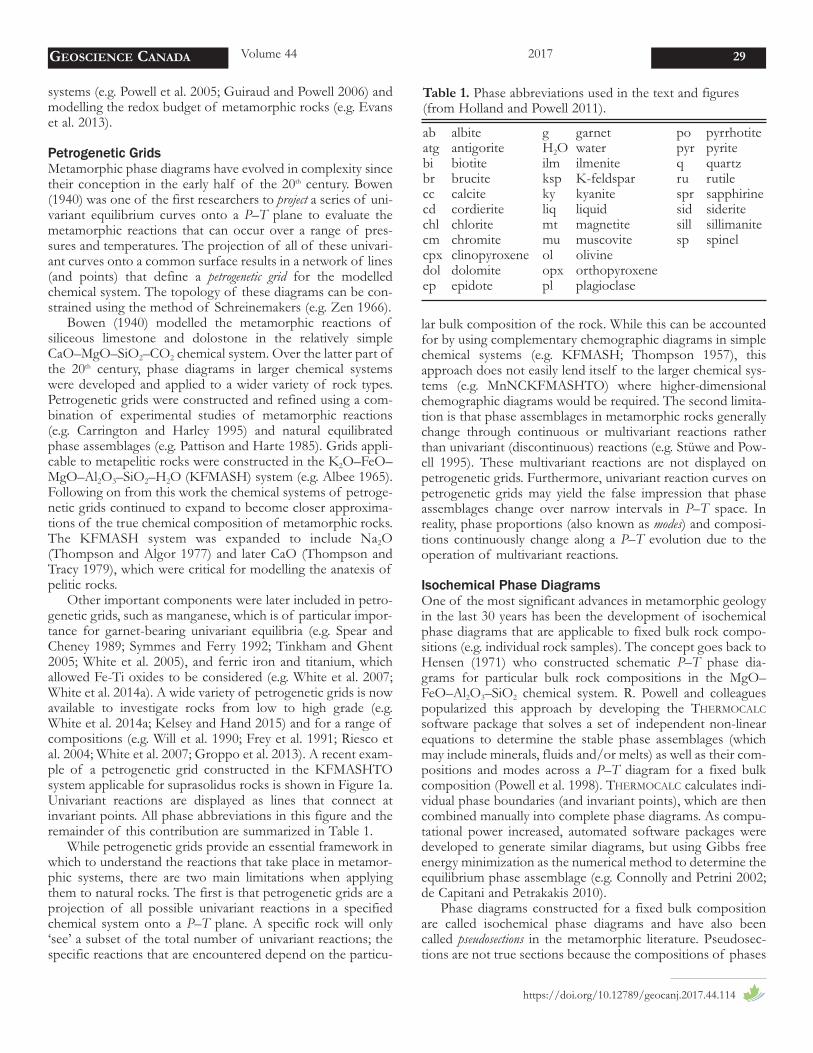
ab albite g garnet po pyrrhotiteatg antigorite H2O water pyr pyritebi biotite ilm ilmenite q quartzbr brucite ksp K-feldspar ru rutilecc calcite ky kyanite spr sapphirinecd cordierite liq liquid sid sideritechl chlorite mt magnetite sill sillimanitecm chromite mu muscovite sp spinelcpx clinopyroxene ol olivinedol dolomite opx orthopyroxeneep epidote pl plagioclase
Table 1. Phase abbreviations used in the text and figures(from Holland and Powell 2011).
in the system may lie off the plane of the section (Powell1991). Although pseudosection also applies to non-isochemicalphase diagrams, the term has largely become synonymous withisochemical phase diagrams. The same term is also used ingeophysics to display 2-dimensional multi-electrode resistivitydata (e.g. Everett 2013). To avoid confusion, I will not use thisterm from this point forward.
Isochemical phase diagrams consist of a series of geomet-ric domains (e.g. panels) that are bounded by lines (Fig. 1b).Each domain represents a stable phase assemblage and thesedomains are commonly shaded (mainly for convenience) sothat darker shades indicate relatively high-variance assemblagesand lighter shades represent low-variance assemblages. Eachdomain is generally labelled with the stable phase assemblage.
In contrast to the lines representing reactions in a petroge-netic grid, the lines on an isochemical phase diagram representthe P–T conditions where the mode of a mineral, fluid or meltgoes to zero. Isochemical phase diagrams can be more power-ful than petrogenetic grids because they can be contoured forphase proportions and compositions that can be used to quan-tify the P–T conditions and the reaction sequence of a partic-ular rock during prograde and retrograde metamorphism.These contours are commonly referred to as isopleths in themetamorphic community. This information can be combinedwith petrographic observations and the results of electronprobe microanalysis of mineral compositions to constrain a P–T path.
The two most important factors in constructing an iso-chemical phase diagram for a rock is choosing an appropriatechemical system and using a representative bulk compositionfor the assumed volume of equilibration. The modelled chem-ical system is a necessary simplification of the more complexnatural system, but it should include the key components thatmake up the phases of interest in a sample. For example, theKFMASH system is appropriate for modelling manymetapelitic rocks but the calculated equilibria would notinclude plagioclase. This system also does not consider man-ganese, which can significantly extend the stability of garnet tolower temperatures (e.g. Symmes and Ferry 1992; Mahar et al.1997; Tinkham et al. 2003; White et al. 2014b). In general, it isgood practice to model in the largest chemical system possible,which represents the closest approximation to the natural rockcomposition.
Bulk composition can be determined in several ways: (1)crushed and milled rock samples can be analyzed using X-rayfluorescence or other bulk analytical techniques, (2) major ele-ment mapping of thin sections using μXRF or scanning elec-tron microscopy (e.g. Indares et al. 2008), and (3) combiningpoint counting or automated mineral mode analysis (e.g.QEMSCAN and MIL) with mineral compositions obtained byelectron microprobe analysis (e.g. Carson et al. 2000; Lasalleand Indares 2014). Each of these methods has advantages anddisadvantages, but the result should be a bulk composition thatapproximates the equilibration volume of the rock. Additionalfactors that need to be considered in some cases are the con-centration of CO2 and H2S in the fluid phase (Tomkins andEvans 2015), the amount of H2O in the bulk composition (e.g.
White et al. 2007), as well as the oxidation state of the system(e.g. Boger et al. 2012; Evans et al. 2013).
Once a bulk composition is determined, there are two maincomputational approaches to constructing isochemical phase
30 Chris Yakymchuk
http://www.geosciencecanada.ca
650 700 750 800 850 9004
5
6
7
8
9
10
11
12g ky bi mu pl ru q
g ky bi ksppl ru q
g ky ksppl ru q g sill ksp pl
ru q
g sill ksppl q
g ky bi mupl q
g ky biksp pl
q
g sill bi muksp pl q
g sill bimu pl
q
g ky bi muksp pl q
g sill cdksp pl q
g sill biksp pl mt q
MnNCKFMASHTO (+ liq + ilm)
sill bi ksppl q
g sill bi ksp pl q
g cd biksp pl mt q
g cd ksp pl mt q
g cd ksp pl
mt
g cd sp pl
g cd kspsp pl
1 2 3 4
5 6
7
8 9 10
11
12
1314
15 16
1718
19
1: g bi mu pl ru q2: g ky bi mu ksp pl ru q3: g sill ksp ru q4: g sill ksp q5: sill bi mu pl q
16: g sill pl 17: g sill cd pl 18: g sill sp pl 19: g sill cd sp pl
6: sill ksp bi mu pl q7: g sill cd bi ksp pl mt q8: g cd bi ksp pl q9: g cd ksp pl q10: g cd ksp pl
Temperature (°C)
Pre
ssur
e (k
bar)
g sill bi cd ksp pl q
KFMASHTO (+ liq + q + ksp)
650 700 750 800 850 900Temperature (°C)
4
5
6
7
8
9
10
11
12
Pre
ssur
e (k
bar)
11: g cd ksp sp pl mt12: g cd sp pl mt 13: g sill cd ksp sp pl 14: g sill cd ksp pl 15: g sill ksp pl
-ksp
sill b
i mt
g cd ilm
liq
g sill mt liq
sp cd ilm
sp bi ilm
g sill mt liq
g sill mt liq
sp cd bi
g bi
mt
opx c
d ilm
liq
opx sill ilm liqg cd mt
opx sill bi liqg cd mt
opx sill ru liqg cd ilm
sill bi
opx cd ilm ru liq
g bi
opx
sill il
m ru
liq
g bi
opx c
d ilm
ru liq
g cd
mt
opx s
p ilm
liq
g m
u ilm
mt
sill b
i liq
g m
u ilm
mt H
2Osi
ll bi
liq
g m
u ilm
H2O
sill b
i mt l
iq
cd ilm ru liq
sill bi H2O
g m
u ilm
ky b
i ru
liq
opx sill ilm liqcd bi mt
[sp mu ru H2O ] [sp mu mt H2O ]
[opx mu ru H2O ]
g m
u ilm
H2O
ky b
i ru
liq
sill b
i
g cd ilm
mt li
q
kysill
opx sill bi mt
g ilm liq
(b)
(a)
subsolidus
Figure 1. (a) Petrogenetic grid of selected suprasolidus univariant reactions formetapelitic rocks in the K2O–FeO–MgO–Al2O3–SiO2–H2O–TiO2–O system(modified from White et al. 2014a). Blue lines are for reactions that include mag-netite and red lines are for reactions that include rutile. Note that some labels areomitted for clarity. (b) Isochemical P–T phase diagram for the average amphibolite-facies metapelite composition of Ague (1991) and modified from Yakymchuk et al.(2017). Each field contains the equilibrium phase assemblage and each line is wherethe proportion of one phase goes to zero. Fields are shaded so that light shades arelow-variance assemblages and dark shades represent high-variance assemblages. Sil-icate melt (liq) and ilmenite (ilm) are present in each field of the diagram.
diagrams. Both approaches require an internally consistentthermodynamic database (e.g. Helgeson et al. 1978; Berman1988; Holland and Powell 1998, 2011) and activity–composi-tion models that relate end-member proportions to end-mem-ber activities for the solid-solution minerals as well as for com-plex fluid and melt phases (e.g. Evans et al. 2010; White et al.2014a; Green et al. 2016).
The first computational approach is to use Gibbs free ener-gy minimization to determine the stable phase assemblages ata given P–T condition. Two common software packages avail-able for this approach are Perple_X (Connolly and Petrini2002; http://www.perplex.ethz.ch) and THERIAK–DOMI-NO (de Capitani and Brown 1987; de Capitani and Petrakakis2010; http://titan.minpet.unibas.ch/minpet/theriak/theruser.html). They are user-friendly and can automatically calculatemost phase diagrams relatively quickly (generally minutes tohours). The output is a complete phase diagram and associatedfiles with other calculation information. An additional benefitof Gibbs free energy minimization programs is the ability toeasily explore thermodynamic data and activity–compositionmodels of end-member activities.
A second approach is to determine the solution of simul-taneous non-linear equations to build up an array of pointsand lines that make up a metamorphic phase diagram (THER-MOCALC: Powell and Holland 1988, 2008; Powell et al. 1998).This is a more time-consuming approach, but workers acquirea deeper understanding of how phase diagrams are developed.
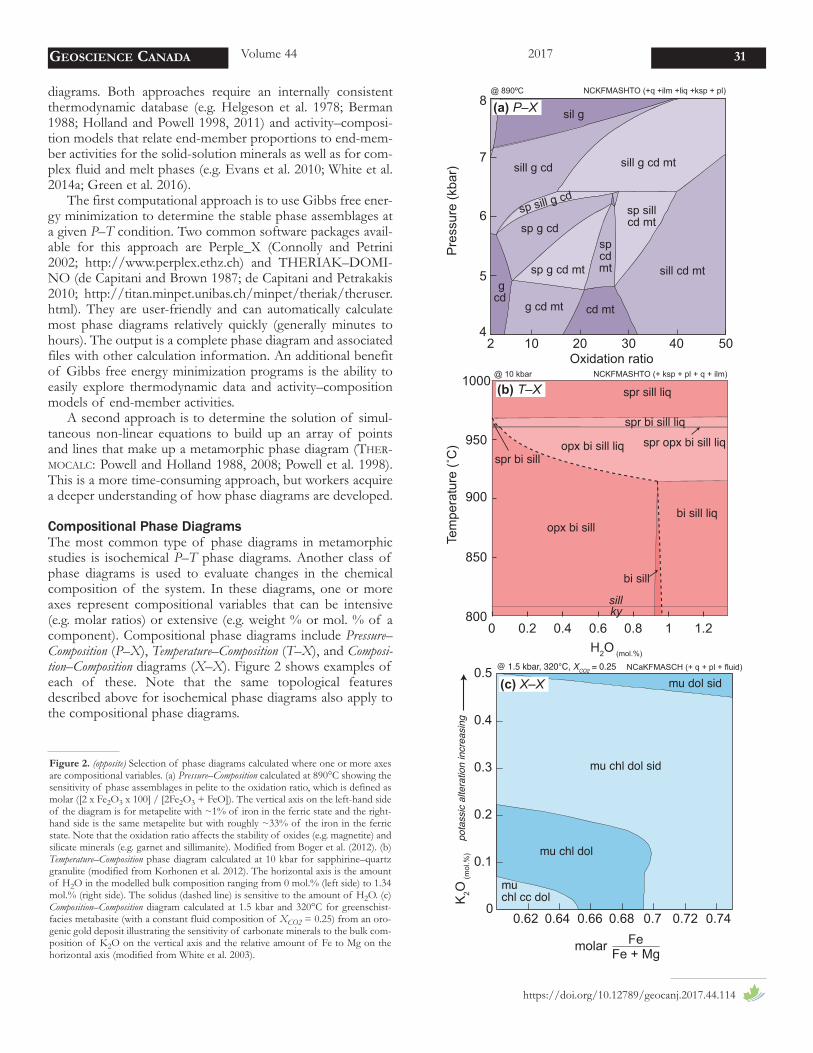
Compositional Phase DiagramsThe most common type of phase diagrams in metamorphicstudies is isochemical P–T phase diagrams. Another class ofphase diagrams is used to evaluate changes in the chemicalcomposition of the system. In these diagrams, one or moreaxes represent compositional variables that can be intensive(e.g. molar ratios) or extensive (e.g. weight % or mol. % of acomponent). Compositional phase diagrams include Pressure–Composition (P–X), Temperature–Composition (T–X), and Composi-tion–Composition diagrams (X–X). Figure 2 shows examples ofeach of these. Note that the same topological featuresdescribed above for isochemical phase diagrams also apply tothe compositional phase diagrams.
GEOSCIENCE CANADA Volume 44 2017 31
https://doi.org/10.12789/geocanj.2017.44.114
1000
950
900
850
8000 0.2 0.4 0.6 0.8 1
NCKFMASHTO (+q +ilm +liq +ksp + pl)
NCaKFMASCH (+ q + pl + fluid)
Tem
pera
ture
(˚C
)
1.2
0.62 0.64 0.66 0.68 0.7 0.72 0.740
0.1
0.2
0.3
0.4
0.5
mu chl dol sid
mu dol sid
mu chl dol
muchl cc dol
@ 1.5 kbar, 320°C, XCO2 = 0.25
@ 10 kbar NCKFMASHTO (+ ksp + pl + q + ilm)
sillky
Oxidation ratio2 10 20 30 40 50
Pre
ssur
e (k
bar)
4
5
6
7
8
H2O (mol.%)
K2O
(mol
.%)
Fe Fe + Mgmolar
pota
ssic
alte
ratio
n in
crea
sing
sil g
sill g cd sill g cd mt
sp sillcd mt
sill cd mt
sp g cd
sp g cd mt
spcdmt
cd mtg cd mt
gcd
sp sill g cd
(a) P–X
(c) X–X
(b) T–X spr sill liq
spr bi sill liq
opx bi sill liq
opx bi sillbi sill liq
spr opx bi sill liqspr bi sill
bi sill
@ 890ºC
Figure 2. (opposite) Selection of phase diagrams calculated where one or more axesare compositional variables. (a) Pressure–Composition calculated at 890°C showing thesensitivity of phase assemblages in pelite to the oxidation ratio, which is defined asmolar ([2 x Fe2O3 x 100] / [2Fe2O3 + FeO]). The vertical axis on the left-hand sideof the diagram is for metapelite with ~1% of iron in the ferric state and the right-hand side is the same metapelite but with roughly ~33% of the iron in the ferricstate. Note that the oxidation ratio affects the stability of oxides (e.g. magnetite) andsilicate minerals (e.g. garnet and sillimanite). Modified from Boger et al. (2012). (b)Temperature–Composition phase diagram calculated at 10 kbar for sapphirine–quartzgranulite (modified from Korhonen et al. 2012). The horizontal axis is the amountof H2O in the modelled bulk composition ranging from 0 mol.% (left side) to 1.34mol.% (right side). The solidus (dashed line) is sensitive to the amount of H2O. (c)Composition–Composition diagram calculated at 1.5 kbar and 320°C for greenschist-facies metabasite (with a constant fluid composition of XCO2 = 0.25) from an oro-genic gold deposit illustrating the sensitivity of carbonate minerals to the bulk com-position of K2O on the vertical axis and the relative amount of Fe to Mg on thehorizontal axis (modified from White et al. 2003).
The P–X diagram in Figure 2a is from Boger et al. (2012)and has P on the vertical axis (similar to most P–T phase dia-grams) and the horizontal axis relates to the ratio of ferric toferrous iron in the bulk composition, which is a proxy for theoxidation state of the system. Here the diagram illustrates thatthe stability of oxide (e.g. magnetite) and silicate minerals (e.g.garnet and sillimanite) is sensitive to changes in the oxidationstate of the system. For example, garnet is stable and mag-netite is unstable over the modelled pressure range for relative-ly reducing systems (left side of diagram), whereas on the rightside of the diagram the opposite is true.
A T–X diagram from Korhonen et al. (2012) in Figure 2billustrates the sensitivity of the solidus temperature in ametasedimentary rock to changes in bulk rock water content.The solidus is at higher temperatures for drier bulk composi-tions (left side of the diagram). A prediction of this phase dia-gram is that melting can initiate due to an increase in the pro-portion of water in the system at a constant temperature. Forexample, the addition of ~1 mol.% (~0.4 wt.%) of H2O to acompletely dry rock at 900°C will cause it to melt at < 800°C.
While not common, X–X diagrams are particularly usefulin studies of hydrothermal alteration and metasomatism (e.g.White et al. 2003; Riesco et al. 2005). An example from Whiteet al. (2003) is shown in Figure 2c. This diagram was calculatedat 1.5 kbar at 320°C with a constant fluid composition of XCO2= 0.25 (molar CO2 / [H2O + CO2]). Here the vertical axis rep-resents the molar proportion of K2O in the bulk composition.Higher values approximate the degree of potassic alteration.The horizontal axis extends along a range of mafic protolithcompositions with variable XFe (molar Fe/[Fe+Mg]). Note thatin some cases an equivalent amount of potassic alteration willproduce the same alteration minerals (e.g. mu+chl+dol+sid atK2O = 0.3) across the range of protolith compositions. Inother scenarios, potassic alteration will produce different alter-ation minerals for protoliths with variable XFe values. Forexample, at a K2O value of 0.2, siderite is stable in the high XFecompositions but is absent in compositions with XFe < 0.64.
Volumetric Phase DiagramsOne of the assumptions when constructing isochemical P–Tphase diagrams is that changes in pressure are accommodatedby changes in volume (e.g. via deformation of the rock). Like-wise, we generally assume that heat flow accommodateschanges in T. The effects of volume change are particularlyimportant in studies of migmatites (e.g. Powell et al. 2005) andultra-high pressure mineral assemblages (e.g. Guiraud andPowell 2006), as well as in studies of the serpentinization ofultramafic rocks (Kelemen and Hirth 2012).
For a P–T isochemical phase diagram to be an effectivemodel of a natural system, we assume that the rock deformsrelatively quickly to maintain a constant pressure. Melt is a rel-atively high-volume phase relative to most silicate minerals andthe production of melt can potentially induce large volumechanges in a rock. For some rock types, such as metabasite andsome greywackes, melt is predicted to be produced more orless continuously along a prograde P–T path (e.g. Johnson etal. 2008; Yakymchuk and Brown 2014a; Palin et al. 2016b).
However, rocks such as metapelite also contain narrow low-variance fields. In these fields, melt is generated over relativelysmall temperature intervals, which potentially represents amore pulsed nature of melt generation. In these cases, a rela-tively small increase in temperature is predicted to generate alarge quantity of melt resulting in a correspondingly large vol-ume increase.
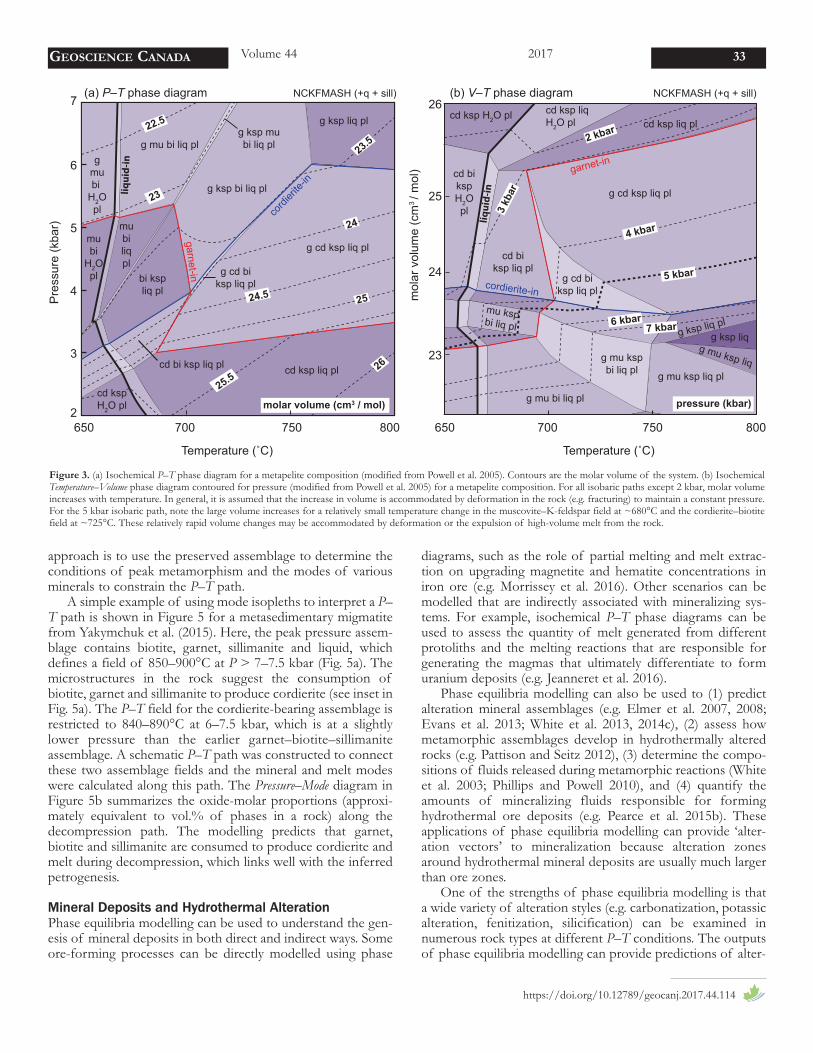
Some of these aspects were explored by Powell et al. (2005)for a model aluminous metapelite composition. An isochemi-cal P–T phase diagram for this composition is shown in Figure3a and it is contoured for molar volume. A complementaryVolume–Temperature diagram from Powell et al. (2005) is shownin Figure 3b. Note that the volume is presented as molar vol-ume. The diagram is contoured for isobars (lines of constantpressure) to illustrate the changes in volume that occur at dif-ferent pressures during isobaric heating. Consider an isobaricheating path at 5 kbar. There are two nearly vertical segments(one at ~680°C and one at ~725°C) that relate to the relativelylow-variance fields that represent muscovite and biotite break-down. As the isobaric path crosses these fields there is a largevolume change due to melt generation. If this relatively rapidvolume increase cannot be accommodated by local deforma-tion in the rock’s environment, then the rock will respond tothe increase in melt volume and concomitant pressure increaseby fracturing or otherwise deforming to allow the melt toescape, thereby re-establishing the ambient lithostatic pressure.If melt is lost, the composition of the residue will change andthe isochemical phase diagrams calculated for the protolithcomposition (Fig. 3a, b) are no longer valid. Some techniquesfor accounting for melt loss are discussed later.
SOME RECENT APPLICATIONS OF PHASE EQUILIBRIAMODELLING
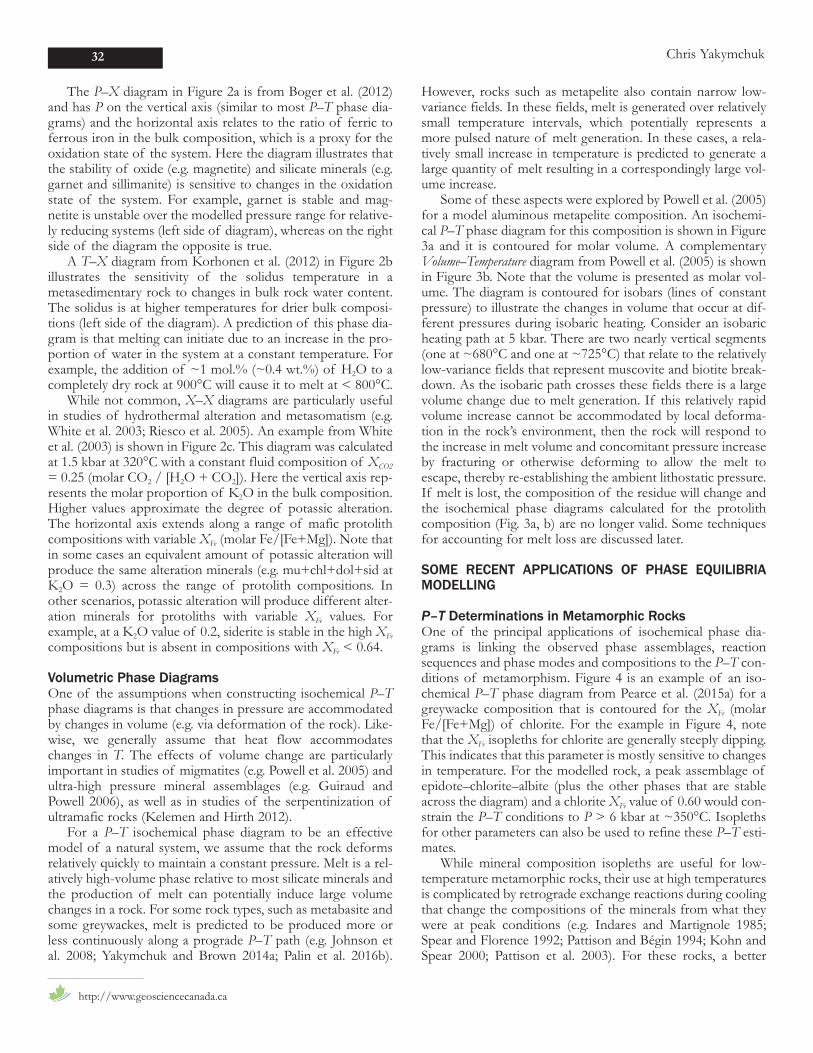
P–T Determinations in Metamorphic RocksOne of the principal applications of isochemical phase dia-grams is linking the observed phase assemblages, reactionsequences and phase modes and compositions to the P–T con-ditions of metamorphism. Figure 4 is an example of an iso-chemical P–T phase diagram from Pearce et al. (2015a) for agreywacke composition that is contoured for the XFe (molarFe/[Fe+Mg]) of chlorite. For the example in Figure 4, notethat the XFe isopleths for chlorite are generally steeply dipping.This indicates that this parameter is mostly sensitive to changesin temperature. For the modelled rock, a peak assemblage ofepidote–chlorite–albite (plus the other phases that are stableacross the diagram) and a chlorite XFe value of 0.60 would con-strain the P–T conditions to P > 6 kbar at ~350°C. Isoplethsfor other parameters can also be used to refine these P–T esti-mates.
While mineral composition isopleths are useful for low-temperature metamorphic rocks, their use at high temperaturesis complicated by retrograde exchange reactions during coolingthat change the compositions of the minerals from what theywere at peak conditions (e.g. Indares and Martignole 1985;Spear and Florence 1992; Pattison and Bégin 1994; Kohn andSpear 2000; Pattison et al. 2003). For these rocks, a better
32 Chris Yakymchuk
http://www.geosciencecanada.ca
approach is to use the preserved assemblage to determine theconditions of peak metamorphism and the modes of variousminerals to constrain the P–T path.
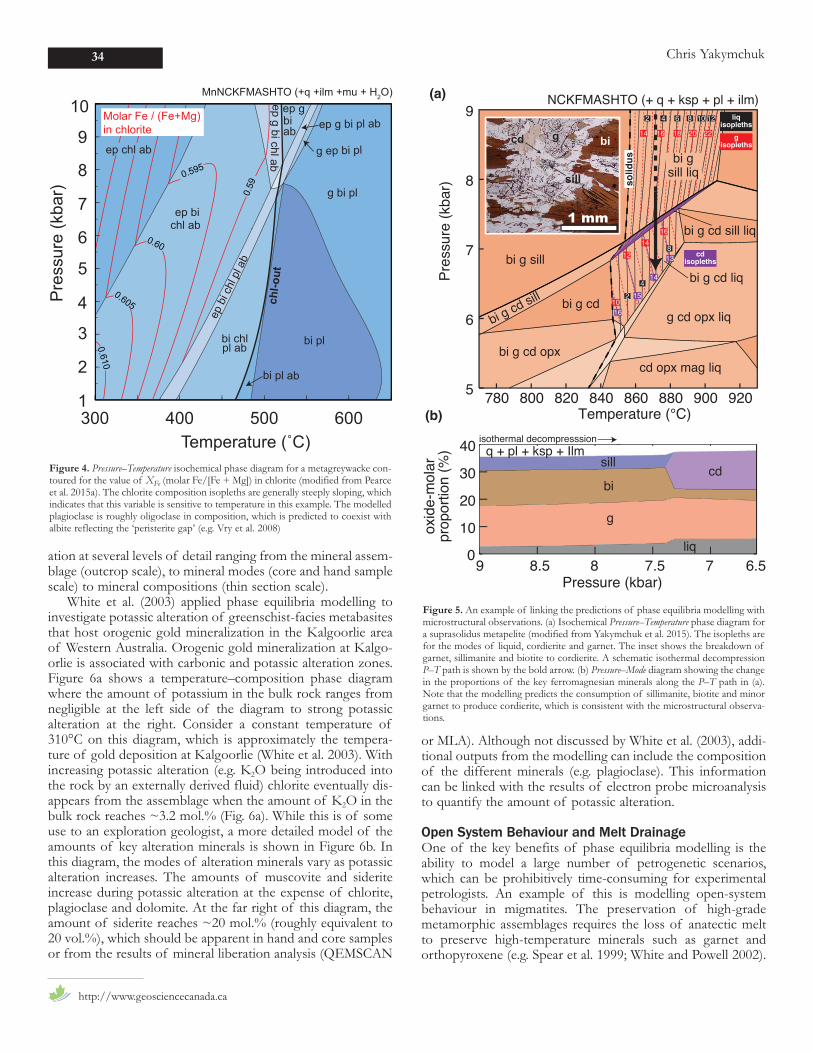
A simple example of using mode isopleths to interpret a P–T path is shown in Figure 5 for a metasedimentary migmatitefrom Yakymchuk et al. (2015). Here, the peak pressure assem-blage contains biotite, garnet, sillimanite and liquid, whichdefines a field of 850–900°C at P > 7–7.5 kbar (Fig. 5a). Themicrostructures in the rock suggest the consumption ofbiotite, garnet and sillimanite to produce cordierite (see inset inFig. 5a). The P–T field for the cordierite-bearing assemblage isrestricted to 840–890°C at 6–7.5 kbar, which is at a slightlylower pressure than the earlier garnet–biotite–sillimaniteassemblage. A schematic P–T path was constructed to connectthese two assemblage fields and the mineral and melt modeswere calculated along this path. The Pressure–Mode diagram inFigure 5b summarizes the oxide-molar proportions (approxi-mately equivalent to vol.% of phases in a rock) along thedecompression path. The modelling predicts that garnet,biotite and sillimanite are consumed to produce cordierite andmelt during decompression, which links well with the inferredpetrogenesis.
Mineral Deposits and Hydrothermal AlterationPhase equilibria modelling can be used to understand the gen-esis of mineral deposits in both direct and indirect ways. Someore-forming processes can be directly modelled using phase
diagrams, such as the role of partial melting and melt extrac-tion on upgrading magnetite and hematite concentrations iniron ore (e.g. Morrissey et al. 2016). Other scenarios can bemodelled that are indirectly associated with mineralizing sys-tems. For example, isochemical P–T phase diagrams can beused to assess the quantity of melt generated from differentprotoliths and the melting reactions that are responsible forgenerating the magmas that ultimately differentiate to formuranium deposits (e.g. Jeanneret et al. 2016).
Phase equilibria modelling can also be used to (1) predictalteration mineral assemblages (e.g. Elmer et al. 2007, 2008;Evans et al. 2013; White et al. 2013, 2014c), (2) assess howmetamorphic assemblages develop in hydrothermally alteredrocks (e.g. Pattison and Seitz 2012), (3) determine the compo-sitions of fluids released during metamorphic reactions (Whiteet al. 2003; Phillips and Powell 2010), and (4) quantify theamounts of mineralizing fluids responsible for forminghydrothermal ore deposits (e.g. Pearce et al. 2015b). Theseapplications of phase equilibria modelling can provide ‘alter-ation vectors’ to mineralization because alteration zonesaround hydrothermal mineral deposits are usually much largerthan ore zones.
One of the strengths of phase equilibria modelling is thata wide variety of alteration styles (e.g. carbonatization, potassicalteration, fenitization, silicification) can be examined innumerous rock types at different P–T conditions. The outputsof phase equilibria modelling can provide predictions of alter-
GEOSCIENCE CANADA Volume 44 2017 33
https://doi.org/10.12789/geocanj.2017.44.114
garnet-in
liquid-in
(a) P–T phase diagram (b) V–T phase diagram
2 kbar
3 kb
ar
5 kbar
4 kbar
6 kbar7 kbar
g cd ksp liq pl
g mu ksp liq pl
g mu ksp liq
g ksp liq
cd ksp H2O pl
NCKFMASH (+q + sill)
cd bikspH2Opl
cd ksp liqH2O pl
g cd biksp liq pl
cd biksp liq pl
g mu kspbi liq pl
g mu bi liq pl
g ksp liq plmu kspbi liq pl
cd ksp liq pl
NCKFMASH (+q + sill)
650 700 750 800
23
24
25
26
mol
ar v
olum
e (c
m3 / m
ol)
Temperature (˚C)Temperature (˚C)
garnet-in
cordi
erite-
in
24
25
26
23
g cd ksp liq pl
g ksp bi liq pl
cd ksp liq pl
bi kspliq pl
mubiliqpl
g mu bi liq plg
mubi
H2Opl
mubi
H2Opl
22.5
23.5
24.5
25.5
molar volume (cm3 / mol)
Pre
ssur
e (k
bar)
7
6
5
4
3
2700 750 800650
cd kspH2O pl
cordierite-in
liquid-in
g ksp liq pl
cd bi ksp liq pl
g ksp mubi liq pl
g cd biksp liq pl
pressure (kbar)
Figure 3. (a) Isochemical P–T phase diagram for a metapelite composition (modified from Powell et al. 2005). Contours are the molar volume of the system. (b) IsochemicalTemperature–Volume phase diagram contoured for pressure (modified from Powell et al. 2005) for a metapelite composition. For all isobaric paths except 2 kbar, molar volumeincreases with temperature. In general, it is assumed that the increase in volume is accommodated by deformation in the rock (e.g. fracturing) to maintain a constant pressure.For the 5 kbar isobaric path, note the large volume increases for a relatively small temperature change in the muscovite–K-feldspar field at ~680°C and the cordierite–biotitefield at ~725°C. These relatively rapid volume changes may be accommodated by deformation or the expulsion of high-volume melt from the rock.
ation at several levels of detail ranging from the mineral assem-blage (outcrop scale), to mineral modes (core and hand samplescale) to mineral compositions (thin section scale).
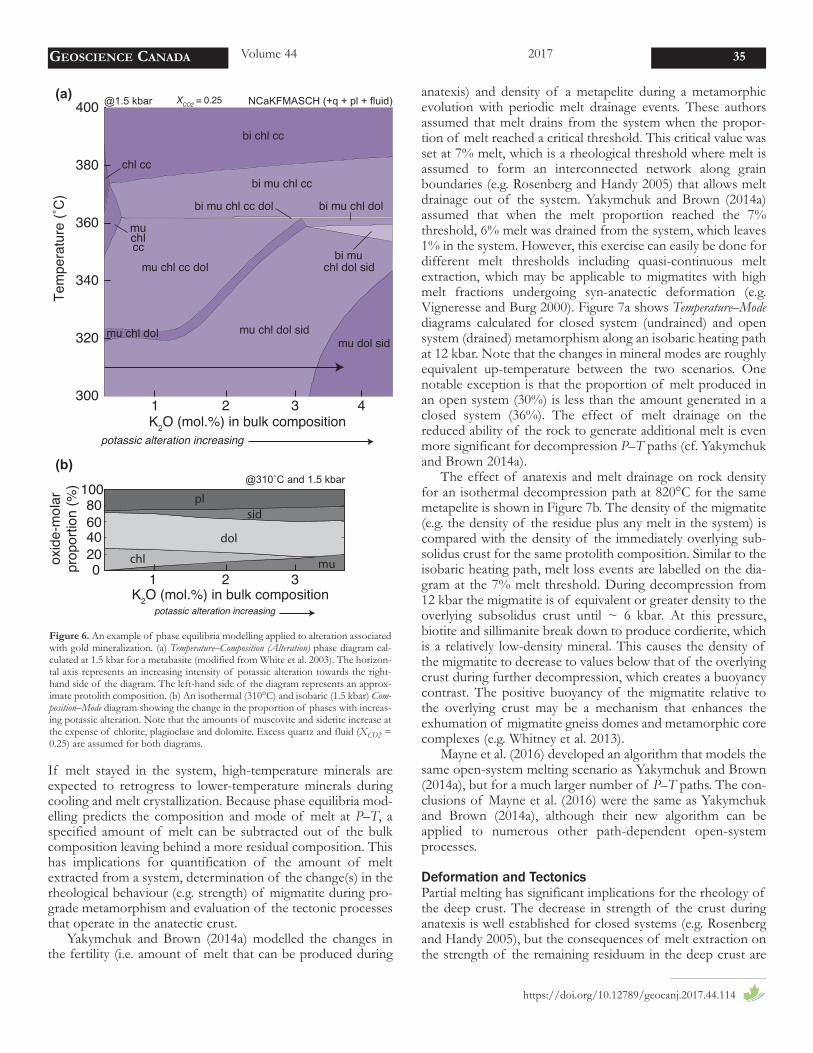
White et al. (2003) applied phase equilibria modelling toinvestigate potassic alteration of greenschist-facies metabasitesthat host orogenic gold mineralization in the Kalgoorlie areaof Western Australia. Orogenic gold mineralization at Kalgo-orlie is associated with carbonic and potassic alteration zones.Figure 6a shows a temperature–composition phase diagramwhere the amount of potassium in the bulk rock ranges fromnegligible at the left side of the diagram to strong potassicalteration at the right. Consider a constant temperature of310°C on this diagram, which is approximately the tempera-ture of gold deposition at Kalgoorlie (White et al. 2003). Withincreasing potassic alteration (e.g. K2O being introduced intothe rock by an externally derived fluid) chlorite eventually dis-appears from the assemblage when the amount of K2O in thebulk rock reaches ~3.2 mol.% (Fig. 6a). While this is of someuse to an exploration geologist, a more detailed model of theamounts of key alteration minerals is shown in Figure 6b. Inthis diagram, the modes of alteration minerals vary as potassicalteration increases. The amounts of muscovite and sideriteincrease during potassic alteration at the expense of chlorite,plagioclase and dolomite. At the far right of this diagram, theamount of siderite reaches ~20 mol.% (roughly equivalent to20 vol.%), which should be apparent in hand and core samplesor from the results of mineral liberation analysis (QEMSCAN
or MLA). Although not discussed by White et al. (2003), addi-tional outputs from the modelling can include the compositionof the different minerals (e.g. plagioclase). This informationcan be linked with the results of electron probe microanalysisto quantify the amount of potassic alteration.
Open System Behaviour and Melt DrainageOne of the key benefits of phase equilibria modelling is theability to model a large number of petrogenetic scenarios,which can be prohibitively time-consuming for experimentalpetrologists. An example of this is modelling open-systembehaviour in migmatites. The preservation of high-grademetamorphic assemblages requires the loss of anatectic meltto preserve high-temperature minerals such as garnet andorthopyroxene (e.g. Spear et al. 1999; White and Powell 2002).
34 Chris Yakymchuk
http://www.geosciencecanada.ca
780 800 820 840 860 880 900 9205
6
7
8
9
solid
us
Pre
ssur
e (k
bar)
bi g sillbi g cd liq
bi g cdbi g cd sill
(a)
bi gsill liq
bi g cd sill liq
(b)
NCKFMASHTO (+ q + ksp + pl + ilm)
bi g cd opx
g cd opx liq
cd opx mag liq
14 16 18 20 22
16
15
14
13
Temperature (°C)
sill
bi
g
liq
q + pl + ksp + Ilm
77.588.50
10
20
30
40ox
ide-
mol
arpr
opor
tion
(%)
Pressure (kbar)
isothermal decompresssion
cd
6.59
cdisopleths
gisopleths
14
16
12
10
2 4 6 8 10 12 liqisopleths
2
4
8
1 mm
gcd bi
sill
Figure 5. An example of linking the predictions of phase equilibria modelling withmicrostructural observations. (a) Isochemical Pressure–Temperature phase diagram fora suprasolidus metapelite (modified from Yakymchuk et al. 2015). The isopleths arefor the modes of liquid, cordierite and garnet. The inset shows the breakdown ofgarnet, sillimanite and biotite to cordierite. A schematic isothermal decompressionP–T path is shown by the bold arrow. (b) Pressure–Mode diagram showing the changein the proportions of the key ferromagnesian minerals along the P–T path in (a).Note that the modelling predicts the consumption of sillimanite, biotite and minorgarnet to produce cordierite, which is consistent with the microstructural observa-tions.
ep bichl ab
ep b
i chl
pl a
b
bi chlpl ab
ep g bi chl ab
g bi pl
bi pl
ep g bi pl ab
bi pl ab
g ep bi pl
MnNCKFMASHTO (+q +ilm +mu + H2O)ep g biab
chl-o
ut
300 400 500 600
4
5
6
7
8
9
10
Pre
ssur
e (k
bar)
Temperature (˚C)
3
2
1
ep chl ab
0.59
0.60
0.605
0.595
0.610
Molar Fe / (Fe+Mg)in chlorite
Figure 4. Pressure–Temperature isochemical phase diagram for a metagreywacke con-toured for the value of XFe (molar Fe/[Fe + Mg]) in chlorite (modified from Pearceet al. 2015a). The chlorite composition isopleths are generally steeply sloping, whichindicates that this variable is sensitive to temperature in this example. The modelledplagioclase is roughly oligoclase in composition, which is predicted to coexist withalbite reflecting the ‘peristerite gap’ (e.g. Vry et al. 2008)
If melt stayed in the system, high-temperature minerals areexpected to retrogress to lower-temperature minerals duringcooling and melt crystallization. Because phase equilibria mod-elling predicts the composition and mode of melt at P–T, aspecified amount of melt can be subtracted out of the bulkcomposition leaving behind a more residual composition. Thishas implications for quantification of the amount of meltextracted from a system, determination of the change(s) in therheological behaviour (e.g. strength) of migmatite during pro-grade metamorphism and evaluation of the tectonic processesthat operate in the anatectic crust.
Yakymchuk and Brown (2014a) modelled the changes inthe fertility (i.e. amount of melt that can be produced during
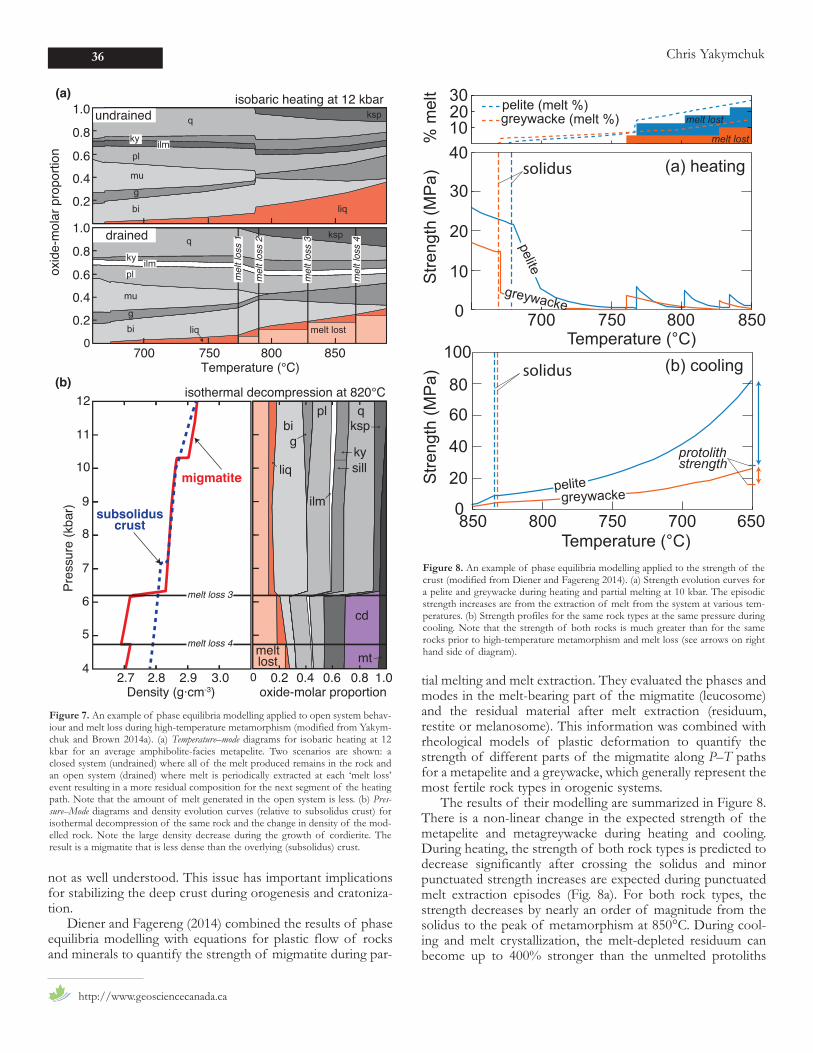
anatexis) and density of a metapelite during a metamorphicevolution with periodic melt drainage events. These authorsassumed that melt drains from the system when the propor-tion of melt reached a critical threshold. This critical value wasset at 7% melt, which is a rheological threshold where melt isassumed to form an interconnected network along grainboundaries (e.g. Rosenberg and Handy 2005) that allows meltdrainage out of the system. Yakymchuk and Brown (2014a)assumed that when the melt proportion reached the 7%threshold, 6% melt was drained from the system, which leaves1% in the system. However, this exercise can easily be done fordifferent melt thresholds including quasi-continuous meltextraction, which may be applicable to migmatites with highmelt fractions undergoing syn-anatectic deformation (e.g.Vigneresse and Burg 2000). Figure 7a shows Temperature–Modediagrams calculated for closed system (undrained) and opensystem (drained) metamorphism along an isobaric heating pathat 12 kbar. Note that the changes in mineral modes are roughlyequivalent up-temperature between the two scenarios. Onenotable exception is that the proportion of melt produced inan open system (30%) is less than the amount generated in aclosed system (36%). The effect of melt drainage on thereduced ability of the rock to generate additional melt is evenmore significant for decompression P–T paths (cf. Yakymchukand Brown 2014a).
The effect of anatexis and melt drainage on rock densityfor an isothermal decompression path at 820°C for the samemetapelite is shown in Figure 7b. The density of the migmatite(e.g. the density of the residue plus any melt in the system) iscompared with the density of the immediately overlying sub-solidus crust for the same protolith composition. Similar to theisobaric heating path, melt loss events are labelled on the dia-gram at the 7% melt threshold. During decompression from12 kbar the migmatite is of equivalent or greater density to theoverlying subsolidus crust until ~ 6 kbar. At this pressure,biotite and sillimanite break down to produce cordierite, whichis a relatively low-density mineral. This causes the density ofthe migmatite to decrease to values below that of the overlyingcrust during further decompression, which creates a buoyancycontrast. The positive buoyancy of the migmatite relative tothe overlying crust may be a mechanism that enhances theexhumation of migmatite gneiss domes and metamorphic corecomplexes (e.g. Whitney et al. 2013).
Mayne et al. (2016) developed an algorithm that models thesame open-system melting scenario as Yakymchuk and Brown(2014a), but for a much larger number of P–T paths. The con-clusions of Mayne et al. (2016) were the same as Yakymchukand Brown (2014a), although their new algorithm can beapplied to numerous other path-dependent open-systemprocesses.
Deformation and TectonicsPartial melting has significant implications for the rheology ofthe deep crust. The decrease in strength of the crust duringanatexis is well established for closed systems (e.g. Rosenbergand Handy 2005), but the consequences of melt extraction onthe strength of the remaining residuum in the deep crust are
GEOSCIENCE CANADA Volume 44 2017 35
https://doi.org/10.12789/geocanj.2017.44.114
300
320
340
360
380
400
mu chl dol sid
bi chl cc
bi mu chl cc
mu chl cc dol
mu dol sid
bi muchl dol sid
bi mu chl cc dol
mu chl dol
chl cc
muchlcc
bi mu chl dol
Tem
pera
ture
(˚C
)
plsid
dol
chl mu
NCaKFMASCH (+q + pl + fluid)(a)
@310˚C and 1.5 kbar
@1.5 kbar
(b)
oxid
e-m
olar
prop
ortio
n (%
) 100806040200
1 2 3 4K2O (mol.%) in bulk composition
1 2 3K2O (mol.%) in bulk composition
potassic alteration increasing
potassic alteration increasing
XCO2 = 0.25
Figure 6. An example of phase equilibria modelling applied to alteration associatedwith gold mineralization. (a) Temperature–Composition (Alteration) phase diagram cal-culated at 1.5 kbar for a metabasite (modified from White et al. 2003). The horizon-tal axis represents an increasing intensity of potassic alteration towards the right-hand side of the diagram. The left-hand side of the diagram represents an approx-imate protolith composition. (b) An isothermal (310°C) and isobaric (1.5 kbar) Com-position–Mode diagram showing the change in the proportion of phases with increas-ing potassic alteration. Note that the amounts of muscovite and siderite increase atthe expense of chlorite, plagioclase and dolomite. Excess quartz and fluid (XCO2 =0.25) are assumed for both diagrams.
not as well understood. This issue has important implicationsfor stabilizing the deep crust during orogenesis and cratoniza-tion.
Diener and Fagereng (2014) combined the results of phaseequilibria modelling with equations for plastic flow of rocksand minerals to quantify the strength of migmatite during par-
tial melting and melt extraction. They evaluated the phases andmodes in the melt-bearing part of the migmatite (leucosome)and the residual material after melt extraction (residuum,restite or melanosome). This information was combined withrheological models of plastic deformation to quantify thestrength of different parts of the migmatite along P–T pathsfor a metapelite and a greywacke, which generally represent themost fertile rock types in orogenic systems.
The results of their modelling are summarized in Figure 8.There is a non-linear change in the expected strength of themetapelite and metagreywacke during heating and cooling.During heating, the strength of both rock types is predicted todecrease significantly after crossing the solidus and minorpunctuated strength increases are expected during punctuatedmelt extraction episodes (Fig. 8a). For both rock types, thestrength decreases by nearly an order of magnitude from thesolidus to the peak of metamorphism at 850°C. During cool-ing and melt crystallization, the melt-depleted residuum canbecome up to 400% stronger than the unmelted protoliths
36 Chris Yakymchuk
http://www.geosciencecanada.ca
(b) cooling
(a) heating
pelite
greywackepelite
protolithstrength
greywacke (melt %)pelite (melt %)
Temperature (°C)700 750 800 8500
10
20
30
40
Stre
ngth
(MP
a)
Temperature (°C)650700750800850
0
20Stre
ngth
(MP
a)40
60
80
100solidus
solidus
greywacke
102030
melt lost
melt lost
% m
elt
Figure 8. An example of phase equilibria modelling applied to the strength of thecrust (modified from Diener and Fagereng 2014). (a) Strength evolution curves fora pelite and greywacke during heating and partial melting at 10 kbar. The episodicstrength increases are from the extraction of melt from the system at various tem-peratures. (b) Strength profiles for the same rock types at the same pressure duringcooling. Note that the strength of both rocks is much greater than for the samerocks prior to high-temperature metamorphism and melt loss (see arrows on righthand side of diagram).
q
ky ilmpl
mu
gbi liq
ksp
q
pl
mu
g
bi liq
ksp
ky ilm
1.0
0.8
0.6
0.4
0.2
0700 750
Temperature (°C)
oxid
e-m
olar
pro
port
ion
mel
t los
s 1
mel
t los
s 2
mel
t los
s 3
mel
t los
s 4
melt lost
800 850
1.0
0.8
0.6
0.4
0.2
undrained
drained
Pre
ssur
e (k
bar)
11
9
8
10
7
6
5
3.02.92.82.7Density (g·cm-3) oxide-molar proportion
1.00.80.60.40.204
12
big
liq
pl
ilm
ksp
kysill
q
melt loss 3
melt loss 4
cd
mtmeltlost
isobaric heating at 12 kbar
isothermal decompression at 820°C
migmatite
subsoliduscrust
(a)
(b)
Figure 7. An example of phase equilibria modelling applied to open system behav-iour and melt loss during high-temperature metamorphism (modified from Yakym-chuk and Brown 2014a). (a) Temperature–mode diagrams for isobaric heating at 12kbar for an average amphibolite-facies metapelite. Two scenarios are shown: aclosed system (undrained) where all of the melt produced remains in the rock andan open system (drained) where melt is periodically extracted at each ‘melt loss’event resulting in a more residual composition for the next segment of the heatingpath. Note that the amount of melt generated in the open system is less. (b) Pres-sure–Mode diagrams and density evolution curves (relative to subsolidus crust) forisothermal decompression of the same rock and the change in density of the mod-elled rock. Note the large density decrease during the growth of cordierite. Theresult is a migmatite that is less dense than the overlying (subsolidus) crust.
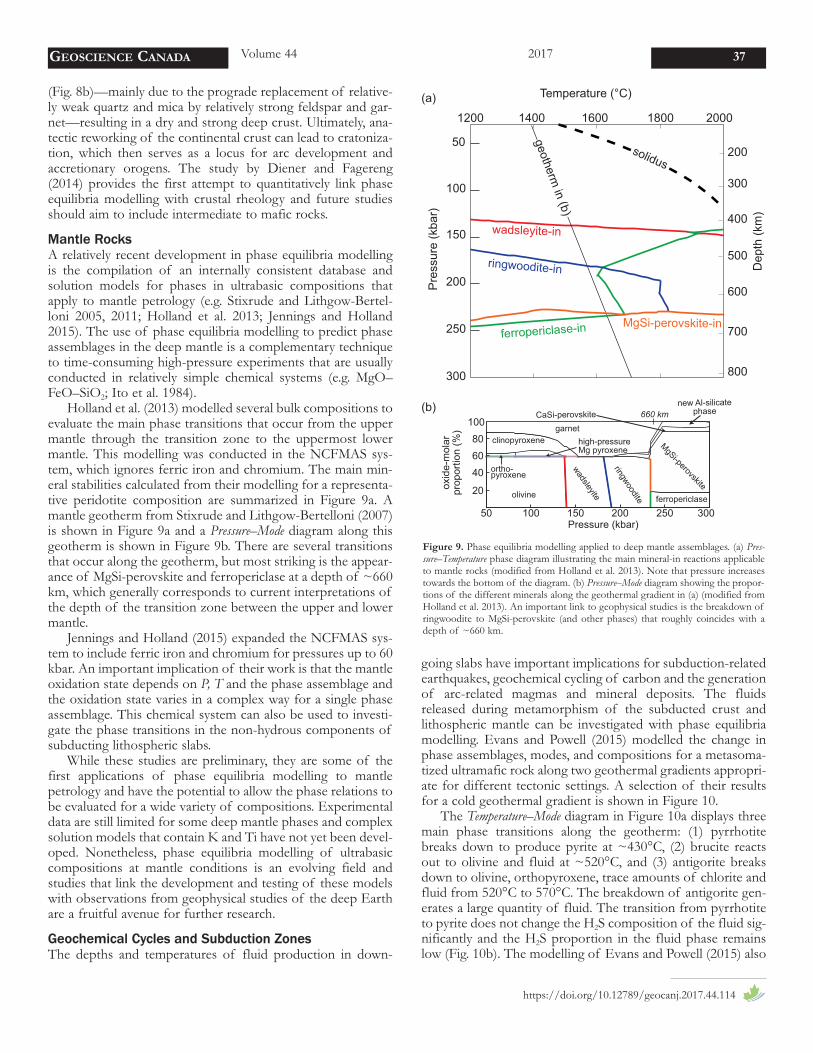
(Fig. 8b)—mainly due to the prograde replacement of relative-ly weak quartz and mica by relatively strong feldspar and gar-net—resulting in a dry and strong deep crust. Ultimately, ana-tectic reworking of the continental crust can lead to cratoniza-tion, which then serves as a locus for arc development andaccretionary orogens. The study by Diener and Fagereng(2014) provides the first attempt to quantitatively link phaseequilibria modelling with crustal rheology and future studiesshould aim to include intermediate to mafic rocks.
Mantle RocksA relatively recent development in phase equilibria modellingis the compilation of an internally consistent database andsolution models for phases in ultrabasic compositions thatapply to mantle petrology (e.g. Stixrude and Lithgow-Bertel-loni 2005, 2011; Holland et al. 2013; Jennings and Holland2015). The use of phase equilibria modelling to predict phaseassemblages in the deep mantle is a complementary techniqueto time-consuming high-pressure experiments that are usuallyconducted in relatively simple chemical systems (e.g. MgO–FeO–SiO2; Ito et al. 1984).
Holland et al. (2013) modelled several bulk compositions toevaluate the main phase transitions that occur from the uppermantle through the transition zone to the uppermost lowermantle. This modelling was conducted in the NCFMAS sys-tem, which ignores ferric iron and chromium. The main min-eral stabilities calculated from their modelling for a representa-tive peridotite composition are summarized in Figure 9a. Amantle geotherm from Stixrude and Lithgow-Bertelloni (2007)is shown in Figure 9a and a Pressure–Mode diagram along thisgeotherm is shown in Figure 9b. There are several transitionsthat occur along the geotherm, but most striking is the appear-ance of MgSi-perovskite and ferropericlase at a depth of ~660km, which generally corresponds to current interpretations ofthe depth of the transition zone between the upper and lowermantle.
Jennings and Holland (2015) expanded the NCFMAS sys-tem to include ferric iron and chromium for pressures up to 60kbar. An important implication of their work is that the mantleoxidation state depends on P, T and the phase assemblage andthe oxidation state varies in a complex way for a single phaseassemblage. This chemical system can also be used to investi-gate the phase transitions in the non-hydrous components ofsubducting lithospheric slabs.
While these studies are preliminary, they are some of thefirst applications of phase equilibria modelling to mantlepetrology and have the potential to allow the phase relations tobe evaluated for a wide variety of compositions. Experimentaldata are still limited for some deep mantle phases and complexsolution models that contain K and Ti have not yet been devel-oped. Nonetheless, phase equilibria modelling of ultrabasiccompositions at mantle conditions is an evolving field andstudies that link the development and testing of these modelswith observations from geophysical studies of the deep Earthare a fruitful avenue for further research.
Geochemical Cycles and Subduction ZonesThe depths and temperatures of fluid production in down-
going slabs have important implications for subduction-relatedearthquakes, geochemical cycling of carbon and the generationof arc-related magmas and mineral deposits. The fluidsreleased during metamorphism of the subducted crust andlithospheric mantle can be investigated with phase equilibriamodelling. Evans and Powell (2015) modelled the change inphase assemblages, modes, and compositions for a metasoma-tized ultramafic rock along two geothermal gradients appropri-ate for different tectonic settings. A selection of their resultsfor a cold geothermal gradient is shown in Figure 10.
The Temperature–Mode diagram in Figure 10a displays threemain phase transitions along the geotherm: (1) pyrrhotitebreaks down to produce pyrite at ~430°C, (2) brucite reactsout to olivine and fluid at ~520°C, and (3) antigorite breaksdown to olivine, orthopyroxene, trace amounts of chlorite andfluid from 520°C to 570°C. The breakdown of antigorite gen-erates a large quantity of fluid. The transition from pyrrhotiteto pyrite does not change the H2S composition of the fluid sig-nificantly and the H2S proportion in the fluid phase remainslow (Fig. 10b). The modelling of Evans and Powell (2015) also
GEOSCIENCE CANADA Volume 44 2017 37
https://doi.org/10.12789/geocanj.2017.44.114
solidus
250
150
50
300
200
100
1200 1400 1600 1800 2000
200
300
400
500
600
700
800
Dep
th (k
m)
Pre
ssur
e (k
bar)
geotherm in (b)
garnet
ringwoodite
wadsleyiteolivine
MgSi-perovskite
ferropericlase
clinopyroxene
ortho-pyroxene
high-pressureMg pyroxene
CaSi-perovskitenew Al-silicate
phase
Pressure (kbar)150100 200 250 30050
oxid
e-m
olar
prop
ortio
n (%
)
660 km100806040
20
MgSi-perovskite-in
ringwoodite-in
wadsleyite-in
ferropericlase-in
(a)
(b)
Temperature (°C)
Figure 9. Phase equilibria modelling applied to deep mantle assemblages. (a) Pres-sure–Temperature phase diagram illustrating the main mineral-in reactions applicableto mantle rocks (modified from Holland et al. 2013). Note that pressure increasestowards the bottom of the diagram. (b) Pressure–Mode diagram showing the propor-tions of the different minerals along the geothermal gradient in (a) (modified fromHolland et al. 2013). An important link to geophysical studies is the breakdown ofringwoodite to MgSi-perovskite (and other phases) that roughly coincides with adepth of ~660 km.
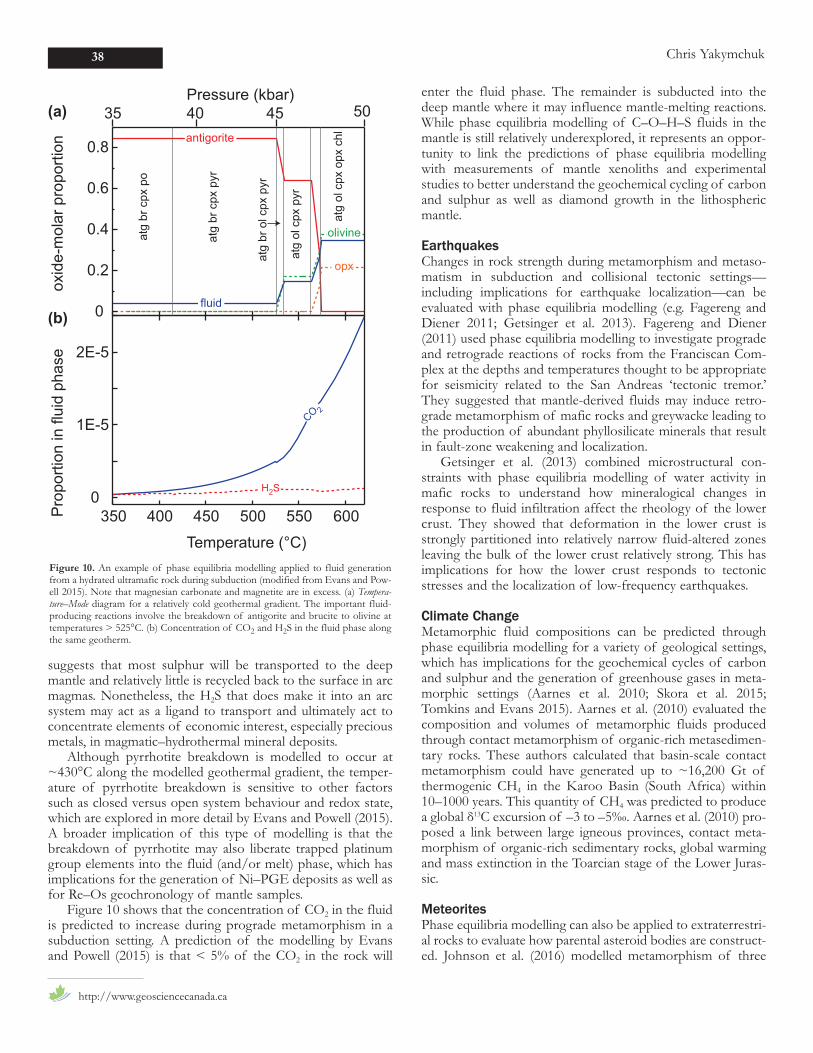
suggests that most sulphur will be transported to the deepmantle and relatively little is recycled back to the surface in arcmagmas. Nonetheless, the H2S that does make it into an arcsystem may act as a ligand to transport and ultimately act toconcentrate elements of economic interest, especially preciousmetals, in magmatic–hydrothermal mineral deposits.
Although pyrrhotite breakdown is modelled to occur at~430°C along the modelled geothermal gradient, the temper-ature of pyrrhotite breakdown is sensitive to other factorssuch as closed versus open system behaviour and redox state,which are explored in more detail by Evans and Powell (2015).A broader implication of this type of modelling is that thebreakdown of pyrrhotite may also liberate trapped platinumgroup elements into the fluid (and/or melt) phase, which hasimplications for the generation of Ni–PGE deposits as well asfor Re–Os geochronology of mantle samples.
Figure 10 shows that the concentration of CO2 in the fluidis predicted to increase during prograde metamorphism in asubduction setting. A prediction of the modelling by Evansand Powell (2015) is that < 5% of the CO2 in the rock will
enter the fluid phase. The remainder is subducted into thedeep mantle where it may influence mantle-melting reactions.While phase equilibria modelling of C–O–H–S fluids in themantle is still relatively underexplored, it represents an oppor-tunity to link the predictions of phase equilibria modellingwith measurements of mantle xenoliths and experimentalstudies to better understand the geochemical cycling of carbonand sulphur as well as diamond growth in the lithosphericmantle.
EarthquakesChanges in rock strength during metamorphism and metaso-matism in subduction and collisional tectonic settings—including implications for earthquake localization—can beevaluated with phase equilibria modelling (e.g. Fagereng andDiener 2011; Getsinger et al. 2013). Fagereng and Diener(2011) used phase equilibria modelling to investigate progradeand retrograde reactions of rocks from the Franciscan Com-plex at the depths and temperatures thought to be appropriatefor seismicity related to the San Andreas ‘tectonic tremor.’They suggested that mantle-derived fluids may induce retro-grade metamorphism of mafic rocks and greywacke leading tothe production of abundant phyllosilicate minerals that resultin fault-zone weakening and localization.
Getsinger et al. (2013) combined microstructural con-straints with phase equilibria modelling of water activity inmafic rocks to understand how mineralogical changes inresponse to fluid infiltration affect the rheology of the lowercrust. They showed that deformation in the lower crust isstrongly partitioned into relatively narrow fluid-altered zonesleaving the bulk of the lower crust relatively strong. This hasimplications for how the lower crust responds to tectonicstresses and the localization of low-frequency earthquakes.
Climate ChangeMetamorphic fluid compositions can be predicted throughphase equilibria modelling for a variety of geological settings,which has implications for the geochemical cycles of carbonand sulphur and the generation of greenhouse gases in meta-morphic settings (Aarnes et al. 2010; Skora et al. 2015;Tomkins and Evans 2015). Aarnes et al. (2010) evaluated thecomposition and volumes of metamorphic fluids producedthrough contact metamorphism of organic-rich metasedimen-tary rocks. These authors calculated that basin-scale contactmetamorphism could have generated up to ~16,200 Gt ofthermogenic CH4 in the Karoo Basin (South Africa) within10–1000 years. This quantity of CH4 was predicted to producea global δ13C excursion of –3 to –5‰. Aarnes et al. (2010) pro-posed a link between large igneous provinces, contact meta-morphism of organic-rich sedimentary rocks, global warmingand mass extinction in the Toarcian stage of the Lower Juras-sic.
MeteoritesPhase equilibria modelling can also be applied to extraterrestri-al rocks to evaluate how parental asteroid bodies are construct-ed. Johnson et al. (2016) modelled metamorphism of three
38 Chris Yakymchuk
http://www.geosciencecanada.ca
0
0.2
0.4
0.6
0.8
oxid
e-m
olar
pro
porti
on
atg
br c
px p
o
atg
br c
px p
yr
atg
ol c
px p
yr
atg
ol c
px o
px c
hl
0
1E-5
2E-5
Pro
porti
on in
flui
d ph
ase
50 35Pressure (kbar)40 45
350 400 450 500 550 600
atg
br o
l cpx
pyr
Temperature (°C)
antigorite
fluid
olivine
opx
CO 2
H2S
(a)
(b)
Figure 10. An example of phase equilibria modelling applied to fluid generationfrom a hydrated ultramafic rock during subduction (modified from Evans and Pow-ell 2015). Note that magnesian carbonate and magnetite are in excess. (a) Tempera-ture–Mode diagram for a relatively cold geothermal gradient. The important fluid-producing reactions involve the breakdown of antigorite and brucite to olivine attemperatures > 525°C. (b) Concentration of CO2 and H2S in the fluid phase alongthe same geotherm.
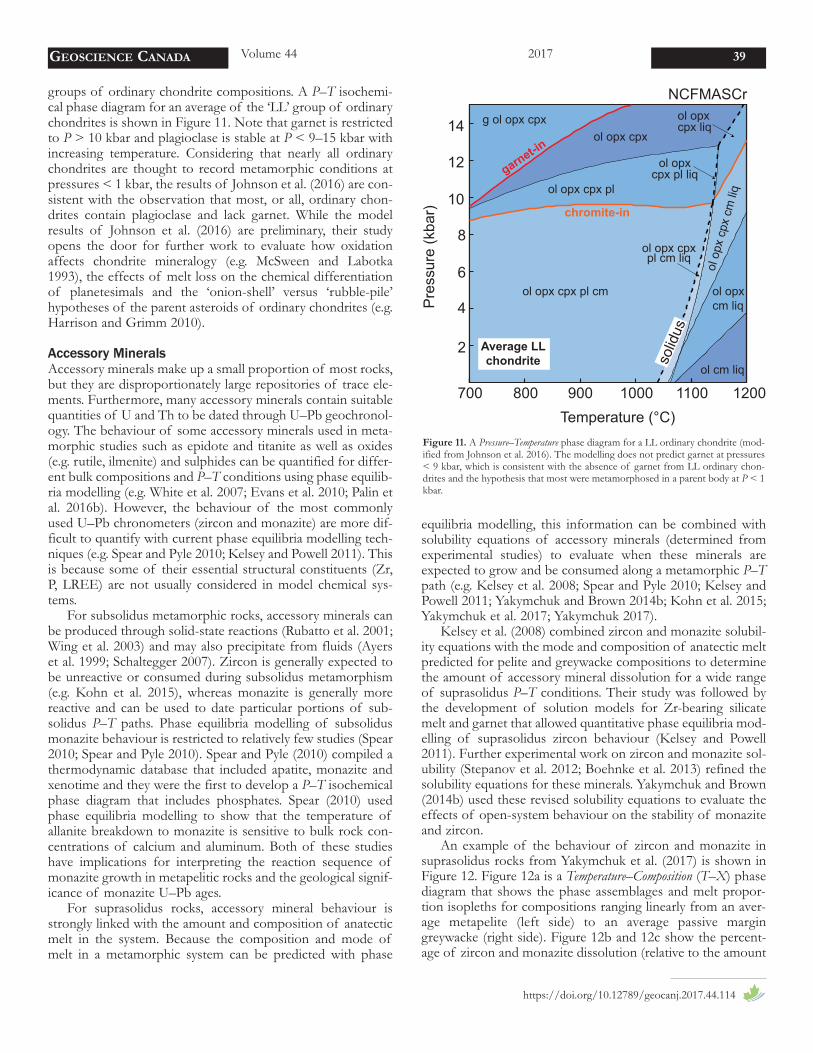
groups of ordinary chondrite compositions. A P–T isochemi-cal phase diagram for an average of the ‘LL’ group of ordinarychondrites is shown in Figure 11. Note that garnet is restrictedto P > 10 kbar and plagioclase is stable at P < 9–15 kbar withincreasing temperature. Considering that nearly all ordinarychondrites are thought to record metamorphic conditions atpressures < 1 kbar, the results of Johnson et al. (2016) are con-sistent with the observation that most, or all, ordinary chon-drites contain plagioclase and lack garnet. While the modelresults of Johnson et al. (2016) are preliminary, their studyopens the door for further work to evaluate how oxidationaffects chondrite mineralogy (e.g. McSween and Labotka1993), the effects of melt loss on the chemical differentiationof planetesimals and the ‘onion-shell’ versus ‘rubble-pile’hypotheses of the parent asteroids of ordinary chondrites (e.g.Harrison and Grimm 2010).
Accessory MineralsAccessory minerals make up a small proportion of most rocks,but they are disproportionately large repositories of trace ele-ments. Furthermore, many accessory minerals contain suitablequantities of U and Th to be dated through U–Pb geochronol-ogy. The behaviour of some accessory minerals used in meta-morphic studies such as epidote and titanite as well as oxides(e.g. rutile, ilmenite) and sulphides can be quantified for differ-ent bulk compositions and P–T conditions using phase equilib-ria modelling (e.g. White et al. 2007; Evans et al. 2010; Palin etal. 2016b). However, the behaviour of the most commonlyused U–Pb chronometers (zircon and monazite) are more dif-ficult to quantify with current phase equilibria modelling tech-niques (e.g. Spear and Pyle 2010; Kelsey and Powell 2011). Thisis because some of their essential structural constituents (Zr,P, LREE) are not usually considered in model chemical sys-tems.
For subsolidus metamorphic rocks, accessory minerals canbe produced through solid-state reactions (Rubatto et al. 2001;Wing et al. 2003) and may also precipitate from fluids (Ayerset al. 1999; Schaltegger 2007). Zircon is generally expected tobe unreactive or consumed during subsolidus metamorphism(e.g. Kohn et al. 2015), whereas monazite is generally morereactive and can be used to date particular portions of sub-solidus P–T paths. Phase equilibria modelling of subsolidusmonazite behaviour is restricted to relatively few studies (Spear2010; Spear and Pyle 2010). Spear and Pyle (2010) compiled athermodynamic database that included apatite, monazite andxenotime and they were the first to develop a P–T isochemicalphase diagram that includes phosphates. Spear (2010) usedphase equilibria modelling to show that the temperature ofallanite breakdown to monazite is sensitive to bulk rock con-centrations of calcium and aluminum. Both of these studieshave implications for interpreting the reaction sequence ofmonazite growth in metapelitic rocks and the geological signif-icance of monazite U–Pb ages.
For suprasolidus rocks, accessory mineral behaviour isstrongly linked with the amount and composition of anatecticmelt in the system. Because the composition and mode ofmelt in a metamorphic system can be predicted with phase
equilibria modelling, this information can be combined withsolubility equations of accessory minerals (determined fromexperimental studies) to evaluate when these minerals areexpected to grow and be consumed along a metamorphic P–Tpath (e.g. Kelsey et al. 2008; Spear and Pyle 2010; Kelsey andPowell 2011; Yakymchuk and Brown 2014b; Kohn et al. 2015;Yakymchuk et al. 2017; Yakymchuk 2017).
Kelsey et al. (2008) combined zircon and monazite solubil-ity equations with the mode and composition of anatectic meltpredicted for pelite and greywacke compositions to determinethe amount of accessory mineral dissolution for a wide rangeof suprasolidus P–T conditions. Their study was followed bythe development of solution models for Zr-bearing silicatemelt and garnet that allowed quantitative phase equilibria mod-elling of suprasolidus zircon behaviour (Kelsey and Powell2011). Further experimental work on zircon and monazite sol-ubility (Stepanov et al. 2012; Boehnke et al. 2013) refined thesolubility equations for these minerals. Yakymchuk and Brown(2014b) used these revised solubility equations to evaluate theeffects of open-system behaviour on the stability of monaziteand zircon.
An example of the behaviour of zircon and monazite insuprasolidus rocks from Yakymchuk et al. (2017) is shown inFigure 12. Figure 12a is a Temperature–Composition (T–X) phasediagram that shows the phase assemblages and melt propor-tion isopleths for compositions ranging linearly from an aver-age metapelite (left side) to an average passive margingreywacke (right side). Figure 12b and 12c show the percent-age of zircon and monazite dissolution (relative to the amount
GEOSCIENCE CANADA Volume 44 2017 39
https://doi.org/10.12789/geocanj.2017.44.114
14
12
10
8
6
4
2
Pre
ssur
e (k
bar)
700 800 900 1000 1100 1200Temperature (°C)
chromite-in
ol opx cpx pl cm
ol opx cpx pl
ol opx cpxg ol opx cpx
NCFMASCr
solid
us
ol o
px c
px c
m li
q
ol opxcm liq
ol cm liq
ol opxcpx liq
ol opx cpxpl cm liq
ol opxcpx pl liqgarnet-in
Average LLchondrite
Figure 11. A Pressure–Temperature phase diagram for a LL ordinary chondrite (mod-ified from Johnson et al. 2016). The modelling does not predict garnet at pressures< 9 kbar, which is consistent with the absence of garnet from LL ordinary chon-drites and the hypothesis that most were metamorphosed in a parent body at P < 1kbar.
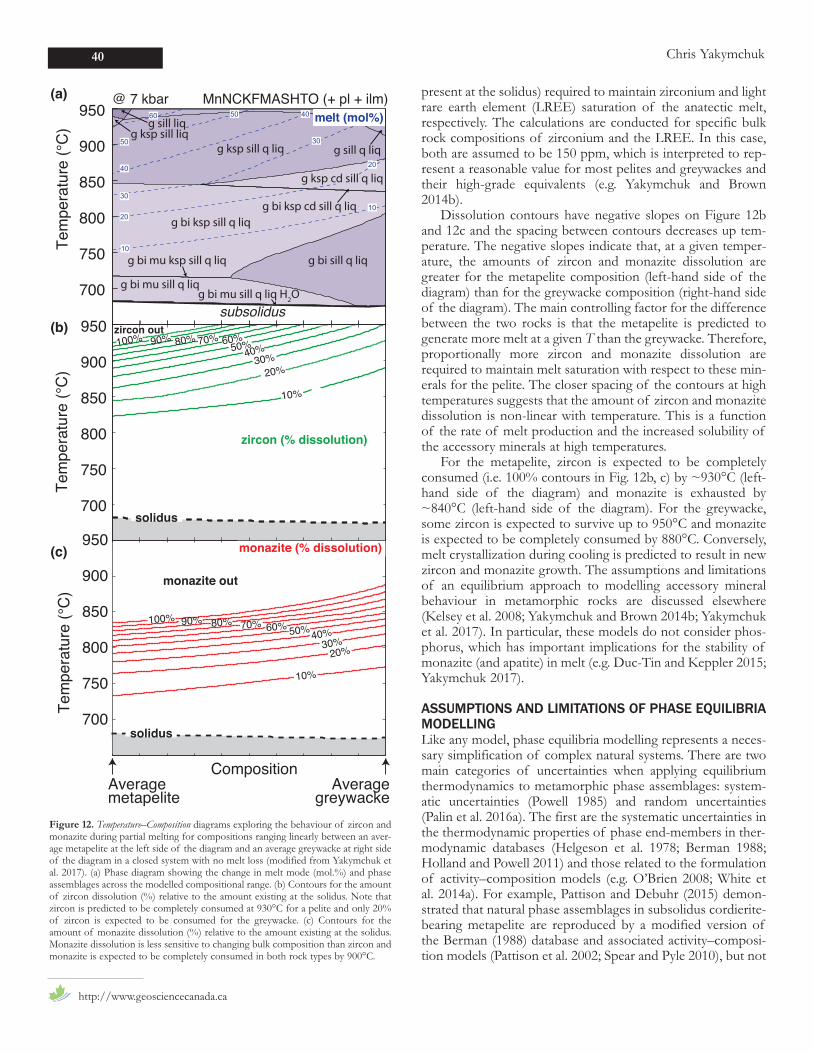
present at the solidus) required to maintain zirconium and lightrare earth element (LREE) saturation of the anatectic melt,respectively. The calculations are conducted for specific bulkrock compositions of zirconium and the LREE. In this case,both are assumed to be 150 ppm, which is interpreted to rep-resent a reasonable value for most pelites and greywackes andtheir high-grade equivalents (e.g. Yakymchuk and Brown2014b).
Dissolution contours have negative slopes on Figure 12band 12c and the spacing between contours decreases up tem-perature. The negative slopes indicate that, at a given temper-ature, the amounts of zircon and monazite dissolution aregreater for the metapelite composition (left-hand side of thediagram) than for the greywacke composition (right-hand sideof the diagram). The main controlling factor for the differencebetween the two rocks is that the metapelite is predicted togenerate more melt at a given T than the greywacke. Therefore,proportionally more zircon and monazite dissolution arerequired to maintain melt saturation with respect to these min-erals for the pelite. The closer spacing of the contours at hightemperatures suggests that the amount of zircon and monazitedissolution is non-linear with temperature. This is a functionof the rate of melt production and the increased solubility ofthe accessory minerals at high temperatures.
For the metapelite, zircon is expected to be completelyconsumed (i.e. 100% contours in Fig. 12b, c) by ~930°C (left-hand side of the diagram) and monazite is exhausted by~840°C (left-hand side of the diagram). For the greywacke,some zircon is expected to survive up to 950°C and monaziteis expected to be completely consumed by 880°C. Conversely,melt crystallization during cooling is predicted to result in newzircon and monazite growth. The assumptions and limitationsof an equilibrium approach to modelling accessory mineralbehaviour in metamorphic rocks are discussed elsewhere(Kelsey et al. 2008; Yakymchuk and Brown 2014b; Yakymchuket al. 2017). In particular, these models do not consider phos-phorus, which has important implications for the stability ofmonazite (and apatite) in melt (e.g. Duc-Tin and Keppler 2015;Yakymchuk 2017).
ASSUMPTIONS AND LIMITATIONS OF PHASE EQUILIBRIAMODELLINGLike any model, phase equilibria modelling represents a neces-sary simplification of complex natural systems. There are twomain categories of uncertainties when applying equilibriumthermodynamics to metamorphic phase assemblages: system-atic uncertainties (Powell 1985) and random uncertainties(Palin et al. 2016a). The first are the systematic uncertainties inthe thermodynamic properties of phase end-members in ther-modynamic databases (Helgeson et al. 1978; Berman 1988;Holland and Powell 2011) and those related to the formulationof activity–composition models (e.g. O’Brien 2008; White etal. 2014a). For example, Pattison and Debuhr (2015) demon-strated that natural phase assemblages in subsolidus cordierite-bearing metapelite are reproduced by a modified version ofthe Berman (1988) database and associated activity–composi-tion models (Pattison et al. 2002; Spear and Pyle 2010), but not
40 Chris Yakymchuk
http://www.geosciencecanada.ca
700
750
800
850
900
950
700
750
800
850
900
950
Tem
pera
ture
(°C
)
Averagemetapelite
Averagegreywacke
700
750
800
850
900
950MnNCKFMASHTO (+ pl + ilm)
Tem
pera
ture
(°C
)T
empe
ratu
re (
°C)
g ksp sill q liq
g bi ksp sill q liq
g bi sill q liq
g bi mu sill q liq
g bi mu ksp sill q liq
g sill q liq
g bi mu sill q liq H2O
g bi ksp cd sill q liq
solidus
monazite out
40%50%
Composition
(a)
(b)
(c)
subsoliduszircon out
10%
20%30%40%50%60%70%80%90%100%
10
1020
30
405060
50
40
30
1020
10
10%
20%30%
60%70%80%90%100%
g ksp cd sill q liq
g ksp sill liqg sill liq melt (mol%)
zircon (% dissolution)
monazite (% dissolution)
solidus
@ 7 kbar
Figure 12. Temperature–Composition diagrams exploring the behaviour of zircon andmonazite during partial melting for compositions ranging linearly between an aver-age metapelite at the left side of the diagram and an average greywacke at right sideof the diagram in a closed system with no melt loss (modified from Yakymchuk etal. 2017). (a) Phase diagram showing the change in melt mode (mol.%) and phaseassemblages across the modelled compositional range. (b) Contours for the amountof zircon dissolution (%) relative to the amount existing at the solidus. Note thatzircon is predicted to be completely consumed at 930°C for a pelite and only 20%of zircon is expected to be consumed for the greywacke. (c) Contours for theamount of monazite dissolution (%) relative to the amount existing at the solidus.Monazite dissolution is less sensitive to changing bulk composition than zircon andmonazite is expected to be completely consumed in both rock types by 900°C.
by the Holland and Powell (1998, 2011) databases and associ-ated activity–composition models. The systematic uncertain-ties of phase equilibria modelling will decrease as more exper-imental data become available and more natural rock assem-blages are examined and integrated into activity–compositionmodels. In some cases, error propagation can be used to assessthe uncertainty in P–T estimates (e.g. Powell 1985) and, morerecently, Monte Carlo simulations were used to quantify sys-tematic uncertainties (Jennings and Holland 2015; Palin et al.2016a).
The second category of uncertainties comprises geologicaluncertainties that are difficult to quantify. These include: (1)choosing an effective bulk composition of a system (e.g. Gue-vara and Caddick 2016), and (2) evaluating if a phase assem-blage is in equilibrium and assessing any kinetic barriers toattaining equilibrium (e.g. Pattison et al. 2011; Spear et al.2016). Another source of uncertainty is the misidentificationof reaction sequences and equilibrium phase assemblages (e.g.Vernon et al. 2008), but this needs to be assessed on a case-by-case basis.
The effective bulk composition of a metamorphic systemcan change along a P–T evolution. The partitioning of partic-ular cations into growing porphyroblasts (e.g. Mn into garnet)and different diffusion rates for cations can result in growth-zoned minerals where the cores are not in equilibrium with thesurrounding phase assemblage. In some cases, this can beexamined by forward modelling of porphyroblast growth (e.g.Zuluaga et al. 2005; Gaidies et al. 2008; Moynihan and Pattison2013).
Melt loss during suprasolidus metamorphism producesmore residual compositions, elevated solidus temperatures anda greater proportion of peritectic minerals relative to theundrained protolith compositions (e.g. Yakymchuk and Brown2014a; Guevara and Caddick 2016). While these residual com-positions are useful for determining peak P–T and portions ofthe retrograde path, they may not be appropriate for investi-gating prograde metamorphic reactions that require an esti-mate of the effective bulk composition before melt extraction.Inverse modelling has been used to add melt back into the bulkcomposition while working down temperature (White et al.2004; Indares et al. 2008; Guilmette et al. 2011), but thisrequires an assumption of the P–T trajectory of the progradepath, which is not always clear.
Assessing if a metamorphic phase assemblage is in equilib-rium is a matter of interpretation and the scale of observation.Most petrologists would interpret high-temperature metamor-phic minerals that are compositionally homogeneous with low-energy grain shapes (e.g. triple junctions at grain boundaries)to represent an equilibrium assemblage. However, very fewmetamorphic rocks fit these criteria. Reaction microstructures(e.g. coronae around porphyroblasts) may be interpreted byone geologist to record disequilibrium at the scale of a handsample or thin section and by another to represent equilibriumat the scale of grain boundaries. Therefore, the interpretationcomes down to the scale of observation. Equilibrium volumesare anticipated to be larger for high-temperature systems thatmay permit relatively rapid cation transport, such as through
melt along grain boundaries, and smaller for lower-tempera-ture systems where intergranular diffusion rates of cations maybe very slow. However, this temperature-related generality maybe secondary to the presence and nature of intergranularvolatile species (e.g. Carlson et al. 2015a).
Metamorphic reactions may not proceed at the P–T condi-tions predicted from phase equilibria modelling due to kineticbarriers related to nucleation, interface reaction and intergran-ular transport (Ridley and Thompson 1986; Rubie 1998; Gai-dies et al. 2011; Carlson et al. 2015b). Kinetic barriers to nucle-ation are generally considered to be the dominant rate-limitingstep in metamorphic phase assemblages reaching equilibrium(e.g. Ague and Carlson 2013). Kelly et al. (2013) used numericalmodelling of diffusion-controlled nucleation (and growth) ofgarnet to show that garnet nucleation begins after 5–67°C ofthermal overstep. Waters and Lovegrove (2002) and Pattison etal. (2011) showed how reaction affinity modelling could beused to predict the degrees of overstepping to be expected fordifferent reactions, the results of which agreed with observa-tions from the Bushveld aureole (Waters and Lovegrove 2002)and Nelson aureole (Pattison and Tinkham 2009). Reactionoverstepping and disequilibrium processes are probably morewidespread than previously acknowledged and are essentialcomponents of a rock’s metamorphic history.
All of the limitations discussed above need to be consid-ered when applying the results of phase equilibria modelling tonatural metamorphic rocks and in particular to detailed studiesof P–T–t paths. Nonetheless, the equilibrium approach tometamorphic assemblages reproduces many first-order obser-vations from metamorphic rocks and this methodology can beapplied to various geological questions in a relatively fast andinexpensive way. Thermodynamics and phase equilibriummodelling also provide some of the theoretical tools to evalu-ate the possible consequences of disequilibrium processes (e.g.Pattison et al. 2011).
CONCLUSIONS AND OUTLOOKPhase equilibria modelling has evolved over the last fewdecades and now allows for a variety of phase diagrams to becalculated with different variables for a wide range of compo-sitions. While there may be limitations to the equilibriumapproach to understanding metamorphic rocks and processes,it provides an excellent framework to test and refine hypothe-ses and opens up connections to many other areas of the geo-sciences. Linking the predictions of phase equilibria modellingof mantle rocks with observations from geophysical studies isa fruitful avenue for further work. Developing alteration vec-tors to mineralization using phase diagrams is an underex-plored connection to economic geology. Integrating metamor-phic phase diagrams into global geochemical cycles from theArchean to the present may provide new insights into the sec-ular change of the lithosphere, hydrosphere and atmosphere.The continual refinement of activity–composition models ofdifferent phases and expanding model chemical systems maysoon allow a more quantitative method to evaluate accessorymineral behaviour in metamorphic systems. Finally, the inter-play between equilibrium and kinetics in the pressure-temper-
GEOSCIENCE CANADA Volume 44 2017 41
https://doi.org/10.12789/geocanj.2017.44.114
ature-fluid-deformation history of rocks is at an early stage ofinvestigation and will be the focus of much future research.
ACKNOWLEDGEMENTSThis admittedly biased review has benefited from numerous interactions with col-leagues and students. Discussions with M Brown, MJ Caddick, C Clark, DRM Patti-son and RW White were particularly insightful. I thank T Rivers and DRM Pattisonfor very thorough and constructive reviews of this manuscript. I thank Andrew Kerrfor the invitation to write this contribution and for his editorial handling. I acknowl-edge funding from a Natural Sciences and Engineering Council of Canada Discov-ery Grant.
REFERENCESAarnes, I., Svensen, H., Connolly, J.A.D., and Podladchikov, Y.Y., 2010, How contact
metamorphism can trigger global climate changes: Modeling gas generationaround igneous sills in sedimentary basins: Geochimica et Cosmochimica Acta,v. 74, p. 7179–7195, https://doi.org/10.1016/j.gca.2010.09.011.
Ague, J.J., 1991, Evidence for major mass transfer and volume strain during regionalmetamorphism of pelites: Geology, v. 19, p. 855–858, https://doi.org/10.1130/0091-7613(1991)019<0855:EFMMTA>2.3.CO;2.
Ague, J.J., and Carlson, W.D., 2013, Metamorphism as garnet sees it: The kinetics ofnucleation and growth, equilibration, and diffusional relaxation: Elements, v. 9,p. 439–445, https://doi.org/10.2113/gselements.9.6.439.
Albee, A.L., 1965, A petrogenetic grid for the Fe-Mg silicates of pelitic schists:American Journal of Science, v. 263, p. 512–536, https://doi.org/10.2475/ajs.263.6.512.
Ambrose, T.K., Larson, K.P., Guilmette, C., Cottle, J.M., Buckingham, H., and Rai,S., 2015, Lateral extrusion, underplating, and out-of-sequence thrusting withinthe Himalayan metamorphic core, Kanchenjunga, Nepal: Lithosphere, v. 7, p.441–464, https://doi.org/10.1130/L437.1.
Ayers, J.C., Miller, C., Gorisch, B., and Milleman, J., 1999, Textural development ofmonazite during high-grade metamorphism; hydrothermal growth kinetics,with implications for U, Th–Pb geochronology: American Mineralogist, v. 84, p.1766–1780, https://doi.org/10.2138/am-1999-11-1206.
Berman, R.G., 1988, Internally-consistent thermodynamic data for minerals in thesystem Na2O–K2O–CaO–MgO–FeO–Fe2O3–Al2O3–SiO2–TiO2–H2O–CO2:Journal of Petrology, v. 29, p. 445–522, https://doi.org/10.1093/petrology/29.2.445.
Boehnke, P., Watson, E.B., Trail, D., Harrison, T.M., and Schmitt, A.K., 2013, Zirconsaturation re-revisited: Chemical Geology, v. 351, p. 324–334, https://doi.org/10.1016/j.chemgeo.2013.05.028.
Boger, S.D., White, R.W., and Schulte, B., 2012, The importance of iron speciation(Fe+2/Fe+3) in determining mineral assemblages: an example from the high-grade aluminous metapelites of southeastern Madagascar: Journal of Metamor-phic Geology, v. 30, p. 997–1018, https://doi.org/10.1111/jmg.12001.
Bowen, N.L., 1940, Progressive metamorphism of siliceous limestone and dolomite:The Journal of Geology, v. 48, p. 225–274, https://doi.org/10.1086/624885.
Brown, M., 2007, Metamorphic conditions in orogenic belts: A record of secularchange: International Geology Review, v. 49, p. 193–234, https://doi.org/10.2747/0020-6814.49.3.193.
Brown, M., 2014, The contribution of metamorphic petrology to understandinglithosphere evolution and geodynamics: Geoscience Frontiers, v. 5, p. 553–569,https://doi.org/10.1016/j.gsf.2014.02.005.
Carlson, W.D., Hixon, J.D., Garber, J.M., and Bodnar, R.J., 2015a, Controls on meta-morphic equilibration: the importance of intergranular solubilities mediated byfluid composition: Journal of Metamorphic Geology, v. 33, p. 123–146,https://doi.org/10.1111/jmg.12113.
Carlson, W.D., Pattison, D.R.M., and Caddick, M.J., 2015b, Beyond the equilibriumparadigm: How consideration of kinetics enhances metamorphic interpretation:American Mineralogist, v. 100, p. 1659–1667, https://doi.org/10.2138/am-2015-5097.
Carrington, D.P., and Harley, S.L., 1995, Partial melting and phase relations in high-grade metapelites: an experimental petrogenetic grid in the KFMASH system:Contributions to Mineralogy and Petrology, v. 120, p. 270–291,https://doi.org/10.1007/BF00306508.
Carson, C.J., Clarke, G.L., and Powell, R., 2000, Hydration of eclogite, Pam Penin-sula, New Caledonia: Journal of Metamorphic Geology, v. 18, p. 79–90,https://doi.org/10.1046/j.1525-1314.2000.00245.x.
Connolly, J.A.D., and Petrini, K., 2002, An automated strategy for calculation ofphase diagram sections and retrieval of rock properties as a function of physi-cal conditions: Journal of Metamorphic Geology, v. 20, p. 697–708,
https://doi.org/10.1046/j.1525-1314.2002.00398.x.de Capitani, C., and Brown, T.H., 1987, The computation of chemical equilibrium
in complex systems containing non-ideal solutions: Geochimica et Cosmochim-ica Acta, v. 51, p. 2639–2652, https://doi.org/10.1016/0016-7037(87)90145-1.
de Capitani, C., and Petrakakis, K., 2010, The computation of equilibrium assem-blage diagrams with Theriak/Domino software: American Mineralogist, v. 95,p. 1006–1016, https://doi.org/10.2138/am.2010.3354.
Diener, J.F.A., and Fagereng, Å., 2014, The influence of melting and melt drainageon crustal rheology during orogenesis: Journal of Geophysical Research, v. 119,p. 6193–6210, https://doi.org/10.1002/2014JB011088.
Dragovic, B., Guevara, V.E., Caddick, M.J., Baxter, E.F., and Kylander-Clark, A.R.C.,2016, A pulse of cryptic granulite-facies metamorphism in the ArcheanWyoming Craton revealed by Sm–Nd garnet and U–Pb monazite geochronol-ogy: Precambrian Research, v. 283, p. 24–49, https://doi.org/10.1016/j.pre-camres.2016.07.010.
Duc-Tin, Q., and Keppler, H., 2015, Monazite and xenotime solubility in graniticmelts and the origin of the lanthanide tetrad effect: Contributions to Mineralo-gy and Petrology, v. 169, Article 8, https://doi.org/10.1007/s00410-014-1100-9.
Elmer, F.L., Powell, R., White, R.W., and Phillips, G.N., 2007, Timing of gold min-eralization relative to the peak of metamorphism at Bronzewing, Western Aus-tralia: Economic Geology, v. 102, p. 379–392, https://doi.org/10.2113/gsecon-geo.102.3.379.
Elmer, F.L., Dugdale, A.L., and Wilson, C.J.L., 2008, Application of mineral equilib-ria modeling to constrain T and XCO2 conditions during the evolution of theMagdala gold deposit, Stawell, Victoria, Australia: Mineralium Deposita, v. 43,p. 759–776, https://doi.org/10.1007/s00126-008-0192-4.
England, P.C., and Thompson, A.B., 1984, Pressure–Temperature–Time paths ofregional metamorphism I. Heat transfer during the evolution of regions ofthickened continental crust: Journal of Petrology, v. 25, p. 894–928,https://doi.org/10.1093/petrology/25.4.894.
Evans, K.A., and Powell, R., 2015, The effect of subduction on the sulphur, carbonand redox budget of lithospheric mantle: Journal of Metamorphic Geology, v.33, p. 649–670, https://doi.org/10.1111/jmg.12140.
Evans, K.A., Powell, R., and Holland, T.J.B., 2010, Internally consistent data for sul-phur-bearing phases and application to the construction of pseudosections formafic greenschist facies rocks in Na2O–CaO–K2O–FeO–MgO–Al2O3–SiO2–CO2–O–S–H2O: Journal of Metamorphic Geology, v. 28, p. 667–687,https://doi.org/10.1111/j.1525-1314.2010.00890.x.
Evans, K.A., Powell, R., and Frost, B.R., 2013, Using equilibrium thermodynamicsin the study of metasomatic alteration, illustrated by an application to serpen-tinites: Lithos, v. 168–169, p. 67–84, https://doi.org/10.1016/j.lithos.2013.01.016.
Everett, M.E., 2013, Near-surface applied geophysics: Cambridge University Press,Cambridge, 415 p., https://doi.org/10.1017/CBO9781139088435.
Fagereng, Å., and Diener, J.F.A., 2011, San Andreas Fault tremor and retrogrademetamorphism: Geophysical Research Letters, v. 38, L23303, https://doi.org/10.1029/2011GL049550.
Frey, M., de Capitani, C., and Liou, J.G., 1991, A new petrogenetic grid for low-grademetabasites: Journal of Metamorphic Geology, v. 9, p. 497–509,https://doi.org/10.1111/j.1525-1314.1991.tb00542.x.
Gaidies, F., de Capitani, C., and Abart, R., 2008, THERIA_G: a software programto numerically model prograde garnet growth: Contributions to Mineralogy andPetrology, v. 155, p. 657–671, https://doi.org/10.1007/s00410-007-0263-z.
Gaidies, F., Pattison, D.R.M., and de Capitani, C., 2011, Toward a quantitative modelof metamorphic nucleation and growth: Contributions to Mineralogy andPetrology, v. 162, Article 975, https://doi.org/10.1007/s00410-011-0635-2.
Getsinger, A.J., Hirth, G., Stünitz, H., and Goergen, E.T., 2013, Influence of wateron rheology and strain localization in the lower continental crust: Geochem-istry, Geophysics, Geosystems, v. 14, p. 2247–2264, https://doi.org/10.1002/ggge.20148.
Green, E.C.R., White, R.W., Diener, J.F.A., Powell, R., Holland, T.J.B., and Palin,R.M., 2016, Activity–composition relations for the calculation of partial meltingequilibria in metabasic rocks: Journal of Metamorphic Geology, v. 34, p. 845–869, https://doi.org/10.1111/jmg.12211.
Groppo, C., Rolfo, F., Castelli, D., and Connolly, J.A.D., 2013, Metamorphic CO2
production from calc-silicate rocks via garnet-forming reactions in the CFAS–H2O–CO2 system: Contributions to Mineralogy and Petrology, v. 166, p. 1655–1675, https://doi.org/10.1007/s00410-013-0947-5.
Guevara, V.E., and Caddick, M.J., 2016, Shooting at a moving target: phase equilibriamodelling of high-temperature metamorphism: Journal of Metamorphic Geol-ogy, v. 34, p. 209–235, https://doi.org/10.1111/jmg.12179.
Guilmette, C., Indares, A., and Hébert, R., 2011, High-pressure anatectic paragneiss-
42 Chris Yakymchuk
http://www.geosciencecanada.ca
es from the Namche Barwa, Eastern Himalayan Syntaxis: Textural evidence forpartial melting, phase equilibria modeling and tectonic implications: Lithos, v.124, p. 66–81, https://doi.org/10.1016/j.lithos.2010.09.003.
Guiraud, M., and Powell, R., 2006, P–V–T relationships and mineral equilibria ininclusions in minerals: Earth and Planetary Science Letters, v. 244, p. 683–694,https://doi.org/10.1016/j.epsl.2006.02.021.
Harrison, K.P., and Grimm, R.E., 2010, Thermal constraints on the early history ofthe H-chondrite parent body reconsidered: Geochimica et Cosmochimica Acta,v. 74, p. 5410–5423, https://doi.org/10.1016/j.gca.2010.05.034.
Helgeson, H.C., Delany, J.M., Nesbitt, H.W., and Bird, D.K., 1978, Summary and cri-tique of the thermodynamic properties of rock-forming minerals: AmericanJournal of Science, v. 278, p. 1–229.
Hensen, B.J., 1971, Theoretical phase relations involving cordierite and garnet in thesystem MgO–FeO–Al2O3–SiO2: Contributions to Mineralogy and Petrology, v.33, p. 191–214, https://doi.org/10.1007/BF00374063.
Holland, T.J.B., and Powell, R., 1998, An internally consistent thermodynamic dataset for phases of petrological interest: Journal of Metamorphic Geology, v. 16,p. 309–343, https://doi.org/10.1111/j.1525-1314.1998.00140.x.
Holland, T.J.B., and Powell, R., 2011, An improved and extended internally consis-tent thermodynamic dataset for phases of petrological interest, involving a newequation of state for solids: Journal of Metamorphic Geology, v. 29, p. 333–383, https://doi.org/10.1111/j.1525-1314.2010.00923.x.
Holland, T.J.B., Hudson, N.F.C., Powell, R., and Harte, B., 2013, New thermodynam-ic models and calculated phase equilibria in NCFMAS for basic and ultrabasiccompositions through the transition zone into the uppermost lower mantle:Journal of Petrology, v. 54, p. 1901–1920, https://doi.org/10.1093/petrology/egt035.
Indares, A., and Martignole, J., 1985, Biotite-garnet geothermometry in granulite-facies rocks; evaluation of equilibrium criteria: The Canadian Mineralogist, v.23, p. 187–193.
Indares, A., White, R.W., and Powell, R., 2008, Phase equilibria modelling of kyan-ite-bearing anatectic paragneisses from the central Grenville Province: Journalof Metamorphic Geology, v. 26, p. 815–836, https://doi.org/10.1111/j.1525-1314.2008.00788.x.
Ito, E., Takahashi, E., and Matsui, Y., 1984, The mineralogy and chemistry of thelower mantle: an implication of the ultrahigh-pressure phase relations in thesystem MgO–FeO–SiO2: Earth and Planetary Science Letters, v. 67, p. 238–248,https://doi.org/10.1016/0012-821X(84)90119-5.
Jamieson, R.A., Beaumont, C., Hamilton, J., and Fullsack, P., 1996, Tectonic assem-bly of inverted metamorphic sequences: Geology, v. 24, p. 839–842,https://doi.org/10.1130/0091-7613(1996)024<0839:TAOIMS>2.3.CO;2.
Jamieson, R.A., Beaumont, C., Fullsack, P., and Lee, B., 1998, Barrovian regionalmetamorphism: where’s the heat?, in Treloar, P.J., and O’Brien, P.J., eds., WhatDrives Metamorphism and Metamorphic Reactions?: Geological Society, Lon-don, Special Publications, v. 138, p. 23–51, https://doi.org/10.1144/GSL.SP.1996.138.01.03.
Jamieson, R.A., Beaumont, C., Medvedev, S., and Nguyen, M.H., 2004, Crustal chan-nel flows: 2. Numerical models with implications for metamorphism in theHimalayan-Tibetan orogen: Journal of Geophysical Research, v. 109, B06407,https://doi.org/10.1029/2003JB002811.
Jamieson, R.A., Beaumont, C., Warren, C.J., and Nguyen, M.H., 2010, The GrenvilleOrogen explained? Applications and limitations of integrating numerical mod-els with geological and geophysical data: Canadian Journal of Earth Sciences, v.47, p. 517–539, https://doi.org/10.1139/E09-070.
Jeanneret, P., Goncalves, P., Durand, C., Trap, P., Marquer, D., Quirt, D., and Ledru,P., 2016, Tectono-metamorphic evolution of the pre-Athabasca basement with-in the Wollaston–Mudjatik Transition Zone, Saskatchewan: Canadian Journal ofEarth Sciences, v. 53, p. 231–259, https://doi.org/10.1139/cjes-2015-0136.
Jennings, E.S., and Holland, T.J.B., 2015, A simple thermodynamic model for melt-ing of peridotite in the system NCFMASOCr: Journal of Petrology, v. 56, p.869–892, https://doi.org/10.1093/petrology/egv020.
Johnson, T.E., White, R.W., and Powell, R., 2008, Partial melting of metagreywacke:a calculated mineral equilibria study: Journal of Metamorphic Geology, v. 26, p.837–853, https://doi.org/10.1111/j.1525-1314.2008.00790.x.
Johnson, T.E., Benedix, G.K., and Bland, P.A., 2016, Metamorphism and partialmelting of ordinary chondrites: Calculated phase equilibria: Earth and PlanetaryScience Letters, v. 433, p. 21–30, https://doi.org/10.1016/j.epsl.2015.10.035.
Kelemen, P.B., and Hirth, G., 2012, Reaction-driven cracking during retrogrademetamorphism: Olivine hydration and carbonation: Earth and Planetary Sci-ence Letters, v. 345–348, p. 81–89, https://doi.org/10.1016/j.epsl.2012.06.018.
Kelly, E.D., Carlson, W.D., and Ketcham, R.A., 2013, Magnitudes of departuresfrom equilibrium during regional metamorphism of porphyroblastic rocks:Journal of Metamorphic Geology, v. 31, p. 981–1002, https://doi.org/10.1111/
jmg.12053.Kelsey, D.E., and Hand, M., 2015, On ultrahigh temperature crustal metamorphism:
Phase equilibria, trace element thermometry, bulk composition, heat sources,timescales and tectonic settings: Geoscience Frontiers, v. 6, p. 311–356,https://doi.org/10.1016/j.gsf.2014.09.006.
Kelsey, D.E., and Powell, R., 2011, Progress in linking accessory mineral growth andbreakdown to major mineral evolution in metamorphic rocks: a thermodynamicapproach in the Na2O–CaO–K2O–FeO–MgO–Al2O3–SiO2–H2O–TiO2–ZrO2
system: Journal of Metamorphic Geology, v. 29, p. 151–166, https://doi.org/10.1111/j.1525-1314.2010.00910.x.
Kelsey, D.E., Clark, C., and Hand, M., 2008, Thermobarometric modelling of zirconand monazite growth in melt-bearing systems: examples using modelmetapelitic and metapsammitic granulites: Journal of Metamorphic Geology, v.26, p. 199–212, https://doi.org/10.1111/j.1525-1314.2007.00757.x.
Kohn, M.J., and Spear, F., 2000, Retrograde net transfer reaction insurance for pres-sure-temperature estimates: Geology, v. 28, p. 1127–1130, https://doi.org/10.1130/0091-7613(2000)28<1127:RNTRIF>2.0.CO;2.
Kohn, M.J., Corrie, S.L., and Markley, C., 2015, The fall and rise of metamorphic zir-con: American Mineralogist, v. 100, p. 897–908, https://doi.org/10.2138/am-2015-5064.
Korhonen, F.J., Powell, R., and Stout, J.H., 2012, Stability of sapphirine + quartz inthe oxidized rocks of the Wilson Lake terrane, Labrador: calculated equilibriain NCKFMASHTO: Journal of Metamorphic Geology, v. 30, p. 21–36,https://doi.org/10.1111/j.1525-1314.2011.00954.x.
Lasalle, S., and Indares, A., 2014, Anatectic record and contrasting P–T paths of alu-minous gneisses from the central Grenville Province: Journal of MetamorphicGeology, v. 32, p. 627–646, https://doi.org/10.1111/jmg.12083.
Mahar, E.M., Baker, J.M., Powell, R., Holland, T.J.B., and Howell, N., 1997, Theeffect of Mn on mineral stability in metapelites: Journal of Metamorphic Geol-ogy, v. 15, p. 223–238, https://doi.org/10.1111/j.1525-1314.1997.00011.x.
Mayne, M.J., Moyen, J.-F., Stevens, G., and Kaislaniemi, L., 2016, Rcrust: a tool forcalculating path-dependent open system processes and application to melt loss:Journal of Metamorphic Geology, v. 34, p. 663–682, https://doi.org/10.1111/jmg.12199.
McSween Jr., H.Y., and Labotka, T.C., 1993, Oxidation during metamorphism of theordinary chondrites: Geochimica et Cosmochimica Acta, v. 57, p. 1105–1114,https://doi.org/10.1016/0016-7037(93)90044-W.
Morrissey, L.J., Hand, M., Lane, K., Kelsey, D.E., and Dutch, R.A., 2016, Upgradingiron-ore deposits by melt loss during granulite facies metamorphism: Ore Geol-ogy Reviews, v. 74, p. 101–121, https://doi.org/10.1016/j.oregeorev.2015.11.012.
Mottram, C.M., Warren, C.J., Regis, D., Roberts, N.M.W., Harris, N.B.W., Argles,T.W., and Parrish, R.R., 2014, Developing an inverted Barrovian sequence;insights from monazite petrochronology: Earth and Planetary Science Letters,v. 403, p. 418–431, https://doi.org/10.1016/j.epsl.2014.07.006.
Moynihan, D.P., and Pattison, D.R.M., 2013, An automated method for the calcula-tion of P–T paths from garnet zoning, with application to metapelitic schistfrom the Kootenay Arc, British Columbia, Canada: Journal of MetamorphicGeology, v. 31, p. 525–548, https://doi.org/10.1111/jmg.12032.
O’Brien, P.J., 2008, Challenges in high-pressure granulite metamorphism in the eraof pseudosections: reaction textures, compositional zoning and tectonic inter-pretation with examples from the Bohemian Massif: Journal of MetamorphicGeology, v. 26, p. 235–251, https://doi.org/10.1111/j.1525-1314.2007.00758.x.
Palin, R.M., Weller, O.M., Waters, D.J., and Dyck, B., 2016a, Quantifying geologicaluncertainty in metamorphic phase equilibria modelling; a Monte Carlo assess-ment and implications for tectonic interpretations: Geoscience Frontiers, v. 7,p. 591–607, https://doi.org/10.1016/j.gsf.2015.08.005.
Palin, R.M., White, R.W., Green, E.C.R., Diener, J.F.A., Powell, R., and Holland,T.J.B., 2016b, High-grade metamorphism and partial melting of basic and inter-mediate rocks: Journal of Metamorphic Geology, v. 34, p. 871–892,https://doi.org/10.1111/jmg.12212.
Pattison, D., and Harte, B., 1985, A petrogenetic grid for pelites in the Ballachulishand other Scottish thermal aureoles: Journal of the Geological Society, v. 142,p. 7–28, https://doi.org/10.1144/gsjgs.142.1.0007.
Pattison, D.R.M., and Bégin, N.J., 1994, Zoning patterns in orthopyroxene and gar-net in granulites: implications for geothermometry: Journal of MetamorphicGeology, v. 12, p. 387–410, https://doi.org/10.1111/j.1525-1314.1994.tb00031.x.
Pattison, D.R.M., and DeBuhr, C.L., 2015, Petrology of metapelites in the Bugabooaureole, British Columbia, Canada: Journal of Metamorphic Geology, v. 33, p.437–462, https://doi.org/10.1111/jmg.12128.
Pattison, D.R.M., and Seitz, J.D., 2012, Stabilization of garnet in metamorphosedaltered turbidites near the St. Eugene lead–zinc deposit, southeastern British
GEOSCIENCE CANADA Volume 44 2017 43
https://doi.org/10.12789/geocanj.2017.44.114
Columbia: Equilibrium and kinetic controls: Lithos, v. 134–135, p. 221–235,https://doi.org/10.1016/j.lithos.2011.12.007.
Pattison, D.R.M., and Tinkham, D.K., 2009, Interplay between equilibrium andkinetics in prograde metamorphism of pelites: an example from the Nelsonaureole, British Columbia: Journal of Metamorphic Geology, v. 27, p. 249–279,https://doi.org/10.1111/j.1525-1314.2009.00816.x.
Pattison, D.R.M., Spear, F.S., Debuhr, C.L., Cheney, J.T., and Guidotti, C.V., 2002,Thermodynamic modelling of the reaction muscovite+cordierite→Al2SiO5+biotite+quartz+ H2O: constraints from natural assemblages and impli-cations for the metapelitic petrogenetic grid: Journal of Metamorphic Geology,v. 20, p. 99–118, https://doi.org/10.1046/j.0263-4929. 2001.356.356.x.
Pattison, D.R.M., Chacko, T., Farquhar, J., and McFarlane, C.R.M., 2003, Tempera-tures of granulite-facies metamorphism: Constraints from experimental phaseequilibria and thermobarometry corrected for retrograde exchange: Journal ofPetrology, v. 44, p. 867–900, https://doi.org/10.1093/petrology/44.5.867.
Pattison, D.R.M., de Capitani, C., and Gaidies, F., 2011, Petrological consequencesof variations in metamorphic reaction affinity: Journal of Metamorphic Geol-ogy, v. 29, p. 953–977, https://doi.org/10.1111/j.1525-1314.2011.00950.x.
Pearce, M.A., White, A.J.R., and Gazley, M.F., 2015a, TCInvestigator: automated cal-culation of mineral mode and composition contours for THERMOCALC pseudo-sections: Journal of Metamorphic Geology, v. 33, p. 413–425, https://doi.org/10.1111/jmg.12126.
Pearce, M.A., White, A.J.R., Fisher, L.A., Hough, R.M., and Cleverley, J.S., 2015b,Gold deposition caused by carbonation of biotite during late-stage fluid flow:Lithos, v. 239, p. 114–127, https://doi.org/10.1016/j.lithos.2015.10.010.
Phillips, G.N., and Powell, R., 2010, Formation of gold deposits: a metamorphicdevolatilization model: Journal of Metamorphic Geology, v. 28, p. 689–718,https://doi.org/10.1111/j.1525-1314.2010.00887.x.
Powell, R., 1978, Equilibrium Thermodynamics in Petrology, An Introduction:Harper & Row Ltd, London, 284 p.
Powell, R., 1985, Geothermometry and geobarometry: a discussion: Journal of theGeological Society, v. 142, p. 29–38, https://doi.org/10.1144/gsjgs.142.1.0029.
Powell, R., 1991, Metamorphic Mineral Equilibria Short Course: Course Notes: Uni-versity of Melbourne. Available from: http://www.metamorph.geo.uni-mainz.de/thermocalc/documentation/introphasediagrams/index.html.
Powell, R., and Holland, T.J.B., 1988, An internally consistent dataset with uncertain-ties and correlations: 3. Applications to geobarometry, worked examples and acomputer program: Journal of Metamorphic Geology, v. 6, p. 173–204,https://doi.org/10.1111/j.1525-1314.1988.tb00415.x.
Powell, R., and Holland, T.J.B., 2008, On thermobarometry: Journal of Metamor-phic Geology, v. 26, p. 155–179, https://doi.org/10.1111/j.1525-1314.2007.00756.x.
Powell, R., Holland, T., and Worley, B., 1998, Calculating phase diagrams involvingsolid solutions via non-linear equations, with examples using THERMOCALC:Journal of Metamorphic Geology, v. 16, p. 577–588, https://doi.org/10.1111/j.1525-1314.1998.00157.x.
Powell, R., Guiraud, M., and White, R.W., 2005, Truth and beauty in metamorphicphase-equilibria: conjugate variables and phase diagrams: The Canadian Miner-alogist, v. 43, p. 21–33, https://doi.org/10.2113/gscanmin.43.1.21.
Ridley, J., and Thompson, A.B., 1986, The role of mineral kinetics in the develop-ment of metamorphic microtexture, in Walther, J.V., and Wood, B.J., eds., Fluid-Rock Interactions During Metamorphism: Springer, New York, p. 154–193.
Riesco, M., Stüwe, K., Reche, J., and Martinez, F.J., 2004, Silica depleted melting ofpelites. Petrogenetic grid and application to the Susqueda Aureole, Spain: Jour-nal of Metamorphic Geology, v. 22, p. 475–494, https://doi.org/10.1111/j.1525-1314.2004.00527.x.
Riesco, M., Stüwe, K., and Reche, J., 2005, Formation of corundum in metapelitesaround ultramafic bodies. An example from the Saualpe region, Eastern Alps:Mineralogy and Petrology, v. 83, p. 1–25, https://doi.org/10.1007/s00710-004-0062-4.
Rosenberg, C.L., and Handy, M.R., 2005, Experimental deformation of partiallymelted granite revisited: implications for the continental crust: Journal of Meta-morphic Geology, v. 23, p. 19–28, https://doi.org/10.1111/j.1525-1314.2005.00555.x.
Rubatto, D., Williams, I.S., and Buick, I.S., 2001, Zircon and monazite response toprograde metamorphism in the Reynolds Range, central Australia: Contribu-tions to Mineralogy and Petrology, v. 140, p. 458–468, https://doi.org/10.1007/PL00007673.
Rubie, D.C., 1998, Disequilibrium during metamorphism: the role of nucleationkinetics, in Treloar, P.J., and O’Brien, P.J., eds., What Drives Metamorphism andMetamorphic Reactions?: Geological Society, London, Special Publications, v.138, p. 199–214, https://doi.org/10.1144/GSL.SP.1996.138.01.12.
Schaltegger, U., 2007, Hydrothermal Zircon: Elements, v. 3, p. 51–79,
https://doi.org/10.2113/gselements.3.1.51.Skora, S., Blundy, J.D., Brooker, R.A., Green, E.C.R., de Hoog, J.C.M., and Connolly,
J.A.D., 2015, Hydrous phase relations and trace element partitioning behaviourin calcareous sediments at subduction-zone conditions: Journal of Petrology, v.56, p. 953–980, https://doi.org/10.1093/petrology/egv024.
Spear, F.S., 1995, Metamorphic phase equilibria and Pressure–Temperature–Timepaths: Mineralogical Society of America, Washington, DC, 799 p.
Spear, F.S., 2010, Monazite–allanite phase relations in metapelites: Chemical Geolo-gy, v. 279, p. 55–62, https://doi.org/10.1016/j.chemgeo.2010.10.004.
Spear, F.S., and Cheney, J.T., 1989, A petrogenetic grid for pelitic schists in the sys-tem SiO2–Al2O3–FeO–MgO–K2O–H2O: Contributions to Mineralogy andPetrology, v. 101, p. 149–164, https://doi.org/10.1007/BF00375302.
Spear, F.S., and Florence, F.P., 1992, Thermobarometry in granulites: pitfalls and newapproaches: Precambrian Research, v. 55, p. 209–241, https://doi.org/10.1016/0301-9268(92)90025-J.
Spear, F.S., and Pyle, J.M., 2010, Theoretical modeling of monazite growth in a low-Ca metapelite: Chemical Geology, v. 273, p. 111–119, https://doi.org/10.1016/j.chemgeo.2010.02.016.
Spear, F.S., Kohn, M.J., and Cheney, J.T., 1999, P –T paths from anatectic pelites:Contributions to Mineralogy and Petrology, v. 134, p. 17–32, https://doi.org/10.1007/s004100050466.
Spear, F.S., Pattison, D.R.M., and Cheney, J.T., 2016, The metamorphosis of meta-morphic petrology: Geological Society of America Special Papers, v. 523, p.SPE523-02, https://doi.org/10.1130/2016.2523(02).
Stepanov, A.S., Hermann, J., Rubatto, D., and Rapp, R.P., 2012, Experimental studyof monazite/melt partitioning with implications for the REE, Th and U geo-chemistry of crustal rocks: Chemical Geology, v. 300–301, p. 200–220,https://doi.org/10.1016/j.chemgeo.2012.01.007.
Stevens, L.M., Baldwin, J.A., Cottle, J.M., and Kylander-Clark, A.R.C., 2015, Phaseequilibria modelling and LASS monazite petrochronology: P–T–t constraintson the evolution of the Priest River core complex, northern Idaho: Journal ofMetamorphic Geology, v. 33, p. 385–411, https://doi.org/10.1111/jmg.12125.
Stixrude, L., and Lithgow-Bertelloni, C., 2005, Thermodynamics of mantle minerals— I. Physical properties: Geophysical Journal International, v. 162, p. 610–632,https://doi.org/10.1111/j.1365-246X.2005.02642.x.
Stixrude, L., and Lithgow-Bertelloni, C., 2007, Influence of phase transformationson lateral heterogeneity and dynamics in Earth’s mantle: Earth and PlanetaryScience Letters, v. 263, p. 45–55, https://doi.org/10.1016/j.epsl.2007.08.027.
Stixrude, L., and Lithgow-Bertelloni, C., 2011, Thermodynamics of mantle minerals- II. Phase equilibria: Geophysical Journal International, v. 184, p. 1180–1213,https://doi.org/10.1111/j.1365-246X.2010.04890.x.
Stüwe, K., and Powell, R., 1995, PT Paths from modal proportions: application tothe Koralm Complex, Eastern Alps: Contributions to Mineralogy and Petrolo-gy, v. 119, p. 83–93, https://doi.org/10.1007/BF00310719.
Symmes, G.H., and Ferry, J.M., 1992, The effect of whole-rock MnO content on thestability of garnet in pelitic schists during metamorphism: Journal of Metamor-phic Geology, v. 10, p. 221–237, https://doi.org/10.1111/j.1525-1314.1992.tb00080.x.
Thompson, A.B., and Algor, J.R., 1977, Model systems for anatexis of pelitic rocks:Contributions to Mineralogy and Petrology, v. 63, p. 247–269, https://doi.org/10.1007/BF00375575.
Thompson, A.B., and England, P.C., 1984, Pressure—Temperature—Time paths ofregional metamorphism II. Their inference and interpretation using mineralassemblages in metamorphic rocks: Journal of Petrology, v. 25, p. 929–955,https://doi.org/10.1093/petrology/25.4.929.
Thompson, A.B., and Tracy, R.J., 1979, Model systems for anatexis of pelitic rocks:Contributions to Mineralogy and Petrology, v. 70, p. 429–438, https://doi.org/10.1007/BF00371049.
Thompson, J.B., 1957, The graphical analysis of mineral assemblages in peliticschists: American Mineralogist, v. 42, p. 842–858.
Tinkham, D.K., and Ghent, E.D., 2005, Estimating P–T conditions of garnetgrowth with isochemical phase-diagram sections and the problem of effectivebulk-composition: The Canadian Mineralogist, v. 43, p. 35–50,https://doi.org/10.2113/gscanmin.43.1.35.
Tinkham, D.K., Zuluaga, C.A., and Stowell, H.H., 2003, Metapelite phase equilibriamodeling in MnNCKFMASH: The effect of variable Al2O3 and MgO/(MgO +FeO) on mineral stability: American Mineralogist, v. 88, p. 1174–1174.
Tomkins, A.G., and Evans, K.A., 2015, Separate zones of sulfate and sulfide releasefrom subducted mafic oceanic crust: Earth and Planetary Science Letters, v.428, p. 73–83, https://doi.org/10.1016/j.epsl.2015.07.028.
Vernon, R.H., and Clarke, G.L., 2008, Principles of Metamorphic Petrology: Cam-bridge University Press, 478 p.
Vernon, R.H., White, R.W., and Clarke, G.L., 2008, False metamorphic events
44 Chris Yakymchuk
http://www.geosciencecanada.ca
inferred from misinterpretation of microstructural evidence and P–T data:Journal of Metamorphic Geology, v. 26, p. 437–449, https://doi.org/10.1111/j.1525-1314.2008.00762.x.
Vigneresse, J.L., and Burg, J.P., 2000, Continuous vs. discontinuous melt segregationin migmatites: insights from a cellular automaton model: Terra Nova, v. 12, p.188–192, https://doi.org/10.1046/j.1365-3121.2000.00299.x.
Vry, J.K., Powell, R., and Williams, J., 2008, Establishing the P–T path for AlpineSchist, Southern Alps near Hokitika, New Zealand: Journal of MetamorphicGeology, v. 26, p. 81–97, https://doi.org/10.1111/j.1525-1314.2007.00746.x.
Waters, D.J., and Lovegrove, D.P., 2002, Assessing the extent of disequilibrium andoverstepping of prograde metamorphic reactions in metapelites from theBushveld Complex aureole, South Africa: Journal of Metamorphic Geology, v.20, p. 135–149, https://doi.org/10.1046/j.0263-4929.2001.00350.x.
White, A.J.R., Waters, D.J., and Robb, L.J., 2013, The application of P–T–X(CO2)modelling in constraining metamorphism and hydrothermal alteration at theDamang gold deposit, Ghana: Journal of Metamorphic Geology, v. 31, p. 937–961, https://doi.org/10.1111/jmg.12051.
White, A.J.R., Legras, M., Smith, R.E., and Nadoll, P., 2014c, Deformation-driven,regional-scale metasomatism in the Hamersley Basin, Western Australia: Journalof Metamorphic Geology, v. 32, p. 417–433, https://doi.org/10.1111/jmg.12078.
White, R.W., and Powell, R., 2002, Melt loss and the preservation of granulite faciesmineral assemblages: Journal of Metamorphic Geology, v. 20, p. 621–632,https://doi.org/10.1046/j.1525-1314.2002.00206_20_7.x.
White, R.W., Powell, R., and Phillips, G.N., 2003, A mineral equilibria study of thehydrothermal alteration in mafic greenschist facies rocks at Kalgoorlie, WesternAustralia: Journal of Metamorphic Geology, v. 21, p. 455–468,https://doi.org/10.1046/j.1525-1314.2003.00454.x.
White, R.W., Powell, R., and Halpin, J.A., 2004, Spatially-focussed melt formation inaluminous metapelites from Broken Hill, Australia: Journal of MetamorphicGeology, v. 22, p. 825–845, https://doi.org/10.1111/j.1525-1314.2004.00553.x.
White, R.W., Pomroy, N.E., and Powell, R., 2005, An in situ metatexite–diatexite tran-sition in upper amphibolite facies rocks from Broken Hill, Australia: Journal ofMetamorphic Geology, v. 23, p. 579–602, https://doi.org/10.1111/j.1525-1314.2005.00597.x.
White, R.W., Powell, R., and Holland, T.J.B., 2007, Progress relating to calculation ofpartial melting equilibria for metapelites: Journal of Metamorphic Geology, v.25, p. 511–527, https://doi.org/10.1111/j.1525-1314.2007.00711.x.
White, R.W., Powell, R., Holland, T.J.B., Johnson, T.E., and Green, E.C.R., 2014a,New mineral activity–composition relations for thermodynamic calculations inmetapelitic systems: Journal of Metamorphic Geology, v. 32, p. 261–286,https://doi.org/10.1111/jmg.12071.
White, R.W., Powell, R., and Johnson, T.E., 2014b, The effect of Mn on mineral sta-bility in metapelites revisited: new a–x relations for manganese-bearing miner-als: Journal of Metamorphic Geology, v. 32, p. 809–828, https://doi.org/10.1111/jmg.12095.
Whitney, D.L., Teyssier, C., Rey, P., and Buck, W.R., 2013, Continental and oceaniccore complexes: Geological Society of America Bulletin, v. 125, p. 273–298,https://doi.org/10.1130/B30754.1.
Will, T.M., Powell, R., and Holland, T.J.B., 1990, A calculated petrogenetic grid forultramafic rocks in the system CaO–FeO–MgO–Al2O3–SiO2–CO2–H2O at lowpressures: Contributions to Mineralogy and Petrology, v. 105, p. 347–358,https://doi.org/10.1007/BF00306544.
Wing, B.A., Ferry, J.M., and Harrison, T.M., 2003, Prograde destruction and forma-tion of monazite and allanite during contact and regional metamorphism ofpelites: petrology and geochronology: Contributions to Mineralogy and Petrol-ogy, v. 145, p. 228–250, https://doi.org/10.1007/s00410-003-0446-1.
Yakymchuk, C., 2017, Behaviour of apatite during partial melting of metapelites andconsequences for prograde suprasolidus monazite growth: Lithos, v. 274–275,p. 421–426, https://doi.org/10.1016/j.lithos.2017.01.009.
Yakymchuk, C., and Brown, M., 2014a, Consequences of open-system melting intectonics: Journal of the Geological Society, v. 171, p. 21–40,https://doi.org/10.1144/jgs2013-039.
Yakymchuk, C., and Brown, M., 2014b, Behaviour of zircon and monazite duringcrustal melting: Journal of the Geological Society, v. 171, p. 465–479,https://doi.org/10.1144/jgs2013-115.
Yakymchuk, C., Brown, M., Clark, C., Korhonen, F.J., Piccoli, P.M., Siddoway, C.S.,Taylor, R.J.M., and Vervoort, J.D., 2015, Decoding polyphase migmatites usinggeochronology and phase equilibria modelling: Journal of Metamorphic Geol-ogy, v. 33, p. 203–230, https://doi.org/10.1111/jmg.12117.
Yakymchuk, C., Clark, C., and White, R.W., 2017, Phase relations, reaction sequencesand petrochronology: Reviews in Mineralogy and Geochemistry, (in press),https://doi.org/10.2138/rmg.2017.83.2.
Zen, E-A., 1966, Construction of pressure-temperature diagrams for multicompo-nent systems after the method of Schreinemakers–A geometric approach:USGS Bulletin 1225, 56 p.
Zuluaga, C.A., Stowell, H.H., and Tinkham, D.K., 2005, The effect of zoned garneton metapelite pseudosection topology and calculated metamorphic P–T paths:American Mineralogist, v. 90, p. 1619–1628, https://doi.org/10.2138/am.2005.1741.
Received November 2016Accepted as revised February 2017First published on the web February 2017
GEOSCIENCE CANADA Volume 44 2017 45
https://doi.org/10.12789/geocanj.2017.44.114

46
http://www.geosciencecanada.ca
�������������������������� �����������������������������������������
����������������������������������������������� �������������������������������!����������������
���������������������������������������"��������������������������#
��������� ���� ���$�������%�"&%�'()*�����������������
+�����,�%�-�%�'().������ ����
���!"��#��$�%�"� $���������������
���$� ����&'��&#��# ��#� /���������
0�0���������������1� �0����&�������2��0�����������������
����3������0�������������4���5,���������1���6������2�����������4���
���������������7
�"!!����"����&$(*(8�.9#�*99(���:������
)))�������