reversal of phenotypes in mecp2 duplication mice using ...human oestrogen receptor (ubc-cre/ert2)....
TRANSCRIPT
0 0 M o n t h 2 0 1 5 | V o L 0 0 0 | n A t U R E | 1© 2015 Macmillan Publishers Limited. All rights reserved
LEttERdoi:10.1038/nature16159
Reversal of phenotypes in MECP2 duplication mice using genetic rescue or antisense oligonucleotidesYehezkel Sztainberg1,2, hong-mei Chen3,4,5, John W. Swann3,4,5, Shuang hao2,5, Bin tang2,5, Zhenyu Wu2,5, Jianrong tang2,5, Ying-Wooi Wan2,6, Zhandong Liu2,5, Frank Rigo7 & huda Y. Zoghbi1,2,5,8
Copy number variations have been frequently associated with developmental delay, intellectual disability and autism spectrum disorders1. MECP2 duplication syndrome is one of the most common genomic rearrangements in males2 and is characterized by autism, intellectual disability, motor dysfunction, anxiety, epilepsy, recurrent respiratory tract infections and early death3–5. The broad range of deficits caused by methyl-CpG-binding protein 2 (MeCP2) overexpression poses a daunting challenge to traditional biochemical-pathway-based therapeutic approaches. Accordingly, we sought strategies that directly target MeCP2 and are amenable to translation into clinical therapy. The first question that we addressed was whether the neurological dysfunction is reversible after symptoms set in. Reversal of phenotypes in adult symptomatic mice has been demonstrated in some models of monogenic loss-of-function neurological disorders6–8, including loss of MeCP2 in Rett syndrome9, indicating that, at least in some cases, the neuroanatomy may remain sufficiently intact so that correction of the molecular dysfunction underlying these disorders can restore healthy physiology. Given the absence of neurodegeneration in MECP2 duplication syndrome, we propose that restoration of normal MeCP2 levels in MECP2 duplication adult mice would rescue their phenotype. By generating and characterizing a conditional Mecp2-overexpressing mouse model, here we show that correction of MeCP2 levels largely reverses the behavioural, molecular and electrophysiological deficits. We also reduced MeCP2 using an antisense oligonucleotide strategy, which has greater translational potential. Antisense oligonucleotides are small, modified nucleic acids that can selectively hybridize with messenger RNA transcribed from a target gene and silence it10,11, and have been successfully used to correct deficits in different mouse models12–18. We find that antisense oligonucleotide treatment induces a broad phenotypic rescue in adult symptomatic transgenic MECP2 duplication mice (MECP2-TG)19,20, and corrected MECP2 levels in lymphoblastoid cells from MECP2 duplication patients in a dose-dependent manner.
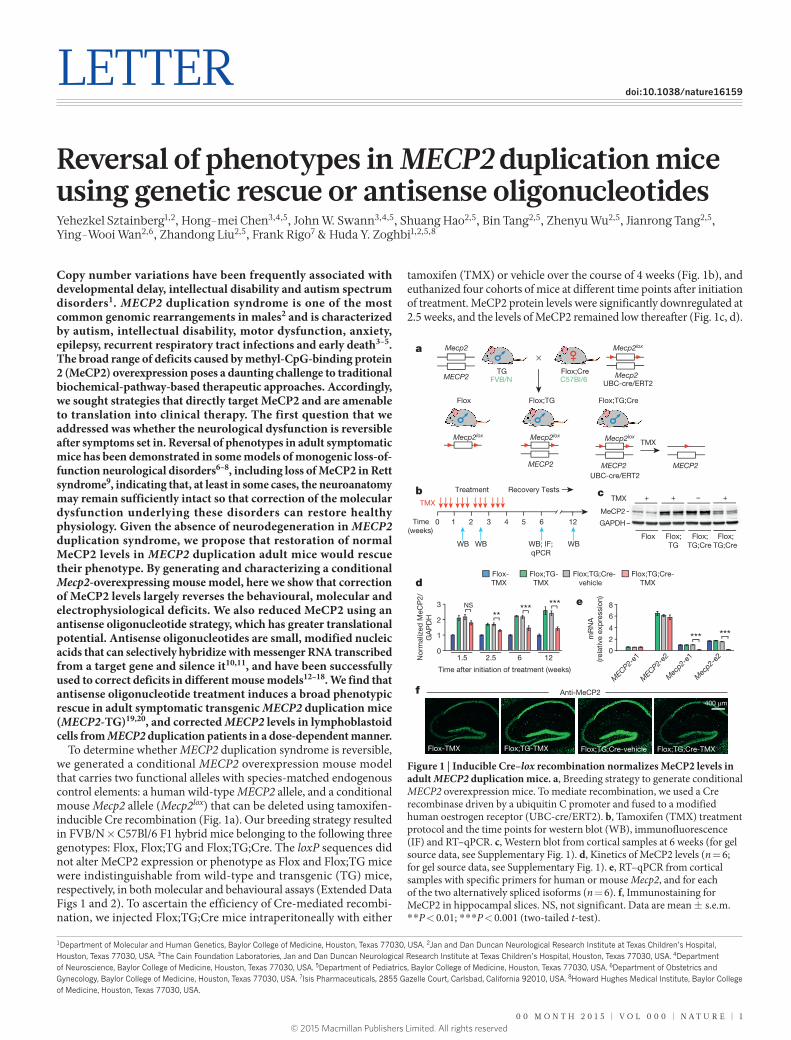
To determine whether MECP2 duplication syndrome is reversible, we generated a conditional MECP2 overexpression mouse model that carries two functional alleles with species-matched endogenous control elements: a human wild-type MECP2 allele, and a conditional mouse Mecp2 allele (Mecp2lox) that can be deleted using tamoxifen- inducible Cre recombination (Fig. 1a). Our breeding strategy resulted in FVB/N × C57Bl/6 F1 hybrid mice belonging to the following three genotypes: Flox, Flox;TG and Flox;TG;Cre. The loxP sequences did not alter MeCP2 expression or phenotype as Flox and Flox;TG mice were indistinguishable from wild-type and transgenic (TG) mice, respectively, in both molecular and behavioural assays (Extended Data Figs 1 and 2). To ascertain the efficiency of Cre-mediated recombi-nation, we injected Flox;TG;Cre mice intraperitoneally with either
tamoxifen (TMX) or vehicle over the course of 4 weeks (Fig. 1b), and euthanized four cohorts of mice at different time points after initiation of treatment. MeCP2 protein levels were significantly downregulated at 2.5 weeks, and the levels of MeCP2 remained low thereafter (Fig. 1c, d).
1Department of Molecular and Human Genetics, Baylor College of Medicine, Houston, Texas 77030, USA. 2Jan and Dan Duncan Neurological Research Institute at Texas Children’s Hospital, Houston, Texas 77030, USA. 3The Cain Foundation Laboratories, Jan and Dan Duncan Neurological Research Institute at Texas Children’s Hospital, Houston, Texas 77030, USA. 4Department of Neuroscience, Baylor College of Medicine, Houston, Texas 77030, USA. 5Department of Pediatrics, Baylor College of Medicine, Houston, Texas 77030, USA. 6Department of Obstetrics and Gynecology, Baylor College of Medicine, Houston, Texas 77030, USA. 7Isis Pharmaceuticals, 2855 Gazelle Court, Carlsbad, California 92010, USA. 8Howard Hughes Medical Institute, Baylor College of Medicine, Houston, Texas 77030, USA.
a
c
MeCP2
GAPDH
TMX + + – +
Flox Flox; TG
Flox; TG;Cre
Flox; TG;Cre
Flox- Flox;TG;Cre- Flox;TG;Cre- Flox;TG- TMX TMX TMX vehicle
Flox;CreC57Bl/6
×
FVB/N TG
Mecp2
MECP2
Mecp2lox
Mecp2UBC-cre/ERT2
Flox Flox;TG Flox;TG;Cre
Mecp2lox
MECP2
Mecp2lox Mecp2lox
MECP2
MECP2-
e1
MECP2-
e2
Mec
p2-e1
Mec
p2-e2
UBC-cre/ERT2
TMX
b Treatment Recovery Tests
Anti-MeCP2
Flox-TMX Flox;TG-TMX Flox;TG;Cre-TMX Flox;TG;Cre-vehicle
d
400 μm
e
*** ***
6 2.5
** ***
1.5
NS
12
***
f
MECP2
Time (weeks)
0 2 3 4 5 6 12 1
TMX
WB WB WB; IF; qPCR
WB
Time after initiation of treatment (weeks)
Nor
mal
ized
MeC
P2/
GA
PD
H
3
2
1
0
mR
NA
(r
elat
ive
exp
ress
ion)
8
6
4
2
0
Figure 1 | Inducible Cre–lox recombination normalizes MeCP2 levels in adult MECP2 duplication mice. a, Breeding strategy to generate conditional MECP2 overexpression mice. To mediate recombination, we used a Cre recombinase driven by a ubiquitin C promoter and fused to a modified human oestrogen receptor (UBC-cre/ERT2). b, Tamoxifen (TMX) treatment protocol and the time points for western blot (WB), immunofluorescence (IF) and RT–qPCR. c, Western blot from cortical samples at 6 weeks (for gel source data, see Supplementary Fig. 1). d, Kinetics of MeCP2 levels (n = 6; for gel source data, see Supplementary Fig. 1). e, RT–qPCR from cortical samples with specific primers for human or mouse Mecp2, and for each of the two alternatively spliced isoforms (n = 6). f, Immunostaining for MeCP2 in hippocampal slices. NS, not significant. Data are mean ± s.e.m. * *P < 0.01; * * *P < 0.001 (two-tailed t-test).
2 | n A t U R E | V o L 0 0 0 | 0 0 M o n t h 2 0 1 5
LetterreSeArCH
© 2015 Macmillan Publishers Limited. All rights reserved
Moreover, quantitative reverse transcription PCR (RT–qPCR) showed that Cre-mediated recombination efficiently downregulated mRNA levels of both alternatively spliced isoforms (Mecp2-e1 and Mecp2-e2) of the floxed mouse Mecp2, but not the human transgenic MECP2 allele (Fig. 1e). Finally, we confirmed the normalization of MeCP2 levels by immunofluorescence staining of hippocampal slices (Fig. 1f).
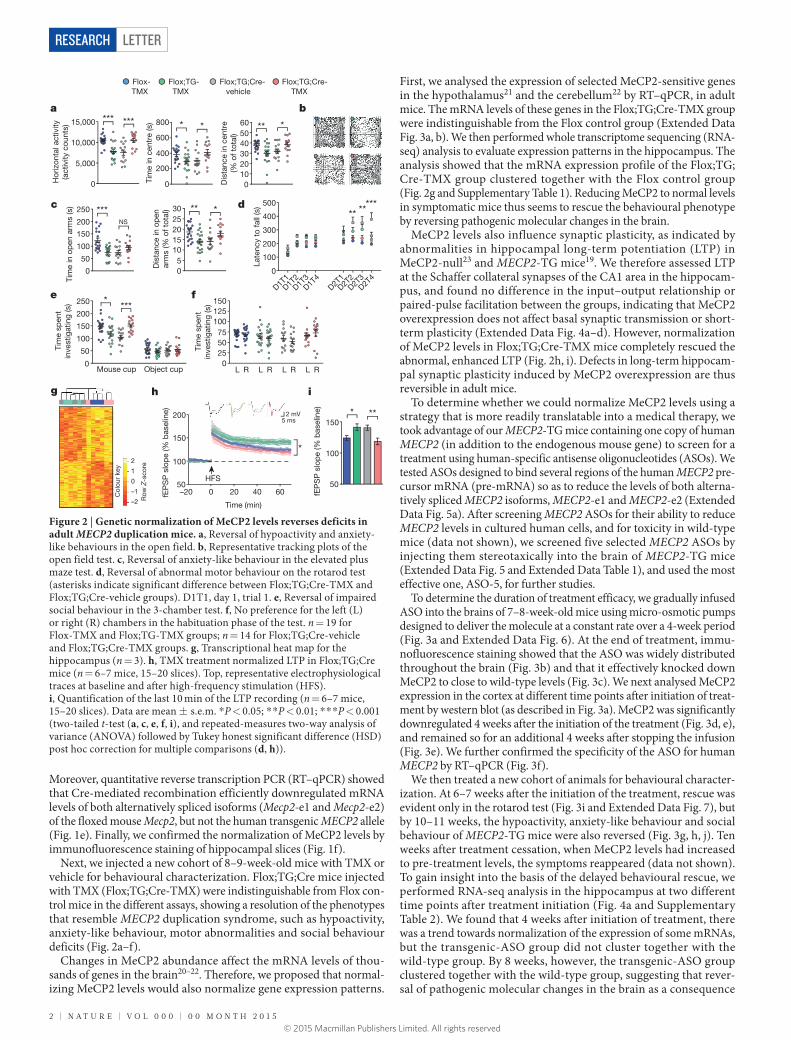
Next, we injected a new cohort of 8–9-week-old mice with TMX or vehicle for behavioural characterization. Flox;TG;Cre mice injected with TMX (Flox;TG;Cre-TMX) were indistinguishable from Flox con-trol mice in the different assays, showing a resolution of the phenotypes that resemble MECP2 duplication syndrome, such as hypoactivity, anxiety-like behaviour, motor abnormalities and social behaviour deficits (Fig. 2a–f).
Changes in MeCP2 abundance affect the mRNA levels of thou-sands of genes in the brain20–22. Therefore, we proposed that normal-izing MeCP2 levels would also normalize gene expression patterns.
First, we analysed the expression of selected MeCP2-sensitive genes in the hypothalamus21 and the cerebellum22 by RT–qPCR, in adult mice. The mRNA levels of these genes in the Flox;TG;Cre-TMX group were indistinguishable from the Flox control group (Extended Data Fig. 3a, b). We then performed whole transcriptome sequencing (RNA-seq) analysis to evaluate expression patterns in the hippocampus. The analysis showed that the mRNA expression profile of the Flox;TG; Cre-TMX group clustered together with the Flox control group (Fig. 2g and Supplementary Table 1). Reducing MeCP2 to normal levels in symptomatic mice thus seems to rescue the behavioural phenotype by reversing pathogenic molecular changes in the brain.
MeCP2 levels also influence synaptic plasticity, as indicated by abnormalities in hippocampal long-term potentiation (LTP) in MeCP2-null23 and MECP2-TG mice19. We therefore assessed LTP at the Schaffer collateral synapses of the CA1 area in the hippocam-pus, and found no difference in the input–output relationship or paired-pulse facilitation between the groups, indicating that MeCP2 overexpression does not affect basal synaptic transmission or short-term plasticity (Extended Data Fig. 4a–d). However, normalization of MeCP2 levels in Flox;TG;Cre-TMX mice completely rescued the abnormal, enhanced LTP (Fig. 2h, i). Defects in long-term hippocam-pal synaptic plasticity induced by MeCP2 overexpression are thus reversible in adult mice.
To determine whether we could normalize MeCP2 levels using a strategy that is more readily translatable into a medical therapy, we took advantage of our MECP2-TG mice containing one copy of human MECP2 (in addition to the endogenous mouse gene) to screen for a treatment using human-specific antisense oligonucleotides (ASOs). We tested ASOs designed to bind several regions of the human MECP2 pre-cursor mRNA (pre-mRNA) so as to reduce the levels of both alterna-tively spliced MECP2 isoforms, MECP2-e1 and MECP2-e2 (Extended Data Fig. 5a). After screening MECP2 ASOs for their ability to reduce MECP2 levels in cultured human cells, and for toxicity in wild-type mice (data not shown), we screened five selected MECP2 ASOs by injecting them stereotaxically into the brain of MECP2-TG mice (Extended Data Fig. 5 and Extended Data Table 1), and used the most effective one, ASO-5, for further studies.
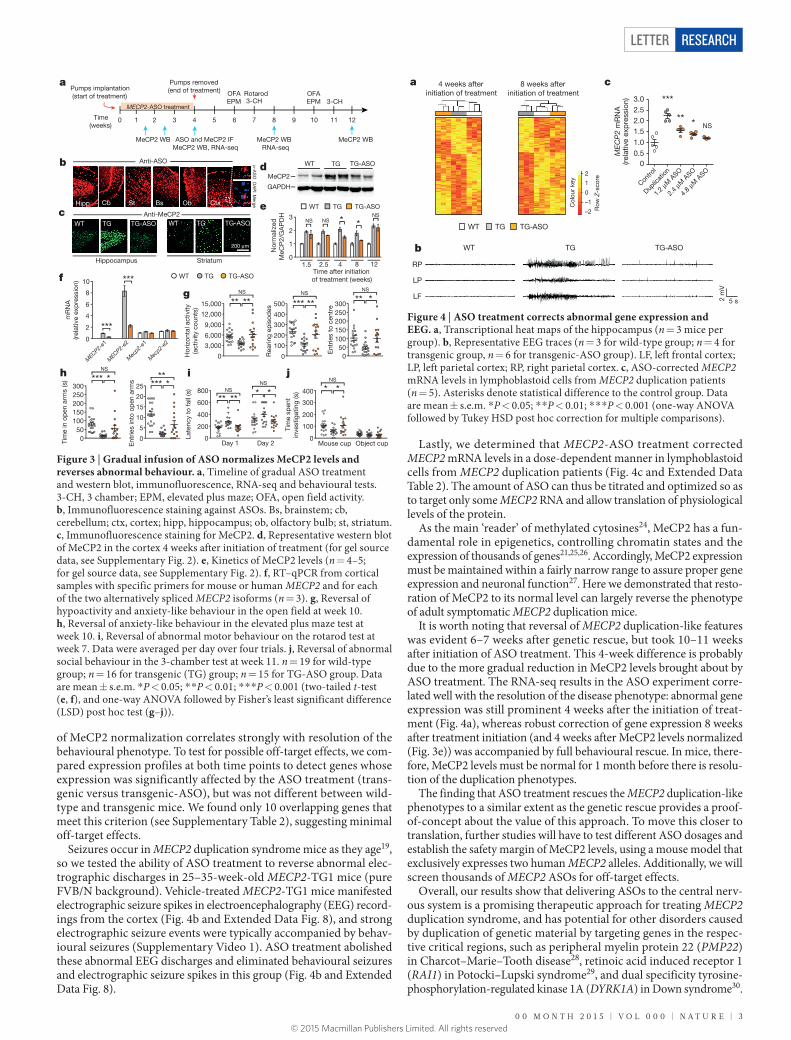
To determine the duration of treatment efficacy, we gradually infused ASO into the brains of 7–8-week-old mice using micro-osmotic pumps designed to deliver the molecule at a constant rate over a 4-week period (Fig. 3a and Extended Data Fig. 6). At the end of treatment, immu-nofluorescence staining showed that the ASO was widely distributed throughout the brain (Fig. 3b) and that it effectively knocked down MeCP2 to close to wild-type levels (Fig. 3c). We next analysed MeCP2 expression in the cortex at different time points after initiation of treat-ment by western blot (as described in Fig. 3a). MeCP2 was significantly downregulated 4 weeks after the initiation of the treatment (Fig. 3d, e), and remained so for an additional 4 weeks after stopping the infusion (Fig. 3e). We further confirmed the specificity of the ASO for human MECP2 by RT–qPCR (Fig. 3f).
We then treated a new cohort of animals for behavioural character-ization. At 6–7 weeks after the initiation of the treatment, rescue was evident only in the rotarod test (Fig. 3i and Extended Data Fig. 7), but by 10–11 weeks, the hypoactivity, anxiety-like behaviour and social behaviour of MECP2-TG mice were also reversed (Fig. 3g, h, j). Ten weeks after treatment cessation, when MeCP2 levels had increased to pre-treatment levels, the symptoms reappeared (data not shown). To gain insight into the basis of the delayed behavioural rescue, we performed RNA-seq analysis in the hippocampus at two different time points after treatment initiation (Fig. 4a and Supplementary Table 2). We found that 4 weeks after initiation of treatment, there was a trend towards normalization of the expression of some mRNAs, but the transgenic-ASO group did not cluster together with the wild-type group. By 8 weeks, however, the transgenic-ASO group clustered together with the wild-type group, suggesting that rever-sal of pathogenic molecular changes in the brain as a consequence
a b
c
e f
d ** **
***
*** *** * * * **
*** NS
* **
Flox- Flox;TG;Cre- Flox;TG;Cre- Flox;TG- TMX TMX TMX vehicle
Hor
izon
tal a
ctiv
ity
(act
ivity
cou
nts)
15,000
10,000
5,000
0 Tim
e in
cen
tre
(s)
0
200
400
600
800
Dis
tanc
e in
cen
tre
(% o
f tot
al)
0 10 20 30 40 50
Tim
e in
op
en a
rms
(s)
0
50
100
150
Dis
tanc
e in
op
en
arm
s (%
of t
otal
)
0 5
10 15 20 25
Late
ncy
to fa
ll (s
)
0
100
200
300
400
500
* ***
Tim
e sp
ent
inve
stig
atin
g (s
)
0
50
100
150
Mouse cup Object cup
200
L R
Tim
e sp
ent
inve
stig
atin
g (s
)
0 25 50 75
100
150
g ih
* **
0 20 40 60
100
150
200
50 HFS
–20
*
5 ms 2 mV
fEP
SP
slo
pe
(% b
asel
ine)
Time (min)
fEP
SP
slo
pe
(% b
asel
ine)
100
150
50
60
200
250 30
250 125
L R L R L R
D1T1D1T
2D1T
3D1T
4
D2T1
D2T2D2T
3D2T
4
2
1
0
–1
–2 Row
Z-s
core
Col
our
key
Figure 2 | Genetic normalization of MeCP2 levels reverses deficits in adult MECP2 duplication mice. a, Reversal of hypoactivity and anxiety-like behaviours in the open field. b, Representative tracking plots of the open field test. c, Reversal of anxiety-like behaviour in the elevated plus maze test. d, Reversal of abnormal motor behaviour on the rotarod test (asterisks indicate significant difference between Flox;TG;Cre-TMX and Flox;TG;Cre-vehicle groups). D1T1, day 1, trial 1. e, Reversal of impaired social behaviour in the 3-chamber test. f, No preference for the left (L) or right (R) chambers in the habituation phase of the test. n = 19 for Flox-TMX and Flox;TG-TMX groups; n = 14 for Flox;TG;Cre-vehicle and Flox;TG;Cre-TMX groups. g, Transcriptional heat map for the hippocampus (n = 3). h, TMX treatment normalized LTP in Flox;TG;Cre mice (n = 6–7 mice, 15–20 slices). Top, representative electrophysiological traces at baseline and after high-frequency stimulation (HFS). i, Quantification of the last 10 min of the LTP recording (n = 6–7 mice, 15–20 slices). Data are mean ± s.e.m. *P < 0.05; * *P < 0.01; * * *P < 0.001 (two-tailed t-test (a, c, e, f, i), and repeated-measures two-way analysis of variance (ANOVA) followed by Tukey honest significant difference (HSD) post hoc correction for multiple comparisons (d, h)).
0 0 M o n t h 2 0 1 5 | V o L 0 0 0 | n A t U R E | 3
Letter reSeArCH
© 2015 Macmillan Publishers Limited. All rights reserved
of MeCP2 normalization correlates strongly with resolution of the behavioural phenotype. To test for possible off-target effects, we com-pared expression profiles at both time points to detect genes whose expression was significantly affected by the ASO treatment (trans-genic versus transgenic-ASO), but was not different between wild-type and transgenic mice. We found only 10 overlapping genes that meet this criterion (see Supplementary Table 2), suggesting minimal off-target effects.
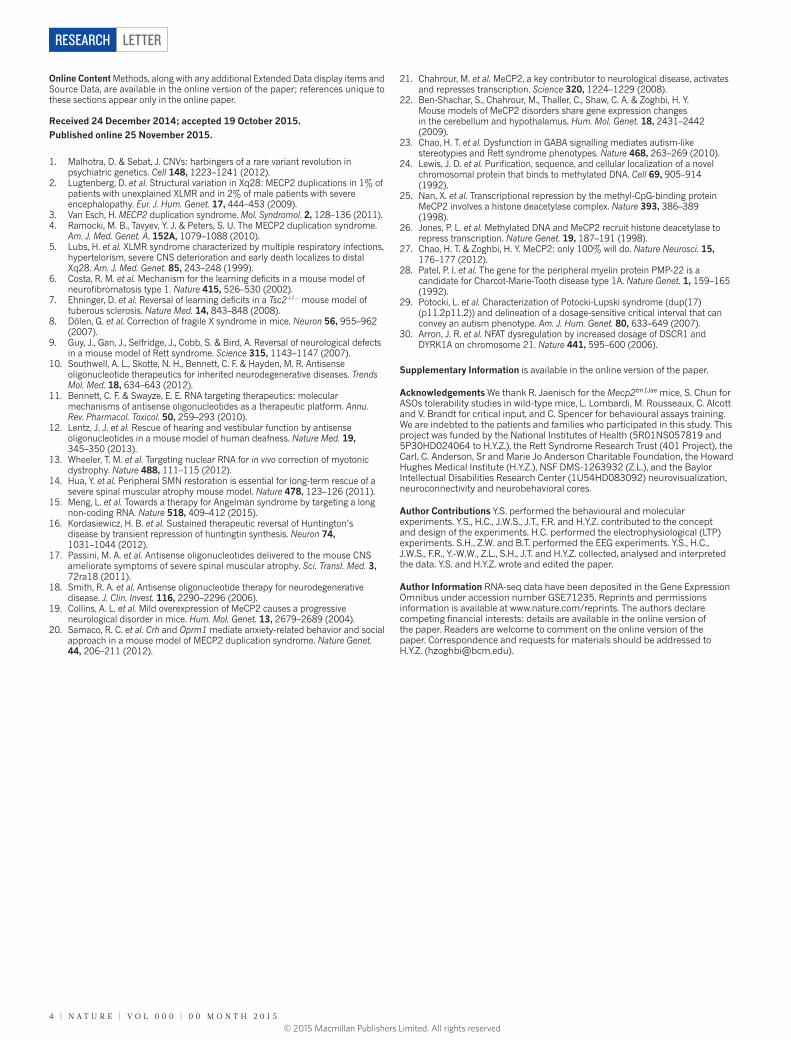
Seizures occur in MECP2 duplication syndrome mice as they age19, so we tested the ability of ASO treatment to reverse abnormal elec-trographic discharges in 25–35-week-old MECP2-TG1 mice (pure FVB/N background). Vehicle-treated MECP2-TG1 mice manifested electrographic seizure spikes in electroencephalography (EEG) record-ings from the cortex (Fig. 4b and Extended Data Fig. 8), and strong electrographic seizure events were typically accompanied by behav-ioural seizures (Supplementary Video 1). ASO treatment abolished these abnormal EEG discharges and eliminated behavioural seizures and electrographic seizure spikes in this group (Fig. 4b and Extended Data Fig. 8).
Lastly, we determined that MECP2-ASO treatment corrected MECP2 mRNA levels in a dose-dependent manner in lymphoblastoid cells from MECP2 duplication patients (Fig. 4c and Extended Data Table 2). The amount of ASO can thus be titrated and optimized so as to target only some MECP2 RNA and allow translation of physiological levels of the protein.
As the main ‘reader’ of methylated cytosines24, MeCP2 has a fun-damental role in epigenetics, controlling chromatin states and the expression of thousands of genes21,25,26. Accordingly, MeCP2 expression must be maintained within a fairly narrow range to assure proper gene expression and neuronal function27. Here we demonstrated that resto-ration of MeCP2 to its normal level can largely reverse the phenotype of adult symptomatic MECP2 duplication mice.
It is worth noting that reversal of MECP2 duplication-like features was evident 6–7 weeks after genetic rescue, but took 10–11 weeks after initiation of ASO treatment. This 4-week difference is probably due to the more gradual reduction in MeCP2 levels brought about by ASO treatment. The RNA-seq results in the ASO experiment corre-lated well with the resolution of the disease phenotype: abnormal gene expression was still prominent 4 weeks after the initiation of treat-ment (Fig. 4a), whereas robust correction of gene expression 8 weeks after treatment initiation (and 4 weeks after MeCP2 levels normalized (Fig. 3e)) was accompanied by full behavioural rescue. In mice, there-fore, MeCP2 levels must be normal for 1 month before there is resolu-tion of the duplication phenotypes.
The finding that ASO treatment rescues the MECP2 duplication-like phenotypes to a similar extent as the genetic rescue provides a proof-of-concept about the value of this approach. To move this closer to translation, further studies will have to test different ASO dosages and establish the safety margin of MeCP2 levels, using a mouse model that exclusively expresses two human MECP2 alleles. Additionally, we will screen thousands of MECP2 ASOs for off-target effects.
Overall, our results show that delivering ASOs to the central nerv-ous system is a promising therapeutic approach for treating MECP2 duplication syndrome, and has potential for other disorders caused by duplication of genetic material by targeting genes in the respec-tive critical regions, such as peripheral myelin protein 22 (PMP22) in Charcot–Marie–Tooth disease28, retinoic acid induced receptor 1 (RAI1) in Potocki–Lupski syndrome29, and dual specificity tyrosine- phosphorylation-regulated kinase 1A (DYRK1A) in Down syndrome30.
a
d b
e
f
g ** ** *** **
*** * *** *
** *
j
MeCP2
GAPDH
WT TG TG-ASO
** *
h
Anti-ASO
Hipp Cb CtxSt Bs Ob
α-A
SO
D
AP
I Merge
WT
Anti-MeCP2 TG WT TG-ASO
Hippocampus
TG WT TG-ASO
Striatum
i
*
4 8 12
c
* **
NS * NS
1.5 2.5
Pumps implantation (start of treatment)
Pumps removed (end of treatment) OFA
EPM Rotarod 3-CH
OFA EPM 3-CH
Time (weeks)
2 3 6 7 1 4 5 8
ASO and MeCP2 IF MeCP2 WB, RNA-seq
MeCP2 WB RNA-seq
MeCP2 WB
0
MECP2-ASO treatment
9 10 11 12
MeCP2 WB
NS *
Time after initiation of treatment (weeks)
***
***
WT TG TG-ASO
Nor
mal
ized
MeC
P2/
GA
PD
H
0
1
2
3
mR
NA
(r
elat
ive
exp
ress
ion)
0
2
4
6
8
10
Hor
izon
tal a
ctiv
ity
(act
ivity
cou
nts)
0
3,000
6,000
9,000
Rea
ring
epis
odes
0
100
200
300 E
ntrie
s to
cen
tre
0 50
100 150
Tim
e in
op
en a
rms
(s)
0 50
100 150 200 250
Ent
ries
into
op
en a
rms
0
5
10
15
Late
ncy
to fa
ll (s
)
0 Day 1 Day 2
200
400
600
Tim
e sp
ent
inve
stig
atin
g (s
)
0 Mouse cup Object cup
100
400 *
NS NSNS
NS
** NS
NSNS
WT TG TG-ASO
12,000
15,000
400
500
200 250 300
300
20
25 800
200
300
MECP2-
e1
MECP2-
e2
Mec
p2-e1
Mec
p2-e2
200 μm
Figure 3 | Gradual infusion of ASO normalizes MeCP2 levels and reverses abnormal behaviour. a, Timeline of gradual ASO treatment and western blot, immunofluorescence, RNA-seq and behavioural tests. 3-CH, 3 chamber; EPM, elevated plus maze; OFA, open field activity. b, Immunofluorescence staining against ASOs. Bs, brainstem; cb, cerebellum; ctx, cortex; hipp, hippocampus; ob, olfactory bulb; st, striatum. c, Immunofluorescence staining for MeCP2. d, Representative western blot of MeCP2 in the cortex 4 weeks after initiation of treatment (for gel source data, see Supplementary Fig. 2). e, Kinetics of MeCP2 levels (n = 4–5; for gel source data, see Supplementary Fig. 2). f, RT–qPCR from cortical samples with specific primers for mouse or human MECP2 and for each of the two alternatively spliced MECP2 isoforms (n = 3). g, Reversal of hypoactivity and anxiety-like behaviour in the open field at week 10. h, Reversal of anxiety-like behaviour in the elevated plus maze test at week 10. i, Reversal of abnormal motor behaviour on the rotarod test at week 7. Data were averaged per day over four trials. j, Reversal of abnormal social behaviour in the 3-chamber test at week 11. n = 19 for wild-type group; n = 16 for transgenic (TG) group; n = 15 for TG-ASO group. Data are mean ± s.e.m. *P < 0.05; * *P < 0.01; * * *P < 0.001 (two-tailed t-test (e, f), and one-way ANOVA followed by Fisher’s least significant difference (LSD) post hoc test (g–j)).
a c
WT TG TG-ASO
RP
LF
LP
5 s 2 m
V
b
***
** NS*
ME
CP
2 m
RN
A
(rel
ativ
e ex
pre
ssio
n)
0 0.5 1.0 1.5 2.0 2.5
4 weeks after initiation of treatment
8 weeks after initiation of treatment
WT TG TG-ASO
3.0
2
1
0
–1
–2 Row
Z-s
core
Col
our
key
Contro
l
Duplic
ation
1.2 μM
ASO
2.4 μM
ASO
4.8 μM
ASO
Figure 4 | ASO treatment corrects abnormal gene expression and EEG. a, Transcriptional heat maps of the hippocampus (n = 3 mice per group). b, Representative EEG traces (n = 3 for wild-type group; n = 4 for transgenic group, n = 6 for transgenic-ASO group). LF, left frontal cortex; LP, left parietal cortex; RP, right parietal cortex. c, ASO-corrected MECP2 mRNA levels in lymphoblastoid cells from MECP2 duplication patients (n = 5). Asterisks denote statistical difference to the control group. Data are mean ± s.e.m. *P < 0.05; * *P < 0.01; * * *P < 0.001 (one-way ANOVA followed by Tukey HSD post hoc correction for multiple comparisons).
4 | n A t U R E | V o L 0 0 0 | 0 0 M o n t h 2 0 1 5
LetterreSeArCH
© 2015 Macmillan Publishers Limited. All rights reserved
Online Content Methods, along with any additional Extended Data display items and Source Data, are available in the online version of the paper; references unique to these sections appear only in the online paper.
received 24 December 2014; accepted 19 October 2015.
Published online 25 November 2015.
1. Malhotra, D. & Sebat, J. CNVs: harbingers of a rare variant revolution in psychiatric genetics. Cell 148, 1223–1241 (2012).
2. Lugtenberg, D. et al. Structural variation in Xq28: MECP2 duplications in 1% of patients with unexplained XLMR and in 2% of male patients with severe encephalopathy. Eur. J. Hum. Genet. 17, 444–453 (2009).
3. Van Esch, H. MECP2 duplication syndrome. Mol. Syndromol. 2, 128–136 (2011).4. Ramocki, M. B., Tavyev, Y. J. & Peters, S. U. The MECP2 duplication syndrome.
Am. J. Med. Genet. A. 152A, 1079–1088 (2010).5. Lubs, H. et al. XLMR syndrome characterized by multiple respiratory infections,
hypertelorism, severe CNS deterioration and early death localizes to distal Xq28. Am. J. Med. Genet. 85, 243–248 (1999).
6. Costa, R. M. et al. Mechanism for the learning deficits in a mouse model of neurofibromatosis type 1. Nature 415, 526–530 (2002).
7. Ehninger, D. et al. Reversal of learning deficits in a Tsc2+/− mouse model of tuberous sclerosis. Nature Med. 14, 843–848 (2008).
8. Dölen, G. et al. Correction of fragile X syndrome in mice. Neuron 56, 955–962 (2007).
9. Guy, J., Gan, J., Selfridge, J., Cobb, S. & Bird, A. Reversal of neurological defects in a mouse model of Rett syndrome. Science 315, 1143–1147 (2007).
10. Southwell, A. L., Skotte, N. H., Bennett, C. F. & Hayden, M. R. Antisense oligonucleotide therapeutics for inherited neurodegenerative diseases. Trends Mol. Med. 18, 634–643 (2012).
11. Bennett, C. F. & Swayze, E. E. RNA targeting therapeutics: molecular mechanisms of antisense oligonucleotides as a therapeutic platform. Annu. Rev. Pharmacol. Toxicol. 50, 259–293 (2010).
12. Lentz, J. J. et al. Rescue of hearing and vestibular function by antisense oligonucleotides in a mouse model of human deafness. Nature Med. 19, 345–350 (2013).
13. Wheeler, T. M. et al. Targeting nuclear RNA for in vivo correction of myotonic dystrophy. Nature 488, 111–115 (2012).
14. Hua, Y. et al. Peripheral SMN restoration is essential for long-term rescue of a severe spinal muscular atrophy mouse model. Nature 478, 123–126 (2011).
15. Meng, L. et al. Towards a therapy for Angelman syndrome by targeting a long non-coding RNA. Nature 518, 409–412 (2015).
16. Kordasiewicz, H. B. et al. Sustained therapeutic reversal of Huntington’s disease by transient repression of huntingtin synthesis. Neuron 74, 1031–1044 (2012).
17. Passini, M. A. et al. Antisense oligonucleotides delivered to the mouse CNS ameliorate symptoms of severe spinal muscular atrophy. Sci. Transl. Med. 3, 72ra18 (2011).
18. Smith, R. A. et al. Antisense oligonucleotide therapy for neurodegenerative disease. J. Clin. Invest. 116, 2290–2296 (2006).
19. Collins, A. L. et al. Mild overexpression of MeCP2 causes a progressive neurological disorder in mice. Hum. Mol. Genet. 13, 2679–2689 (2004).
20. Samaco, R. C. et al. Crh and Oprm1 mediate anxiety-related behavior and social approach in a mouse model of MECP2 duplication syndrome. Nature Genet. 44, 206–211 (2012).
Supplementary Information is available in the online version of the paper.
Acknowledgements We thank R. Jaenisch for the Mecp2tm1Jae mice, S. Chun for ASOs tolerability studies in wild-type mice, L. Lombardi, M. Rousseaux, C. Alcott and V. Brandt for critical input, and C. Spencer for behavioural assays training. We are indebted to the patients and families who participated in this study. This project was funded by the National Institutes of Health (5R01NS057819 and 5P30HD024064 to H.Y.Z.), the Rett Syndrome Research Trust (401 Project), the Carl. C. Anderson, Sr and Marie Jo Anderson Charitable Foundation, the Howard Hughes Medical Institute (H.Y.Z.), NSF DMS-1263932 (Z.L.), and the Baylor Intellectual Disabilities Research Center (1U54HD083092) neurovisualization, neuroconnectivity and neurobehavioral cores.
Author Contributions Y.S. performed the behavioural and molecular experiments. Y.S., H.C., J.W.S., J.T., F.R. and H.Y.Z. contributed to the concept and design of the experiments. H.C. performed the electrophysiological (LTP) experiments. S.H., Z.W. and B.T. performed the EEG experiments. Y.S., H.C., J.W.S., F.R., Y.-W.W., Z.L., S.H., J.T. and H.Y.Z. collected, analysed and interpreted the data. Y.S. and H.Y.Z. wrote and edited the paper.
Author Information RNA-seq data have been deposited in the Gene Expression Omnibus under accession number GSE71235. Reprints and permissions information is available at www.nature.com/reprints. The authors declare competing financial interests: details are available in the online version of the paper. Readers are welcome to comment on the online version of the paper. Correspondence and requests for materials should be addressed to H.Y.Z. ([email protected]).
21. Chahrour, M. et al. MeCP2, a key contributor to neurological disease, activates and represses transcription. Science 320, 1224–1229 (2008).
22. Ben-Shachar, S., Chahrour, M., Thaller, C., Shaw, C. A. & Zoghbi, H. Y. Mouse models of MeCP2 disorders share gene expression changes in the cerebellum and hypothalamus. Hum. Mol. Genet. 18, 2431–2442 (2009).
23. Chao, H. T. et al. Dysfunction in GABA signalling mediates autism-like stereotypies and Rett syndrome phenotypes. Nature 468, 263–269 (2010).
24. Lewis, J. D. et al. Purification, sequence, and cellular localization of a novel chromosomal protein that binds to methylated DNA. Cell 69, 905–914 (1992).
25. Nan, X. et al. Transcriptional repression by the methyl-CpG-binding protein MeCP2 involves a histone deacetylase complex. Nature 393, 386–389 (1998).
26. Jones, P. L. et al. Methylated DNA and MeCP2 recruit histone deacetylase to repress transcription. Nature Genet. 19, 187–191 (1998).
27. Chao, H. T. & Zoghbi, H. Y. MeCP2: only 100% will do. Nature Neurosci. 15, 176–177 (2012).
28. Patel, P. I. et al. The gene for the peripheral myelin protein PMP-22 is a candidate for Charcot-Marie-Tooth disease type 1A. Nature Genet. 1, 159–165 (1992).
29. Potocki, L. et al. Characterization of Potocki-Lupski syndrome (dup(17)(p11.2p11.2)) and delineation of a dosage-sensitive critical interval that can convey an autism phenotype. Am. J. Hum. Genet. 80, 633–649 (2007).
30. Arron, J. R. et al. NFAT dysregulation by increased dosage of DSCR1 and DYRK1A on chromosome 21. Nature 441, 595–600 (2006).
Letter reSeArCH
© 2015 Macmillan Publishers Limited. All rights reserved
MethODSASO synthesis. Isis Pharmaceuticals synthesized all ASOs as previously described15. All ASOs consist of 20 chemically modified nucleotides (MOE gap-mer). The central gap of 10 deoxynucleotides is flanked on its 5′ and 3′ sides by five 2′ -O-(2-methoxyethyl) (MOE)-modified nucleotides. The backbone modi-fications from 5′ to 3′ are: 1-PS, 4-PO, 10-PS, 2-PO and 2-PS. Phosphorothioate (PS) modifications were replaced with native phosphodiester (PO) in the MOE wings to reduce the overall PS content of the ASO, since a fully modified PS ASO is not necessary for robust CNS activity15. The sequence of each ASO is listed in Extended Data Table 1.Mice. The first MeCP2-overexpressing mice were MECP2-TG mice on a FVB/N pure background19. These mice show normal locomotion in the open field and an increase in vertical activity, which was interpreted as less anxiety, but there was no difference in anxiety-like behaviour in the light–dark test. Mice on a pure FVB/N background, however, develop premature retinal degeneration, which can confound the interpretation of some behavioural tests31. To overcome issues related to a pure inbred strain, our laboratory characterized F1 hybrid MECP2-TG mice (FVB/N × C57Bl/6 or FVB/N × 129S6/SvEv), and showed that these mice display several phenotypes as early as 7 weeks of age20, including increased anxiety and a trend towards hypoactivity. Therefore, for both the genetic rescue and the ASO treatment experiments, we decided to continue using F1 hybrid MECP2-TG mice.
For experiments related to the validation of the Flox;TG mouse model (Extended Data Figs 1 and 2), we generated F1 hybrid animals by mating male MECP2-TG1 mice on a pure FVB/N background19 to female mice heterozy-gous for the Mecp2lox allele (Flox) (B6;129S4-Mecp2tm1Jae/Mmucd obtained from MMRRC, and backcrossed to C57Bl/6J for more than 10 generations; see also scheme in Extended Data Fig. 1a). For experiments related to conditional rescue of MECP2-TG mice (Figs 1 and 2), we first mated Flox C57Bl/6 females with C57Bl/6 Cre-ER males (B6.Cg-Tg(UBC-cre/ERT2)1Ejb/J obtained from Jackson Laboratories). The F1 Flox;Cre females were then mated to FVB/N MECP2-TG1 males to generate the F1 hybrid, triple-transgenic Flox;TG;Cre male mice and their control littermates (Flox and Flox;TG) (see scheme in Fig. 1a). For studies related to MECP2-ASOs, we generated F1 hybrid animals by mating FVB/N MECP2-TG1 females and wild-type 129S6/SvEv male mice (Taconic Farms). For the EEG exper-iment (Fig. 4b), we used MECP2-TG1 males on a pure FVB/N background.
We routinely used mouse littermates as controls for our experiments. Throughout the experiments, mice were maintained in a temperature-controlled, AALAS-certified level 3 facility on a 12 h light–dark cycle. Food and water were given ad libitum. All procedures to maintain and use these mice were approved by the Institutional Animal Care and Use Committee for Baylor College of Medicine. Animals were randomly selected using Excel software to generate a table of random numbers for all genetic and treatment studies. For all experiments, the individuals performing the behavioural and electrophysiological studies were blinded to the genotype or treatment.Preparation of brain lysates and western blot. Brains were dissected and homog-enized in cold lysis buffer (20 mM Tris-HCl, pH 8.0, 180 mM NaCl, 0.5% NP-40, 1 mM EDTA and Complete Protease Inhibitor, Roche). Lysates were rotated for 20 min at 4 °C. After centrifugation at 4 °C, the supernatant was mixed with NuPAGE sample buffer, heated for 5 min at 95 °C, and run on a NuPAGE 4–12% Bis-Tris gradient gel with MES SDS running buffer (NuPAGE). Proteins were transferred to a nitrocellulose membrane using NuPAGE Transfer Buffer for 1.5 h at 4 °C. The membrane was blocked for 1 h with 5% milk in TBS with 2% Tween-20 (TBST) followed by overnight incubation with primary antibody at 4 °C. After four 10-min washes with TBST, the membrane was incubated with secondary antibody for 1–2 h at room temperature. Horseradish peroxidase (HRP) was detected using SuperSignal West Dura kit, Thermo Scientific. Western blot images were acquired by ImageQuant LAS 4000 (GE Healthcare) and quantified by an ImageJ software package. Primary antibodies: rabbit antiserum raised against the amino terminus of MeCP2 (1:5,000; Zoghbi laboratory), mouse anti-GAPDH 6C5 (1:20,000; Advanced Immunochemicals, 2-RGM2). Secondary antibodies: goat anti-rabbit HRP (1:20,000; Bio-Rad), donkey anti-mouse HRP (1:20,000; Jackson ImmunoResearch Labs, 715-035-150).Gene expression analysis by RT–qPCR. The subset of mice for RT–qPCR was selected randomly, using Excel software to generate a table of random numbers. No significant differences on behavioural measurements were found between the selected mice and the rest (per genotype group). Total RNA from mouse brain tissue was extracted using miRNeasy minikit (Qiagen), and 1 μ g of total RNA was used to synthesize cDNA by Quantitect reverse transcription kit (Qiagen). For human lymphoblasts, 2 μ g of total RNA was used to synthesize cDNA. RT–qPCR was performed in a CFX96 Real-Time System (Bio-Rad) using PerfeCTa SYBR Green Fast Mix (Quanta Biosciences). Sense and antisense primers were selected to be located on different exons, and the RNA was treated with DNase, to avoid false-positive results caused by DNA contamination. The specificity of
the amplification products was verified by melting curve analysis. All RT–qPCR reactions were conducted in technical triplicates and the results were averaged for each sample, normalized to Hprt levels, and analysed using the comparative Δ Δ Ct method. The following primers were used in the RT–qPCR reactions: MECP2 (common to human and mouse): 5′ -TATTTGATCAATCCCCAGGG-3′ (sense), 5′ -CTCCCTCTCCCAGTTACCGT-3′ (antisense); MECP2 (human- specific): 5′ -GATGTGTATTTGATCAATCCC-3′ (sense), 5′ -TTAGGGTC CAGGGATGTGTC-3′ (antisense); Mecp2-e1 (mouse-specific): 5′ -AGGAGA GACTGGAGGAAAAGTC-3′ (sense), 5′ -CTTAAACTTCAGTGGCTTGTCT CTG-3′ (antisense); Mecp2-e2 (mouse-specific): 5′ -CTCACCAGTTCCTG CTTTGATGT-3′ (sense), 5′ -CTTAAACTTCAGTGGCTTGTCTCTG-3′ (anti-sense); MECP2-e1 (human-specific): 5′ -AGGAGAGACTGGAAGAAAAGTC-3′ (sense), 5′ -CTTGAGGGGTTTGTCCTTGA-3′ (antisense); MECP2-e2 (human- specific): 5′ -CTCACCAGTTCCTGCTTTGATGT-3′ (sense), 5′-CTTGAGG GGTTTGTCCTTGA-3′ (antisense); Hprt (mouse-specific): 5′ -CGGGGG ACATAAAAGTTATTG-3′ (sense), 5′ -TGCATTGTTTTACCAGTGTCAA-3′ (antisense); HPRT (human-specific): 5′ -GACCAGTCAACAGGGGACAT-3′ (sense), 5′ -CCTGACCAAGGAAAGCAAAG-3′ (antisense); Sst: 5′ -CCC AGACTCCGTCAGTTTCT-3′ (sense), 5′ -GAAGTTCTTGCAGCCAGCTT-3′ (antisense); Crf: 5′ -TACCAAGGGAGGAGAAGAGA-3′ (sense), 5′ -GATC AGAACCGGCTGAGGT-3′ (antisense); Npbwr1: 5′ -TCTCTTACTTCATC ACCAGCC-3′ (sense), 5′ -GCATAGAGGAAAGGGTTGAG-3′ (antisense); Gamt: 5′ -GGATTATTGAGTGCAATGATGG-3′ (sense), 5′ -TCAAGGGAACAA CCTTATGTG-3′ (antisense); Agrp: 5′ -TCAAGAAGACAACTGCAGAC-3′ (sense), 5′ -TCTGTGGATCTAGCACCTC-3′ (antisense); Rcor2: 5′ -AC CCGAAGTCGAACTAGTG-3′ (sense), 5′ -CTAGTTCATCACTGTCTTCTTTG-3′ (antisense); Prl2c2: 5′ -CATGAGCACCATGCTTCAG-3′ (sense), 5′ -GCG AGCATCTTCATTGTCAG-3′ (antisense).Immunofluorescence. Animals were anaesthetized with a mix of ketamine 37.6 mg ml−1, xylazine 1.92 mg ml−1 and acepromazine 0.38 mg ml−1, and tran-scardially perfused with 20 ml PBS followed by 100 ml of cold PBS-buffered 4% paraformaldehyde (PFA). The brains were removed and post-fixed overnight in 4% PFA. Next, brains were cryoprotected in 4% PFA with 30% sucrose at 4 °C for two additional days and embedded in Optimum Cutting Temperature (O.C.T., Tissue-Tek). Free-floating 40-μ m brain sections were cut using a Leica CM3050 cryostat and collected in PBS. The sections were blocked for 1 h in 2% normal goat serum, 0.3% Triton X-100 in PBS at room temperature. Sections were then incubated overnight at 4 °C with either rabbit anti-MeCP2 antibody (1:1,000; Cell Signaling) or rabbit anti-ASO antibody (1:10,000; Isis Pharmaceuticals). The sections were washed three times for 10 min with PBS, and incubated for 3 h at room tempera-ture with goat anti-rabbit antibody (1:500; Alexa Fluor 488, Invitrogen, A-11034). Sections were washed again three times for 10 min with PBS and mounted onto glass slides with Vectashield mounting medium with DAPI (Vector Laboratories).Tamoxifen treatment. Tamoxifen (Sigma-Aldrich, T5648) was dissolved to 20 mg ml−1 in peanut oil, aliquotted and frozen at − 20 °C until use. Peanut oil was also used as a vehicle. Tamoxifen or vehicle was injected intraperitoneally at a dose of 100 mg kg−1, three alternative days a week for 4 weeks (as described in Fig. 1b).Behavioural assays. All data acquisition and analyses were carried out by an individual blinded to the genotype and treatment. All behavioural studies were performed during the light period. Mice were habituated to the test room for 1 h before each test. At least one day was given between assays for the mice to recover. All the tests were performed as previously described23 with few modifications.Open field test. After habituation in the test room (150 lx, 60 dB white noise), mice were placed in the centre of an open arena (40 × 40 × 30 cm), and their behaviour was tracked by laser photobeam breaks for 30 min. General locomotor activity was automatically analysed using AccuScan Fusion software (Omnitech) by counting the number of times mice break the laser beams (activity counts). In addition, rearing activity, the time spent in the centre of the arena, entries to the centre and distance travelled were analysed. In this study, we found that MECP2-TG mice are hypoactive in the open field test. In contrast, in ref. 20, MECP2-TG mice show a non-significant trend towards hypoactivity. This difference might be the result of our study assessing locomotor activity by measuring activity counts, and in ref. 20 by measuring the distance travelled, which is calculated by the software from the activity counts.Elevated plus maze test. After habituation in the test room (700 lx, 60 dB white noise), mice were placed in the centre part of the maze facing one of the two open arms. Mouse behaviour was video-tracked for 10 min, and the time mice spent in the open arms and the entries to the open arms, as well as the distance travelled in the open arms, were recorded and analysed using ANY-maze system (Stoelting).Accelerating rotarod test. After habituation in the test room (700 lx, 60 dB white noise), motor coordination was measured using an accelerating rotarod apparatus (Ugo Basile). Mice were tested for two consecutive days, four trials each, with an interval of 60 min between trials to rest. Each trial lasted for a maximum of 10 min,
LetterreSeArCH
© 2015 Macmillan Publishers Limited. All rights reserved
and the rod accelerated from 4 to 40 r.p.m. in the first 5 min. The time that it took for each mouse to fall from the rod (latency to fall) was recorded.Three-chamber test. The three-chamber apparatus consists of a clear Plexiglas box (24.75 × 16.75 × 8.75) with removable partitions that separate the box into three chambers. In both the left and right chambers a cylindrical wire cup was placed with the open side down. Age- and gender-matched C57Bl/6 mice were used as novel partners. Two days before the test, the novel partner mice were habituated to the wire cups (3 inches diameter by 4 inches in height) for 1 h per day. After habituation in the test room (700 lx, 60 dB white noise), mice were placed in the central chamber and allowed to explore the three chambers for 10 min (habituation phase). Next, a novel partner mouse was placed into a wire cup in either the left or the right chamber. An inanimate object was placed as control in the wire cup of the opposite chamber. The location of the novel mouse was randomized between left and right chambers across subjects to control for side preference. The mouse tested was allowed to explore again for an additional 10 min. The time spent investigating the novel partner (defined by rearing, sniffing or pawing at the wire cup) and the time spent investigating the inanimate object were measured manually.RNA-seq. Mice were euthanized under anaesthesia and the hippocampi were quickly dissected over ice. Total RNA of 30 hippocampal samples (three biological replicates of each genotype from three experiments) was extracted using miRNeasy minikit (Qiagen), following the manufacturer’s instructions. Isolated RNA was eluted in RNase-free water and submitted to the Genomic and RNA Profiling Core at Baylor College of Medicine. Sample quality checks using the NanoDrop spectrophotometer and Agilent Bioanalyzer 2100 were conducted. Then Illumina TruSeq RNA library preparation protocol was used as follows. A double-stranded DNA library was created using 250 ng of total RNA (measured by picogreen), preparing the fragments for hybridization onto a flow-cell. First, cDNA was cre-ated using the fragmented 3′ poly(A) selected portion of total RNA and random primers. During second-strand synthesis, dTTP is replaced with dUTP, which quenches the second strand during amplification, thereby achieving strand spec-ificity. Libraries were created from the cDNA by first blunt-ending the fragments, attaching an adenosine to the 3′ -end and finally ligating unique adapters to the ends. The ligated products were then amplified using 15 cycles of PCR. The result-ing libraries were quantified using the NanoDrop spectrophotometer and fragment size assessed with the Agilent Bioanalyzer. A qPCR quantification was performed on the libraries to determine the concentration of adaptor ligated fragments using Applied Biosystems ViiA7 Real-Time PCR System and a KAPA Library Quant Kit. Using the concentration from the ViiA7 qPCR machine, 21 pM of library was loaded onto a flow-cell and amplified by bridge amplification using the Illumina cBot machine. A paired-end 100 cycle run was used to sequence the flow-cell on a HiSeq Sequencing System.RNA-seq data pre-processing and analysis. For each sample, about 10 million 100-base-pair pair-end reads were generated. Raw reads were first groomed by removing adapters from both the 3′ - and 5′ -ends before mapping to the refer-ence genome. Then, trimmed reads were aligned to the Mus musculus genome (UCSC mm10; the gene model for the mapping was obtained from http://ccb.jhu.edu/software/tophat/igenomes.shtml) using TopHat v2.0.9 (ref. 32) with default parameters (-r 200 -p 5). The mappability for all 30 samples was above 85%. To pre-pare the aligned sequence reads into expression level for differential gene analysis, we used the free Python program HTSeq33. The htseq-count function of HTSeq allowed us to accumulate the number of aligned reads that fall under the exons of the gene (union of all the exons of the gene). These read counts are analogous to the expression level of the gene. Using the obtained read counts, differential gene analyses were carried out using the DESeq package and glm.nb function in the R environment. DESeq includes functions for us to normalize the read counts of multiple samples across several genotypes by the use of the negative binomial dis-tribution and a shrinkage estimator for the distribution’s variance34. glm.nb allows us to fit a negative binomial regression model to test the gene changes between genotypes. Specifically, for data from the ASO experiment, each gene was tested to check whether its expression levels in wild-type and TG-ASO mice differed from that in transgenic mice. Similarly, for data from the genetic rescue experiment, expression levels in Flox and Flox;TG;Cre-TMX were tested for differences from the expression in Flox;TG;Cre-vehicle and Flox;TG. The statistical significance of the observed changes was reported by the false discovery rate, which is the P value adjusted for multiple testing with the Benjamini–Hochberg procedure. A gene was considered significantly different between genotypes if it fell under a false discovery rate of 10% and changed in a coherent direction.Sample clustering. To assess the similarity of expression patterns between sam-ples of different genotypes, we carried out unbiased clustering: expressions of the identified significantly changed genes were clustered by sample based on Euclidean distance on average linkage and by genes based on Euclidean distance on complete linkage. Heat maps were then used to plot the clustered gene expressions for visual inspection. The plotted expressions (Z-scores) for each gene were the expressions
normalized at the gene level to have an average of zero and a standard deviation of one.Hippocampal slice preparation. Mice were deeply anaesthetized with isofluorane, followed by decapitation. The brain was removed into oxygenated and ice-cold cutting solution (CS) containing (in mM): 110 sucrose, 60 NaCl, 3 KCl, 1.25 NaH2PO4, 28 NaHCO3, 0.5 CaCl2, 7 MgCl2 and 5 glucose, and the caudal portion of the forebrain containing the hippocampus and entorhinal cortex was isolated by razor blade cuts. Transverse slices (400 μ m) were prepared with a Vibratome (Vibratome). Cortical tissue was then removed and hippocampal slices were equilibrated in a mixture of 50% CS and 50% artificial cerebrospinal fluid (ACSF) containing (in mM): 125 NaCl, 1.25 NaH2PO4, 2.5 KCl, 25 NaHCO3, 2 CaCl2, 1 MgCl2 and 15 glucose, at room temperature for 10–20 min before transfer to the recording chamber.Slice electrophysiology. All data acquisition and analyses were carried out blinded to the genotype and treatment. Electrophysiology was performed in an interface chamber (Fine Science Tools). Oxygenated ACSF (95%/5% O2/CO2, 31 °C) was perfused into the recording chamber at the rate of 1.5 ml min−1. Electrophysiological traces were digitized and stored using a Digidata 1320A and Clampex software (Axon Instruments). fEPSPs were recorded in the stratum radia-tum with an ACSF-filled glass recording electrode (1–3 MΩ). The relationship between fibre volley amplitude and fEPSP slope over various stimulus intensities was used to assess baseline synaptic transmission. All subsequent experimental stimuli were set to an intensity that evoked a 30–40% of the maximal fEPSP slope. Slices that did not exhibit stable fEPSP slopes during the first 20 min of recording were excluded from the analysis. Paired-pulse facilitation was measured at varying interstimulus intervals (20, 50, 100, 200 and 300 ms). LTP was induced by two trains of high-frequency stimulation (100 Hz for 1 s) with a 20-s intertrain interval. Synaptic efficacy was monitored for 20 min before and 70 min after LTP induction by recording fEPSPs every 20 s (three traces were averaged over succeeding 1-min intervals). For the quantification of the last 10 min of the LTP recording (Fig. 2i), slices were averaged per mouse, and statistical analysis was done on the animals (n = 6–7 mice, 15–20 slices, two-tailed t-test).Intracerebral injection of ASO. Mice were anaesthetized with isoflurane and placed on a computer-guided stereotaxic instrument (Angle Two Stereotaxic Instrument, Leica Microsystems) that is fully integrated with the Franklin and Paxinos35 mouse brain atlas through a control panel. Anaesthesia (isoflurane 3%) was continuously delivered via a small face mask. Ketoprofen 5 mg kg−1 was admin-istered subcutaneously at the initiation of surgery. After sterilizing the surgical site with betadine and 70% alcohol, a midline incision was made over the skull and a small hole was drilled through the skull above the right lateral ventricle. A total of 500 μ g MECP2-ASO or saline was delivered using a Hamilton syringe connected to a motorized nanoinjector at 0.3 μ l min−1. The coordinates used relative to bregma were: anteroposterior (AP) = − 0.2 mm, medial lateral (ML) = 1 mm, dorsal ven-tral (DV) = − 3 mm, based on a calibration study indicating these coordinates as leading to the right ventricle in our mice. To allow diffusion of the solution into the brain, the needle was left for 5 min on the site of injection. The incision was manually closed with suture. Carprofen-containing food pellets were provided for 5 days after the surgery. Two weeks after the surgery,the animals were euthanized and their brains were dissected for RNA and protein analysis.Surgical implantation of cannula and osmotic pumps. Two days before surgery, a micro-osmotic pump (Alzet model 1004, Durect) was filled with 500 μ g MECP2-ASO or control-ASO dissolved in 100 μ l saline. The pump was then connected through a plastic catheter to a cannula (Alzet Brain Infusion Kit 3, Durect) (see Extended Data Fig. 6a). The pump was designed to deliver the drug at a rate of 0.11 μ l h−1 for 28 days. The cannula plus pump assembly was primed in sterile saline for 2 days at 37 °C. Mice were anaesthetized with isoflurane and placed on a computer-guided stereotaxic instrument (Angle Two Stereotaxic Instrument, Leica Microsystems). Anaesthesia (isoflurane 3%) was continuously maintained via a small face mask. Ketoprofen 5 mg kg−1 was administered subcutaneously at the initiation of the surgery. After sterilizing the surgical site with betadine and 70% alcohol, a midline incision was made over the skull and a subcutaneous pocket was generated on the back of the animal. Next, the pump was inserted into the pocket and the cannula was stereotactically implanted to deliver the drug in the right ven-tricle using the following coordinates: AP = − 0.2 mm, ML = 1 mm, DV = − 3 mm. The incision was sutured shut. Carprofen-containing food pellets were provided for 5 days after the surgery. The pump was disconnected and removed 28 days after the initiation of treatment. Two additional weeks were given to the animals to recover before any behavioural testing.EEG monitoring. Mice were anaesthetized with isoflurane and mounted in a ster-eotaxic frame. Under aseptic conditions, each mouse was surgically implanted with three recording electrodes (Teflon-coated silver wire, 125 μ m in diameter) aimed at the subdural space of left frontal cortex, left parietal cortex and right parietal cortex. The reference electrode was then positioned in the occipital region of the skull.
Letter reSeArCH
© 2015 Macmillan Publishers Limited. All rights reserved
All electrode wires were attached to a miniature connector (Harwin Connector). After 3–5 days of post-surgical recovery, cortical EEG activity (filtered between 0.5 and 5 kHz, sampled at 2 kHz) and behaviour were simultaneously recorded in freely moving mice for 2 h per day over 3–5 days36.EEG data analysis. All the EEG recordings were qualitatively and manu-ally analysed by experimenters blinded to the mouse genotype and treatment. Electrographic seizure activities were visually identified and matched with the behavioural seizure, if applicable. Other abnormal epileptiform spikes were also identified visually37.Lymphoblasts culture and transfection with ASOs. Following informed con-sent, approved by the Institutional Review Board for Human Subject Research at Baylor College of Medicine (H-18122), a venous blood sample was provided by five individuals affected with MECP2 duplication syndrome and five age-matched controls to establish immortalized B-lymphoblastoid cell lines, following standard procedures. Human B-lymphoblastoid cells were cultured in suspension in RPMI 1640 medium with l-glutamine, penicillin–streptomycin and 10% (v/v) FBS. A day before transfection, cells were seeded in 6-wells plates at a density of 1 × 10⁶ cells in a total volume of 2 ml complete medium. Transfection mixture was prepared by combining 20 μ l ASO (at the desire concentration), 4 μ l transfection reagent (TurboFect, R0531, Thermo Scientific) and 180 μ l serum-free RPMI medium. The mix was incubated at room temperature for 15 min before adding to the cells. RNA was extracted from lymphoblasts 48 h after transfection. Lymphoblastoid cells from the age-matched control donors and the non-treated MECP2 duplication cells were incubated with 4.8 μ M control-ASO.
Statistical analysis. Statistical significance was analysed using GraphPad Prism. The number of animals used (n), and the specific statistical tests used are indicated for each experiment in the figure legends. Sample size in behavioural studies was based on previous reports using transgenic mice with the same background. Mice were randomly assigned to vehicle or treatment groups using Excel software to generate a table of random numbers, and the experimenter was always blinded to the treatment. For behavioural assays, all population values appear normally distributed. Equal variances were never assumed, and the Geisser–Greenhouse correction for sphericity was always applied when using ANOVA.
31. Cook, M. N., Williams, R. W. & Flaherty, L. Anxiety-related behaviors in the elevated zero-maze are affected by genetic factors and retinal degeneration. Behav. Neurosci. 115, 468–476 (2001).
32. Kim, D. et al. TopHat2: accurate alignment of transcriptomes in the presence of insertions, deletions and gene fusions. Genome Biol. 14, R36 (2013).
33. Anders, S., Pyl, P. T. & Huber, W. HTSeq–a Python framework to work with high-throughput sequencing data. Bioinformatics 31, 166–169 (2015).
34. Anders, S. & Huber, W. Differential expression analysis for sequence count data. Genome Biol. 11, R106 (2010).
35. Paxinos, G. & Franklin, K. B. The Mouse Brain in Stereotaxic Coordinates (Academic, 2001).
36. Han, K. et al. SHANK3 overexpression causes manic-like behaviour with unique pharmacogenetic properties. Nature 503, 72–77 (2013).
37. Roberson, E. D. et al. Amyloid-β /Fyn-induced synaptic, network, and cognitive impairments depend on tau levels in multiple mouse models of Alzheimer’s disease. J. Neurosci. 31, 700–711 (2011).
LetterreSeArCH
© 2015 Macmillan Publishers Limited. All rights reserved
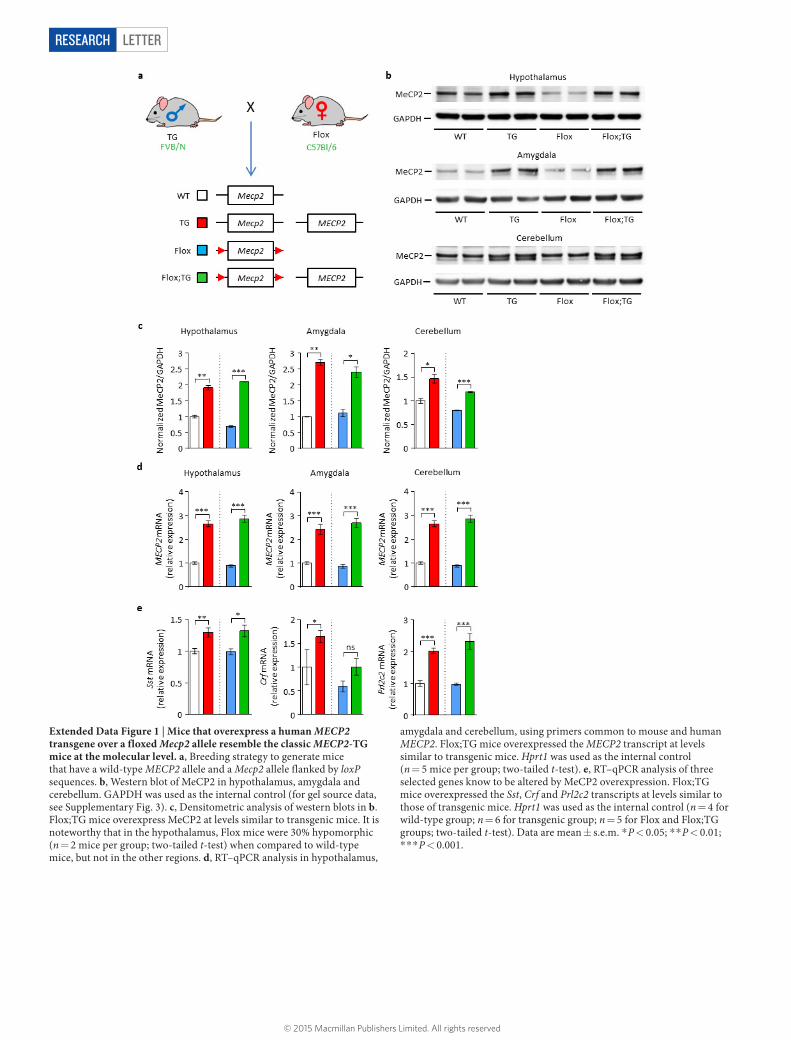
Extended Data Figure 1 | Mice that overexpress a human MECP2 transgene over a floxed Mecp2 allele resemble the classic MECP2-TG mice at the molecular level. a, Breeding strategy to generate mice that have a wild-type MECP2 allele and a Mecp2 allele flanked by loxP sequences. b, Western blot of MeCP2 in hypothalamus, amygdala and cerebellum. GAPDH was used as the internal control (for gel source data, see Supplementary Fig. 3). c, Densitometric analysis of western blots in b. Flox;TG mice overexpress MeCP2 at levels similar to transgenic mice. It is noteworthy that in the hypothalamus, Flox mice were 30% hypomorphic (n = 2 mice per group; two-tailed t-test) when compared to wild-type mice, but not in the other regions. d, RT–qPCR analysis in hypothalamus,
amygdala and cerebellum, using primers common to mouse and human MECP2. Flox;TG mice overexpressed the MECP2 transcript at levels similar to transgenic mice. Hprt1 was used as the internal control (n = 5 mice per group; two-tailed t-test). e, RT–qPCR analysis of three selected genes know to be altered by MeCP2 overexpression. Flox;TG mice overexpressed the Sst, Crf and Prl2c2 transcripts at levels similar to those of transgenic mice. Hprt1 was used as the internal control (n = 4 for wild-type group; n = 6 for transgenic group; n = 5 for Flox and Flox;TG groups; two-tailed t-test). Data are mean ± s.e.m. * P < 0.05; * * P < 0.01; * * * P < 0.001.
Letter reSeArCH
© 2015 Macmillan Publishers Limited. All rights reserved
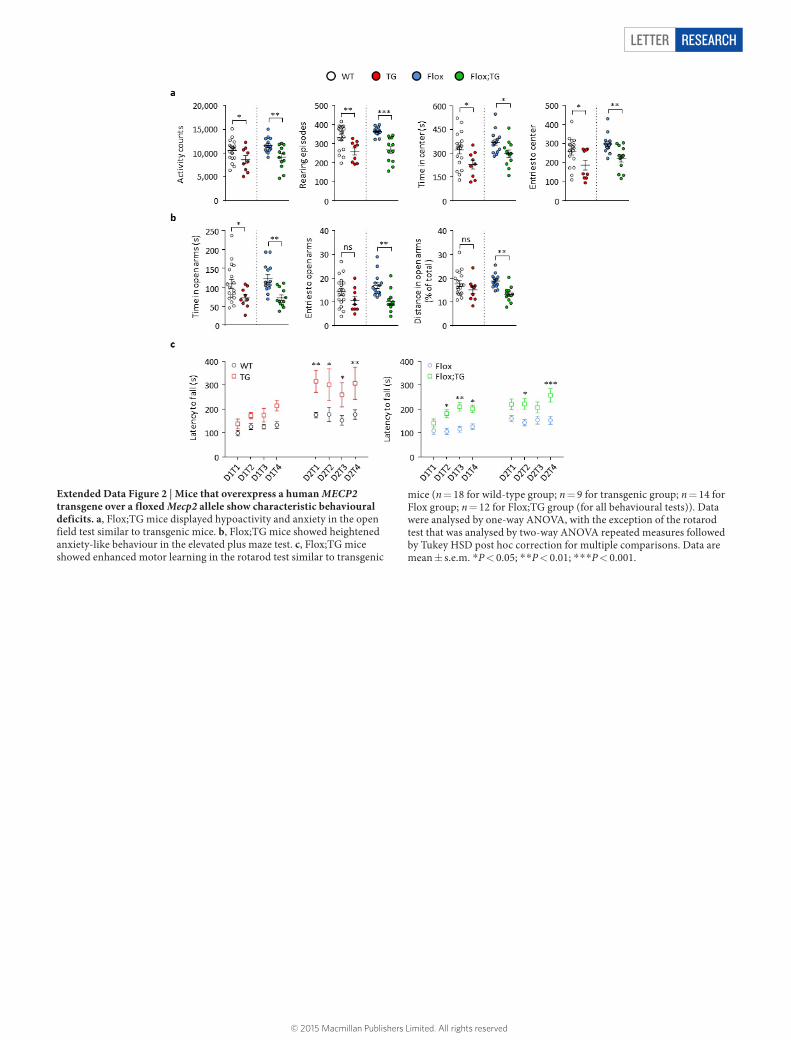
Extended Data Figure 2 | Mice that overexpress a human MECP2 transgene over a floxed Mecp2 allele show characteristic behavioural deficits. a, Flox;TG mice displayed hypoactivity and anxiety in the open field test similar to transgenic mice. b, Flox;TG mice showed heightened anxiety-like behaviour in the elevated plus maze test. c, Flox;TG mice showed enhanced motor learning in the rotarod test similar to transgenic
mice (n = 18 for wild-type group; n = 9 for transgenic group; n = 14 for Flox group; n = 12 for Flox;TG group (for all behavioural tests)). Data were analysed by one-way ANOVA, with the exception of the rotarod test that was analysed by two-way ANOVA repeated measures followed by Tukey HSD post hoc correction for multiple comparisons. Data are mean ± s.e.m. *P < 0.05; * *P < 0.01; * * *P < 0.001.
LetterreSeArCH
© 2015 Macmillan Publishers Limited. All rights reserved
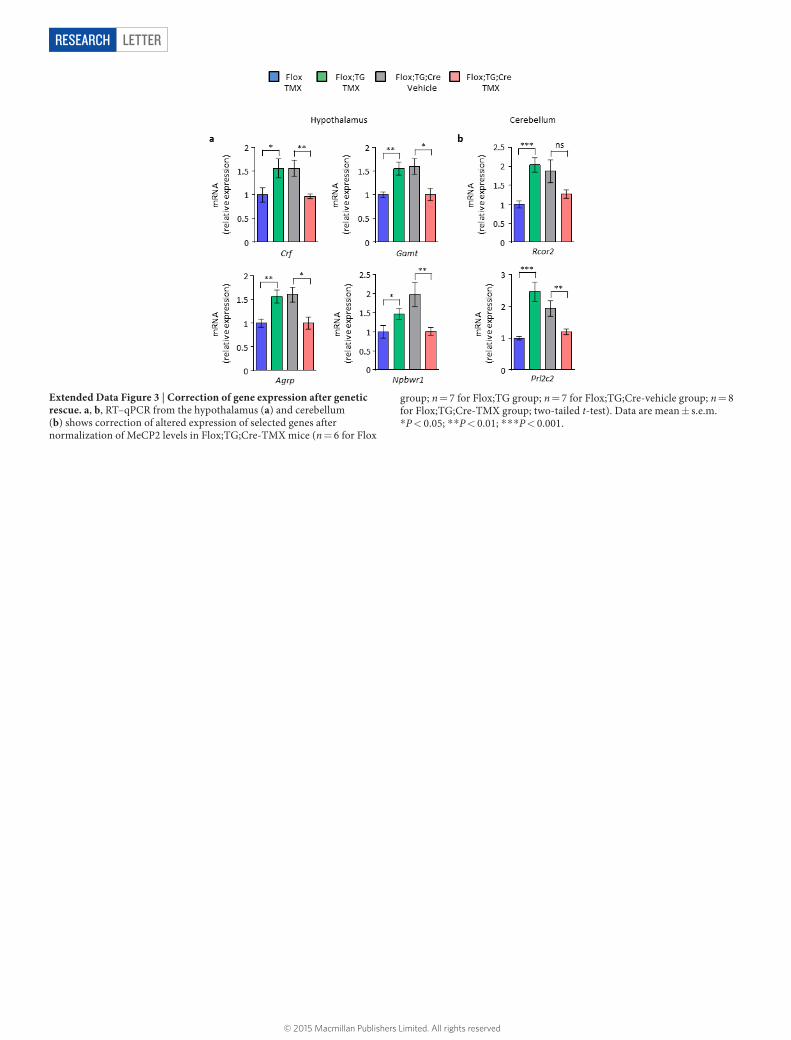
Extended Data Figure 3 | Correction of gene expression after genetic rescue. a, b, RT–qPCR from the hypothalamus (a) and cerebellum (b) shows correction of altered expression of selected genes after normalization of MeCP2 levels in Flox;TG;Cre-TMX mice (n = 6 for Flox
group; n = 7 for Flox;TG group; n = 7 for Flox;TG;Cre-vehicle group; n = 8 for Flox;TG;Cre-TMX group; two-tailed t-test). Data are mean ± s.e.m. *P < 0.05; * *P < 0.01; * * *P < 0.001.
Letter reSeArCH
© 2015 Macmillan Publishers Limited. All rights reserved
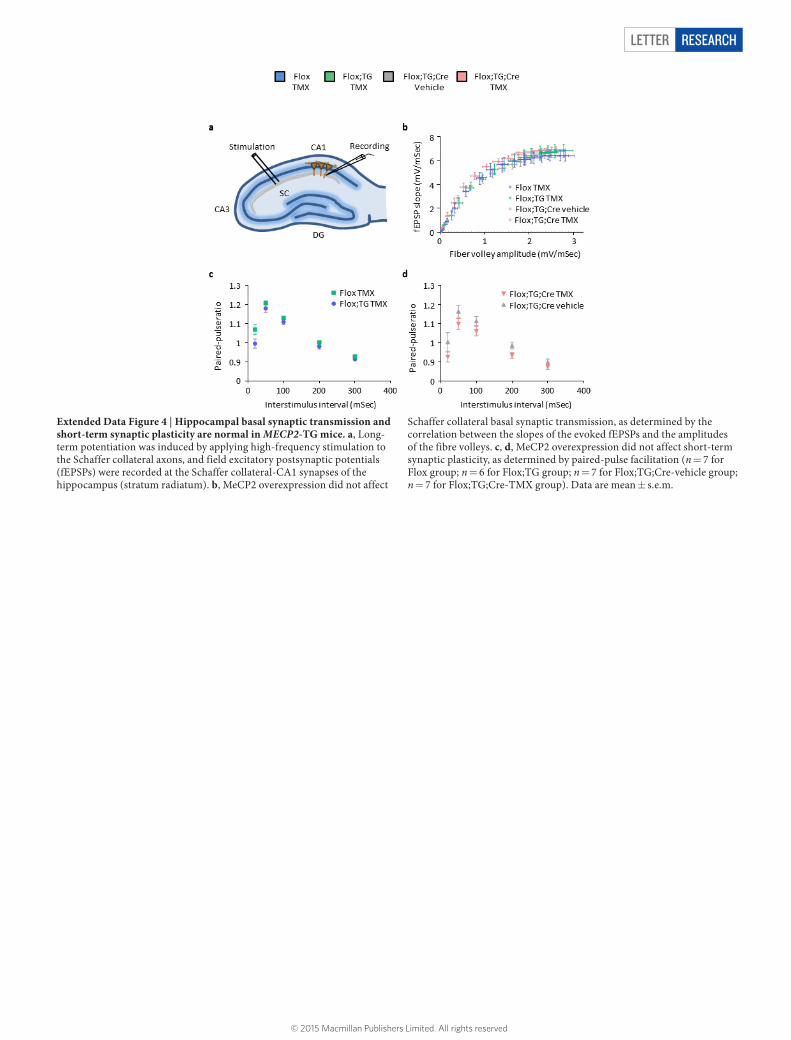
Extended Data Figure 4 | Hippocampal basal synaptic transmission and short-term synaptic plasticity are normal in MECP2-TG mice. a, Long-term potentiation was induced by applying high-frequency stimulation to the Schaffer collateral axons, and field excitatory postsynaptic potentials (fEPSPs) were recorded at the Schaffer collateral-CA1 synapses of the hippocampus (stratum radiatum). b, MeCP2 overexpression did not affect
Schaffer collateral basal synaptic transmission, as determined by the correlation between the slopes of the evoked fEPSPs and the amplitudes of the fibre volleys. c, d, MeCP2 overexpression did not affect short-term synaptic plasticity, as determined by paired-pulse facilitation (n = 7 for Flox group; n = 6 for Flox;TG group; n = 7 for Flox;TG;Cre-vehicle group; n = 7 for Flox;TG;Cre-TMX group). Data are mean ± s.e.m.
LetterreSeArCH
© 2015 Macmillan Publishers Limited. All rights reserved
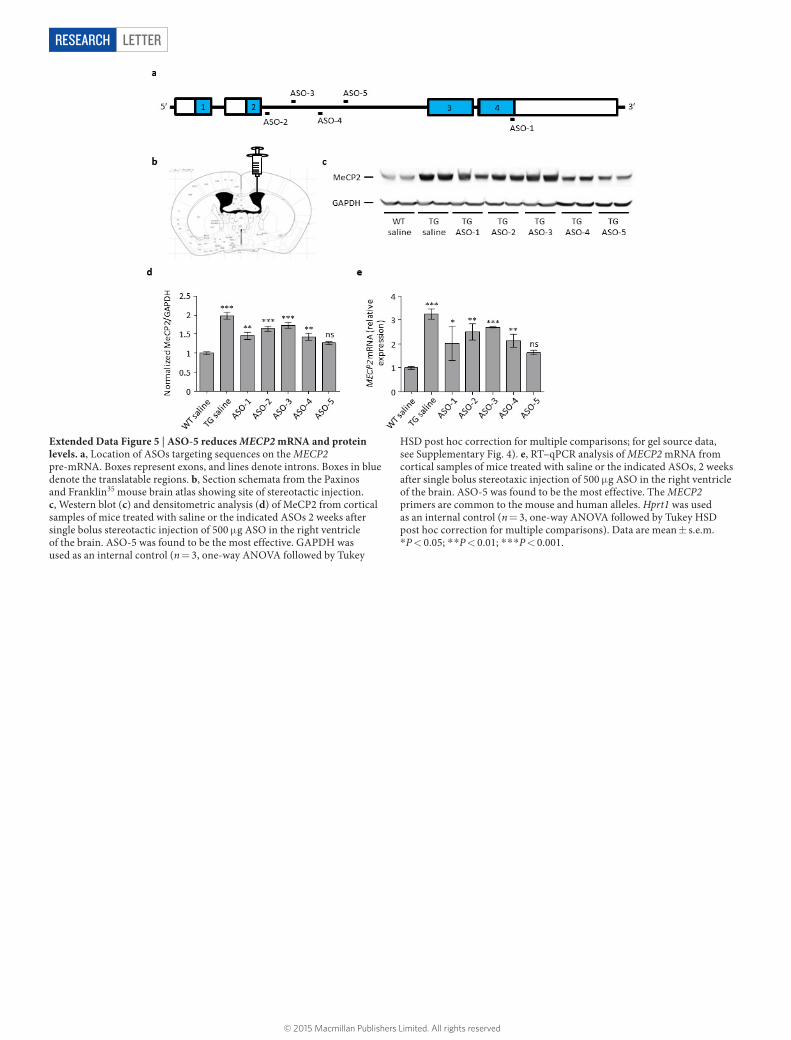
Extended Data Figure 5 | ASO-5 reduces MECP2 mRNA and protein levels. a, Location of ASOs targeting sequences on the MECP2 pre-mRNA. Boxes represent exons, and lines denote introns. Boxes in blue denote the translatable regions. b, Section schemata from the Paxinos and Franklin35 mouse brain atlas showing site of stereotactic injection. c, Western blot (c) and densitometric analysis (d) of MeCP2 from cortical samples of mice treated with saline or the indicated ASOs 2 weeks after single bolus stereotactic injection of 500 μ g ASO in the right ventricle of the brain. ASO-5 was found to be the most effective. GAPDH was used as an internal control (n = 3, one-way ANOVA followed by Tukey
HSD post hoc correction for multiple comparisons; for gel source data, see Supplementary Fig. 4). e, RT–qPCR analysis of MECP2 mRNA from cortical samples of mice treated with saline or the indicated ASOs, 2 weeks after single bolus stereotaxic injection of 500 μ g ASO in the right ventricle of the brain. ASO-5 was found to be the most effective. The MECP2 primers are common to the mouse and human alleles. Hprt1 was used as an internal control (n = 3, one-way ANOVA followed by Tukey HSD post hoc correction for multiple comparisons). Data are mean ± s.e.m. *P < 0.05; * *P < 0.01; * * *P < 0.001.
Letter reSeArCH
© 2015 Macmillan Publishers Limited. All rights reserved
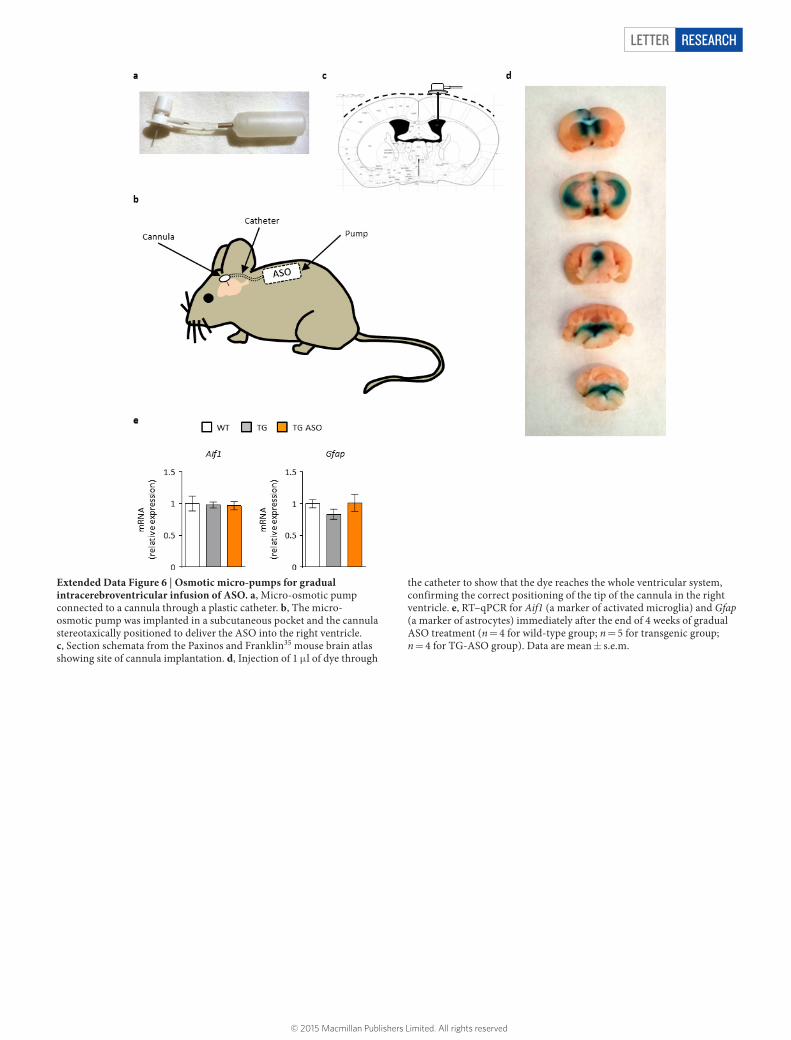
Extended Data Figure 6 | Osmotic micro-pumps for gradual intracerebroventricular infusion of ASO. a, Micro-osmotic pump connected to a cannula through a plastic catheter. b, The micro-osmotic pump was implanted in a subcutaneous pocket and the cannula stereotaxically positioned to deliver the ASO into the right ventricle. c, Section schemata from the Paxinos and Franklin35 mouse brain atlas showing site of cannula implantation. d, Injection of 1 μ l of dye through
the catheter to show that the dye reaches the whole ventricular system, confirming the correct positioning of the tip of the cannula in the right ventricle. e, RT–qPCR for Aif1 (a marker of activated microglia) and Gfap (a marker of astrocytes) immediately after the end of 4 weeks of gradual ASO treatment (n = 4 for wild-type group; n = 5 for transgenic group; n = 4 for TG-ASO group). Data are mean ± s.e.m.
LetterreSeArCH
© 2015 Macmillan Publishers Limited. All rights reserved
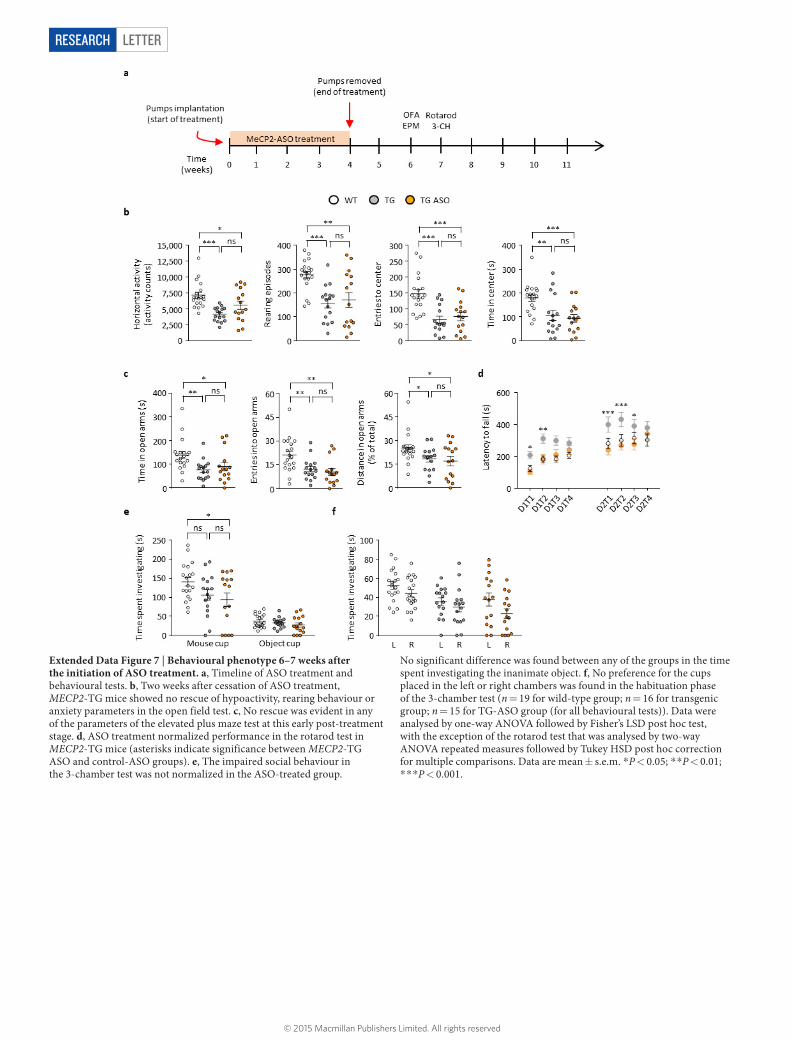
Extended Data Figure 7 | Behavioural phenotype 6–7 weeks after the initiation of ASO treatment. a, Timeline of ASO treatment and behavioural tests. b, Two weeks after cessation of ASO treatment, MECP2-TG mice showed no rescue of hypoactivity, rearing behaviour or anxiety parameters in the open field test. c, No rescue was evident in any of the parameters of the elevated plus maze test at this early post-treatment stage. d, ASO treatment normalized performance in the rotarod test in MECP2-TG mice (asterisks indicate significance between MECP2-TG ASO and control-ASO groups). e, The impaired social behaviour in the 3-chamber test was not normalized in the ASO-treated group.
No significant difference was found between any of the groups in the time spent investigating the inanimate object. f, No preference for the cups placed in the left or right chambers was found in the habituation phase of the 3-chamber test (n = 19 for wild-type group; n = 16 for transgenic group; n = 15 for TG-ASO group (for all behavioural tests)). Data were analysed by one-way ANOVA followed by Fisher’s LSD post hoc test, with the exception of the rotarod test that was analysed by two-way ANOVA repeated measures followed by Tukey HSD post hoc correction for multiple comparisons. Data are mean ± s.e.m. *P < 0.05; * *P < 0.01; * * *P < 0.001.
Letter reSeArCH
© 2015 Macmillan Publishers Limited. All rights reserved
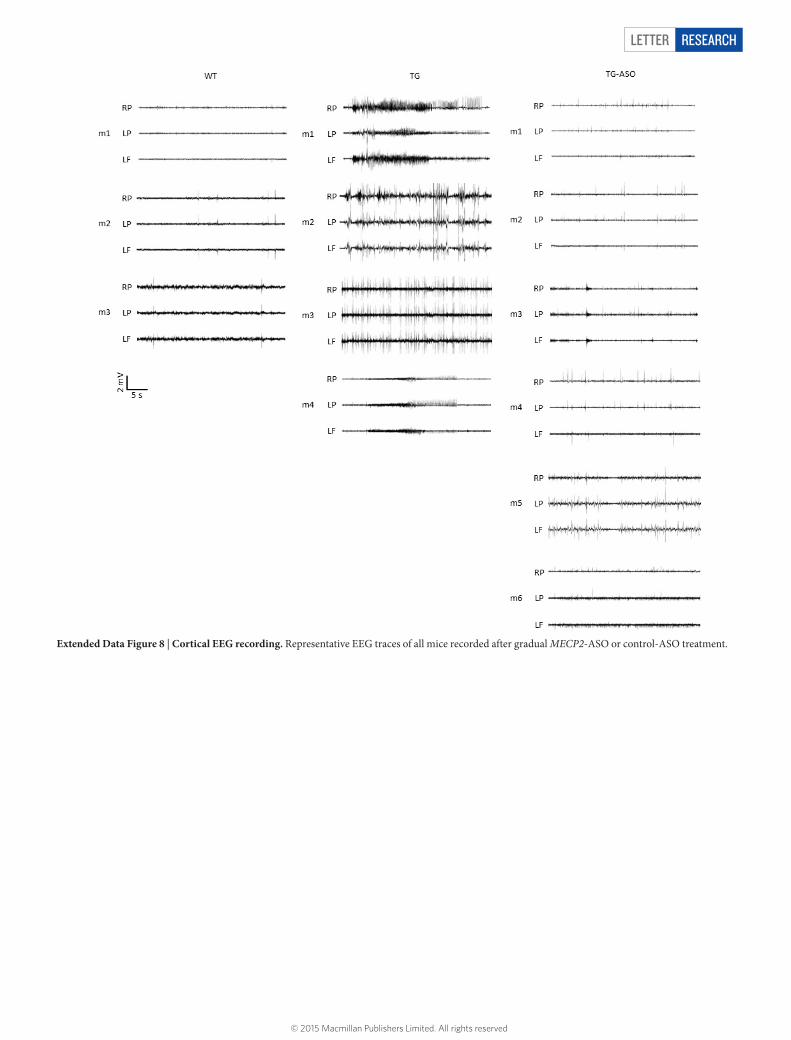
Extended Data Figure 8 | Cortical EEG recording. Representative EEG traces of all mice recorded after gradual MECP2-ASO or control-ASO treatment.
LetterreSeArCH
© 2015 Macmillan Publishers Limited. All rights reserved
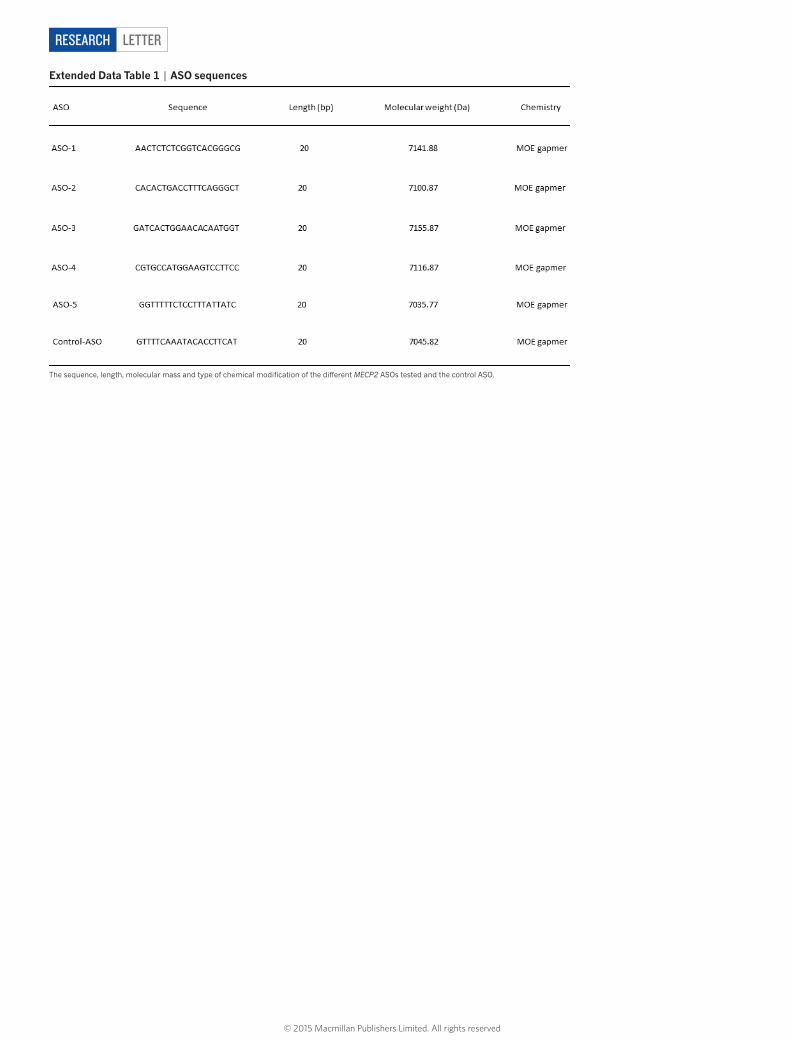
extended Data table 1 | ASO sequences
The sequence, length, molecular mass and type of chemical modification of the different MECP2 ASOs tested and the control ASO.
Letter reSeArCH
© 2015 Macmillan Publishers Limited. All rights reserved
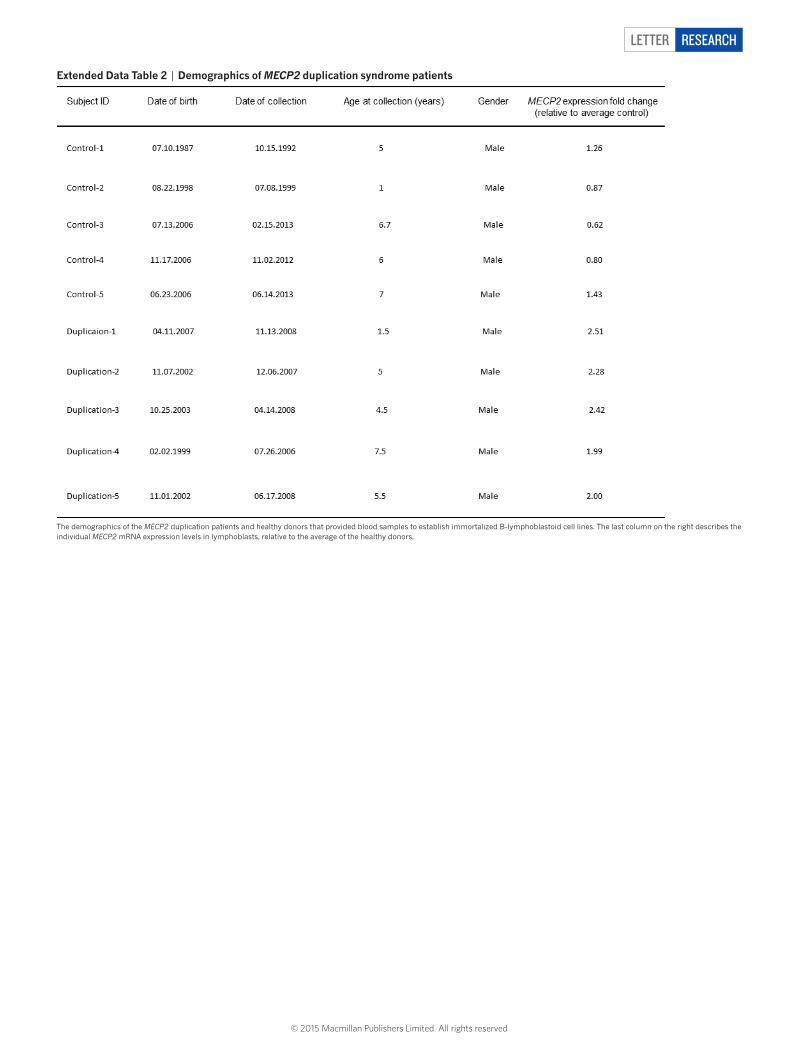
extended Data table 2 | Demographics of MECP2 duplication syndrome patients
The demographics of the MECP2 duplication patients and healthy donors that provided blood samples to establish immortalized B-lymphoblastoid cell lines. The last column on the right describes the individual MECP2 mRNA expression levels in lymphoblasts, relative to the average of the healthy donors.