results of the cavity intergrated tests in horizontal test ... · tuning system were all redesigned...
TRANSCRIPT
November 30, 2015 LCLSII-TN-XXXX
Results of the cavity Intergrated tests inHorizontal Test Stand at FNAL(AES021, AES028 and AES027)
LCLS-II TN-15-43
11/23/2015
Nikolay Solyak, Ivan Gonin, Anna Gressellino,Chuck Grimm, Timergali Khabiboulline, Andrei
Lunin, Joe Ozelis, Yuri Pischalnikov, OlegProkofiev, Warren Schappert, Dmitri Sergatskov,
Jeremiah Holzbauer, Genfa Wu
L C L S - I I T E C H N I C A L N O T E
November 30, 2015 LCLSII-TN-XXXX 2
Contents ........................................................................................................................................ 1
Results of the cavity Intergrated tests in Horizontal Test Stand at FNAL (AES021,AES028 and AES027) ....................................................................................................... 1
1 Abstract ................................................................................................................... 3
2 Introduction ............................................................................................................ 3
3 Cavity assembly and configuration........................................................................... 4
4 Instrumentation....................................................................................................... 6
4.1 Cavity instrumentation ...................................................................................... 6
4.2 Fundamental Power Coupler (FPC) instrumentation .......................................... 6
5 Coupler RF power conditioning at room temperature. ............................................. 9
6 Coupler RF power tests with cavity “ON” and “OFF” resonance at 2K ..................... 11
6.1 Temperatures and heat flux measurements at 80K zone. ................................ 13
6.2 Temperature measurements heat flux at 5K zone ........................................... 15
6.3 Simulation results ............................................................................................ 17
7 Coupler and cavity vacuum .................................................................................... 17
8 CAVITY Q0 MEASUREMENTS .................................................................................. 18
9 HOM COUPLER HEATING ....................................................................................... 20
10 Tuner Performance. Microphonics and Frequency Control Studies. ........................ 21
11 CONCLUSION ......................................................................................................... 23
12 ACKNOWLEDGMENT ............................................................................................. 23
13 REFERENCES .......................................................................................................... 23
14 APPENDIX A ........................................................................................................... 24
14.1 Copper braid calibration test ....................................................................... 24
14.2 AL5N braid calibration test .......................................................................... 24

L C L S - I I T E C H N I C A L N O T E
November 30, 2015 LCLSII-TN-XXXX 3
1 AbstractNew auxiliary components have been designed and fabricated for the 1.3 GHz SRF cavities
comprising the LCLS-II linac. In particular, the LCLS-II cavity’s helium vessel, high-power inputcoupler, higher-order mode (HOM) couplers and feedthroughs, magnetic shielding, and cavitytuning system were all redesigned to meet LCLS-II specifications. As part of design verification(DV) program all new components were tested in HTS to verify their performances. Finally, twofully dressed cavities in LCLS-II configuration were tested in HTS to demonstrate that cavity canpreserve high Q0 in cryostat. All auxiliary components (main couplers, HOM couplers, fast andslow tuner two-layer magnetic shielding) as well as regime of cool-down and magneticcompensation coils were teste in these integrated tests. In tests we studied performance of thefundamental power coupler in several regimes at the power level up to 4-6 kilowatts incontinuous-wave mode, close or above LCLS-II specification. Thermal regimes of differentcomponents and efficiency of thermal intercepts was investigated. The results of the tests aresummarized in this technical note.
2 IntroductionThe LCLS-II 4 GeV superconducting linac [1] is based on XFEL/ILC technology intensively
developed over the last couple of decades. A major difference however is that LCLS-II operatesin the CW regime, whereas the XFEL/ILC will operate in pulsed mode. This requiredmodifications to or complete re-design of some of the basic components: cavity helium vessel(HV), tuner, power coupler, and other cryomodule parts in order to accommodate the muchhigher cryogenic loads expected in the CW regime. To accelerate the production of two pre-production cryomodules, it was decided to use existing ILC bare cavities and fundamental powercouplers, which led to some constraints.
The major LCLS-II modifications of the dressed cavity and auxiliaries are as follows:
· Nitrogen doped cavity to reduce losses in CW regime. LCLS-II requirements: Q0 >2.7 x 10¹⁰ at the nominal gradient of 16 MV/m.
· Helium vessel with a larger diameter(4” vs. 2.25”) two-phase connection toaccommodate higher heat flux, and two helium supply inlets to provide more uniformthermal gradients during cooldown, which are crucial to effective magnetic fluxexpulsion, and hence low surface resistance.
· Two layers of magnetic shielding to reduce residual magnetic field at the cavitybelow 5mG. Compensation coils outside of HTS cryostat reduces earth magneticfield.
· New end-lever tuner design which had to remain compatible with the “short-short”version of the ILC cavity adopted for the pre-production cryomodule. This design

L C L S - I I T E C H N I C A L N O T E
November 30, 2015 LCLSII-TN-XXXX 4
must also fit the “short-long” XFEL version of the cavity adopted for productioncryomodules.
· Design of the fundamental power coupler (FPC) was modified to fulfil LCLS-IIrequirements: loaded QL=4x 10⁷ and average power up to 6.4kW (includes 1.6kW ofreflected power). Major modifications include reduction of the antenna length by8.5mm and increase in the thickness of copper plating on the inner conductor ofwarm section to reduce coupler temperature.
To minimize the risks to the project all technical solutions and new designs have to beprototyped and tested in a cryomodule. Testing was focused on the most critical components andtechnical solutions, and performed in the Horizontal Test Stand cryostat (HTS) under conditionsapproximating the final cryomodule configuration. An integrated cavity test was the last stage ofthe design verification program. Two fully integrated cavities(AES021 and AES027) were testedat HTS. One cavity (AES028) was installed and partially tested (coupler) but due tomultipactoring problems in HOM couplers test was not completed. In these tests a nitrogen dopedcavity, previously qualified in a vertical cryostat (VTS), was dressed and fully assembled with allcomponents (fundamental power coupler, two-layer magnetic shielding, XFEL-typefeedthroughs, end-lever tuner). All components were previously individually tested in the HTSwith N-doped or un-doped cavities, but not as a complete integrated system. One major goal ofthis integrated test was to demonstrate that high Q0 values demonstrated in vertical test can bepreserved even when additional sources of heating from the power coupler and tuner andpotential additional external magnetic fields from auxiliary components are present.
Other important studies related to design verification included thermal performance andpower handling of the power coupler, heating of HOM couplers and tuner components, tunerperformance, sensitivity to microphonics, and frequency control. Data from this test programallows component design to be verified and certain other aspects of cryomodule design (e.g.,component thermal anchoring) to be finalized.
3 Cavity assembly and configurationDressed cavities were tested previously in a vertical test stand (VTS) without HOM
feedthroughs. HOM feedthroughs were later installed in a clean room and after a brief highpressure water rinse, a pumping manifold was installed, the cavity evacuated, and leak checked.The cavity field probe was not removed or replaced. The cavity was transported to a differentclean room for installation of the coupler cold section. No additional cleaning of the cavitysurfaces took place either as part of or subsequent to coupler installation.
The tuner was installed with a pre-determined cavity compression/frequency offset. Twolayers of Cryoperm® 10 magnetic shield were installed on the cavity. Magnetic shield end capswere comprised of a single layer and connected to the outer layer of the shield. AdditionalMetGlas® foil [3], a thin and flexible magnetic shield alloy, was used to cover the majority of the
L C L S - I I T E C H N I C A L N O T E
November 30, 2015 LCLSII-TN-XXXX 5
remaining openings in the magnetic shields. The coupler beam pipe port was left uncovered whilethe tuner-side beam pipe port was covered by the magnetic foil. Multilayer insulation was placedbetween the inner and outer magnetic shields. The inside surfaces of the magnetic shields arecovered with an insulating material (Kapton® tape) in order to electrically isolate them andminimize any potential thermal currents. The remnant magnetic fields of all components (e.g.,tuner, feedthroughs, etc.) were measured at a distance of 2” with a 3-D magnetometer anddemagnetized if needed before they were attached to the cavity. All fields were found to be lessthan 5mG with the exception of the tuner motor. Since it was located at least 10” away from thecavity, it was not magnetically shielded.
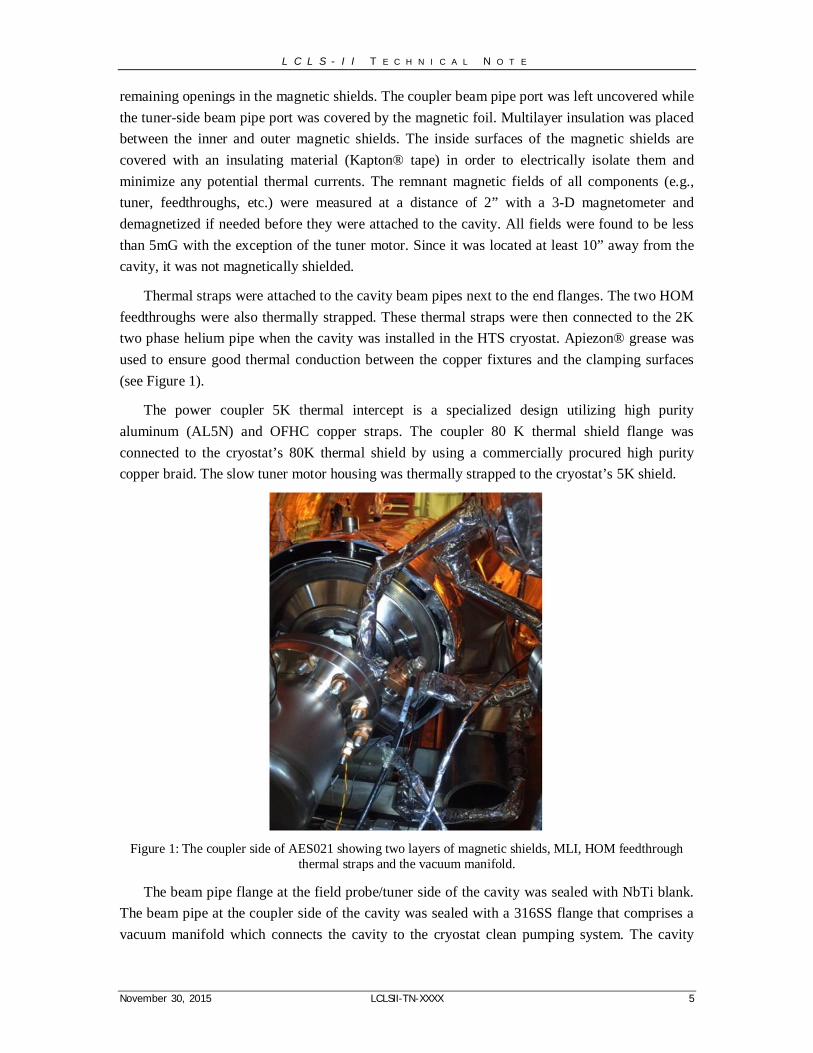
Thermal straps were attached to the cavity beam pipes next to the end flanges. The two HOMfeedthroughs were also thermally strapped. These thermal straps were then connected to the 2Ktwo phase helium pipe when the cavity was installed in the HTS cryostat. Apiezon® grease wasused to ensure good thermal conduction between the copper fixtures and the clamping surfaces(see Figure 1).
The power coupler 5K thermal intercept is a specialized design utilizing high purityaluminum (AL5N) and OFHC copper straps. The coupler 80 K thermal shield flange wasconnected to the cryostat’s 80K thermal shield by using a commercially procured high puritycopper braid. The slow tuner motor housing was thermally strapped to the cryostat’s 5K shield.
Figure 1: The coupler side of AES021 showing two layers of magnetic shields, MLI, HOM feedthroughthermal straps and the vacuum manifold.
The beam pipe flange at the field probe/tuner side of the cavity was sealed with NbTi blank.The beam pipe at the coupler side of the cavity was sealed with a 316SS flange that comprises avacuum manifold which connects the cavity to the cryostat clean pumping system. The cavity
L C L S - I I T E C H N I C A L N O T E
November 30, 2015 LCLSII-TN-XXXX 6
was actively evacuated during testing. The cryostat insulating space was evacuated to 1 x 10⁻⁶Torr, and leak checked, before cooldown commenced.
4 Instrumentation
4.1 Cavity instrumentationIn order to extract as much performance information as possible for this integrated test, the
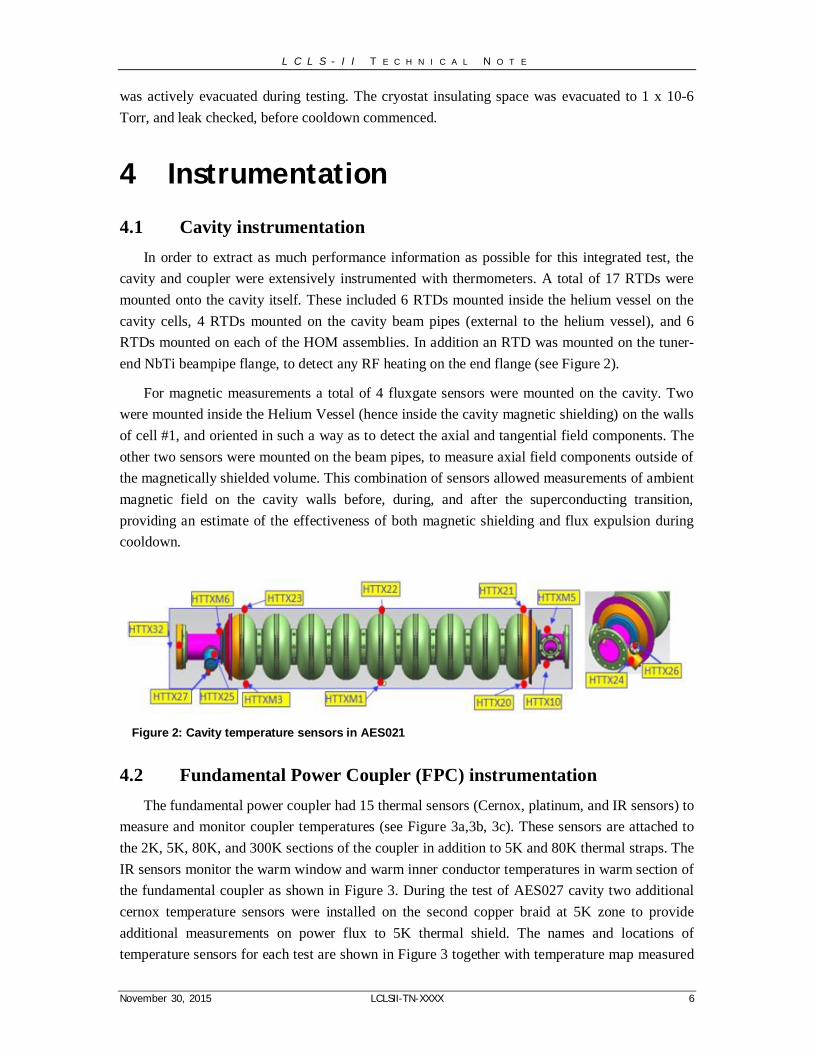
cavity and coupler were extensively instrumented with thermometers. A total of 17 RTDs weremounted onto the cavity itself. These included 6 RTDs mounted inside the helium vessel on thecavity cells, 4 RTDs mounted on the cavity beam pipes (external to the helium vessel), and 6RTDs mounted on each of the HOM assemblies. In addition an RTD was mounted on the tuner-end NbTi beampipe flange, to detect any RF heating on the end flange (see Figure 2).
For magnetic measurements a total of 4 fluxgate sensors were mounted on the cavity. Twowere mounted inside the Helium Vessel (hence inside the cavity magnetic shielding) on the wallsof cell #1, and oriented in such a way as to detect the axial and tangential field components. Theother two sensors were mounted on the beam pipes, to measure axial field components outside ofthe magnetically shielded volume. This combination of sensors allowed measurements of ambientmagnetic field on the cavity walls before, during, and after the superconducting transition,providing an estimate of the effectiveness of both magnetic shielding and flux expulsion duringcooldown.
Figure 2: Cavity temperature sensors in AES021
4.2 Fundamental Power Coupler (FPC) instrumentationThe fundamental power coupler had 15 thermal sensors (Cernox, platinum, and IR sensors) to
measure and monitor coupler temperatures (see Figure 3a,3b, 3c). These sensors are attached tothe 2K, 5K, 80K, and 300K sections of the coupler in addition to 5K and 80K thermal straps. TheIR sensors monitor the warm window and warm inner conductor temperatures in warm section ofthe fundamental coupler as shown in Figure 3. During the test of AES027 cavity two additionalcernox temperature sensors were installed on the second copper braid at 5K zone to provideadditional measurements on power flux to 5K thermal shield. The names and locations oftemperature sensors for each test are shown in Figure 3 together with temperature map measured
L C L S - I I T E C H N I C A L N O T E
November 30, 2015 LCLSII-TN-XXXX 7
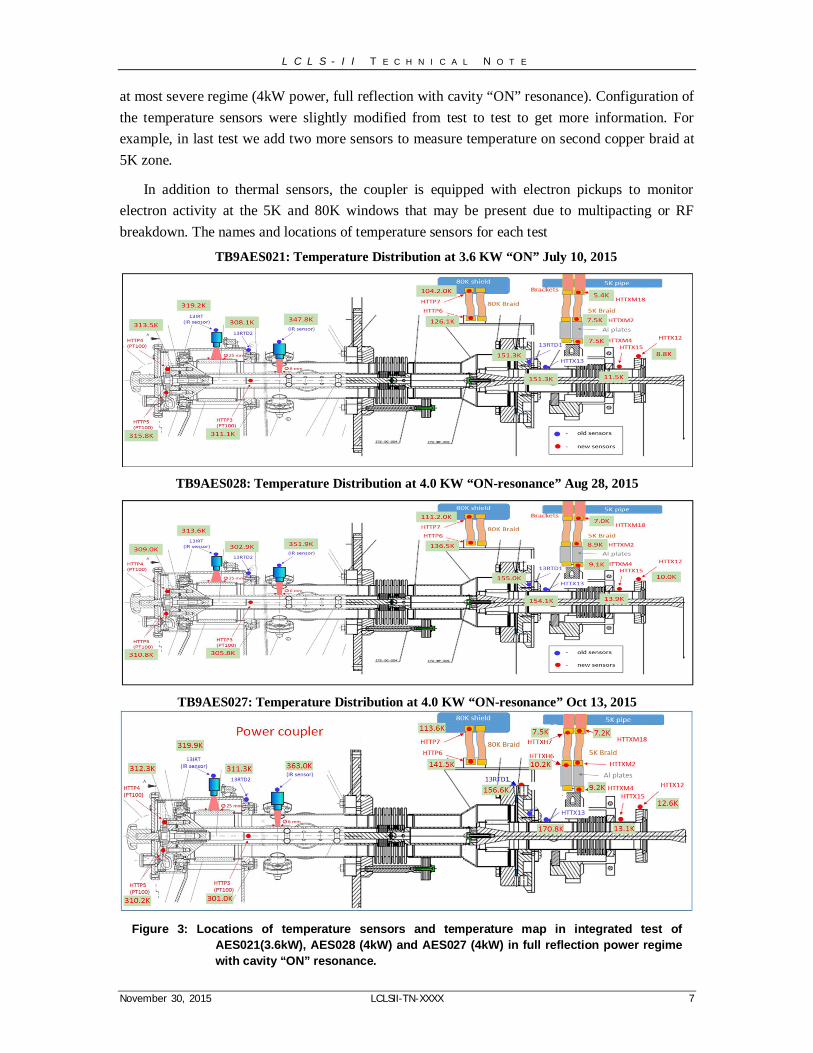
at most severe regime (4kW power, full reflection with cavity “ON” resonance). Configuration ofthe temperature sensors were slightly modified from test to test to get more information. Forexample, in last test we add two more sensors to measure temperature on second copper braid at5K zone.
In addition to thermal sensors, the coupler is equipped with electron pickups to monitorelectron activity at the 5K and 80K windows that may be present due to multipacting or RFbreakdown. The names and locations of temperature sensors for each test
TB9AES021: Temperature Distribution at 3.6 KW “ON” July 10, 2015
TB9AES028: Temperature Distribution at 4.0 KW “ON-resonance” Aug 28, 2015
TB9AES027: Temperature Distribution at 4.0 KW “ON-resonance” Oct 13, 2015
Figure 3: Locations of temperature sensors and temperature map in integrated test ofAES021(3.6kW), AES028 (4kW) and AES027 (4kW) in full reflection power regimewith cavity “ON” resonance.

L C L S - I I T E C H N I C A L N O T E
November 30, 2015 LCLSII-TN-XXXX 8
The warm section of the power coupler was assembled on the cavity after it was installed inthe HTS. A portable clean room was used to eliminate particle contamination. After connection,the coupler vacuum space was evacuated.
Coupler thermal intercepts, comprising short flexible copper braids (commercially sourcedfrom TAI) were installed to provide passive cooling of the coupler. Two braids connected acopper can attached to the coupler CF100 flange (functioning as a 80K intercept) to the cryostat’s80K thermal shield. The other two braids connected the 5K coupler intercept to the 5K thermalshield of HTS. These copper braids were extended by adding two straps made of pure aluminium(AL5N, each 95mm long, with a cross section of 125mm2). Figure 4 shows details of the couplerthermal connection at 80K and 5K coupler ends in each test.
Figure 4: Coupler thermal 70K (left) and 5K connection. (AES021)
Figure 5: AES028 and AES027: thermal sensors were installed directly on copper braid toeliminate effect of extra-contact (on left -70K zone, on-right – 5K zone) to compare withFigure 4 above.
L C L S - I I T E C H N I C A L N O T E
November 30, 2015 LCLSII-TN-XXXX 9
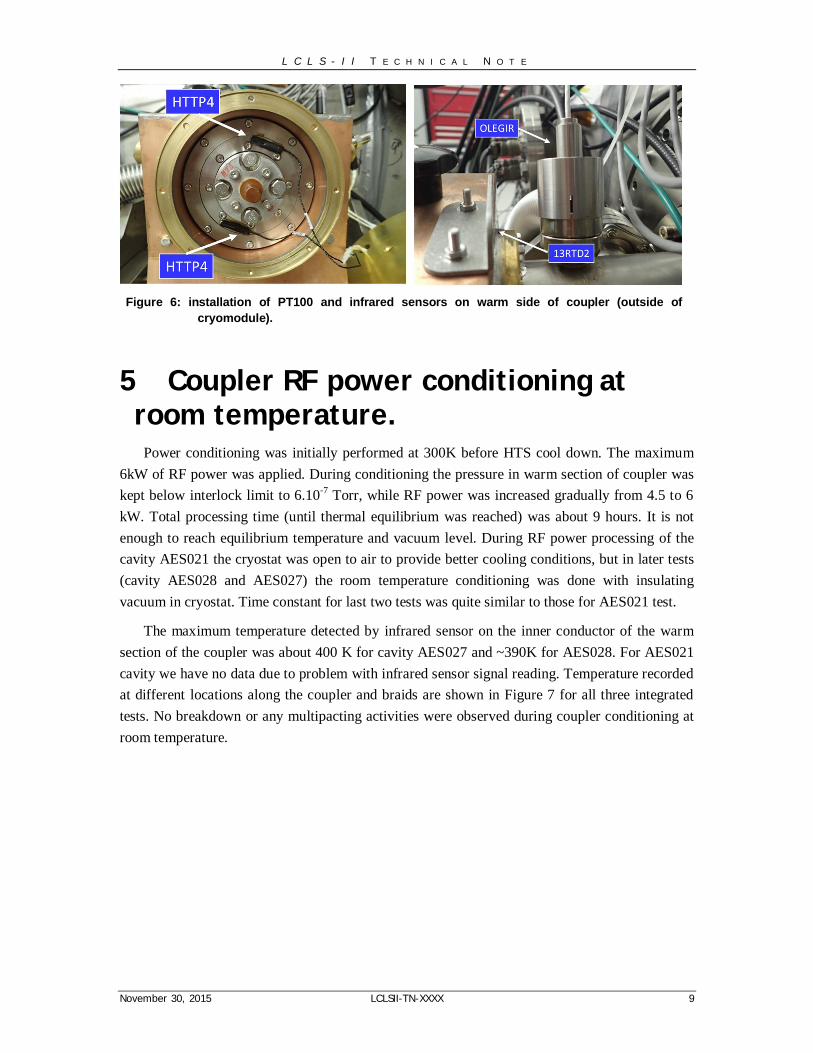
Figure 6: installation of PT100 and infrared sensors on warm side of coupler (outside ofcryomodule).
5 Coupler RF power conditioning atroom temperature.
Power conditioning was initially performed at 300K before HTS cool down. The maximum6kW of RF power was applied. During conditioning the pressure in warm section of coupler waskept below interlock limit to 6.10-7 Torr, while RF power was increased gradually from 4.5 to 6kW. Total processing time (until thermal equilibrium was reached) was about 9 hours. It is notenough to reach equilibrium temperature and vacuum level. During RF power processing of thecavity AES021 the cryostat was open to air to provide better cooling conditions, but in later tests(cavity AES028 and AES027) the room temperature conditioning was done with insulatingvacuum in cryostat. Time constant for last two tests was quite similar to those for AES021 test.
The maximum temperature detected by infrared sensor on the inner conductor of the warmsection of the coupler was about 400 K for cavity AES027 and ~390K for AES028. For AES021cavity we have no data due to problem with infrared sensor signal reading. Temperature recordedat different locations along the coupler and braids are shown in Figure 7 for all three integratedtests. No breakdown or any multipacting activities were observed during coupler conditioning atroom temperature.

L C L S - I I T E C H N I C A L N O T E
November 30, 2015 LCLSII-TN-XXXX 10
Figure 7: Room temperature coupler conditioning: 1-AES021 (9hrs); 2-AES028 (8hrs); 3-AES027(6hrs). Rf power: 6kW in Standing Wave regime.
Result of simulation of the power coupler at room temperature for 6kW standing waveregime is shown in Figure 8. Phase of reflection is defined from modeling of cavity at roomtemperature (Q0~1.e4). Boundary conditions are set as measured on HTS test. Assumption arethe following: Copper plating (RRR=50) on stainless steel walls of coupler has a thickness 10umon outer conductor and 100um on inner conductor; cold window made of ceramic with dielectricconstant ε=9 and loss factor tanδ = 1.e-4 to 3e-4; with and without surface roughness. Simulatedpower flux to 80K zone (CF100 flange) is in the range 18.7 to 20.9 W (see Table 1). Measuredvalue is 18.6W for cavity AES027 and 19.5W for the cavity AES028. Power flux to 80K wasrecalculated from differential temperature on copper braid (15.4 and 16.1K) and known thermalconductivity of two braids (1.21W/K) used in tests. Measured temperature on inner conductor andpower flux to CF100 flange are in a good agreement with simulation result.

L C L S - I I T E C H N I C A L N O T E
November 30, 2015 LCLSII-TN-XXXX 11
Figure 8: Temperature distribution along inner conductor of power coupler for room temperaturepower conditioning at 6kW.
Table 1: Effect of ceramic loss factor (tanδ) and surface roughness
Assumptions Tmax (K) TIR (K) Power flux at 70K zoneTanδ=1.e-4, no roughness 438 410 18.7Tanδ=3.e-4, no roughness 436 410 18.7Tanδ=3.e-4, roughness 10%* 451 418 20.9
*In simulation resistance was increased by 20% which translated to effective increasing ofpower losses in surface by 10%, equivalent to increasing of surface area by 10% (so calledsurface roughness)
6 Coupler RF power tests with cavity“ON” and “OFF” resonance at 2K
After cool-down of the cavity to a nominal temperature of 2K, coupler conditioningcontinued with the cavity off-resonance. In this regime power dissipation and temperature in thecoupler was found to be lower to compare with the cavity on-resonance case, as was predicted insimulations. In earlier HTS test the coupler was conditioned at 2K up to 6 kW, but in integratedtests all three cavities were tested up to 4 kW of RF power. Test results for cavity AES021 isshown in Figure 9 for 80K and 5K zones. One can see the correlation of temperatures all sensorsat 80K zone with temperature of thermal shield (HTTPN8 sensor), which was quite noisy in testssometimes jumping from 80 to 90K and back This correlation was taken into account in dataanalysis, normalizing result to 80K of shield temperature when it was possible.
L C L S - I I T E C H N I C A L N O T E
November 30, 2015 LCLSII-TN-XXXX 12
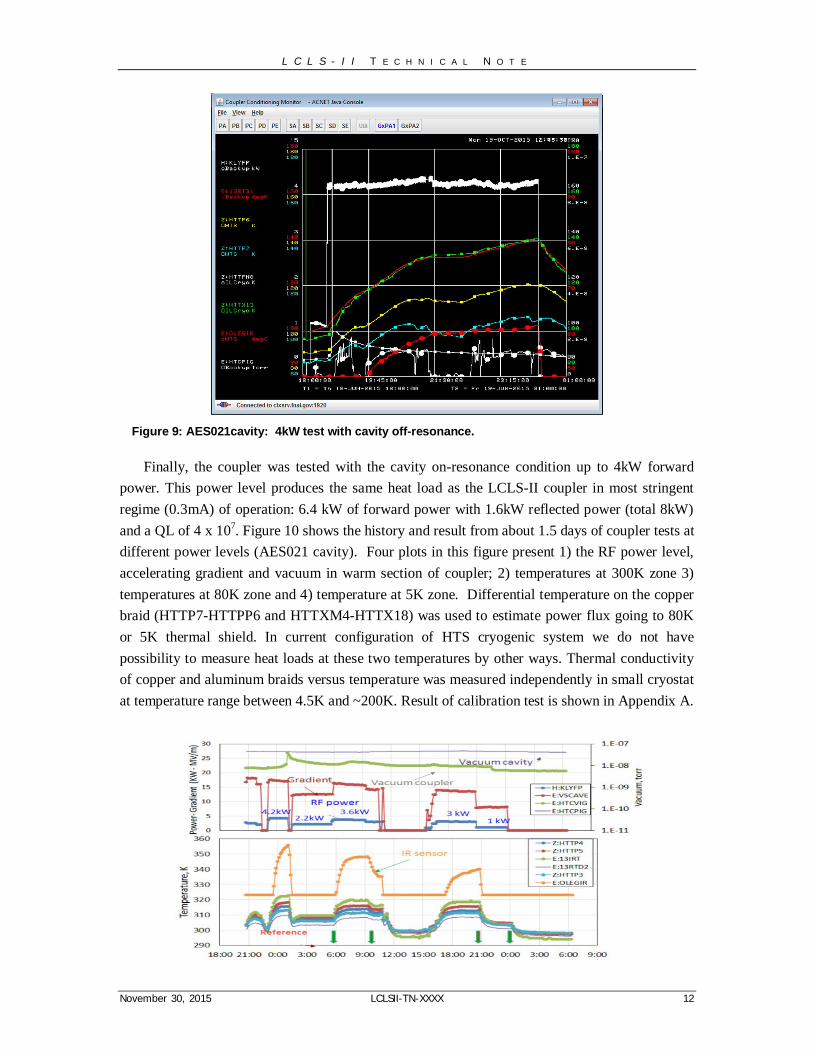
Figure 9: AES021cavity: 4kW test with cavity off-resonance.
Finally, the coupler was tested with the cavity on-resonance condition up to 4kW forwardpower. This power level produces the same heat load as the LCLS-II coupler in most stringentregime (0.3mA) of operation: 6.4 kW of forward power with 1.6kW reflected power (total 8kW)and a QL of 4 x 10⁷. Figure 10 shows the history and result from about 1.5 days of coupler tests atdifferent power levels (AES021 cavity). Four plots in this figure present 1) the RF power level,accelerating gradient and vacuum in warm section of coupler; 2) temperatures at 300K zone 3)temperatures at 80K zone and 4) temperature at 5K zone. Differential temperature on the copperbraid (HTTP7-HTTPP6 and HTTXM4-HTTX18) was used to estimate power flux going to 80Kor 5K thermal shield. In current configuration of HTS cryogenic system we do not havepossibility to measure heat loads at these two temperatures by other ways. Thermal conductivityof copper and aluminum braids versus temperature was measured independently in small cryostatat temperature range between 4.5K and ~200K. Result of calibration test is shown in Appendix A.

L C L S - I I T E C H N I C A L N O T E
November 30, 2015 LCLSII-TN-XXXX 13
Figure 10: History of coupler test with cavity “ON” resonance regime in AES021 integrated study.Top plot shows RF power, accelerating gradient and vacuum in warm section of FPC.Bottom plots show temperature of sensors at 300K, 80K and 5K zones of the coupler.
6.1 Temperatures and heat flux measurements at 80K zone.Temperature time constant for all sensors installed at 80K zone is much higher than for those
in 300K and 5K zones. Time constant is defined by coupler antenna, ceramic window, massiveCF100 stainless steel flange and large volume of copper can, attached to CF100 flange. Typicalhistory of temperatures of sensors at 80K zone at 4kW power with ON resonance cavity is shownin Figure 11. One can see from plot that it takes more than 6 hours of heating to be close toequilibrium regime. For each cavity we did measurements at different power levels (1, 2, 3 and 4kW) for cavity “OFF” and “ON” resonance. In some cases we start from higher power (up to6kW) to accelerate heating process and then switch to the tested power level, when temperature iscloser to equilibrium.
All results from three integrated cavities (AES021, AES028 and AES027) are summarized inplots in Figure 12 for the cavity “ON” and “OFF” resonance. Three curves show the temperatureon CF100 flange (highest temperature), on source side of copper braid (middle temperature) andon sink side of copper braid (lowest temperature). One can see that heating is much lower for thecase when cavity is “OFF” resonance. We should also note that measurements are more reliablewhen done at least one week after cool-down, when temperature of cryomodule components moreor less stabilized.
Differential temperature on the copper braid for the cavity “ON” and “OFF” resonance isshown in Figure 13 (on left). From this data and calibrated thermal conductivity of the braid theheat flux was to 80K shield was estimated and plotted at Figure 13 right plot. Here we assumethat second braid contribute equally to the thermal intercept.

L C L S - I I T E C H N I C A L N O T E
November 30, 2015 LCLSII-TN-XXXX 14
Figure 11: Temperatures at 80K zone (upper plots) and at 5K zone (lower plots) for AES028 (left)and AES027 (right) integrated tests with cavity ON-resonance. Test duration was 6 and24 hrs; TOP: While color - RF power 4kW for AES028 and 4/2kW for AES027Red dotted line -temperature at CF100 flange, Yellow and blue –temperature on two ends of copper braid(dT_max = HTTP7-HTTP6 = 24 K); Red with circles – Infrared sensors Temperaturemeasured on inner conductor (in °C). White – temperature of 80K thermal shield. Bottom: White – RF power, Red-Temperature on coupler intercept; Blue and yellow– temperature of copper+AL braid (sink and source ends)

L C L S - I I T E C H N I C A L N O T E
November 30, 2015 LCLSII-TN-XXXX 15
Figure 12: Temperature vs. RF power measured at the 80K intercept zone with the cavity ON-resonance (left) and cavity OFF-resonance (right) Highest temperature measured atCF100 flange. Lowest two curves correspond temperature on the copper braid (sourceand sink ends). An estimated error of temperature measurements was about +/- 2K.
Figure 13: 80K intercept zone: Temperature gradient on the copper braid (left) and calculated heatload (right) vs. RF power for the cavity ON-resonace (circles) and OFF resonance (boxes).Results are shown for all three cavity tests. Temperature dependence of the braid thermalconductivity was taken from the calibration test (Appendix A).
6.2 Temperature measurements heat flux at 5K zoneResult of temperature measurement versus rf power in all sensors located in 5K zone is
shown in Figure 15 for cavity “ON” and “OFF” resonance. All three cavities behaved quitesimilar, except the fact that temperature was shifted by ~1K up for AES028 and AES027 tests tocompare with AES021. For these two cavities we start coupler test shortly after cool-down andtemperature on coupler and cavity end-groups was not reach equilibrium values.
L C L S - I I T E C H N I C A L N O T E
November 30, 2015 LCLSII-TN-XXXX 16
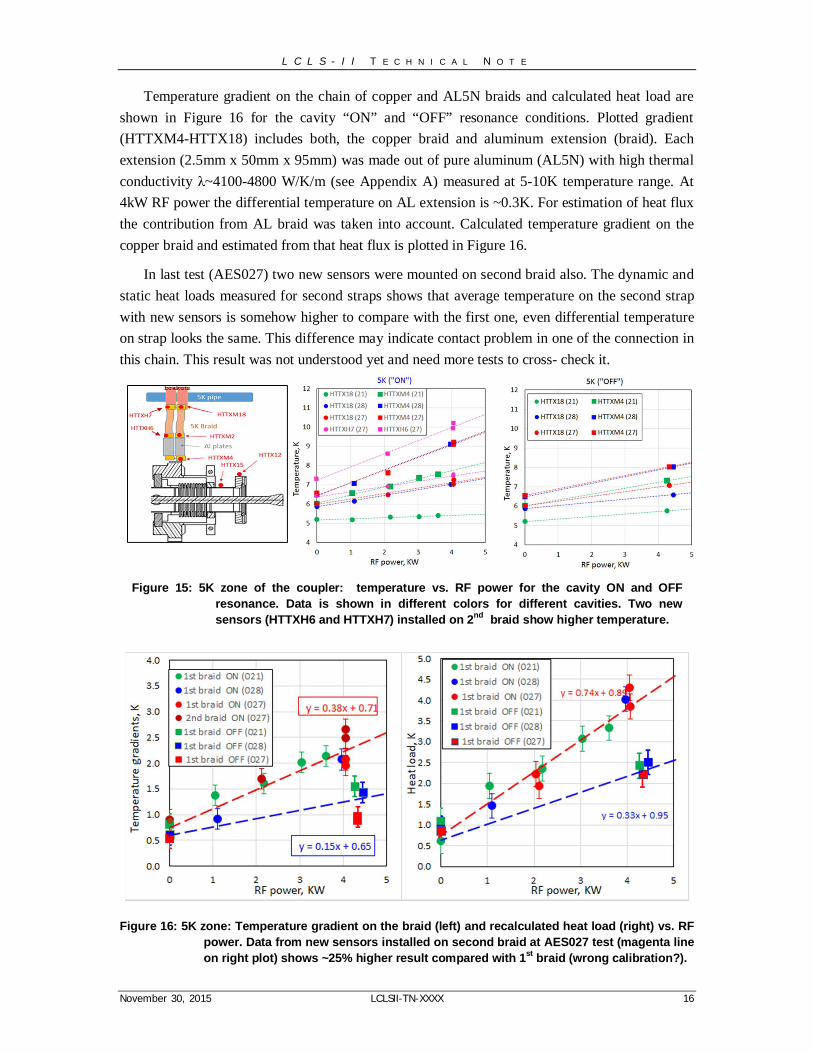
Temperature gradient on the chain of copper and AL5N braids and calculated heat load areshown in Figure 16 for the cavity “ON” and “OFF” resonance conditions. Plotted gradient(HTTXM4-HTTX18) includes both, the copper braid and aluminum extension (braid). Eachextension (2.5mm x 50mm x 95mm) was made out of pure aluminum (AL5N) with high thermalconductivity λ~4100-4800 W/K/m (see Appendix A) measured at 5-10K temperature range. At4kW RF power the differential temperature on AL extension is ~0.3K. For estimation of heat fluxthe contribution from AL braid was taken into account. Calculated temperature gradient on thecopper braid and estimated from that heat flux is plotted in Figure 16.
In last test (AES027) two new sensors were mounted on second braid also. The dynamic andstatic heat loads measured for second straps shows that average temperature on the second strapwith new sensors is somehow higher to compare with the first one, even differential temperatureon strap looks the same. This difference may indicate contact problem in one of the connection inthis chain. This result was not understood yet and need more tests to cross- check it.
Figure 15: 5K zone of the coupler: temperature vs. RF power for the cavity ON and OFFresonance. Data is shown in different colors for different cavities. Two newsensors (HTTXH6 and HTTXH7) installed on 2nd braid show higher temperature.
Figure 16: 5K zone: Temperature gradient on the braid (left) and recalculated heat load (right) vs. RFpower. Data from new sensors installed on second braid at AES027 test (magenta lineon right plot) shows ~25% higher result compared with 1st braid (wrong calibration?).

L C L S - I I T E C H N I C A L N O T E
November 30, 2015 LCLSII-TN-XXXX 17
6.3 Simulation resultsResult of simulations for the cavity “ON” resonance and 4kW rf power is shown in Figure17.
Boundary conditions used in the simulations are taken from the measurements. Figure shows theset of material parameters used in simulations. Table inside plot shows sensitivity of heat flow at80K to basic parameters variation. Increase of copper plating thickness from 100um to 150um(inner conductor of warm section) leads decreasing in maximum temperature down to 400K andincreasing in heat load up to 28W in worst case of 10% of surface roughness. Static heat loads,calculated at boundary conditions 6.5K/90K/300K are: 0.35W at 5K and 4.2W at 80K.
Figure 17: Simulation of 4kW cavity on-resonance with the last set of parameters from table.Nominal parameters are: 10/100um copper plating, no roughness, e=9; tan=3.e-4;RRR=50 (ASE included RRR=35).
7 Coupler and cavity vacuumVacuum in cavity (and cold par of coupler) and in warm part of main coupler is controlled by
ion gages. The names of channels are: HTCPIG / HTCVIG for vacuum in warm coupler andcavity. Signal from ion pump also available for vacuum measurements. The typical vacuum plotis shown in Figure 18. Cavity vacuum is not sensitive to RF power, while vacuum on warm partof the coupler react to RF processing. Cavity vacuum is measured at ~2m away from cryostat, itnot reflects actual pressure in cavity.
Figure 18: Cavity vacuum (red) and warm coupler vacuum (white) during one month of AES021test. RF power is shown in yellow. Cavity was cold from June 17.

L C L S - I I T E C H N I C A L N O T E
November 30, 2015 LCLSII-TN-XXXX 18
8 CAVITY Q0 MEASUREMENTSFinal Q0 measurements were performed after a standardized fast cool down procedure. After
the cavity and cryostat were held at 3K for more than three weeks, the cavity temperature wasraised to an average of 45 K. With the LHe supply pressure at 24 psig the supply valve was fullyopened and two-phase LHe at 5 g/sec flowed into the two inlets of the cavity helium vessel,passing across he cavity cells and was exiting through the helium two phase return pipe (2Kheader). This created a vertical cavity temperature gradient of between 7K and 22 K during thesuperconducting transition. This thermal gradient expelled the magnetic flux successfully as seenon the fluxgate magnetometers. Figure 19 shows the cavity temperature and the magnetometerreading during the fast cool down.
Figure 19: Cavity temperatures and magnetometer readings during the fast cool down.
Determination of cavity Q0 requires the measurement of accelerating gradient and powerdissipation in the cavity walls. Cavity dynamic heat load (power dissipation) was calculated bycalorimetrically measuring the heat load in the 2K He bath via a mass flowmeter. A heater in the2K header was used to provide a calibration between mass flow and power dissipated in the Hebath. As the cavity was operated at various accelerating gradients, the 2K mass flow wasmeasured and cavity heat load thus calculated. Figure 20 shows mass flow during the cavitydynamic heat load measurement.

L C L S - I I T E C H N I C A L N O T E
November 30, 2015 LCLSII-TN-XXXX 19
Figure 20: Dynamic heat load measurement.
Cavity gradient was determined using two different methods, measurement of cavitytransmitted power along with knowledge of the external Q of the field probe (Q2), or bymeasurement of forward power along with knowledge of the power coupler external Q (Q1). Q2can be measured in the HTS using a network analyzer or values previously measured duringvertical testing can be used if the field probe was not changed. The external Q of the coupler (Q1)was obtained by measuring cavity power decay (loaded-Q measurement). The two methodsagreed to within 5%. In Figure 21 the results of Q0 measurements are plotted, using the averageof the two methods to determine gradient.
Figure 21: Cavity Q vs. Eacc during bare cavity vertical test and horizontal integrated test.
L C L S - I I T E C H N I C A L N O T E
November 30, 2015 LCLSII-TN-XXXX 20
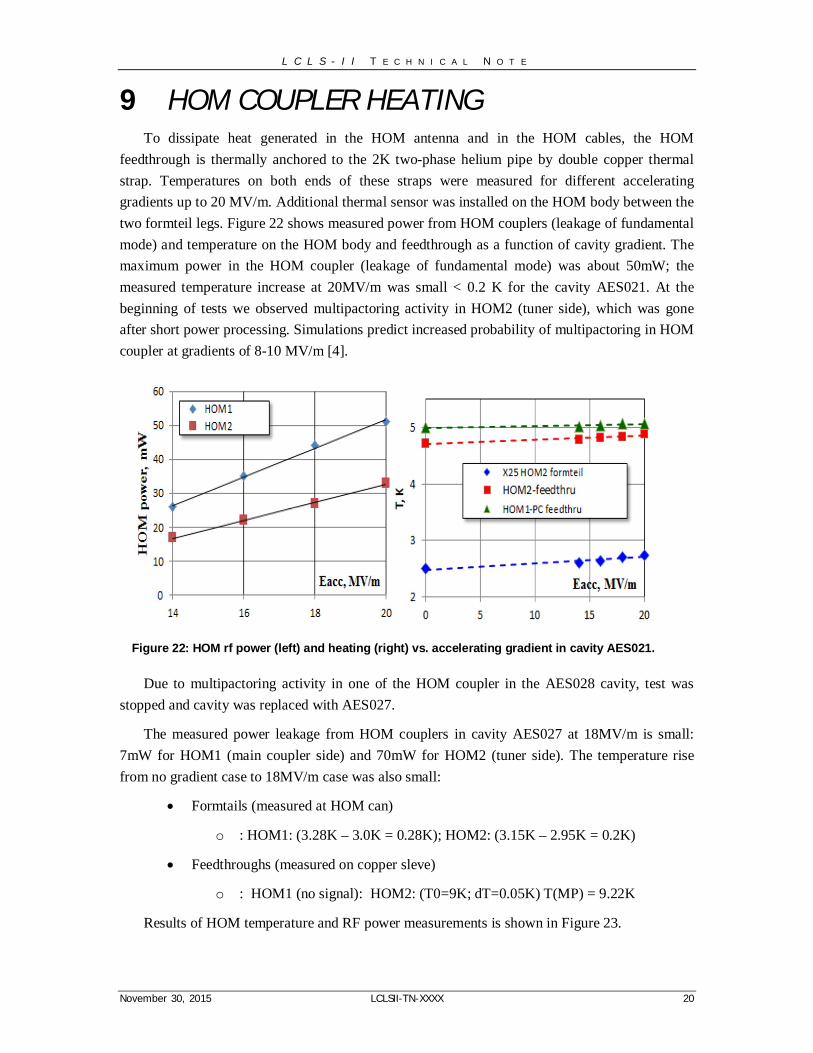
9 HOM COUPLER HEATINGTo dissipate heat generated in the HOM antenna and in the HOM cables, the HOM
feedthrough is thermally anchored to the 2K two-phase helium pipe by double copper thermalstrap. Temperatures on both ends of these straps were measured for different acceleratinggradients up to 20 MV/m. Additional thermal sensor was installed on the HOM body between thetwo formteil legs. Figure 22 shows measured power from HOM couplers (leakage of fundamentalmode) and temperature on the HOM body and feedthrough as a function of cavity gradient. Themaximum power in the HOM coupler (leakage of fundamental mode) was about 50mW; themeasured temperature increase at 20MV/m was small < 0.2 K for the cavity AES021. At thebeginning of tests we observed multipactoring activity in HOM2 (tuner side), which was goneafter short power processing. Simulations predict increased probability of multipactoring in HOMcoupler at gradients of 8-10 MV/m [4].
Figure 22: HOM rf power (left) and heating (right) vs. accelerating gradient in cavity AES021.
Due to multipactoring activity in one of the HOM coupler in the AES028 cavity, test wasstopped and cavity was replaced with AES027.
The measured power leakage from HOM couplers in cavity AES027 at 18MV/m is small:7mW for HOM1 (main coupler side) and 70mW for HOM2 (tuner side). The temperature risefrom no gradient case to 18MV/m case was also small:
· Formtails (measured at HOM can)
o : HOM1: (3.28K – 3.0K = 0.28K); HOM2: (3.15K – 2.95K = 0.2K)
· Feedthroughs (measured on copper sleve)
o : HOM1 (no signal): HOM2: (T0=9K; dT=0.05K) T(MP) = 9.22K
Results of HOM temperature and RF power measurements is shown in Figure 23.

L C L S - I I T E C H N I C A L N O T E
November 30, 2015 LCLSII-TN-XXXX 21
Figure 23: AES027: HOM power and heating at different cavity gradients: Sign of multipactoringactivity are seen at 18MV/m (green curve – temperature at HOM2 can); White – cavitygradient (scale 20MV/m); Blue – power from HOM coupler (scale 0.1W); Red and Green –temperatures on HOM can.
10 Tuner Performance. Microphonics andFrequency Control Studies.
During the integrated test of AES021 (and subsequently AES028) dedicated studies of thecavity tuner were conducted. A primary goal was to confirm performance parameters of the tuneras measured in previous tests with dressed cavities [2]. Results of tuner performance aresummarized in Table 2.
Table 2: LCLS II SRF Cavity Tuner Parameters
The minimum and maximum range of the coarse tuner was determined by first using thetuner to put the cavity in the “relaxed” (un-loaded) position (see Figure 24).

L C L S - I I T E C H N I C A L N O T E
November 30, 2015 LCLSII-TN-XXXX 22
Figure 24: Cavity frequency change by coarse motor.
The cavity was then compressed with the low tuner. Piezo tuner hysteresis (cavity frequencyshift versus voltage applied to piezo) was measured at different values of the cavity frequency.Results indicate that the piezo response is practically flat (22.8±0.7 Hz/V) starting from ΔF = 20kHz up to maximum ΔF = 600 kHz.
The effect of cavity detuning due to microphonics was studied with and without piezocompensation [5]. The piezo-stack was driven with a combination of the signals: feed-forwardproportional to ଶܧ to compensate Lorentz Force Detuning; slow feedback for compensation ofcavity detuning from helium pressure variation; and 45Hz single resonance suppression.Summary of the active resonance control on cavity with piezo tuner is shown in Figure 25.Without piezo compensation the level of microphonics at HTS is ~20Hz peak to peak; with piezocompensation “ON” this level was reduced by factor of 2.
Figure 25: Active Resonance Control of the AES028 with piezo-tuner. Red-line is LCLS IIspecifications.
L C L S - I I T E C H N I C A L N O T E
November 30, 2015 LCLSII-TN-XXXX 23
11 CONCLUSIONThe first integrated test at FNAL of a nitrogen doped high-Q cavity demonstrated that the
cavity, assembled with components designed or modified to meet the requirements of the LCLS-II project, still exhibits the high-Q demonstrated in vertical test. It demonstrates that cavitydressing, assembly, and operation with all auxiliary components will not degrade cavityperformance if done properly. Power coupler heating and performance in test closely matchesexpectations and the tuner design was verified.
12 ACKNOWLEDGMENTWe appreciate the contributions to this work and assistance from the LCLS-II teams at Fermilab, SLACand JLAB.
13 REFERENCES[1] J.Galayda, “The new LCLS-II project: Status and challenges”, Linac14, Geneva, Switzerland.
[2] Y. Pischalnikov, et al. “Design and Test of Compact Tuner for Narrow Bandwidth SRF Cavities”,IPAC2015, Richmond, VA, USA.
[3] G. Wu, et al., “Magnetic foils for SRF cryomodule” these proceedings, SRF’2015, Whistler, Canada.
[4] G.Romanov et al, “Multipactoring in ILC HOM coupler”, TD-Note-15-16.
[5] W. Schappert et al. “Resonance Control for Narrow Bandwidth SRF Cavities”, SRF2015, Whistler, BC,Canada.

L C L S - I I T E C H N I C A L N O T E
November 30, 2015 LCLSII-TN-XXXX 24
14 APPENDIX A
14.1 Copper braid calibration test Heat flows for 5K and 70K intercepts were calculated from measurements of temperature
gradient on the copper straps. All 4 thermal straps used for HTS tests were fabricated from OFHCcopper by TAI Corp. The strap rope length was 66 mm and cross-section ~100 mm2. The strapthermal conductance has been measured at cryogenic test stand in temperature range of from 5Kto 300K (Fig A1). The obtained calibration data were compared with RRR for copper material.As follows from data the measured strap conductance (copper rope, blocks and thermal contacts)corresponds to copper RRR ~50. This value was used for heat flow estimation.
Figure A1: Strap thermal conductance measurements and comparison with copper RRR.
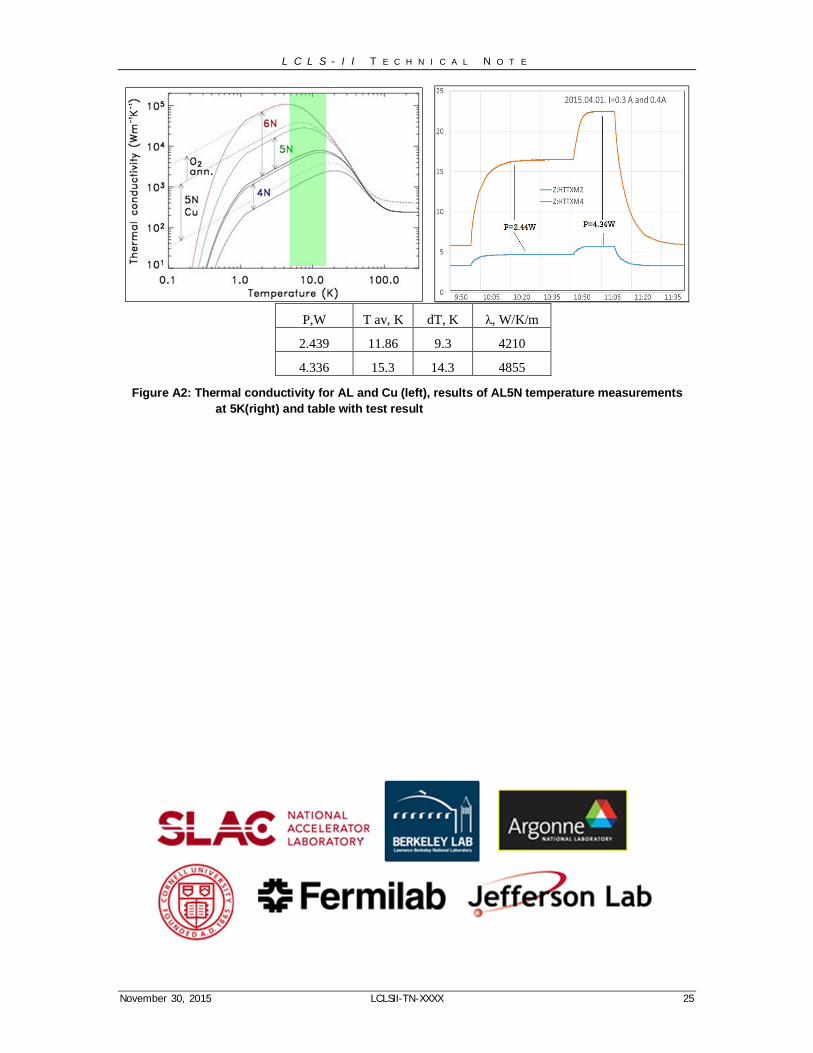
14.2 AL5N braid calibration testSample of Al5N strap (cross-section S=0.5mm x 25mm, length L=200mm) was calibrated at
HTS at 5K to measure thermal conductivity. One end of strap was attached 5K thermal shield andheater was installed from other end. Two Cernox sensors were mounted on both ends to measuretemperature. Expected properties of AL5N and results of test are presented in Figure A2 and onthe table below. In tests the temperature gradient was measured at several levels of heater power.Thermal conductivity in table was calculated from heater power and temperature gradient alongthe braid: λ= (P/dT)*(L/S). Temperature offset measured at no power regime was subtracted.
L C L S - I I T E C H N I C A L N O T E
November 30, 2015 LCLSII-TN-XXXX 25
P,W T av, K dT, K λ, W/K/m
2.439 11.86 9.3 4210
4.336 15.3 14.3 4855
Figure A2: Thermal conductivity for AL and Cu (left), results of AL5N temperature measurementsat 5K(right) and table with test result