reliability, resilience and vulnerability of a multipurpose storage reservoir / confiance,...
TRANSCRIPT
This article was downloaded by: [UMKC University of Missouri Kansas City]On: 29 September 2014, At: 10:09Publisher: Taylor & FrancisInforma Ltd Registered in England and Wales Registered Number: 1072954 Registered office: MortimerHouse, 37-41 Mortimer Street, London W1T 3JH, UK
Hydrological Sciences JournalPublication details, including instructions for authors and subscription information:http://www.tandfonline.com/loi/thsj20
Reliability, resilience and vulnerability of amultipurpose storage reservoir / Confiance,résilience et vulnérabilité d'un barrage multi-objectifsS. K. JAIN a & P. K. BHUNYA aa National Institute of Hydrology , Roorkee, 247 667, Uttaranchal, IndiaPublished online: 18 Jan 2010.
To cite this article: S. K. JAIN & P. K. BHUNYA (2008) Reliability, resilience and vulnerability of a multipurpose storagereservoir / Confiance, résilience et vulnérabilité d'un barrage multi-objectifs, Hydrological Sciences Journal, 53:2,434-447, DOI: 10.1623/hysj.53.2.434
To link to this article: http://dx.doi.org/10.1623/hysj.53.2.434
PLEASE SCROLL DOWN FOR ARTICLE
Taylor & Francis makes every effort to ensure the accuracy of all the information (the “Content”) containedin the publications on our platform. However, Taylor & Francis, our agents, and our licensors make norepresentations or warranties whatsoever as to the accuracy, completeness, or suitability for any purpose ofthe Content. Any opinions and views expressed in this publication are the opinions and views of the authors,and are not the views of or endorsed by Taylor & Francis. The accuracy of the Content should not be reliedupon and should be independently verified with primary sources of information. Taylor and Francis shallnot be liable for any losses, actions, claims, proceedings, demands, costs, expenses, damages, and otherliabilities whatsoever or howsoever caused arising directly or indirectly in connection with, in relation to orarising out of the use of the Content.
This article may be used for research, teaching, and private study purposes. Any substantial or systematicreproduction, redistribution, reselling, loan, sub-licensing, systematic supply, or distribution in anyform to anyone is expressly forbidden. Terms & Conditions of access and use can be found at http://www.tandfonline.com/page/terms-and-conditions
Hydrological Sciences–Journal–des Sciences Hydrologiques, 53(2) April 2008
Open for discussion until 1 October 2008 Copyright © 2008 IAHS Press
434
Reliability, resilience and vulnerability of a multipurpose storage reservoir S. K. JAIN & P. K. BHUNYA National Institute of Hydrology, Roorkee 247 667, Uttaranchal, India Abstract The behaviour of statistical performance indices, namely, reliability, resilience and vulnerability for a multipurpose storage reservoir is examined. Monte Carlo simulations were carried using data of the Dharoi Reservoir (India) and the inflows to the reservoir were generated by following two approaches: long-memory models and short-memory models. Statistical behaviour of three indices were examined for two cases: (i) municipal and industrial water supply; and (ii) irrigation, thus making a total of six indices for the analysis. To interpret the behaviour of these indices, a probabilistic approach was followed. It was noted that when inflows generated using long-memory models were input in simulation, there were large variations in reliability, resilience and vulnerability among the runs. In contrast, when data from short-memory models were used, the indices were confined to a narrow band. Average values of reliabilities and their variance for both the demands were much higher when the data generated using short-memory models were used. Since natural geophysical hydrological data series display persistence, the results pertaining to long-memory model are closer to reality. It was also shown that the framework of analysis presented can be very useful for multicriteria analysis and interpretation of trade-offs in the reliability space. Key words reliability; resilience; vulnerability; multipurpose reservoir; Dharoi; India; Monte Carlo; long memory
Confiance, résilience et vulnérabilité d’un barrage multi-objectifs Résumé On examine le comportement d’indices statistiques de performance, en l’occurrence la confiance, la résilience et la vulnérabilité d’un barrage multi-objectifs. Des simulations de Monte Carlo ont été réalisées en utilisant les données du Barrage Dharoi (Inde), les débits entrant dans le barrage étant générés selon deux approches: des modèles à longue et à courte mémoire. Le comportement statistique des trois indices a été examiné dans deux cas: (i) approvisionnement en eau municipal et industriel, et (ii) irrigation, ce qui fait un total de six indices pour l’analyse. Pour interpréter le comportement de ces indices, une approche probabiliste a été suivie. Il est apparu que lorsque les débits entrants générés à l’aide des modèles à longue mémoire sont utilisés comme données d’entrée des simulations, les variations de la confiance, de la résilience et de la vulnérabilité sont importantes entre les simulations. Au contraire, lorsque sont utilisés les débits entrants générés par les modèles à courte mémoire, les indices sont concentrés dans un faisceau étroit. Les valeurs moyennes de confiance et leur variance pour les deux types de demande sont bien supérieures lors de l’utilisation des données générées avec les modèles à courte mémoire. Puisque les séries naturelles de données géophysiques hydrologiques présentent une persistance, les résultats obtenus avec les modèles à longue mémoire sont plus proches de la réalité. Il est également montré que le cadre d’analyse présenté peut être très utile pour une analyse multi-critères et pour l’interprétation des arbitrages dans l’espace de confiance. Mots clefs confiance; résilience; vulnérabilité; barrage multi-objectifs; Dharoi; Inde; Monte Carlo; longue mémoire INTRODUCTION
Because of high spatial and temporal variability of hydrological and associated variables, the outputs of hydrological systems show large variations with time. A number of statistical indices are used to measure the performance of a water resources system. It is important and necessary that decision makers and managers are aware of the significance and use of the various per-formance measures in decision-making processes. The use of the reliability concept has been an integral part of the analysis and design of water resources systems. Hashimoto et al. (1982) elaborated the use of three statistical indices: reliability, resilience, and vulnerability, to describe the performance of a multipurpose reservoir system. The use of the last two performance criteria, resilience and vulnerability, has been discussed in many works, for example, Moy et al. (1986); Jinno et al. (1995); Kundzewicz & Laski (1995); Vogel & Bolognese (1995); Kundzewicz & Kindler (1995); Srinivasan et al. (1999); and Vogel et al. (1999). Nalbantis & Koutsoyiannis (1997) developed parametric rules for multi-reservoir systems. More recently, Kay (2000) and Kjeldsen & Rosbjerg (2001) proposed the
Dow
nloa
ded
by [
UM
KC
Uni
vers
ity o
f M
isso
uri K
ansa
s C
ity]
at 1
0:09
29
Sept
embe
r 20
14

Reliability, resilience and vulnerability of a multipurpose storage reservoir
Copyright © 2008 IAHS Press
435
sustainability criterion for evaluating the performance status of some existing water resources systems. Alhazmi et al. (2004) developed methods in software reliability engineering that use plots of the cumulative number of defects found against time to describe the reliability and vulnerability of released software. By using this procedure they tried to estimate the mean time to failure after the software has been tested (or released). Some of the statistical indices that are frequently used as a measure of uncertainty in hydrological studies are confidence band, bias, standard error of estimates, the two tailed t test, chi-square fit, and the variances of two samples. These indices highlight different facets of the operation of any system. A good review of these measures was given by Montgomery & Runger (1994). In situations where the length of data record is insufficient to compute the performance indices, Monte Carlo simulations are employed as a decision-making aid. Several estimators of reliability, resilience and vulnerability have been proposed, but few of the studies mentioned above discuss which is the most appropriate combination of estimators to use. Kjeldsen & Rosbjerg (2004) reported that the estimates of these indices based on historical time series are problematic and recommended the use of long data series for such a purpose. One way to investigate the most appropriate combination of the estimators is the use of Monte Carlo simulations. Thus, the objective of this paper is to investigate the application of reliability, resilience and vulnerability measures of performance for an in-depth understanding of the behaviour of a multipurpose reservoir. Note that in a multipurpose reservoir, demands can be conflicting, as was the case in the reservoir studied here. Further, the performance criteria employed here measure conflicting features of reservoir management. Cumulative distribution plots were used to examine the significance of three indices for two cases of water use, thus making a total of six indices in assessing the performance of a reservoir. A sensitivity analysis of the operation policy and a comparative study of changes in the performance indices due to use of long- and short-memory models was also carried out. For this study, the data of Dharoi Reservoir in the Sabarmati basin (India) were used. PERFORMANCE INDICES
Reliability
Three reliability indices are generally followed in water resources planning and management. Time reliability is the probability that the system state lies in the set of satisfactory states:
rt = P[x(t) ∈ S] (1a) where P(⋅) is the probability, x(t) is the system’s state in the given time period t, and S is a set of satisfactory states. Time- or occurrence-based reliability can be estimated by:
tr̂ = 1 – (fp/Tp) 0 ≤ rt ≤ 1, fp ≤ Tp (1b)
where tr̂ is the estimate of time reliability and fp is the number of failure periods for a particular demand out of the total periods, Tp. Volume reliability Volume or quantity-based reliability, rv is expressed as:
rv = Vs/Vd (2) where Vs is the volume of water supplied and Vd the volume of water demanded during a given period. Note that this quantity is not really expressed in terms of probability. Annual reliability is defined in an analogous way to the time reliability, the only difference being that the time period in this case pertains to one year. Annual reliability can be estimated by:
ar̂ = 1 – (Fy/Ty) (3)
Dow
nloa
ded
by [
UM
KC
Uni
vers
ity o
f M
isso
uri K
ansa
s C
ity]
at 1
0:09
29
Sept
embe
r 20
14

S. K. Jain & P. K. Bhunya
Copyright © 2008 IAHS Press
436
where Fy is the number of failure years when the annual supply is less than the annual demand over a total duration of Ty years. An alternative definition of reliability is that it is the probability of no failure within a given period of time, often taken to be the planning period. Hence, reliability is sometimes interpreted as the opposite of risk or the probability of failure (= 1 – reliability). Although reliability is a widely used concept in water resources planning, both reliability and this definition of risk do not describe the severity or likely consequences of a failure. The possible severity of failures can be described by other criteria, such as resilience and vulnerability. Resilience
Resilience describes how quickly a system is likely to recover from failure. If failures are prolonged events and system recovery is slow vis-à-vis the behaviour of the natural system, it implies that the system design has a serious flaw, and requires careful re-examination. Therefore, a good designer would like to design a system which can recover rapidly after a failure and return to a satisfactory state. To define resilience, following Hashimoto et al. (1982), let tf be the length of time over which a system’s output remains unsatisfactory after a failure. Clearly, the resilience of a system can be interpreted as the inverse of the expected value of tf. If S denotes the set of satisfactory states and F the set of all unsatisfactory states then in the long run, the number of transitions from satisfactory states in S to unsatisfactory states in F must equal the number of transactions in the reverse direction:
P{xt ∈ S and xt+1 ∈ F} = P{xt ∈ F and xt+1∈ S} (4) Hence resilience γ is defined as the conditional probability of a recovery from the failure set in a single time step (Hashimoto et al., 1982):
γ = P{Xt+1 ∈ S | Xt∈ F} = F}{
S} and F{ 1
∈∈∈ +
t
tt
XPXXP (5)
Equation (5) describes resilience as the probability of a variate (x = X) to be in universal set S provided it was earlier in set F. This can be computed in the following way:
yearsin periodlan failures/P ofNumber F)S and S(F events ofnumber S)/Total toF from passing events of (Countsˆ →→
=γ (6a)
Alternatively, resilience may also be defined as equal to the inverse of the mean value of the time the system spends in an unsatisfactory state, i.e.:
1
1)(1
−
= ⎪⎭
⎪⎬⎫
⎪⎩
⎪⎨⎧
= ∑M
jjd
Mγ (6b)
where d(j) is the duration of the jth failure event and M is the total number of failure events. Moy et al. (1986) defined resilience as the maximum consecutive duration the system spends in an unsatisfactory state. In a limiting condition, if the occurrence of an event of failure (Xt ∈ F) and an event of success (Xt+1 ∈ S) are independent and mutually exclusive, then γ would reduce to P{Xt+1 ∈ S}, which is the measure of reliability. That means a measure of resilience implicitly includes the factor of reliability. Vulnerability
Vulnerability is a measure of the likely damage in a failure event and refers to the likely magnitude of a failure, if one occurs. Sometimes the consequences of the failure of a low probability event may be of large magnitude; hence prior strategies should be adopted to deal with the possible consequences of failures due to such events. Here, the idea of safe fail as opposed to fail safe is important; sometimes it is also referred to as survivability. An alternative way of defining
Dow
nloa
ded
by [
UM
KC
Uni
vers
ity o
f M
isso
uri K
ansa
s C
ity]
at 1
0:09
29
Sept
embe
r 20
14

Reliability, resilience and vulnerability of a multipurpose storage reservoir
Copyright © 2008 IAHS Press
437
vulnerability is to measure it in terms of defects in a system which enables an attacker to bypass security measures (Schultz et al., 1990). Although attempts are usually directed to maximize the reliability of a system or make a system’s operation failure free, very few systems can be designed and constructed in such a way. Many times, efforts to maximize system efficiency and reliability can actually increase a system’s vulnerability to costly failures, if and when these occur. For instance, flood control reservoirs and levees that control small floods create a sense of security. However, this may accelerate unwise development in partially protected areas, which in turn creates the potential for large losses should a large flood occur or a levee break. Flooding in the city of New Orleans (USA) in 2005 or in Surat City (downstream of the Ukai Reservoir in India) in August 2006 are examples of such vulnerability, and the time taken by these cities to return to the normal condition is a measure of their resilience. Mathematically, the index of system vulnerability can be developed as follows. Assume that the system performance variable Xt can take discrete values x1, …, xn. Now, each discrete failure state xj ∈ F is assigned a numerical indicator of the severity of that state, denoted by sj Furthermore, let ej be the probability that xj, corresponding to sj is the most unsatisfactory and severe outcome that occurs in a sojourn into the set of unsatisfactory states F. Then ej equals the probability that xj (corresponding to sj) is the most severe outcome in a sojourn in F. One reasonable metric for overall system vulnerability is the expected maximum severity of a sojourn into the set of unsatisfactory states:
∑∈
=Fj
jj esυ (7)
Here emphasis is not on how long failure persists (the inverse of resilience), but on how bad things may become. Besides maximum values, expected values are also used to compute vulnerability. Hashimoto et al. (1982) have described these indices in detail. In many countries including India, while determining the size of a reservoir and in deriving operation policies, only time and volume reliabilities are normally considered. However, many times these indices are not adequate and they fail to describe the resilience and vulnerability of a reservoir. With the growing scarcity of water, it is important that these indices are also examined to get a better insight into how the reservoir may perform in the future in the presence of natural randomness. Often the length of time series of input hydrological data is not adequate to obtain a stable estimate of these indices and recourse is made to Monte Carlo simulation. Monte Carlo simulation
In Monte Carlo simulation (MCS), random values of each of the uncertain variables are generated according to their respective probability distributions and the model describing the operation of the system is run using the generated values. If the steps involved in generation of random input variables and running the model of the system are repeated a large number of times, the statistical properties (mean, standard deviation, skewness, etc.) and the probability distribution of the model output can be determined. Law & Kelton (1991) provide a detailed treatment of MCS. Techniques to generate random variables that follow a wide variety of probability distributions are given by Fleming (1974) and Johnson (1980). The accuracy of the statistics and probability distribution obtained from MCS is a function of the number of simulations performed. For models with a large number of parameters and for which events with low probabilities (<0.1) of occurrence are of interest, tens of thousands of simulations are required. For complex, nonlinear models with many uncertain basic variables, the number of simulations (thus the computer time) necessary to achieve an accurate estimate may become prohibitive. Monte Carlo simulation is an extremely flexible and robust method capable of solving a great variety of problems. When the computing power is not a limitation (which is the case in almost all situations these days), MCS becomes a very versatile tool.
Dow
nloa
ded
by [
UM
KC
Uni
vers
ity o
f M
isso
uri K
ansa
s C
ity]
at 1
0:09
29
Sept
embe
r 20
14
S. K. Jain & P. K. Bhunya
Copyright © 2008 IAHS Press
438
Data used For the purpose of analysis, the data of Dharoi Reservoir in the Sabarmati basin, India, were used in this study. Dharoi is a multipurpose reservoir built across the Sabarmati River near Dharoi village, about 165 km upstream of Ahmedabad City in Gujarat State. The storage reservoir is used to supply water for municipal and industrial (M&I) uses and irrigation as well as to control floods in the downstream reaches. A detailed study of this system was reported by Jain et al. (1998) and the data used by them were used in this study. The storage and flow statistics of the Dharoi Reservoir are given in Table 1. The mean annual inflow to the reservoir is 972 × 106 m3 with standard deviation of 786 × 106 m3 and coefficient of variation of 0.81 (under the hypothesis of non-seasonality). Lag-one serial correlation for the monthly flows is 0.42. The annual demand for irrigation and water supply are 410 × 106 m3 and the live storage capacity of the reservoir is 739 × 106 m3. Thus the storage coefficient, which is the ratio of live storage to mean annual inflow, is 0.76 and the draft ratio, which is the ratio of annual demands to mean annual inflow, is 0.422. Further, this reservoir lies in an arid region where evaporation losses are quite high. The normal annual depth of evaporation from the reservoir is 2.15 m and the average annual volume of water loss due to evaporation is about 160 × 106 m3. If evaporation is interpreted as a compulsory demand from nature, the outflow ratio, which could be defined as the ratio of (demand + evaporation)/mean annual inflow, is 0.59. A comparison of the magnitudes of the average annual flows, live storage capacity and demands shows that the reservoir size is somewhat limited and, in the event of a dry year, the operator has few options in meeting demands. Statistical parameters of the observed discharge at Dharoi were used to generate synthetic sequences of flows. Two concepts were employed in the generation of monthly flows: short-memory models and long-memory models. Short-term memory implies that the effect of a particular value of the time series on the future values becomes negligible after a short period of time. Contrary to short-term memory, long-term memory implies that the influence of a particular value of the series on the future values is felt for a long period of time. Thus, in the short-memory models, the long-term dependence in the discharge series is not considered. Flows generated by using, for example the Thomas-Fiering and the ARMA models, do not display long-term dependence. In this study, the monthly Thomas-Fiering model (Bras & Rodriguez-Iturbe, 1985) was employed to generate monthly flows. Table 1 Basic data of the Dharoi Reservoir.
Storage capacity (106 m3) Demand (106 m3) Inflow (106 m3) Live Dead Total Irrigation M&I water supply 972.345 739.47 89.94 829.41 214.114 196.576 Hydrological time series display long-term memory or persistence, which is the tendency of high events (when the observed values are larger than the mean) or low events (when the observed values are smaller than the mean) to cluster together. If the data of a time series are available for n years then the statistic rescaled adjusted range is given by:
R*(n)/s(n) = KnH 0.5 < H < 1 (8) For a standard normal independent series, H is about 0.5, but Hurst (1951) found that the average value of H for time series of geophysical processes was 0.73. The Hurst phenomenon is the tendency of the geophysical processes to display a value of H much greater than 0.5. Many investigators (e.g. Klemeš, 1974; Bras & Rodriguez-Iturbe, 1985; Koutsoyiannis, 2002) have offered explanations for the Hurst phenomenon. To generate a time series of flow at a given location, while respecting the Hurst phenomenon, the first step is to compute the value of Hurst exponent H of the observed series. To estimate the
Dow
nloa
ded
by [
UM
KC
Uni
vers
ity o
f M
isso
uri K
ansa
s C
ity]
at 1
0:09
29
Sept
embe
r 20
14

Reliability, resilience and vulnerability of a multipurpose storage reservoir
Copyright © 2008 IAHS Press
439
Hurst exponent, R(n)/S(n) is plotted against log n. The slope of the straight line fitted to these data is an estimate of the Hurst exponent. For the data of inflows to the Dharoi Reservoir, the value of H was computed following the method of Koutsoyiannis (2002) and it turned out to be 0.7445. Among the models that have been proposed to reproduce the Hurst phenomenon while generating synthetic data, the fractional Gaussian noise (fGn) model was used in this study. The correlation function, ρ for the fGn processes is expressed as:
ρ(j, H) = 0.5[⏐j+1⏐2H –2⏐j⏐2H + ⏐j – 1⏐2H ] 22)12( −−≅ HjHH (9)
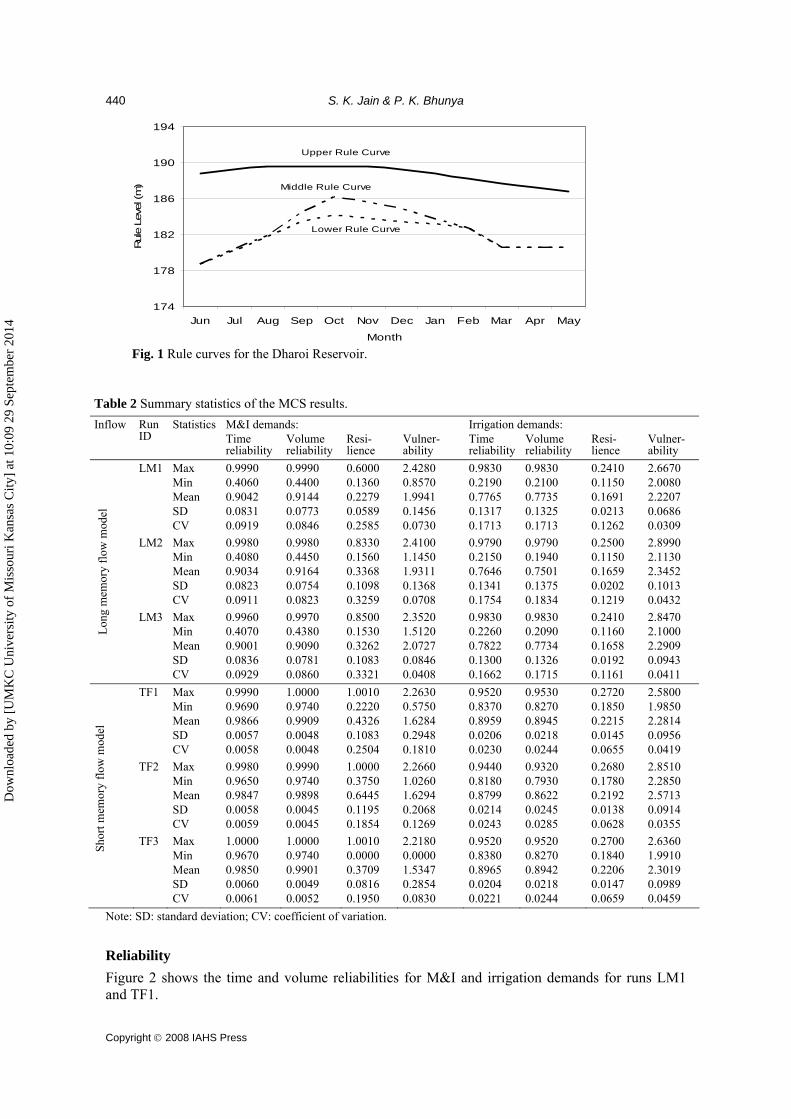
where j is the lag and H is the Hurst exponent. The symmetric moving average approach proposed by Koutsoyiannis (2002) to generate a fGn series was used to generate annual flows. These flows were disaggregated into monthly flows by following a linear disaggregation model (see Valencia & Schaake, 1973; Salas et al., 1980). Five hundred sequences, each of 200 years in length, representing inflows to the Dharoi Reservoir were generated. In India, reservoirs normally have a useful life of 100–150 years and, hence, this length adequately represents the life of a reservoir. Using these inflow sequences, the operation of the Dharoi Reservoir was simulated. For each sequence, several performance indices were computed. These are: (a) time and volume reliability for M&I water supply; (b) time and volume reliability for irrigation demands; (c) resilience of the system in meeting M&I demands; (d) resilience of the system in meeting irrigation demands; (e) vulnerability of the system in meeting M&I demands; and (f) vulnerability of the system in meeting M&I demands. Thus, a total of six indices was used. Reservoir operation Following Jain et al. (1998), the operation of the reservoir was simulated with the help of three rule curves. The upper rule curve controls reservoir filling and is not very relevant for the present study. The middle rule curve is critical to irrigation demands and was derived for the situation when water is scarce and not all demands can be met throughout the water year (in India the water year is considered to begin in June and end in May of the next year). If the reservoir falls below the level corresponding to the middle rule curve in a particular month, the supply for irrigation is curtailed so that the reduced release can be made for a longer duration, thus avoiding severe crop failure. It is envisaged that, below this level, release will be made to satisfy, at most, 75% of the irrigation demands and full water supply demands. The lower rule curve levels are critical to higher-priority M&I water supply demand. When the reservoir level falls below the lower rule level, the supply for irrigation is completely curtailed and release is made only for M&I demands. An iterative simulation process was followed to derive rule curves and the computations were terminated when desired reliabilities for both the demands were attained. The procedure to derive the rule curves is described in detail by Jain & Singh (2003). In this study, the rule curves developed by Jain et al. (1998) were followed. These rule curves are shown in Fig. 1. In some simulation runs, these curves were modified to examine the impact of changes in operation policy on the performance of the reservoir. RESULTS OF MONTE CARLO SIMULATIONS
Herein we discuss the results of Monte Carlo simulations. Table 2 summarizes the results of the various runs using the data generated by long-memory and short-memory models. In total, six sets of runs were taken: three for each memory model. The runs for long-memory flow models are identified as LM1, LM2, and LM3 while those for short-memory models (Thomas Fiering) are TF1, TF2, and TF3. In runs LM1 and TF1, rule curves shown in Fig. 1 were employed. For runs LM2 and TF2, the ordinates of the middle rule curve for all the months were raised by 1.0 m, and in runs LM3 and TF3, the lower rule curve was lowered by 0.3 m for all the months.
Dow
nloa
ded
by [
UM
KC
Uni
vers
ity o
f M
isso
uri K
ansa
s C
ity]
at 1
0:09
29
Sept
embe
r 20
14
S. K. Jain & P. K. Bhunya
Copyright © 2008 IAHS Press
440
174
178
182
186
190
194
Jun Jul Aug Sep Oct Nov Dec Jan Feb Mar Apr May
Month
Rul
e Le
vel (
m)
Upper Rule Curve
Middle Rule Curve
Lower Rule Curve
Fig. 1 Rule curves for the Dharoi Reservoir.
Table 2 Summary statistics of the MCS results. M&I demands: Irrigation demands: Inflow Run
ID Statistics
Time reliability
Volume reliability
Resi- lience
Vulner-ability
Time reliability
Volume reliability
Resi-lience
Vulner-ability
LM1 Max 0.9990 0.9990 0.6000 2.4280 0.9830 0.9830 0.2410 2.6670 Min 0.4060 0.4400 0.1360 0.8570 0.2190 0.2100 0.1150 2.0080 Mean 0.9042 0.9144 0.2279 1.9941 0.7765 0.7735 0.1691 2.2207 SD 0.0831 0.0773 0.0589 0.1456 0.1317 0.1325 0.0213 0.0686 CV 0.0919 0.0846 0.2585 0.0730 0.1713 0.1713 0.1262 0.0309 LM2 Max 0.9980 0.9980 0.8330 2.4100 0.9790 0.9790 0.2500 2.8990 Min 0.4080 0.4450 0.1560 1.1450 0.2150 0.1940 0.1150 2.1130 Mean 0.9034 0.9164 0.3368 1.9311 0.7646 0.7501 0.1659 2.3452 SD 0.0823 0.0754 0.1098 0.1368 0.1341 0.1375 0.0202 0.1013 CV 0.0911 0.0823 0.3259 0.0708 0.1754 0.1834 0.1219 0.0432 LM3 Max 0.9960 0.9970 0.8500 2.3520 0.9830 0.9830 0.2410 2.8470 Min 0.4070 0.4380 0.1530 1.5120 0.2260 0.2090 0.1160 2.1000 Mean 0.9001 0.9090 0.3262 2.0727 0.7822 0.7734 0.1658 2.2909 SD 0.0836 0.0781 0.1083 0.0846 0.1300 0.1326 0.0192 0.0943
Long
mem
ory
flow
mod
el
CV 0.0929 0.0860 0.3321 0.0408 0.1662 0.1715 0.1161 0.0411 TF1 Max 0.9990 1.0000 1.0010 2.2630 0.9520 0.9530 0.2720 2.5800 Min 0.9690 0.9740 0.2220 0.5750 0.8370 0.8270 0.1850 1.9850 Mean 0.9866 0.9909 0.4326 1.6284 0.8959 0.8945 0.2215 2.2814 SD 0.0057 0.0048 0.1083 0.2948 0.0206 0.0218 0.0145 0.0956 CV 0.0058 0.0048 0.2504 0.1810 0.0230 0.0244 0.0655 0.0419 TF2 Max 0.9980 0.9990 1.0000 2.2660 0.9440 0.9320 0.2680 2.8510 Min 0.9650 0.9740 0.3750 1.0260 0.8180 0.7930 0.1780 2.2850 Mean 0.9847 0.9898 0.6445 1.6294 0.8799 0.8622 0.2192 2.5713 SD 0.0058 0.0045 0.1195 0.2068 0.0214 0.0245 0.0138 0.0914 CV 0.0059 0.0045 0.1854 0.1269 0.0243 0.0285 0.0628 0.0355 TF3 Max 1.0000 1.0000 1.0010 2.2180 0.9520 0.9520 0.2700 2.6360 Min 0.9670 0.9740 0.0000 0.0000 0.8380 0.8270 0.1840 1.9910 Mean 0.9850 0.9901 0.3709 1.5347 0.8965 0.8942 0.2206 2.3019
Shor
t mem
ory
flow
mod
el
SD 0.0060 0.0049 0.0816 0.2854 0.0204 0.0218 0.0147 0.0989 CV 0.0061 0.0052 0.1950 0.0830 0.0221 0.0244 0.0659 0.0459
Note: SD: standard deviation; CV: coefficient of variation.
Reliability Figure 2 shows the time and volume reliabilities for M&I and irrigation demands for runs LM1 and TF1.
Dow
nloa
ded
by [
UM
KC
Uni
vers
ity o
f M
isso
uri K
ansa
s C
ity]
at 1
0:09
29
Sept
embe
r 20
14
Reliability, resilience and vulnerability of a multipurpose storage reservoir
Copyright © 2008 IAHS Press
441
0.4
0.5
0.6
0.7
0.8
0.9
1Ti
me
relia
bilit
y
Time Rel. M&I, LM1
Time Rel. M&I, TF1
0.4
0.5
0.6
0.7
0.8
0.9
1
0 100 200 300 400 500
MCS Run number
Vol
ume
relia
bilit
y
Vol. Rel. M&I, LM1
Vol. Rel. M&I, TF1
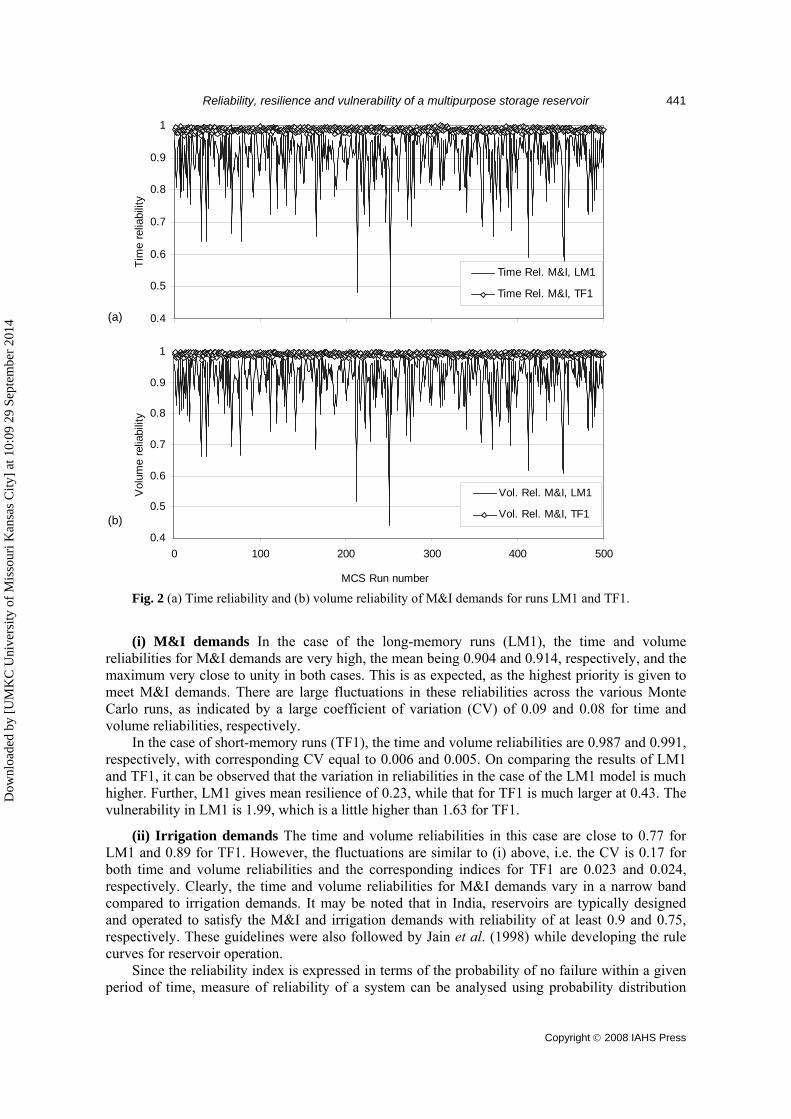
Fig. 2 (a) Time reliability and (b) volume reliability of M&I demands for runs LM1 and TF1.
(i) M&I demands In the case of the long-memory runs (LM1), the time and volume reliabilities for M&I demands are very high, the mean being 0.904 and 0.914, respectively, and the maximum very close to unity in both cases. This is as expected, as the highest priority is given to meet M&I demands. There are large fluctuations in these reliabilities across the various Monte Carlo runs, as indicated by a large coefficient of variation (CV) of 0.09 and 0.08 for time and volume reliabilities, respectively. In the case of short-memory runs (TF1), the time and volume reliabilities are 0.987 and 0.991, respectively, with corresponding CV equal to 0.006 and 0.005. On comparing the results of LM1 and TF1, it can be observed that the variation in reliabilities in the case of the LM1 model is much higher. Further, LM1 gives mean resilience of 0.23, while that for TF1 is much larger at 0.43. The vulnerability in LM1 is 1.99, which is a little higher than 1.63 for TF1.
(ii) Irrigation demands The time and volume reliabilities in this case are close to 0.77 for LM1 and 0.89 for TF1. However, the fluctuations are similar to (i) above, i.e. the CV is 0.17 for both time and volume reliabilities and the corresponding indices for TF1 are 0.023 and 0.024, respectively. Clearly, the time and volume reliabilities for M&I demands vary in a narrow band compared to irrigation demands. It may be noted that in India, reservoirs are typically designed and operated to satisfy the M&I and irrigation demands with reliability of at least 0.9 and 0.75, respectively. These guidelines were also followed by Jain et al. (1998) while developing the rule curves for reservoir operation. Since the reliability index is expressed in terms of the probability of no failure within a given period of time, measure of reliability of a system can be analysed using probability distribution
(b)
(a)
Dow
nloa
ded
by [
UM
KC
Uni
vers
ity o
f M
isso
uri K
ansa
s C
ity]
at 1
0:09
29
Sept
embe
r 20
14

S. K. Jain & P. K. Bhunya
Copyright © 2008 IAHS Press
442
0
0.1
0.2
0.3
0.4
0.5
0.6
0.7
0.8
0.9
1
0.2 0.3 0.4 0.5 0.6 0.7 0.8 0.9 1
Reliability
Prob
. of n
on-e
xcee
danc
e
Time Rel. Irr.Time Rel. M&I
0
0.1
0.2
0.3
0.4
0.5
0.6
0.7
0.8
0.9
1
0.2 0.3 0.4 0.5 0.6 0.7 0.8 0.9 1
Reliability
Prob
. of n
on-e
xcee
danc
e
Vol. Rel. Irr.
Vol. Rel. M&I
Fig. 3 Plots of (a) cdf of time reliability (b) cdf of volume reliability for M&I and irrigation demands for run LM1.
function (pdf) (Kjeldsen & Rosbjerg, 2004) by plotting the pdf with the probability of no failure on the y-axis and the recurrence time on the x-axis. The area under the pdf at any point will be the probability of no failure of the system within a fixed time. The probability concept was employed here to analyse the results of reliability (Table 2). From the pdf, estimates of reliability can be based on the pth percentile in the empirical cumulative distribution function (cdf) as:
)(/1
)(/11
1
pFr
pFr
vv
dd−
−
=
= (10)
where Fd and Fv are the cdf of duration and deficit volume, respectively. In the present study, the Blom’s plotting position formula:
)25.0/()375.0(/11 +−=−= NipF (11)
was used to construct the cdf. The cdf plot for time and volume reliabilities for M&I and irrigation demands is shown in Fig. 3. From the plot it can be noted that the probability of reliability being less than the critical value of 0.75 for irrigation demands is 0.373 and 0.345 for time and volume, respectively. Volume reliability is less likely to fall below the critical value because some quantity of water is supplied even during the failure periods. Although the cdf shapes for the two cases
(a)
(b)
Dow
nloa
ded
by [
UM
KC
Uni
vers
ity o
f M
isso
uri K
ansa
s C
ity]
at 1
0:09
29
Sept
embe
r 20
14

Reliability, resilience and vulnerability of a multipurpose storage reservoir
Copyright © 2008 IAHS Press
443
shown here are quite similar, the reliability values are significantly different in the middle portion. It means for very high and low probabilities (at the tail ends) the reliabilities of both time and volume asymptotically approach each other. Overall, there is high reliability in meeting the M&I demands since a high priority is given to these demands. In the case of MCS runs using short memory models, the CV for time and volume reliabilities was much smaller (Table 2) for both M&I and irrigation demands as compared to the corresponding values for long-memory runs. Above the probability of non-exceedence 0.2, time reliability for irrigation demands increases sharply for both (volume and time) cases. However, the volume reliability for irrigation demands changes slightly faster than that for time with respect to the probabilities indicating that the reservoir performance is very sensitive for reliability greater than 0.8. Beyond a relative frequency value of 0.8, the reliability of meeting demands does not change much with relative frequency while the time reliability shows some changes. This behaviour shows that, with the present combination of inflows, demands and reservoir characteristics, the chances of achieving of time reliability greater than 0.9 for the irrigation demands are very small. Resilience and vulnerability
Figure 4 shows the behaviour of resilience of the reservoir when serving M&I and irrigation demands. From Table 2 it is observed that for LM1, the average resilience of the reservoir for both the demands is low with a high CV; the CV is also higher for M&I demands. Higher resilience for M&I demands arises because the moment some water is available after a failure, attempts are made to meet these demands. Further, the reservoir has an average vulnerability of 2.2207 and 1.9941 for irrigation and M&I demands, respectively (Table 2). Here, the vulnerability values show the expected magnitude of scaled shortages. A smaller vulnerability for M&I demands arises due to higher priority attached with these demands. Low resilience and high vulnerability of the reservoir for irrigation demands has important implications. It shows that while the reservoir is able to meet the stipulated benchmarks under normal circumstances, it is highly vulnerable to low inflows in meeting irrigation demands. Further, the reservoir is more resilient and less vulnerable for M&I demands, but these indices show wide fluctuation because the storage capacity is rather small compared to mean annual inflows and the volume of demands. Consequently, a single bad year can severely downgrade the performance of the reservoir, which is a cause for concern as this reservoir is located in a drought prone region. Similar to equation (10), the pth percentile in the empirical cdf for resilience and vulnerability, respectively, are given as:
)(/1
)(/11
1
pFυ
pFγ
ν
γ
−
−
=
= (12)
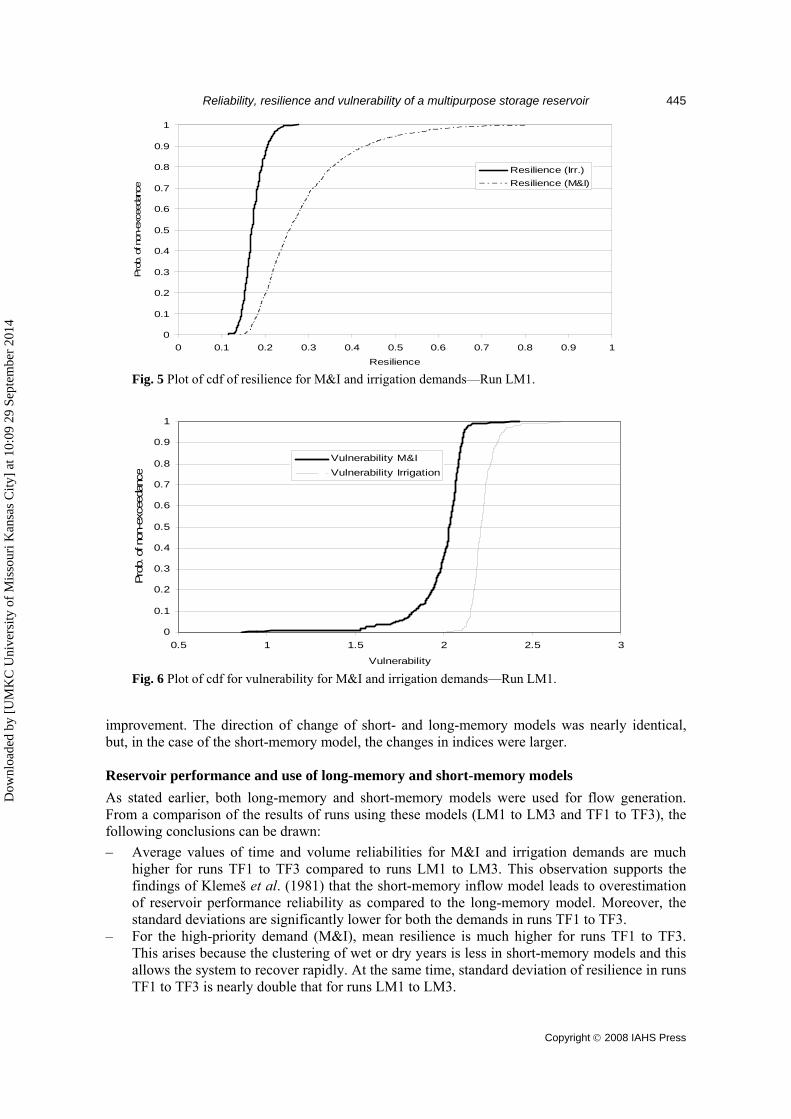
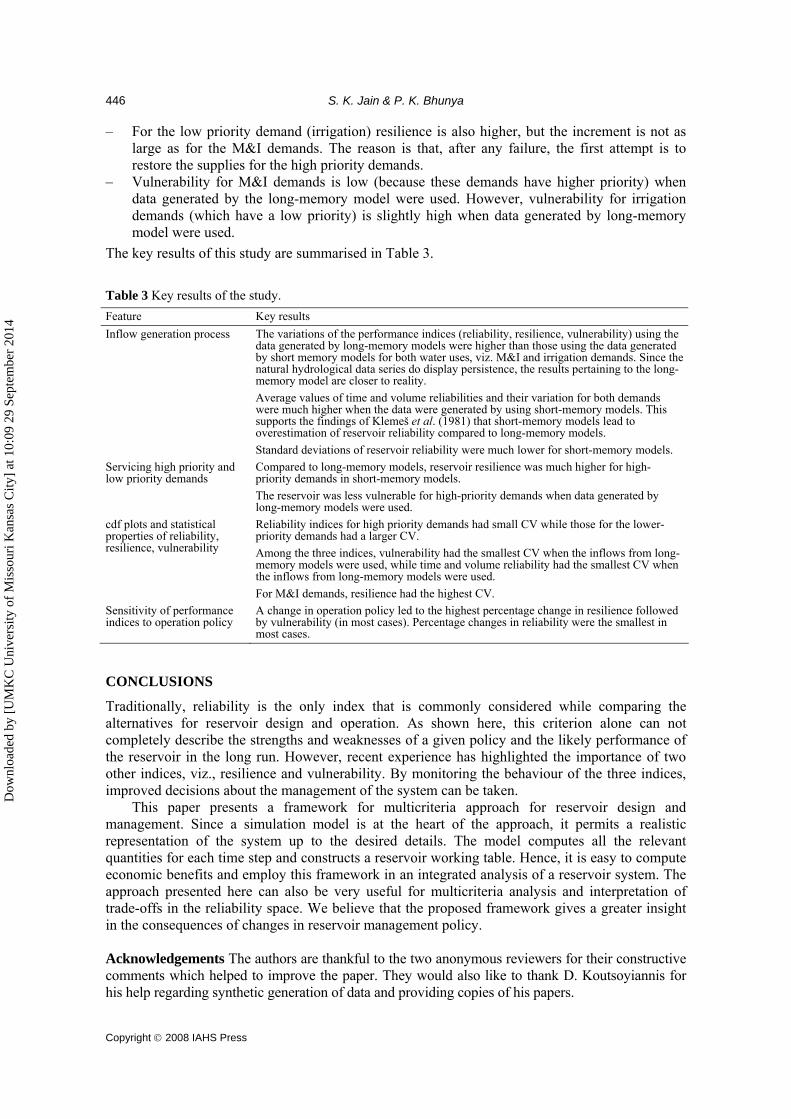
The cdf of the MCS results for resilience of the reservoir was plotted using equation (11) and is shown in Fig. 5. The result shows that low values of resilience are infrequent for M&I demands, whereas the reservoir has a low value of resilience in meeting the irrigation demands. For example, the probability of non-exceedence for low resilience of 0.3 in the case of M&I demands is 0.7, whereas in the case of irrigation demands, the maximum value (in our runs) of resilience is 0.27. Further, resilience values greater than 0.2 are rare for irrigation demands while those below 0.15 are rare for M&I demands. This graph further reinforces earlier inference about the robust performance of the reservoir in meeting the M&I demands. The cdf plot for vulnerability (Fig. 6) shows that the curves for M&I and irrigation demands have almost the same shapes with a shift of about 0.5. Of course, the former has low relative frequency for low values of vulnerability (or the operation is less vulnerable). Sensitivity of performance measures to changes in operation policy (rule curves) To examine the sensitivity of the performance measures to the changes in rule curve levels, some numerical experiments were conducted. The results are discussed below.
Dow
nloa
ded
by [
UM
KC
Uni
vers
ity o
f M
isso
uri K
ansa
s C
ity]
at 1
0:09
29
Sept
embe
r 20
14

S. K. Jain & P. K. Bhunya
Copyright © 2008 IAHS Press
444
0.1
0.2
0.3
0.4
0.5
0.6
0 100 200 300 400 500
Res
ilien
ceResilience M&I
Mean
0.08
0.12
0.16
0.2
0.24
0.28
0 100 200 300 400 500
MCS Run number
Res
ilien
ce
Resilience Irrigation
Mean
Fig. 4 Behaviour of resilience when serving for: (a) M&I and (b) irrigation demands for Run LM1.
In runs LM2 and TF2, the ordinates of the middle rule curve for all the months were raised by 1.0 m. As the supply of water to meet irrigation demands is curtailed when the reservoir level drops below the middle rule curve, a rise in the middle rule curve implies that the reduction in supply for irrigation demands may begin a little early and, hence, the reliability for irrigation demands will be lower. A comparison of the results shows that time and volume reliabilities for irrigation have reduced from LM1 to LM2 and from TF1 to TF2. At the same time, resilience in irrigation demands has decreased and the corresponding vulnerability has increased from LM1 to LM2 and from TF1 to TF2. Note that the percentage increase in mean vulnerability was more than the percentage reduction in mean resilience. Also, there was marginal increase in volume reliability for M&I demands and reservoir was more resilient and more vulnerability. The change in the indices for irrigation demands was in the same direction for the short- and long-memory models and there were minor differences for M&I demands. Runs LM2 and TF2 pertain to the situation in which the ordinates of the middle rule curve for all the months were raised by 1.0 m. The results of runs LM3 and TF3 show the behaviour of the performance indices when the lower rule curve was lowered by 0.3 m for all the months. Note that by doing this, some additional quantity of water may become available for irrigation while less water will be available for M&I demands. A comparison of the results of the runs LM3 and TF3 with runs LM1 and TF1 shows that with this change, the time and volume reliabilities for M&I demands have reduced. Further, with the changed rule curve, the resilience reduces significantly while the vulnerability increases marginally. As for the irrigation demands, the time reliability improved but the volume reliability was almost the same, resilience showed marginal decline, and vulnerability had marginal
(a)
(b)
Dow
nloa
ded
by [
UM
KC
Uni
vers
ity o
f M
isso
uri K
ansa
s C
ity]
at 1
0:09
29
Sept
embe
r 20
14
Reliability, resilience and vulnerability of a multipurpose storage reservoir
Copyright © 2008 IAHS Press
445
0
0.1
0.2
0.3
0.4
0.5
0.6
0.7
0.8
0.9
1
0 0.1 0.2 0.3 0.4 0.5 0.6 0.7 0.8 0.9 1
Resilience
Pro
b. o
f non
-exc
eeda
nce
Resilience (Irr.)Resilience (M&I)
Fig. 5 Plot of cdf of resilience for M&I and irrigation demands—Run LM1.
0
0.1
0.2
0.3
0.4
0.5
0.6
0.7
0.8
0.9
1
0.5 1 1.5 2 2.5 3
Vulnerability
Pro
b. o
f non
-exc
eeda
nce
Vulnerability M&IVulnerability Irrigation
Fig. 6 Plot of cdf for vulnerability for M&I and irrigation demands—Run LM1.
improvement. The direction of change of short- and long-memory models was nearly identical, but, in the case of the short-memory model, the changes in indices were larger. Reservoir performance and use of long-memory and short-memory models As stated earlier, both long-memory and short-memory models were used for flow generation. From a comparison of the results of runs using these models (LM1 to LM3 and TF1 to TF3), the following conclusions can be drawn: – Average values of time and volume reliabilities for M&I and irrigation demands are much
higher for runs TF1 to TF3 compared to runs LM1 to LM3. This observation supports the findings of Klemeš et al. (1981) that the short-memory inflow model leads to overestimation of reservoir performance reliability as compared to the long-memory model. Moreover, the standard deviations are significantly lower for both the demands in runs TF1 to TF3.
– For the high-priority demand (M&I), mean resilience is much higher for runs TF1 to TF3. This arises because the clustering of wet or dry years is less in short-memory models and this allows the system to recover rapidly. At the same time, standard deviation of resilience in runs TF1 to TF3 is nearly double that for runs LM1 to LM3.
Dow
nloa
ded
by [
UM
KC
Uni
vers
ity o
f M
isso
uri K
ansa
s C
ity]
at 1
0:09
29
Sept
embe
r 20
14
S. K. Jain & P. K. Bhunya
Copyright © 2008 IAHS Press
446
– For the low priority demand (irrigation) resilience is also higher, but the increment is not as large as for the M&I demands. The reason is that, after any failure, the first attempt is to restore the supplies for the high priority demands.
– Vulnerability for M&I demands is low (because these demands have higher priority) when data generated by the long-memory model were used. However, vulnerability for irrigation demands (which have a low priority) is slightly high when data generated by long-memory model were used.
The key results of this study are summarised in Table 3. Table 3 Key results of the study. Feature Key results Inflow generation process The variations of the performance indices (reliability, resilience, vulnerability) using the
data generated by long-memory models were higher than those using the data generated by short memory models for both water uses, viz. M&I and irrigation demands. Since the natural hydrological data series do display persistence, the results pertaining to the long-memory model are closer to reality. Average values of time and volume reliabilities and their variation for both demands were much higher when the data were generated by using short-memory models. This supports the findings of Klemeš et al. (1981) that short-memory models lead to overestimation of reservoir reliability compared to long-memory models. Standard deviations of reservoir reliability were much lower for short-memory models.
Servicing high priority and low priority demands
Compared to long-memory models, reservoir resilience was much higher for high-priority demands in short-memory models. The reservoir was less vulnerable for high-priority demands when data generated by long-memory models were used.
cdf plots and statistical properties of reliability, resilience, vulnerability
Reliability indices for high priority demands had small CV while those for the lower- priority demands had a larger CV. Among the three indices, vulnerability had the smallest CV when the inflows from long-memory models were used, while time and volume reliability had the smallest CV when the inflows from long-memory models were used. For M&I demands, resilience had the highest CV.
Sensitivity of performance indices to operation policy
A change in operation policy led to the highest percentage change in resilience followed by vulnerability (in most cases). Percentage changes in reliability were the smallest in most cases.
CONCLUSIONS
Traditionally, reliability is the only index that is commonly considered while comparing the alternatives for reservoir design and operation. As shown here, this criterion alone can not completely describe the strengths and weaknesses of a given policy and the likely performance of the reservoir in the long run. However, recent experience has highlighted the importance of two other indices, viz., resilience and vulnerability. By monitoring the behaviour of the three indices, improved decisions about the management of the system can be taken. This paper presents a framework for multicriteria approach for reservoir design and management. Since a simulation model is at the heart of the approach, it permits a realistic representation of the system up to the desired details. The model computes all the relevant quantities for each time step and constructs a reservoir working table. Hence, it is easy to compute economic benefits and employ this framework in an integrated analysis of a reservoir system. The approach presented here can also be very useful for multicriteria analysis and interpretation of trade-offs in the reliability space. We believe that the proposed framework gives a greater insight in the consequences of changes in reservoir management policy. Acknowledgements The authors are thankful to the two anonymous reviewers for their constructive comments which helped to improve the paper. They would also like to thank D. Koutsoyiannis for his help regarding synthetic generation of data and providing copies of his papers.
Dow
nloa
ded
by [
UM
KC
Uni
vers
ity o
f M
isso
uri K
ansa
s C
ity]
at 1
0:09
29
Sept
embe
r 20
14
Reliability, resilience and vulnerability of a multipurpose storage reservoir
Copyright © 2008 IAHS Press
447
REFERENCES Alhazmi, O. H., Malaiya, Y. K. & Ray, I. (2004) Vulnerabilities in major operating systems. Tech. Report, Computer Science
Department, Colorado State University, USA. Bras, R. L. & Rodriguez-Iturbe, I. (1985) Random Functions in Hydrology. Dover Publications, New York, USA. Fleming, A. N. (1974) Deterministic Simulation in Hydrology. American Elsevier, New York, USA. Hashimoto, T., Stedinger, J. R. & Loucks, D. P. (1982) Reliability, resiliency, and vulnerability criteria for water resource
system performance. Water Resour. Res. 18(1), 14–20. Hurst, H. (1951) Long term storage capacity of reservoirs. Trans. Am. Soc. Civil Engrs 116, 770–799. Jain, S. K., Goel, M. K. & Agrawal, P. K. (1998) Reservoir operation studies of Sabarmati System, India. J. Water Resour.
Plan. Manage. ASCE 124(1), 31–37. Jain, S. K. & Singh, V. P. (2003) Water Resources Systems Planning and Management. Elsevier, Amsterdam, The Netherlands. Jinno, K., Zongxue, X., Kawamura, A. & Tajiri, K. (1995) Risk assessment of a water supply system during drought. Water
Resour. Devel. 11(2), 185–204. Johnson, I. (1980) Users Manual for Hydrological Simulation Program Fortran (HSPF). EPA-600/9-80-015, US
Environmental Protection Agency, Davis, California, USA. Kay, P. A. (2000) Measuring sustainability in Israel’s water system. Water Int. 25(4), 617–623. Kjeldsen, T. R. & Rosbjerg, D. (2001) A framework for assessing water resources system sustainability. In: Regional
Management of Water Resources (ed. by A. H. Schumann, A. C. Acremann, D. Davis, M. A. Marino, D. Rosbjerg & Xia Jun), 107–113. IAHS Publ. 268. IAHS Press, Wallingford, UK.
Kjeldsen, T. R. & Rosbjerg, D. (2004) Choice of reliability, resilience and vulnerability estimators for risk assessments of water resources systems. Hydrol. Sci. J. 49(5), 755–767.
Klemeš, V. (1974) The Hurst phenomenon: a puzzle? Water Resour. Res. 10(4), 675–688. Klemeš, V., Srikanthan, R. & McMahon, T. A. (1981) Long-memory flow models in reservoir analysis: what is their practical
value? Water Resour. Res. 17(3), 737–751. Koutsoyiannis, D. (2002) The Hurst phenomenon and fractional Gaussian noise made easy. Hydrol. Sci. J. 47(4), 573–595. Kundzewicz, Z. W. & Kindler, J. (1995) Multiple criteria for evaluation of reliability aspects of water resources systems. In:
Modelling and Management of Sustainable Basin-scale Water Resources Systems (ed. by S. P. Simonovic, Z. Kundzewicz, D. Rosbjerg & K. Takeuchi) (Proc. Boulder Symp., July 1995), 217–224. IAHS Publ. 231. IAHS Press, Wallingford, UK.
Kundzewicz, Z. W. & Laski, A. (1995) Reliability-related criteria in water supply studies. In: New Uncertainties Concepts in Hydrology and Water Resources (ed. by Z. W. Kundzewicz), 299–305. Cambridge University Press, Cambridge, UK.
Law, A. M. & Kelton, W. D. (1991) Simulation Modeling and Analysis. McGraw-Hill, New York, USA. Montgomery, D. C. & Runger, G. C. (1994) Applied Statistics and Probability for Engineers. John Wiley Sons Inc., New York,
USA. Moy, W.-S., Cohon, J. L. & ReVelle, C. S. (1986) A programming model for analysis of the reliability, resiliency, and
vulnerability of a water supply reservoir. Water Resour. Res. 22(4), 489–498. Nalbantis, I. & Koutsoyiannis, D. (1997) A parametric rule for planning and management of multiple-reservoir systems. Water
Resour. Res. 33(9), 2165–2177. Salas, J. D., Delleur, J. W., Yevjevich, V. & Lane, W. L. (1980) Applied Modeling of Hydrologic Time Series. Water Resources
Publications, Littleton, Colorado, USA. Schultz, E. E. Jr, Brown, D. S. & Longstaff, T. A. (1990) Responding to Computer Security Incidents, July 23. Lawrence
Livermore National Laboratory, New York, USA. Srinivasan, K., Neelakantan, T. R., Shyam Narayan, P. & Nagarajukumar, C. (1999) Mixed-integer programming model for
reservoir performance optimization. J. Water Resour. Plan. Manage. ASCE 125(5), 298–301. Valencia, D. & Schaake, J. C. (1973) Disaggregation processes in stochastic hydrology. Water Resour. Res. 9(3), 580–585. Vogel, R. M., Lane, M., Ravindiran, R. S. & Kirshen, P. (1999) Storage reservoir behaviour in the United States. J. Water
Resour. Plan. Manage. ASCE 125(5), 245–254. Vogel, R. M. & Bolognese, R. A. (1995) Storage–reliability–resiliency–yield relations for over-year water supply systems.
Water Resour. Res. 31(3), 645–654. Received 20 November 2006; accepted 26 September 2007 D
ownl
oade
d by
[U
MK
C U
nive
rsity
of
Mis
sour
i Kan
sas
City
] at
10:
09 2
9 Se
ptem
ber
2014