summer distribution and relative abundance of …summer distribution and relative abundance of...
TRANSCRIPT
SSuummmmeerr DDiissttrriibbuuttiioonn aanndd RReellaattiivvee AAbbuunnddaannccee ooff
CCeettaacceeaannss ooffff tthhee WWeesstt CCooaasstt ooff IIrreellaanndd
ShOp Surveys Unit
Irish Whale and Dolphin Group
Merchant’s Quay, Kilrush, Co. Clare
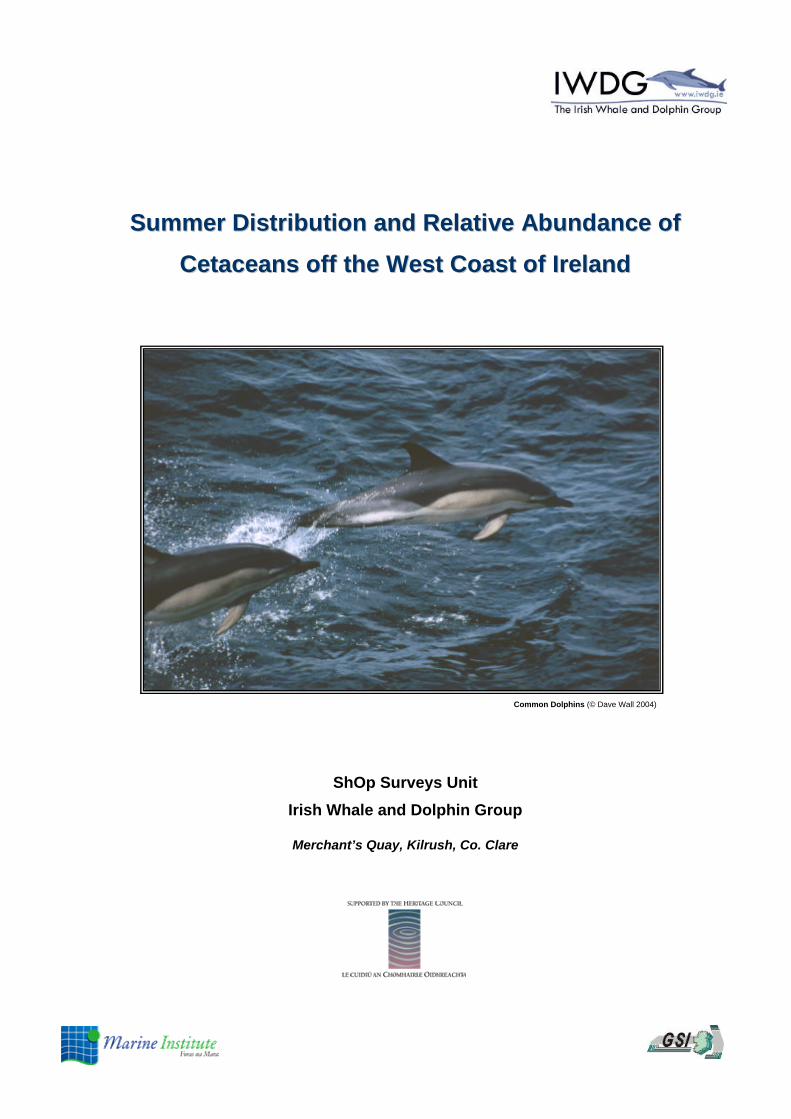
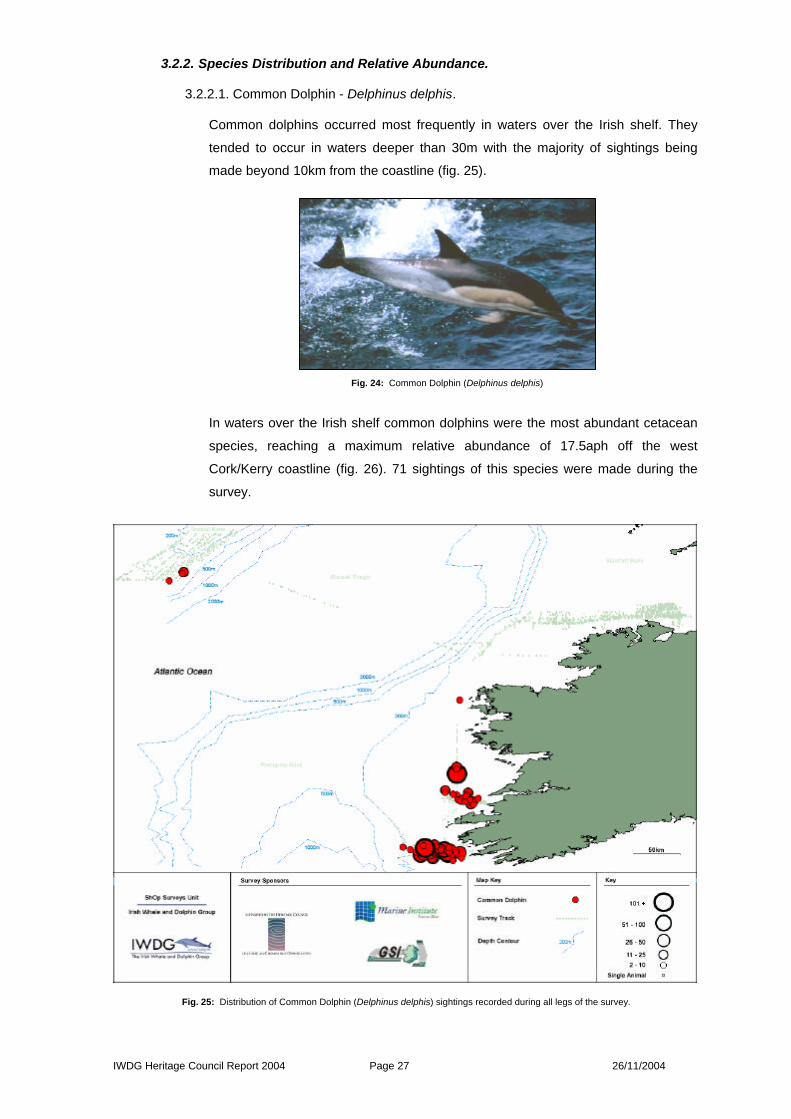
Common Dolphins (© Dave Wall 2004)
IWDG Heritage Council Report 2004 Page 1 26/11/2004
Summer Distribution and Relative Abundance of Cetaceans off the West Coast of Ireland
A Report for the Heritage Council
By
Dave Wall
ShOp Surveys Unit
Irish Whale and Dolphin Group
Merchants Quay, Kilrush, Co. Clare.
Email: [email protected] Web: www.iwdg.ie/shopsurveys/
Survey Team
Dave Wall (Project Director)
Joanne O’Brien
John Meade
Brendan Allen

IWDG Heritage Council Report 2004 Page 2 26/11/2004
Index
Summary …………………………………………………………………………………...........................................
1. Introduction ………………………………………………………………………………………………………………
2. Methods
2.1 Survey Methods …………………………………………………...…...................................................
2.2 Data Recording ………………………...…………… …………………………………………………..
2.3 Data Analysis …………………………………………..…………………………………………………..
3. Results
3.1 Survey Leg Reports …………………………….………………...…...................................................
3.1.1 Leg 1 - Shannon Approaches…………….…………………………………………………
3.1.2 Leg 2 - North Coast……………………………………. ……….………………...…………
3.1.3 Leg 3 - Rockall Bank …………………...….………..……..……………………...…………
3.1.4 Leg 4 – North Coast ……………………………….……....……………………...…………
3.1.5 Leg 5 – Cork/Kerry Coast ……………...………….……....……………………...…………
3.2 Cetacean Species Distribution & Relative Abundance …………………………..............................
3.2.1 Survey Effort ……………………………….…………………………………………………
3.2.2 Species Distribution & Relative Abundance ………………………………………………
3.2.2.1 Common Dolphin (Delphinus delphis) ………………………………………
3.2.2.2 Atlantic White-Sided Dolphin (Lagenorhynchus acutus) ……………….…
3.2.2.3 Bottlenose Dolphin (Tursiops truncatus) ……………………………………
3.2.2.4 Harbour Porpoise (Phocoena phocoena) ………..…………………………
3.2.2.5 Risso’s Dolphin (Grampus griseus) …………………………………………
3.2.2.6 Pilot Whale (Globicephala melanea) ……..…………………………………
3.2.2.7 Minke Whale (Balaenoptera acutorostrata) ………...………………………
3.2.2.8 Fin Whale (Balaenoptera physalus) …………………………………………
3.2.2.9 Unidentified Dolphin Species …………………………………………………
3.2.2.10 Unidentified Whale Species …………………………………………………
3.2.2.11 Basking Shark (Cetorhinus maximus) ………..……………………………
3.2.2.12 Other Species …………………………………………………………………
4. Conclusions ……………………………………………………………………………………………………..
5. Acknowledgements …………………………………………………………………………………………….
6. References ……………………………………………………………………………………………………….
Appendix I : List of cetacean species recorded in Irish waters .………………………………………………………..
Appendix II : Daily Wind Speed and Directions Recorded During Each Leg of the Survey ………………………..
Page
3
4
6
4
4
8
8
12
15
19
22
26
26
27
27
30
32
34
36
38
40
42
44
45
46
47
48
49
50
52
53
IWDG Heritage Council Report 2004 Page 3 26/11/2004
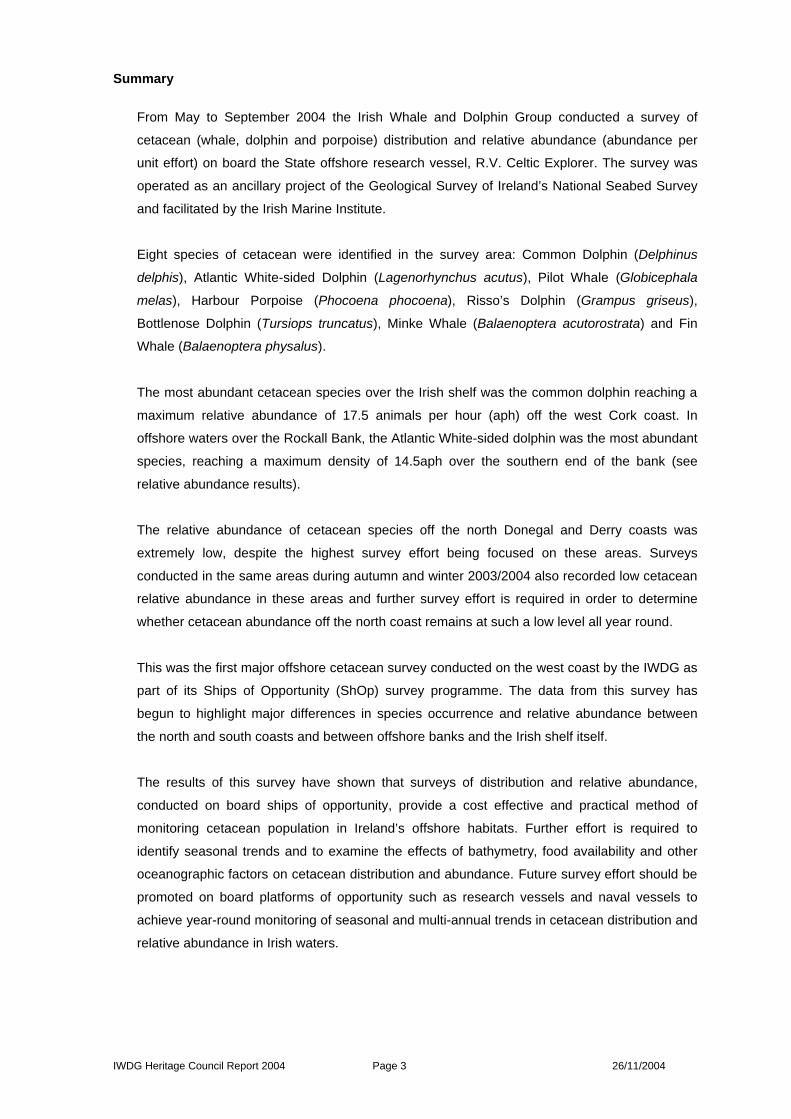
Summary
From May to September 2004 the Irish Whale and Dolphin Group conducted a survey of
cetacean (whale, dolphin and porpoise) distribution and relative abundance (abundance per
unit effort) on board the State offshore research vessel, R.V. Celtic Explorer. The survey was
operated as an ancillary project of the Geological Survey of Ireland’s National Seabed Survey
and facilitated by the Irish Marine Institute.
Eight species of cetacean were identified in the survey area: Common Dolphin (Delphinus
delphis), Atlantic White-sided Dolphin (Lagenorhynchus acutus), Pilot Whale (Globicephala
melas), Harbour Porpoise (Phocoena phocoena), Risso’s Dolphin (Grampus griseus),
Bottlenose Dolphin (Tursiops truncatus), Minke Whale (Balaenoptera acutorostrata) and Fin
Whale (Balaenoptera physalus).
The most abundant cetacean species over the Irish shelf was the common dolphin reaching a
maximum relative abundance of 17.5 animals per hour (aph) off the west Cork coast. In
offshore waters over the Rockall Bank, the Atlantic White-sided dolphin was the most abundant
species, reaching a maximum density of 14.5aph over the southern end of the bank (see
relative abundance results).
The relative abundance of cetacean species off the north Donegal and Derry coasts was
extremely low, despite the highest survey effort being focused on these areas. Surveys
conducted in the same areas during autumn and winter 2003/2004 also recorded low cetacean
relative abundance in these areas and further survey effort is required in order to determine
whether cetacean abundance off the north coast remains at such a low level all year round.
This was the first major offshore cetacean survey conducted on the west coast by the IWDG as
part of its Ships of Opportunity (ShOp) survey programme. The data from this survey has
begun to highlight major differences in species occurrence and relative abundance between
the north and south coasts and between offshore banks and the Irish shelf itself.
The results of this survey have shown that surveys of distribution and relative abundance,
conducted on board ships of opportunity, provide a cost effective and practical method of
monitoring cetacean population in Ireland’s offshore habitats. Further effort is required to
identify seasonal trends and to examine the effects of bathymetry, food availability and other
oceanographic factors on cetacean distribution and abundance. Future survey effort should be
promoted on board platforms of opportunity such as research vessels and naval vessels to
achieve year-round monitoring of seasonal and multi-annual trends in cetacean distribution and
relative abundance in Irish waters.
IWDG Heritage Council Report 2004 Page 4 26/11/2004
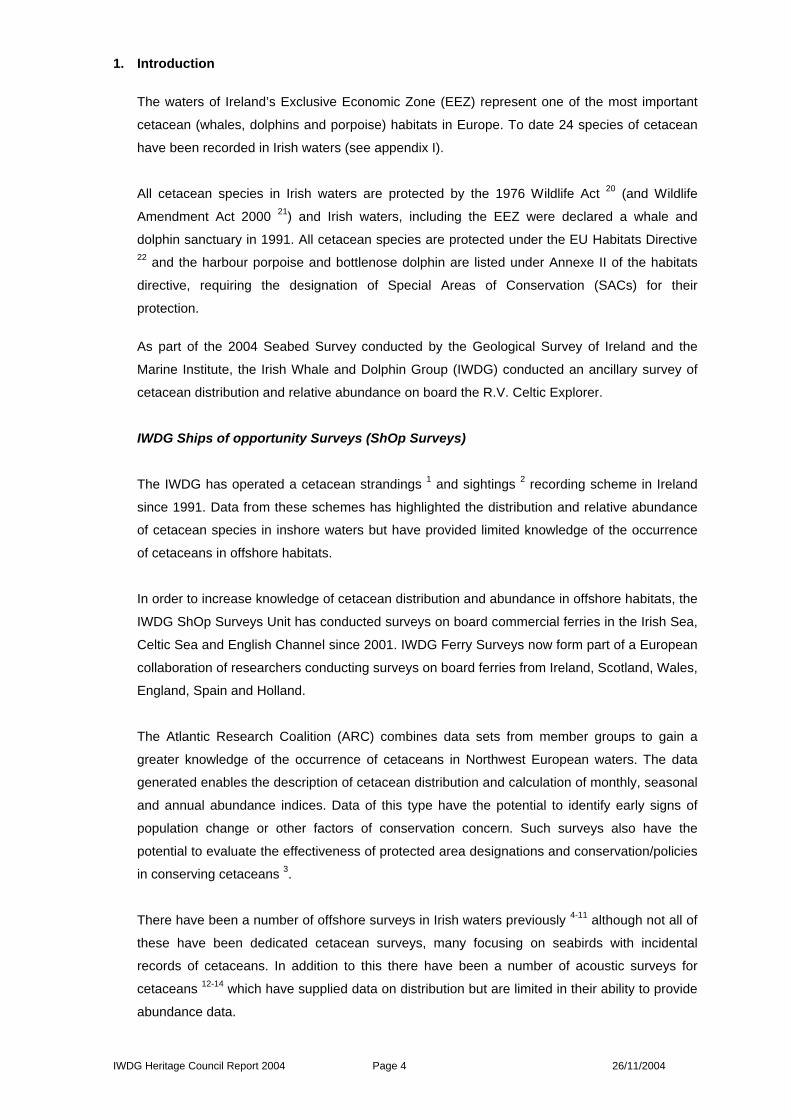
1. Introduction
The waters of Ireland’s Exclusive Economic Zone (EEZ) represent one of the most important
cetacean (whales, dolphins and porpoise) habitats in Europe. To date 24 species of cetacean
have been recorded in Irish waters (see appendix I).
All cetacean species in Irish waters are protected by the 1976 Wildlife Act 20 (and Wildlife
Amendment Act 2000 21) and Irish waters, including the EEZ were declared a whale and
dolphin sanctuary in 1991. All cetacean species are protected under the EU Habitats Directive 22 and the harbour porpoise and bottlenose dolphin are listed under Annexe II of the habitats
directive, requiring the designation of Special Areas of Conservation (SACs) for their
protection.
As part of the 2004 Seabed Survey conducted by the Geological Survey of Ireland and the
Marine Institute, the Irish Whale and Dolphin Group (IWDG) conducted an ancillary survey of
cetacean distribution and relative abundance on board the R.V. Celtic Explorer.
IWDG Ships of opportunity Surveys (ShOp Surveys)
The IWDG has operated a cetacean strandings 1 and sightings 2 recording scheme in Ireland
since 1991. Data from these schemes has highlighted the distribution and relative abundance
of cetacean species in inshore waters but have provided limited knowledge of the occurrence
of cetaceans in offshore habitats.
In order to increase knowledge of cetacean distribution and abundance in offshore habitats, the
IWDG ShOp Surveys Unit has conducted surveys on board commercial ferries in the Irish Sea,
Celtic Sea and English Channel since 2001. IWDG Ferry Surveys now form part of a European
collaboration of researchers conducting surveys on board ferries from Ireland, Scotland, Wales,
England, Spain and Holland.
The Atlantic Research Coalition (ARC) combines data sets from member groups to gain a
greater knowledge of the occurrence of cetaceans in Northwest European waters. The data
generated enables the description of cetacean distribution and calculation of monthly, seasonal
and annual abundance indices. Data of this type have the potential to identify early signs of
population change or other factors of conservation concern. Such surveys also have the
potential to evaluate the effectiveness of protected area designations and conservation/policies
in conserving cetaceans 3.
There have been a number of offshore surveys in Irish waters previously 4-11 although not all of
these have been dedicated cetacean surveys, many focusing on seabirds with incidental
records of cetaceans. In addition to this there have been a number of acoustic surveys for
cetaceans 12-14 which have supplied data on distribution but are limited in their ability to provide
abundance data.
IWDG Heritage Council Report 2004 Page 5 26/11/2004
The knowledge of cetacean distribution and abundance in Irish offshore habitats is poor and it
is with the goal of significantly increasing this knowledge that the current study was conducted.
The majority of cetacean offshore surveys in Irish waters, as with the current survey, have
focused on the summer months. The current survey will, however, form part of a wider
database of distribution and relative abundance surveys conducted by the IWDG ShOp
Surveys Unit in all seasons since 2001 and into the future. Already the IWDG has a three year
database for the Irish Sea and eastern Celtic Sea. In addition to this surveys conducted
onboard the Celtic Explorer in autumn/winter/spring 2003/2004 and planned surveys for the
coming autumn/winter will significantly increase knowledge on the distribution and abundance
of cetaceans during these rarely surveyed seasons.
The objectives of this survey were to:
1. Determine the relative abundance and distribution of cetacean species within the
survey areas covered by the 2004 National Seabed Survey and in areas covered en
route to and from these survey areas.
2. Produce relative abundance and distribution data comparable to the data collected by
the IWDG on their Ferry Surveys and other surveys conducted by the ShOp Surveys
Unit on board the R.V. Celtic Explorer. All data to be fed into the main IWDG sightings
database and used to produce maps of cetacean relative abundance and distribution
for Irish waters.

IWDG Heritage Council Report 2004 Page 6 26/11/2004
2. Methods
2.1. Survey Method
This survey was conducted from the observation platform located above the bridge and
18m above the waterline (fig. 1).
Watch effort was focused on the area dead ahead of the vessel and 45? to either side. The
area was constantly scanned during these hours by eye and with binoculars. Sightings
recorded up to 90? either side of dead ahead were included in the survey results.
2.2. Data Collection
Ships position, course and speed were recorded using a Garmin 72™ GPS linked to a
Toshiba laptop PC. At the end of each day the track data was downloaded onto the laptop
PC using Garmin MapSource™ plotting software. Environmental stations were recorded
every 15 minutes using the IFAW Logger 2000™ program 23 and later transferred to a
Microsoft Excel spreadsheet. Environmental data gathered were: sea state; visibility; cloud
cover; swell height; precipitation; wind speed & wind direction.
Sightings were also logged using the IFAW Logger 2000™ program. For each sighting the
following data were recorded: time; location; species; distance; bearing; number of animals
(adults, juveniles and calves) and behaviour.
2.3. Data Analysis
Sightings data were separated into two categories; 1) Effort-related – sightings collected
while conducting surveys from the crow’s nest. 2) Auxiliary sightings – collected outside
Fig. 1. R.V. Celtic Explorer (Left) showing the purpose built Crow’s Nest located above
the bridge (Right).
IWDG Heritage Council Report 2004 Page 7 26/11/2004
survey hours e.g. while working on the bridge or while on breaks etc. Both effort-related
and auxiliary sightings were used to plot distribution maps for each species.
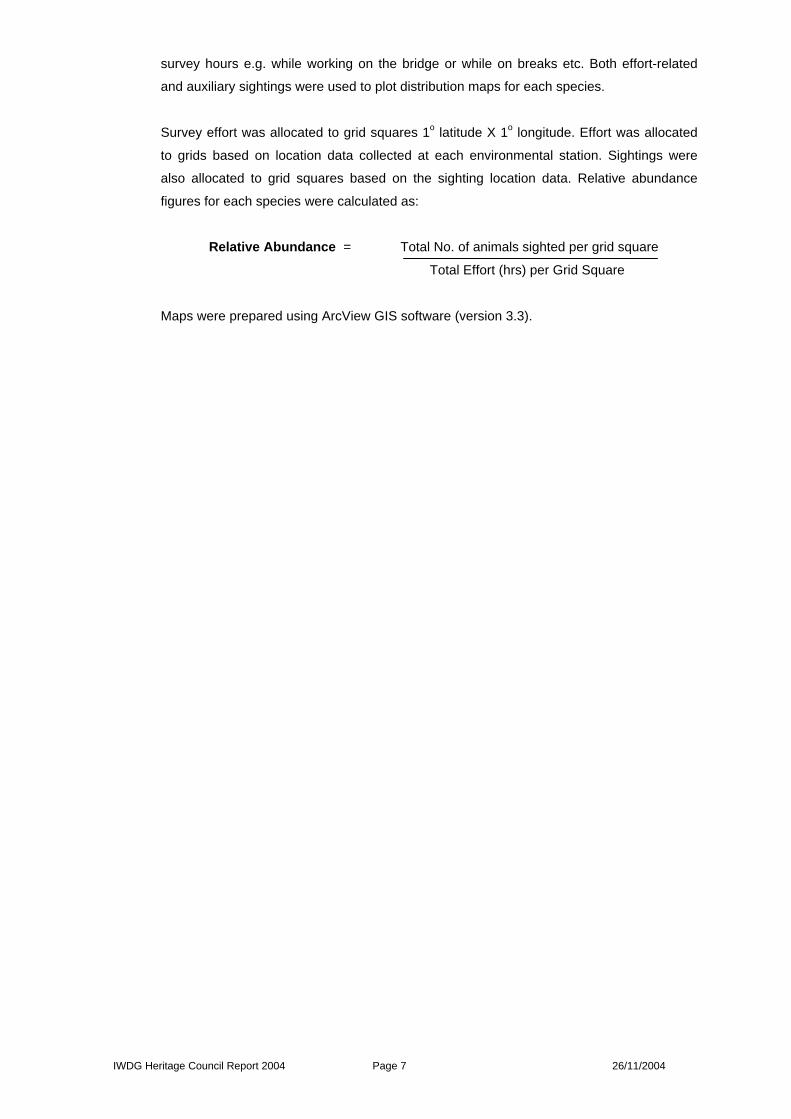
Survey effort was allocated to grid squares 1o latitude X 1o longitude. Effort was allocated
to grids based on location data collected at each environmental station. Sightings were
also allocated to grid squares based on the sighting location data. Relative abundance
figures for each species were calculated as:
Relative Abundance = Total No. of animals sighted per grid square
Total Effort (hrs) per Grid Square
Maps were prepared using ArcView GIS software (version 3.3).
IWDG Heritage Council Report 2004 Page 8 26/11/2004
3. Results
3.1. Survey Leg Reports
3.1.1. Leg 1 – Shannon Approaches (11 May – 2 June 2004)
3.1.1.1. Environmental Conditions
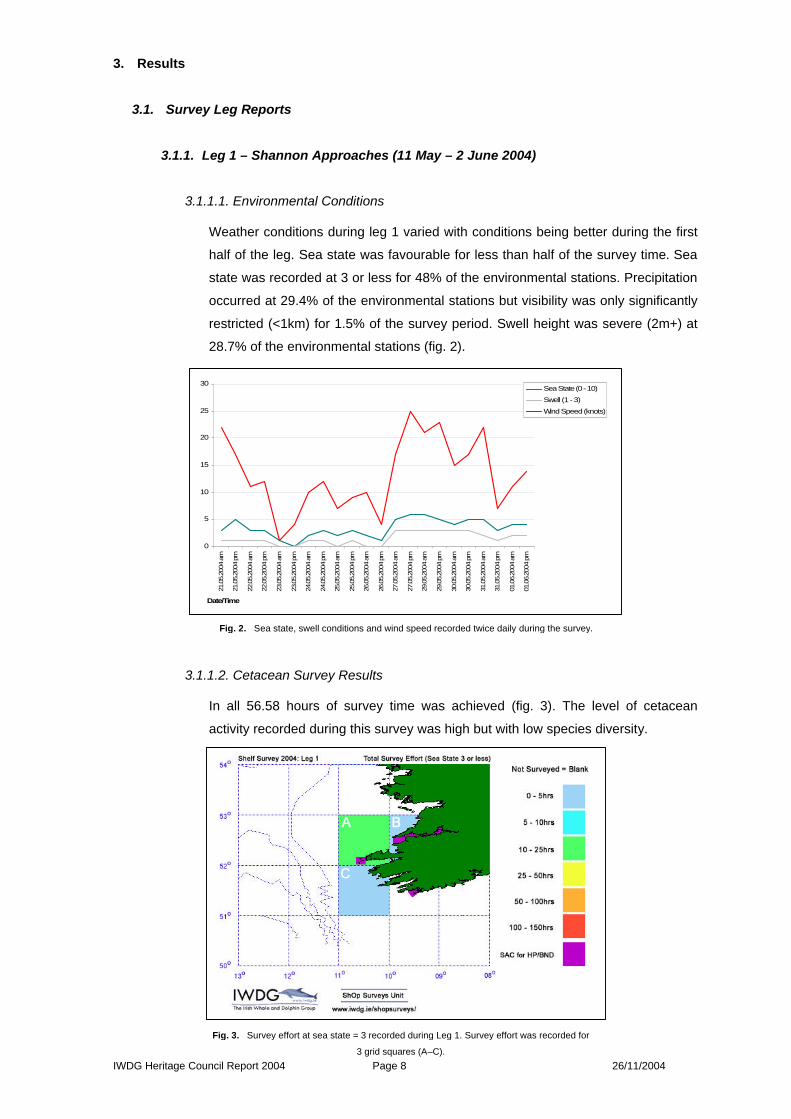
Weather conditions during leg 1 varied with conditions being better during the first
half of the leg. Sea state was favourable for less than half of the survey time. Sea
state was recorded at 3 or less for 48% of the environmental stations. Precipitation
occurred at 29.4% of the environmental stations but visibility was only significantly
restricted (<1km) for 1.5% of the survey period. Swell height was severe (2m+) at
28.7% of the environmental stations (fig. 2).
3.1.1.2. Cetacean Survey Results
In all 56.58 hours of survey time was achieved (fig. 3). The level of cetacean
activity recorded during this survey was high but with low species diversity.
0
5
10
15
20
25
30
21.0
5.20
04 a
m
21.0
5.20
04 p
m
22.0
5.20
04 a
m
22.0
5.20
04 p
m
23.0
5.20
04 a
m
23.0
5.20
04 p
m
24.0
5.20
04 a
m
24.0
5.20
04 p
m
25.0
5.20
04 a
m
25.0
5.20
04 p
m
26.0
5.20
04 a
m
26.0
5.20
04 p
m
27.0
5.20
04 a
m
27.0
5.20
04 p
m
29.0
5.20
04 a
m
29.0
5.20
04 p
m
30.0
5.20
04 a
m
30.0
5.20
04 p
m
31.0
5.20
04 a
m
31.0
5.20
04 p
m
01.0
6.20
04 a
m
01.0
6.20
04 p
m
Date/Time
Sea State (0 - 10)
Swell (1 - 3)
Wind Speed (knots)
Fig. 2. Sea state, swell conditions and wind speed recorded twice daily during the survey.
Fig. 3. Survey effort at sea state = 3 recorded during Leg 1. Survey effort was recorded for
3 grid squares (A–C).
IWDG Heritage Council Report 2004 Page 9 26/11/2004
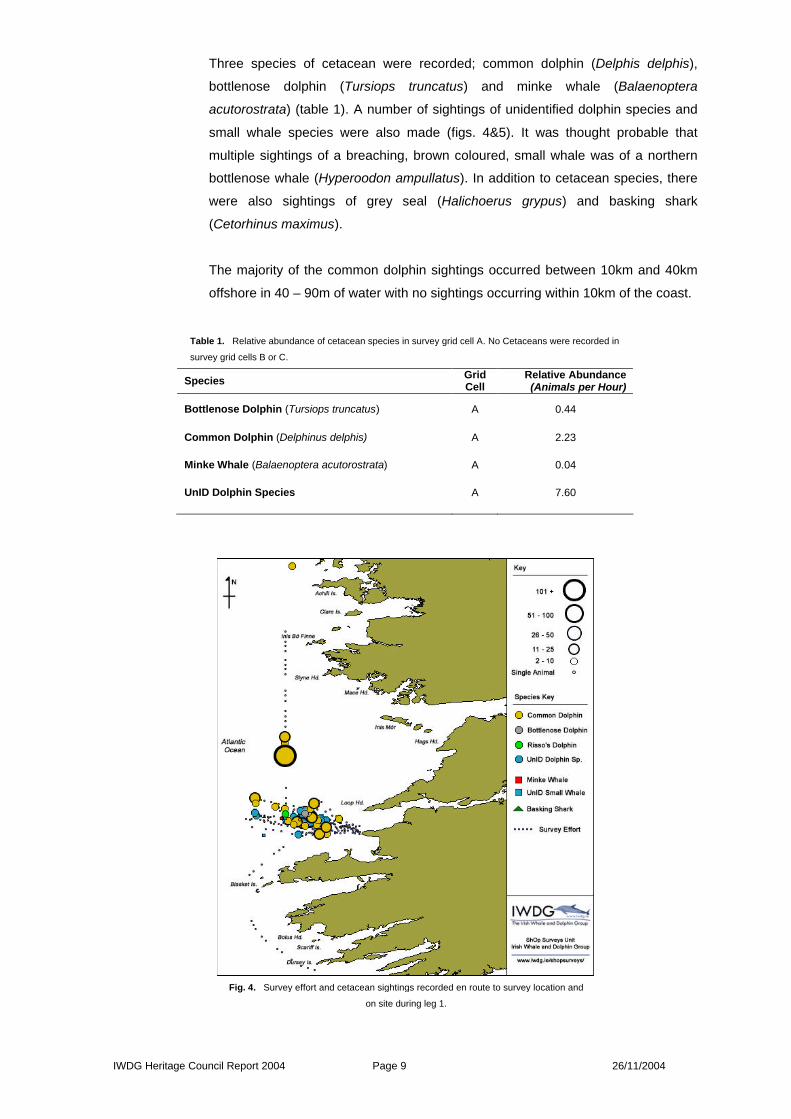
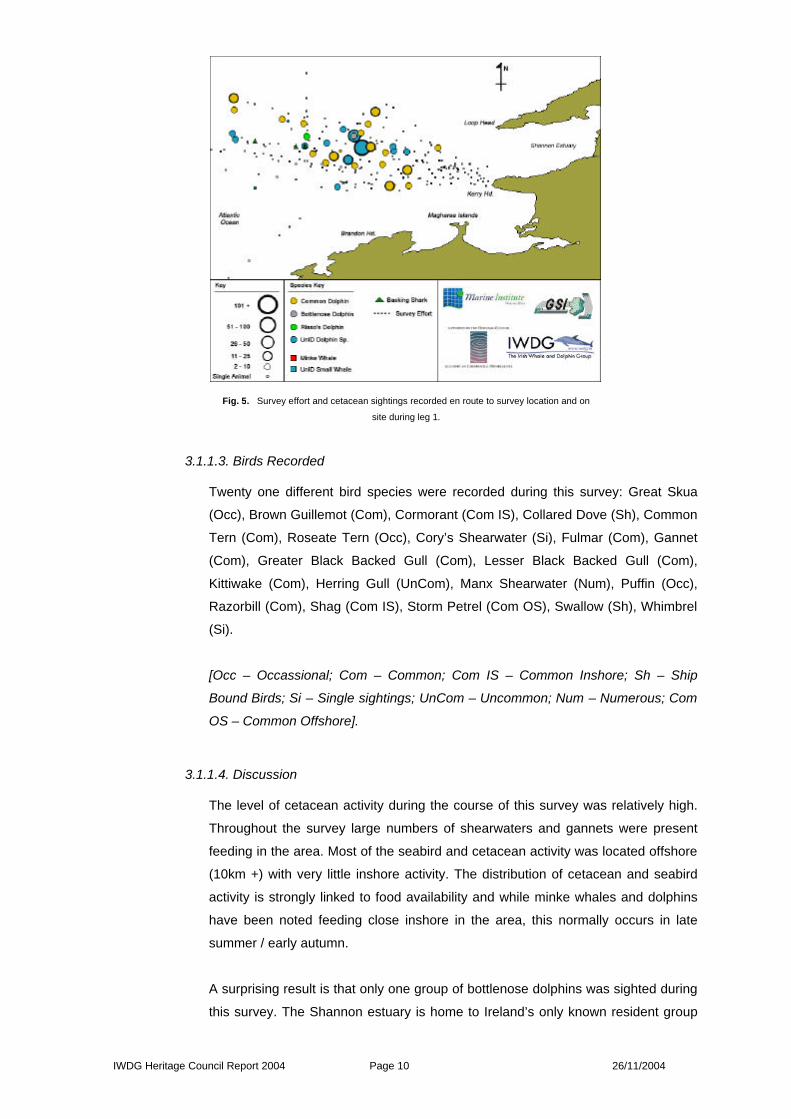
Three species of cetacean were recorded; common dolphin (Delphis delphis),
bottlenose dolphin (Tursiops truncatus) and minke whale (Balaenoptera
acutorostrata) (table 1). A number of sightings of unidentified dolphin species and
small whale species were also made (figs. 4&5). It was thought probable that
multiple sightings of a breaching, brown coloured, small whale was of a northern
bottlenose whale (Hyperoodon ampullatus). In addition to cetacean species, there
were also sightings of grey seal (Halichoerus grypus) and basking shark
(Cetorhinus maximus).
The majority of the common dolphin sightings occurred between 10km and 40km
offshore in 40 – 90m of water with no sightings occurring within 10km of the coast.
Species Grid Cell
Relative Abundance (Animals per Hour)
Bottlenose Dolphin (Tursiops truncatus) A 0.44
Common Dolphin (Delphinus delphis) A 2.23
Minke Whale (Balaenoptera acutorostrata) A 0.04
UnID Dolphin Species A 7.60
Table 1. Relative abundance of cetacean species in survey grid cell A. No Cetaceans were recorded in
survey grid cells B or C.
Fig. 4. Survey effort and cetacean sightings recorded en route to survey location and
on site during leg 1.
IWDG Heritage Council Report 2004 Page 10 26/11/2004
3.1.1.3. Birds Recorded
Twenty one different bird species were recorded during this survey: Great Skua
(Occ), Brown Guillemot (Com), Cormorant (Com IS), Collared Dove (Sh), Common
Tern (Com), Roseate Tern (Occ), Cory’s Shearwater (Si), Fulmar (Com), Gannet
(Com), Greater Black Backed Gull (Com), Lesser Black Backed Gull (Com),
Kittiwake (Com), Herring Gull (UnCom), Manx Shearwater (Num), Puffin (Occ),
Razorbill (Com), Shag (Com IS), Storm Petrel (Com OS), Swallow (Sh), Whimbrel
(Si).
[Occ – Occassional; Com – Common; Com IS – Common Inshore; Sh – Ship
Bound Birds; Si – Single sightings; UnCom – Uncommon; Num – Numerous; Com
OS – Common Offshore].
3.1.1.4. Discussion
The level of cetacean activity during the course of this survey was relatively high.
Throughout the survey large numbers of shearwaters and gannets were present
feeding in the area. Most of the seabird and cetacean activity was located offshore
(10km +) with very little inshore activity. The distribution of cetacean and seabird
activity is strongly linked to food availability and while minke whales and dolphins
have been noted feeding close inshore in the area, this normally occurs in late
summer / early autumn.
A surprising result is that only one group of bottlenose dolphins was sighted during
this survey. The Shannon estuary is home to Ireland’s only known resident group
Fig. 5. Survey effort and cetacean sightings recorded en route to survey location and on
site during leg 1.

IWDG Heritage Council Report 2004 Page 11 26/11/2004
of bottlenose dolphins. However IWDG sightings records 2 show few sightings of
bottlenose dolphins off Loop Head during May, with sightings peaking in mid to late
summer. The absence of bottlenose dolphins in the Shannon approaches during
this survey may be linked to:
1. Food availability: although there was a high degree of offshore feeding
activity among common dolphins, bottlenose dolphins were absent. It is
possible that the bottlenose dolphins remain inside the estuary to feed on
migrating salmon at this time of the year.
2. Factors related to the bottlenose dolphin calving period: calving in
bottlenose dolphins occurs at this time of the year and this may affect the
distribution of dolphins within and outside the estuary.
3. Bottlenose dolphin sensitivity to noise emissions from onboard
multi-beam and sub bottom profiler equipment: Although common
dolphins showed no severe reaction to the same equipment, different
dolphin species are sensitive to different sound frequency ranges. With
bottlenose dolphin sightings in the area being normally low at this time of
the year, there is little evidence to suggest that acoustic disturbance was a
significant factor.
The presence of basking sharks was noted only in sea state 0 - 1. The sightings
during this survey were preceded by a sighting of 100+ basking sharks off the west
Cork coast two week previously.
Surveyor: Dave Wall
IWDG Heritage Council Report 2004 Page 12 26/11/2004
3.1.2. Leg 2 – North Coast (3 June – 28 June 2004)
3.1.2.1. Environmental Conditions
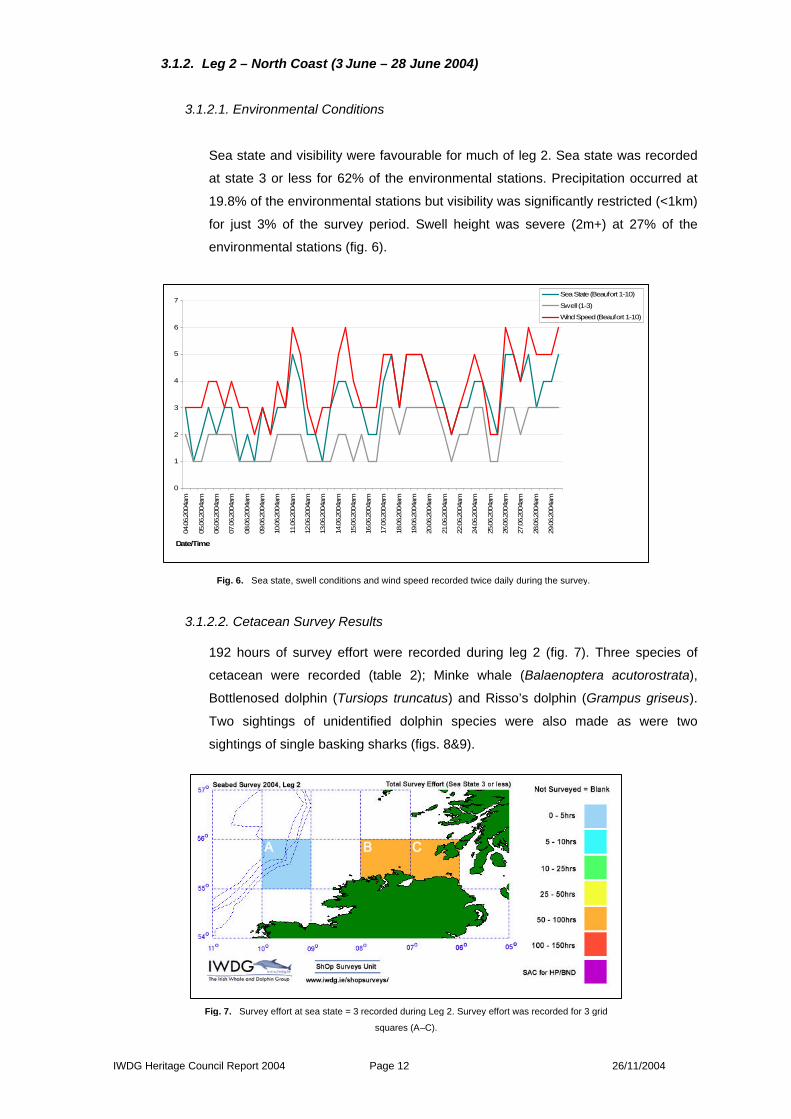
Sea state and visibility were favourable for much of leg 2. Sea state was recorded
at state 3 or less for 62% of the environmental stations. Precipitation occurred at
19.8% of the environmental stations but visibility was significantly restricted (<1km)
for just 3% of the survey period. Swell height was severe (2m+) at 27% of the
environmental stations (fig. 6).
3.1.2.2. Cetacean Survey Results
192 hours of survey effort were recorded during leg 2 (fig. 7). Three species of
cetacean were recorded (table 2); Minke whale (Balaenoptera acutorostrata),
Bottlenosed dolphin (Tursiops truncatus) and Risso’s dolphin (Grampus griseus).
Two sightings of unidentified dolphin species were also made as were two
sightings of single basking sharks (figs. 8&9).
0
1
2
3
4
5
6
7
04.0
6.20
04am
05.0
6.20
04am
06.0
6.20
04am
07.0
6.20
04am
08.0
6.20
04am
09.0
6.20
04am
10.0
6.20
04am
11.0
6.20
04am
12.0
6.20
04am
13.0
6.20
04am
14.0
6.20
04am
15.0
6.20
04am
16.0
6.20
04am
17.0
6.20
04am
18.0
6.20
04am
19.0
6.20
04am
20.0
6.20
04am
21.0
6.20
04am
22.0
6.20
04am
24.0
6.20
04am
25.0
6.20
04am
26.0
6.20
04am
27.0
6.20
04am
28.0
6.20
04am
29.0
6.20
04am
Date/Time
Sea State (Beaufort 1-10)
Swell (1-3)
Wind Speed (Beaufort 1-10)
Fig. 6. Sea state, swell conditions and wind speed recorded twice daily during the survey.
Fig. 7. Survey effort at sea state = 3 recorded during Leg 2. Survey effort was recorded for 3 grid
squares (A–C).
IWDG Heritage Council Report 2004 Page 13 26/11/2004
Species Grid Cell
Relative Abundance (Animals per Hour)
Bottlenose Dolphin (Tursiops truncatus) B 0.03
Minke Whale (Balaenoptera acutorostrata) B 0.01
Risso’s Dolphin (Grampus griseus) C 0.08
UnID Dolphin Species B 0.03
C 0.1
Table 2: Relative abundance of cetacean species in survey grid cells B & C.
Fig. 8: Survey effort and cetacean sightings recorded en route to survey
location and on site during leg 2.
Fig. 9: Survey effort and cetacean sightings recorded north of Malin Head
during leg 2.
IWDG Heritage Council Report 2004 Page 14 26/11/2004
3.1.2.3. Discussion
The low number of cetacean sightings was surprising given the high level of
cetacean activity in the south and south west at this time of the year. The IWDG
sightings database has a low number of sightings recorded from the north and
northwest of the country. Prior to these ShOp surveys it was thought that the low
number of sightings may have been related to low levels of survey effort but this
now has to be questioned.
This survey suggests that the relative abundance of cetaceans in this region is
much lower than other parts of the country at this time of year. At the time of the
survey numerous casual sightings had been reported around the country with most
cetacean activity been recorded in the south.
Another factor that could negatively influence sightings was the type of equipment
used on board during this survey. The multibeam (EM1002) used to map the sea
floor gives of frequencies of 93 and 98 kHz. The sonar (Simrad SP70) used has a
range between 20-30kHz and the bridge sounders give off frequencies of 50 and
200kHz. The wide range of high intensity acoustic frequencies produced may
have acted as a deterrent to cetaceans.
Most sightings of animals were at least 300m from the ship except for on the 26
June 2 sightings of basking sharks Cetorhinus maximus were made approximately
150m from the ship. On previous surveys where the same equipment was in use
cetaceans such as common dolphin Delphinus delphis, and pilot whales
Globicephala melanea have approached the vessel on numerous occasions and
did not exhibit any evident reaction to these high frequencies.
Surveyor: Joanne O’Brien
IWDG Heritage Council Report 2004 Page 15 26/11/2004
3.1.3. Leg 3 – Rockall Bank (2 July – 28 July 2004)
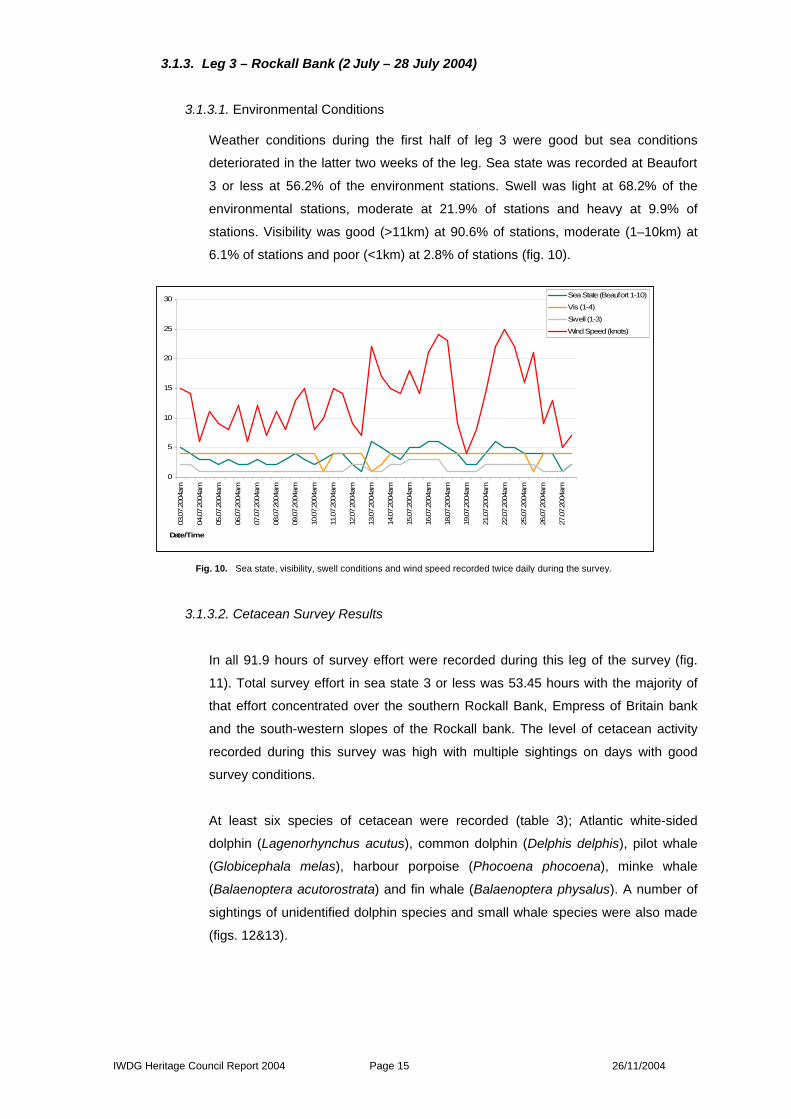
3.1.3.1. Environmental Conditions
Weather conditions during the first half of leg 3 were good but sea conditions
deteriorated in the latter two weeks of the leg. Sea state was recorded at Beaufort
3 or less at 56.2% of the environment stations. Swell was light at 68.2% of the
environmental stations, moderate at 21.9% of stations and heavy at 9.9% of
stations. Visibility was good (>11km) at 90.6% of stations, moderate (1–10km) at
6.1% of stations and poor (<1km) at 2.8% of stations (fig. 10).
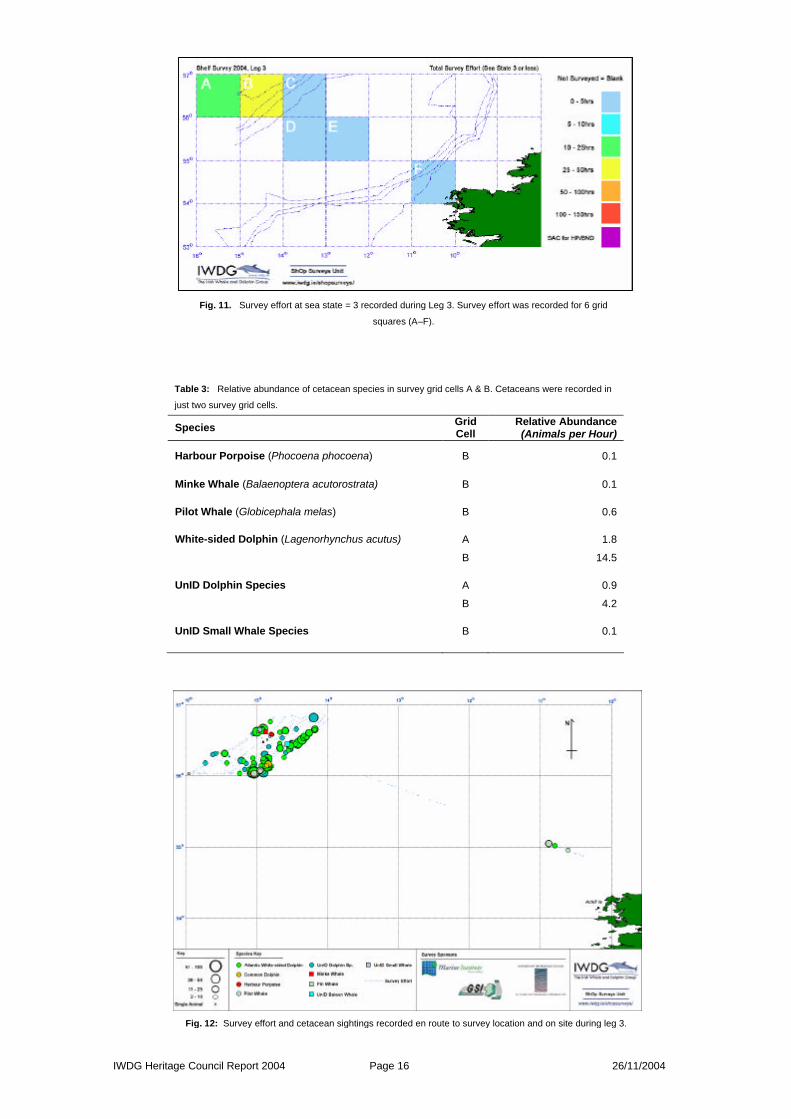
3.1.3.2. Cetacean Survey Results
In all 91.9 hours of survey effort were recorded during this leg of the survey (fig.
11). Total survey effort in sea state 3 or less was 53.45 hours with the majority of
that effort concentrated over the southern Rockall Bank, Empress of Britain bank
and the south-western slopes of the Rockall bank. The level of cetacean activity
recorded during this survey was high with multiple sightings on days with good
survey conditions.
At least six species of cetacean were recorded (table 3); Atlantic white-sided
dolphin (Lagenorhynchus acutus), common dolphin (Delphis delphis), pilot whale
(Globicephala melas), harbour porpoise (Phocoena phocoena), minke whale
(Balaenoptera acutorostrata) and fin whale (Balaenoptera physalus). A number of
sightings of unidentified dolphin species and small whale species were also made
(figs. 12&13).
0
5
10
15
20
25
30
03.0
7.20
04am
04.0
7.20
04am
05.0
7.20
04am
06.0
7.20
04am
07.0
7.20
04am
08.0
7.20
04am
09.0
7.20
04am
10.0
7.20
04am
11.0
7.20
04am
12.0
7.20
04am
13.0
7.20
04am
14.0
7.20
04am
15.0
7.20
04am
16.0
7.20
04am
18.0
7.20
04am
19.0
7.20
04am
21.0
7.20
04am
22.0
7.20
04am
25.0
7.20
04am
26.0
7.20
04am
27.0
7.20
04am
Date/Time
Sea State (Beaufort 1-10)
Vis (1-4)
Swell (1-3)
Wind Speed (knots)
Fig. 10. Sea state, visibility, swell conditions and wind speed recorded twice daily during the survey.
IWDG Heritage Council Report 2004 Page 16 26/11/2004
Species Grid Cell
Relative Abundance (Animals per Hour)
Harbour Porpoise (Phocoena phocoena) B 0.1
Minke Whale (Balaenoptera acutorostrata) B 0.1
Pilot Whale (Globicephala melas) B 0.6
White-sided Dolphin (Lagenorhynchus acutus) A 1.8
B 14.5
UnID Dolphin Species A 0.9
B 4.2
UnID Small Whale Species B 0.1
Fig. 11. Survey effort at sea state = 3 recorded during Leg 3. Survey effort was recorded for 6 grid
squares (A–F).
Table 3: Relative abundance of cetacean species in survey grid cells A & B. Cetaceans were recorded in
just two survey grid cells.
Fig. 12: Survey effort and cetacean sightings recorded en route to survey location and on site during leg 3.
IWDG Heritage Council Report 2004 Page 17 26/11/2004
3.1.3.3. Birds Recorded
Fourteen different bird species were recorded during this survey: Brown Guillemot
(UnCom); Fulmar (Com); Gannet (Occ); Great Skua (Occ); Kittiwake (Occ); Lesser
Black Back Gull (Occ); Manx Shearwater (Com); Pomarine Skua (UnCom); Puffin
(UnCom); Roseate Tern (UnCom), Sooty Shearwater (Co from mid month); Storm
Petrel (Com); Swallow (UnCom).
[Occ – Occassional; Com – Common; Com IS – Common Inshore; Sh – Ship Bound Birds; Sin – Single
sightings; UnCom – Uncommon; Num – Numerous; Com OS – Common Offshore].
3.1.3.4. Discussion
The number of cetaceans observed during the course of this survey was generally
high, though prevailing weather conditions in the latter half of leg 3 prevented
effective surveying from taking place. The most notable trend in the data was the
replacement of common dolphins (Delphinus delphis) by Atlantic white-sided
dolphins (Lagenorhynchus acutus) as the most common dolphin species over the
Rockall Bank. Common dolphins were also present on the Bank but their
occurrence was sporadic and in relatively low numbers.
Much of the survey took place close to the edge of the bank, where water depths
drop off to 1000m+. Despite this, the deep water cetacean species expected along
such a feature were notably absent. There were only three sightings of pilot whales
over the bank edge and no sperm whales or beaked whales. It may be that these
species favour deep water canyons such as found off the Hatton Bank to the
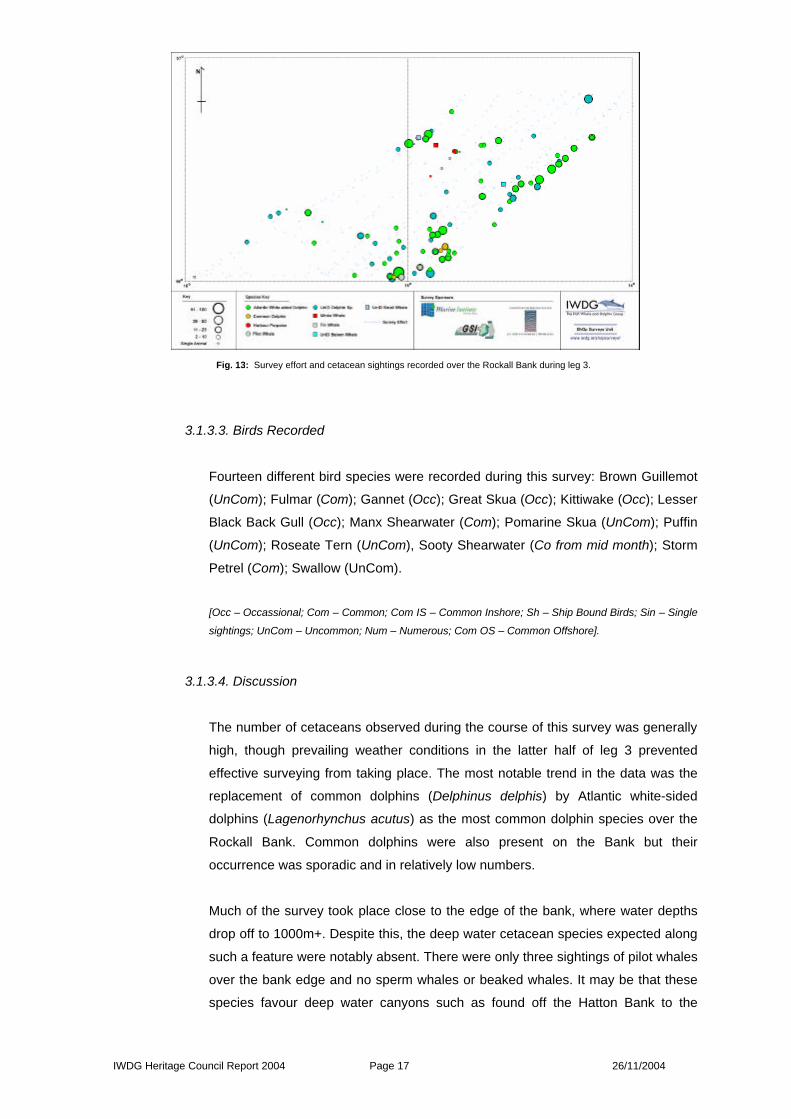
Fig. 13: Survey effort and cetacean sightings recorded over the Rockall Bank during leg 3.
IWDG Heritage Council Report 2004 Page 18 26/11/2004
northwest. Reports from an adjacent survey on the Hatton Bank indicated that pilot
whales, sperm whales and northern bottlenose whales were present in some
numbers (M. Mackey pers. comm.).
Many of the recorded sightings of unidentified dolphin species were thought to
have been of Atlantic white-sided dolphins. Other notable sightings were of
harbour porpoise, which occur in low numbers over offshore banks and of a fin
whale. The fin whale sighted was not feeding and three unidentified baleen whales
(thought to be of the same species) also seemed to be travelling rather than
feeding.
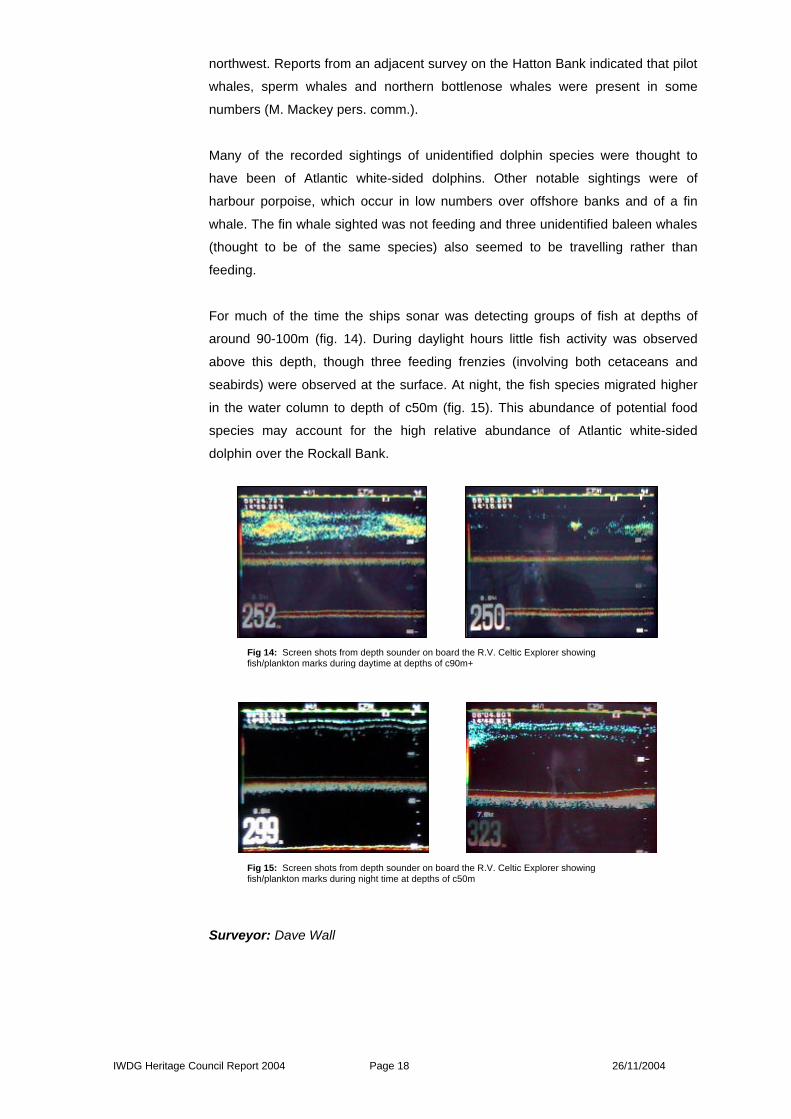
For much of the time the ships sonar was detecting groups of fish at depths of
around 90-100m (fig. 14). During daylight hours little fish activity was observed
above this depth, though three feeding frenzies (involving both cetaceans and
seabirds) were observed at the surface. At night, the fish species migrated higher
in the water column to depth of c50m (fig. 15). This abundance of potential food
species may account for the high relative abundance of Atlantic white-sided
dolphin over the Rockall Bank.
Surveyor: Dave Wall
Fig 14: Screen shots from depth sounder on board the R.V. Celtic Explorer showing fish/plankton marks during daytime at depths of c90m+
Fig 15: Screen shots from depth sounder on board the R.V. Celtic Explorer showing fish/plankton marks during night time at depths of c50m
IWDG Heritage Council Report 2004 Page 19 26/11/2004
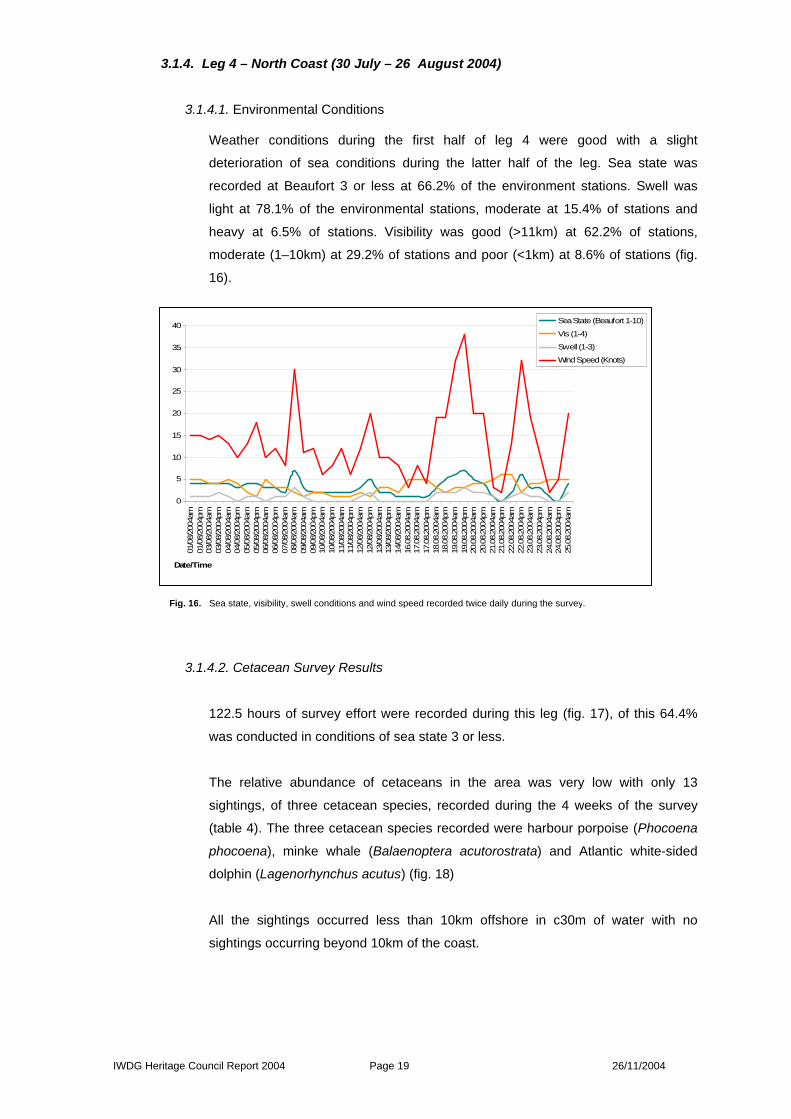
3.1.4. Leg 4 – North Coast (30 July – 26 August 2004)
3.1.4.1. Environmental Conditions
Weather conditions during the first half of leg 4 were good with a slight
deterioration of sea conditions during the latter half of the leg. Sea state was
recorded at Beaufort 3 or less at 66.2% of the environment stations. Swell was
light at 78.1% of the environmental stations, moderate at 15.4% of stations and
heavy at 6.5% of stations. Visibility was good (>11km) at 62.2% of stations,
moderate (1–10km) at 29.2% of stations and poor (<1km) at 8.6% of stations (fig.
16).
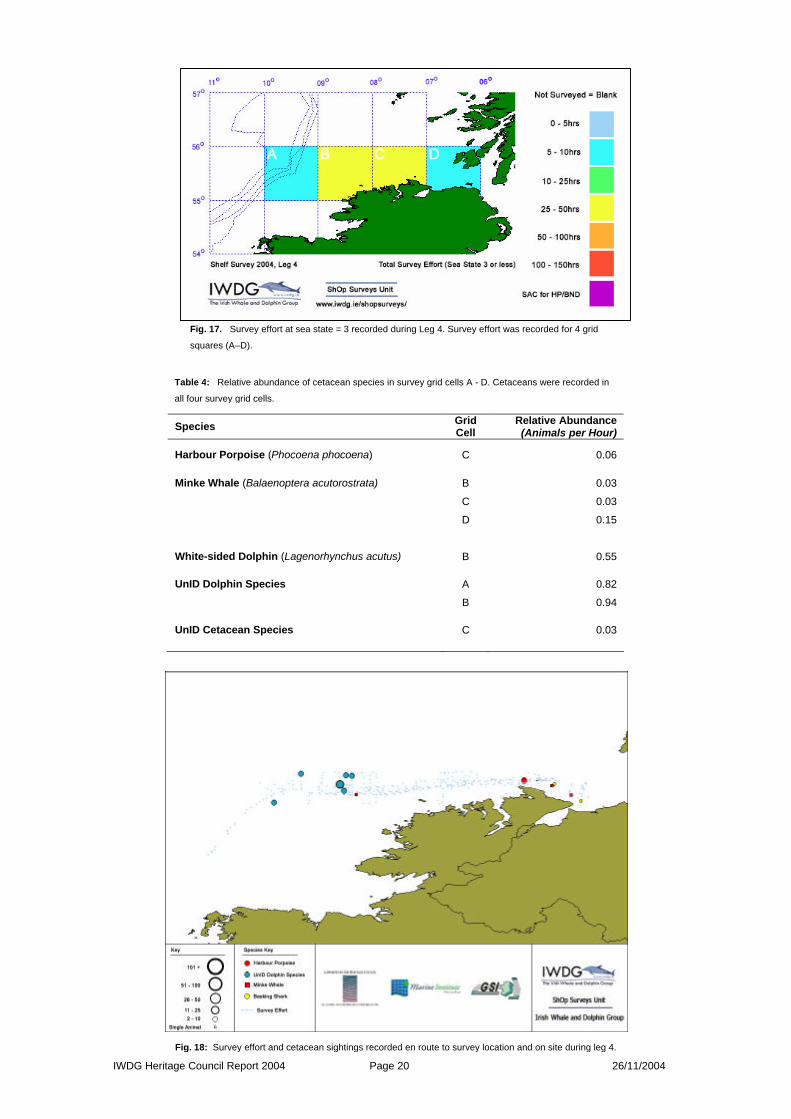
3.1.4.2. Cetacean Survey Results
122.5 hours of survey effort were recorded during this leg (fig. 17), of this 64.4%
was conducted in conditions of sea state 3 or less.
The relative abundance of cetaceans in the area was very low with only 13
sightings, of three cetacean species, recorded during the 4 weeks of the survey
(table 4). The three cetacean species recorded were harbour porpoise (Phocoena
phocoena), minke whale (Balaenoptera acutorostrata) and Atlantic white-sided
dolphin (Lagenorhynchus acutus) (fig. 18)
All the sightings occurred less than 10km offshore in c30m of water with no
sightings occurring beyond 10km of the coast.
0
5
10
15
20
25
30
35
40
01/0
8/20
04am
01/0
8/20
04pm
03/0
8/20
04am
03/0
8/20
04pm
04/0
8/20
04am
04/0
8/20
04pm
05/0
8/20
04am
05/0
8/20
04pm
06/0
8/20
04am
06/0
8/20
04pm
07/0
8/20
04am
08/0
8/20
04am
09/0
8/20
04am
09/0
8/20
04pm
10/0
8/20
04am
10/0
8/20
04pm
11/0
8/20
04am
11/0
8/20
04pm
12/0
8/20
04am
12/0
8/20
04pm
13/0
8/20
04am
13/0
8/20
04pm
14/0
8/20
04am
16.0
8.20
04am
17.0
8.20
04am
17.0
8.20
04pm
18.0
8.20
04am
18.0
8.20
04pm
19.0
8.20
04am
19.0
8.20
04pm
20.0
8.20
04am
20.0
8.20
04pm
21.0
8.20
04am
21.0
8.20
04pm
22.0
8.20
04am
22.0
8.20
04pm
23.0
8.20
04am
23.0
8.20
04pm
24.0
8.20
04am
24.0
8.20
04pm
25.0
8.20
04am
Date/Time
Sea State (Beaufort 1-10)
Vis (1-4)
Swell (1-3)
Wind Speed (Knots)
Fig. 16. Sea state, visibility, swell conditions and wind speed recorded twice daily during the survey.
IWDG Heritage Council Report 2004 Page 20 26/11/2004
Species Grid Cell
Relative Abundance (Animals per Hour)
Harbour Porpoise (Phocoena phocoena) C 0.06
Minke Whale (Balaenoptera acutorostrata) B 0.03
C 0.03
D 0.15
White-sided Dolphin (Lagenorhynchus acutus) B 0.55
UnID Dolphin Species A 0.82
B 0.94
UnID Cetacean Species C 0.03
Fig. 17. Survey effort at sea state = 3 recorded during Leg 4. Survey effort was recorded for 4 grid
squares (A–D).
Table 4: Relative abundance of cetacean species in survey grid cells A - D. Cetaceans were recorded in
all four survey grid cells.
Fig. 18: Survey effort and cetacean sightings recorded en route to survey location and on site during leg 4.
IWDG Heritage Council Report 2004 Page 21 26/11/2004
3.1.4.3. Birds Recorded
There were many seabirds recorded during the survey with large numbers of
shags (Phalacrocorax aristotelis) in groups of close to 30 birds regularly recorded
near Tór Rocks and Inistrahull. Also regularly recorded from the observation deck,
in decreasing abundance, were gannet (Sula bassana), fulmar (Fulmarus
glacialis), lesser black-backed gull (Larus fuscus), kittiwake (Rissa tridactyla),
storm petrel (Hydrobates pelagicus), great black-backed gull (Larus marinus),
herring gull (Larus argentatus), manx shearwater (Puffinus puffinus), razorbill (Alca
torda), guillemot (Aria aalge), black guillemot (Cepphus grille), puffin (Fratercula
artica), great skua (Stercorarius skua), black-headed gull (Larus ridibundus), rock
dove (Columba livia), swallow (Hirundo rustica) and whimbrel (Numenius
phaeopus).
3.1.4.4. Discussion
The results of this survey corroborate results from prior surveys conducted off the
north-west coast in 2003 and 2004 15,16 which indicate that the ship-based and land
based survey work of the north Irish coastline needs to be conducted, to determine
cetacean relative abundance estimates for all months.
Surveyors: John Meade & Brendan Allen
IWDG Heritage Council Report 2004 Page 22 26/11/2004
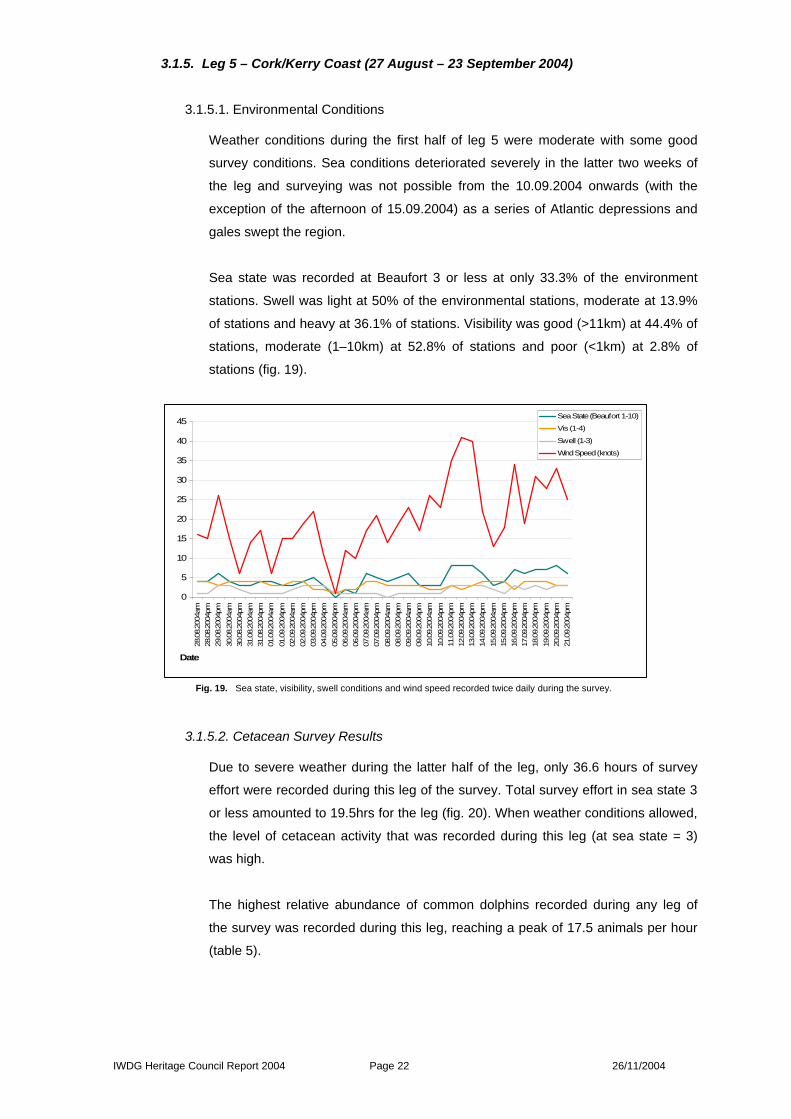
3.1.5. Leg 5 – Cork/Kerry Coast (27 August – 23 September 2004)
3.1.5.1. Environmental Conditions
Weather conditions during the first half of leg 5 were moderate with some good
survey conditions. Sea conditions deteriorated severely in the latter two weeks of
the leg and surveying was not possible from the 10.09.2004 onwards (with the
exception of the afternoon of 15.09.2004) as a series of Atlantic depressions and
gales swept the region.
Sea state was recorded at Beaufort 3 or less at only 33.3% of the environment
stations. Swell was light at 50% of the environmental stations, moderate at 13.9%
of stations and heavy at 36.1% of stations. Visibility was good (>11km) at 44.4% of
stations, moderate (1–10km) at 52.8% of stations and poor (<1km) at 2.8% of
stations (fig. 19).
3.1.5.2. Cetacean Survey Results
Due to severe weather during the latter half of the leg, only 36.6 hours of survey
effort were recorded during this leg of the survey. Total survey effort in sea state 3
or less amounted to 19.5hrs for the leg (fig. 20). When weather conditions allowed,
the level of cetacean activity that was recorded during this leg (at sea state = 3)
was high.
The highest relative abundance of common dolphins recorded during any leg of
the survey was recorded during this leg, reaching a peak of 17.5 animals per hour
(table 5).
0
5
10
15
20
25
30
35
40
45
28.0
8.20
04am
28.0
8.20
04pm
29.0
8.20
04pm
30.0
8.20
04am
30.0
8.20
04pm
31.0
8.20
04am
31.0
8.20
04pm
01.0
9.20
04am
01.0
9.20
04pm
02.0
9.20
04am
02.0
9.20
04pm
03.0
9.20
04pm
04.0
9.20
04pm
05.0
9.20
04pm
06.0
9.20
04am
06.0
9.20
04pm
07.0
9.20
04am
07.0
9.20
04pm
08.0
9.20
04am
08.0
9.20
04pm
09.0
9.20
04am
09.0
9.20
04pm
10.0
9.20
04am
10.0
9.20
04pm
11.0
9.20
04pm
12.0
9.20
04pm
13.0
9.20
04pm
14.0
9.20
04pm
15.0
9.20
04am
15.0
9.20
04pm
16.0
9.20
04pm
17.0
9.20
04pm
18.0
9.20
04pm
19.0
9.20
04pm
20.0
9.20
04pm
21.0
9.20
04pm
Date
Sea State (Beaufort 1-10)
Vis (1-4)
Swell (1-3)
Wind Speed (knots)
Fig. 19. Sea state, visibility, swell conditions and wind speed recorded twice daily during the survey.
IWDG Heritage Council Report 2004 Page 23 26/11/2004
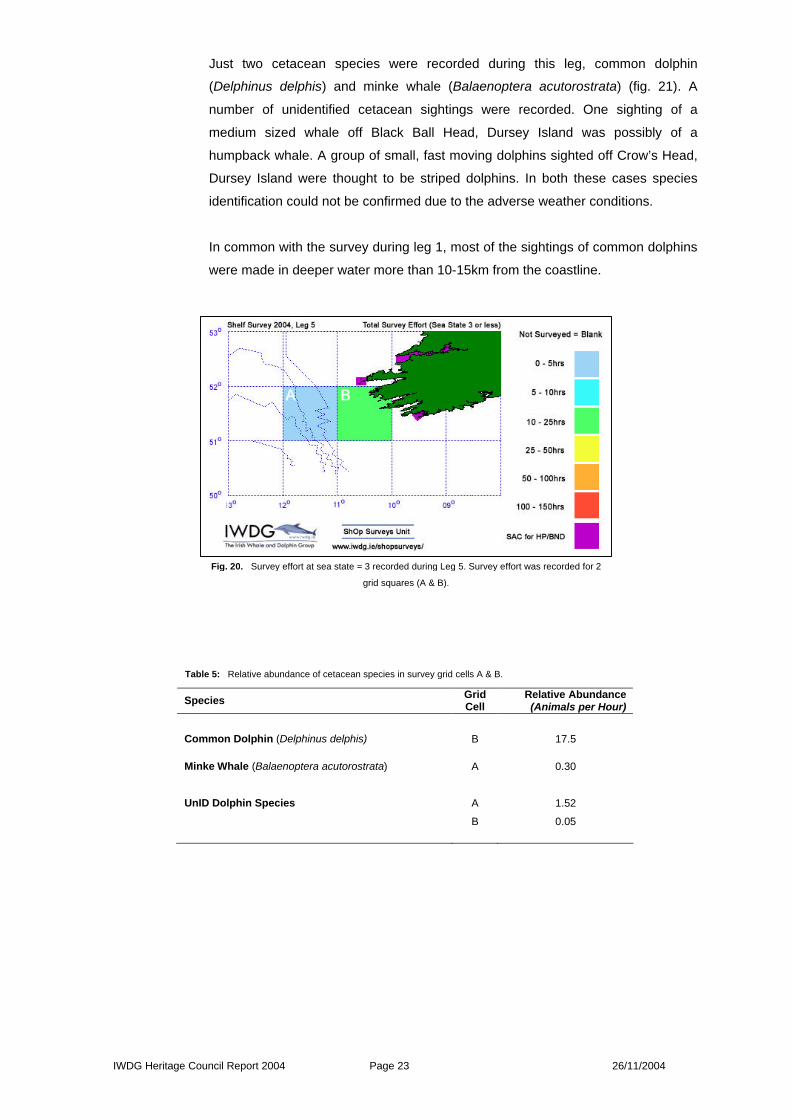
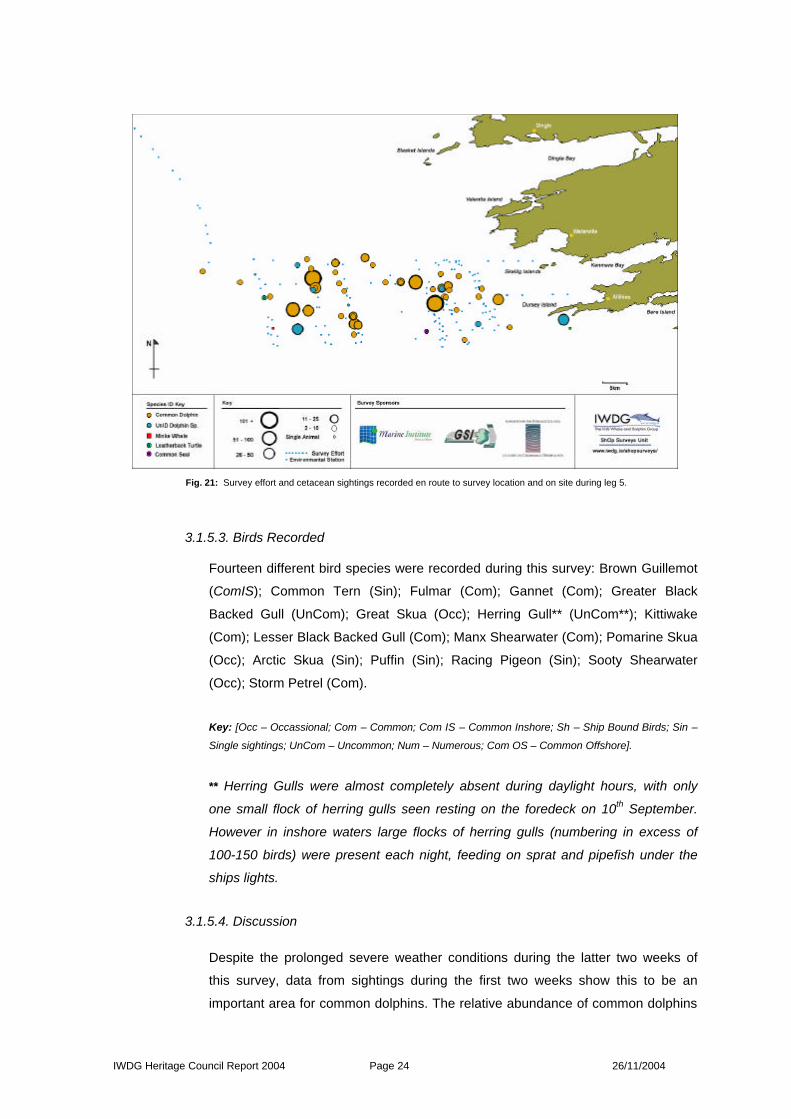
Just two cetacean species were recorded during this leg, common dolphin
(Delphinus delphis) and minke whale (Balaenoptera acutorostrata) (fig. 21). A
number of unidentified cetacean sightings were recorded. One sighting of a
medium sized whale off Black Ball Head, Dursey Island was possibly of a
humpback whale. A group of small, fast moving dolphins sighted off Crow’s Head,
Dursey Island were thought to be striped dolphins. In both these cases species
identification could not be confirmed due to the adverse weather conditions.
In common with the survey during leg 1, most of the sightings of common dolphins
were made in deeper water more than 10-15km from the coastline.
Species Grid Cell
Relative Abundance (Animals per Hour)
Common Dolphin (Delphinus delphis) B 17.5
Minke Whale (Balaenoptera acutorostrata) A 0.30
UnID Dolphin Species A 1.52
B 0.05
Fig. 20. Survey effort at sea state = 3 recorded during Leg 5. Survey effort was recorded for 2
grid squares (A & B).
Table 5: Relative abundance of cetacean species in survey grid cells A & B.
IWDG Heritage Council Report 2004 Page 24 26/11/2004
3.1.5.3. Birds Recorded
Fourteen different bird species were recorded during this survey: Brown Guillemot
(ComIS); Common Tern (Sin); Fulmar (Com); Gannet (Com); Greater Black
Backed Gull (UnCom); Great Skua (Occ); Herring Gull** (UnCom**); Kittiwake
(Com); Lesser Black Backed Gull (Com); Manx Shearwater (Com); Pomarine Skua
(Occ); Arctic Skua (Sin); Puffin (Sin); Racing Pigeon (Sin); Sooty Shearwater
(Occ); Storm Petrel (Com).
Key: [Occ – Occassional; Com – Common; Com IS – Common Inshore; Sh – Ship Bound Birds; Sin –
Single sightings; UnCom – Uncommon; Num – Numerous; Com OS – Common Offshore].
** Herring Gulls were almost completely absent during daylight hours, with only
one small flock of herring gulls seen resting on the foredeck on 10th September.
However in inshore waters large flocks of herring gulls (numbering in excess of
100-150 birds) were present each night, feeding on sprat and pipefish under the
ships lights.
3.1.5.4. Discussion
Despite the prolonged severe weather conditions during the latter two weeks of
this survey, data from sightings during the first two weeks show this to be an
important area for common dolphins. The relative abundance of common dolphins
Fig. 21: Survey effort and cetacean sightings recorded en route to survey location and on site during leg 5.
IWDG Heritage Council Report 2004 Page 25 26/11/2004
recorded in the survey area was the highest recorded during any leg of the 2004
survey. Calves were recorded in many of the larger groups of common dolphins
sighted during the leg indicating that this may be an important breeding area for
this species.
The diversity of cetacean species recorded was low, however a number of
cetaceans were sighted but could not be identified due to poor visibility or rough
weather.
A number of non-cetacean species were sighted during this survey. On 30 August
a large leatherback turtle (Dermochelys coriacea) was sighted within 400m of the
ship, in deep water near to the shelf edge. The animal was actively swimming and
dived soon after being sighted.
On the 13 September a common seal was seen following the ship as it was hove-
to (making 1-2 knots into the weather) in rough seas. The seal followed in the
ships wake for around half an hour.
From the start of the survey a very large number of jellyfish were noted on the
surface. The jellyfish were of the species Vellella vellella or ‘by-the-wind sailor’.
This species floats on the surface with its tentacles hanging down below the water.
It ‘sails’ along in the wind using balloon-like membranes which project above the
water surface. Rafts of the jellyfish varied in density from a few per square meter to
solid rafts covering several square meters in area. The number of individuals must
have numbered many millions but could not be estimated as no boundary to the
rafts was reached. The jellyfish disappeared after easterly gales between the 7
and 9 September. No more were sighted after this time.
One night during the 3rd week of the survey bioluminescence (Notiluca sp.) was
noted in the ships bow waves.
Surveyor: Dave Wall
IWDG Heritage Council Report 2004 Page 26 26/11/2004
3.2. Cetacean Species Distribution and Relative Abundance
3.2.1. Survey Effort
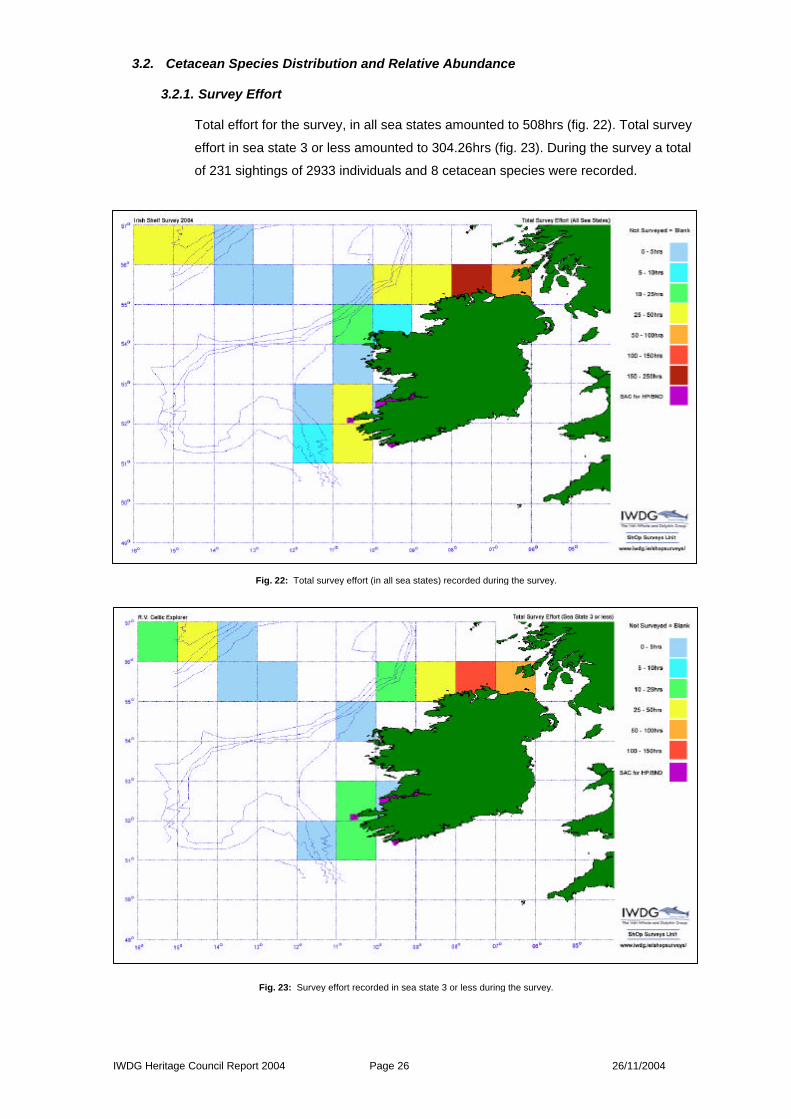
Total effort for the survey, in all sea states amounted to 508hrs (fig. 22). Total survey
effort in sea state 3 or less amounted to 304.26hrs (fig. 23). During the survey a total
of 231 sightings of 2933 individuals and 8 cetacean species were recorded.
Fig. 22: Total survey effort (in all sea states) recorded during the survey.
Fig. 23: Survey effort recorded in sea state 3 or less during the survey.
IWDG Heritage Council Report 2004 Page 27 26/11/2004
3.2.2. Species Distribution and Relative Abundance.
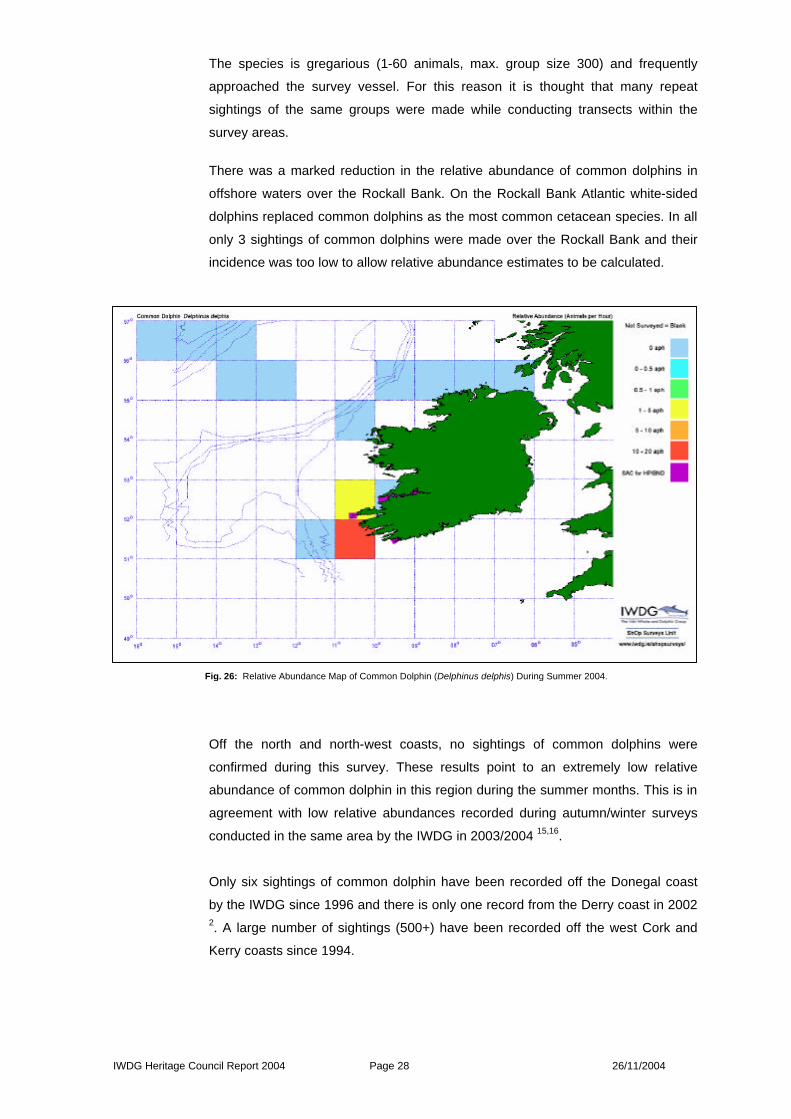
3.2.2.1. Common Dolphin - Delphinus delphis.
Common dolphins occurred most frequently in waters over the Irish shelf. They
tended to occur in waters deeper than 30m with the majority of sightings being
made beyond 10km from the coastline (fig. 25).
In waters over the Irish shelf common dolphins were the most abundant cetacean
species, reaching a maximum relative abundance of 17.5aph off the west
Cork/Kerry coastline (fig. 26). 71 sightings of this species were made during the
survey.
Fig. 25: Distribution of Common Dolphin (Delphinus delphis) sightings recorded during all legs of the survey.
Fig. 24: Common Dolphin (Delphinus delphis)
IWDG Heritage Council Report 2004 Page 28 26/11/2004
The species is gregarious (1-60 animals, max. group size 300) and frequently
approached the survey vessel. For this reason it is thought that many repeat
sightings of the same groups were made while conducting transects within the
survey areas.
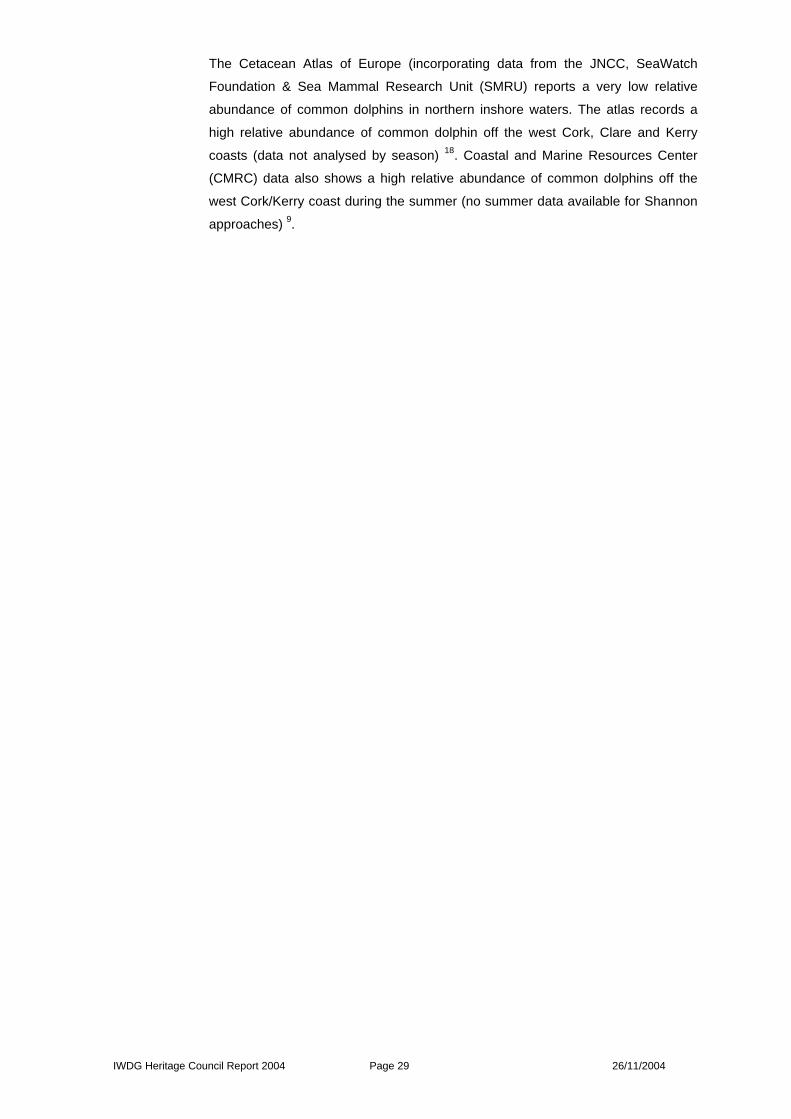
There was a marked reduction in the relative abundance of common dolphins in
offshore waters over the Rockall Bank. On the Rockall Bank Atlantic white-sided
dolphins replaced common dolphins as the most common cetacean species. In all
only 3 sightings of common dolphins were made over the Rockall Bank and their
incidence was too low to allow relative abundance estimates to be calculated.
Off the north and north-west coasts, no sightings of common dolphins were
confirmed during this survey. These results point to an extremely low relative
abundance of common dolphin in this region during the summer months. This is in
agreement with low relative abundances recorded during autumn/winter surveys
conducted in the same area by the IWDG in 2003/2004 15,16.
Only six sightings of common dolphin have been recorded off the Donegal coast
by the IWDG since 1996 and there is only one record from the Derry coast in 2002 2. A large number of sightings (500+) have been recorded off the west Cork and
Kerry coasts since 1994.
Fig. 26: Relative Abundance Map of Common Dolphin (Delphinus delphis) During Summer 2004.
IWDG Heritage Council Report 2004 Page 29 26/11/2004
The Cetacean Atlas of Europe (incorporating data from the JNCC, SeaWatch
Foundation & Sea Mammal Research Unit (SMRU) reports a very low relative
abundance of common dolphins in northern inshore waters. The atlas records a
high relative abundance of common dolphin off the west Cork, Clare and Kerry
coasts (data not analysed by season) 18. Coastal and Marine Resources Center
(CMRC) data also shows a high relative abundance of common dolphins off the
west Cork/Kerry coast during the summer (no summer data available for Shannon
approaches) 9.
IWDG Heritage Council Report 2004 Page 30 26/11/2004
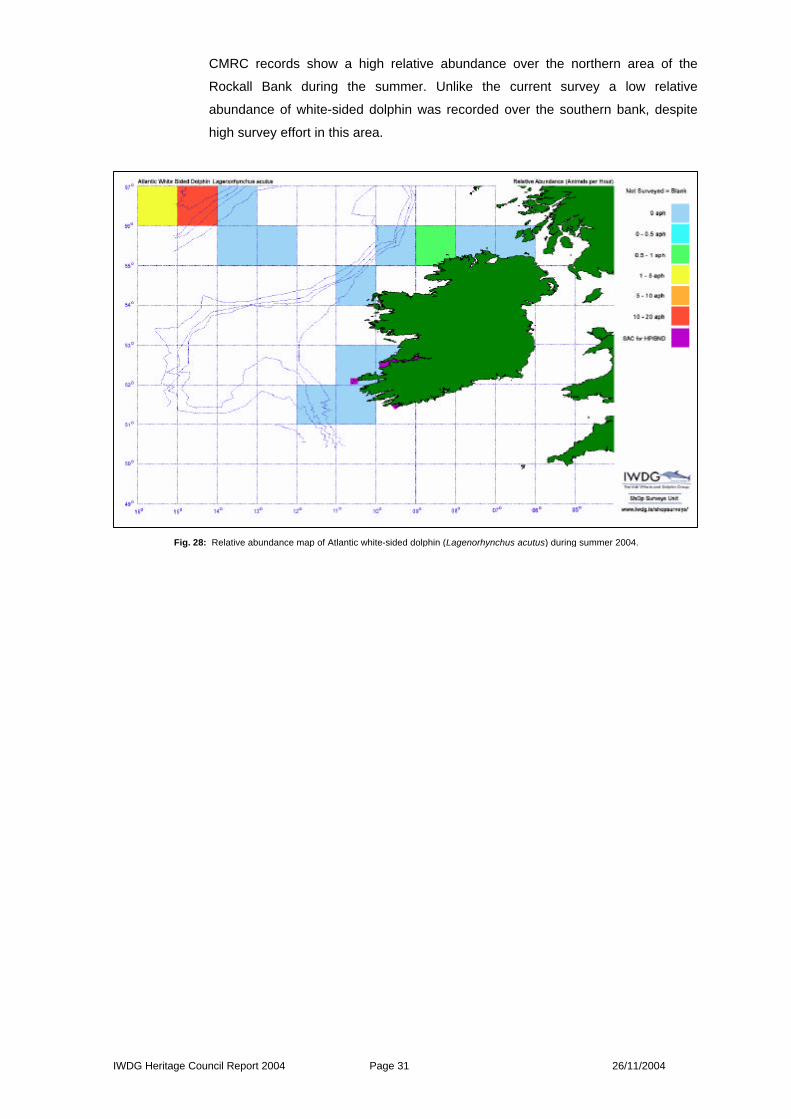
3.2.2.2. Atlantic White-sided Dolphin - Lagenorhynchus acutus.
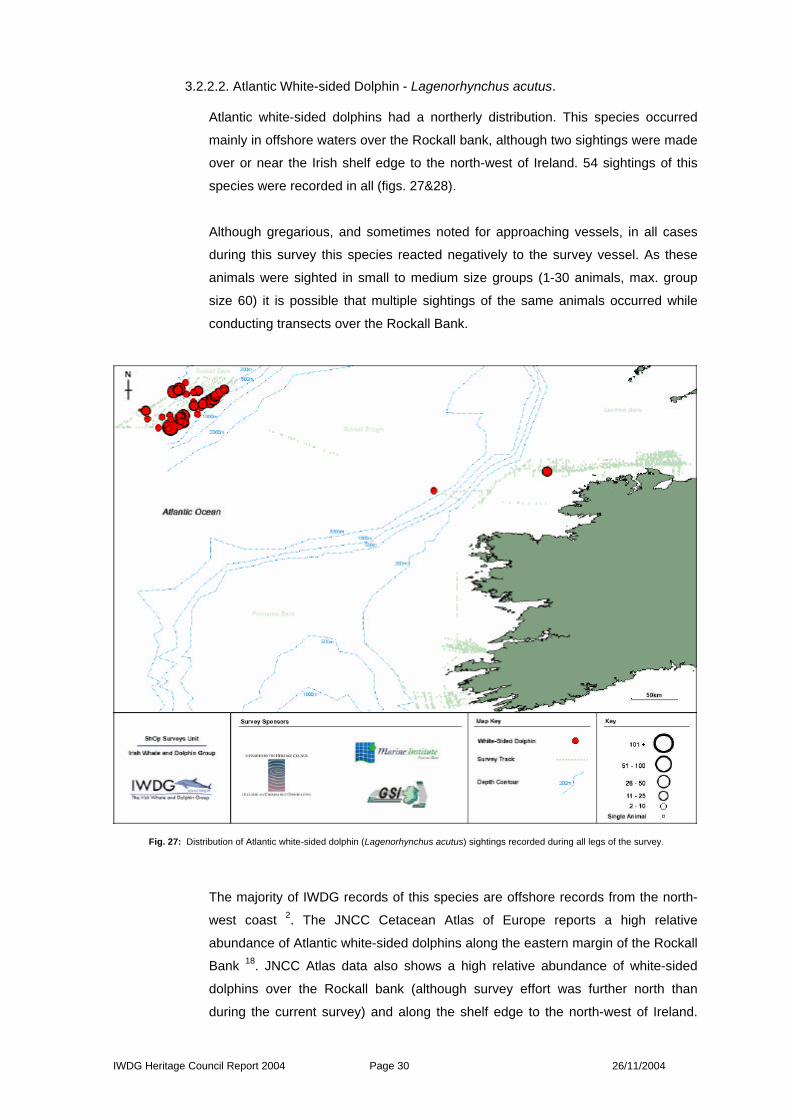
Atlantic white-sided dolphins had a northerly distribution. This species occurred
mainly in offshore waters over the Rockall bank, although two sightings were made
over or near the Irish shelf edge to the north-west of Ireland. 54 sightings of this
species were recorded in all (figs. 27&28).
Although gregarious, and sometimes noted for approaching vessels, in all cases
during this survey this species reacted negatively to the survey vessel. As these
animals were sighted in small to medium size groups (1-30 animals, max. group
size 60) it is possible that multiple sightings of the same animals occurred while
conducting transects over the Rockall Bank.
The majority of IWDG records of this species are offshore records from the north-
west coast 2. The JNCC Cetacean Atlas of Europe reports a high relative
abundance of Atlantic white-sided dolphins along the eastern margin of the Rockall
Bank 18. JNCC Atlas data also shows a high relative abundance of white-sided
dolphins over the Rockall bank (although survey effort was further north than
during the current survey) and along the shelf edge to the north-west of Ireland.
Fig. 27: Distribution of Atlantic white-sided dolphin (Lagenorhynchus acutus) sightings recorded during all legs of the survey.
IWDG Heritage Council Report 2004 Page 31 26/11/2004
CMRC records show a high relative abundance over the northern area of the
Rockall Bank during the summer. Unlike the current survey a low relative
abundance of white-sided dolphin was recorded over the southern bank, despite
high survey effort in this area.
Fig. 28: Relative abundance map of Atlantic white-sided dolphin (Lagenorhynchus acutus) during summer 2004.
IWDG Heritage Council Report 2004 Page 32 26/11/2004
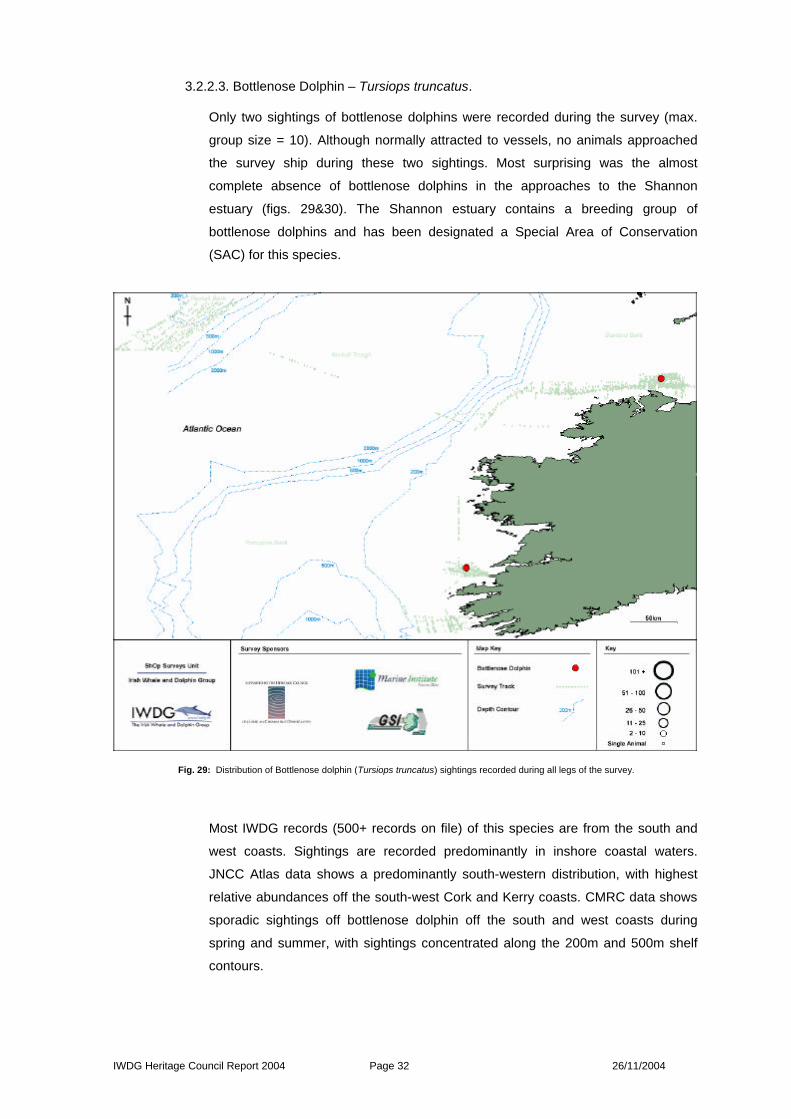
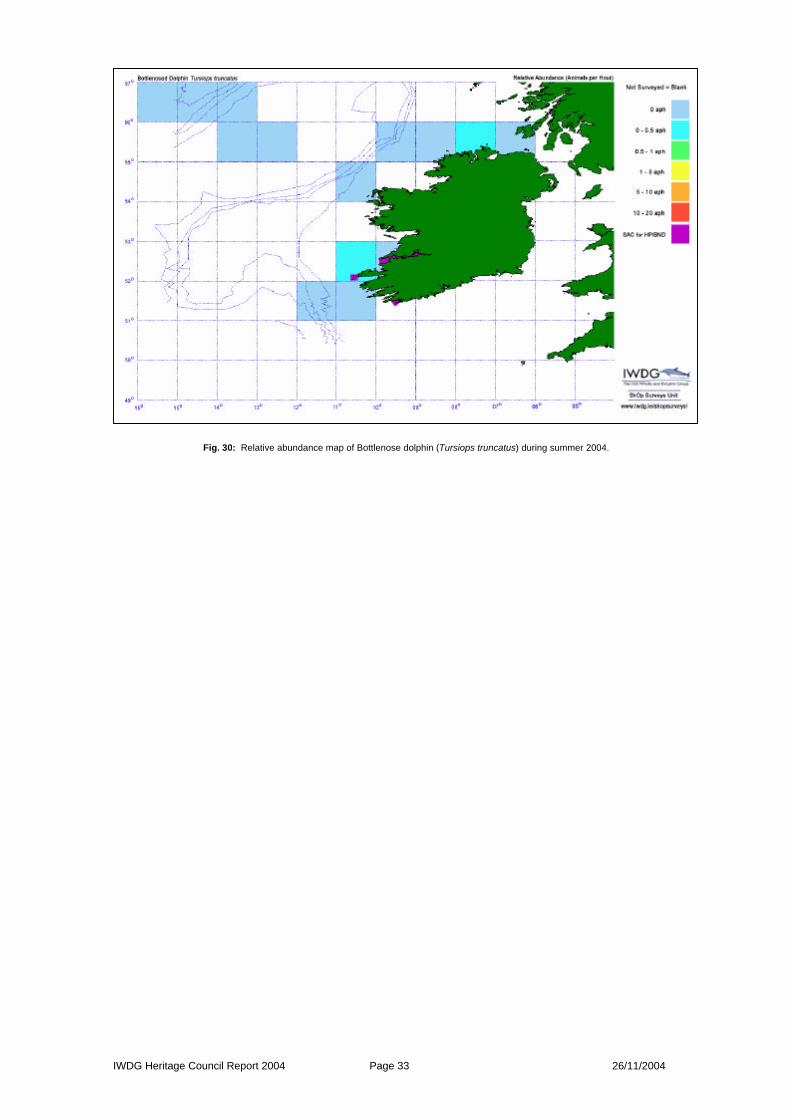
3.2.2.3. Bottlenose Dolphin – Tursiops truncatus.
Only two sightings of bottlenose dolphins were recorded during the survey (max.
group size = 10). Although normally attracted to vessels, no animals approached
the survey ship during these two sightings. Most surprising was the almost
complete absence of bottlenose dolphins in the approaches to the Shannon
estuary (figs. 29&30). The Shannon estuary contains a breeding group of
bottlenose dolphins and has been designated a Special Area of Conservation
(SAC) for this species.
Most IWDG records (500+ records on file) of this species are from the south and
west coasts. Sightings are recorded predominantly in inshore coastal waters.
JNCC Atlas data shows a predominantly south-western distribution, with highest
relative abundances off the south-west Cork and Kerry coasts. CMRC data shows
sporadic sightings off bottlenose dolphin off the south and west coasts during
spring and summer, with sightings concentrated along the 200m and 500m shelf
contours.
Fig. 29: Distribution of Bottlenose dolphin (Tursiops truncatus) sightings recorded during all legs of the survey.
IWDG Heritage Council Report 2004 Page 33 26/11/2004
Fig. 30: Relative abundance map of Bottlenose dolphin (Tursiops truncatus) during summer 2004.
IWDG Heritage Council Report 2004 Page 34 26/11/2004
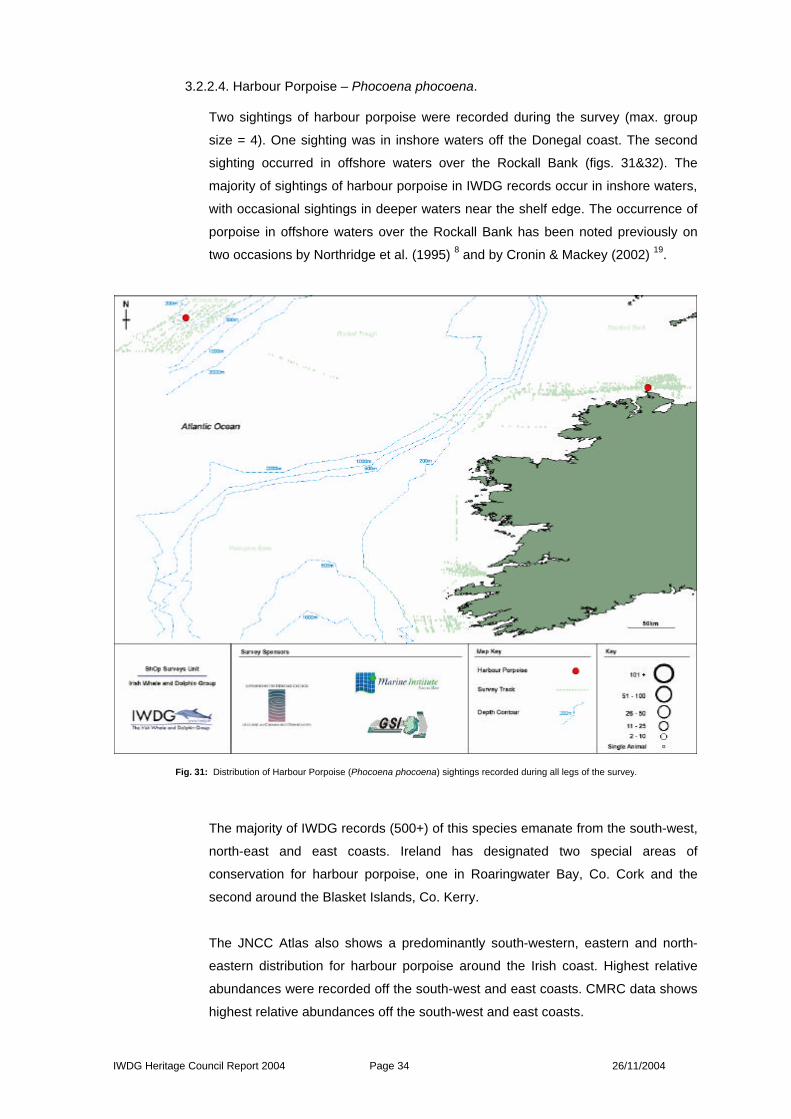
3.2.2.4. Harbour Porpoise – Phocoena phocoena.
Two sightings of harbour porpoise were recorded during the survey (max. group
size = 4). One sighting was in inshore waters off the Donegal coast. The second
sighting occurred in offshore waters over the Rockall Bank (figs. 31&32). The
majority of sightings of harbour porpoise in IWDG records occur in inshore waters,
with occasional sightings in deeper waters near the shelf edge. The occurrence of
porpoise in offshore waters over the Rockall Bank has been noted previously on
two occasions by Northridge et al. (1995) 8 and by Cronin & Mackey (2002) 19.
The majority of IWDG records (500+) of this species emanate from the south-west,
north-east and east coasts. Ireland has designated two special areas of
conservation for harbour porpoise, one in Roaringwater Bay, Co. Cork and the
second around the Blasket Islands, Co. Kerry.
The JNCC Atlas also shows a predominantly south-western, eastern and north-
eastern distribution for harbour porpoise around the Irish coast. Highest relative
abundances were recorded off the south-west and east coasts. CMRC data shows
highest relative abundances off the south-west and east coasts.
Fig. 31: Distribution of Harbour Porpoise (Phocoena phocoena) sightings recorded during all legs of the survey.

IWDG Heritage Council Report 2004 Page 35 26/11/2004
Fig. 32: Relative abundance map of Harbour Porpoise (Phocoena phocoena) during summer 2004.
IWDG Heritage Council Report 2004 Page 36 26/11/2004
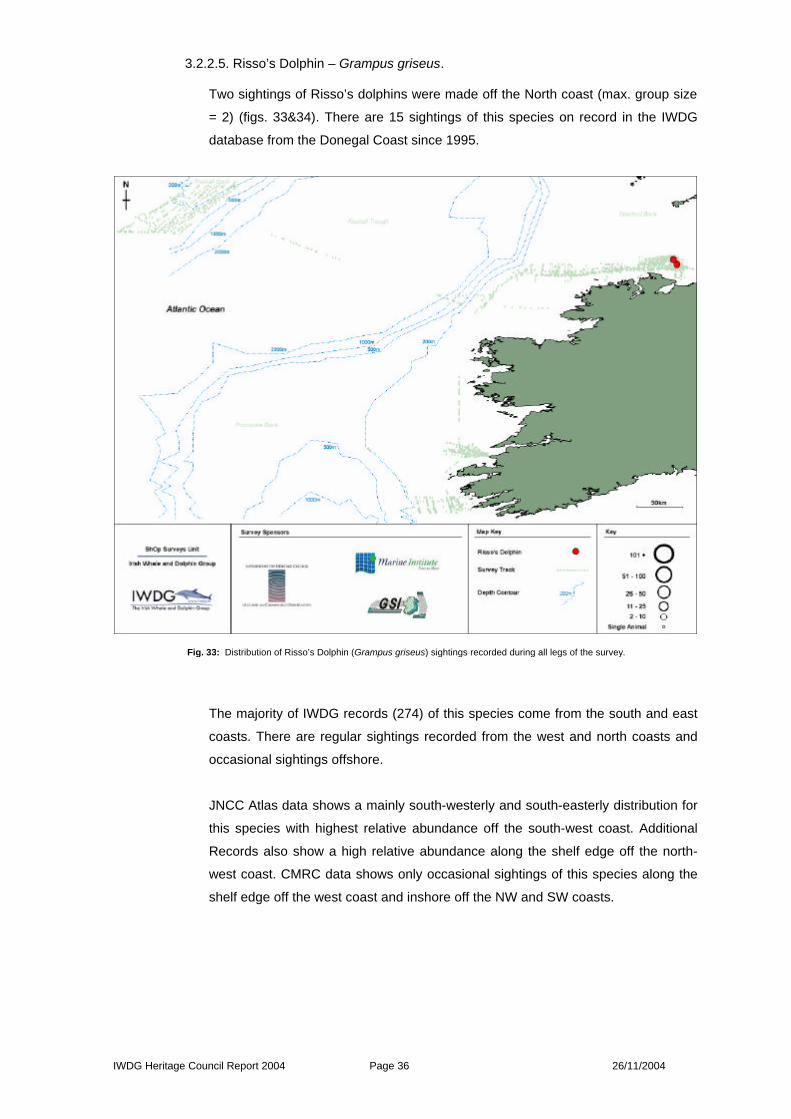
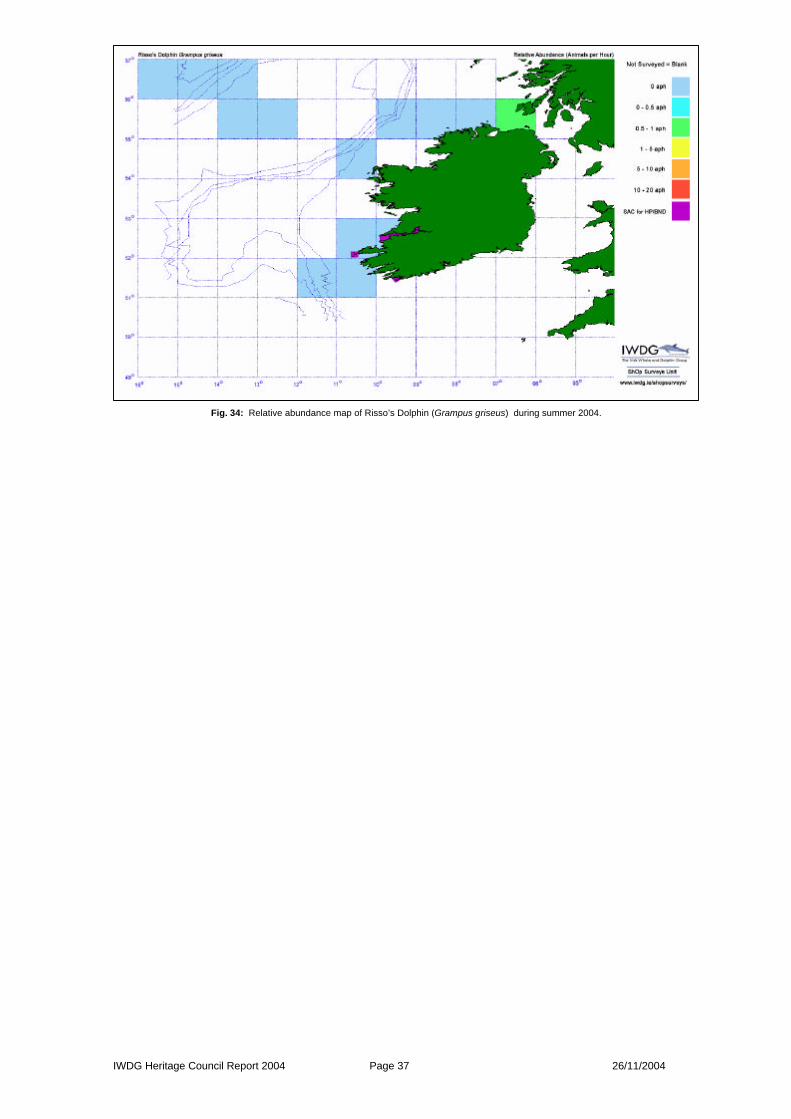
3.2.2.5. Risso’s Dolphin – Grampus griseus.
Two sightings of Risso’s dolphins were made off the North coast (max. group size
= 2) (figs. 33&34). There are 15 sightings of this species on record in the IWDG
database from the Donegal Coast since 1995.
The majority of IWDG records (274) of this species come from the south and east
coasts. There are regular sightings recorded from the west and north coasts and
occasional sightings offshore.
JNCC Atlas data shows a mainly south-westerly and south-easterly distribution for
this species with highest relative abundance off the south-west coast. Additional
Records also show a high relative abundance along the shelf edge off the north-
west coast. CMRC data shows only occasional sightings of this species along the
shelf edge off the west coast and inshore off the NW and SW coasts.
Fig. 33: Distribution of Risso’s Dolphin (Grampus griseus) sightings recorded during all legs of the survey.
IWDG Heritage Council Report 2004 Page 37 26/11/2004
Fig. 34: Relative abundance map of Risso’s Dolphin (Grampus griseus) during summer 2004.
IWDG Heritage Council Report 2004 Page 38 26/11/2004
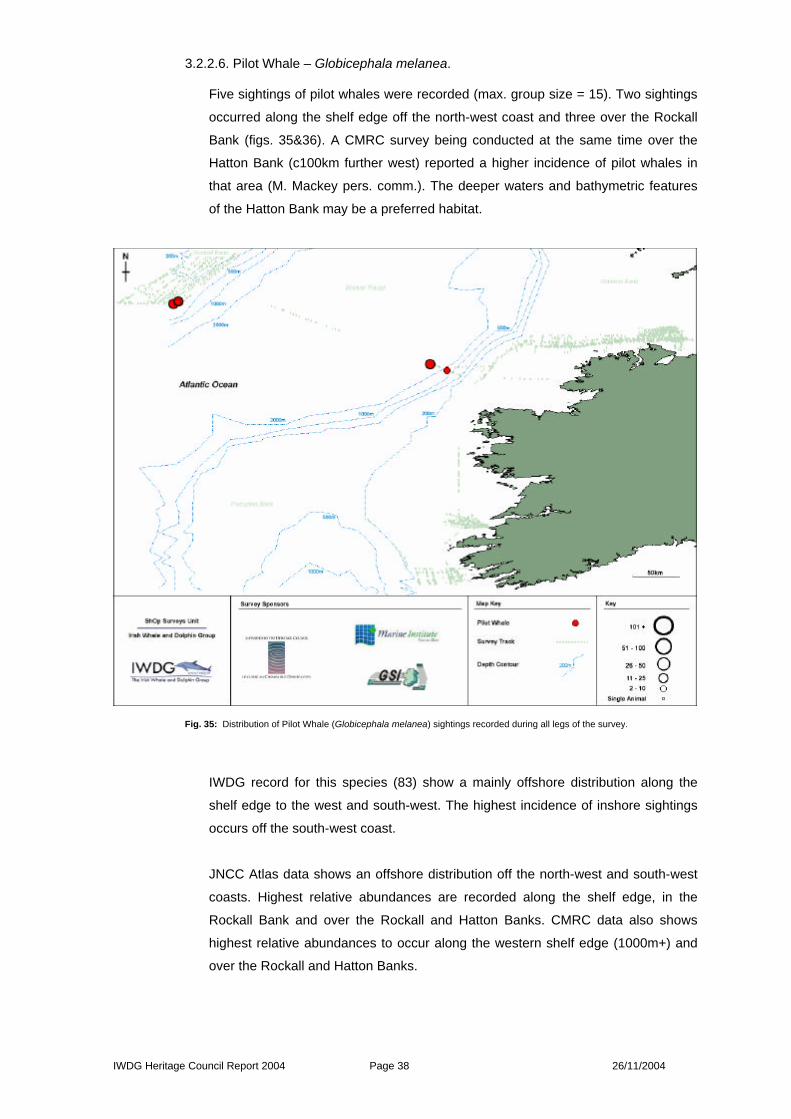
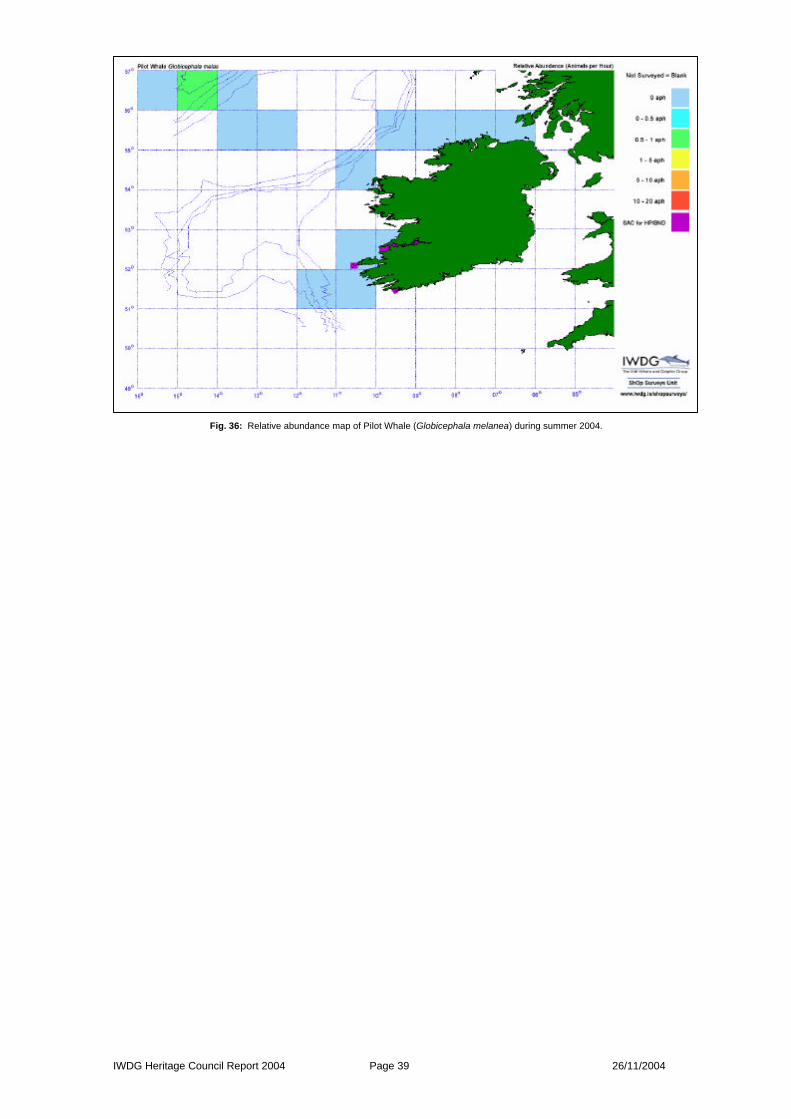
3.2.2.6. Pilot Whale – Globicephala melanea.
Five sightings of pilot whales were recorded (max. group size = 15). Two sightings
occurred along the shelf edge off the north-west coast and three over the Rockall
Bank (figs. 35&36). A CMRC survey being conducted at the same time over the
Hatton Bank (c100km further west) reported a higher incidence of pilot whales in
that area (M. Mackey pers. comm.). The deeper waters and bathymetric features
of the Hatton Bank may be a preferred habitat.
IWDG record for this species (83) show a mainly offshore distribution along the
shelf edge to the west and south-west. The highest incidence of inshore sightings
occurs off the south-west coast.
JNCC Atlas data shows an offshore distribution off the north-west and south-west
coasts. Highest relative abundances are recorded along the shelf edge, in the
Rockall Bank and over the Rockall and Hatton Banks. CMRC data also shows
highest relative abundances to occur along the western shelf edge (1000m+) and
over the Rockall and Hatton Banks.
Fig. 35: Distribution of Pilot Whale (Globicephala melanea) sightings recorded during all legs of the survey.
IWDG Heritage Council Report 2004 Page 39 26/11/2004
Fig. 36: Relative abundance map of Pilot Whale (Globicephala melanea) during summer 2004.
IWDG Heritage Council Report 2004 Page 40 26/11/2004
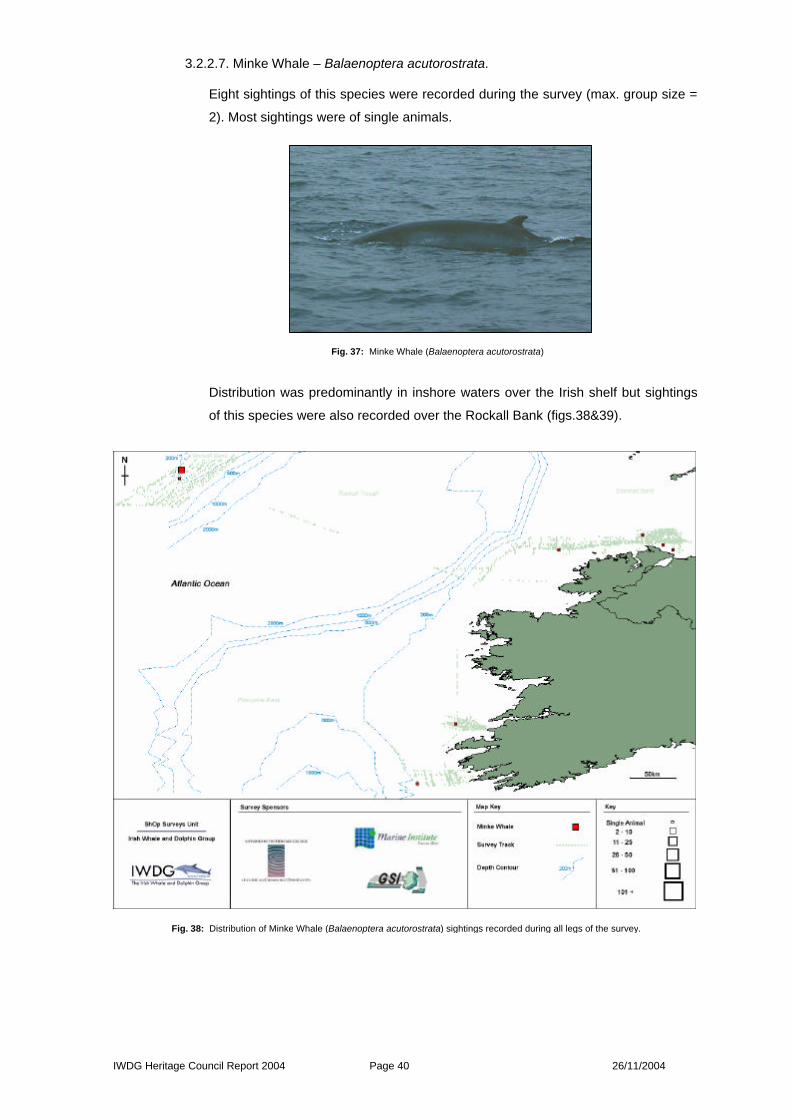
3.2.2.7. Minke Whale – Balaenoptera acutorostrata.
Eight sightings of this species were recorded during the survey (max. group size =
2). Most sightings were of single animals.
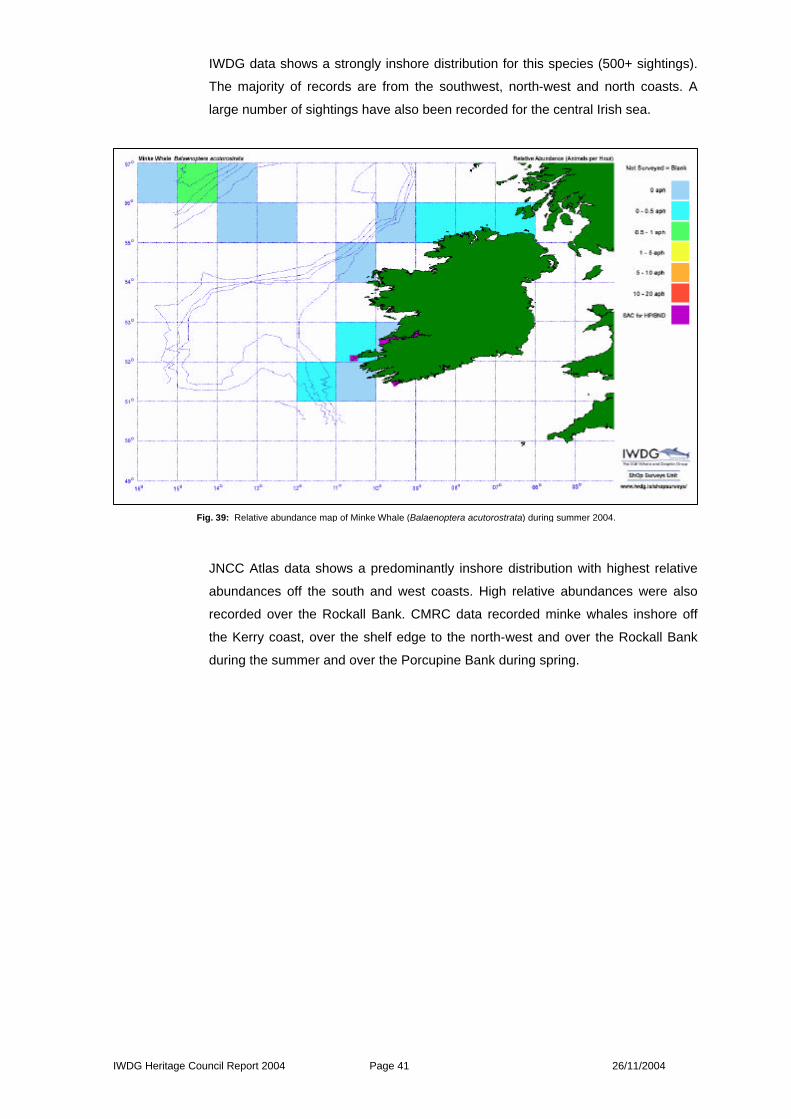
Distribution was predominantly in inshore waters over the Irish shelf but sightings
of this species were also recorded over the Rockall Bank (figs.38&39).
Fig. 38: Distribution of Minke Whale (Balaenoptera acutorostrata) sightings recorded during all legs of the survey.
Fig. 37: Minke Whale (Balaenoptera acutorostrata)
IWDG Heritage Council Report 2004 Page 41 26/11/2004
IWDG data shows a strongly inshore distribution for this species (500+ sightings).
The majority of records are from the southwest, north-west and north coasts. A
large number of sightings have also been recorded for the central Irish sea.
JNCC Atlas data shows a predominantly inshore distribution with highest relative
abundances off the south and west coasts. High relative abundances were also
recorded over the Rockall Bank. CMRC data recorded minke whales inshore off
the Kerry coast, over the shelf edge to the north-west and over the Rockall Bank
during the summer and over the Porcupine Bank during spring.
Fig. 39: Relative abundance map of Minke Whale (Balaenoptera acutorostrata) during summer 2004.
IWDG Heritage Council Report 2004 Page 42 26/11/2004
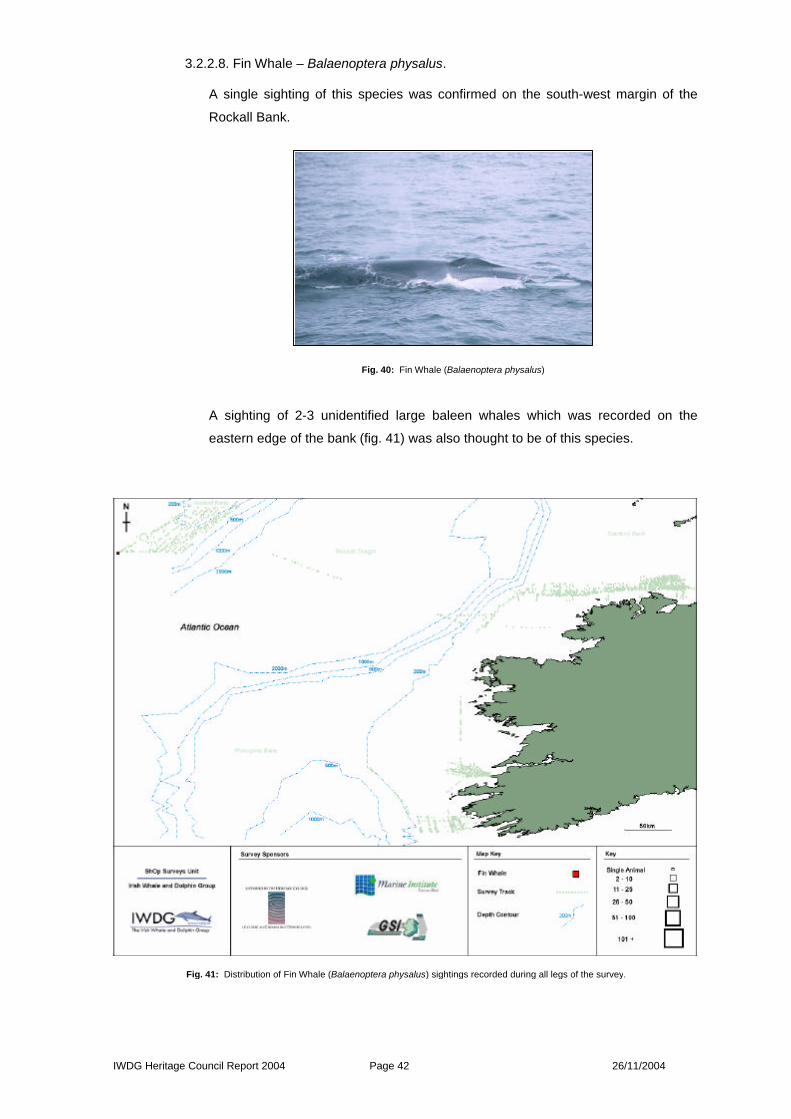
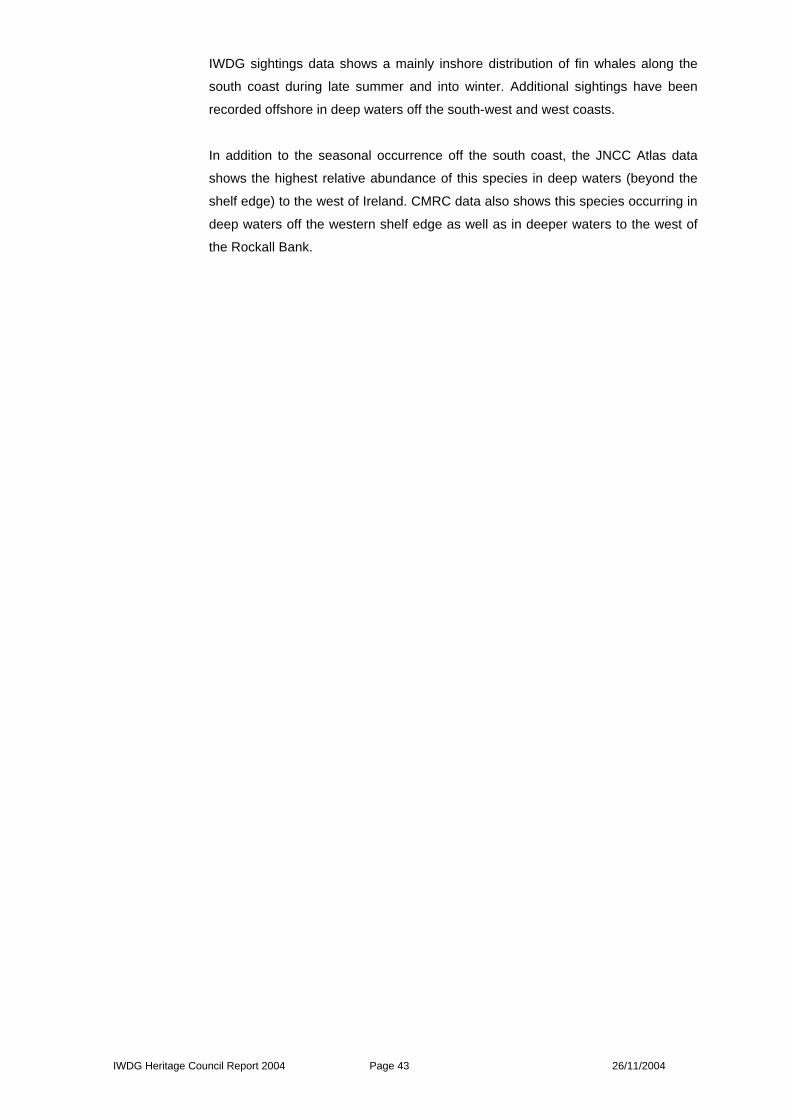
3.2.2.8. Fin Whale – Balaenoptera physalus.
A single sighting of this species was confirmed on the south-west margin of the
Rockall Bank.
A sighting of 2-3 unidentified large baleen whales which was recorded on the
eastern edge of the bank (fig. 41) was also thought to be of this species.
Fig. 41: Distribution of Fin Whale (Balaenoptera physalus) sightings recorded during all legs of the survey.
Fig. 40: Fin Whale (Balaenoptera physalus)
IWDG Heritage Council Report 2004 Page 43 26/11/2004
IWDG sightings data shows a mainly inshore distribution of fin whales along the
south coast during late summer and into winter. Additional sightings have been
recorded offshore in deep waters off the south-west and west coasts.
In addition to the seasonal occurrence off the south coast, the JNCC Atlas data
shows the highest relative abundance of this species in deep waters (beyond the
shelf edge) to the west of Ireland. CMRC data also shows this species occurring in
deep waters off the western shelf edge as well as in deeper waters to the west of
the Rockall Bank.
IWDG Heritage Council Report 2004 Page 44 26/11/2004
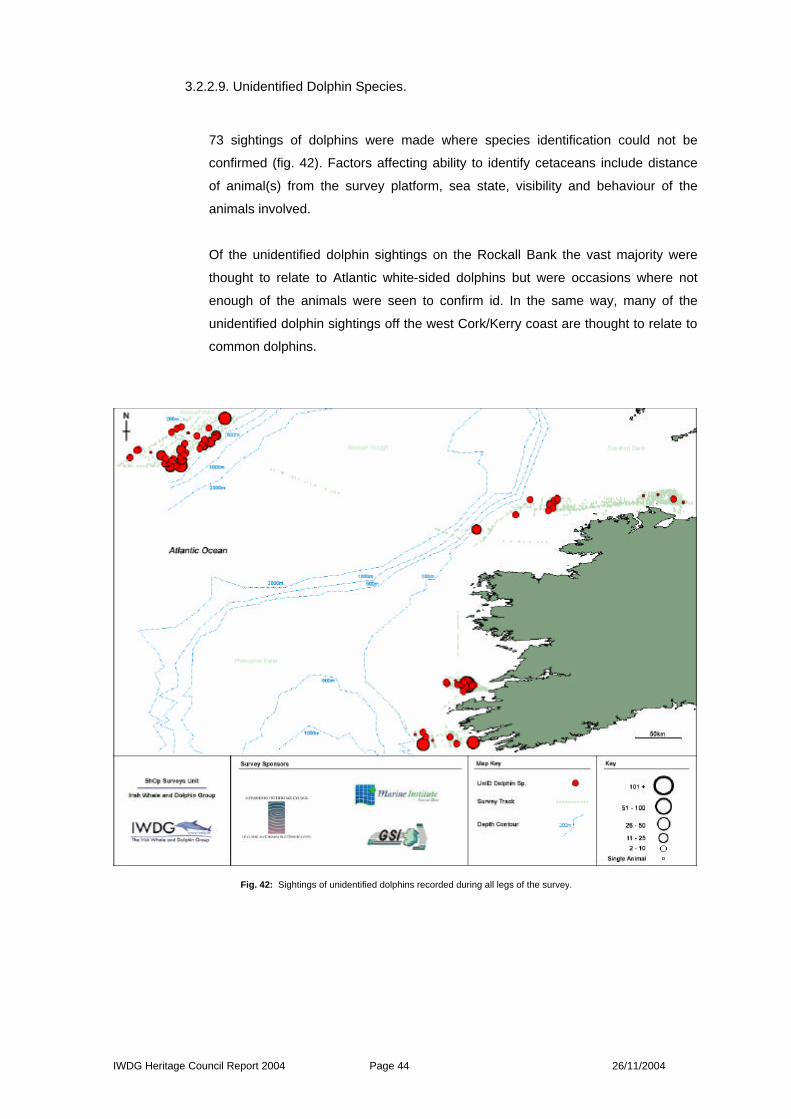
3.2.2.9. Unidentified Dolphin Species.
73 sightings of dolphins were made where species identification could not be
confirmed (fig. 42). Factors affecting ability to identify cetaceans include distance
of animal(s) from the survey platform, sea state, visibility and behaviour of the
animals involved.
Of the unidentified dolphin sightings on the Rockall Bank the vast majority were
thought to relate to Atlantic white-sided dolphins but were occasions where not
enough of the animals were seen to confirm id. In the same way, many of the
unidentified dolphin sightings off the west Cork/Kerry coast are thought to relate to
common dolphins.
Fig. 42: Sightings of unidentified dolphins recorded during all legs of the survey.
IWDG Heritage Council Report 2004 Page 45 26/11/2004
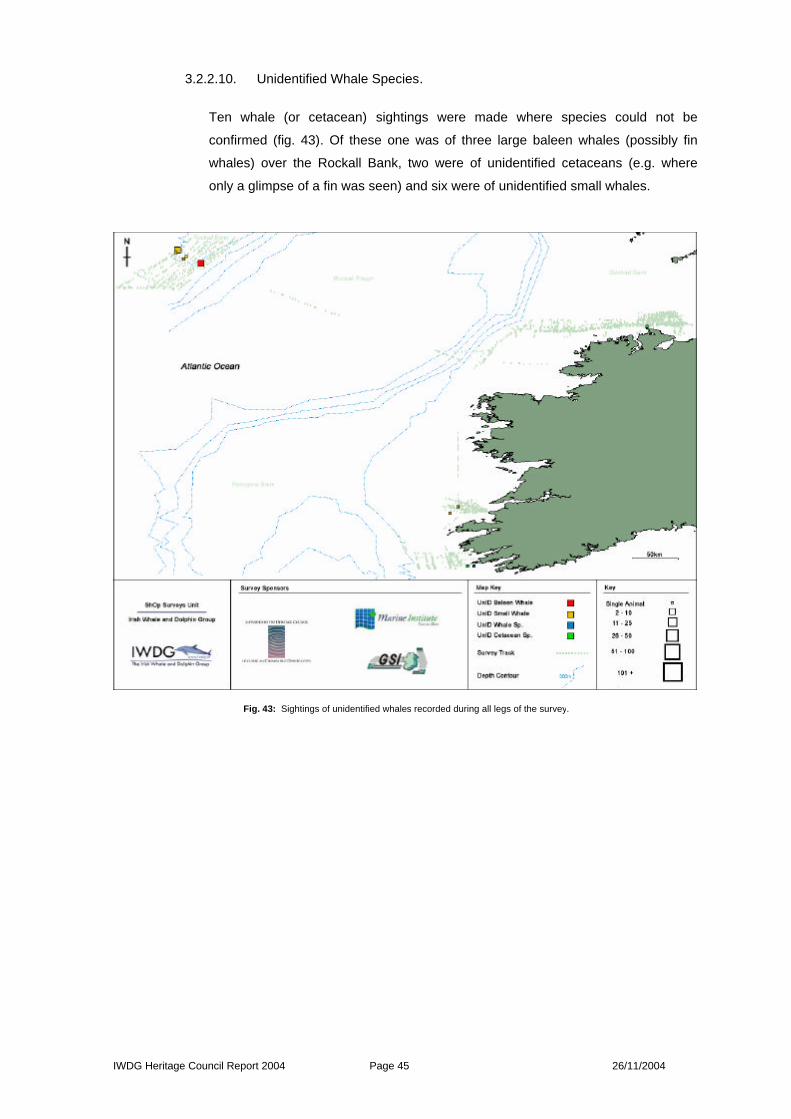
3.2.2.10. Unidentified Whale Species.
Ten whale (or cetacean) sightings were made where species could not be
confirmed (fig. 43). Of these one was of three large baleen whales (possibly fin
whales) over the Rockall Bank, two were of unidentified cetaceans (e.g. where
only a glimpse of a fin was seen) and six were of unidentified small whales.
Fig. 43: Sightings of unidentified whales recorded during all legs of the survey.
IWDG Heritage Council Report 2004 Page 46 26/11/2004
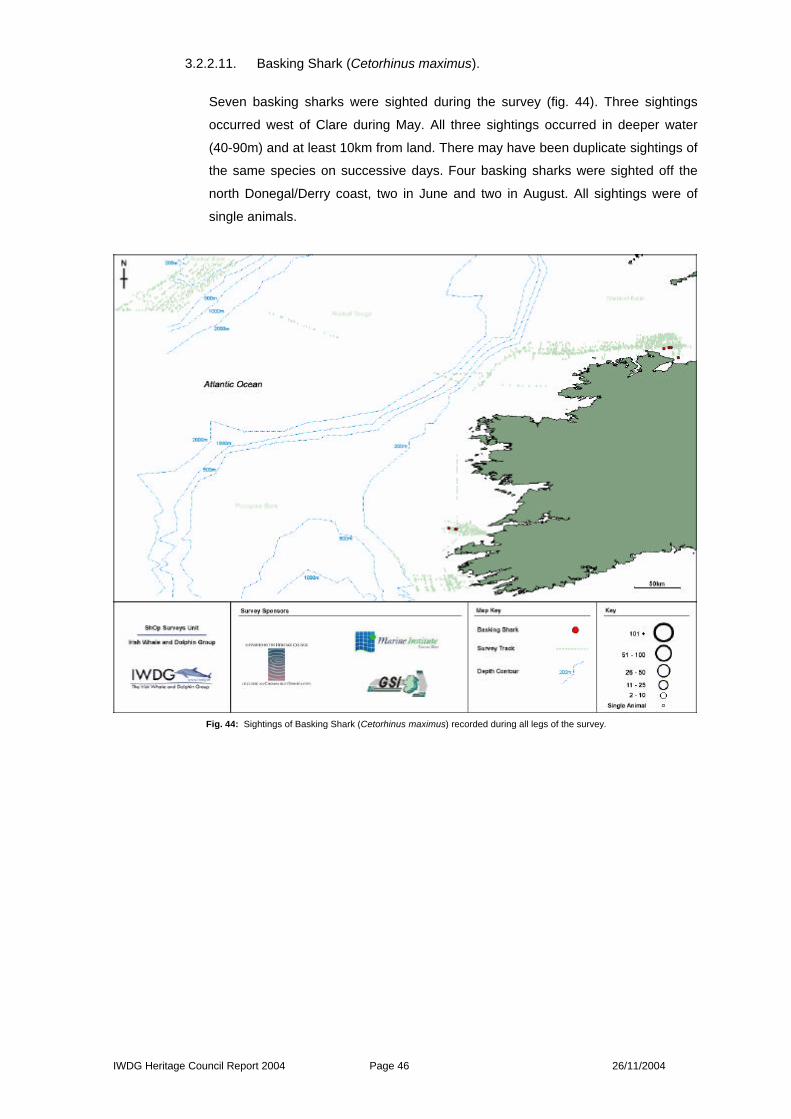
3.2.2.11. Basking Shark (Cetorhinus maximus).
Seven basking sharks were sighted during the survey (fig. 44). Three sightings
occurred west of Clare during May. All three sightings occurred in deeper water
(40-90m) and at least 10km from land. There may have been duplicate sightings of
the same species on successive days. Four basking sharks were sighted off the
north Donegal/Derry coast, two in June and two in August. All sightings were of
single animals.
Fig. 44: Sightings of Basking Shark (Cetorhinus maximus) recorded during all legs of the survey.
IWDG Heritage Council Report 2004 Page 47 26/11/2004
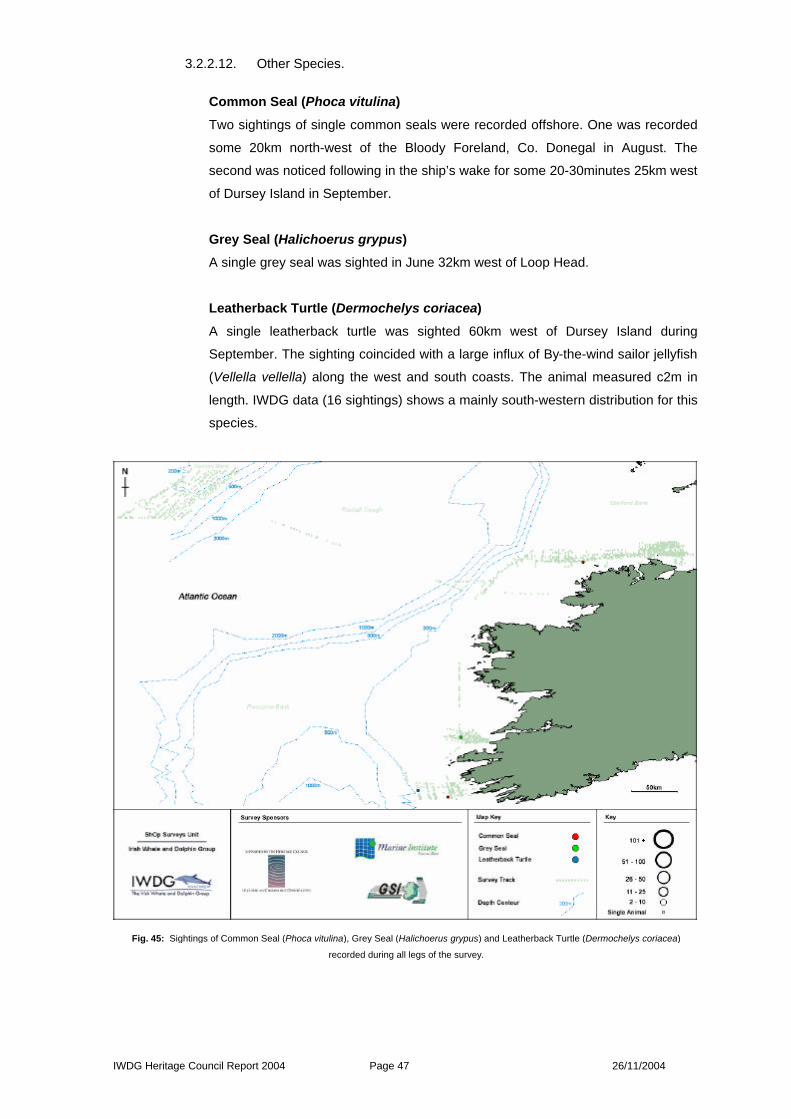
3.2.2.12. Other Species.
Common Seal (Phoca vitulina)
Two sightings of single common seals were recorded offshore. One was recorded
some 20km north-west of the Bloody Foreland, Co. Donegal in August. The
second was noticed following in the ship’s wake for some 20-30minutes 25km west
of Dursey Island in September.
Grey Seal (Halichoerus grypus)
A single grey seal was sighted in June 32km west of Loop Head.
Leatherback Turtle (Dermochelys coriacea)
A single leatherback turtle was sighted 60km west of Dursey Island during
September. The sighting coincided with a large influx of By-the-wind sailor jellyfish
(Vellella vellella) along the west and south coasts. The animal measured c2m in
length. IWDG data (16 sightings) shows a mainly south-western distribution for this
species.
Fig. 45: Sightings of Common Seal (Phoca vitulina), Grey Seal (Halichoerus grypus) and Leatherback Turtle (Dermochelys coriacea)
recorded during all legs of the survey.
IWDG Heritage Council Report 2004 Page 48 26/11/2004
4. Conclusions
Ships of Opportunity (ShOps) provide a useful, cost effective and practical method of
monitoring cetacean relative abundance and distribution. Due to the nature of the acoustic
mapping being conducted on board the R.V. Celtic Explorer during this survey, large amounts
of cetacean survey effort were focused in relatively small geographical areas. This resulted in a
trade off of larger survey area against obtaining a better picture of cetacean activity within the
areas surveyed.
The results of this survey show that cetacean relative abundance and species distribution can
vary significantly across even relatively short geographic distances. The major findings of this
survey were:
1. The most common cetacean species over the Irish shelf along the Clare and west
Cork/Kerry coasts was the common dolphin, reaching a peak relative abundance of
17.5aph off the Cork/Kerry coast. In both survey areas common dolphins were
primarily encountered in deeper waters (40m+) and more than 10km from the shore.
2. Atlantic white-sided dolphins were the most common cetacean species over the
southern end of the Rockall Bank, reaching a relative abundance of 14.5aph. The
relative abundance of common dolphins over the Rockall Bank was very low.
3. Despite the highest survey effort being focused on the north Donegal coast, cetacean
relative abundance in this region was very low. Similar results were noted during
surveys conducted by the IWDG in Autumn/Winter 2003/2004.
Surveys of distribution and relative abundance, conducted on board ships of opportunity,
provide the most cost effective and practical method of monitoring cetacean population in
Ireland’s offshore habitats. Survey effort to date has been focused on the summer months,
when weather is finest and many scientific and seismic surveys are conducted. It is evident
from inshore IWDG sightings data 2 that significant temporal variations in both the distribution
and relative abundance of many cetacean species occur.
More effort is required to survey more offshore marine habitats for cetacean distribution and
relative abundance. Year-round monitoring is all required in all areas to record seasonal trends
in cetacean distribution and relative abundance. As cetacean monitoring in offshore habitats is
both difficult and relatively expensive work, it is desirable that all distribution and relative
abundance data (collected during public or privately funded surveys in Irish waters) is made
available to researchers and conservation managers in a comparable format. This may take
the form of a central Irish database or through the publication of periodic joint reports involving
all groups conducting such research in Irish waters.
IWDG Heritage Council Report 2004 Page 49 26/11/2004
5. Acknowledgements
This project was sponsored by a grant under the Heritage Council Wildlife Grants scheme
(Grant No.13552). Thanks to the Geological Survey of Ireland for their cooperation and
support. Thanks to the Marine Institute for facilitating this survey and technical support. To the
captains, crews, party chiefs and fellow researchers of the R.V. Celtic Explorer for the help and
interest shown during these surveys. Finally to Fiona Fitzpatrick of the Marine Institute for her
support and organisational skills in facilitating and looking after both surveys and surveyors.
IWDG Heritage Council Report 2004 Page 50 26/11/2004
6. References
1. IWDG (2004). Online Cetacean Strandings Database. http://www.iwdg.ie/strandings/
2. IWDG (2004). Online Cetacean Sightings Database. http://www.iwdg.ie/iscope/
3. ARC (2004). Cetacean Monitoring in North-west European Waters. ARC Report No. 1
4. Evans, P.G.H. (1981) NE Atlantic summer 1980 whale & seabird cruise. Mammal
Society. London.
5. Hammond, P.S., Benke, H., Berggren, P., Borchers, D.L., Buckland, S.T., Collet, A.,
Heide-Jørgensen, M.P., Heimlich-Boran, S., Hiby, A.R., Leopold, M.F. and Øien , N.
(1995). Distribution and abundance of the Harbour porpoise and other small cetaceans in
the North sea and adjacent waters. LIFE 92-2/UK/027.
6. Ingram, S. Englund, A. and Rogan, E. (2001). An extensive survey of bottlenose
dolphins (Tursiops truncatus) on the west coast of Ireland. Report to the Heritage Council,
WLD/2001/42.
7. Leopold, M.F., Wolf, P.A. and Van de Meer, J. (1992). The elusive harbour porpoise
exposed: strip transect counts off southwestern Ireland. Netherlands Journal of Sea
Research 29, pp. 395-402.
8. Northridge, S., Tasker, M.L., Webb, A. and Williams, J.M. (1995). Distribution and
relative abundance of harbour porpoises (Phocoena phocoena L.), white-beaked dolphins
(Lagenorhynchus albirostris Gray), and minke whale (Balaenoptera acutorostrata
Lacepède) around the British Isles. ICES Journal of Marine Science 52, pp. 55-66.
9. Ó Cadhla, O., Mackey, M., Aguilar de Soto, N., Rogan, E. & Connolly, N. (2004).
Cetaceans and Seabirds of Ireland’s Atlantic Margin. Volume II – Cetacean distribution and
abundance. Report on research carried out under the Irish Infrastructure Programme
(PIP): Rockall Studies Group (RSG) projects 98/6 and 00/13, Porcupine Studies Group
project P00/15 and Offshore Support Group (OSG) project 99/38. 89pp.
10. Pollock, C., Reid, J.B., Webb, A. and Tasker, M.L. (1997). The distribution of seabirds
and cetaceans in the waters around Ireland. JNCC Report, No. 267.
11. Gordon, J., Berrow, S.D., Rogan, E. & Fennelly, S. (1999). Acoustic and visual survey
of cetaceans off the Mullet peninsula, Co. Mayo. Irish Naturalist Journal, 26, 251-259.
IWDG Heritage Council Report 2004 Page 51 26/11/2004
12. R.A. Charif & C.W. Clark (2000). Acoustic monitoring of large whales off north and west
Britain and Ireland: a two year study, October 1996 – September 1998. JNCC Report 313.
13. Chariff, R.A., Clapham, P.J. & Clark, C.W. (2001). Accoustic detection of singing
humpback whales in deep waters off the British Isles. Mar. Mamm. Sci., 17(4), 751-768.
14. Aguilar de Soto, N., Rogan, E., Ó Cadhla, O., Gordon, J.C.D., Mackey, M. &
Connolloy, N. (2004). Cetaceans and Seabirds of Ireland’s Atlantic Margin. Volume III –
Acoustic Surveys for Cetaceans. Report on research carried out under the Irish
Infrastructure Programme (PIP): Rockall Studies Group (RSG) projects 98/6 and 00/13,
Porcupine Studies Group project P00/15 and Offshore Support Group (OSG) project 99/38.
51pp.
15. IWDG (2003). Cetacean Distribution & Relative Abundance Survey during Ground fish
Survey 2003. http://www.iwdg.ie/downloads/CelticExplorerReport2003.PDF
16. IWDG (2004). Cetacean Distribution and Relative Abundance Survey during Herring
Acoustic Survey 2004. http://www.iwdg.ie/downloads/CelticExplorerReport2004.PDF
17. IWDG (2004). Cetacean Distribution and Relative Abundance Survey during Blue Whiting
Survey 2004. http://www.iwdg.ie/downloads/CelticExplorerReport2004b.PDF
18. Reid, J.B., Evans, P.G.H. & Northridge, S.P. (2003) Atlas of Cetacean Distribution in
north-west European Waters. Joint Nature Conservation Committee, Peterborough.
19. Cronin, M. & Mackey, M. (2002). Cetaceans and seabirds in waters over the Hatton-
Rockall region. Cruise report to the GSI: http://www.gsiseabed.ie/petrov02report.pdf
20. Government of Ireland (1976). Wildlife Act, 1976. Government Publications Office,
Molesworth St., Dublin 2.
21. Government of Ireland (2000). Wildlife (Amendment) Bill, 1999. Government Publications
Office, Molesworth St.
22. European Commission (1992). Council directive on the conservation of natural habitats
and of wild fauna and flora. Council Directive 92/43/EEC
23. IFAW (2000). IFAW automatic data logging program: Logger 2000.
http://www.ifaw.org/ifaw/general/default.aspx?oid=25653
IWDG Heritage Council Report 2004 Page 52 26/11/2004
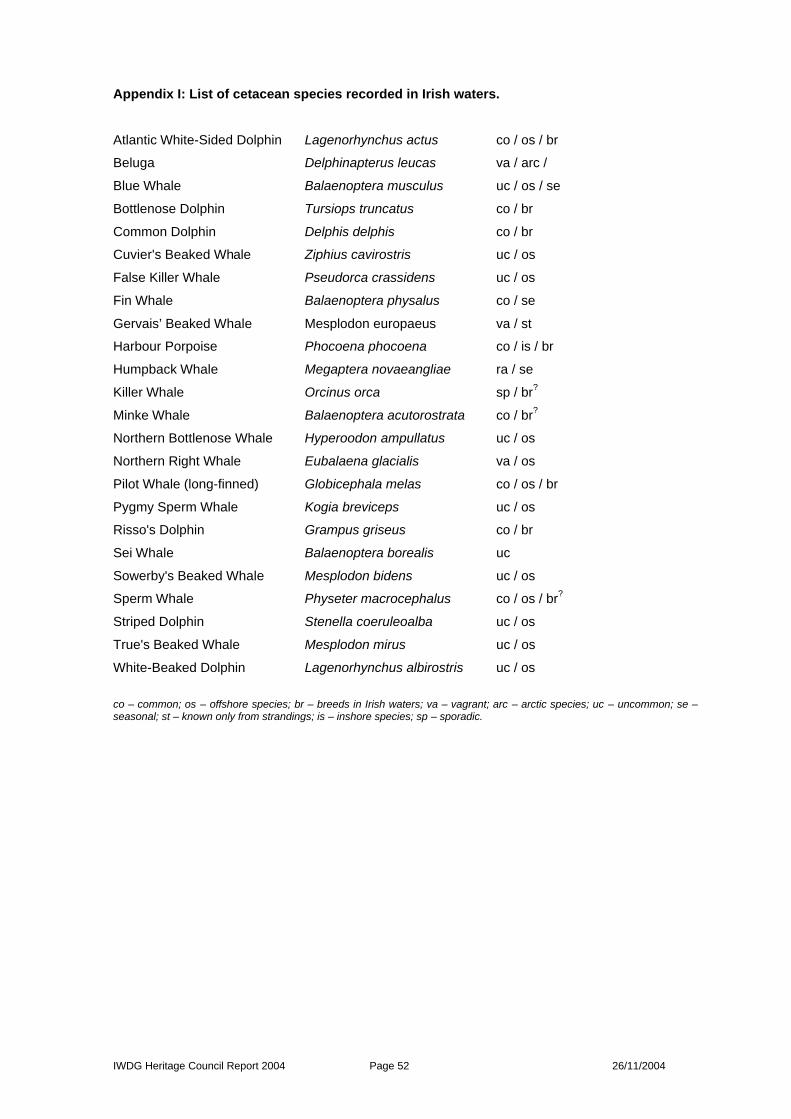
Appendix I: List of cetacean species recorded in Irish waters. Atlantic White-Sided Dolphin Lagenorhynchus actus co / os / br
Beluga Delphinapterus leucas va / arc /
Blue Whale Balaenoptera musculus uc / os / se
Bottlenose Dolphin Tursiops truncatus co / br
Common Dolphin Delphis delphis co / br
Cuvier's Beaked Whale Ziphius cavirostris uc / os
False Killer Whale Pseudorca crassidens uc / os
Fin Whale Balaenoptera physalus co / se
Gervais’ Beaked Whale Mesplodon europaeus va / st
Harbour Porpoise Phocoena phocoena co / is / br
Humpback Whale Megaptera novaeangliae ra / se
Killer Whale Orcinus orca sp / br?
Minke Whale Balaenoptera acutorostrata co / br?
Northern Bottlenose Whale Hyperoodon ampullatus uc / os
Northern Right Whale Eubalaena glacialis va / os
Pilot Whale (long-finned) Globicephala melas co / os / br
Pygmy Sperm Whale Kogia breviceps uc / os
Risso's Dolphin Grampus griseus co / br
Sei Whale Balaenoptera borealis uc
Sowerby's Beaked Whale Mesplodon bidens uc / os
Sperm Whale Physeter macrocephalus co / os / br?
Striped Dolphin Stenella coeruleoalba uc / os
True's Beaked Whale Mesplodon mirus uc / os
White-Beaked Dolphin Lagenorhynchus albirostris uc / os
co – common; os – offshore species; br – breeds in Irish waters; va – vagrant; arc – arctic species; uc – uncommon; se – seasonal; st – known only from strandings; is – inshore species; sp – sporadic.
IWDG Heritage Council Report 2004 Page 53 26/11/2004
Appendix II: Daily Wind Speed and Directions Recorded During Each Leg of the Survey
Leg 1: Wind direction recorded twice daily during the survey.
Date Time Wind Dir. 21.05.2004 am W pm W 22.05.2004 am W pm W 23.05.2004 am S pm S 24.05.2004 am NW pm W 25.05.2004 am NW pm W 26.05.2004 am NE pm W 27.05.2004 am N pm NE 28.05.2004 am E pm E 30.05.2004 am SE pm E 31.05.2004 am N pm S 01.05.2004 am SW pm SW
Leg 2: Wind direction recorded twice daily during the survey.
Date Time Wind Dir.
04.06.2004 pm SW
05.06.2004 am W
pm W
06.06.2004 am NW
pm NW
07.06.2004 am NW
pm NW
08.06.2004 am W
pm W
09.06.2004 am W
pm W
10.06.2004 am SW
pm SW
11.06.2004 am W
pm W
12.06.2004 am W
pm W
13.06.2004 am W
pm W
14.06.2004 am W
pm W
15.06.2004 am NW
pm W
16.06.2004 am W
pm NW
17.06.2004 am W
pm W
IWDG Heritage Council Report 2004 Page 54 26/11/2004
18.06.2004 am NW
pm N
19.06.2004 am NW
pm NW
20.06.2004 am N
pm NW
21.06.2004 am N
pm N
22.06.2004 am E
pm E
24.06.2004 am NW
pm NW
25.06.2004 am NW
pm NW
26.06.2004 am SE
pm SE
27.06.2004 am SW
pm SW
28.06.2004 am SW
pm SW
29.06.2004 am S
pm S
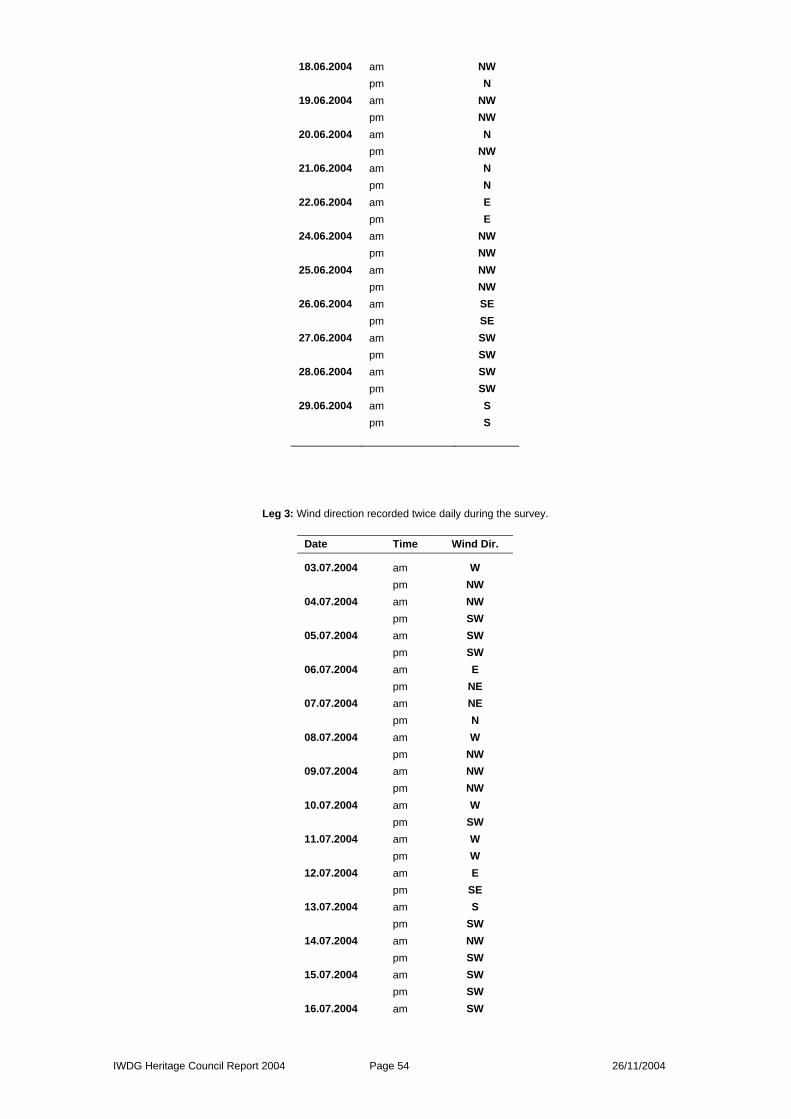
Leg 3: Wind direction recorded twice daily during the survey.
Date Time Wind Dir.
03.07.2004 am W
pm NW
04.07.2004 am NW
pm SW
05.07.2004 am SW
pm SW
06.07.2004 am E
pm NE
07.07.2004 am NE
pm N
08.07.2004 am W
pm NW
09.07.2004 am NW
pm NW
10.07.2004 am W
pm SW
11.07.2004 am W
pm W
12.07.2004 am E
pm SE
13.07.2004 am S
pm SW
14.07.2004 am NW
pm SW
15.07.2004 am SW
pm SW
16.07.2004 am SW
IWDG Heritage Council Report 2004 Page 55 26/11/2004
pm SW
18.07.2004 am W
pm W
19.07.2004 am S
pm SE
21.07.2004 am NW
pm SW
22.07.2004 am SW
pm SW
25.07.2004 am W
pm W
26.07.2004 am SW
pm SW
27.07.2004 am NE
pm E
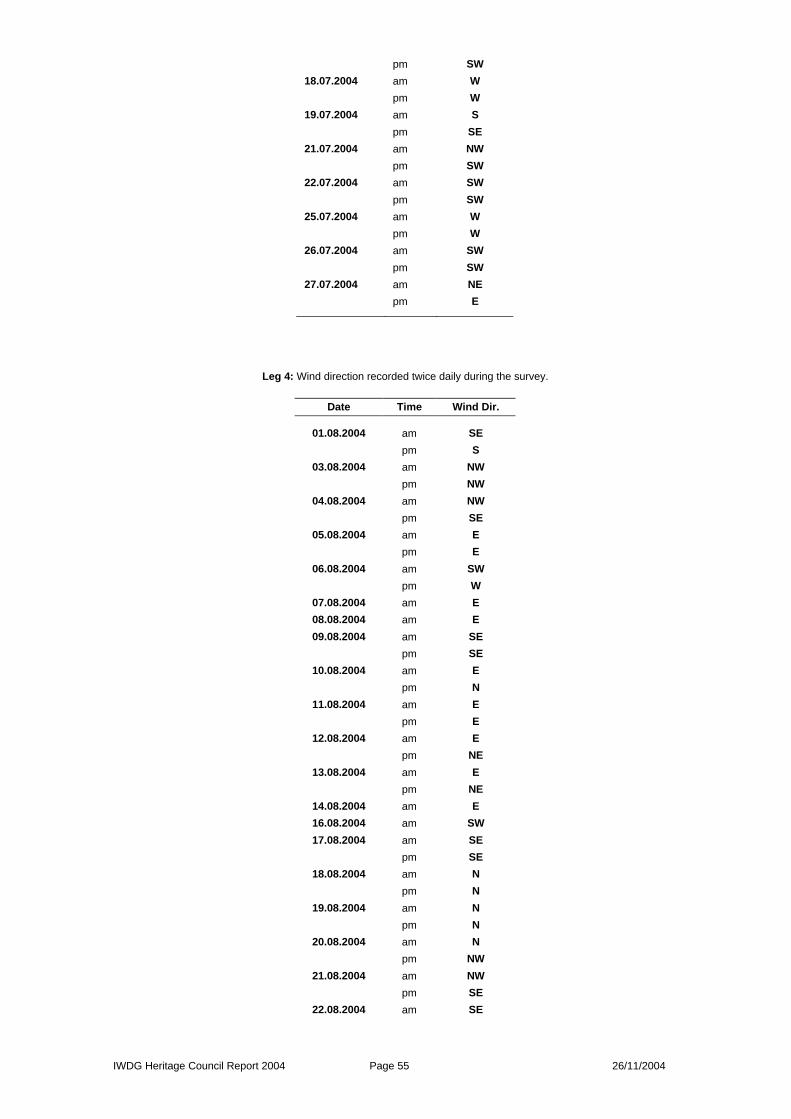
Leg 4: Wind direction recorded twice daily during the survey.
Date Time Wind Dir.
01.08.2004 am SE
pm S
03.08.2004 am NW
pm NW
04.08.2004 am NW
pm SE
05.08.2004 am E
pm E
06.08.2004 am SW
pm W
07.08.2004 am E
08.08.2004 am E
09.08.2004 am SE
pm SE
10.08.2004 am E
pm N
11.08.2004 am E
pm E
12.08.2004 am E
pm NE
13.08.2004 am E
pm NE
14.08.2004 am E
16.08.2004 am SW
17.08.2004 am SE
pm SE
18.08.2004 am N
pm N
19.08.2004 am N
pm N
20.08.2004 am N
pm NW
21.08.2004 am NW
pm SE
22.08.2004 am SE
IWDG Heritage Council Report 2004 Page 56 26/11/2004
pm E
23.08.2004 am E
pm E
24.08.2004 am E
pm N
25.08.2004 am NW
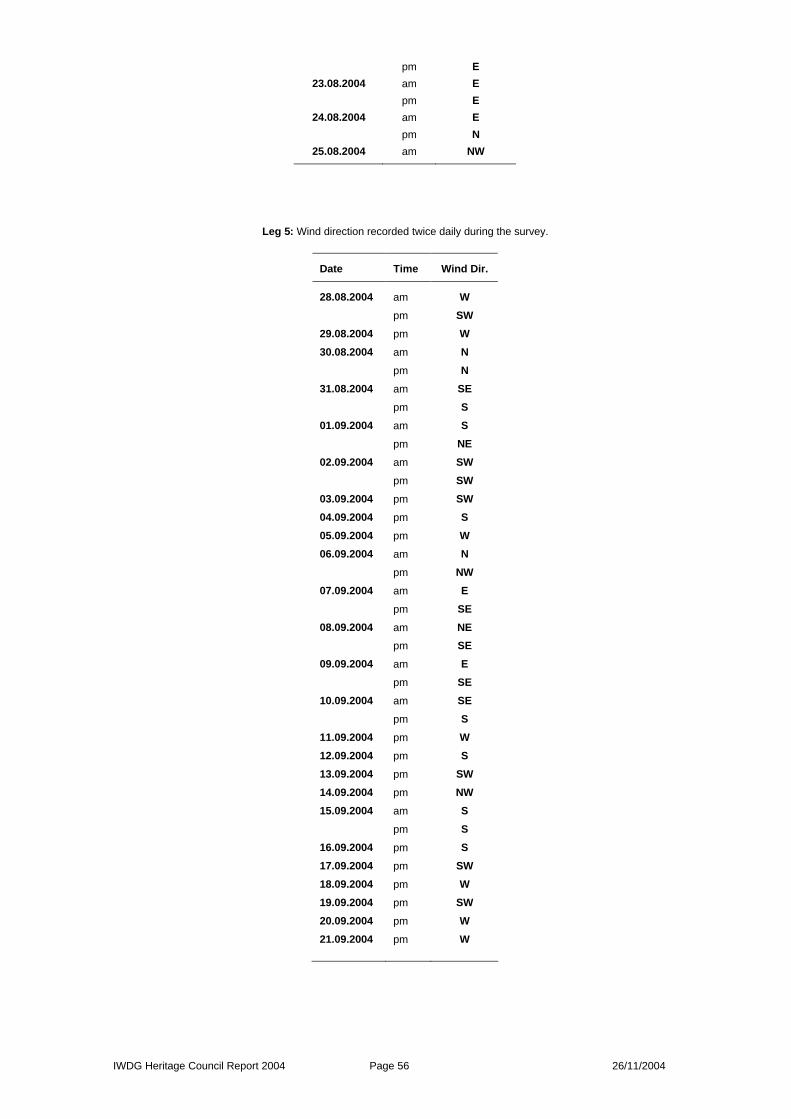
Leg 5: Wind direction recorded twice daily during the survey.
Date Time Wind Dir.
28.08.2004 am W
pm SW
29.08.2004 pm W
30.08.2004 am N
pm N
31.08.2004 am SE
pm S
01.09.2004 am S
pm NE
02.09.2004 am SW
pm SW
03.09.2004 pm SW
04.09.2004 pm S
05.09.2004 pm W
06.09.2004 am N
pm NW
07.09.2004 am E
pm SE
08.09.2004 am NE
pm SE
09.09.2004 am E
pm SE
10.09.2004 am SE
pm S
11.09.2004 pm W
12.09.2004 pm S
13.09.2004 pm SW
14.09.2004 pm NW
15.09.2004 am S
pm S
16.09.2004 pm S
17.09.2004 pm SW
18.09.2004 pm W
19.09.2004 pm SW
20.09.2004 pm W
21.09.2004 pm W