productive use of energy – produse...productive use of energy (produse) is a joint initiative of...
TRANSCRIPT

Productive Use of Energy – PRODUSEMeasuring Impacts of Electrification on Small and Micro-Enterprises in Sub-Saharan Africa

Copyright © 2013Deutsche Gesellschaft für Internationale Zusammenarbeit (GIZ) GmbHP.O. Box 518065726 Eschborn, [email protected]
All rights reservedThe findings, interpretations, and conclusions expressed in this paper are entirely those of the authors.
Photos© GIZ: Moussa Doumbia, Caroline Heidtmann, Marco Hüls, Kamikazz, Lucius Mayer-Tasch,
Christoph Messinger, Monika Rammelt© Shutterstock
Layoutcreative republicThomas Maxeiner Visual CommunicationsFrankfurt, Germanywww.creativerepublic.net
Language EditorSina Mabwa
Acknowledgments
The present study was implemented by a joint Task Team under the supervision of Lucius Mayer-Tasch (GIZ), Mohua Mukherjee (World Bank) and Kilian Reiche (lead consultant) with funding from the German Federal Min-istry for Economic Cooperation and Development (BMZ) and the Energy Sector Management Assistance Program (ESMAP). The study’s main authors are listed at the start of each chapter. In addition, we would like to thank the following contributors, reviewers and interviewed experts: Benjamin Attigah, Sudeshna Ghosh Banerjee, Anna Brüderle, Elizabeth Elizondo, Mike Enskat, Raluca Golumbeanu, Maya Hirsch, Marco Hüls, Ulrich Laumanns, Suzanne Maia, Irene Nakiwu, Alain Ouedraogo, Dana Rysankova and William Steel.
Productive Use of Energy (PRODUSE) is a joint initiative of the Energy Sector Management Assistance Program (ESMAP), the Africa Electrification Initiative (AEI), the EUEI Partnership Dialogue Facility (EUEI PDF) and Deutsche Gesellschaft für Internationale Zusammenarbeit (GIZ). Further information on www.produse.org.
The financial and technical support by the Energy Sector Management Assistance Program (ESMAP) is grate-fully acknowledged. ESMAP is a global knowledge and technical assistance program administered by the World Bank that assists low- and middle-income countries to increase their know-how and institutional capacity to achieve environmentally sustainable energy solutions for poverty reduction and economic growth. ESMAP is funded by Australia, Austria, Denmark, Finland, France, Germany, Iceland, Lithuania, the Netherlands, Norway, Sweden, the United Kingdom, and the World Bank Group.

Edited by Lucius Mayer-Tasch, Mohua Mukherjee and Kilian Reiche
Productive Use of Energy – PRODUSEMeasuring Impacts of Electrification on Small and Micro-Enterprises in Sub-Saharan Africa

4
Table of Contents
List of Tables and Figures ....................................................6List of Acronyms .....................................................................8Executive Summary .............................................................10
Chapter 1: Introduction ......................................... 15
Chapter 2: The Impact of Electricity Access on Economic Development: A Literature Review ............................ 19
1. Introduction ....................................................................... 202. Conceptual Background: The Steps from
Electricity Supply to Poverty Reduction .................. 213. Methodological Issues ................................................... 214. Macro-Level Research.....................................................23 4.1. Introduction .........................................................23 4.2. Empirical Evidence .............................................235. Micro-Level Research ..................................................... 28 5.1. Introduction ........................................................ 28 5.2. Factors Influencing Impacts of Energy .... 28 5.3. Empirical Evidence ............................................ 296. Summary and Conclusion of the
Literature Review ............................................................ 36
Chapter 3: Methodology ........................................ 39
1. Potential Linkages between Electricity and Income Generation ................................................40
2. The Treatment: Availability and Connection .........................................................................40
3. Identification Strategies ............................................... 42 3.1. The Identification Problem ........................... 42 3.2. Cross-Sectional Impact Evaluation .............43 3.3. Evaluation Strategies after an Ex-Post
Survey ..................................................................... 444. Study Implementation ..................................................47 4.1. Selection of Appropriate Control
Regions ...................................................................47 4.2 Survey Approach ................................................ 48
Chapter 4: Electrification and Firm Performance in Rural Benin: An Ex-Ante Impact Assessment ...... 51
Abstract ...............................................................................521. Introduction ........................................................................522. Data Collection..................................................................533. Research Approach and Focus ....................................54 3.1. Identification Strategy .....................................54 3.2. Electricity Dependency: Reliant and
Non-Reliant Enterprises ..................................554. Economic Conditions in the Survey
Regions .............................................................................. 56 4.1. Business Environment and
Infrastructure...................................................... 56 4.2. Micro-Finance and BDS .................................. 56 4.3. Market Access ......................................................585. Intermediate Outcomes: Electrification Impacts
on Inputs .............................................................................60 5.1. Energy Usage ......................................................60 5.2. Employment ........................................................ 62 5.3. Capital .................................................................... 636. Impacts on Firm Performance ...................................64 6.1. Profits in the Service Sector ..........................64 6.2. Profits in the Manufacturing Sector ......... 65 6.2.1. Difference in Means .............................. 65 6.2.2. Matching Approaches..........................687. Microeconomic Considerations of
Firm Behavior .................................................................... 708. Conclusions ........................................................................72
Chapter 5: Firm Performance and Electricity Usage in Small Manufacturing and Service Firms in Ghana ............. 75
Abstract .............................................................................. 761. Introduction ....................................................................... 762. Empirical Strategy and Data .......................................77 2.1. Sampling and Survey Design ..........................77 2.2. Potential Impacts and Outcome
Indicators ...............................................................78 2.3. Identification Strategy .....................................78
5
Table of Contents
3. Economic Conditions in Surveyed Area.................. 79 3.1. Access to Infrastructure ................................. 79 3.2. The Surveyed Firms: Access to Markets,
Finance and Business Development Services ..................................................................80
4. Intermediate Impacts of Electricity Usage .......... 82 4.1. Energy Sources ................................................... 82 4.2. Lighting ..................................................................83 4.3. Energy Expenditures .........................................85 4.4. Capital and Employment ................................855. Impact Analysis .................................................................87 5.1. Sales and Firm Revenue .................................. 88 5.2. Firm Profits: Difference in Means ............... 88 5.3. Ordinary Least Squares ...................................89 5.4. Two Stage Least Squares .................................91 5.5. Robustness of Results ......................................916. Conclusion ......................................................................... 92
Chapter 6: Micro-Enterprise Electricity Usage in Two Export-Oriented Fishing Communities at Lake Victoria, Uganda .................................................... 95
Abstract ..............................................................................961. Introduction .......................................................................962. Empirical Strategy and Data ......................................96 2.1. Sampling and Survey Design .......................96 2.2. Treatment, Comparability Issues and
Indicators .............................................................. 973. Economic Conditions in the Surveyed Area .........98 3.1. Roads and Energy Infrastructure ................98 3.2. Access to Finance and Business
Development Services .....................................99 3.3. The Typical Enterprise in the Survey
Area .........................................................................994. Quantitative Evidence: Energy and
Enterprise Outcomes ....................................................99 4.1. Energy Usage ......................................................99 4.2. Capital ...................................................................103 4.3. Employment and Operation Hours ......... 104 4.4. Market Access ....................................................105 4.5. Firm Profits......................................................... 106 4.6. Industry Structure and Product
Variety ...................................................................107
5. Qualitative Evidence: Stylised Case Studies ....... 108 5.1. Electricity Not Required: Carpentry and
Upholstery.......................................................... 108 5.2. Electricity is Crucial: Aquaculture ............. 109 5.3. Electricity Improves Offered Services:
Barber, Phone and Computer Shop.......... 1096. Conclusion ........................................................................ 110
Chapter 7: Conclusions ......................................... 113
Annex: Impact Monitoring and Evaluation of Productive Electricity Use – An Implementation Guide for Project Managers ............................... 119
1. Introduction ..................................................................... 1202. Classical M&E vs. Impact M&E .................................121 2.1. Outcomes, Impacts and Highly-
Aggregated Impacts ........................................121 2.2. Second Round Effects ..................................... 1223. Developing a Productive Use Impact M&E
System ............................................................................. 122 3.1. General strategies to isolate the project’s
effect ..................................................................... 122 3.2. Three PUE Impact M&E Modules .............. 1234. Step-by-step Towards an Effective PUE Impact
M&E System ....................................................................1265. Aid Items ............................................................................136 Aid 1. The Results Chain Concept and
Demarcation Between Outcomes and Impacts ...................................................136
Aid 2. Strategies to Identify the Counterfactual Situation .........................136
Aid 3. List of Indicators ...........................................139 Aid 4. Outline of Terms of Reference for
Short-Term Experts .....................................142 Aid 5. Outline of Inception Report .................... 143
Addenda ............................................... 145
References ........................................... 146

6
List of Tables and Figures
Table 1: Effects of Infrastructure and Energy on Productivity .........................................................................................24Table 2: Effects of Infrastructure and Electricity on Economic Growth .......................................................................26Table 3: Effects of Infrastructure on Poverty Reduction in Developing Countries ................................................... 27Table 4: Effects of Electricity Access on Number of Businesses ......................................................................................29Table 5: Effects of Electricity Access/Quality on Firm Productivity ................................................................................30Table 6: Effects of Electricity Access on Employment .......................................................................................................... 32Table 7: Effects of Electricity Use on Income at Firm and Household Level ...............................................................34Table 8: Effects of Electricity Use on Poverty ........................................................................................................................... 35Table 9: Advantages and Disadvantages of Different Impact Evaluation Approaches ........................................ 46Table 10: Sampling ............................................................................................................................................................................... 53Table 11: Electricity Reliant and Non-Reliant Firms in the Access Region ..................................................................... 55Table 12: Subjective Reasons for Not Applying for Credits .................................................................................................. 57Table 13: Association Membership, Cooperation and BDS .................................................................................................. 57Table 14: Entrepreneurs Perception of BDS ................................................................................................................................58Table 15: Major Problems as Mentioned by the Entrepreneurs (multiple answers possible) ..............................58Table 16: Location of Product Selling – Manufacturing Firms (multiple answers possible) ..................................59Table 17: Destination of Products – Manufacturing Firms ..................................................................................................59Table 18: Artificial Lighting Usage Among Electricity Non-Reliant Firms ....................................................................60Table 19: Energy Using Appliance Usage (electric and other) ............................................................................................ 61Table 20: Connection Rates and Electricity Consumption ................................................................................................... 61Table 21: Employment and Wages .................................................................................................................................................62Table 22: Average Capital Stock per Firm in the Service Sector (in FCFA) ......................................................................63Table 23: Capital Usage in the Manufacturing Sector.......................................................................................................... 64Table 24: Profits in the Service Sector, Access and Non-Access Region ..........................................................................65Table 25: Profits in the Service Sector, Connected and Non-Connected Firms ............................................................65Table 26: Mean Performance Indicators by Access and Non-Access Region ................................................................65Table 27: Mean Performance Indicators in the Access Region .......................................................................................... 66Table 28: Electricity Reliant and Non-Reliant Manufacturing Firms in the Access Region ................................... 66Table 29: Contribution of Electricity-Reliant Firms to the Local Economy.....................................................................67Table 30: Mean Performance Indicators by Region, Excluding Electricity-Reliant Firms .........................................67Table 31: Mean Profits in the Access Region, Excluding Electricity-Reliant Firms ......................................................67Table 32: Probit Regression – Grid Connection as Dependent Variable ........................................................................ 69Table 33: Mean Profits for Connected and Hypothetically Connected Firms ............................................................. 69Table 34: Subcategories in the Service and Manufacturing Sector ................................................................................. 77Table 35: Integration with External Markets (only manufacturing firms) ................................................................... 80Table 36: Access to Finance ................................................................................................................................................................81Table 37: Subjective Reasons For Not Applying For Credits ..................................................................................................81Table 38: BDS Usage .............................................................................................................................................................................82Table 39: Connection Rates in Selected Business Types ........................................................................................................82Table 40: Reason for Not Connecting to the Grid (multiple answers possible) ..........................................................83Table 41: Lighting ..................................................................................................................................................................................84Table 42: Cost Reduction Through Electric Lighting ...............................................................................................................84Table 43: Monetary Expenditures and Time Spent to Obtain Respective Energy Source .......................................85Table 44: Resale Value of Capital Endowment (in GH¢) ....................................................................................................... 86Table 45: Daily Operation Hours .................................................................................................................................................... 86

7
List of Tables and Figures
Table 46: Labor Input per Week .......................................................................................................................................................87Table 47: Characteristics of Workforce and Compensation.................................................................................................87Table 48: Revenue per Month (in GH¢) .........................................................................................................................................88Table 49: Labour Productivity: Revenue (in GH¢) per Total Input of Working Hours .................................................88Table 50: Profits (in GH¢) – Difference in Means ..................................................................................................................... 89Table 51: Monthly Firm Profit – Ordinary Least Squares and Two Stage Least Squares Regression
(p-values in parentheses) ..............................................................................................................................................90Table 52: Monthly Profits – Manufacturing and Service Sector (including outliers) ................................................92Table 53: Average Firm Characteristics in the Survey Area ............................................................................................... 100Table 54: Reasons for Not Connecting ...................................................................................................................................... 100Table 55: Share of Firms Using the Respective Energy Source (in %) ..............................................................................101Table 56: Energy Expenditures in UShs ......................................................................................................................................102Table 57: Lighting Sources ...............................................................................................................................................................102Table 58: Capital Endowment ........................................................................................................................................................ 103Table 59: Hours of Operation and Monthly Labour Input ..................................................................................................104Table 60: Employment and Remuneration ...............................................................................................................................105Table 61: To Whom of the Following Does the Enterprise Sell the Majority of its Goods and Services to?
(in %) ..................................................................................................................................................................................... 106Table 62: In Which of the Following Places Are the Majority of this Enterprise's Goods and Services
consumed? (in %) ............................................................................................................................................................ 106Table 63: Calculated Profits in an Average Month ............................................................................................................... 106Table 64: Industry Structure (in %) ............................................................................................................................................... 107Table 65: Products Sold (in %) .........................................................................................................................................................108Table 66: Potential Approaches for PUE impact M&E – An Overview ........................................................................... 124
Figure 1: The Theory: Steps from Electricity Supply to Poverty Reduction .................................................................... 22Figure 2: Macro-Level Correlation Between Electricity and Human Development .................................................. 22Figure 3: Contribution of Infrastructure to Total Factor Productivity of Firms ............................................................31Figure 4: Pathways from Electricity to Income Generation ..................................................................................................41Figure 5: The Difference-in-Differences Approach .................................................................................................................45Figure 6: Access and Non-Access Region ....................................................................................................................................54Figure 7: Matching of Hypothetically Connected Firms ...................................................................................................... 68Figure 8: Optimal Production Level by Technology ..................................................................................................................71Figure 9: Steps in the Design of the PUE Impact M&E Approach ...................................................................................127Figure 10: Exemplary Results Chain of Grid Extension Programme .................................................................................137

8
List of Acronyms
2SLS Two Stage Least SquaresADB Asian Development BankAFD Agence Française de DéveloppementAMFIU Association of Microfinance Institutions of UgandaBDS Business Development ServiceBMZ German Federal Ministry for Economic Cooperation and DevelopmentBUDS Business Uganda Development SchemeCIA Conditional Independence Assumption DD Difference-in-Difference-EstimationDFID Department for International DevelopmentDGIS Directorate-General for International Cooperation of the Dutch Ministry of Foreign AffairsEIU Economist Intelligence UnitEnDev Energising Development programmeEnPoGen Energy, Poverty and GenderESMAP Energy Sector Management Assistance ProgramEU European UnionEUEI PDF EUEI Partnership Dialogue FacilityFCFA West Africa FrancGDP Gross Domestic ProductGH¢ Ghanaian New CediGIZ Deutsche Gesellschaft für Internationale Zusammenarbeit (GIZ) GmbHGTZ Gesellschaft für Technische Zusammenarbeit (GTZ) GmbHHBS Household Budget SurveyHDI Human Development IndexICE ICE EnergyICT Information and Communications Technology IEA International Energy AgencyIEG International Energy Group ISSER Institute of Statistical Social and Economic ResearchIT Information TechnologyIV Instrumental VariablesLSMS Living Standards Measurement StudyM&E Monitoring & EvaluationM&EED Group Monitoring and Evaluation in Energy for DevelopmentMDG Millennium Development GoalMENA Middle East North AfricaMPI Multidimensional Poverty IndicatorMSME Micro, Small and Medium EnterprisesNED Northern Electricity DepartmentNGO Non-Government OrganisationNONIE Network of Networks on Impact EvaluationNRECA National Rural Electric Cooperative AssociationOLS Ordinary Least SquaresPRODUSE Productive Use of EnergyPUE Productive Use of Electricity R&D Research & Development

9
SBEE Small Business Energy EfficiencySE4All Sustainable Energy for All initiativeSHS Solar Home SystemsSME Small and Medium EnterpriseSPSS Predictive analysis softwareSTATA Data analysis and statistical softwareTC Total CostTFP Total Factor ProductivityToR Terms of ReferenceTR Total RevenueU.S. United States of AmericaUK United KingdomUMEME Electricity distribution company in UgandaUN United NationsUNDP United Nations Development ProgrammeUS $ United States DollarUShs Uganda ShillingsVRA Volta River AuthorityWHO World Health Organization

10
Executive Summary
While the interest of policy makers in the nexus between electrification, productive electricity usage and development impacts has been increasing steadily over the last decade, the lack of robust evidence on causal effects of electrification is striking. The joint GIZ-ESMAP study Productive Use of Energy (PRODUSE) – Measuring Impacts of Electrification on Small and Micro-Enterprises in Sub-Saharan Africa set out to improve the under-standing of this issue. PRODUSE pursued two main objectives: (a) gaining insights on the interaction between electrification and productive electricity usage by examining the impact of electrification on micro-enterprises and (b) improving the available toolkit for the impact evaluation of electrification programmes.1
PRODUSE has shown that proper usage of statistical techniques is required for deriving solid findings on these impacts and has demonstrated that methodological rigour is possible even if available project evalua-tion budgets are small. The study has confirmed that the ex-ante differences between firms that get connected to electricity and those that do not get connected are substantial – which invalidates any determi-nation of impacts by simply comparing these groups using descriptive statistics (as is all too often done in literature on electrification impacts). Methods have to be used which account for observable and also for non-observable heterogeneity between connected and non-connected firms.
With regards to objective (a) i.e. gaining insight on the interaction between electricity access, productive electric-ity usage, income generation and additional services, valuable and partly surprising findings could be provided based on field surveys in Benin, Ghana and Uganda, in spite of the modest budget of the surveys. Stark differ-ences between industries show up: while service firms tend to get connected to the grid, take-up rates in the manufacturing sector of rural areas were low in the countries that have been studied. Connected firms in rural areas in both the manufacturing and the service sectors use electricity mostly for lighting and phone charging. Some rural manufacturing firms also use electric appliances if it is essential for their production process (such as welders). In general, however, take-up of electric appliances remains modest. In the service sector more appli-ances are used, mostly refrigerators and entertainment devices. A slightly different picture prevails in the peri-urban set-up studied in Ghana. Here, grid connected firms employ much more electric machinery.
Altogether, in the three studies electricity usage did hardly translate into higher firm profits in a measurable way.2 In one country case, Benin, it seems that the financial burden resulting from the investment in the connection and subsequent electricity bills can even reduce the profitability of firms, indicating that from a pure business perspective getting connected is not always a rational option.
These rather sobering results (i.e. generally no clear indication for positive effects of electricity access on firm performance) were contrasted by some evidence indicating that electrification can lead to the creation of new firms, which generate additional income and, hence, impacts on the target population in the project regions. Small service and manufacturing firms are created offering goods and services that have previously been imported from other regions or simply not been offered in the area heretofore. In addition, individual cases could be observed, in which larger firms were attracted to the region by the availability of electricity. While such direct investments could contribute substantially to income generation in the region, it is prema-ture to claim that such firm creation occurs systematically. More research in other regions and with larger sample sizes is needed to further understand this potential process of electricity-induced firm creation and
1) Regarding objective (b), our aim was to demonstrate evaluation methods which would (i) allow for more robust results than most electrifi-
cation evaluations to date, and at the same time (ii) be readily applicable in real-life implementation contexts – which often face limitations
in terms of costs and/or timing. The impact evaluation methods we propose could be applied with relatively modest additional effort to
most electrification programmes. As an example, we provide a ‘next best’ method to treat project implementation cases in which no
baseline has been established by the time an evaluation starts (which should obviously be avoided wherever possible, but all too often
happens in practice).
2) One can think of a whole series of possible explanations for this result of our three case studies, such as lack of access to external markets,
lack of business skills, etc. One possible explanation that has repeatedly been brought forth by this study’s peer reviewers is the low
reliability of the electricity grid. However, none of our three case studies allows for clear conclusions regarding these explanations. For
example, the grid in the surveyed region in Northern Benin, was stable with short outages occurring only once every few days. In Ghana
and Uganda, both announced and unannounced outages occurred somewhat more frequently, but even here only a small number of entre-
preneurs complained about reliability issues. Also, only few non-connected firms declared reliability as a major reason for not connecting.

11
3) See Chapter 3 (methodology) and the PRODUSE Impact M&E Guide in the annex.
4) The PRODUSE website (www.produse.org) is available as a platform for making available studies that fulfill these requirements.
investments. This particularly includes studies that survey project target regions before and after electrifica-tion and compare firm creation at these two points in time, respectively. Furthermore, crowding-out effects (i.e. people have to reduce their expenditures for the old product in order to buy the new one) have to be taken into account in order to assess the net benefit for a region.
Methodologically, PRODUSE has developed and applied a solid approach for gaining insight on how micro-enterprises use electricity and the extent to which this changes their production process. In spite of this innovative contribution, PRODUSE cannot be more than a kick-off to further and broader investigations of the complex relationship between electricity access and productive processes and, eventually, economic develop-ment and poverty alleviation. It can be concluded that cross-sectional methods – if properly implemented – are a valid approach to identify causal effects of electrification on micro-enterprises. Furthermore, the ex-ante cross-sectional approach generates insights into firm characteristics and behaviour in a comparable, already electrified non-project region as well as in the project region that can inform the design and implementation of the planned electrification project. For example, the baseline data from the already electrified control group can be used during project implementation for developing realistic business plans together with firms in the project area.
Nonetheless, it would be desirable to also collect over-time data in order to allow the application of differ-ence-in-differences analysis. In contrast to cross-sectional data, this accounts for unobservable heterogeneity between connected and non-connected firms, which in turn increases the robustness of results. Furthermore, it would be desirable to have bigger sample sizes in future studies, because the heterogeneity of firms and their responses is so high that small sample sizes are often not able to grasp potentially existing differences in a statistically significant way (even if the survey is focused on specific industries). In addition, the scope of research might be extended to all sectors in one region and also neighbouring communities in order to capture demand movements and, hence, crowding out effects.
We strongly encourage development practitioners and policy makers to make use of rigorous evaluation methodologies such as the one used for PRODUSE3 when planning new energy interventions to i) improve project results and ii) contribute to a more solid overall understanding of the nexus between electrification, productive use and development impacts. As the literature review (Chapter 2) has shown, there are very few solid studies on this topic to date. Once a critical mass of robust evaluation studies has been conducted in a sufficiently broad variety of country, market and project contexts, it will be possible to draw more general conclusions about this nexus.4
One of the conclusions that can be drawn from the research efforts presented in this report is that project managers should be realistic in their expectations with regard to the (measurable) economic impact of elec-trification projects, especially on firms. If substantial productive take-up is specifically intended by an electri-fication project, a typical strategy would be to include the major determinants for productive uptake in the programme’s geographic area targeting process (i.e. picking those areas first that appear to be most promis-ing for productive uses – for example because of better access to external markets). However, this may be in direct contrast to other selection criteria (such as poverty targeting).

12
The PRODUSE Manual, which has been developed in parallel to this study, provides guidance on how to design and implement activities promoting productive use that can be integrated into broader electrification projects and enhance the impact of electrification projects and programmes on local economic development in general and firm productivity in specific. However, the results of our study show that productive use is not automatically associated with positive impacts on firm performance and other parameters. Promotion activities should therefore include support for proper business plan development5 for the targeted firms (i.e. the potential commercial electricity customers) in order to ensure the profitability of their investment into grid connections and electric appliances. Such promotion activities have to be open towards the results: Con-necting to the grid should not be promoted at all costs. The decision should rather be based on the business plan implying that the recommendation for an individual firm can as well be to abstain from a connection if the projected additional revenue is insufficient to recover the investment. This is essential in order to avoid predictable misallocations, which might drive some firms into financial problems, as appeared to have hap-pened in the case study from Benin (‘electrification trap’). Furthermore, the creation of promising new enterprises as observed in Benin and Uganda could be facilitated by accompanying activities that support potential external investors in collecting the required information to prepare firm creation in the region. This could be done in cooperation with industry chambers or regional development programmes.
On a more general note, the findings of the PRODUSE study suggest that (rural) electrification should not be reduced to its potential contribution to ‘productive uses’ and, hence, to economic growth in a narrower sense. Firstly, this poses the risk that claimed objectives are not achieved, as productive uptake can be moderate in the short term, as our country cases show. Secondly and more importantly, this would neglect the ‘non-productive’ significance that electricity arguably has to people in rural areas. From the perspective of rural dwellers, electric lighting, television and mobile phone charging revolu-tionise their lives. In this context, it should not be forgotten that ‘productive use’ in specific and economic growth in general are only proxies to measure improvements in people’s well-being. Elec-tricity and modern energy services at large, however, directly affect the well-being of rural people – beyond any potential income generation. In the same vein, the UN has recently included electric-ity access explicitly as a direct indicator of their new Multidimensional Poverty Indicator (MPI).6
5) See modules 5.3 and 5.4 of the PRODUSE manual Productive Use of Energy (PRODUSE) –
A Manual for Electrification Practitioners, which has been developed by GIZ and EUEI PDF.
It can be accessed at www.produse.org/manual.
6) The MPI is based on the Human Development Index (HDI) and formulates ten dimensions
that capture poverty.

13


Chapter 1: Introduction By Kilian Reiche and Jörg Peters
16
Introduction
Access to modern energy is considered key to poverty alleviation and growth strategies by policy makers and development practitioners alike. While energy access was not declared an explicit Millennium Development Goal (MDG) in 2000, UN (2005) emphasized the role that modern energy plays in achieving most of the MDGs; UN (2010) stated that ‘energy is at the heart of most critical economic, environmental and develop-mental issues facing the world today’; and the recent SE4All Initiative has mobilized broad international support for achieving universal energy access with good chances to make energy access an explicit UN Devel-opment Target in the Post-2015 Development Agenda (UN 2013, UN SDSN 2013).
Access to electricity in particular ranks high in subjective demand prioritizations in most household surveys. According to the SE4All Global Tracking Framework (2013), about one billion people need to be provided with electricity to achieve universal access by 2030 at total investments of about US $ one trillion.
At the same time, the energy sectors in virtually all least developed countries are in need of urgent improve-ments: generation capacities are often not sufficient (with frequent blackouts as a consequence) and electric-ity tariffs are hardly cost covering, making the extension of electricity grids difficult. New electricity users in rural areas are the most unattractive market segment, due to low demand densities and a relatively higher fraction of low income households compared to connected areas. As a response to these difficult conditions, governments as well as bilateral and multilateral donors have increased their efforts in this sub-sector over the last decade and subsidized grid and offgrid electrification in many countries.
Electrification practitioners often refer to a set of common sense-based causalities to underpin the hypothe-sis that electrification contributes to poverty alleviation. Most notably, they often emphasize the crucial role productive electricity take-up may play in increasing income generation for home businesses and enterprises - thus making electricity service provision more viable in turn. Accordingly, UN (2010) and SE4All (2013) both stress the importance of productive energy uses as an explicit element of universal access strategies.7
However, systematic evidence on (i) the relationship between access to electricity and poverty alleviation in gen-eral as well as (ii) productivity impacts of electrification in specific are scarce, and rigorous evaluations of electri-fication interventions particularly in Africa are virtually non-available (IEG 2008, Estache 2010, Chapter 2).8
In order to (i) start filling this gap between practitioners’ perceptions and the lack of robust evidence and to (ii) inform the design of interventions to promote the productive use of energy, GIZ and ESMAP launched the Productive Use of Energy (PRODUSE) study. In three African countries – Benin, Ghana and Uganda – the usage of electricity in micro-enterprises was examined and the effect of electricity use on firm perfor-mance was assessed.
At the outset of the project, a joint survey methodology for all cases was developed: a number of firms should be surveyed that would be sufficiently high to allow the application of statistical tools. In the optimal case, both an electrified and a non-electrified area are included in order to obtain an idea about how the perfor-mance of firms differs – taking into account other differences like, for instance, the industry they belong to, the firm size or the entrepreneur’s education. The methodology aims to identify counterfactual outcomes and, thereby, the PRODUSE study is one of few attempts to date to apply rigorous evaluation techniques (as outlined in Ravallion 2008) to analyse the particular impact of electrification on micro-enterprises.
7) UN 2010: “The global community should aim to provide access for the 2-3 billion people excluded from modern energy services, to a basic
minimum threshold of modern energy services for both consumption and productive uses.” SE4All (2013): “The SE4ALL universal access goal
will be achieved only if every person on the planet has access to modern energy services provided through electricity, clean cooking fuels, clean
heating fuels, and energy for productive use and community services.“
8) IEG 2008: “The evidence base remains weak for many of the claimed benefits of [rural electrification]. Tailor-made surveys, designed to test
these benefits, need to be built into a greater number of Bank projects and designed to allow rigorous testing of the impact of electrification.
[…] While stimulation of productive enterprise is claimed to be among the benefits of electrification, few studies have tried to quantify these
benefits using an impact evaluation methodology”.

17
The methodology can be used beyond the specific PRODUSE exercise and adapted to evaluate the impacts of any other electrification project, at relatively modest costs.
Thus the cost can be covered by most electrification projects from their M&E budget. This is essential to allow for a wider use of such impact evaluation modules in electrification projects (which should be an explicit element of SE4All roll-out), with the aim to produce a broader body of evidence-based findings on the energy-poverty nexus. Depending on the available M&E budget of the project, co-funding from evaluation depart-ments or research networks can be complementarily considered to meet the financial requirements to implement a robust impact study.
The main objective of the PRODUSE study is (a) to gain insights into the interaction between electricity access and productive electricity usage and (b) to improve the available toolkit for evaluation of electrification projects (with a particular focus on productive usage). Based on a better understanding of how modern energy access might lead to economic and social development, effective interventions can be planned to complement en-ergy programmes.
In parallel to this study, GIZ and the EUEI Partnership Dialogue Facility have reviewed the experience with ongoing and past productive use promotion efforts. Based on this review, a practical guide for project plan-ners was developed to design concrete activities to promote sustainable productive use of electricity. This parallel guidance note has been published under the title Productive Use of Energy (PRODUSE) – A Manual for Electrification Practitioners.9
The main part of this report presents the application of the developed tools and particularly the results regarding objective (a). Chapter 2 starts with an overview of the existing literature showing that, while a couple of solid publications exist on electrification and its impacts, rigorous project evaluations focusing on electricity take up in general and productive use impacts are rare. Chapter 3 outlines the methodology to evaluate the impacts of productive electricity usage, which is then applied in Chapters 4-6 for the case of Benin, Ghana and Uganda. Chapter 7 contains concluding remarks.
Regarding objective (b), a hands-on step-by-step guide for electrification practitioners on how to implement an impact-based M&E system is presented in the Annex. This tool helps project managers to move from simple monitoring and reporting of numerical targets to a methodologically sound evaluation of the impact achieved through electrification among micro-enterprises.
9) See EUEI PDF/GIZ 2011. The PRODUSE Manual is available at www.produse.org/manual.

18

19
Chapter 2: The Impact of Electricity Access on Economic Development: A Literature Review By Benjamin Attigah and Lucius Mayer-Tasch 10
20
1. Introduction
Policy makers around the world believe that access to modern energy (both electrical and non-electrical) is a necessary requirement for sustainable development. This belief is based on three basic arguments, which often appear in non-empirical literature on energy for development:
(i) modern energy may be a crucial input to achieving several of the Millennium Development Goals (MDGs)
(ii) modern energy use may enable the poor in developing countries to engage in improved or new income-generating activities (often called ‘productive use of energy’, as opposed to ‘consumptive use’), thereby eventually leading to an improvement in their living conditions (Practical Action 2012, UNDP/WHO 2009, DFID 2002, UN 2002, UN Millennium Project 2005, Brew-Hammond and Kemausuor 2009) and
(iii) exclusion from modern energy might be a direct indicator of poverty based on definitions which refer to living standards – for instance, access to electricity is included in a recently published ‘Multidimen-sional Poverty Index’ by the UNDP (2010).
Of all modern energy types, electricity access is included most frequently as an explicit objective of national development strategies. Hence, the focus in this chapter is on access to electricity.
Empirical evidence which can be used to validate the arguments above is surprisingly scarce. In particular, little direct evidence has been published to underpin the second argument, i.e. the claim that electrification can reduce poverty through enabling ‘productive uses’ of electricity (IEG 2008, Kooijman-van Dijk 2008, ADB 2005, Meadows et al. 2003, Martinot et al. 2002). Moreover, quantitative evidence of the impact of electricity on economic development (especially in comparison to other publicly provided services) hardly exists. Strong-er evidence is needed for better-informed policy decisions, such as the priorities of public investment options (World Bank 2010).
The few studies that do exist on the topic often lack a reliable methodology (Meadows and Riley 2003). ADB (2005) and Estache (2010) present two recent reviews of academic literature on the impact of infrastructure on poverty reduction: both conclude that most existing studies on electrification impacts are of ‘uncertain value’ due to a series of shortcomings in the applied methodologies, such as a lack of control groups and/or before-after data and a general failure to track the effects on poverty over a long enough time period.11
The lack of robust evidence to date can partly be attributed to the fact that electricity is a ‘quintessential’ in-termediate good. Electricity does not represent an end in itself: it is an input factor to a large set of activities (‘uses’) that can improve welfare, increase productivity or generate income. The complex interactions and synergies between multiple development factors, including other infrastructure investments next to electric-ity and enabling political, socio-economic and cultural conditions, pose major methodological challenges to isolating and quantifying the impact of electrification. Indeed, it is increasingly recognised that certain “com-plementary” inputs or services – such as business development services (BDS) or access to finance – can increase the chances that access to electricity leads to significant income generation and poverty alleviation (ADB 2005, IEG 2008, Motta and Reiche 2001, Peters et al. 2009). However, knowledge about the extent to which these complementary factors contribute to improving the impacts of energy investments on poverty reduction and under which circumstances is at best incomplete (Kooijman-van Dijk 2008).
The debate on the precise role of electricity in economic development, thus, remains disputed.
This chapter provides a short review of relevant recent literature in order to better understand the contribu-tion of energy (in particular, electricity) to economic growth and development. It looks at both macro and micro-level research analysing the links between energy and development. The chapter will discuss only in-depth qualitative and quantitative research. The fairly large number of policy papers citing purely anecdo-
10) The authors thank Anna Brüderle, Mike Enskat, Elizabeth Elizondo, Nadja Kabierski-Chakrabarti, Sophia Kamarudeen, Nicolas Korves, Jörg
Peters, Kilian Reiche and Peggy Schulz for valuable inputs.
11) Some recent studies have begun to apply more comprehensive research methods (e.g. World Bank 2009a, World Bank 2009b). Nevertheless,
these studies are still few in number and they represent mostly ‘grey literature’ which is not yet established in more academic research.

21
tal evidence on ‘productive use of electricity’ is not taken into account here. The review focuses on the role of electricity access; questions of service quality or reliability of energy supply will only be considered as far as they influence the uptake and impact of (newly provided) energy access. In line with the general focus of the PRODUSE Study, the chapter takes a one-dimensional perspective on development with economic parame-ters like income generation, growth and productivity, inter alia, as the best measurable development indica-tors. Impacts on education or health for example obviously form important aspects of development – but their measurement requires more complex methodologies and therefore they are not discussed here.
The remainder of this chapter is structured as follows: the next section provides a basic conceptual back-ground by outlining the steps that lead from energy supply to poverty reduction. Section 3 discusses some methodological issues. This is followed by an overview of the existing empirical evidence at the macro-level (Section 4) and at micro-level (Section 5). Section 6 contains concluding remarks.
2. Conceptual Background: The Steps from Electricity Supply to Poverty Reduction
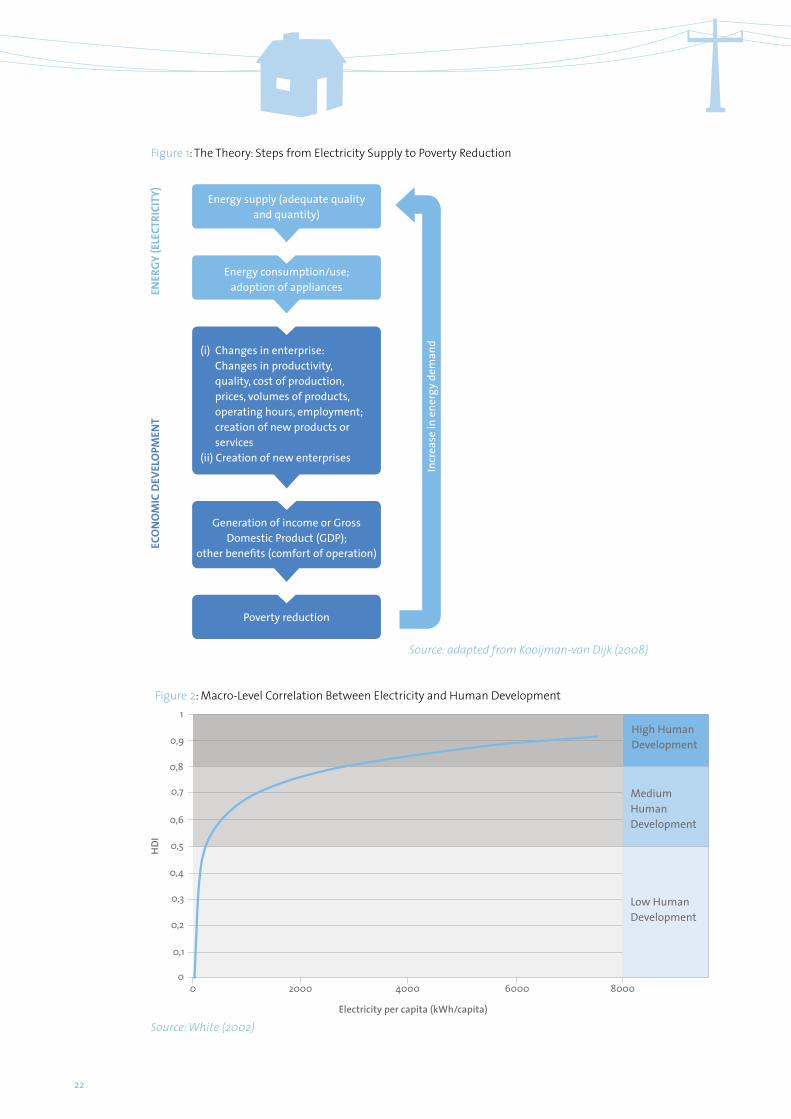
As Kooijman-van Dijk (2008) points out, one of the reasons why there is little understanding of the links between electricity supply and poverty reduction through income generation is because the relationship con-sists of several steps and many factors influence each of these steps. The first step towards a business benefit-ing from electricity supply is the physical provision of electricity and the entrepreneur’s decision to make use of it. However, it is the steps that follow, namely the actual use of electricity and the subsequent changes that electricity use brings in the enterprise (e.g. increased productivity), which can ultimately lead to impacts at enterprise level, such as increased income. The theory regarding the causal chain from energy supply infrastruc-ture to development outcomes is displayed in Figure 1 (adapted from Kooijman-van Dijk 2008: 6). This concept is discussed in more detail in the methodology developed for the empirical research of the study at hand.
Obviously this figure shows only a hypothesis of interaction and direction of impact. However, it provides a useful framework for further analysis, as the structure makes clear the relationships between the different variables that are typically analysed in the literature (energy supply – quality and reliability of energy supply - energy consumption/use – productivity – growth/GDP/income (inequality) – poverty reduction). For pur-poses of empirical investigation, these variables can in turn be measured by different indicators. The empirical findings presented in subchapters 4 and 5, for both macro and micro-level, are structured along these lines.
3. Methodological Issues
Evidence of the contribution of energy to economic development is often presented in the form of simple cor-relations between electricity and welfare indicators such as GDP or the Human Development Index (HDI) at the macro-level (e.g. IEA 2004) or household income at the micro-level. Such correlations are then presented as evi-dence that energy causes positive development outcomes. For example in a study by White (2002: 34) the figure below is presented as evidence that ‘human development responds dramatically to initial electricity additions’.
It is important to point out, however, the simple but all too often neglected fact that correlation does not imply causality! In our example, it is just as plausible that improvements in the HDI lead to increases in energy consumption and not just the other way around.
Academic research commonly uses regression analysis to test the magnitude and direction of causal relation-ships between variables in a data set.12 In the literature on the link between electricity (or on a more general level, infrastructure) and economic development, the main explanatory variable is usually either electricity consumption or electricity supply. The dependent variables analysed in the literature are productivity, output, growth, income (inequality), employment or poverty reduction.
22
Figure 1: The Theory: Steps from Electricity Supply to Poverty ReductionEC
ON
OM
IC D
EVEL
OPM
ENT
ENER
Gy (E
LECT
RICI
Ty)
Poverty reduction
Source: adapted from Kooijman-van Dijk (2008)
Source: White (2002)
Energy supply (adequate quality and quantity)
Generation of income or Gross Domestic Product (GDP);
other benefits (comfort of operation)
Energy consumption/use;adoption of appliances
(i) Changes in enterprise: Changes in productivity, quality, cost of production, prices, volumes of products, operating hours, employment; creation of new products or services
(ii) Creation of new enterprises
Figure 2: Macro-Level Correlation Between Electricity and Human Development
00 2000
Electricity per capita (kWh/capita)
4000 6000 8000
0,1
0,2
0,3
0,4
0,5
0,6
0,7
0,8
0,9
1
HDI
Low HumanDevelopment
Medium HumanDevelopment
High HumanDevelopment
Incr
ease
in e
nerg
y de
man
d

23
A common methodological framework to research the electricity-development link is the production func-tion. Within the framework of the production function, the impact of electricity on (aggregate) output is usu-ally modelled in two main ways: firstly, directly when electricity services enter production as an additional input and secondly, indirectly when they raise total factor productivity by reducing transaction and other costs, thus allowing a more efficient use of conventional productive inputs (Straub 2008a). Examples for such indirect effects of electricity infrastructure are: (i) well-maintained infrastructure may reduce operating costs of private capital or extend its life span, such as machines connected to stable voltage lines, (ii) high-quality infrastructure can reduce private adjustment costs to unreliable electricity services, e.g. investments in power back-up systems, (iii) it can increase labour productivity, e.g. through a more efficient structuring of business processes as a result of improved information and communication technology. It is important to point out, that adverse effects of investments in electricity infrastructure may also occur, e.g. when public investment crowds out private investment.
4. Macro-Level Research
4.1. Introduction
The macro-level literature analysing the link between electricity and economic development so far remains limited, as the ‘mainstream’ economic literature on growth and development pays little attention to the role of energy (Estache 2010). There are, however, a number of studies from the field of energy economics that look at the causal relationship between energy consumption and economic growth. A second distinct body of literature, as mentioned in the section above on methodological issues, focuses on investigating the impacts of infrastructure investments on a variety of development outcomes (such as growth, productivity or poverty reduction). Most of these studies include energy infrastructure as one variable of interest.13
In the context of the aforementioned body of literature, it will be of interest to not only look at the direct im-pacts of energy infrastructure on different development outcomes, but also to analyse its impact compared with other publicly provided infrastructure services. Such an assessment will be relevant from a policy per-spective as it allows policy makers to better evaluate and prioritise different types of investments in order to allocate public funds as efficiently as possible.
4.2. Empirical Evidence
This section surveys the empirical evidence on the impact of electricity on different development outcomes, manifested in three broad categories of impacts: productivity, growth and poverty.
Impacts on Productivity
The literature examining the development impact of infrastructure, most of which includes electricity infra-structure as one variable of interest, started with the seminal work of Aschauer (1989). He finds that the stock of public infrastructure capital – including electricity – is a significant determinant of aggregate total factor productivity (TFP). His results suggest that infrastructure played an important role in the ‘productivity slow-down’ in the U.S. which started around 1973. Earlier studies exploring this phenomenon had ignored the role of infrastructure and focused on other factors such as energy prices or R&D (Gramlich 1994). Critics of Aschauer’s
12) Regression analysis is a method for numerical data analysis where the relationship among the variables in a data set is summarised as
an equation. In this equation the variable of interest, or the dependent variable, is expressed as a function of one or several explanatory
variables.
13) Infrastructure typically includes energy, transport, telecommunications, water, irrigation and sanitation.

24
work pointed out that the economic significance of his results was considered implausibly large and that he failed to address several methodological issues.14 Later studies applied more sophisticated econometric tech-niques to correct for these methodological problems (see Gramlich 1994, Romp and de Haan 2005 and Estache and Fay 2009 for an overview of these studies).
Table 1 summarises the studies reviewed in this section, which look at electricity as a variable of interest next to other infrastructure services like transport and telecommunications. Different electricity indicators are employed, including electricity generation, electricity generation capacity and investment in electricity infra-structure. The overall effect of electricity on productivity varies across countries. Positive effects of electricity on productivity are found in various geographic areas (Fedderke and Bogetic 2006, Noumba Um, Straub and Vellutini 2009), while only insignificant or even negative impacts also emerge for some other regions (Fan, Zhang and Zhang 2002, Fan, Hazell and Thorat 1999, Straub, Vellutini and Warlters 2008). The evidence also shows that in some countries such as China, India and Thailand electricity displays a smaller productivity effect than other infrastructure investments, notably agricultural research and development.
14) The most important issue concerned the potential of reverse causation from public capital to productivity and output. Neglect of this
potential endogeneity is likely to cause an upward bias in the estimated returns to infrastructure (Romp and de Haan 2005).
Source Country/ Region Output Indicator(s) Conclusion
Edquist and Henrekson (2006)
Germany, Sweden, UK, US
Rate of productivity growth
Productivity growth occurs with a distinct time lag following electrification (about 40–50 years for electrification and the ICT revolution and about 140 years for the steam engine). No clear evidence of high productivity growth rates for both electric machinery industry and the steam engine producing industry was found.
Fan, Hazell and Thorat (1999)
India Agricultural productivity
Additional government spending on rural electrification has low productivity effects. Government expenditure on rural roads and agricultural research and extension promote greatest growth in agricultural productivity.
Fan, Jitsuchon and Methakunnavut (2004)
Thailand Agricultural labour productivity
Investments in rural electrification have the second largest impact on agricultural productivity growth after agricultural research and development.
Fan, Zhang and Zhang (2002)
China Agricultural productivity
No significant effect of electricity on agricultural productivity. Agricultural research has largest effect on productivity.
Fedderke and Bogetic (2006)
South Africa Labour productivity and TFP growth
Electricity generation is positively related to labour productivity and TFP growth.
Noumba Um, Straub and Vellutini (2009)
North Africa and Middle East
TFP Electricity production helps explain cross-country differences in TFP growth.
Straub, Vellutini and Warlters (2008)
East Asia TFP growth No significant contribution of electricity generating capacity. Indonesia (as a relatively poor country) is the only exception and shows negative impacts.
Table 1: Effects of Infrastructure and Energy on Productivity
Sour
ce: a
dapt
ed fr
om P
inst
rup-
Ande
rsen
and
Shim
okaw
a (2
007)

25
Impacts on Growth
The literature on electricity and growth can be split into (a) the energy economics literature analysing the causal relationship between electricity consumption and growth and (b) the literature on infrastructure and development which often includes electricity infrastructure as a variable of interest. Studies in the first cate-gory, which analyse the relationship between electricity consumption and GDP growth, produce conflicting results in terms of the existence and direction of causality between the two variables. This conclusion is drawn by Ozturk (2010) who has undertaken an extensive review of this body of literature of more than a hundred studies from a wide range of countries, including both country-specific and multi-country analyses, covering the period 1978 to 2009 and applying a variety of methodological approaches. Ozturk distinguishes between four types of relationships: no causality, uni-directional causality running from economic growth to electricity consumption, uni-directional causality running from electricity to growth and bi-directional cau-sality between economic growth and electricity consumption.
With regard to methodology, Ozturk suggests in line with Karanfil (2009) that researchers should use more appropriate econometric techniques in the future, as the methods most often applied to date are of limited value with regard to the issue in question. The traditional methods (i.e. ordinary least squares) will not yield the required insight but rather increase the number of conflicting results and cast doubt on the reliability of their policy recommendations. A number of recent studies have sought to apply more comprehensive econo-metric techniques and address key methodological issues. For instance, in his study on the nexus between electricity supply, employment and real GDP in India, Gosh (2009) makes a case for electricity supply being a more meaningful indicator than electricity demand in countries with high levels of non-technical transmis-sion and distribution losses (e.g. as a result of theft or pilferage of electricity), as the use of official data may lead to a systematic underestimation of real electricity consumption. Next to findings in relation to employ-ment effects of electricity, the author establishes short-run causality running from growth to electricity supply (based on use of electric appliances in the industrial, commercial and domestic end-use sectors) but finds no causality running from electricity supply to real GDP.
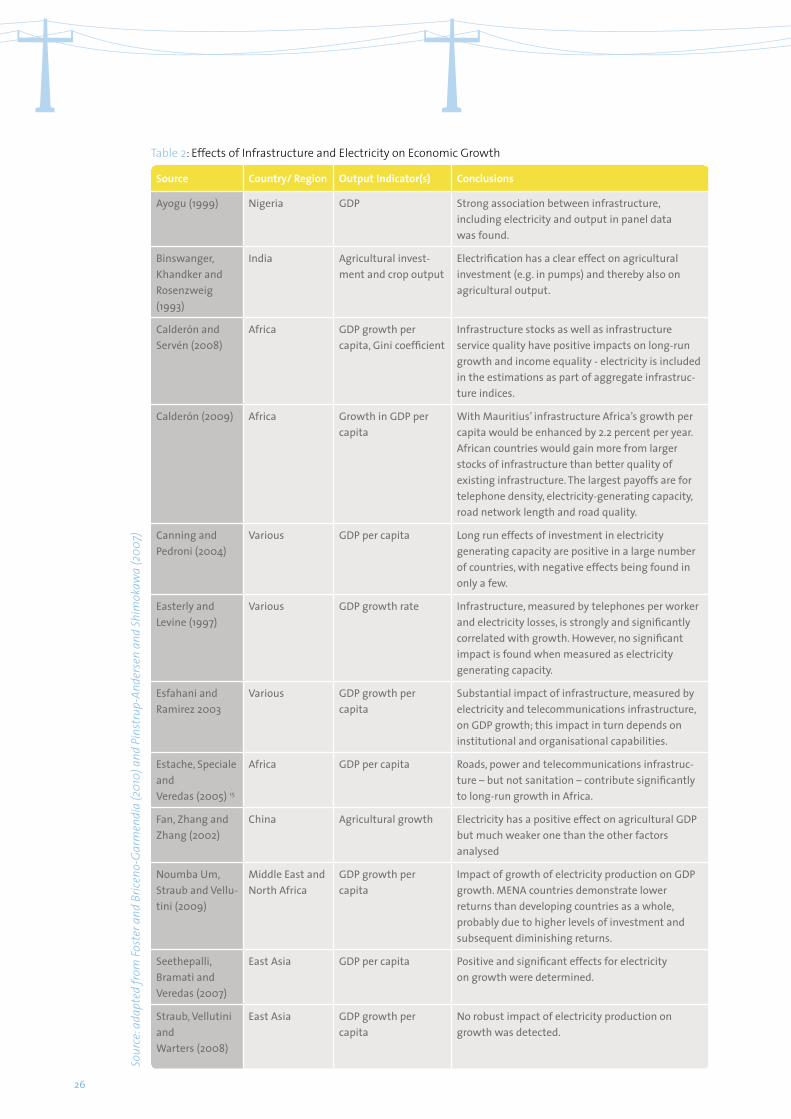
The second category of studies that examine the electricity-growth-nexus, i.e. those that try to quantify the contribution of different kinds of infrastructure to income and growth, find mostly positive effects of electric-ity on economic growth. In a recent survey of the literature on infrastructure and growth in Africa, Foster and Briceno-Garmendia (2010), conclude that there are strong indications of a positive impact of infrastructure on growth. Several of the reviewed studies include electricity in their estimations and show a beneficial growth effect of electricity (e.g. Ayogu 1999, Calderón and Servén 2008, Estache, Speciale and Veredas 2005).
Table 2 summarises a number of empirical studies that examine the effects of electricity infrastructure on growth.
As can be seen from the table, only a few studies report relatively small impacts of electricity compared to other infrastructure investments (Fan, Zhang and Zhang 2002) or fail to find significant impact of electricity on growth (Straub, Vellutini and Warlters 2008). Despite the evidence pointing towards positive growth effects of electricity infrastructure, some authors suggest to interpret such results with caution. For instance, Straub, Vellutini and Warlters (2008) state that results from aggregate macro-level data should generally be interpreted with care. They point out that the primary function of infrastructure investments may not be to directly promote economic growth but rather relieve constraints and bottlenecks to growth as they arise. Other authors such as Ayogu (2007) voice more fundamental concerns about the infrastructure-growth literature. Ayogu conducts an extensive review of the empirical literature and he concludes that the question of whether infrastructure matters for growth has not been satisfactorily resolved. Moreover, in his view this is only a marginally important issue, ’way beyond what could be the value added from totally resolving the issue’. Instead, the author proposes to focus future research efforts on much more relevant policy issues, such as analysing how much infrastructure matters exactly in different contexts.
26
Source Country/ Region Output Indicator(s) Conclusions
Ayogu (1999) Nigeria GDP Strong association between infrastructure, including electricity and output in panel data was found.
Binswanger, Khandker and Rosenzweig (1993)
India Agricultural invest-ment and crop output
Electrification has a clear effect on agricultural investment (e.g. in pumps) and thereby also on agricultural output.
Calderón and Servén (2008)
Africa GDP growth per capita, Gini coefficient
Infrastructure stocks as well as infrastructure service quality have positive impacts on long-run growth and income equality - electricity is included in the estimations as part of aggregate infrastruc-ture indices.
Calderón (2009) Africa Growth in GDP per capita
With Mauritius’ infrastructure Africa’s growth per capita would be enhanced by 2.2 percent per year. African countries would gain more from larger stocks of infrastructure than better quality of existing infrastructure. The largest payoffs are for telephone density, electricity-generating capacity, road network length and road quality.
Canning and Pedroni (2004)
Various GDP per capita Long run effects of investment in electricity generating capacity are positive in a large number of countries, with negative effects being found in only a few.
Easterly and Levine (1997)
Various GDP growth rate Infrastructure, measured by telephones per worker and electricity losses, is strongly and significantly correlated with growth. However, no significant impact is found when measured as electricity generating capacity.
Esfahani and Ramirez 2003
Various GDP growth per capita
Substantial impact of infrastructure, measured by electricity and telecommunications infrastructure, on GDP growth; this impact in turn depends on institutional and organisational capabilities.
Estache, Speciale and Veredas (2005) 15
Africa GDP per capita Roads, power and telecommunications infrastruc-ture – but not sanitation – contribute significantly to long-run growth in Africa.
Fan, Zhang and Zhang (2002)
China Agricultural growth Electricity has a positive effect on agricultural GDP but much weaker one than the other factors analysed
Noumba Um, Straub and Vellu-tini (2009)
Middle East and North Africa
GDP growth per capita
Impact of growth of electricity production on GDP growth. MENA countries demonstrate lower returns than developing countries as a whole, probably due to higher levels of investment and subsequent diminishing returns.
Seethepalli, Bramati and Veredas (2007)
East Asia GDP per capita Positive and significant effects for electricity on growth were determined.
Straub, Vellutini and Warters (2008)
East Asia GDP growth per capita
No robust impact of electricity production on growth was detected.
Table 2: Effects of Infrastructure and Electricity on Economic GrowthSo
urce
: ada
pted
from
Fost
er a
nd B
ricen
o-Ga
rmen
dia
(201
0) a
nd P
inst
rup-
Ande
rsen
and
Shim
okaw
a (2
007)

27
Sour
ce: a
dapt
ed fr
om P
inst
rup-
Ande
rsen
and
Shim
okaw
a (2
007)
15) It should be noted that the reliability of this finding is questionable because the control group of non-electrified households was very
small (31 households, compared to 1,012 electrified households) and the authors
Impacts on Poverty
There are several empirical studies that focus on the question of whether increased electricity access actually benefits the poor or whether it tends to increase incomes of the upper income strata disproportionately. In this context it will be of interest to specifically compare the impact of energy infrastructure with the impact of other infrastructure services. This might allow policy makers to evaluate and prioritise infrastructure investments in order to allocate public funds as efficiently as possible.
A general observation from these studies is that electricity has a relatively small effect on poverty as com-pared to other infrastructure investments, notably roads. Table 3 provides an overview of the cited studies on the nexus between electricity infrastructure and poverty reduction.
Fan, Hazell and Thorat (1999), for example, using data for 1970 to 1993 from India, conclude that government spending should focus on rural roads and agricultural research and extension, as these types of investments have the greatest poverty impact (i.e. the number of people raised above the poverty line for each additional million rupees spent). Regarding rural electrification (as well as irrigation), they state that additional govern-ment spending has no discernible impact on poverty reduction.
One exception to these findings is a study by Fan, Jitsuchon and Methakunnavut (2004) on Thailand. Their results show that out of different types of public investments (agricultural R&D, irrigation, rural education, road infrastructure and electricity infrastructure), investments in rural electrification have the largest poverty reduction impacts. The authors suggest that this differing result is due to Thailand’s status as a middle- income country. They state that in lower-income countries returns from road investments usually are higher than from electricity or telecommunications. However, as Thailand had already invested heavily in rural roads, additional investments in roads will only yield diminishing returns. This can explain why in the case of Thai-land the returns on investment in electricity are higher than for investments in roads.
Table 3: Effects of Infrastructure on Poverty Reduction in Developing Countries
Source Country/ Region Output Indicator(s) Conclusions
Balisacan 2001 Philippines Proportion of the rural population living below the provincial poverty line
No significant effect of electricity access; roads have highest impact.
Fan, Hazell and Thorat (1999)
India Number of poor reduced per million rupees infrastructure investment
Additional government spending on rural electrification has no discernible impact on poverty reduction. Spending on roads has largest impact on poverty reduction, followed by agricultural research.
Fan, Jitsuchon, and Methakunnavut (2004)
Thailand Number of poor reduced per million bahts infrastructure investment
Among different public investments (agricultural R&D, irrigation, rural education, road infrastructure) invest-ments in rural electrification have the largest poverty reduction impacts.
Fan, Zhang and Zhang (2002)
China Number of poor reduced per 10,000 yuans infrastructure investment
Positive effects of infrastructure investments in rural electrification, which are however smaller than those of investments in rural education, agricultural research and roads.

28
5. Micro-Level Research
5.1. Introduction
As far as impacts of electrification on the micro-level are concerned, the empirical research has taken different methodological approaches, looking at different units of analysis. There are a number of energy-specific stud-ies and general enterprise surveys looking at various types of businesses (formal and informal, small and large) and household surveys analysing economic indicators such as income from home businesses among other impacts of electrification.
Impacts of electricity on the micro-level are often examined using the same indicators as on the macro-level (enterprise creation, business activity, firm productivity, employment, income (equality), gender and poverty reduction) and the conceptual framework of the second subchapter also applies here. The main difference lies in the level of aggregation.
Besides a key methodological weakness of macro-level research, very few micro-level studies so far go beyond showing correlations by attempting to employ rigorous methods that are suitable for proving electrification impacts on MSMEs by providing robust evidence for a causality between electrification and MSME performance.
This subchapter will first discuss which factors have been found to influence whether and how electricity impacts on enterprise performance emerge. It will then review the literature that provides evidence on impacts of electricity on enterprises, looking at different forms in which such impacts can be measured on the firm and household level: the creation of new businesses, productivity, employment, poverty and income of businesses and households.
5.2. Factors Influencing Impacts of Energy
The uptake of electricity (i.e. the decision for connection and the magnitude of kWh use) and the impacts of electricity use on MSMEs depend on various external and internal factors including access to markets (inter-national, national and local), company location, income levels in the local economy, quality of supply and financial as well as other assets of the entrepreneur/firm.
Using an adapted version of the Sustainable Livelihoods Framework, Kooijman-van Dijk (2008) distinguishes between financial, physical, human and social assets that influence an entrepreneur’s ability and willingness to connect to and use electricity. The same assets influence if/how electricity is used for productive activities which translate an electricity connection into economic benefits. She also differentiates between the strate-gies pursued by entrepreneurs who were forced to engage in a certain (non-farm) income-generating activity due to a lack of other opportunities (coping strategies) and those with a clear growth orientation (accumula-tion strategies).
Quality and reliability of electricity supply is an important factor both for the decision to connect and for the impact on MSME performance. In some countries the reliability is so low that electricity-reliant businesses have no choice but to invest in diesel generators if they want to maintain business operations at a minimum level of steadiness. Foster and Steinbuks (2009) estimate that generators owned by firms account for about 6 % of total installed generation capacity in Sub-Saharan Africa and up to 20 % in low-income countries. According to the World Bank’s Doing Business report, firms in low-income countries are affected by electricity supply interruptions on average 18 times in a typical month. The resulting workflow interruptions and the damage of sensitive electrical equipment such as computers caused by voltage fluctuations can curtail prof-its significantly. Business managers interviewed for the Doing Business project in the various countries esti-mated that losses due to electricity outages amount to an average of 3.2 % of annual sales and as much as 22.6 % in Malawi (World Bank 2010). Studies on the impact of unreliable power supply on firm productivity are reviewed in the subchapter ‘Impact on productivity’ below.
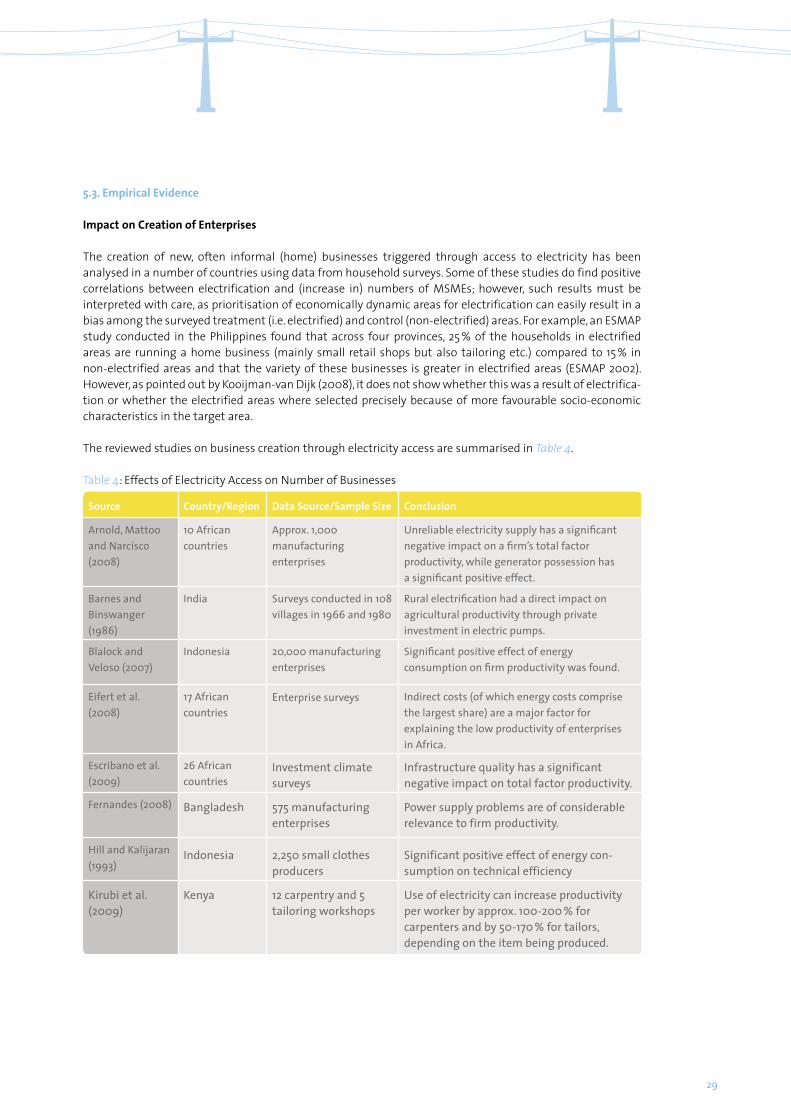
29
5.3. Empirical Evidence
Impact on Creation of Enterprises
The creation of new, often informal (home) businesses triggered through access to electricity has been analysed in a number of countries using data from household surveys. Some of these studies do find positive correlations between electrification and (increase in) numbers of MSMEs; however, such results must be interpreted with care, as prioritisation of economically dynamic areas for electrification can easily result in a bias among the surveyed treatment (i.e. electrified) and control (non-electrified) areas. For example, an ESMAP study conducted in the Philippines found that across four provinces, 25 % of the households in electrified areas are running a home business (mainly small retail shops but also tailoring etc.) compared to 15 % in non-electrified areas and that the variety of these businesses is greater in electrified areas (ESMAP 2002). However, as pointed out by Kooijman-van Dijk (2008), it does not show whether this was a result of electrifica-tion or whether the electrified areas where selected precisely because of more favourable socio-economic characteristics in the target area.
The reviewed studies on business creation through electricity access are summarised in Table 4.
Table 4: Effects of Electricity Access on Number of Businesses
Source Country/Region Data Source/Sample Size Conclusion
Arnold, Mattoo and Narcisco (2008)
10 African countries
Approx. 1,000 manufacturing enterprises
Unreliable electricity supply has a significant negative impact on a firm’s total factor productivity, while generator possession has a significant positive effect.
Barnes and Binswanger (1986)
India Surveys conducted in 108 villages in 1966 and 1980
Rural electrification had a direct impact on agricultural productivity through private investment in electric pumps.
Blalock and Veloso (2007)
Indonesia 20,000 manufacturing enterprises
Significant positive effect of energy consumption on firm productivity was found.
Eifert et al. (2008)
17 African countries
Enterprise surveys Indirect costs (of which energy costs comprise the largest share) are a major factor for explaining the low productivity of enterprises in Africa.
Escribano et al. (2009)
26 African countries
Investment climate surveys
Infrastructure quality has a significant negative impact on total factor productivity.
Fernandes (2008) Bangladesh 575 manufacturing enterprises
Power supply problems are of considerable relevance to firm productivity.
Hill and Kalijaran (1993)
Indonesia 2,250 small clothes producers
Significant positive effect of energy con-sumption on technical efficiency
Kirubi et al. (2009)
Kenya 12 carpentry and 5 tailoring workshops
Use of electricity can increase productivity per worker by approx. 100-200 % for carpenters and by 50-170 % for tailors, depending on the item being produced.
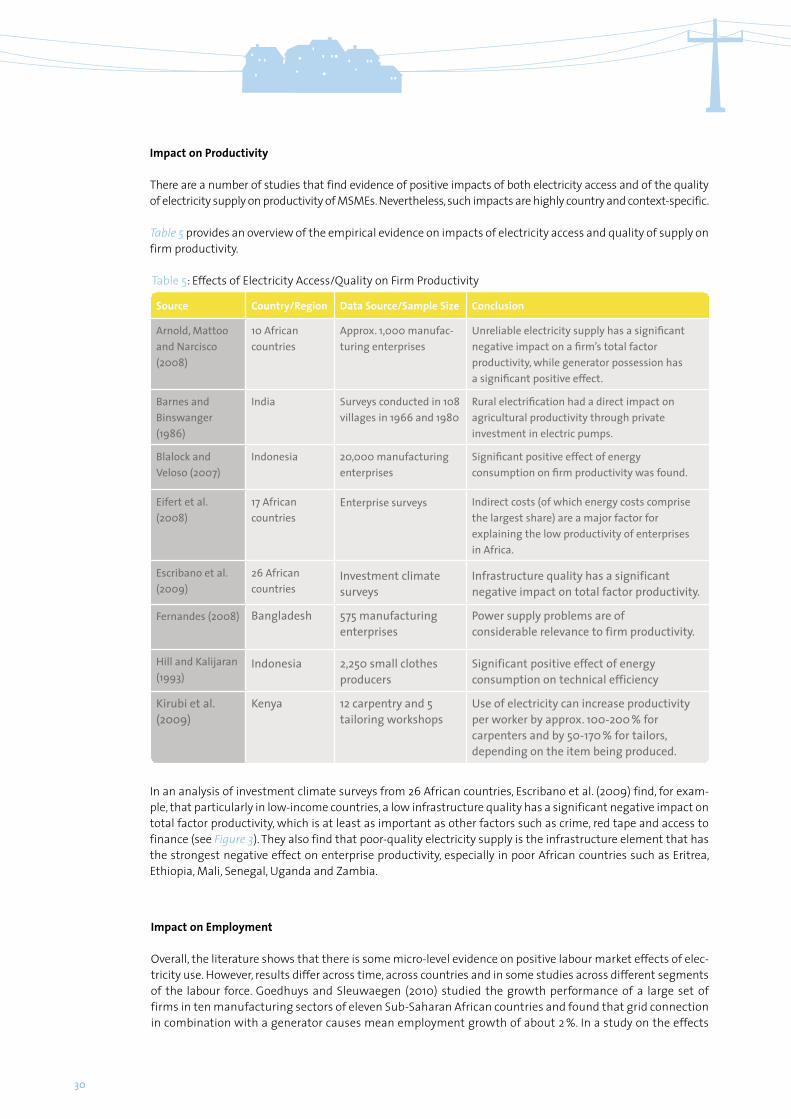
30
Impact on Productivity
There are a number of studies that find evidence of positive impacts of both electricity access and of the quality of electricity supply on productivity of MSMEs. Nevertheless, such impacts are highly country and context-specific.
Table 5 provides an overview of the empirical evidence on impacts of electricity access and quality of supply on firm productivity.
In an analysis of investment climate surveys from 26 African countries, Escribano et al. (2009) find, for exam-ple, that particularly in low-income countries, a low infrastructure quality has a significant negative impact on total factor productivity, which is at least as important as other factors such as crime, red tape and access to finance (see Figure 3). They also find that poor-quality electricity supply is the infrastructure element that has the strongest negative effect on enterprise productivity, especially in poor African countries such as Eritrea, Ethiopia, Mali, Senegal, Uganda and Zambia.
Table 5: Effects of Electricity Access/Quality on Firm Productivity
Source Country/Region Data Source/Sample Size Conclusion
Arnold, Mattoo and Narcisco (2008)
10 African countries
Approx. 1,000 manufac-turing enterprises
Unreliable electricity supply has a significant negative impact on a firm’s total factor productivity, while generator possession has a significant positive effect.
Barnes and Binswanger (1986)
India Surveys conducted in 108 villages in 1966 and 1980
Rural electrification had a direct impact on agricultural productivity through private investment in electric pumps.
Blalock and Veloso (2007)
Indonesia 20,000 manufacturing enterprises
Significant positive effect of energy consumption on firm productivity was found.
Eifert et al. (2008)
17 African countries
Enterprise surveys Indirect costs (of which energy costs comprise the largest share) are a major factor for explaining the low productivity of enterprises in Africa.
Escribano et al. (2009)
26 African countries
Investment climate surveys
Infrastructure quality has a significant negative impact on total factor productivity.
Fernandes (2008) Bangladesh 575 manufacturing enterprises
Power supply problems are of considerable relevance to firm productivity.
Hill and Kalijaran (1993)
Indonesia 2,250 small clothes producers
Significant positive effect of energy consumption on technical efficiency
Kirubi et al. (2009)
Kenya 12 carpentry and 5 tailoring workshops
Use of electricity can increase productivity per worker by approx. 100-200 % for carpenters and by 50-170 % for tailors, depending on the item being produced.
Impact on Employment
Overall, the literature shows that there is some micro-level evidence on positive labour market effects of elec-tricity use. However, results differ across time, across countries and in some studies across different segments of the labour force. Goedhuys and Sleuwaegen (2010) studied the growth performance of a large set of firms in ten manufacturing sectors of eleven Sub-Saharan African countries and found that grid connection in combination with a generator causes mean employment growth of about 2 %. In a study on the effects
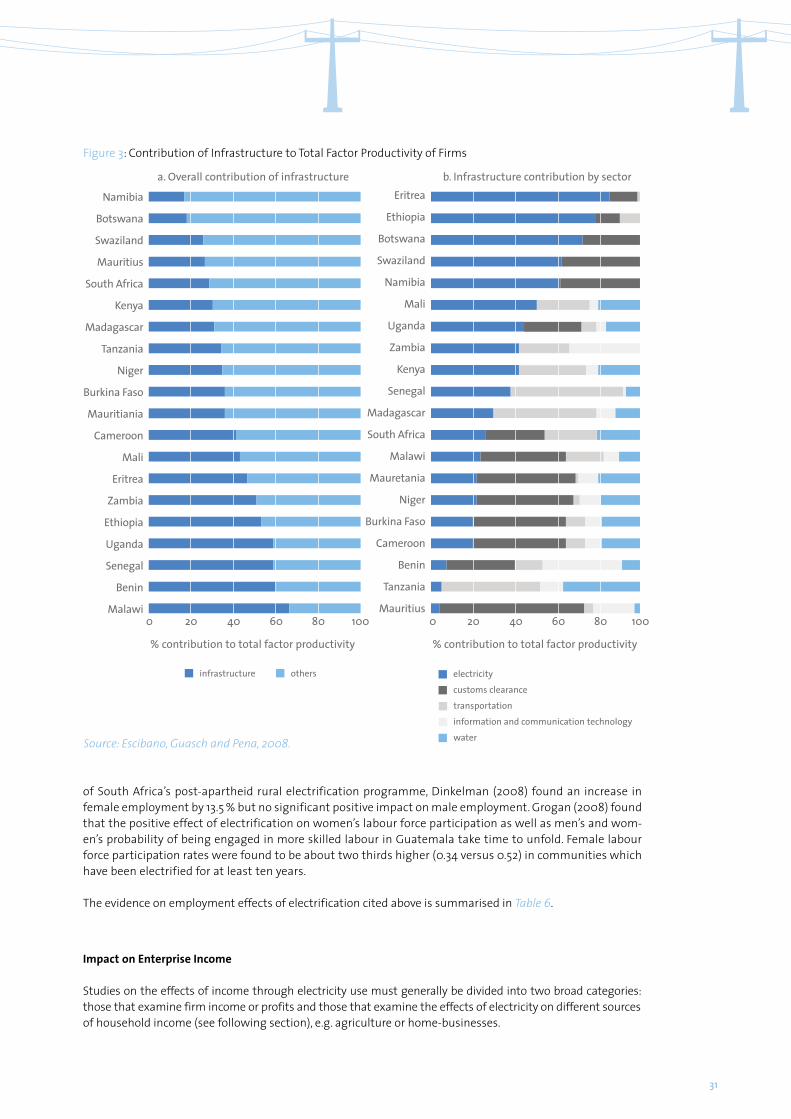
31
of South Africa’s post-apartheid rural electrification programme, Dinkelman (2008) found an increase in female employment by 13.5 % but no significant positive impact on male employment. Grogan (2008) found that the positive effect of electrification on women’s labour force participation as well as men’s and wom-en’s probability of being engaged in more skilled labour in Guatemala take time to unfold. Female labour force participation rates were found to be about two thirds higher (0.34 versus 0.52) in communities which have been electrified for at least ten years.
The evidence on employment effects of electrification cited above is summarised in Table 6.
Figure 3: Contribution of Infrastructure to Total Factor Productivity of Firms
Namibia
Botswana
Swaziland
Mauritius
South Africa
Kenya
Madagascar
Tanzania
Niger
Burkina Faso
Mauritiania
Cameroon
Mali
Eritrea
Zambia
Ethiopia
Uganda
Senegal
Benin
Malawi
Eritrea
Ethiopia
Botswana
Swaziland
Namibia
Mali
Uganda
Zambia
Kenya
Senegal
Madagascar
South Africa
Malawi
Mauretania
Niger
Burkina Faso
Cameroon
Benin
Tanzania
Mauritius
a. Overall contribution of infrastructure b. Infrastructure contribution by sector
Source: Escibano, Guasch and Pena, 2008.
0 020 2040 4060 6080 80100 100
% contribution to total factor productivity % contribution to total factor productivity
infrastructure electricity
information and communication technology
transportation
water
customs clearance
others
Impact on Enterprise Income
Studies on the effects of income through electricity use must generally be divided into two broad categories: those that examine firm income or profits and those that examine the effects of electricity on different sources of household income (see following section), e.g. agriculture or home-businesses.
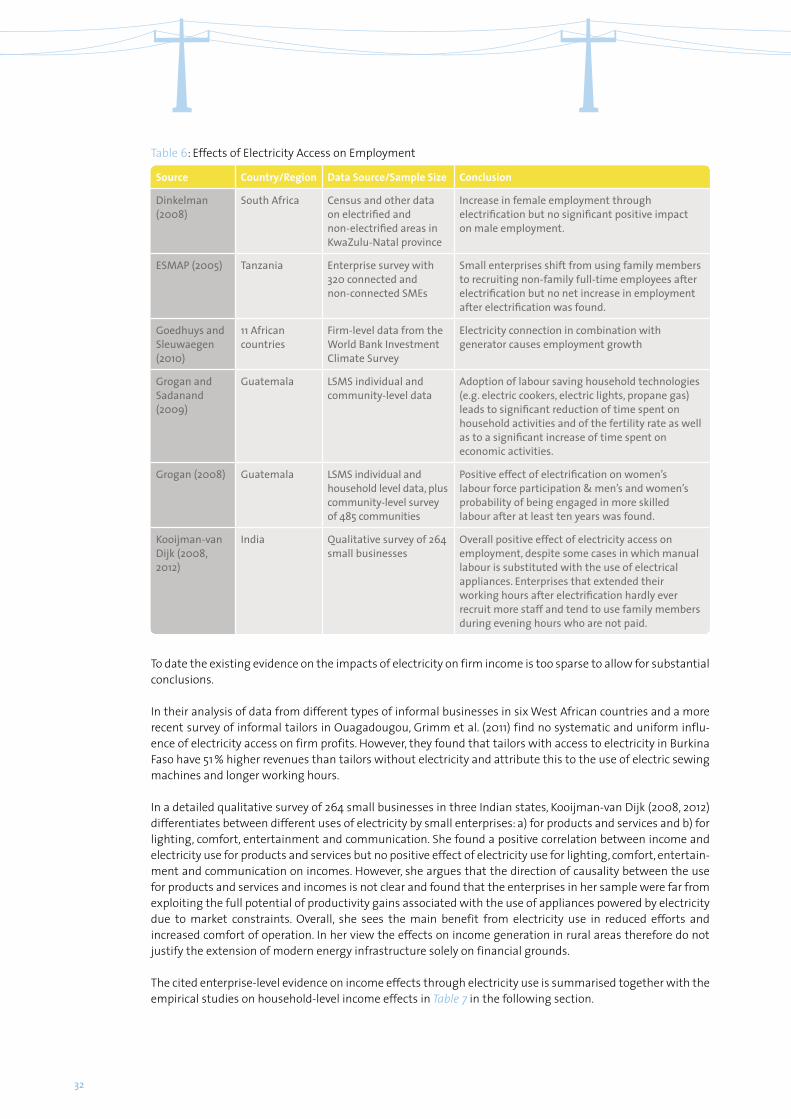
32
Table 6: Effects of Electricity Access on Employment
Source Country/Region Data Source/Sample Size Conclusion
Dinkelman (2008)
South Africa Census and other data on electrified and non-electrified areas in KwaZulu-Natal province
Increase in female employment through electrification but no significant positive impact on male employment.
ESMAP (2005) Tanzania Enterprise survey with 320 connected and non-connected SMEs
Small enterprises shift from using family members to recruiting non-family full-time employees after electrification but no net increase in employment after electrification was found.
Goedhuys and Sleuwaegen (2010)
11 African countries
Firm-level data from the World Bank Investment Climate Survey
Electricity connection in combination with generator causes employment growth
Grogan and Sadanand (2009)
Guatemala LSMS individual and community-level data
Adoption of labour saving household technologies (e.g. electric cookers, electric lights, propane gas) leads to significant reduction of time spent on household activities and of the fertility rate as well as to a significant increase of time spent on economic activities.
Grogan (2008) Guatemala LSMS individual and household level data, plus community-level survey of 485 communities
Positive effect of electrification on women’s labour force participation & men’s and women’s probability of being engaged in more skilled labour after at least ten years was found.
Kooijman-van Dijk (2008, 2012)
India Qualitative survey of 264 small businesses
Overall positive effect of electricity access on employment, despite some cases in which manual labour is substituted with the use of electrical appliances. Enterprises that extended their working hours after electrification hardly ever recruit more staff and tend to use family members during evening hours who are not paid.
To date the existing evidence on the impacts of electricity on firm income is too sparse to allow for substantial conclusions.
In their analysis of data from different types of informal businesses in six West African countries and a more recent survey of informal tailors in Ouagadougou, Grimm et al. (2011) find no systematic and uniform influ-ence of electricity access on firm profits. However, they found that tailors with access to electricity in Burkina Faso have 51 % higher revenues than tailors without electricity and attribute this to the use of electric sewing machines and longer working hours.
In a detailed qualitative survey of 264 small businesses in three Indian states, Kooijman-van Dijk (2008, 2012) differentiates between different uses of electricity by small enterprises: a) for products and services and b) for lighting, comfort, entertainment and communication. She found a positive correlation between income and electricity use for products and services but no positive effect of electricity use for lighting, comfort, entertain-ment and communication on incomes. However, she argues that the direction of causality between the use for products and services and incomes is not clear and found that the enterprises in her sample were far from exploiting the full potential of productivity gains associated with the use of appliances powered by electricity due to market constraints. Overall, she sees the main benefit from electricity use in reduced efforts and increased comfort of operation. In her view the effects on income generation in rural areas therefore do not justify the extension of modern energy infrastructure solely on financial grounds.
The cited enterprise-level evidence on income effects through electricity use is summarised together with the empirical studies on household-level income effects in Table 7 in the following section.
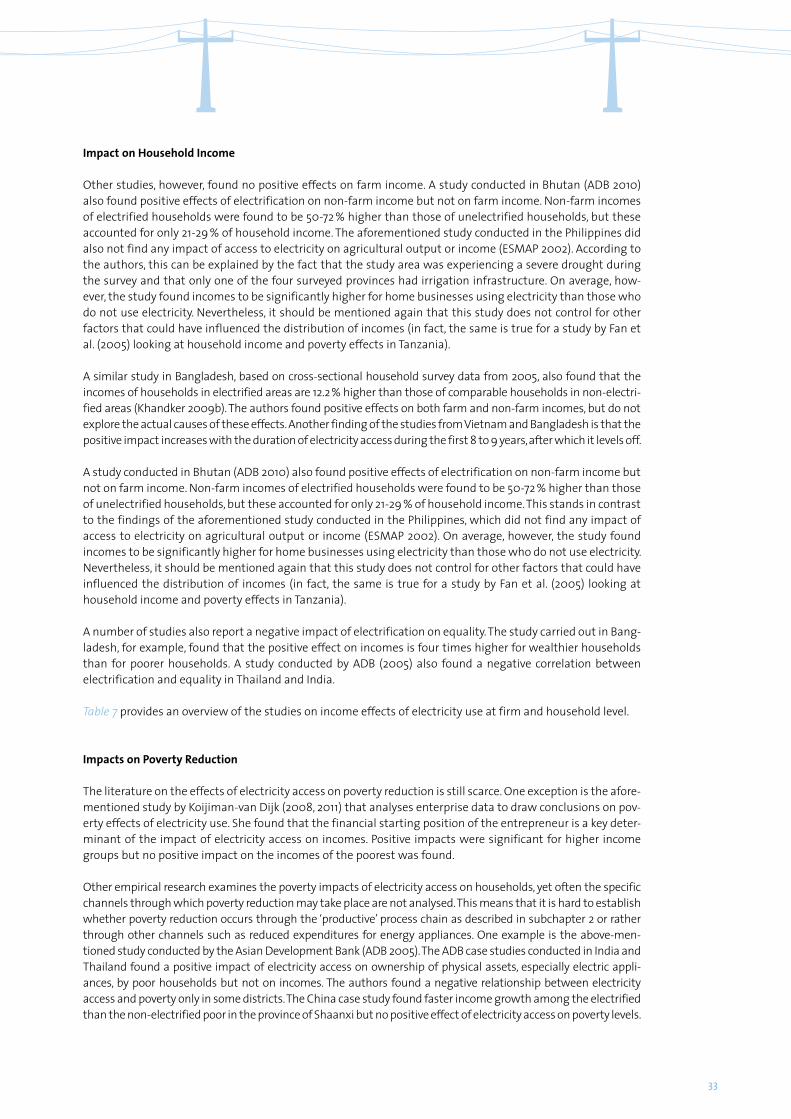
33
Impact on Household Income
Other studies, however, found no positive effects on farm income. A study conducted in Bhutan (ADB 2010) also found positive effects of electrification on non-farm income but not on farm income. Non-farm incomes of electrified households were found to be 50-72 % higher than those of unelectrified households, but these accounted for only 21-29 % of household income. The aforementioned study conducted in the Philippines did also not find any impact of access to electricity on agricultural output or income (ESMAP 2002). According to the authors, this can be explained by the fact that the study area was experiencing a severe drought during the survey and that only one of the four surveyed provinces had irrigation infrastructure. On average, how-ever, the study found incomes to be significantly higher for home businesses using electricity than those who do not use electricity. Nevertheless, it should be mentioned again that this study does not control for other factors that could have influenced the distribution of incomes (in fact, the same is true for a study by Fan et al. (2005) looking at household income and poverty effects in Tanzania).
A similar study in Bangladesh, based on cross-sectional household survey data from 2005, also found that the incomes of households in electrified areas are 12.2 % higher than those of comparable households in non-electri-fied areas (Khandker 2009b). The authors found positive effects on both farm and non-farm incomes, but do not explore the actual causes of these effects. Another finding of the studies from Vietnam and Bangladesh is that the positive impact increases with the duration of electricity access during the first 8 to 9 years, after which it levels off.
A study conducted in Bhutan (ADB 2010) also found positive effects of electrification on non-farm income but not on farm income. Non-farm incomes of electrified households were found to be 50-72 % higher than those of unelectrified households, but these accounted for only 21-29 % of household income. This stands in contrast to the findings of the aforementioned study conducted in the Philippines, which did not find any impact of access to electricity on agricultural output or income (ESMAP 2002). On average, however, the study found incomes to be significantly higher for home businesses using electricity than those who do not use electricity. Nevertheless, it should be mentioned again that this study does not control for other factors that could have influenced the distribution of incomes (in fact, the same is true for a study by Fan et al. (2005) looking at household income and poverty effects in Tanzania).
A number of studies also report a negative impact of electrification on equality. The study carried out in Bang-ladesh, for example, found that the positive effect on incomes is four times higher for wealthier households than for poorer households. A study conducted by ADB (2005) also found a negative correlation between electrification and equality in Thailand and India.
Table 7 provides an overview of the studies on income effects of electricity use at firm and household level.
Impacts on Poverty Reduction
The literature on the effects of electricity access on poverty reduction is still scarce. One exception is the afore-mentioned study by Koijiman-van Dijk (2008, 2011) that analyses enterprise data to draw conclusions on pov-erty effects of electricity use. She found that the financial starting position of the entrepreneur is a key deter-minant of the impact of electricity access on incomes. Positive impacts were significant for higher income groups but no positive impact on the incomes of the poorest was found.
Other empirical research examines the poverty impacts of electricity access on households, yet often the specific channels through which poverty reduction may take place are not analysed. This means that it is hard to establish whether poverty reduction occurs through the ‘productive’ process chain as described in subchapter 2 or rather through other channels such as reduced expenditures for energy appliances. One example is the above-men-tioned study conducted by the Asian Development Bank (ADB 2005). The ADB case studies conducted in India and Thailand found a positive impact of electricity access on ownership of physical assets, especially electric appli-ances, by poor households but not on incomes. The authors found a negative relationship between electricity access and poverty only in some districts. The China case study found faster income growth among the electrified than the non-electrified poor in the province of Shaanxi but no positive effect of electricity access on poverty levels.
34
Table 7: Effects of Electricity Use on Income at Firm and Household Level
Source Country/Region Data Source/Sample Size Conclusion
ADB (2005) India, Thailand India: survey of approx. 2,600 rural households,Thailand: survey of approx. 1,100 rural and urban households
Equity: Thailand: the degree of electricity access is negatively correlated with the incomes of poor households.India: income inequality in electrified villages is higher than in unelectrified villages.
ADB (2010) Bhutan 1,276 electrifiedand 822 unelectrified households
Access to electricity has a significant effect on nonfarm income.
ESMAP (2002)
Philippines Survey of approx. 28,000 domestic, commercial, industrial and irrigation units with and without electricity
Average incomes of home businesses using electricity are significantly higher than those who do not use electricity but no positive impact of electrification on incomes from agriculture was found.
ESMAP (2005)
Tanzania Enterprise survey of 320 connected and non-connected SMEs; focus groups
90 % of connected SMEs stated that their business income increased since electrification and 85 % of them stated that this can be attributed to the use of electricity. 80 % of focus group discussants stated that the volume of their business and the number of clients had grown.
Fan et al. (2005)
Tanzania Household Budget Survey (HBS) of approx. 22,000 households; Multistage; stratified sample
Access to electricity significantly increases household income in all zones.
Grimm et al. (2011)
6 African countries
Survey of 5,409 informal enterprises and 248 informal tailors
No systematic and uniform influence of electricity access on enterprise performance across different types of businesses found, but significant influence on tailors.
Grogan (2008)
Guatemala LSMS individual and household level data, plus community-level survey of 485 communi-ties
Positive effects of electrification on women’s incomes increase over time. Women in communities which have been electrified more than 10 years ago earn about 4 times more than women in more recently electrified communities. However, there is no such effect on men’s incomes.
Khandker (2009a)
Vietnam Panel survey data (2002 and 2005) from 1,100 rural households
Grid electrification increased household incomes by at least 25 %; strong increase in farm income but hardly any effect on non-farm income.
Khandker (2009b)
Bangladesh Cross-sectional survey of approx. 20,000 rural households
Incomes of households in electrified areas are 12.2 % higher than those of comparable households in non-electrified areas, positive effects on both farm and non-farm incomes.Equity: positive effect on incomes is four times higher for wealthier households than for poorer households.
Kooijman-van Dijk (2008, 2012)
India Qualitative survey of 264 small businesses
Positive correlation between electricity use for products and services and incomes, but causality is not clear.
UNDP (2011) Nepal Household survey conducted in communi-ties with and without access to electricity from micro-hydropower schemes
Significantly higher incomes in villages served by micro-hydropower schemes was found; electricity access explains about 30 % of the increase.

35
A study on the impact of electrification in Ethiopia (Bernard et al. 2009) took differences in household ex-penditure as a proxy for poverty levels and found no significant positive effect. This stands in contrast to the aforementioned study on the impact of different forms of public investments in Tanzania (Fan et al. 2005), which did find a positive impact of electrification on poverty reduction and it concludes that a 1 % increase in the electrification rate would lift approx. 140,000 people out of poverty.
Micro-Level Evidence – Other Issues
Nexus between improved lighting and enterprise performance
For many small enterprises especially in rural areas the first and main use of electricity is lighting. Enterprises switching from traditional forms of lighting such as candles and kerosene lamps to electric light obtain a better lighting service - as measured in lumen hours consumed - at a lower price per unit (ESMAP 2002). In addition, electric lighting is more convenient and less risky in terms of negative health effects from indoor air pollution and fire accidents than conventional alternatives.16 Certain businesses such as electric repair shops require high-quality light even during daytime, while others use electric light only to extend business hours during times of peak demand or to improve the appearance of their shop (Kooijman-van Dijk 2008).
Numerous studies state that access to electric light by small businesses leads to longer operating hours which in turn leads to increased income by these businesses. For example, informal tailors with access to electricity in Burkina Faso were found to work around 17 % or four labour hours more per day than their coun-terparts without access (Grimm et al. 2001). Similarly, service sector MSMEs using solar home systems (SHS) in rural Uganda work for approx. 1 hour longer, attract more customers and their monthly profits are approx. 8 US $ higher than a comparable group of matched businesses in a control region (GTZ 2009).
While the link between access to electric light, longer operating hours and increased income is often taken for granted, an overall positive impact cannot always be proven. For many small businesses in rural areas, it does not make sense to operate at night, if there is no specific demand for their products/services during evening hours and the market cannot absorb an increased output. Accordingly, the Uganda study therefore concludes that whether it pays off for an enterprise to invest in a SHS or not is a question of the economic sector in which the firm operates. The study found that overall, rural manufacturing enterprises – which usually cannot realise higher sales or profits by extending operating hours beyond day-time, are less likely to invest in electric lighting
Table 8: Effects of Electricity Use on Poverty
Source Country/Region Data source/Sample Size Conclusion
ADB (2005) China, India, Thailand
China: panel survey data of 1,143 households, field survey of 624 householdsIndia: survey of approx. 2,600 rural households;Thailand: survey of approx. 1,100 rural and urban households
China: faster income growth among the electrified than the non-electrified poor in the province of Shaanxi, no positive effect of electricity on poverty levels was found.India and Thailand: positive impact of electricity access on ownership of electric appliances by poor households but not on incomes was found.
Bernard et al. (2009)
Ethiopia Survey of 800 households No significant effect of electrification on changes in household expenditure
Fan et al. (2005)
Tanzania Household Budget Survey (HBS) of approx. 22,000 households; multi-stage, stratified sample
1 % increase in the electrification rate would lift approx. 140,000 people out of poverty.
Koijiman-van Dijk (2011)
India Qualitative survey of 264 small businesses
Low uptake of electricity for production of goods and services among low-income entrepreneurs was found. Substantial share of enterprises with low income despite productive use of electricity were identified, but direction of causality not clear.
16) See Cabraal et al. (2005) for a summary of the benefits of improved lighting.
36
as compared to service providers such as retail shops (GTZ 2009). This is because there is a demand for their services at night when customers are home from work and better light enables them to attract more customers. However, this may come at the expense of their competitors using traditional lighting, so at village/regional level the net effect of electricity use by entrepreneurs on overall income levels may amount to zero.
Bundling access to electricity with complementary services
Some authors argue that a targeted ‘bundling’ of electricity access and other services such as BDS and micro-credits could improve the impact of electrification programmes (Motta and Reiche 2001, Peters et al. 2009).
Escobal (2005) analyses the impact of rural infrastructure investment on market development for the enhancement of income generation opportunities for the poor in rural Peru. Based on regional time series data and data from national household surveys he finds that the benefits of particular investments in rural infrastructure (roads, electricity, telecommunication, water or sanitation services) in terms of growth in rural incomes are significantly higher if they take place in combination with other infrastructure investments. Similarly, Barnes et al. (2002) found that the positive impact of access to electricity and education on nonfarm income can be amplified by 2.3 times if both services are delivered together. In their analysis of informal tailors in Burkina Faso, Grimm et al. (2011) found that access to electricity only exerts a significant positive impact on firm performance if these are not credit constrained.
6. Summary and Conclusion of the Literature Review
This chapter has reviewed the relevant empirical literature on the contribution of electricity to economic growth and development on the macro and micro-level. At both levels, the multitude of (often grey) literature is of very limited methodological quality. Drawing clear-cut conclusions is complicated further by the fact that the various studies look at different indicators, units of analysis and time frames and results vary from country to country.
(a) Macro-Level
At the macro-level, empirical research shows a modestly positive impact of electricity on productivity which seems to vary across countries. The literature on poverty reduction reports a relatively small impact of electric-ity compared to other infrastructure investments (most importantly roads). The empirical research on electricity and growth presents an ambiguous picture. The energy economics literature analysing the energy-growth nexus is generally inconclusive: there seems to be no consensus on the existence or the direction of causality between energy (or electricity) consumption and economic growth. The studies on infrastructure and growth report a mostly positive effect of electricity on economic growth.
(b) Micro-Level
The micro-level-literature on productive use impacts of electrification programmes is generally inconclusive. According to the research done so far, access to and use of electricity by MSMEs does not automatically lead to intended development results such as increased productivity, profits and income, and knowledge on the conditions under which this is the case are still sketchy.
There is some evidence that electricity access can lead to the creation of informal (sometimes home-based) and formal enterprises. However, more research applying rigorous methods to avoid/control for any selection bias would be needed to confirm this finding. A growing body of literature shows positive impacts of both electricity use and electricity quality on firm productivity. Nevertheless, the magnitude of such impacts is highly country and context-specific. Concerning the impact of electricity on business income it is hardly possible to draw any conclusions at this point, as the available literature is very thin. There are significantly more studies measuring effects on household income. In this case there seems to be an overall positive impact yet results vary, e.g. regarding gender differences or differences between farm and non-farm income. The micro-level evidence on employment effects, too, is not quite clear. While some studies report a signifi-

37
cant total increase in employment, others find that increased labour market participation is restricted to women or family members who are not paid. Regarding poverty reduction effects, the micro-level evidence does not yet provide a sound basis for the assumption that investing in electricity is an effective approach to lift people out of poverty. Overall, it seems that the full potential of the economic impact of electricity can only be exploited if certain necessary preconditions are fulfilled, such as a certain endowment with capital e.g. for investment in electric appliances and access to markets and transport infrastructure.
(c) What Are the Explanations for the Variation of Results?
For one, the immense variation across results of different studies is not surprising given the very distinct country contexts and stages of development from which the evidence originates (Estache and Fay 2009). Moreover, the different indicators that are employed to measure electricity input into the economic system as well as the different economic outcome indicators are an obvious source of differences in the emerging conclusions.
There are, however, also several empirical and methodological issues that underlie the variations in results: firstly, quality of electricity supply (and other infrastructure) is highly heterogeneous but rarely measured or described (World Bank 2010). Secondly, the quality and nature of the data analysed also differs enormously across studies. Most importantly, many studies do not control for endogeneity of the measured outcomes. Endogeneity can in turn have different origins, for instance, measurement error problems, potentially unob-served effects or omitted variables or reverse causality. The latter occurs, for example, when public capital (like electricity infrastructure) may affect productivity and output, and at the same time, economic growth can increase the demand and supply of energy services.
To allow for sound conclusions, these methodological issues need to be addressed through more sophisticated econometric techniques. Studies should not focus on detecting correlations between electricity input and develop-ment measures but test the direction, magnitude and significance of the causality. Other relevant methodological approaches are estimations of panel models or simultaneous equation models or the use of instrumental variables.
(d) Conclusion
Perhaps most importantly, most of the studies addressing the question of whether or how much electricity (or more generally infrastructure) matters for economic development, are often not relevant from a policy perspective (Ayogu 2007, Straub 2008a, Estache and Fay 2009). The relevant question for policy makers would be whether an optimal level of electricity provision can be identified in a specific context which could then serve to derive the corresponding investment and funding priorities.
Especially macro-level data is limited in this regard. Data at that level of aggregation cannot provide guidance on detailed investment decisions for particular projects (Straub 2008b). Micro-level data will allow for a better under-standing on how exactly other factors and complementary services such as BDS and access to financial services influence the economic impact of electricity. This is of particular concern for policy makers who need to under-stand how their policies on infrastructure interact and depend on policies relating to other sectors of the economy.
It can be concluded that rather than investing more money in macro-level research on the impact of electricity infrastructure on economic development, further micro-level research is needed to investigate the indirect chan-nels through which electricity enhances productive uses and improves livelihoods. In the energy sector, such micro-level research should comprise among others the role of complementary services such as BDS, financial and ICT services as well as other factors that create an enabling environment for the use of electricity for socio-economic development. Future micro-level research should also be extended to analyse impacts at levels beyond firm and household level (e.g. community, district, national, regional and international levels), since the impact on one level could have intended or unintended effects on another level. In addition, it should further explore poten-tial negative impacts on employment opportunities and inequalities. All this can only be done with rigorous qualitative and quantitative micro-level research methods, as highlighted above.
The PRODUSE study ‘Measuring Impacts of Electrification on Small Businesses in Sub-Saharan Africa’ attempts to contribute to a better understanding of some of these issues.

38

39
Chapter 3: Methodology By Jörg Peters and Colin Vance17

40
1. Potential Linkages between Electricity and Income Generation
The productive or income-generating use of electricity is seen as a promising way to contribute to poverty reduction. Micro-enterprises are frequently considered to be one of the main beneficiaries of electrification and, in turn, an important contributor to income generation – above all in rural communities. The empirical relationship between energy input and firm productivity, however, is mainly based on anecdotal evidence (Meadows 2003). This is particularly true for Sub-Saharan Africa where the relation has not yet been system-atically investigated (see Chapter 2 for a systematic literature review).
Theoretically, several transmission processes are possible through which improved electricity access might translate into higher income. This section briefly reviews these potential pathways, which, as displayed in Figure 4., are categorised by refrigeration, communication, motive power and lighting. Motive power is argu-ably the most important trigger for the generation of cash income given that mechanisation and automation typically allows achieving higher outputs at constant inputs.
The usage of electrical energy for lighting has several advantages compared to lighting with traditional fuels like kerosene lamps. Most importantly, electricity for lighting – unlike kerosene or petroleum – is delivered directly to the firm, is of higher quality and is much cheaper. This might render extended operating hours profitable. Furthermore, electric lights, fans, radio or television might attract additional customers.
In addition, firms can become more productive from electricity-based information and communication tech-nologies, which reduce information costs. Electricity also facilitates the preservation of goods via refrigeration devices and, thereby, might bring down the costs of such goods.
All these effects lead directly or indirectly to higher productivity in the sense that less input is needed to pro-duce the same output. This increased productivity might either lead to higher profits for the firm owner or higher incomes for workers. Electricity usage, thus, ultimately leads to income generation in the form of higher firm owner’s income, higher employment or higher wages. The following country studies examine employ-ment and wages as well as many intermediate outcomes such as lighting or machinery usage. The focus, however, is on owner’s income and in particular on profits as the major firm performance indicator.
2. The Treatment: Availability and Connection
The ultimate objective of this study is assessing the extent to which electricity affects income generation in micro-enterprises. In general terms, the evaluation literature refers to an intervention as the treatment. This section presents the different interpretations of electrification as a treatment. Furthermore, it illustrates the relation between the outcome variable firm profits18 and electrification as well as other input factors such as labour and capital.
Firm performance can be described by a standard production function f that determines firm’s profits Y as a function of electricity S and a vector of additional determinants X. This vector includes the complementary factors capital and labour.
Given the complementarity of these factors, an increase in, for example, energy infrastructure leads to higher productivity of the other factors.19
17) The authors are grateful for valuable comments and suggestions by Benjamin Attigah, Nadja Kabierski-Chakrabarti and Kilian Reiche.
18) The discussion in this section is essentially transferable to other outcome variables such as employment or wages.
19) See Straub (2008) for presentation of the general case of infrastructure in a production function.
Y = f(X,S) (1)
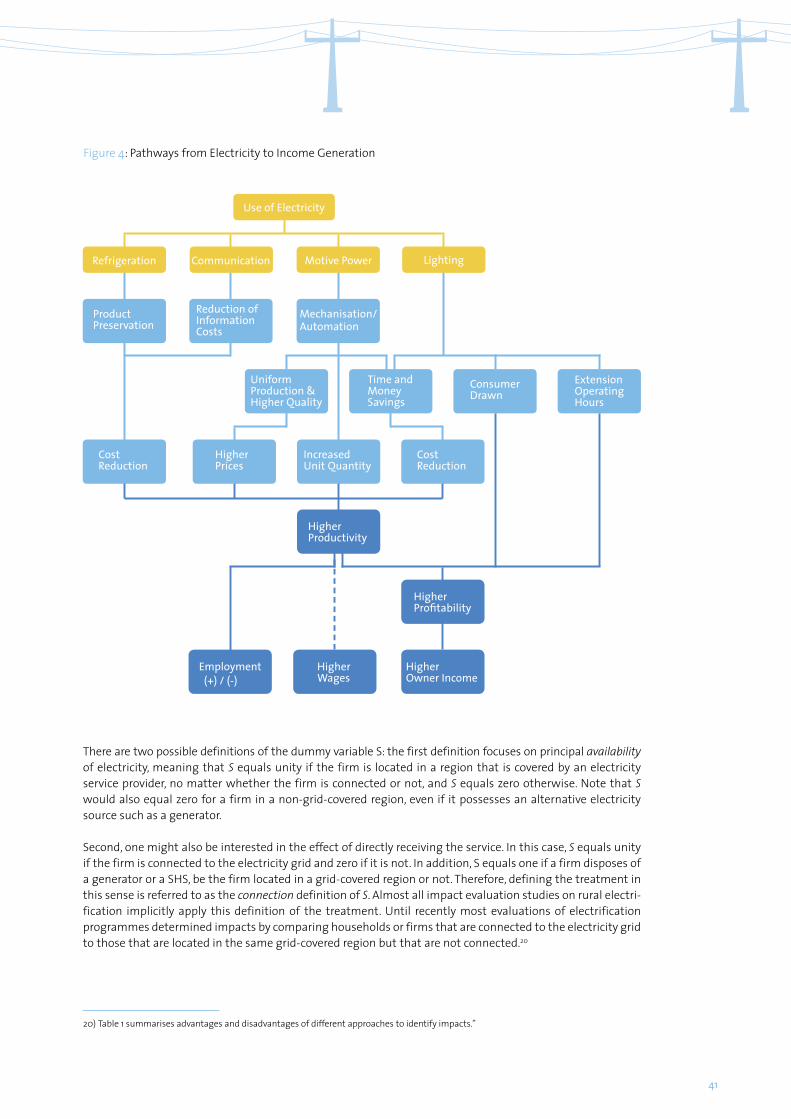
41
20) Table 1 summarises advantages and disadvantages of different approaches to identify impacts.”
Use of Electricity
Refrigeration Communication Motive Power Lighting
Product Preservation
Reduction of Information Costs
Uniform Production & Higher Quality
Cost Reduction
Cost Reduction
HigherProfitability
HigherOwner Income
HigherWages
Employment (+) / (-)
Time and Money Savings
HigherPrices
Consumer Drawn
IncreasedUnit Quantity
Higher Productivity
Extension Operating Hours
Mechanisation/ Automation
Figure 4: Pathways from Electricity to Income Generation
There are two possible definitions of the dummy variable S: the first definition focuses on principal availability of electricity, meaning that S equals unity if the firm is located in a region that is covered by an electricity service provider, no matter whether the firm is connected or not, and S equals zero otherwise. Note that S would also equal zero for a firm in a non-grid-covered region, even if it possesses an alternative electricity source such as a generator.
Second, one might also be interested in the effect of directly receiving the service. In this case, S equals unity if the firm is connected to the electricity grid and zero if it is not. In addition, S equals one if a firm disposes of a generator or a SHS, be the firm located in a grid-covered region or not. Therefore, defining the treatment in this sense is referred to as the connection definition of S. Almost all impact evaluation studies on rural electri-fication implicitly apply this definition of the treatment. Until recently most evaluations of electrification programmes determined impacts by comparing households or firms that are connected to the electricity grid to those that are located in the same grid-covered region but that are not connected.20
42
Two evaluation problems arise from these definitions of the treatment S. First, if S indicates the actual connec-tion to the electricity service, the causation expressed in (1) of S affecting Y may also run in the reverse direc-tion. Firms that perform better are more inclined to connect to the electricity grid. Therefore, we face a system of simultaneous equations consisting of (1) and
In other words, a firm’s decision pertaining to the connection to the grid depends on output and a vector of additional determinants Z, which may include the components of the vector X in (1). In addition, Z comprises firm-specific characteristics such as distance to the distribution grid or personal relations to the electricity util-ity’s staff. The main intuition behind (2) is straightforward: firms exhibiting a higher profit are more likely to have the funds to get a connection. This mutual relationship between the treatment and the outcome, commonly referred to as simultaneity, complicates the task of isolating the influence of firm connections on income.
If S=1 indicates availability of electricity, the simultaneity reflected in (2) does not apply on the firm level (because S is then not a choice variable from the individual firm’s perspective) but on community level. With respect to the decision on establishing a power grid, most rural electrification programmes take into account economic potential and ability-to-pay and, hence, typically resort to some measure of aggregate income. Thus, better-off communities are more likely to be electrified. At the same time, it can be expected that electrifica-tion also affects the income of the community.
A second evaluation problem occurs if components of Z are part of X and, in addition, unobservable. Consider the example of entrepreneurs that are more motivated or risk-taking. Because of these character traits, they might be more inclined to get a grid connection. At the same time, these generally unobservable characteris-tics certainly affect the outcome variable profit Y. Hence, differences in Y would be assigned to the connection S according to equation (1), even though they are in fact due to these unobservable differences in characteris-tics. This is commonly referred to as omitted variables or selection bias.
If S=1 designates availability of the grid, an omitted variables bias might arise from community characteristics that are both part of X and Z.21 One might imagine that, for example, smart local politicians affect the business environment and, hence, the individual income in a village. At the same time these politicians might be able to affect the probability that the national grid is extended to the village.
The self-conception of most rural electrification programmes is to provide access to electricity for the whole community, not only individual households or firms. While, as a matter of course, direct benefits to the firms that get connected to the grid are intended, the programmes typically also aim at generating benefits for those firms that do not get connected themselves. In fact, non-connected firms might benefit from, for exam-ple, using electricity at their neighbours or other firms. Likewise, they might suffer because connected firms now have a competitive advantage and attract more customers. In contrast to the application of the connec-tion definition, applying the availability definition takes such spillover effects into account.
3. Identification Strategies
3.1. The Identification Problem
To determine the true effect of S on Y requires comparing the outcome variable after having received the treatment to the counterfactual situation of not having received it. In general, we denote the post-treatment outcome by Yt
S=1 if the firm has received the treatment and YtS=0 if not. For actually treated firms, the difference
between these two, G = YtS=1 - Yt
S=0, is the causal impact. In this case, YtS=0 is the hypothetical counterfactual
situation. In the following, several strategies to identify this causal impact are presented, taking into account the particularities of electrification projects. While for the present report we only have cross-sectional data to
S = g(Y,Z) (2)
21) See Augurzky and Schmidt (2001) for an examination of community-based effects in evaluation problems.

43
hand, the conducted surveys can be used as a baseline for subsequent evaluation of longer-term effects in future years. Therefore, we do not limit the presentation to the cross-sectional identification strategy but also introduce before-after techniques.
The frequency of outcome YtS=0 and Yt
S=1 across the population of firms depends on a set of characteristics X. One main interest in an impact analysis is on the average individual outcome change resulting from the project intervention. This mean effect of treatment on the treated is expressed in the following manner:
where E(.) denotes the expected values.
As is obvious, we can never observe both YtS=1 and Yt
S=0 for the same firm, since it is either targeted by the project or not. While E(Yt
S=1|X, S = 1) can be easily estimated from a sample of treated firms, E(YtS=0|X, S = 1), which
measures the hypothetical output of these treated firms had they not been treated, is not observable. This is what Frondel and Schmidt (2005) refer to as the core of the evaluation problem. To solve this, we have to formu-late identification assumptions that allow replacing the unobservable and, hence, not estimable E(Yt
S=0|X, S = 1) with something that can be obtained by estimation from an existent dataset. In practice, this is only possible by finding a comparison group that serves to simulate the counterfactual situation for the treatment group.
3.2. Cross-Sectional Impact Evaluation
In this study, we use cross-sectional comparison to identify the impacts of electrification. In the PRODUSE case study from Benin, this is done before the intervention is implemented, which we refer to as ex-ante impact assessment. The methodological considerations and identification assumption are equal for ex-ante and ex-post cross-sectional evaluation. For both approaches, the intuition is that one group simulates the behaviour of the other: while in the ex-post case, the non-electrified firms simulate what would have been had there been no electrification programme for the now electrified, in the ex-ante case the already electri-fied firms simulate the behaviour of the now to be electrified firms.
In formalised terms, the identification assumption for cross-sectional comparison is:
In other words, it is assumed that electrified firms, if they – hypothetically – had no electricity, would behave and develop as the non-electrified do. We need two regions to investigate the impacts of availability of a service. These two groups have to be sufficiently comparable (see Section 4.1) to fulfil the identification assumption.
The connection treatment can be investigated without a comparison region. This is what the PRODUSE Ghana study and a couple of World Bank studies do (EnPoGen 2003a, EnPoGen 2003b, ESMAP 2003a, World Bank 2006. See also Peters and Vance 2011). In this case, firms that are connected to the grid are compared to those that are not connected, with both being located in the same region. Due to the simultaneity reflected in (2), validity of the identification assumption (8) is highly questionable and leads to an upward bias in the impact assessment. Furthermore, spillover effects positively affecting the outcome variable of non-using firms induce a downward bias if connected and non-connected firms in the same region are compared. Lastly, assumption (8) must not be undermined by unobservable variables that affect selection into treatment and the counterfactual no-treatment outcome at the same time. In total, investigating only one region and exam-ining the difference between connected and non-connected firms requires strong assumptions to rule out selection, simultaneity and spillover biases.
One opportunity to improve the comparability of connected and non-connected firms is the application of matching approaches (see, for example Khandker et al. 2009a, 2009b).” . For this purpose, firms from the access region are matched to those from the non-access region with respect to specific observable characteristics that
M = E(YtS=1 |X, S = 1) – E(Yt
S=0|X, S = 1)
E(YtS=1 |X, S = 1) – E(Yt
S=0|X, S = 0)
(5)
(8)

44
are covariates of the decision to connect. Covariates are variables that affect the decision to connect. The matching procedure is used to form a new and more comparable comparison group. The crucial step is the identification of appropriate covariates, which are required to influence the decision to connect but must not be responsive to the intervention. In this sense, the pre-intervention outcome Yt-1 is an appropriate covariate. Yet, in the case of cross-sectional comparisons, data on pre-intervention variables is frequently not available. In this case, variables such as the education of firm owners or assets like construction material and size of buildings can be chosen as covariates, as they can be assumed to influence the decision to connect but are not affected by electrification in the short to medium term. By basing the matching approach on such covariates, unobservable factors that are associated with the pre-intervention variables can be accounted for. In particu-lar, the simultaneity bias resulting from (2) can be reduced.22
In principle, matching approaches can be used if only one region that has access to electricity is surveyed and connected and non-connected firms are compared. However, due to the strong selection into treatment process (most of the better-off firms are connected, most of the poorer firms are not) this is likely to yield bad matches (see, for example, Bensch, Kluve and Peters 2011 and Peters, Vance and Harsdorff 2011). As a conse-quence, there are only few partners of sufficient comparability that can be matched. In contrast, if both access and non-access regions are surveyed, non-connected firms from the non-access region can serve as matching partners to connected firms from the access region. Thereby, the probability of finding good matches is much higher. In the Benin study we apply a matching technique to form a new comparison group out of the non-access firms.23
Another possibility to deal with selection and simultaneity biases in comparing connected and non-connect-ed firms is to find an identification variable that is correlated with the connection variable but uncorrelated with the firm’s output variable. While such instrumental variables (IV) in general are not easy to find, it might even allow for identifying the causal effect without having a control region at hand. In the Ghana case study, we use firm location within the agglomeration as an instrument, which affects the probability of being connected but not the firm’s profit.
Altogether, predicated on a good survey design and the appropriate analytical technique, cross-sectional data offers possibilities to identify the causal effect of electrification.24 Since it approximates the long-term impacts of an intervention, cross-sectional estimation alleviates the problems of limited monitoring horizons. It cures the curse of lacking baseline data in many development projects and it can additionally be used for ex-ante impact assessments as done in this report.
3.3. Evaluation Strategies after an Ex-Post Survey
In addition to the immediate investigation of electrification impacts, the surveys conducted for this report were designed to deliver baseline data for robust ex-post evaluation. Therefore, this section presents possi-bilities to use the data once post-intervention surveys will have been conducted.
A frequently pursued approach is the before-after comparison, where E(YtS=0|X, S = 1) is replaced by E(Yt -1
S=0|X, S = 1), i.e. the expected income of treated firms themselves at t-1, the time before the implementation of the project, represent the comparison group.25 For example, the profit of an electrified firm is compared with its profit before electrification. The identification assumption in this case would be:
22) See, for example, Angrist and Krueger (1999), Caliendo and Kopeinig (2008) and Dehejia and Wahba (2002) for a description of how to
effectively match observations.
23) For another application of this procedure see Bensch, Kluve and Peters (2011).
24) Ex-post cross-sectional comparison has been applied frequently in the evaluation literature. See, for example, Becchetti and Costantino
(2008), Cuong (2008), Khandker et al. (2009a), Kondo et al. (2008), McKernan (2002), Morduch (1998) and Ravallion and Wodon (1998).
25) Khandker et al. (2009b) use household data from Vietnam before and after electrification to assess the impacts on income, expenditures
and educational outcomes.
E(YtS=0 |X, S = 1) = E(Yt-1|X, S = 1) (6)
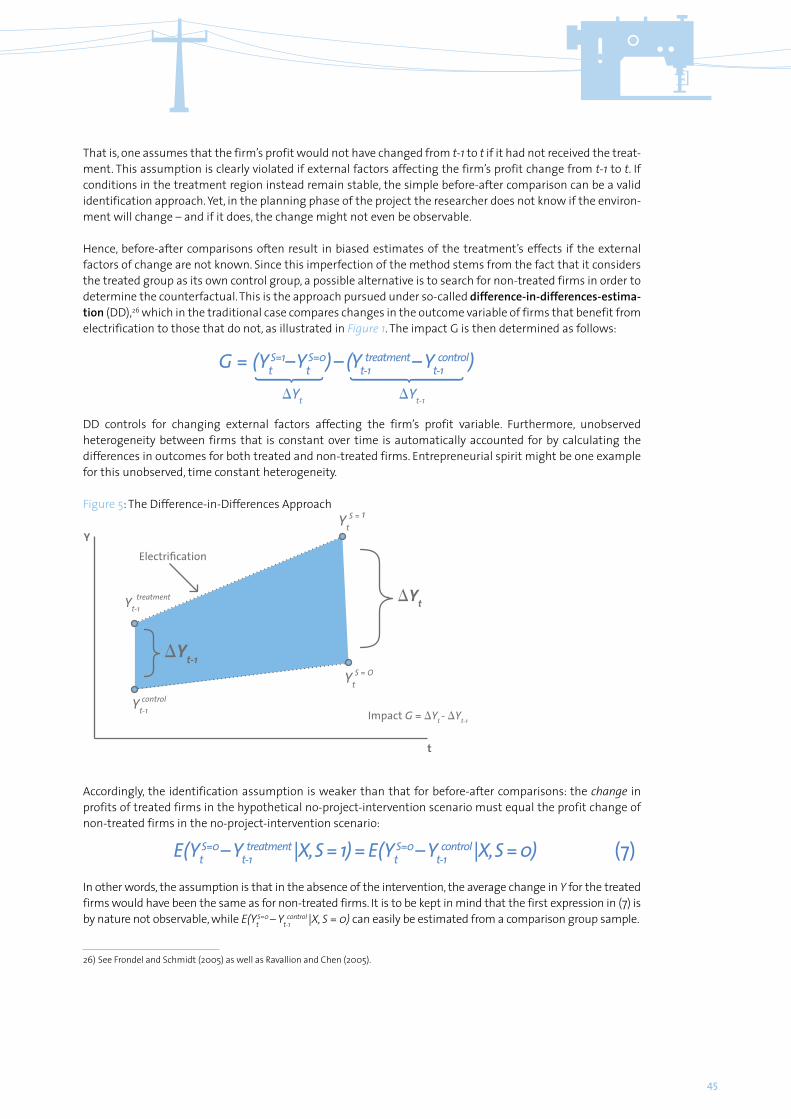
45
That is, one assumes that the firm’s profit would not have changed from t-1 to t if it had not received the treat-ment. This assumption is clearly violated if external factors affecting the firm’s profit change from t-1 to t. If conditions in the treatment region instead remain stable, the simple before-after comparison can be a valid identification approach. Yet, in the planning phase of the project the researcher does not know if the environ-ment will change – and if it does, the change might not even be observable.
Hence, before-after comparisons often result in biased estimates of the treatment’s effects if the external factors of change are not known. Since this imperfection of the method stems from the fact that it considers the treated group as its own control group, a possible alternative is to search for non-treated firms in order to determine the counterfactual. This is the approach pursued under so-called difference-in-differences-estima-tion (DD),26 which in the traditional case compares changes in the outcome variable of firms that benefit from electrification to those that do not, as illustrated in Figure 1. The impact G is then determined as follows:
DD controls for changing external factors affecting the firm’s profit variable. Furthermore, unobserved heterogeneity between firms that is constant over time is automatically accounted for by calculating the differences in outcomes for both treated and non-treated firms. Entrepreneurial spirit might be one example for this unobserved, time constant heterogeneity.
Accordingly, the identification assumption is weaker than that for before-after comparisons: the change in profits of treated firms in the hypothetical no-project-intervention scenario must equal the profit change of non-treated firms in the no-project-intervention scenario:
In other words, the assumption is that in the absence of the intervention, the average change in Y for the treated firms would have been the same as for non-treated firms. It is to be kept in mind that the first expression in (7) is by nature not observable, while E(Yt
S=0 – Yt-1control |X, S = 0) can easily be estimated from a comparison group sample.
26) See Frondel and Schmidt (2005) as well as Ravallion and Chen (2005).
E(YtS=0 – Yt-1
treatment |X, S = 1) = E(YtS=0 – Yt-1
control |X, S = 0)
G = (YtS=1– Yt
S=0) – (Yt-1treatment – Yt-1
control)ΔYt ΔYt-1
(7)
Figure 5: The Difference-in-Differences Approach
Electrification
Impact G = ΔYt - ΔYt-1
y
ΔYt
ΔYt-1
t
Yt-1treatment
Yt-1control
S = OYt
S = 1Yt

46
Using the different definitions of the electrification variable S presented in the previous Section 2, we encoun-ter different identification possibilities using the DD-approach. Applying the availability definition of S, we require two regions that have to be surveyed before and after a project intervention: one that is not yet covered by an electricity provider but that will receive access to the service soon (treatment group) and another that neither has received nor will receive electricity coverage (comparison group). In order to meet the identification assumption (7), both regions have to fulfil certain conditions (see Section 4).
For the application of the connection definition of S, surveying only the region of the project intervention is sufficient under specific conditions. The treatment group then would consist of those firms that choose to use electricity directly, while the non-connected constitute the comparison group. Both have to be surveyed before and after the intervention. Yet, the assumption in (7) would be violated if the non-connected firms react to external changes, in particular to the treatment, differently than the connected ones. Moreover, spill-over effects within the grid-connected region have to be excluded, which might not be warranted in many cases. For example, non-connected firms might benefit from additional orders of connected firms or they might suffer from the loss of consumers who switch to the connected firms.
Table 9: Advantages and Disadvantages of Different Impact Evaluation Approaches
Key Requirements/Assumptions Advantages Disadvantages
Before-after comparison
The observed change in the outcome variable for a firm has to be solely assigned to the electrification intervention.
No control group of firms not having benefited from the intervention is needed.
Very strong assumption considering that secular changes (e.g. changing energy prices, general economic growth) as well as effects of other develop-ment projects that may be present in the project area cannot be accounted for.Participants must already be identified at baseline.
Cross-sectional comparison
Control firms in control regions are comparable to the firms benefiting from the electrifica-tion intervention in terms of socio-economic and market access conditions.
Can be implemented when the intervention is already ongoing and no baseline data is available. Can be implemented before the intervention allowing for ex-ante assessment of the target region and likely impacts.The inclusion of control sites allows the capturing of secular changes.
Both the identification of genuinely comparable control regions and counterfactual firms can be difficult in practise.
Difference- in-difference estimation
The growth trends in outcome variables are the same for intervention and control group. Alternatively, unobserved charac-teristics are time-invariant between the two groups.Requires a baseline survey and, hence, that the target region of the project remains the same between baseline and follow-up survey.
Most robust non-experimental approach because unobserved heterogeneity between connected and non-connected firms is accounted for as long as it is time-invariant.
Requires two surveys in both the treatment and the control group (cost).Participants must already be identified at baseline and the same enterprises must be interviewed aga
47
As a matter of course, both the before-after comparison and the DD-estimation require data from both before and after the project intervention, which can, however, often not be fulfilled in practical evaluation scenarios. Many projects do not carry out adequate baseline studies at the time of the planning phase prior to the project’s implementation. Furthermore, evaluation practitioners frequently overlook that ex-post surveys should be conducted only after sufficient time has elapsed since the beginning of the intervention, particu-larly in infrastructure projects (Ravallion and Chen 2005, Ravallion 2009). The reason is that consumers – be they households or firms – need time to adapt to the new situation after electrification. ESMAP (2003b), for example, notes that educational impacts can be observed ten years after the electrification intervention at the earliest. The monitoring phase, however, typically only covers around three to five years, including the planning phase before the actual hardware installation.
The ex-ante cross-sectional set-up that we apply in Benin, i.e. surveying the target region without electricity and an already electrified region, also allows for DD-estimation after an ex-post survey. The already electrified region provides for a benchmark that enables the comparison of differences. Principally, this already electri-fied region nets out fixed individual effects and the confounding influence of changing environments – in the same way as the region that remains non-electrified in the traditional DD-approach does. As in the tradi-tional approach, the identification assumption requires that the average change in Y for the treated firms without an intervention would have been the same as for the comparison group. This breaks down to an additional assumption for this modified DD-estimation: the already electrified comparison group has to behave with respect to the change in Y as if it was not electrified. This additional assumption would be violated if a region is not only shifted to higher income level but also to a different growth level.
4. Study Implementation
4.1. Selection of Appropriate Control Regions
The studies in this PRODUSE report are based on cross-sectional data and try to compare firms from electri-fied regions to firms from non-electrified regions. In doing so, the survey covers ideally a variety of different village types in order to control for different levels of community characteristics or geographic conditions. In this way, the effect of electrification S on outcome Y can be disentangled from other observable effects like access to transportation, climatic conditions, soil quality or business opportunities (Kondo et al. 2008, Raval-lion and Wodon 1998). However, in the present case, this ideal design is not implementable due to budgetary and other project restrictions. Instead, we were only able to design survey setups that cover 8 villages at most, which may not capture enough variation of village characteristics.
Under such restricted circumstances, comparability of electrified and non-electrified communities has to be assured during the selection of these communities. Village level parameters like size, demography, political importance and access to roads, transport services or telecommunication have to be checked in both regions. Most importantly, the business environment has to be similar. This can be ensured by taking into account local market conditions, the availability of cash crops, infrastructure, etc. Generally speaking, differences in local characteristics between the treatment and the control region that also influence the outcome variable Y have to be reduced as far as possible. For this purpose, the considered regions should be carefully scrutinised, based on information from the utility but not least also by an extensive field visit by researchers familiar with the study’s purpose and methodology. The reason is that, although a checklist of general characteristics to be fulfilled in terms of comparability is crucial, it can hardly be comprehensive.
In most cases, such regions exhibiting sufficiently comparable conditions to the project’s target region are available. Rural Africa, in particular, is only sparsely electrified, so that comparable non-electrified regions should be available abundantly. Finding comparable already electrified areas for the ex-ante cross-sectional analysis is harder because the few electrified rural communities are often business centres or otherwise

48
privileged areas. In the Ghana case study, we were not able to identify an appropriate control region. The project and, hence, survey region is in peri-urban areas that are already grid covered. Comparable non-access regions do not exist in Ghana. The Benin approach succeeded in finding a comparison group. The two areas seem to be gradually comparable. In the Uganda case study it turned out that the selected electrified and non-electrified regions were not satisfactorily comparable, partly because the researchers were not suffi-ciently involved in the selection process.
4.2 Survey Approach
The studies are mainly based on a structured questionnaire covering virtually all areas of firm activity. In addition, availability and usage of infrastructure, Business Development Services and credits are addressed. With regards to the main variables used in the analysis – firm profits, capital, labour and energy – the idea was to relieve the respondent from aggregative calculation work as much as possible. Instead, the questionnaire tries to grasp these fields in enough detail to allow for the accurate derivation of variables not directly elicited. It is an ongoing discussion of whether to address, for example profits directly (‘How much does your firm earn?’) or by asking for the sold items and costs (‘How much of good X and how much of good Y do you sell?’). While some survey practitioners argue in favour of eliciting profits or sales by a direct question, others opt for calculating profits from income and expenditure figures.27 The justification for this latter approach is that – in addition to the ad-hoc calculation argument – many respondents feel uncomfortable about revealing their income due to tax-related concerns or to an aversion of exposing details about their financial situation. With the applied questionnaire, it can be decided on a case-to-case basis which approach is to be chosen.
Quantitative questionnaires are frequently criticised for being prone to misreporting errors. In particular, for financial questions it is suspected that respondents purposely understate their income or the value of assets. In general, critics claim that interviewed firms or households involuntarily give wrong answers – simply be-cause they do not know the exact answer and can only provide estimates. The validity of these arguments is certainly beyond discussion. Resorting only to qualitative judgements as an alternative is, however, also not warranted. The reason is that misreporting on profits, for example, only poses problems if the extent of the error in the answers is correlated with the electrification treatment (Ravallion 2008). In other words, only if we suspect that firms that are more likely to misreport are also more (or less) inclined to get connected does misre-porting induce a systematic bias across the sample. While distorting effects of misreporting – as a classical unobservable variable – via correlations with the treatment variable can never be ruled out, a priori it seems plausible to assume that there is no correlation between inaccurate answers and the decision to connect.
Quantitative data collected with the structured questionnaire is complemented by qualitative informa-tion gathered by open interviews with key informants and resource persons in the survey areas. Such additional insights are indispensable to understand the business environment in the villages and to complement the quantitative data. These qualitative interviews were conducted by junior researchers that were on the ground during the whole field work. Being familiar with the methodological issues outlined in this chapter, they acted as field supervisors at the same time. These junior researchers were not only responsible for the quality control, including consistency and completeness checks, they also reported methodological problems and pitfalls back to the central study team.
27) See De Mel, McKenzie and Woodruff (2009) and Daniels (2001).

49

50

51
Chapter 4: Electrification and Firm Performance in Rural Benin: An Ex-Ante Impact Assessment Jörg Peters, Colin Vance and Marek Harsdorff28
52
Abstract
This chapter investigates the impact of electricity on the performance of micro-enterprises by comparing the performance of firms in grid-covered and non-covered villages in Northern Benin. Using firm-level data, the empirical analysis employs Propensity Score Matching techniques. While beneficial impacts are found from firm creation after electrification, firms that existed before actually show a non-significantly inferior performance to their matched counterparts from a non-electrified region. Complementary measures that sensitise firms about the implications of a grid connection are recommended as important features of programme design.
1. Introduction
With a per-capita income of US $ 771 in 2008 and a ranking of 146 out of 175 countries, Benin is one of the poor-est countries in the world.29 While the coastal region enjoys some commercial advantages afforded by the combined influence of industrial activity and trade linkages, rural Benin is dominated by a subsistence-orient-ed agrarian economy that is largely detached from external markets. Benin’s economic growth is highly dependent on the world market price for cotton and fluctuated between 3.0 and 5.1 percent in recent years.30
In spite of the dominance of the agricultural sector, a growing number of farmers have attempted to diversify their incomes by establishing small enterprises in the service and manufacturing sectors. Today some 40 % of the rural population works at least part time in non- farming businesses. In some parts of North-Eastern rural Benin, this transition has been facilitated by the installation of grid electricity beginning in 2000, which was accompanied by an 8 % increase in rural per capita income over a five year period. In the long run, lighting and small machinery can potentially foster further expansion of the service and small scale industry sector, there-by helping to diversify the rural economy.
In light of the growing relevance of the non-agricultural sector, the Benin PRODUSE study investigates the impacts of electricity provision by comparing the performance of micro-enterprises located in grid-connected and non-connected villages in Northern Benin. In the yet non-electrified region, the Deutsche Gesellschaft für Internationale Zusammenarbeit (GIZ) GmbH is implementing an electrification project for which the data used in this study was collected in April and May 2008 as baseline information. While both manufacturing and service firms were interviewed, the focus of the study is on the manufacturing enterprises. A structured questionnaire was used that covers most activities and relevant characteristics of the firm.
Following a brief discussion of the survey design and the study’s approach, the economic situation in the survey regions is described, including access to infrastructure, markets, Business Development Services (BDS) and credits (Section 3). This is followed by a presentation of some intermediate indicators for firm perfor-mance, mainly input factors such as labour and capital but with a particular focus on energy usage. During complementary qualitative interviews we found that it is reasonable to distinguish between firms that can be considered being dependent on electricity and those that can also work without. We hence differentiate between electricity-reliant firms and non-reliant firms. These two types differ substantially making an individual inspection of characteristics and outcome indicators reasonable.
The principal outcome indicator for firm performance is the firm’s profit. The electricity-reliant firms exhibit profits that are considerably higher than those of the non-connected and non-reliant firms. For the non-reliant firms in the manufacturing sector we examine the impact on profits using a propensity score matching ap-proach. This approach uses the information from the grid covered access region to predict a firm’s probability of getting connected in the non-access region. Thereby, we estimate which firms will hypothetically get connected in the non-access region and use them as a more comparable comparison group for the impact assessment.
28) We are grateful for the valuable comments and suggestions by Benjamin Attigah, Gunther Bensch, John Haisken-DeNew, Wilhelm
Löwenstein, Lucius Mayer-Tasch, Sven Neelsen, Kilian Reiche and, in particular, Christoph M. Schmidt.
29) Per capita GDP in current US $. Source: World Development Indicators (data.worldbank.org/indicator).
30) Source: www.data.worldbank.org/indicator

53
31) This project has been implemented under the Energising Development (EnDev) programme (www.endev.info). Another 105 villages are
going to be electrified under the successor project, which is implemented by SBEE and GIZ and co-financed by the Government of Benin,
AFD and the EU.
For the non-reliant firms no positive effect of being connected to the grid on firm profits can be attested. The discussion section of the chapter explains this result by highlighting the role of market constraints in stifling increased production following the shift to electrified technology. Implications for the project design and evaluation of electrification programmes are drawn in the concluding section.
2. Data Collection
The findings presented in this paper emerge from a project implemented by GIZ to provide grid access to a collection of twelve villages in rural Benin.31 As part of this endeavor, a survey of 367 manufacturing and service enterprises in five electrified and five non-electrified villages was undertaken between April and May 2008. While the service sector includes classical service firms such as hairdressers or telephone shops, also bars and small commerce were assigned to this group. For the purposes of this study, the non-electrified villages in the project’s target region located in the Atacora-Donga region in North-Western Benin form the comparison group for cross-sectional analysis. The electrified villages, the treatment group, are located in North-Eastern Benin around the rural centre of Parakou. In addition, the collected data serves as a baseline and can be used for ex-post evaluation after the electrification intervention will have been implemented. In the following, we refer to the grid-covered treatment group as the access region and to the control group as the non-access region.
As described in the overall methodology, the treatment villages had to be selected in a way that a sufficient comparability is warranted. Therefore, key criteria were determined to assure that treatment- and control villages are comparable with respect to the characteristics hypothesised to be important determinants of enterprise performance. Eight such characteristics were identified. The villages are located in rural areas in northern Benin that are between 400 and 600 km from the economic capital Cotonou,
� have asphalt or dirt road access that is conductible in the dry and rainy seasons by car and trucks� have a population of between 500 and 1,500 households� have a secondary school� have a regular market in the village� enjoy some political relevance via the existence of a communal administrative office and� have access to Business Development Services (BDS) and micro-finance services.
Selection-based on these characteristics resulted in the exclusion of small villages with limited business opportunities in the project region, because comparable electrified villages do not exist.
Table 10: Sampling
Sector Non-Access Region
Access RegionTotal
Connected Non-Connected
Manufacturing (carpenter, welder, mechanic, tailor, saw mill, blacksmith)
130 55 91 276
Service (bars, shops, hairdressers, photocopy, telephone, electrician, photograph)
51 33 7 91
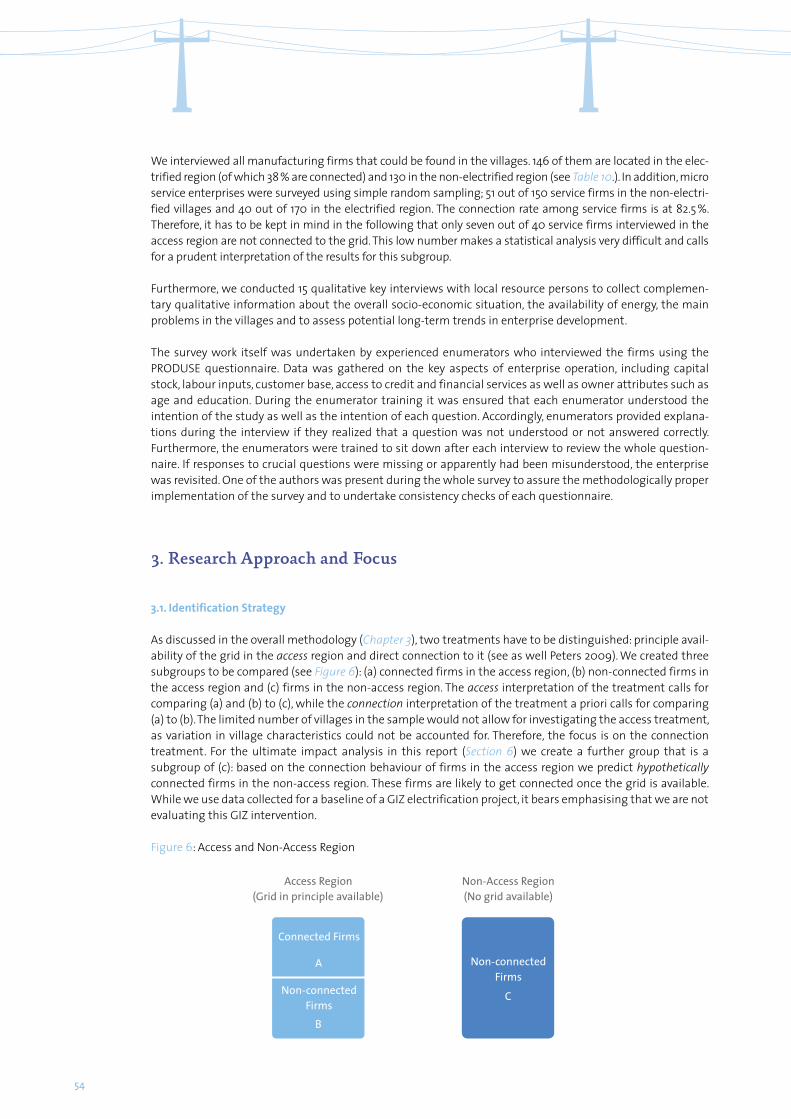
54
We interviewed all manufacturing firms that could be found in the villages. 146 of them are located in the elec-trified region (of which 38 % are connected) and 130 in the non-electrified region (see Table 10.). In addition, micro service enterprises were surveyed using simple random sampling; 51 out of 150 service firms in the non-electri-fied villages and 40 out of 170 in the electrified region. The connection rate among service firms is at 82.5 %. Therefore, it has to be kept in mind in the following that only seven out of 40 service firms interviewed in the access region are not connected to the grid. This low number makes a statistical analysis very difficult and calls for a prudent interpretation of the results for this subgroup.
Furthermore, we conducted 15 qualitative key interviews with local resource persons to collect complemen-tary qualitative information about the overall socio-economic situation, the availability of energy, the main problems in the villages and to assess potential long-term trends in enterprise development.
The survey work itself was undertaken by experienced enumerators who interviewed the firms using the PRODUSE questionnaire. Data was gathered on the key aspects of enterprise operation, including capital stock, labour inputs, customer base, access to credit and financial services as well as owner attributes such as age and education. During the enumerator training it was ensured that each enumerator understood the intention of the study as well as the intention of each question. Accordingly, enumerators provided explana-tions during the interview if they realized that a question was not understood or not answered correctly. Furthermore, the enumerators were trained to sit down after each interview to review the whole question-naire. If responses to crucial questions were missing or apparently had been misunderstood, the enterprise was revisited. One of the authors was present during the whole survey to assure the methodologically proper implementation of the survey and to undertake consistency checks of each questionnaire.
3. Research Approach and Focus
3.1. Identification Strategy
As discussed in the overall methodology (Chapter 3), two treatments have to be distinguished: principle avail-ability of the grid in the access region and direct connection to it (see as well Peters 2009). We created three subgroups to be compared (see Figure 6): (a) connected firms in the access region, (b) non-connected firms in the access region and (c) firms in the non-access region. The access interpretation of the treatment calls for comparing (a) and (b) to (c), while the connection interpretation of the treatment a priori calls for comparing (a) to (b). The limited number of villages in the sample would not allow for investigating the access treatment, as variation in village characteristics could not be accounted for. Therefore, the focus is on the connection treatment. For the ultimate impact analysis in this report (Section 6) we create a further group that is a subgroup of (c): based on the connection behaviour of firms in the access region we predict hypothetically connected firms in the non-access region. These firms are likely to get connected once the grid is available. While we use data collected for a baseline of a GIZ electrification project, it bears emphasising that we are not evaluating this GIZ intervention.
A
Connected Firms
Access Region(Grid in principle available)
Non-Access Region(No grid available)
B
CNon-connected Firms
Non-connected Firms
Figure 6: Access and Non-Access Region
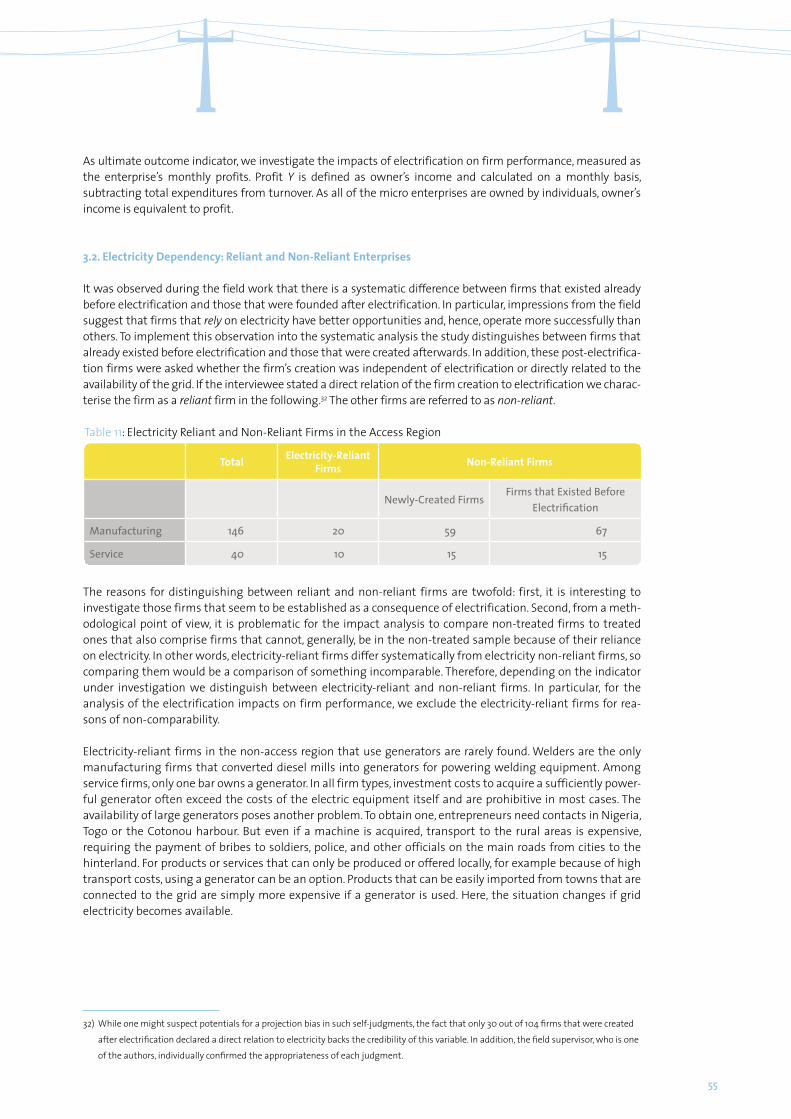
55
As ultimate outcome indicator, we investigate the impacts of electrification on firm performance, measured as the enterprise’s monthly profits. Profit Y is defined as owner’s income and calculated on a monthly basis, subtracting total expenditures from turnover. As all of the micro enterprises are owned by individuals, owner’s income is equivalent to profit.
3.2. Electricity Dependency: Reliant and Non-Reliant Enterprises
It was observed during the field work that there is a systematic difference between firms that existed already before electrification and those that were founded after electrification. In particular, impressions from the field suggest that firms that rely on electricity have better opportunities and, hence, operate more successfully than others. To implement this observation into the systematic analysis the study distinguishes between firms that already existed before electrification and those that were created afterwards. In addition, these post-electrifica-tion firms were asked whether the firm’s creation was independent of electrification or directly related to the availability of the grid. If the interviewee stated a direct relation of the firm creation to electrification we charac-terise the firm as a reliant firm in the following.32 The other firms are referred to as non-reliant.
The reasons for distinguishing between reliant and non-reliant firms are twofold: first, it is interesting to investigate those firms that seem to be established as a consequence of electrification. Second, from a meth-odological point of view, it is problematic for the impact analysis to compare non-treated firms to treated ones that also comprise firms that cannot, generally, be in the non-treated sample because of their reliance on electricity. In other words, electricity-reliant firms differ systematically from electricity non-reliant firms, so comparing them would be a comparison of something incomparable. Therefore, depending on the indicator under investigation we distinguish between electricity-reliant and non-reliant firms. In particular, for the analysis of the electrification impacts on firm performance, we exclude the electricity-reliant firms for rea-sons of non-comparability.
Electricity-reliant firms in the non-access region that use generators are rarely found. Welders are the only manufacturing firms that converted diesel mills into generators for powering welding equipment. Among service firms, only one bar owns a generator. In all firm types, investment costs to acquire a sufficiently power-ful generator often exceed the costs of the electric equipment itself and are prohibitive in most cases. The availability of large generators poses another problem. To obtain one, entrepreneurs need contacts in Nigeria, Togo or the Cotonou harbour. But even if a machine is acquired, transport to the rural areas is expensive, requiring the payment of bribes to soldiers, police, and other officials on the main roads from cities to the hinterland. For products or services that can only be produced or offered locally, for example because of high transport costs, using a generator can be an option. Products that can be easily imported from towns that are connected to the grid are simply more expensive if a generator is used. Here, the situation changes if grid electricity becomes available.
32) While one might suspect potentials for a projection bias in such self-judgments, the fact that only 30 out of 104 firms that were created
after electrification declared a direct relation to electricity backs the credibility of this variable. In addition, the field supervisor, who is one
of the authors, individually confirmed the appropriateness of each judgment.
Table 11: Electricity Reliant and Non-Reliant Firms in the Access Region
Total Electricity-Reliant Firms Non-Reliant Firms
Newly-Created Firms Firms that Existed Before
Electrification
Manufacturing 146 20 59 67
Service 40 10 15 15
56
4. Economic Conditions in the Survey Regions
4.1. Business Environment and Infrastructure
The economy in the surveyed regions is dominated by agricultural activities. Nearly all households own a field and pursue some sort of agricultural work. The most important cash crop in the region is cotton, which is cultivated by 20 % of the households and can be sold directly to the national cotton export agency. Around 40 % of households earn incomes from additional activities outside of agriculture – with men mostly working in manufacturing firms and women doing commerce activities.
To provide for a stylised example, we describe a typical medium-size village (1,000 households) as surveyed for this study: it has around 12 tailors, 10 carpenters, 8 mechanics, 8 hairdressers, 12 cereal mills and two bars in addition to some temporary businesses. Following access to grid electricity, some additional businesses such as welders, photocopy or fish shops (refrigeration) and typically one sawmill are established in the village. Bars use electricity to offer cold drinks and sometimes use entertainment devices. A main road traverses the centre of the villages. Larger villages are connected to the next bigger towns by asphalt roads and the smaller ones by dirt roads. The dirt roads are bulldozed and are also drivable during the rainy season. All villages are accessible by cars and trucks, although not equally easily. The distance to the closest city varies between 20-50 km and the distance to the economic capital Cotonou ranges between 400 and 600 km. Although fix telephone lines exist in some villages, the lines, phone cabins and phones are in very bad condition and there-fore rarely used. None of the non-electrified villages are covered by a cell phone network, which tends to be extended to villages that get connected to the electricity grid.
In rural areas of Benin grid electricity is virtually non-existent. The surveyed electrified region is one of the few grid-covered rural areas and was connected 3-8 years prior to the survey. Tariffs for private consumption varied in 2008 between 56 FCFA/kWh – the social tariff for the first 25 kWh consumed – and up to 95 FCFA/KWh for large consumers. Commercial users paid a fixed price of 88 FCFA/kWh.33 Costs of an official connection – including the official fees and the in-house installation costs – varied between 50,000-200,000 FCFA depend-ing on the distance to the grid and on accorded subsidies. Informal connections, also called secondary connec-tions, account for more than half of all connections. Such connections are tolerated by the utility as the infor-mal clients pay for the consumed electricity via the bill of the primary connection. These self-made connections cost between 5,000-50,000 FCFA depending on the distance to the neighbor. The electricity grid in the surveyed region is relatively reliable. Unexpected blackouts occur around two times per week, but are of very short duration (2-30 minutes).
The most important economic institution in the surveyed villages are the weekly markets. Villages without an institutionalised market are less developed with fewer permanent enterprises and less economic activity. Usually, in medium size-villages, there are 8 market days a month, mostly used to trade agricultural products. The firms that are examined in this study sell their manufactured products or services in permanent struc-tures. Even if these enterprises do not directly profit from the markets, they enjoy indirect benefits from the influx of cash and associated increase in local purchasing power. Apart from the 8 market days, there is very little trade and exchange with other villages.
4.2. Micro-Finance and BDS
Theoretically, all firms in the survey regions have access to micro-finance. The usage of credits, however, is very low. No firm applied for a credit to finance the electricity connection. In total, less than 7 % of firms ever requested a credit – equally distributed across sectors. These few firms perform much better than the major-ity which has never received a loan. The low take-up rate of credits is even more astonishing given that all firms that ever applied for a credit eventually received one. As Table 12 shows, procedural difficulties such as business plan requirements are perceived to be the most important hurdle. Interest rates and collateral de-mands, on the other hand, are not regarded major barriers. Another reason for the low take-up rate of credits might be that many of the surveyed firms believe that they do not dispose of adequate collateral for a credit
33) The local currency is the West Africa Franc (FCFA). It is pegged to the Euro at an exchange rate of 1 to 656. The FCFA/US $ exchange rate
in May 2013 is 509.
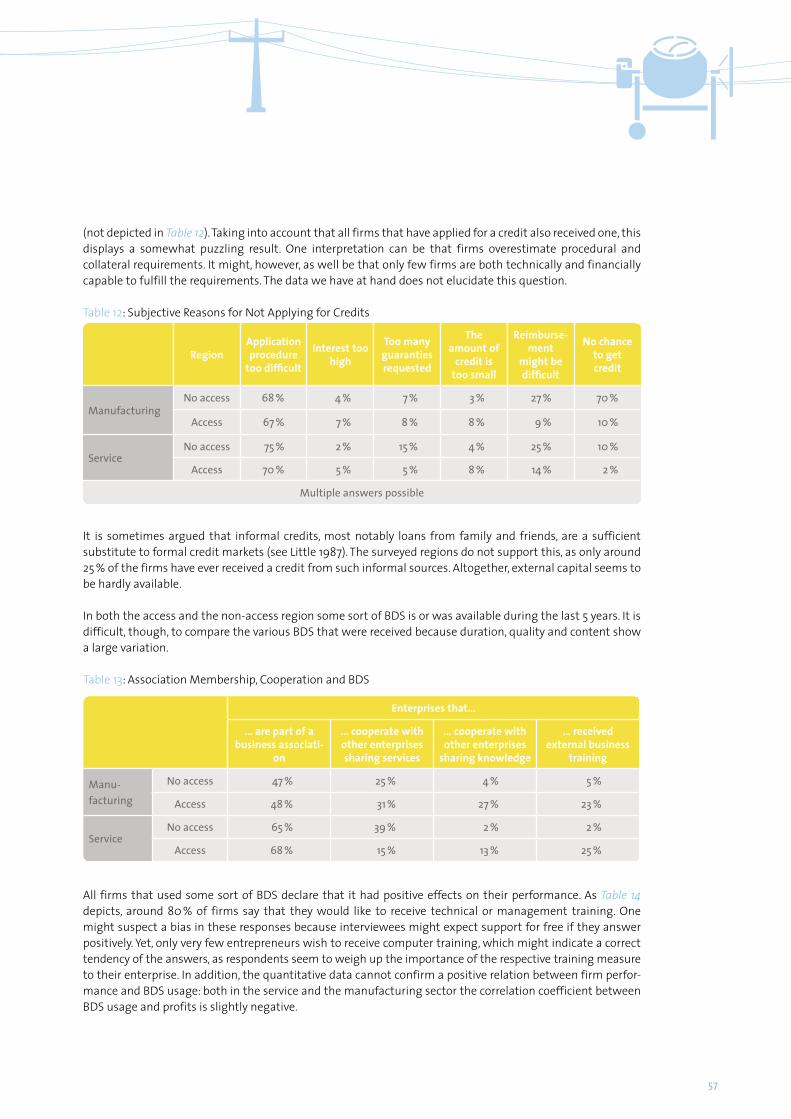
57
Table 12: Subjective Reasons for Not Applying for Credits
RegionApplication procedure
too difficult
Interest too high
Too many guaranties requested
The amount of
credit is too small
Reimburse-ment
might be difficult
No chance to get credit
ManufacturingNo access 68 % 4 % 7 % 3 % 27 % 70 %
Access 67 % 7 % 8 % 8 % 9 % 10 %
ServiceNo access 75 % 2 % 15 % 4 % 25 % 10 %
Access 70 % 5 % 5 % 8 % 14 % 2 %
Multiple answers possible
It is sometimes argued that informal credits, most notably loans from family and friends, are a sufficient substitute to formal credit markets (see Little 1987). The surveyed regions do not support this, as only around 25 % of the firms have ever received a credit from such informal sources. Altogether, external capital seems to be hardly available.
In both the access and the non-access region some sort of BDS is or was available during the last 5 years. It is difficult, though, to compare the various BDS that were received because duration, quality and content show a large variation.
All firms that used some sort of BDS declare that it had positive effects on their performance. As Table 14 depicts, around 80 % of firms say that they would like to receive technical or management training. One might suspect a bias in these responses because interviewees might expect support for free if they answer positively. Yet, only very few entrepreneurs wish to receive computer training, which might indicate a correct tendency of the answers, as respondents seem to weigh up the importance of the respective training measure to their enterprise. In addition, the quantitative data cannot confirm a positive relation between firm perfor-mance and BDS usage: both in the service and the manufacturing sector the correlation coefficient between BDS usage and profits is slightly negative.
Table 13: Association Membership, Cooperation and BDS
Enterprises that…
… are part of a business associati-
on
… cooperate with other enterprises sharing services
… cooperate with other enterprises
sharing knowledge
… received external business
training
Manu-facturing
No access 47 % 25 % 4 % 5 %
Access 48 % 31 % 27 % 23 %
ServiceNo access 65 % 39 % 2 % 2 %
Access 68 % 15 % 13 % 25 %
(not depicted in Table 12). Taking into account that all firms that have applied for a credit also received one, this displays a somewhat puzzling result. One interpretation can be that firms overestimate procedural and collateral requirements. It might, however, as well be that only few firms are both technically and financially capable to fulfill the requirements. The data we have at hand does not elucidate this question.
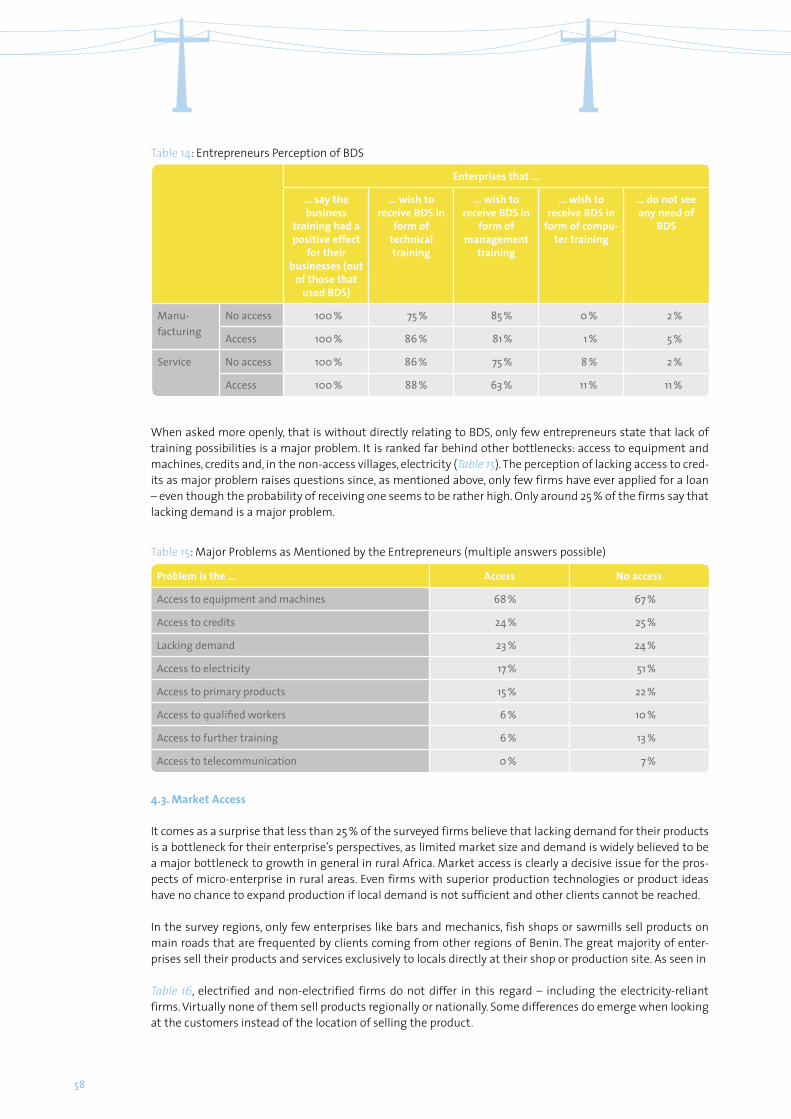
58
Table 14: Entrepreneurs Perception of BDS
Enterprises that …
… say the business
training had a positive effect
for their businesses (out
of those that used BDS)
… wish to receive BDS in
form of technical training
… wish to receive BDS in
form of management
training
… wish to receive BDS in
form of compu-ter training
… do not see any need of
BDS
Manu-facturing
No access 100 % 75 % 85 % 0 % 2 %
Access 100 % 86 % 81 % 1 % 5 %
Service No access 100 % 86 % 75 % 8 % 2 %
Access 100 % 88 % 63 % 11 % 11 %
When asked more openly, that is without directly relating to BDS, only few entrepreneurs state that lack of training possibilities is a major problem. It is ranked far behind other bottlenecks: access to equipment and machines, credits and, in the non-access villages, electricity (Table 15). The perception of lacking access to cred-its as major problem raises questions since, as mentioned above, only few firms have ever applied for a loan – even though the probability of receiving one seems to be rather high. Only around 25 % of the firms say that lacking demand is a major problem.
4.3. Market Access
It comes as a surprise that less than 25 % of the surveyed firms believe that lacking demand for their products is a bottleneck for their enterprise’s perspectives, as limited market size and demand is widely believed to be a major bottleneck to growth in general in rural Africa. Market access is clearly a decisive issue for the pros-pects of micro-enterprise in rural areas. Even firms with superior production technologies or product ideas have no chance to expand production if local demand is not sufficient and other clients cannot be reached.
In the survey regions, only few enterprises like bars and mechanics, fish shops or sawmills sell products on main roads that are frequented by clients coming from other regions of Benin. The great majority of enter-prises sell their products and services exclusively to locals directly at their shop or production site. As seen in
Table 16, electrified and non-electrified firms do not differ in this regard – including the electricity-reliant firms. Virtually none of them sell products regionally or nationally. Some differences do emerge when looking at the customers instead of the location of selling the product.
Table 15: Major Problems as Mentioned by the Entrepreneurs (multiple answers possible)
Problem is the … Access No access
Access to equipment and machines 68 % 67 %
Access to credits 24 % 25 %
Lacking demand 23 % 24 %
Access to electricity 17 % 51 %
Access to primary products 15 % 22 %
Access to qualified workers 6 % 10 %
Access to further training 6 % 13 %
Access to telecommunication 0 % 7 %
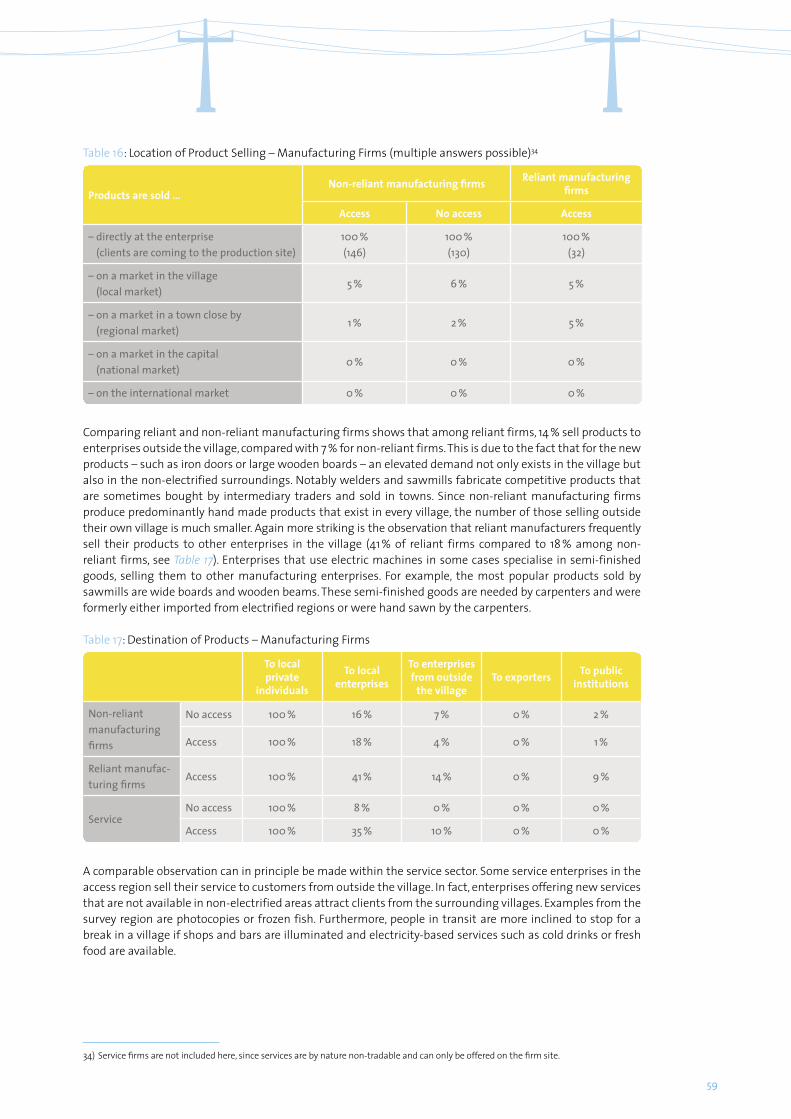
59
Comparing reliant and non-reliant manufacturing firms shows that among reliant firms, 14 % sell products to enterprises outside the village, compared with 7 % for non-reliant firms. This is due to the fact that for the new products – such as iron doors or large wooden boards – an elevated demand not only exists in the village but also in the non-electrified surroundings. Notably welders and sawmills fabricate competitive products that are sometimes bought by intermediary traders and sold in towns. Since non-reliant manufacturing firms produce predominantly hand made products that exist in every village, the number of those selling outside their own village is much smaller. Again more striking is the observation that reliant manufacturers frequently sell their products to other enterprises in the village (41 % of reliant firms compared to 18 % among non- reliant firms, see Table 17). Enterprises that use electric machines in some cases specialise in semi-finished goods, selling them to other manufacturing enterprises. For example, the most popular products sold by sawmills are wide boards and wooden beams. These semi-finished goods are needed by carpenters and were formerly either imported from electrified regions or were hand sawn by the carpenters.
A comparable observation can in principle be made within the service sector. Some service enterprises in the access region sell their service to customers from outside the village. In fact, enterprises offering new services that are not available in non-electrified areas attract clients from the surrounding villages. Examples from the survey region are photocopies or frozen fish. Furthermore, people in transit are more inclined to stop for a break in a village if shops and bars are illuminated and electricity-based services such as cold drinks or fresh food are available.
Table 16: Location of Product Selling – Manufacturing Firms (multiple answers possible)34
Products are sold …Non-reliant manufacturing firms Reliant manufacturing
firms
Access No access Access
– directly at the enterprise (clients are coming to the production site)
100 %(146)
100 %(130)
100 %(32)
– on a market in the village (local market)
5 % 6 % 5 %
– on a market in a town close by (regional market)
1 % 2 % 5 %
– on a market in the capital (national market)
0 % 0 % 0 %
– on the international market 0 % 0 % 0 %
34) Service firms are not included here, since services are by nature non-tradable and can only be offered on the firm site.
Table 17: Destination of Products – Manufacturing Firms
To local private
individuals
To local enterprises
To enterprises from outside
the villageTo exporters To public
institutions
Non-reliant manufacturing firms
No access 100 % 16 % 7 % 0 % 2 %
Access 100 % 18 % 4 % 0 % 1 %
Reliant manufac-turing firms
Access 100 % 41 % 14 % 0 % 9 %
ServiceNo access 100 % 8 % 0 % 0 % 0 %
Access 100 % 35 % 10 % 0 % 0 %
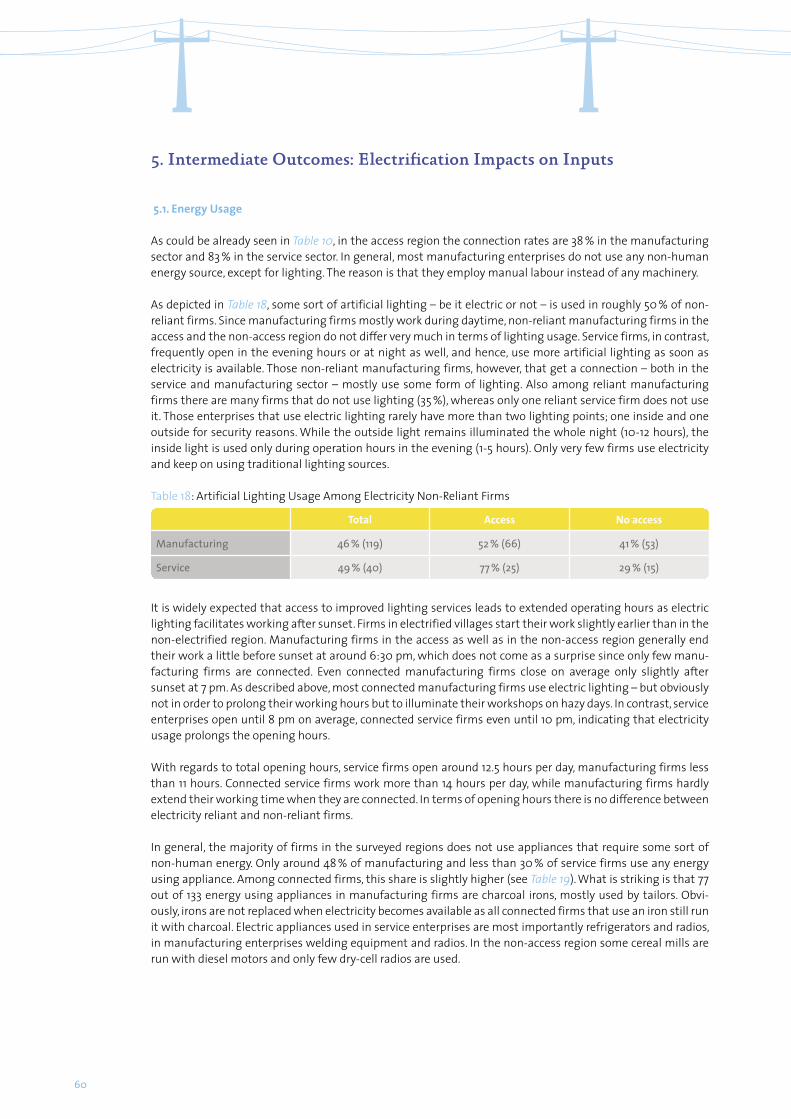
60
5. Intermediate Outcomes: Electrification Impacts on Inputs
5.1. Energy Usage
As could be already seen in Table 10, in the access region the connection rates are 38 % in the manufacturing sector and 83 % in the service sector. In general, most manufacturing enterprises do not use any non-human energy source, except for lighting. The reason is that they employ manual labour instead of any machinery.
As depicted in Table 18, some sort of artificial lighting – be it electric or not – is used in roughly 50 % of non-reliant firms. Since manufacturing firms mostly work during daytime, non-reliant manufacturing firms in the access and the non-access region do not differ very much in terms of lighting usage. Service firms, in contrast, frequently open in the evening hours or at night as well, and hence, use more artificial lighting as soon as electricity is available. Those non-reliant manufacturing firms, however, that get a connection – both in the service and manufacturing sector – mostly use some form of lighting. Also among reliant manufacturing firms there are many firms that do not use lighting (35 %), whereas only one reliant service firm does not use it. Those enterprises that use electric lighting rarely have more than two lighting points; one inside and one outside for security reasons. While the outside light remains illuminated the whole night (10-12 hours), the inside light is used only during operation hours in the evening (1-5 hours). Only very few firms use electricity and keep on using traditional lighting sources.
Table 18: Artificial Lighting Usage Among Electricity Non-Reliant Firms
Total Access No access
Manufacturing 46 % (119) 52 % (66) 41 % (53)
Service 49 % (40) 77 % (25) 29 % (15)
It is widely expected that access to improved lighting services leads to extended operating hours as electric lighting facilitates working after sunset. Firms in electrified villages start their work slightly earlier than in the non-electrified region. Manufacturing firms in the access as well as in the non-access region generally end their work a little before sunset at around 6:30 pm, which does not come as a surprise since only few manu-facturing firms are connected. Even connected manufacturing firms close on average only slightly after sunset at 7 pm. As described above, most connected manufacturing firms use electric lighting – but obviously not in order to prolong their working hours but to illuminate their workshops on hazy days. In contrast, service enterprises open until 8 pm on average, connected service firms even until 10 pm, indicating that electricity usage prolongs the opening hours.
With regards to total opening hours, service firms open around 12.5 hours per day, manufacturing firms less than 11 hours. Connected service firms work more than 14 hours per day, while manufacturing firms hardly extend their working time when they are connected. In terms of opening hours there is no difference between electricity reliant and non-reliant firms.
In general, the majority of firms in the surveyed regions does not use appliances that require some sort of non-human energy. Only around 48 % of manufacturing and less than 30 % of service firms use any energy using appliance. Among connected firms, this share is slightly higher (see Table 19). What is striking is that 77 out of 133 energy using appliances in manufacturing firms are charcoal irons, mostly used by tailors. Obvi-ously, irons are not replaced when electricity becomes available as all connected firms that use an iron still run it with charcoal. Electric appliances used in service enterprises are most importantly refrigerators and radios, in manufacturing enterprises welding equipment and radios. In the non-access region some cereal mills are run with diesel motors and only few dry-cell radios are used.
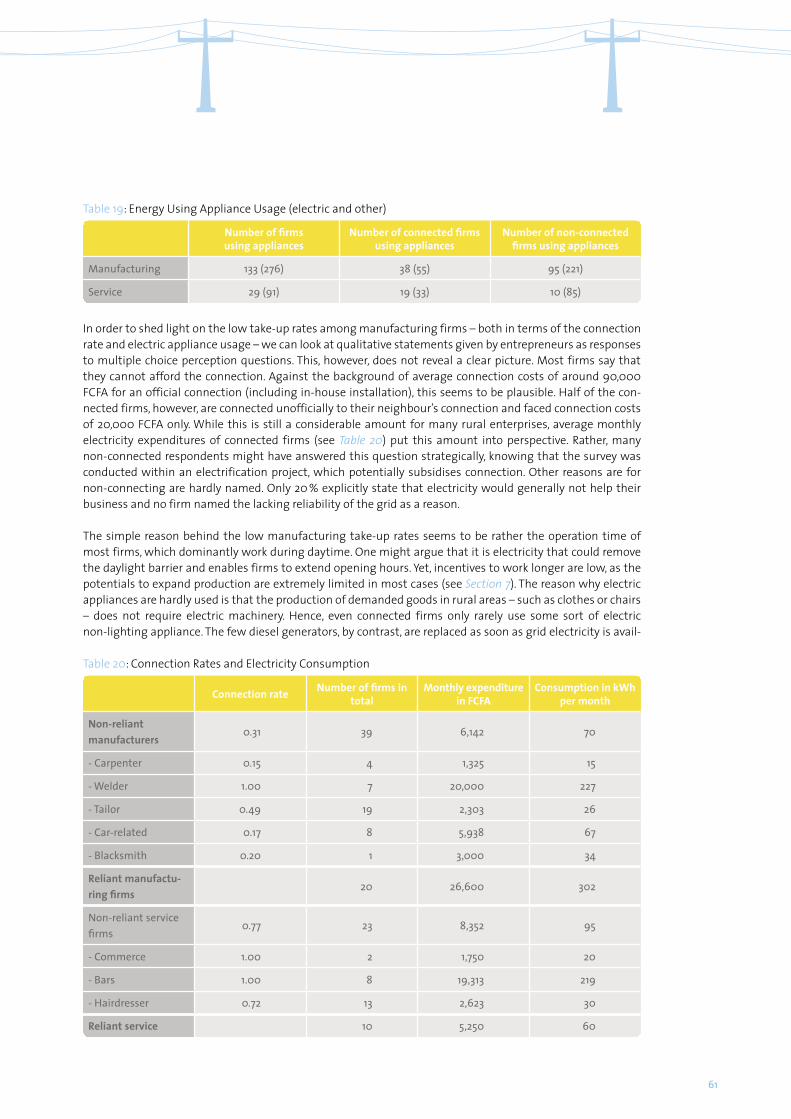
61
In order to shed light on the low take-up rates among manufacturing firms – both in terms of the connection rate and electric appliance usage – we can look at qualitative statements given by entrepreneurs as responses to multiple choice perception questions. This, however, does not reveal a clear picture. Most firms say that they cannot afford the connection. Against the background of average connection costs of around 90,000 FCFA for an official connection (including in-house installation), this seems to be plausible. Half of the con-nected firms, however, are connected unofficially to their neighbour’s connection and faced connection costs of 20,000 FCFA only. While this is still a considerable amount for many rural enterprises, average monthly electricity expenditures of connected firms (see Table 20) put this amount into perspective. Rather, many non-connected respondents might have answered this question strategically, knowing that the survey was conducted within an electrification project, which potentially subsidises connection. Other reasons are for non-connecting are hardly named. Only 20 % explicitly state that electricity would generally not help their business and no firm named the lacking reliability of the grid as a reason.
The simple reason behind the low manufacturing take-up rates seems to be rather the operation time of most firms, which dominantly work during daytime. One might argue that it is electricity that could remove the daylight barrier and enables firms to extend opening hours. Yet, incentives to work longer are low, as the potentials to expand production are extremely limited in most cases (see Section 7). The reason why electric appliances are hardly used is that the production of demanded goods in rural areas – such as clothes or chairs – does not require electric machinery. Hence, even connected firms only rarely use some sort of electric non-lighting appliance. The few diesel generators, by contrast, are replaced as soon as grid electricity is avail-
Table 19: Energy Using Appliance Usage (electric and other)
Number of firms using appliances
Number of connected firms using appliances
Number of non-connected firms using appliances
Manufacturing 133 (276) 38 (55) 95 (221)
Service 29 (91) 19 (33) 10 (85)
Table 20: Connection Rates and Electricity Consumption
Connection rate Number of firms in total
Monthly expenditure in FCFA
Consumption in kWh per month
Non-reliant manufacturers
0.31 39 6,142 70
- Carpenter 0.15 4 1,325 15
- Welder 1.00 7 20,000 227
- Tailor 0.49 19 2,303 26
- Car-related 0.17 8 5,938 67
- Blacksmith 0.20 1 3,000 34
Reliant manufactu-ring firms
20 26,600 302
Non-reliant service firms
0.77 23 8,352 95
- Commerce 1.00 2 1,750 20
- Bars 1.00 8 19,313 219
- Hairdresser 0.72 13 2,623 30
Reliant service 10 5,250 60
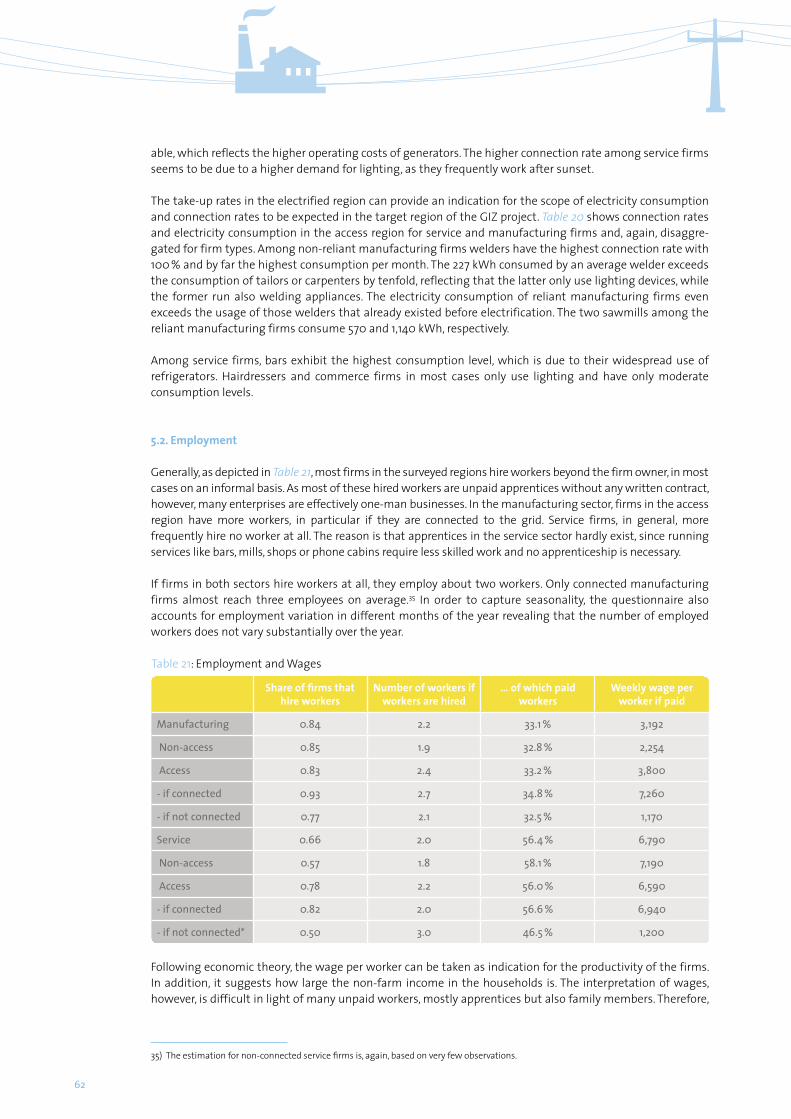
62
able, which reflects the higher operating costs of generators. The higher connection rate among service firms seems to be due to a higher demand for lighting, as they frequently work after sunset.
The take-up rates in the electrified region can provide an indication for the scope of electricity consumption and connection rates to be expected in the target region of the GIZ project. Table 20 shows connection rates and electricity consumption in the access region for service and manufacturing firms and, again, disaggre-gated for firm types. Among non-reliant manufacturing firms welders have the highest connection rate with 100 % and by far the highest consumption per month. The 227 kWh consumed by an average welder exceeds the consumption of tailors or carpenters by tenfold, reflecting that the latter only use lighting devices, while the former run also welding appliances. The electricity consumption of reliant manufacturing firms even exceeds the usage of those welders that already existed before electrification. The two sawmills among the reliant manufacturing firms consume 570 and 1,140 kWh, respectively.
Among service firms, bars exhibit the highest consumption level, which is due to their widespread use of refrigerators. Hairdressers and commerce firms in most cases only use lighting and have only moderate consumption levels.
5.2. Employment
Generally, as depicted in Table 21, most firms in the surveyed regions hire workers beyond the firm owner, in most cases on an informal basis. As most of these hired workers are unpaid apprentices without any written contract, however, many enterprises are effectively one-man businesses. In the manufacturing sector, firms in the access region have more workers, in particular if they are connected to the grid. Service firms, in general, more frequently hire no worker at all. The reason is that apprentices in the service sector hardly exist, since running services like bars, mills, shops or phone cabins require less skilled work and no apprenticeship is necessary.
If firms in both sectors hire workers at all, they employ about two workers. Only connected manufacturing firms almost reach three employees on average.35 In order to capture seasonality, the questionnaire also accounts for employment variation in different months of the year revealing that the number of employed workers does not vary substantially over the year.
35) The estimation for non-connected service firms is, again, based on very few observations.
Table 21: Employment and Wages
Share of firms that hire workers
Number of workers if workers are hired
… of which paid workers
Weekly wage per worker if paid
Manufacturing 0.84 2.2 33.1 % 3,192
Non-access 0.85 1.9 32.8 % 2,254
Access 0.83 2.4 33.2 % 3,800
- if connected 0.93 2.7 34.8 % 7,260
- if not connected 0.77 2.1 32.5 % 1,170
Service 0.66 2.0 56.4 % 6,790
Non-access 0.57 1.8 58.1 % 7,190
Access 0.78 2.2 56.0 % 6,590
- if connected 0.82 2.0 56.6 % 6,940
- if not connected* 0.50 3.0 46.5 % 1,200
Following economic theory, the wage per worker can be taken as indication for the productivity of the firms. In addition, it suggests how large the non-farm income in the households is. The interpretation of wages, however, is difficult in light of many unpaid workers, mostly apprentices but also family members. Therefore,

63
we exclude unpaid workers and investigate the average wage of paid workers only as an indicator both for productivity and income generation. Here, we find large differences between the groups. Workers in the man-ufacturing sector earn around 3,000 FCFA per week, while those in service firms receive some 6,800 FCFA on average. In the service sector, paid workers in the access and non-access region earn relatively comparable wages with the non-access region exhibiting slightly higher remuneration.
Among manufacturing firms, however, firms in the access region pay considerably higher wages, which is mainly due to the connected firms that pay around 7,300 FCFA on average. A wage of around 1,200 FCFA in non-connected manufacturing firms in the access region is the lowest in the whole sample. Interpreting this difference between connected and non-connected firms, however, has to be done carefully. First, a closer look into the data shows that the magnitude of the wages paid in connected manufacturing firms is mainly driven by the electricity-reliant enterprises, which pay as much as 28,000 FCFA per week (not depicted in Table 21). Second, selection processes are quite likely to be responsible for parts of the difference: those firms that already paid higher wages before electrification are more likely to get connected. Also the connected non- reliant enterprises still pay 4,300 FCFA per week.
5.3. Capital
Capital is measured as the aggregated value of the capital stock possessed by the enterprise at resale values. For this purpose data on all equipment, machinery, larger tools and vehicles was collected in the survey. To draw a conclusion on how the capital stock might change after electrification, subgroups for capital are created: electricity-using machinery and appliances, appliances driven by other energy sources (i.e. genera-tors), simple hand tools and vehicles.
At the first glance the capital endowment among service firms is substantially higher in the access region. Yet, it has to be noted that the magnitude is drastically dominated by transport capital like cars, trucks or motorcy-cles. Among service firms in the access region this accounts for more than 80 %. While 30 % of the service firms own a motorcycle with an average value of 260,000 FCFA, transport capital goods depicted in Table 22 are dom-inated by only three firms that own expensive cars and trucks with an average value of 2.5 million FCFA.
But also apart from transport capital the capital stock in the access region is considerably higher. It seems that enterprises in the access region and notably those using electricity invest in electric appliances as well as in furni-ture and accessories they use for their service. Hence, their capital stock – also net of transport – is much higher.
Although only one service firm in the non-access region declares to own a generator, 32 enterprises use some sort of electric appliance explaining the relatively large amount of electricity-based capital in the non-access region. These appliances are widely dominated by radios and mobile phones that can, as a matter of course, also be run without a direct electricity connection. Yet, also some color television sets and electric fridges are used, which might come as a surprise. In fact, as non-questionnaire information from the field shows, some firms already acquired such smaller appliances because they wait to be connected soon. Some also have appliances that are broken and intend to repair them in case of electricity access.
Table 22: Average Capital Stock per Firm in the Service Sector (in FCFA)
Access Non-Access
Total Access Connected Non-Connected
Energy but not electricity-using appliances
6,125 7,424 2,069 2,353
Electric appliances 183,525 222,000 2,143 61,529
Transport 2,032,000 2,463,030 0 90,451
Tools and furniture used for service
205,138 214,333 161,785 76,705
Total 2,426,788 2,906,787 165,997 231,038
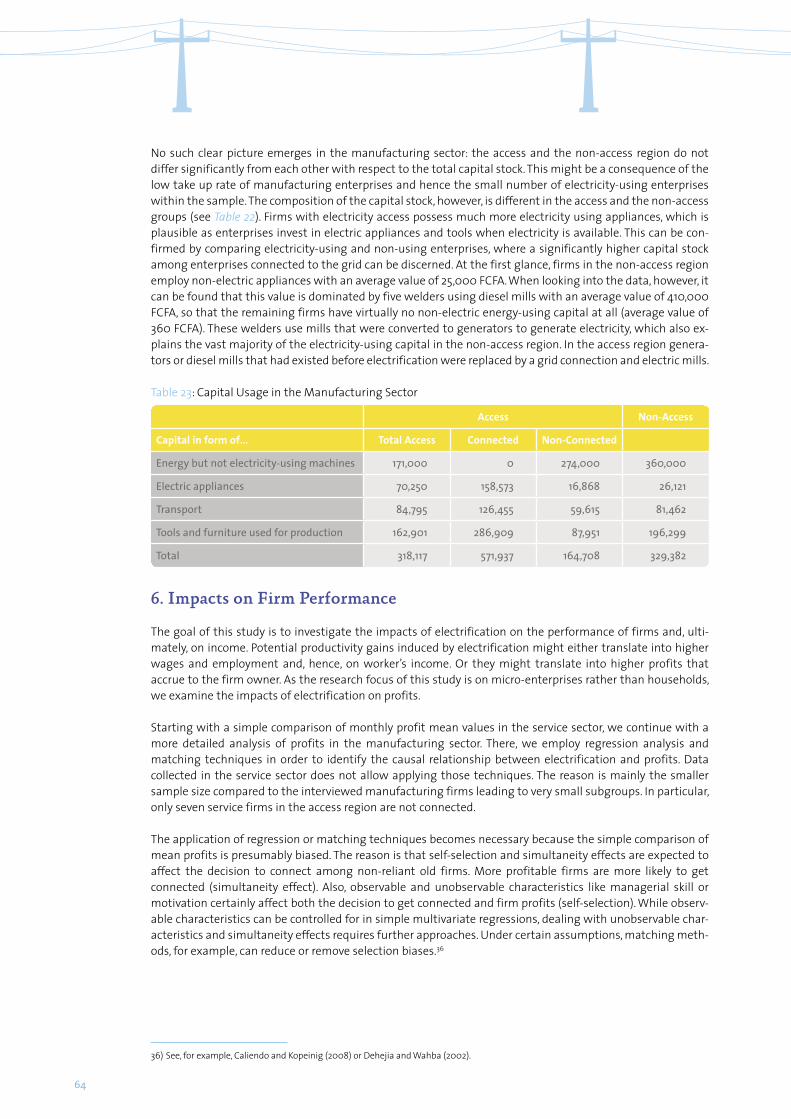
64
No such clear picture emerges in the manufacturing sector: the access and the non-access region do not differ significantly from each other with respect to the total capital stock. This might be a consequence of the low take up rate of manufacturing enterprises and hence the small number of electricity-using enterprises within the sample. The composition of the capital stock, however, is different in the access and the non-access groups (see Table 22). Firms with electricity access possess much more electricity using appliances, which is plausible as enterprises invest in electric appliances and tools when electricity is available. This can be con-firmed by comparing electricity-using and non-using enterprises, where a significantly higher capital stock among enterprises connected to the grid can be discerned. At the first glance, firms in the non-access region employ non-electric appliances with an average value of 25,000 FCFA. When looking into the data, however, it can be found that this value is dominated by five welders using diesel mills with an average value of 410,000 FCFA, so that the remaining firms have virtually no non-electric energy-using capital at all (average value of 360 FCFA). These welders use mills that were converted to generators to generate electricity, which also ex-plains the vast majority of the electricity-using capital in the non-access region. In the access region genera-tors or diesel mills that had existed before electrification were replaced by a grid connection and electric mills.
6. Impacts on Firm Performance
The goal of this study is to investigate the impacts of electrification on the performance of firms and, ulti-mately, on income. Potential productivity gains induced by electrification might either translate into higher wages and employment and, hence, on worker’s income. Or they might translate into higher profits that accrue to the firm owner. As the research focus of this study is on micro-enterprises rather than households, we examine the impacts of electrification on profits.
Starting with a simple comparison of monthly profit mean values in the service sector, we continue with a more detailed analysis of profits in the manufacturing sector. There, we employ regression analysis and matching techniques in order to identify the causal relationship between electrification and profits. Data collected in the service sector does not allow applying those techniques. The reason is mainly the smaller sample size compared to the interviewed manufacturing firms leading to very small subgroups. In particular, only seven service firms in the access region are not connected.
The application of regression or matching techniques becomes necessary because the simple comparison of mean profits is presumably biased. The reason is that self-selection and simultaneity effects are expected to affect the decision to connect among non-reliant old firms. More profitable firms are more likely to get connected (simultaneity effect). Also, observable and unobservable characteristics like managerial skill or motivation certainly affect both the decision to get connected and firm profits (self-selection). While observ-able characteristics can be controlled for in simple multivariate regressions, dealing with unobservable char-acteristics and simultaneity effects requires further approaches. Under certain assumptions, matching meth-ods, for example, can reduce or remove selection biases.36
Table 23: Capital Usage in the Manufacturing Sector
Access Non-Access
Capital in form of… Total Access Connected Non-Connected
Energy but not electricity-using machines 171,000 0 274,000 360,000
Electric appliances 70,250 158,573 16,868 26,121
Transport 84,795 126,455 59,615 81,462
Tools and furniture used for production 162,901 286,909 87,951 196,299
Total 318,117 571,937 164,708 329,382
36) See, for example, Caliendo and Kopeinig (2008) or Dehejia and Wahba (2002).

65
6.1. Profits in the Service Sector
At first blush, the profits of service enterprises in the access region, particularly the connected ones, are much higher than those in the non-access region. Much of this difference, however, is driven by one extreme outlier: a grid-connected shop declares profits of more than 3 million FCFA, while only 7 other firms have profits exceeding 500,000 FCFA, none of them reaches the 1,000,000 mark. Although qualitative information from the field suggests the rough accuracy of this figure, it appears reasonable to exclude this firm from the sam-ple. First, because it does not seem to be representative for the typical firm in the region. A second reason is that the outlier firm exhibits an electricity consumption of less than 30 kWh per month indicating that the huge profit has not much to do with electricity usage.
Therefore, Table 24 shows the mean profit values excluding the described outlier. Still, access firms perform better than non-access firms – with a considerable difference of more than 20,000 FCFA. Taking into account the stand-ard error, however, the difference between access and non-access region is not statistically different from zero.
Connected firms, again, outperform the non-connected ones and are clearly responsible for higher profits in the access region (Table 25). Non-connected firms even earn less than the firms in the non-access region. Nevertheless, the difference is statistically not significant. In addition, interpreting the positive difference as an impact of electrification is difficult, as poorly performing firms are certainly more likely to abstain from getting connected. In addition, it comes as a surprise that electricity-reliant service firms exhibit profits below those of the non-reliant service firms (82,300 FCFA). Apparently, in the service sector the newly-created firms are not necessarily the high-performers.
6.2. Profits in the Manufacturing Sector
Compared to the service sector, the data availability in the manufacturing sector allows a more intensive investigation of the profits of manufacturing firms and their relation to electrification. We first investigate the simple difference in means and look at the robustness of this result in the light of observable confounding effects. For this purpose, we use Ordinary Least Squares (OLS) regression analysis and a matching approach.
6.2.1. Difference in Means
As in the service sector, monthly profits of manufacturing firms are higher in the access than in the non- access region, with a difference of 13,540 FCFA, which again is statistically not significant (see Table 25).
Table 24: Profits in the service sector, access and non-access region
Access Non-Access Difference Standard Error
Monthly profits (1,000 FCFA) 85.25 64.53 20.72 15.14
# firms 39 51
Table 25: Profits in the Service Sector, Connected and Non-Connected Firms
Connected FirmsNon-Connected
FirmsDifference Standard Error
Monthly profits (1,000 FCFA) 92.64 51.48 41.16 33.87
# firms 32 7
Table 26: Mean Performance Indicators by Access and Non-Access Region
Access No Access Difference Standard Error
Monthly profits (1,000 FCFA) 87.10 73.56 13.54 11.54
# firms 146 130
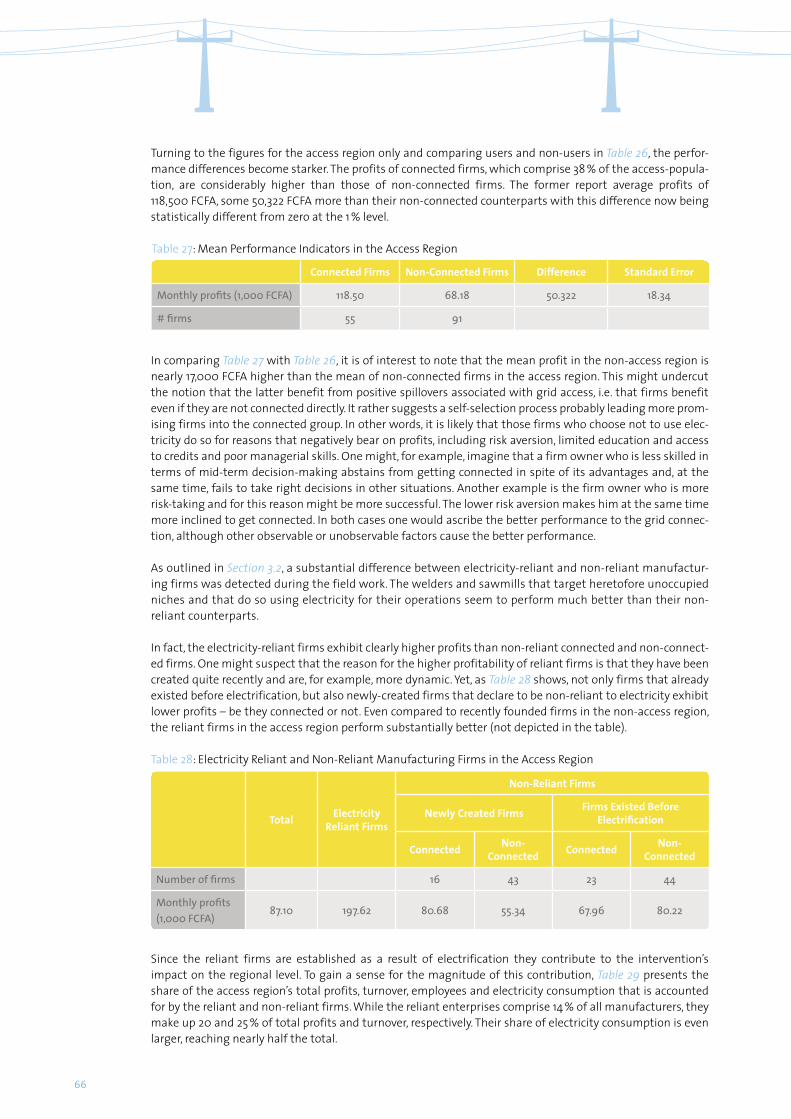
66
Turning to the figures for the access region only and comparing users and non-users in Table 26, the perfor-mance differences become starker. The profits of connected firms, which comprise 38 % of the access-popula-tion, are considerably higher than those of non-connected firms. The former report average profits of 118,500 FCFA, some 50,322 FCFA more than their non-connected counterparts with this difference now being statistically different from zero at the 1 % level.
Table 27: Mean Performance Indicators in the Access Region
Connected Firms Non-Connected Firms Difference Standard Error
Monthly profits (1,000 FCFA) 118.50 68.18 50.322 18.34
# firms 55 91
In comparing Table 27 with Table 26, it is of interest to note that the mean profit in the non-access region is nearly 17,000 FCFA higher than the mean of non-connected firms in the access region. This might undercut the notion that the latter benefit from positive spillovers associated with grid access, i.e. that firms benefit even if they are not connected directly. It rather suggests a self-selection process probably leading more prom-ising firms into the connected group. In other words, it is likely that those firms who choose not to use elec-tricity do so for reasons that negatively bear on profits, including risk aversion, limited education and access to credits and poor managerial skills. One might, for example, imagine that a firm owner who is less skilled in terms of mid-term decision-making abstains from getting connected in spite of its advantages and, at the same time, fails to take right decisions in other situations. Another example is the firm owner who is more risk-taking and for this reason might be more successful. The lower risk aversion makes him at the same time more inclined to get connected. In both cases one would ascribe the better performance to the grid connec-tion, although other observable or unobservable factors cause the better performance.
As outlined in Section 3.2, a substantial difference between electricity-reliant and non-reliant manufactur-ing firms was detected during the field work. The welders and sawmills that target heretofore unoccupied niches and that do so using electricity for their operations seem to perform much better than their non-reliant counterparts.
In fact, the electricity-reliant firms exhibit clearly higher profits than non-reliant connected and non-connect-ed firms. One might suspect that the reason for the higher profitability of reliant firms is that they have been created quite recently and are, for example, more dynamic. Yet, as Table 28 shows, not only firms that already existed before electrification, but also newly-created firms that declare to be non-reliant to electricity exhibit lower profits – be they connected or not. Even compared to recently founded firms in the non-access region, the reliant firms in the access region perform substantially better (not depicted in the table).
Since the reliant firms are established as a result of electrification they contribute to the intervention’s impact on the regional level. To gain a sense for the magnitude of this contribution, Table 29 presents the share of the access region’s total profits, turnover, employees and electricity consumption that is accounted for by the reliant and non-reliant firms. While the reliant enterprises comprise 14 % of all manufacturers, they make up 20 and 25 % of total profits and turnover, respectively. Their share of electricity consumption is even larger, reaching nearly half the total.
Table 28: Electricity Reliant and Non-Reliant Manufacturing Firms in the Access Region
Total Electricity Reliant Firms
Non-Reliant Firms
Newly Created Firms Firms Existed Before Electrification
Connected Non- Connected Connected Non-
Connected
Number of firms 16 43 23 44
Monthly profits (1,000 FCFA)
87.10 197.62 80.68 55.34 67.96 80.22

67
Although these figures convey seemingly impressive impacts of electrification via new firm creation, it bears recognising that they obscure the broader implications for economic welfare by omitting any accounting of offsetting effects. The most immediate of these effects are job losses and decreased profits among competing traditional manufacturers, also referred to as crowding out effects, along with indirect impacts on the upstream businesses that supply the traditional manufacturers. Moreover, to the extent that parts of local consumer purchasing power are diverted to the new electricity reliant manufacturers, existing non-reliant manufacturers are likely to suffer a drain on business (budget effect). Finally, we should recall that the catego-risation into reliant and non-reliant firms was done based on a self-judgment of the respondents. Although qualitative information from the field supports the accuracy of answers doubts might remain that some of the reliant firms would have also been established had there been no electrification intervention.
While it is reasonable to include the electricity reliant firms in the assessment of impacts on the regional level, it is not so if one wants to determine the impact on firm level: here, it is unwarranted to compare elec-tricity-reliant firms to firms that are not connected or do not have access to electricity. The reason is, as a mat-ter of course, that there are no comparable firms among the untreated firms to these electricity-reliant ones, simply because they cannot exist in regions without electricity. Therefore, to explore the impact on the firm level, we consequently removed the 14 % of electricity-reliant manufacturing enterprises established after electrification and recalculated the means.
As indicated by the figures in Table 30, this results in a markedly different picture from that presented above. The average profits of enterprises in the access region drop dramatically and are actually lower than the profits in the non-access region.
A similar pattern is revealed when comparing connected and non-connected firms in the access region. Prof-its decrease precipitously with the exclusion of electricity-reliant firms, by some 38%. Nevertheless, in this in-stance the connected firms still register profits that are 8 % higher than those of the non-users (see Table 31).
Table 29: Contribution of Electricity-Reliant Firms to the Local Economy
Profits Turnover Employees Electricity Consumption # of Firms % of Firms
Electricity-reliant firms
0.20 0.25 0.15 0.47 20 0.14
Electricity non-reliant firms
0.80 0.75 0.85 0.53 126 0.86
Table 30: Mean Performance Indicators by Region, Excluding Electricity-Reliant Firms
Access No Access Difference Standard Error
Monthly profits (1000 FCFA) 69.55 85.14 -15.590 11.93
# firms 126 130
Table 31: Mean Profits in the Access Region, Excluding Electricity-Reliant Firms
Connected Firms Non-Connected Firms Difference Standard Error
Monthly profits (1,000 FCFA) 73.18 67.93 5.251 11.85
# firms 39 87
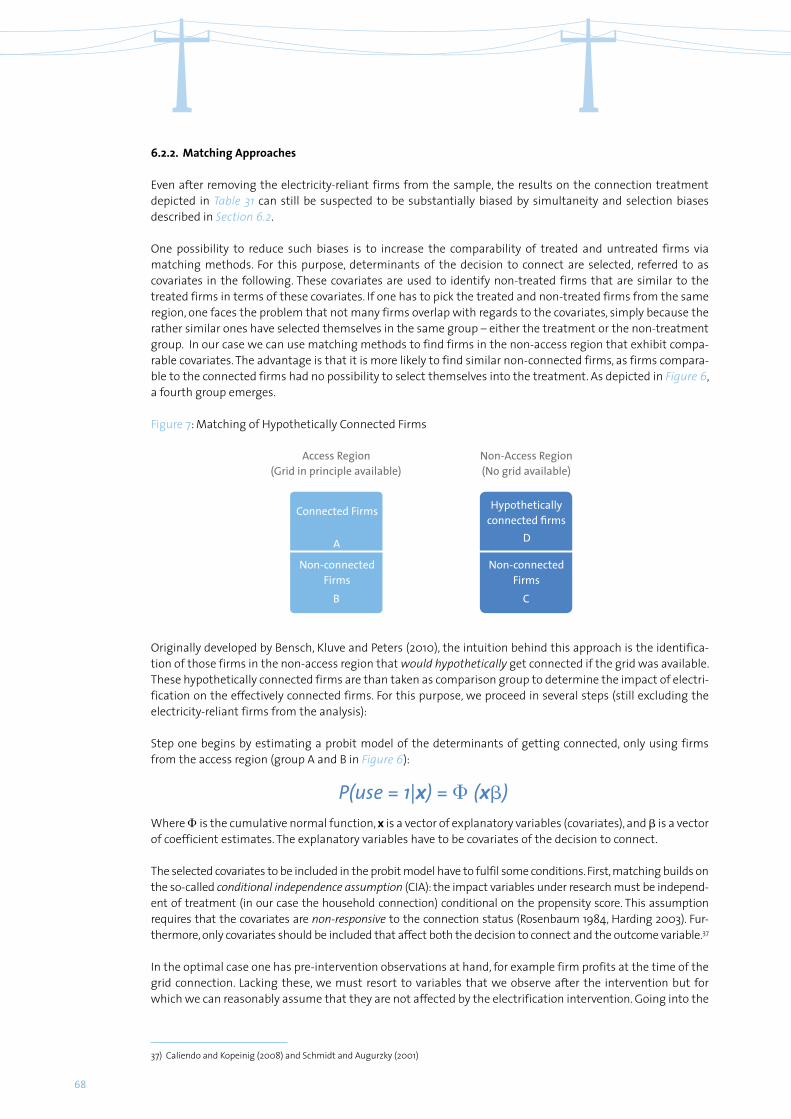
68
Originally developed by Bensch, Kluve and Peters (2010), the intuition behind this approach is the identifica-tion of those firms in the non-access region that would hypothetically get connected if the grid was available. These hypothetically connected firms are than taken as comparison group to determine the impact of electri-fication on the effectively connected firms. For this purpose, we proceed in several steps (still excluding the electricity-reliant firms from the analysis):
Step one begins by estimating a probit model of the determinants of getting connected, only using firms from the access region (group A and B in Figure 6):
Where Φ is the cumulative normal function, x is a vector of explanatory variables (covariates), and β is a vector of coefficient estimates. The explanatory variables have to be covariates of the decision to connect.
The selected covariates to be included in the probit model have to fulfil some conditions. First, matching builds on the so-called conditional independence assumption (CIA): the impact variables under research must be independ-ent of treatment (in our case the household connection) conditional on the propensity score. This assumption requires that the covariates are non-responsive to the connection status (Rosenbaum 1984, Harding 2003). Fur-thermore, only covariates should be included that affect both the decision to connect and the outcome variable.37
In the optimal case one has pre-intervention observations at hand, for example firm profits at the time of the grid connection. Lacking these, we must resort to variables that we observe after the intervention but for which we can reasonably assume that they are not affected by the electrification intervention. Going into the
6.2.2. Matching Approaches
Even after removing the electricity-reliant firms from the sample, the results on the connection treatment depicted in Table 31 can still be suspected to be substantially biased by simultaneity and selection biases described in Section 6.2.
One possibility to reduce such biases is to increase the comparability of treated and untreated firms via matching methods. For this purpose, determinants of the decision to connect are selected, referred to as covariates in the following. These covariates are used to identify non-treated firms that are similar to the treated firms in terms of these covariates. If one has to pick the treated and non-treated firms from the same region, one faces the problem that not many firms overlap with regards to the covariates, simply because the rather similar ones have selected themselves in the same group – either the treatment or the non-treatment group. In our case we can use matching methods to find firms in the non-access region that exhibit compa-rable covariates. The advantage is that it is more likely to find similar non-connected firms, as firms compara-ble to the connected firms had no possibility to select themselves into the treatment. As depicted in Figure 6, a fourth group emerges.
A
Connected Firms
Access Region(Grid in principle available)
Non-Access Region(No grid available)
Hypothetically connected firms
B C
Non-connected Firms
Non-connected Firms
Figure 7: Matching of Hypothetically Connected Firms
D
37) Caliendo and Kopeinig (2008) and Schmidt and Augurzky (2001)
P(use = 1|x) = Φ (xβ)
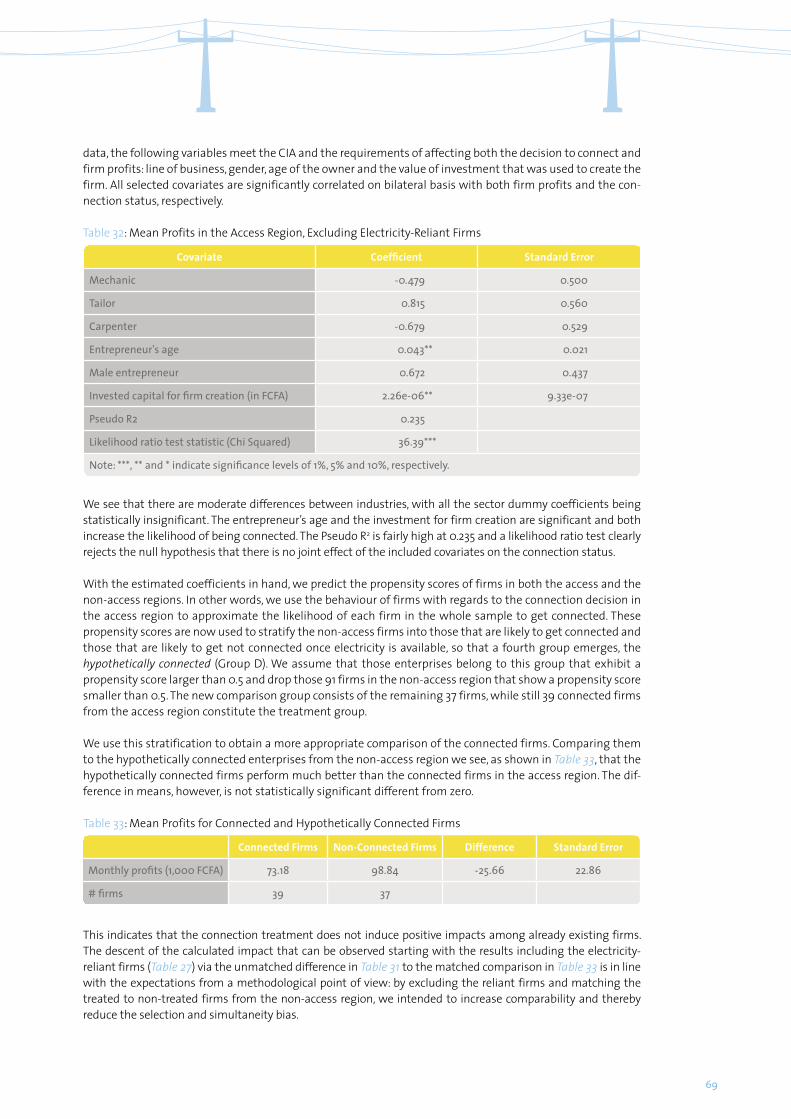
69
data, the following variables meet the CIA and the requirements of affecting both the decision to connect and firm profits: line of business, gender, age of the owner and the value of investment that was used to create the firm. All selected covariates are significantly correlated on bilateral basis with both firm profits and the con-nection status, respectively.
We see that there are moderate differences between industries, with all the sector dummy coefficients being statistically insignificant. The entrepreneur’s age and the investment for firm creation are significant and both increase the likelihood of being connected. The Pseudo R2 is fairly high at 0.235 and a likelihood ratio test clearly rejects the null hypothesis that there is no joint effect of the included covariates on the connection status.
With the estimated coefficients in hand, we predict the propensity scores of firms in both the access and the non-access regions. In other words, we use the behaviour of firms with regards to the connection decision in the access region to approximate the likelihood of each firm in the whole sample to get connected. These propensity scores are now used to stratify the non-access firms into those that are likely to get connected and those that are likely to get not connected once electricity is available, so that a fourth group emerges, the hypothetically connected (Group D). We assume that those enterprises belong to this group that exhibit a propensity score larger than 0.5 and drop those 91 firms in the non-access region that show a propensity score smaller than 0.5. The new comparison group consists of the remaining 37 firms, while still 39 connected firms from the access region constitute the treatment group.
We use this stratification to obtain a more appropriate comparison of the connected firms. Comparing them to the hypothetically connected enterprises from the non-access region we see, as shown in Table 33, that the hypothetically connected firms perform much better than the connected firms in the access region. The dif-ference in means, however, is not statistically significant different from zero.
This indicates that the connection treatment does not induce positive impacts among already existing firms. The descent of the calculated impact that can be observed starting with the results including the electricity- reliant firms (Table 27) via the unmatched difference in Table 31 to the matched comparison in Table 33 is in line with the expectations from a methodological point of view: by excluding the reliant firms and matching the treated to non-treated firms from the non-access region, we intended to increase comparability and thereby reduce the selection and simultaneity bias.
Table 32: Mean Profits in the Access Region, Excluding Electricity-Reliant Firms
Covariate Coefficient Standard Error
Mechanic -0.479 0.500
Tailor 0.815 0.560
Carpenter -0.679 0.529
Entrepreneur's age 0.043** 0.021
Male entrepreneur 0.672 0.437
Invested capital for firm creation (in FCFA) 2.26e-06** 9.33e-07
Pseudo R2 0.235
Likelihood ratio test statistic (Chi Squared) 36.39***
Note: ***, ** and * indicate significance levels of 1%, 5% and 10%, respectively.
Table 33: Mean Profits for Connected and Hypothetically Connected Firms
Connected Firms Non-Connected Firms Difference Standard Error
Monthly profits (1,000 FCFA) 73.18 98.84 -25.66 22.86
# firms 39 37

70
As robustness check, we applied conventional propensity score matching algorithms that match treated and untreated firms individually. Both nearest neighbour and Kernel matching confirm that hypothetically connected firms perform better – but still with this difference being insignificant.38
Recapitulating, we observe that the initial difference in monthly profits of 50,322 FCFA revealed from a simple comparison of connected to non-connected firms in the access region conveys a misleading indicator of elec-trification impacts. Removing the electricity-reliant firms, which comprise a relatively small share of the sam-ple, decreases this difference nearly tenfold to 5,664. Finally, by matching the treated to non-treated firms from both the access and non-access region, the difference actually reverses in sign and suggests that non-connected firms have profits that exceed those of non-reliant connected ones. This result is confirmed by all matching techniques with the negative difference being insignificant in all cases, however. While the absence of positive effects of electrification on existing firms might come as a surprise, the next section provides for explanations based on theoretical considerations and qualitative findings from the field work.
7. Microeconomic Considerations of Firm Behavior
Non-rigorous and qualitative information from the field work suggest that one reason for the lack of positive impacts and the potentially even weaker performance of non-reliant connected firms compared to comparable non-connected firms could be what one might refer to as the electrification trap: firms decide to invest in the grid connection without having properly elaborated business plans and the required information at hand. As a consequence, they might overestimate the profitability of this investment given prevailing market conditions. While certainly many entrepreneurs take the decision to connect rationally, others may proceed on the premise that electricity is a prerequisite to modernise, neglecting the full implications for their business operations.39
In contrast to the electricity-reliant manufacturers, whose products typically fill a new market niche, the pre-existing manufacturers offer products that already exist, with limited, if any, access to external markets. Consequently, even if the variable costs of electrified capital initially fall as economies of scale are achieved, the firm may nevertheless not be able to reach the optimal scale of production for lack of sufficient demand.
This circumstance is illustrated in Figure 8, which shows the total revenue (TR) and total cost (TC) schedules corresponding to a labour-intensive and a capital-intensive production technology in the lower and upper panels, respectively. As in classical models, the TR curve passes straight through the origin because of constant prices at all levels of output (Koutsoyiannis 1979). The TC curve, by contrast, is non-linear. It initially becomes flatter as a result of economies of scale but subsequently rises at an increasing rate, reflecting the increased costs of expanding output with fixed stocks of labour and capital over the short-run. Shaded areas of the graph indicate production levels at which production costs are higher than revenues, meaning that the firm incurs losses. The optimal production point using the labour-intensive technology is point YL, where the differ-ence between total revenue and total costs – profits – is maximised. By contrast, using the capital-intensive technology, production at point YL would result in losses. Profits using this technology are instead maximised at a higher production level corresponding to point YK*.
Whether the firm switches to the capital-intensive production technology made available by electricity de-pends fundamentally on whether the demand exists to sufficiently increase production beyond point YL. Although the attainable profits from this technology are higher than those with the labour-intensive tech-nology, the firm may not be able to reach the corresponding level of production because of an inability to expand its customer base beyond that of the local market within which it is situated. In the stylised depiction of Figure 7, the labour-intensive firm must increase production by the amount given by the line segment YLYK in order to attain at least the profit level of its labour intensive production technology. Only if market poten-tials are sufficient to absorb at least Yk should the firm decide to invest in an electricity connection and the respective machinery.
38) The procedure, the results as well as the balancing of matched subsamples are presented in Peters, Vance and Harsdorff (2011).
39) Thom (2000: 36) reports a similar observation for households in South Africa, which acquire electric appliances for symbolic reasons.
‘Usefulness and cost are only one of the factors that influence’ the decision to invest in equipment.
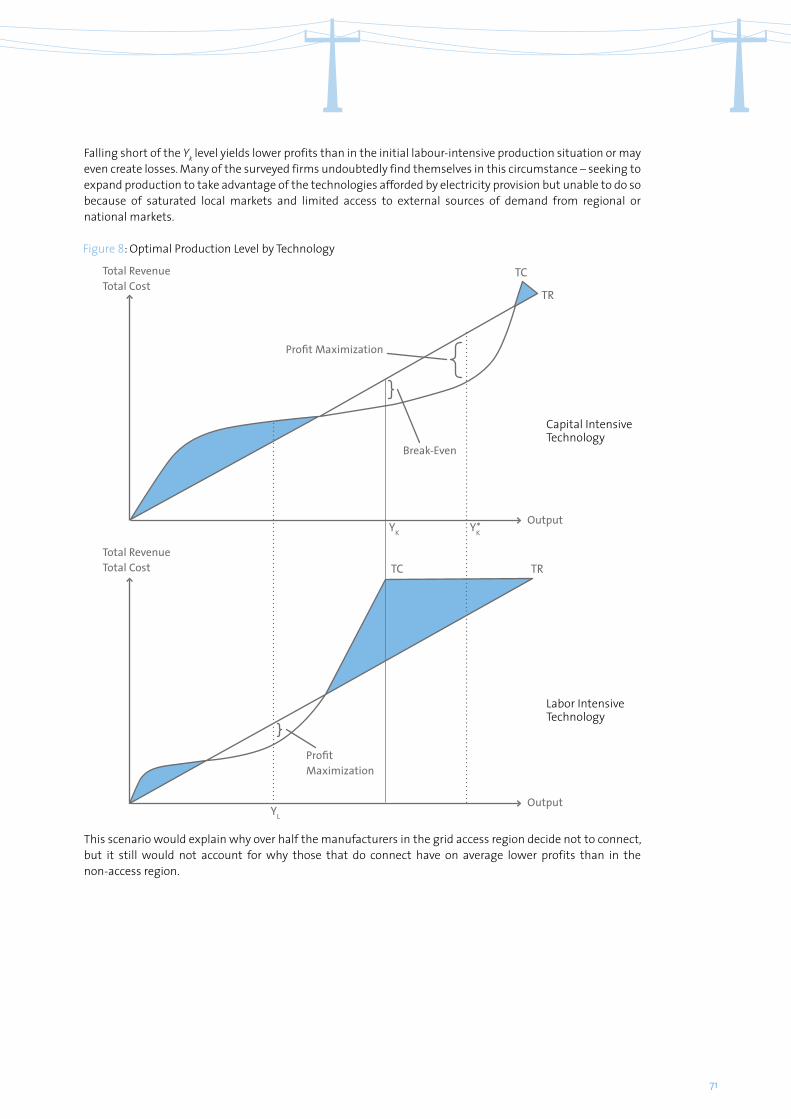
71
Falling short of the Yk level yields lower profits than in the initial labour-intensive production situation or may even create losses. Many of the surveyed firms undoubtedly find themselves in this circumstance – seeking to expand production to take advantage of the technologies afforded by electricity provision but unable to do so because of saturated local markets and limited access to external sources of demand from regional or national markets.
This scenario would explain why over half the manufacturers in the grid access region decide not to connect, but it still would not account for why those that do connect have on average lower profits than in the non-access region.
Total RevenueTotal Cost
Profit Maximization
Profit Maximization
Break-Even
Total RevenueTotal Cost
Output
OutputYL
YK
TC
TC
TR
TR
Figure 8: Optimal Production Level by Technology
Capital IntensiveTechnology
Labor IntensiveTechnology
YK*
<
<
<
<
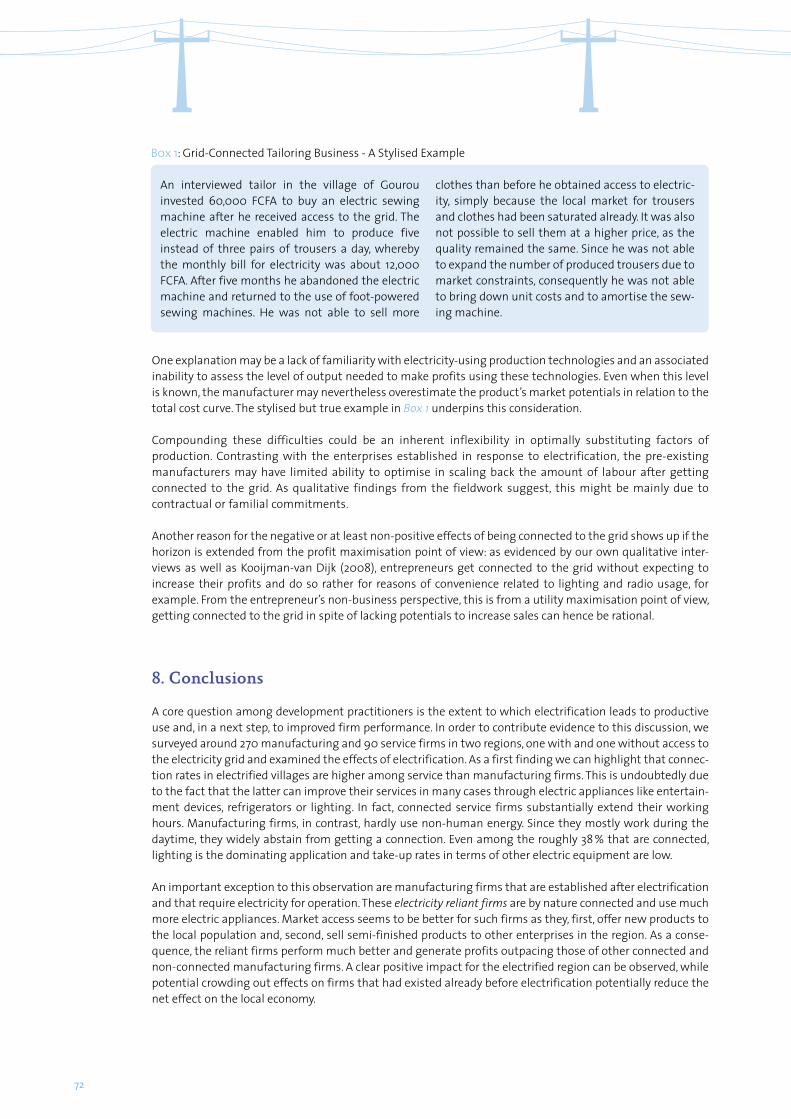
72
B0x 1: Grid-Connected Tailoring Business - A Stylised Example
An interviewed tailor in the village of Gourou invested 60,000 FCFA to buy an electric sewing machine after he received access to the grid. The electric machine enabled him to produce five instead of three pairs of trousers a day, whereby the monthly bill for electricity was about 12,000 FCFA. After five months he abandoned the electric machine and returned to the use of foot-powered sewing machines. He was not able to sell more
clothes than before he obtained access to electric-ity, simply because the local market for trousers and clothes had been saturated already. It was also not possible to sell them at a higher price, as the quality remained the same. Since he was not able to expand the number of produced trousers due to market constraints, consequently he was not able to bring down unit costs and to amortise the sew-ing machine.
One explanation may be a lack of familiarity with electricity-using production technologies and an associated inability to assess the level of output needed to make profits using these technologies. Even when this level is known, the manufacturer may nevertheless overestimate the product’s market potentials in relation to the total cost curve. The stylised but true example in Box 1 underpins this consideration.
Compounding these difficulties could be an inherent inflexibility in optimally substituting factors of production. Contrasting with the enterprises established in response to electrification, the pre-existing manufacturers may have limited ability to optimise in scaling back the amount of labour after getting connected to the grid. As qualitative findings from the fieldwork suggest, this might be mainly due to contractual or familial commitments.
Another reason for the negative or at least non-positive effects of being connected to the grid shows up if the horizon is extended from the profit maximisation point of view: as evidenced by our own qualitative inter-views as well as Kooijman-van Dijk (2008), entrepreneurs get connected to the grid without expecting to increase their profits and do so rather for reasons of convenience related to lighting and radio usage, for example. From the entrepreneur’s non-business perspective, this is from a utility maximisation point of view, getting connected to the grid in spite of lacking potentials to increase sales can hence be rational.
8. Conclusions
A core question among development practitioners is the extent to which electrification leads to productive use and, in a next step, to improved firm performance. In order to contribute evidence to this discussion, we surveyed around 270 manufacturing and 90 service firms in two regions, one with and one without access to the electricity grid and examined the effects of electrification. As a first finding we can highlight that connec-tion rates in electrified villages are higher among service than manufacturing firms. This is undoubtedly due to the fact that the latter can improve their services in many cases through electric appliances like entertain-ment devices, refrigerators or lighting. In fact, connected service firms substantially extend their working hours. Manufacturing firms, in contrast, hardly use non-human energy. Since they mostly work during the daytime, they widely abstain from getting a connection. Even among the roughly 38 % that are connected, lighting is the dominating application and take-up rates in terms of other electric equipment are low.
An important exception to this observation are manufacturing firms that are established after electrification and that require electricity for operation. These electricity reliant firms are by nature connected and use much more electric appliances. Market access seems to be better for such firms as they, first, offer new products to the local population and, second, sell semi-finished products to other enterprises in the region. As a conse-quence, the reliant firms perform much better and generate profits outpacing those of other connected and non-connected manufacturing firms. A clear positive impact for the electrified region can be observed, while potential crowding out effects on firms that had existed already before electrification potentially reduce the net effect on the local economy.

73
For the firms in the manufacturing sector established prior to electrification, we furthermore investigated firm profits as a performance indicator using a matching technique that identifies comparable firms in the non-access region, which we refer to as hypothetically connected. The principal finding emerging from this approach is that the provision of grid access does not unequivocally improve the performance of manufactur-ers in Northern Benin. To the contrary, our results suggest that the performance of the non-reliant firms is inferior to that of their counterparts in the non-access region. Although this negative difference is statisti-cally non-significant, it might come as a surprise that no positive effect can be detected. One reason for this might be that firms decide to get connected without having properly developed the business plan for the investment in the connection or electric equipment. As our theoretical explanation underpins, this can easily lead to a situation that is less advantageous than the non-connected status, since higher operation costs as well as the investment have to be covered.
Two implications for programme design derive from this result. First, if substantial productive electricity uses are desired, the electrification project should preferentially be targeted at regions that have sufficient market poten-tial to accommodate expanded production. Where this potential is deemed insufficient, additional measures may be required that facilitate participation in external markets. The design of these measures will depend on identifying where barriers to exchange exist but may include the improvement of marketing networks.
Second, the project should be accompanied by technical and possibly financial assistance to assess produc-tive use potentials. In this regard, BDS can raise awareness about cost structures and existent and non-exist-ent market opportunities. Moreover, improved access to credits can serve in helping manufacturers to finance the costs of switching to electrified production. In the centre of any productive use promotion activity should be the establishment of proper business plans. Firms should be assisted in planning the investment into the connection or machinery. This assistance has to be open towards the result: productive use promotion activi-ties might also consult local firms to abstain from investing in a connection or machinery – if the business plan shows that the investment is not beneficial. This is important to highlight, because many practitioners consider productive electricity use and machinery investment as a means to an end – and do not consider that it might be disadvantageous for some firms.
With regards to credit usage the findings are not straightforward. While the take-up rate is dramatically low, neither the quantitative nor the qualitative information can reveal why firms abstain from using credits. All firms that had applied for a credit also received one. At the same time, many firms that have never applied for a credit name procedural or collateral requirements as the main barrier. Accompanying measures in an elec-trification project could try to verify whether the gap between supply and demand of credits is a real one (i.e. for example due to a lack of credit supply) or one that might be closed simply by mutual information.
BDS are moderately used in the surveyed regions. Most participants claim a positive impact on their business, which can, however, not be confirmed in the data. In general, it has to be stated that the provided BDS are very heterogeneous in terms of quality, content and duration. Clearly, for both BDS and credit usage further research and focused study designs are required to gauge the relation between firm performance and these services.
One methodological lesson from this study is that the evaluation of the programme, be it ex-ante or ex-post, should strive to clearly disentangle the effects of grid-access on pre-existing manufacturers and on newcom-ers. To obtain the net impact of the newly-created firms on the local economy, it is of particular importance to future research to examine crowding-out effects among already existing firms. Therefore, ex-post and maybe even intermediate surveys in the same regions should follow up on this baseline and ex-ante study. Such temporal data would enable the observation of firm creation in the project zone so that the origin of the performance difference between electricity reliant and traditional firms could be further investigated. Look-ing ahead, it would also be good to enlarge the sample size with respect to both the number of observations and the covered sectors to comprehensively account for potential regional crowding out and budget effects. Furthermore, a conventional control region without access to the grid that will not be electrified between the baseline and the follow-up survey would help identifying the net total effect of electrification on both firm creation and existing firms.

74

75
Chapter 5: Firm Performance and Electricity Usage in Small Manufacturing and Service Firms in Ghana By Jörg Peters, Maximiliane Sievert and Colin Vance40
76
Abstract
In recent years, interest in electrification has risen substantially among governments in developing countries and donor organisations. Productive uses of electricity are particularly seen as a promising way to contribute to economic development. This paper examines the impact of electricity usage on the performance of micro-enterprises in the Brong Ahafo Region in Ghana. Using cross-sectional firm-level data from the service and manufacturing sector, we investigate the impact of being connected to the electricity grid on firm profits. No significant difference can be observed with the result being robust across different methods like Ordinary Least Squares and an instrumented variables approach.
1. Introduction
Although the overall business climate in Ghana has improved in recent years, also due to the pro-market policies of the government, micro and small enterprises in informal firm clusters in the town centres face periodic attempts of communal governments to be relocated to areas outside of the towns. In these zones, electricity and other services are frequently not available. Overall, about half the population has access to grid electricity (UNDP/WHO 2009). Weak supply growth combined with low rainfalls resulting in a shortage of water for hydropower production had been answered with nationwide load-shedding in 2006 and 2007.
The Energising Development or Industrial Zone Development component of the Programme for Sustainable Economic Development, implemented by the Deutsche Gesellschaft für Internationale Zusammenarbeit (GIZ) GmbH on behalf of the German Federal Ministry for Economic Cooperation and Development (BMZ) and the Directorate-General for International Cooperation of the Dutch Ministry of Foreign Affairs (DGIS), has been assisting selected districts in Ghana to establish or upgrade industrial zones for MSEs since 2007. The project provides these zones with materials for grid extension and technical assistance to the enterprises and the district government. In some cases, the project has also supplied roads, water supply and sanitary facilities. The companies located in the industrial clusters receive Business Development Services (BDS) including financial training to develop a business plan and apply for loans at micro-finance institutions. The underlying premise of the project is that a service package comprising improved electricity supply, systematically pro-vided BDS, access to micro-finance and operating in a designated clustered area together with other enter-prises improves business performance more effectively than providing these services individually.
Against this background, this chapter examines the impacts of grid electricity use on the performance of enter-prises employing less than 20 employees in small towns in Ghana’s Brong Ahafo Region. Using cross-sectional firm-level data on 236 businesses from the service and manufacturing sector that was collected in this region in 2007, we describe energy usage patterns in the firms and investigate the impact of electricity use on firm performance with firm profits as the major indicator. The identification strategy relies on a comparison of firms that are connected to the electricity grid to those that are not. In order to address potential underlying selection processes we employ – in addition to descriptive statistics – Ordinary Least Squares (OLS) regression to gauge the correlations while controlling for other variables. To correct for endogeneity in the relationship between profits and electricity usage, a Two Stage Least Squares (2SLS) approach is subsequently applied.
The remainder of this chapter is organised as follows: Section 2 presents the methodology for data collection and analysis. Section 3 describes the economic conditions in the surveyed regions. Section 4 examines impacts on the intermediate level, this is energy usage and factor inputs. Following the presentation of descriptive statistics, Section 5 examines the impacts by the application of regression techniques. Section 6 contains concluding remarks.
40) We are grateful for valuable comments and suggestions by Samuel Adoboe, Benjamin Attigah, Mirka Bodenbender, Anna Brüderle,
Marco Hüls, Raya Kühne, Lucius Mayer-Tasch, Sven Neelsen and Kilian Reiche.
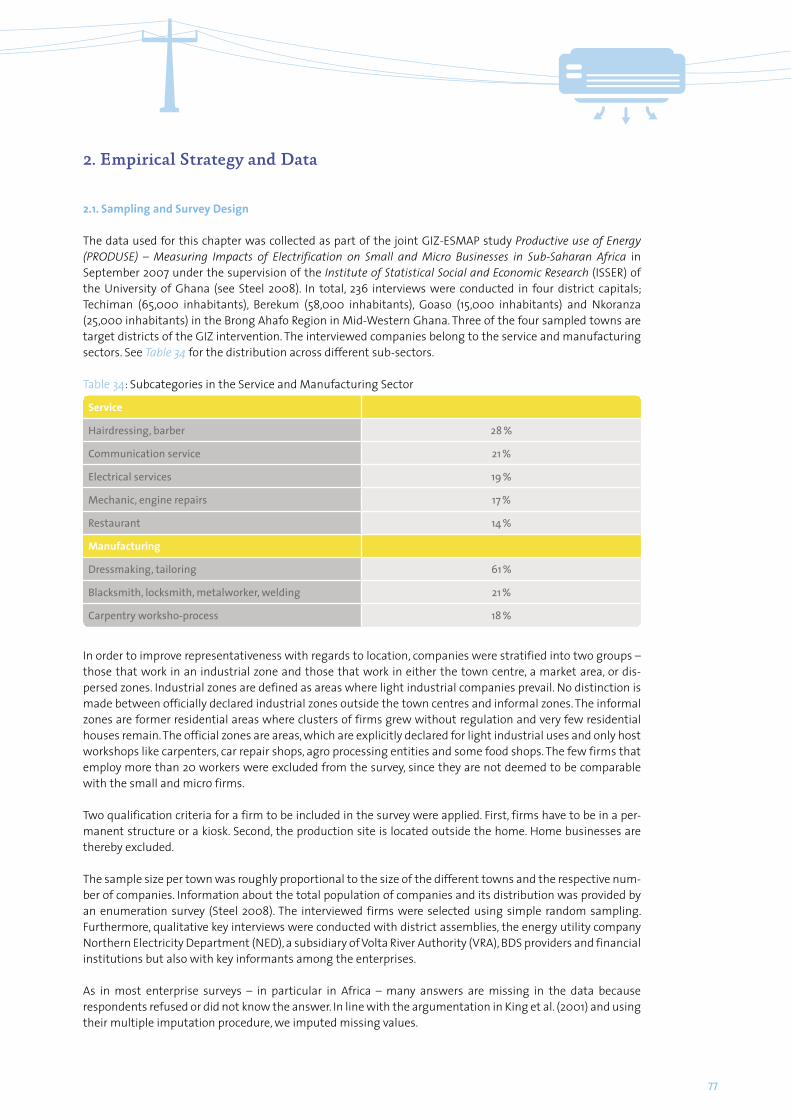
77
2. Empirical Strategy and Data
2.1. Sampling and Survey Design
The data used for this chapter was collected as part of the joint GIZ-ESMAP study Productive use of Energy (PRODUSE) – Measuring Impacts of Electrification on Small and Micro Businesses in Sub-Saharan Africa in September 2007 under the supervision of the Institute of Statistical Social and Economic Research (ISSER) of the University of Ghana (see Steel 2008). In total, 236 interviews were conducted in four district capitals; Techiman (65,000 inhabitants), Berekum (58,000 inhabitants), Goaso (15,000 inhabitants) and Nkoranza (25,000 inhabitants) in the Brong Ahafo Region in Mid-Western Ghana. Three of the four sampled towns are target districts of the GIZ intervention. The interviewed companies belong to the service and manufacturing sectors. See Table 34 for the distribution across different sub-sectors.
Table 34: Subcategories in the Service and Manufacturing Sector
Service
Hairdressing, barber 28 %
Communication service 21 %
Electrical services 19 %
Mechanic, engine repairs 17 %
Restaurant 14 %
Manufacturing
Dressmaking, tailoring 61 %
Blacksmith, locksmith, metalworker, welding 21 %
Carpentry worksho-process 18 %
In order to improve representativeness with regards to location, companies were stratified into two groups – those that work in an industrial zone and those that work in either the town centre, a market area, or dis-persed zones. Industrial zones are defined as areas where light industrial companies prevail. No distinction is made between officially declared industrial zones outside the town centres and informal zones. The informal zones are former residential areas where clusters of firms grew without regulation and very few residential houses remain. The official zones are areas, which are explicitly declared for light industrial uses and only host workshops like carpenters, car repair shops, agro processing entities and some food shops. The few firms that employ more than 20 workers were excluded from the survey, since they are not deemed to be comparable with the small and micro firms.
Two qualification criteria for a firm to be included in the survey were applied. First, firms have to be in a per-manent structure or a kiosk. Second, the production site is located outside the home. Home businesses are thereby excluded.
The sample size per town was roughly proportional to the size of the different towns and the respective num-ber of companies. Information about the total population of companies and its distribution was provided by an enumeration survey (Steel 2008). The interviewed firms were selected using simple random sampling. Furthermore, qualitative key interviews were conducted with district assemblies, the energy utility company Northern Electricity Department (NED), a subsidiary of Volta River Authority (VRA), BDS providers and financial institutions but also with key informants among the enterprises.
As in most enterprise surveys – in particular in Africa – many answers are missing in the data because respondents refused or did not know the answer. In line with the argumentation in King et al. (2001) and using their multiple imputation procedure, we imputed missing values.
78
2.2. Potential Impacts and Outcome Indicators
Electricity usage facilitates mechanisation and automation and thereby increases outputs quantitatively or qualitatively. The usage of electrical lighting is cheaper than traditional lighting sources and delivers a much better lighting quality. That, in turn, might contribute to extended working hours, more customers or higher quality products (see Chapter 3, methodology). All these effects lead directly or indirectly to higher productivity in the sense that less input is needed to produce the same output. This increased productivity might either lead to higher profits for the firm owner or higher incomes for workers. While we present descriptive statistics on all of these variables, the econometric analysis focuses on the firm’s monthly profit as the final outcome variable.
Enterprise surveys in Africa face measurement difficulties in most cases. This is mostly due to a lack of written records, recall problems and the unwillingness of respondents to reveal certain information. To address this, the survey raised information on practically all aspects of firm activity on a detailed level. Particularly sensitive variables were elicited in different ways. With regards to profits, for example, owners were asked directly to categorise their income of the last month into one of five income brackets. Alternatively, the questionnaire offers the possibility to calculate owner incomes by subtracting all running expenses from monthly sales. While De Mel, McKenzie and C. Woodruff (2009) argue in favour of directly elicited profits, Daniels and Mead (1998) as well as many survey experts state that information on income should be calculated by gathering detailed data on its components. Our data supports the latter view: most respondents chose the lowest income bracket, although their sales and cost figures suggest profits that are clearly positive and much high-er than they indicate. While it cannot be ultimately answered which response indicates the true profit, the tendency to understate answers to direct profit questions advocates in favour of calculated profits.
2.3. Identification Strategy
The study intended to follow the overall PRODUSE methodology as described in Chapter 2 of this publication. This methodology proposes to survey the target region of an electrification project before the intervention and, in addition, a further region with access to electricity. In the case study from Ghana, however, it was not possible to identify a comparable region as a control group. The reason is that unlike the set-up described in the Methodology Chapter, the GIZ project in Ghana targets peri-urban regions that are basically already pro-vided with electricity. Since the electrification process in Ghana is relatively advanced, it was not possible, however, to find non-electrified regions comparable in terms of size, distance to business centres and eco-nomic base. As a consequence, all firms in the sample have, essentially, access to the grid and the effects of electrification can only be examined by comparing firms that are connected to the electricity grid to those which are not.
Methodologically, this is problematic since the usage of electricity and our outcome variable, profit, affect each other simultaneously. In other words, an electricity connection might positively affect the firm’s profits, while at the same time better-performing firms are certainly more inclined to get connected. Additionally, unobserved factors such as the motivation level of the owner may influence the decision to connect and, at the same time, motivation may also affect profits. This leads to endogeneity of the treatment variable and a selection bias in ordinary univariate or multivariate analyses. In Section 5 we take these endogeneity consid-erations into account and investigate the impacts of being connected to the grid by simple difference in means, namely OLS and a 2SLS approach. For the latter method, in the first stage, the potentially endogenous variable – in our case the connection dummy – is regressed on all control variables and, additionally, identify-ing variables, also called Instrumental Variables (IV). The basic idea behind this approach is to let the IV cap-ture the effect of that part of the variation in the endogenous explanatory variable that is correlated with the IV. Such IV have to fulfil two conditions: (1) the instruments have to be correlated with the endogenous explanatory variable and (2) the instruments have to be uncorrelated with the dependent variable, except for the correlation via the endogenous variable. Results from the first stage regression are then used to generate predicted values of the endogenous variable. In the second stage, the outcome variable, profits, is regressed on all control variables, with the predictions from the first stage used as instruments replacing the endoge-nous variable. Two binary variables in our data qualify for this: whether the firm is located in an industrial zone and whether the firm is located in a so-called dispersed area (see Section 5).
79
3. Economic Conditions in Surveyed Area
Notwithstanding the predominantly agrarian economy, real GDP growth in Ghana amounted to 6.3 % in 2007.41 Roughly 56 % of the labour force in 2008 was employed in the agricultural sector, followed by 29 % in services and 15 % in industry (CIA 2008, EIU 2008). The business-friendly policies of the current administration contributed to Ghana’s ranking as a ‘top ten reformer’ by the World Bank, reaching position 87 out of 178 coun-tries in an evaluation of the ease of doing business (World Bank 2007). Still, the policy focus has predomi-nantly been on the formal sector and policy interventions targeting informal businesses have aimed mainly to formalise them. Sometimes local governments can be said to even have a hostile policy towards SMEs, when their interventions focus on trying to keep informal businesses out of town centres (Steel 2008).
The Brong Ahafo Region, where both the GIZ project’s and the survey’s target districts are located, is situated in Mid-Western Ghana. It is a transition zone between Ghana’s poorer Northern regions and its more densely populated and wealthier central and coastal zones. In the agricultural sector, the cultivation of commercial crops like maize, yams, cassava, plantain or cocoa is the most important source of income. The non-farming sector is dominated by commerce activities. All of the surveyed towns have markets at least once a week, where traders from all over the region arrive. Techiman has one of the biggest agricultural markets in West Africa. Furthermore, agro-processing activities such as palm oil production or grain milling, woodwork – main-ly producing furniture – tailoring and car-related services are core economic activities.
3.1. Access to Infrastructure
Ghana has one of the highest electrification rates in Sub-Saharan Africa, which was 54 % at the time of this study (UNDP/WHO 2009). The generation capacity in 2008 totalled 1,730 MW and was mainly provided by the hydro power plant of Akosombo at Lake Volta but increasingly also by thermal plants. The Ghanaian grid is part of the West-African Power Pool and has interconnections with Benin, Côte d’Ivoire and Togo. In 2007, electricity demand in Ghana could not be met by the production capacities, both because demand had been growing and because supply had decreased due to low water levels in Lake Volta. Historically, Ghana almost solely relied on hydro power and was an important electricity exporter to neighbouring countries. Today, by contrast, Ghana is still exporting but to fuel its thermal plants Ghana relies heavily on crude oil and gas imports.
To face these problems, a load shedding policy was developed leading to frequent but announced blackouts at the time of the survey. In addition, grid connected firms often face unforeseen blackouts and voltage fluc-tuations. Firms that use grid-electricity reported an average of 2.8 times per week of unannounced blackouts lasting approximately 4.4 hours on average.
The grid was extended to the surveyed towns between the end of the 1980s and the beginning of the 1990s. At the time of surveying, the percentage of connected households in the surveyed towns was above 70 %. In some areas, virtually all households are connected. Connection costs differ substantially depending on the distance to the distribution lines and, hence, how much material, i.e. poles and cables, are required. The aver-age initial connection costs paid by surveyed firms are 106 GH¢.42
The main roads leading to and passing through the surveyed towns are tarred. Only feeder roads are in a more problematic state. In the industrial zones surveyed, most roads were not tarred, making it difficult to reach some of the businesses in the rainy season. The towns lie at the main roads connecting Northern Ghana and neighbouring countries to the coastal regions. This leads to a high number of potential customers passing through the towns and large weekly markets. In all towns, postal services, internet connections and fax or fixed telephone lines are available. The main communication medium is the mobile phone, used by 70 % of all businesses in the survey.
41) The description of the economic conditions refers to the situation when the data were collected by the end of 2007. Later developments,
especially in the electricity sector, have not been taken into account.
42) At the time of the survey, the exchange rate was 1 Ghanaian New Cedi (GH¢) = 1.06 US $.
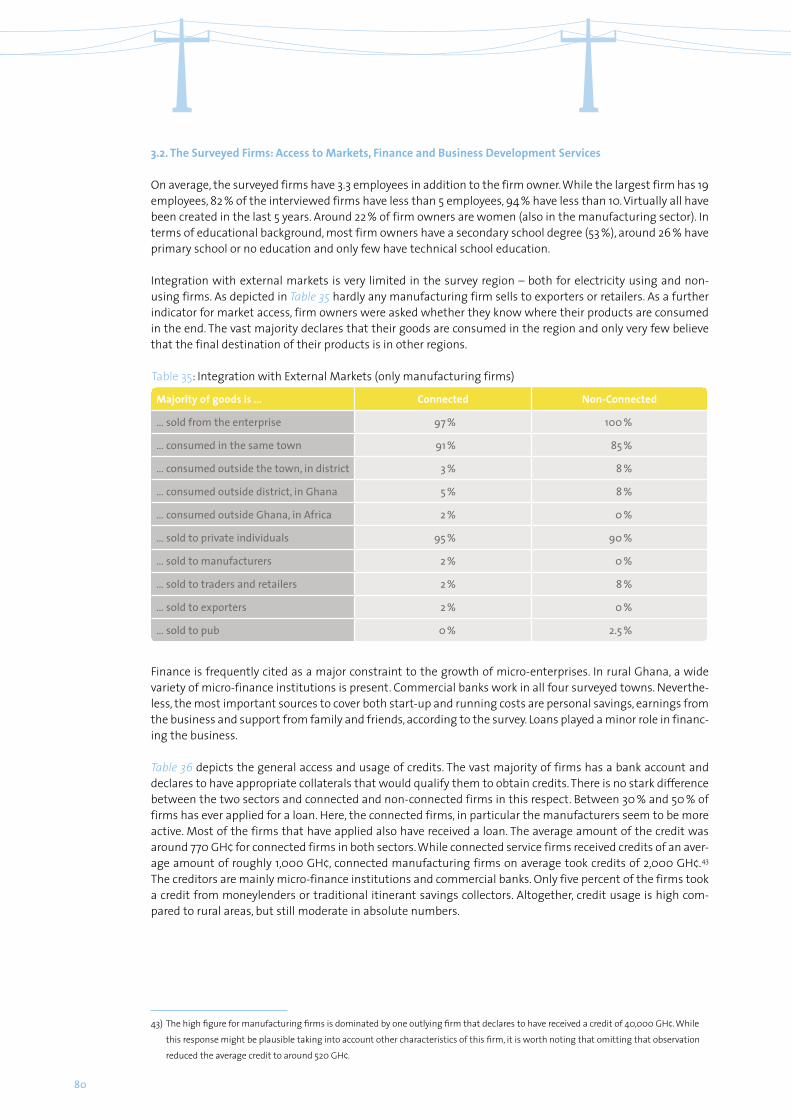
80
3.2. The Surveyed Firms: Access to Markets, Finance and Business Development Services
On average, the surveyed firms have 3.3 employees in addition to the firm owner. While the largest firm has 19 employees, 82 % of the interviewed firms have less than 5 employees, 94 % have less than 10. Virtually all have been created in the last 5 years. Around 22 % of firm owners are women (also in the manufacturing sector). In terms of educational background, most firm owners have a secondary school degree (53 %), around 26 % have primary school or no education and only few have technical school education.
Integration with external markets is very limited in the survey region – both for electricity using and non- using firms. As depicted in Table 35 hardly any manufacturing firm sells to exporters or retailers. As a further indicator for market access, firm owners were asked whether they know where their products are consumed in the end. The vast majority declares that their goods are consumed in the region and only very few believe that the final destination of their products is in other regions.
Finance is frequently cited as a major constraint to the growth of micro-enterprises. In rural Ghana, a wide variety of micro-finance institutions is present. Commercial banks work in all four surveyed towns. Neverthe-less, the most important sources to cover both start-up and running costs are personal savings, earnings from the business and support from family and friends, according to the survey. Loans played a minor role in financ-ing the business.
Table 36 depicts the general access and usage of credits. The vast majority of firms has a bank account and declares to have appropriate collaterals that would qualify them to obtain credits. There is no stark difference between the two sectors and connected and non-connected firms in this respect. Between 30 % and 50 % of firms has ever applied for a loan. Here, the connected firms, in particular the manufacturers seem to be more active. Most of the firms that have applied also have received a loan. The average amount of the credit was around 770 GH¢ for connected firms in both sectors. While connected service firms received credits of an aver-age amount of roughly 1,000 GH¢, connected manufacturing firms on average took credits of 2,000 GH¢.43 The creditors are mainly micro-finance institutions and commercial banks. Only five percent of the firms took a credit from moneylenders or traditional itinerant savings collectors. Altogether, credit usage is high com-pared to rural areas, but still moderate in absolute numbers.
Table 35: Integration with External Markets (only manufacturing firms)
Majority of goods is … Connected Non-Connected
… sold from the enterprise 97 % 100 %
… consumed in the same town 91 % 85 %
… consumed outside the town, in district 3 % 8 %
… consumed outside district, in Ghana 5 % 8 %
… consumed outside Ghana, in Africa 2 % 0 %
… sold to private individuals 95 % 90 %
… sold to manufacturers 2 % 0 %
… sold to traders and retailers 2 % 8 %
… sold to exporters 2 % 0 %
… sold to pub 0 % 2.5 %
43) The high figure for manufacturing firms is dominated by one outlying firm that declares to have received a credit of 40,000 GH¢. While
this response might be plausible taking into account other characteristics of this firm, it is worth noting that omitting that observation
reduced the average credit to around 520 GH¢.

81
To improve understanding of the high share of firms that have never applied for a credit we look at responses to a subjective multiple-choice question in the questionnaire asking respondents to name reasons for having not applied for a credit. As Table 37 shows, there seems to be no clearly dominating factor. The highest ranked answer was that procedural requirements are too difficult. Yet, also this reason was given by less than one third of the firms. It is interesting to note that few firms complain about high interest rates. This is particu-larly astonishing as the average interest rate in received credits is around 154 %, which is, however, dominated by three outliers that declare having paid an interest rate of around 1,000 %. But even omitting these three outliers yields an average interest rate of more than 100 %. Even taking into account the relatively high infla-tion rate in Ghana,44 this is an extraordinarily high interest rate. For comparison, Morduch (1999) reports nom-inal interest rates from micro-finance programmes in Asia of between 20 % and 55 %.
A couple of firms also state that collateral demands are too high. Effectively, however, in the majority of assigned credits no collateral at all was required (which partly explains the high interest rates). While such subjective statements have to be interpreted carefully in general, these two reasons for not applying for a credit might indicate a lack of knowledge about micro-credit processes among the entrepreneurs.
In the surveyed region, different BDS programmes are offered by the public sector and donors. As a conse-quence, around one third of the firms has received technical or business training. Only one firm claims to have participated in an IT training.
44) The inflation rate (consumer prices) was persistently above 10 % between 2000 and 2007 with peaks of up to 33 % in 2002
(see www.data.worldbank.org).
Table 36: Access to Finance
Share of firms that …
have a bank
account
declare to have
collaterals
have ever applied
for a loan
have ever received
a loan
Amount of credit if
received one (in GH¢)
Manufactu-ring
Connected 88 % 73 % 52 % 37 % 2,040
Non- connected 80 % 69 % 33 % 28 % 770
Service
Connected 84 % 70 % 38 % 34 % 997
Non- connected 79 % 64 % 31 % 24 % 773
Table 37: Subjective Reasons For Not Applying For Credits
Procedure of demand too difficult
Interest too high
The amount of credit is too small
Reimburse-ment might be difficult
Collateral require-
ments are too high
No need for loan
Manu-facturing
Connected 20 % 13 % 13 % 23 % 13 % 13 %
Non- connected
31 % 23 % 8 % 4 % 8 % 8 %
Service Connected 27 % 13 % 0 % 10 % 13 % 21 %
Multiple Answers possible
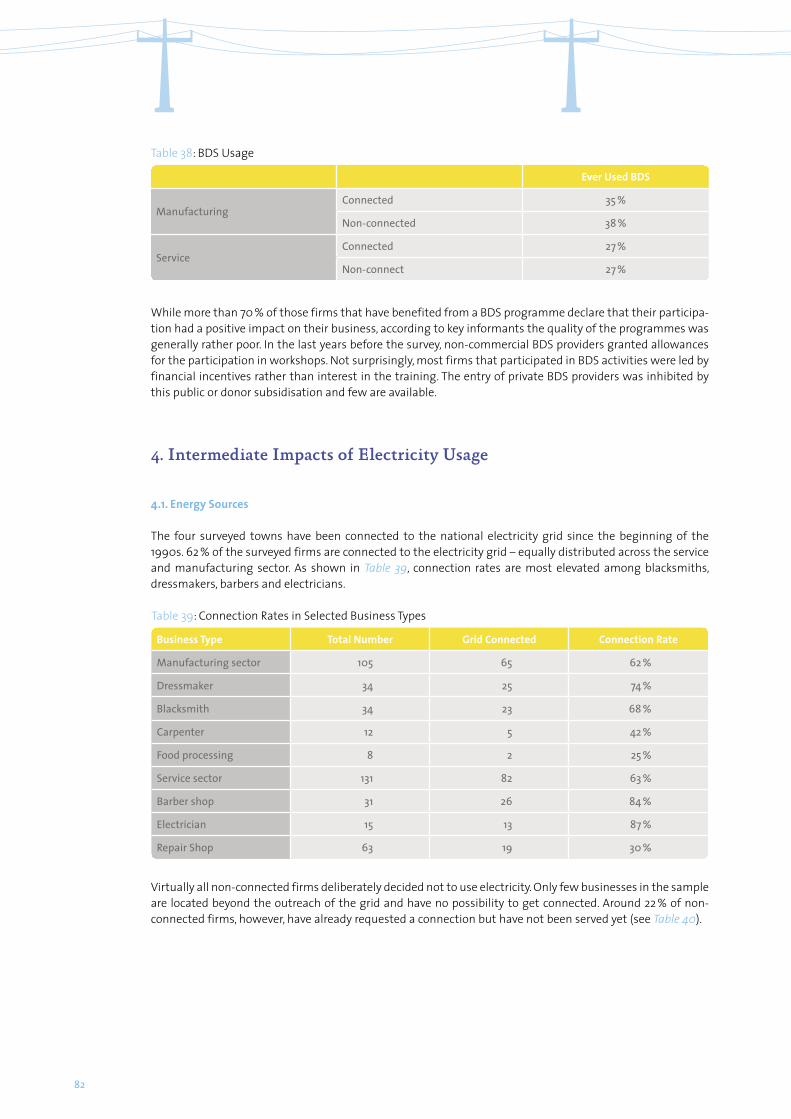
82
Table 38: BDS Usage
Ever Used BDS
ManufacturingConnected 35 %
Non-connected 38 %
ServiceConnected 27 %
Non-connect 27 %
While more than 70 % of those firms that have benefited from a BDS programme declare that their participa-tion had a positive impact on their business, according to key informants the quality of the programmes was generally rather poor. In the last years before the survey, non-commercial BDS providers granted allowances for the participation in workshops. Not surprisingly, most firms that participated in BDS activities were led by financial incentives rather than interest in the training. The entry of private BDS providers was inhibited by this public or donor subsidisation and few are available.
4. Intermediate Impacts of Electricity Usage
4.1. Energy Sources
The four surveyed towns have been connected to the national electricity grid since the beginning of the 1990s. 62 % of the surveyed firms are connected to the electricity grid – equally distributed across the service and manufacturing sector. As shown in Table 39, connection rates are most elevated among blacksmiths, dressmakers, barbers and electricians.
Virtually all non-connected firms deliberately decided not to use electricity. Only few businesses in the sample are located beyond the outreach of the grid and have no possibility to get connected. Around 22 % of non-connected firms, however, have already requested a connection but have not been served yet (see Table 40).
Table 39: Connection Rates in Selected Business Types
Business Type Total Number Grid Connected Connection Rate
Manufacturing sector 105 65 62 %
Dressmaker 34 25 74 %
Blacksmith 34 23 68 %
Carpenter 12 5 42 %
Food processing 8 2 25 %
Service sector 131 82 63 %
Barber shop 31 26 84 %
Electrician 15 13 87 %
Repair Shop 63 19 30 %

83
The most prominent reasons are that firms do not need electricity for their business or that they cannot afford it. In spite of the announced and unannounced outages described in Section 2, unreliability does not seem to be an important reason for not connecting. It is therefore consistent that only 13 % of the connected firms use backup facilities, mostly generators.
Among the electricity using firms, 30 % are connected informally by extensions from neighbouring houses or businesses. In some cases, businesses also use the connection of other businesses on demand only and pay for it directly.
Apart from grid electricity, firms do not use non-human energy sources much. Charcoal is the most common source and used by only 17 %, principally by dressmakers for ironing and blacksmiths for forging. Dressmakers continue to use charcoal irons even if electricity is available. Alternative electricity sources, mostly generators and car batteries, are used by 13 %. Dry cell batteries or kerosene are used by less than 10 %.
4.2. Lighting
As in most electrified regions in Africa, lighting is the most widely used energy service. The frequently cited advantages of electric lighting as compared to traditional lighting devices are higher quality, more conveni-ence and lower costs per unit of light output (e.g. Nieuwenhout 1998). This is widely expected to translate into higher accuracy of work and longer operating hours.
In total, 61 % of the surveyed firms use some sort of lighting, most of which are connected to the grid (see Table 41). The most common electric lighting devices are fluorescent lamps followed by energy saving lamps (compact fluorescent lamps). One reason for the extensive use of energy savers is a governmental energy sav-ing initiative that distributed six million energy savers for free. Only few firms use traditional lighting sources like candles or wick lamps. Businesses with a grid connection use candles twice as much as firms without a connection. These firms rely on lighting and use candles as a backup in case of blackouts after nightfall. It is also striking that non-connected firms hardly use any artificial lighting. This might on the one hand suggest that electricity facilitates lighting usage. On the other hand, it is also likely that firms that require lighting are more inclined to get a connection.
Table 40: Reason for Not Connecting to the Grid (multiple answers possible)
Percentage
‘Electricity is not needed for the enterprise's operation’. 27
‘The enterprise cannot afford the connection fee’. 24
‘The enterprise cannot afford the payments for consumption’. 23
‘Grid is available and a connection has been requested but has not yet been established’. 22
‘Public street lighting is sufficient’. 5
‘There is no grid available’. 3
‘Cables are always stolen whenever enterprise is connected’. 1
‘Electricity supply through grid is too unreliable’. <1
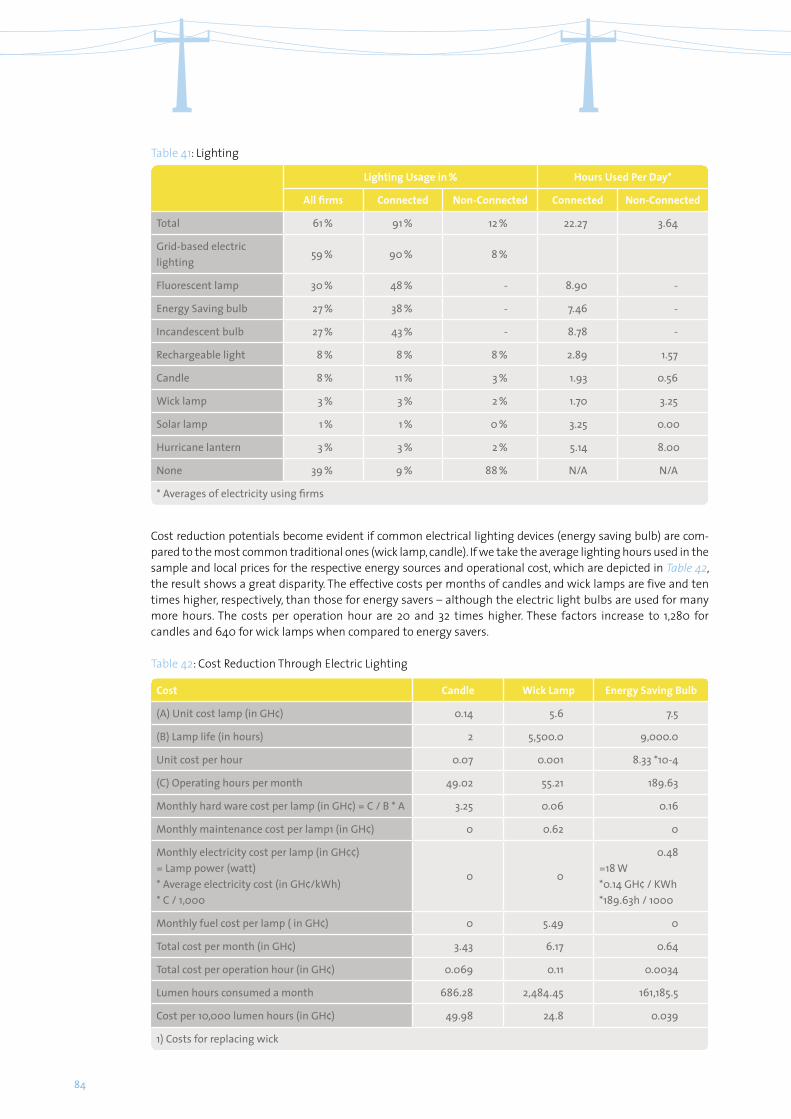
84
Table 41: Lighting
Lighting Usage in % Hours Used Per Day*
All firms Connected Non-Connected Connected Non-Connected
Total 61 % 91 % 12 % 22.27 3.64
Grid-based electric lighting
59 % 90 % 8 %
Fluorescent lamp 30 % 48 % - 8.90 -
Energy Saving bulb 27 % 38 % - 7.46 -
Incandescent bulb 27 % 43 % - 8.78 -
Rechargeable light 8 % 8 % 8 % 2.89 1.57
Candle 8 % 11 % 3 % 1.93 0.56
Wick lamp 3 % 3 % 2 % 1.70 3.25
Solar lamp 1 % 1 % 0 % 3.25 0.00
Hurricane lantern 3 % 3 % 2 % 5.14 8.00
None 39 % 9 % 88 % N/A N/A
* Averages of electricity using firms
Cost reduction potentials become evident if common electrical lighting devices (energy saving bulb) are com-pared to the most common traditional ones (wick lamp, candle). If we take the average lighting hours used in the sample and local prices for the respective energy sources and operational cost, which are depicted in Table 42, the result shows a great disparity. The effective costs per months of candles and wick lamps are five and ten times higher, respectively, than those for energy savers – although the electric light bulbs are used for many more hours. The costs per operation hour are 20 and 32 times higher. These factors increase to 1,280 for candles and 640 for wick lamps when compared to energy savers.
Table 42: Cost Reduction Through Electric Lighting
Cost Candle Wick Lamp Energy Saving Bulb
(A) Unit cost lamp (in GH¢) 0.14 5.6 7.5
(B) Lamp life (in hours) 2 5,500.0 9,000.0
Unit cost per hour 0.07 0.001 8.33 *10-4
(C) Operating hours per month 49.02 55.21 189.63
Monthly hard ware cost per lamp (in GH¢) = C / B * A 3.25 0.06 0.16
Monthly maintenance cost per lamp1 (in GH¢) 0 0.62 0
Monthly electricity cost per lamp (in GH¢¢)= Lamp power (watt)* Average electricity cost (in GH¢/kWh)* C / 1,000
0 0
0.48 =18 W*0.14 GH¢ / KWh*189.63h / 1000
Monthly fuel cost per lamp ( in GH¢) 0 5.49 0
Total cost per month (in GH¢) 3.43 6.17 0.64
Total cost per operation hour (in GH¢) 0.069 0.11 0.0034
Lumen hours consumed a month 686.28 2,484.45 161,185.5
Cost per 10,000 lumen hours (in GH¢) 49.98 24.8 0.039
1) Costs for replacing wick
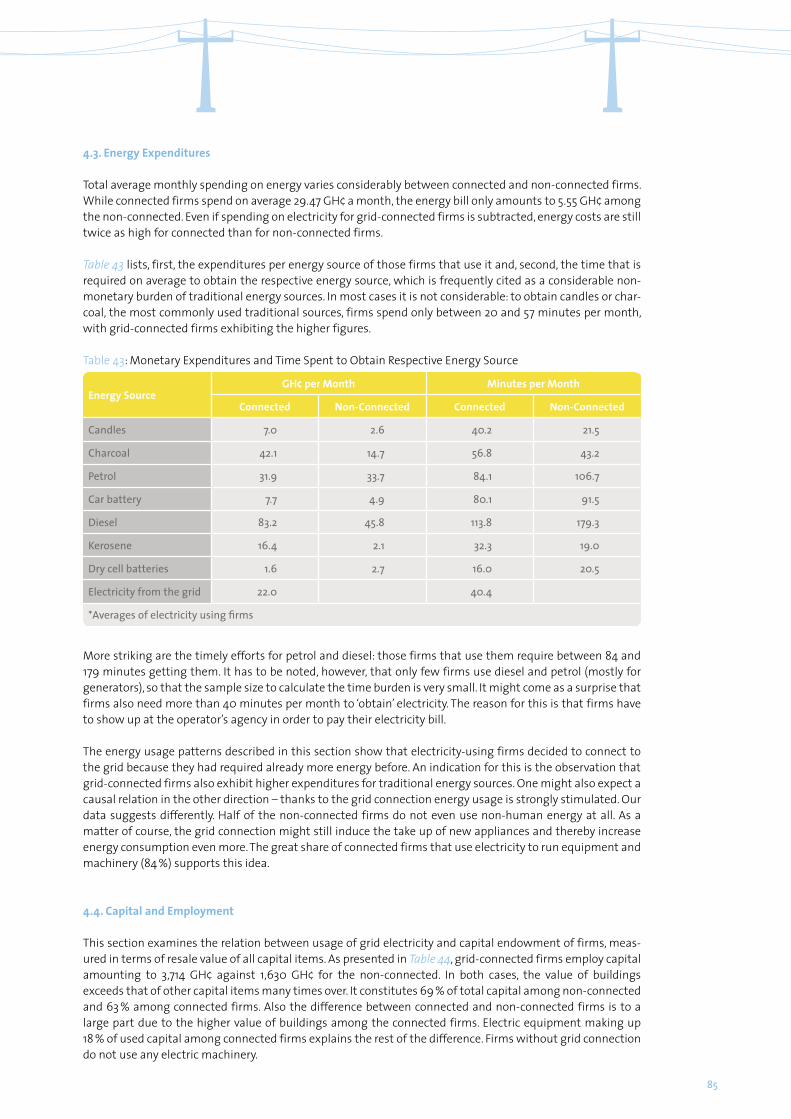
85
More striking are the timely efforts for petrol and diesel: those firms that use them require between 84 and 179 minutes getting them. It has to be noted, however, that only few firms use diesel and petrol (mostly for generators), so that the sample size to calculate the time burden is very small. It might come as a surprise that firms also need more than 40 minutes per month to ‘obtain’ electricity. The reason for this is that firms have to show up at the operator’s agency in order to pay their electricity bill.
The energy usage patterns described in this section show that electricity-using firms decided to connect to the grid because they had required already more energy before. An indication for this is the observation that grid-connected firms also exhibit higher expenditures for traditional energy sources. One might also expect a causal relation in the other direction – thanks to the grid connection energy usage is strongly stimulated. Our data suggests differently. Half of the non-connected firms do not even use non-human energy at all. As a matter of course, the grid connection might still induce the take up of new appliances and thereby increase energy consumption even more. The great share of connected firms that use electricity to run equipment and machinery (84 %) supports this idea.
4.4. Capital and Employment
This section examines the relation between usage of grid electricity and capital endowment of firms, meas-ured in terms of resale value of all capital items. As presented in Table 44, grid-connected firms employ capital amounting to 3,714 GH¢ against 1,630 GH¢ for the non-connected. In both cases, the value of buildings exceeds that of other capital items many times over. It constitutes 69 % of total capital among non-connected and 63 % among connected firms. Also the difference between connected and non-connected firms is to a large part due to the higher value of buildings among the connected firms. Electric equipment making up 18 % of used capital among connected firms explains the rest of the difference. Firms without grid connection do not use any electric machinery.
4.3. Energy Expenditures
Total average monthly spending on energy varies considerably between connected and non-connected firms. While connected firms spend on average 29.47 GH¢ a month, the energy bill only amounts to 5.55 GH¢ among the non-connected. Even if spending on electricity for grid-connected firms is subtracted, energy costs are still twice as high for connected than for non-connected firms.
Table 43 lists, first, the expenditures per energy source of those firms that use it and, second, the time that is required on average to obtain the respective energy source, which is frequently cited as a considerable non-monetary burden of traditional energy sources. In most cases it is not considerable: to obtain candles or char-coal, the most commonly used traditional sources, firms spend only between 20 and 57 minutes per month, with grid-connected firms exhibiting the higher figures.
Table 43: Monetary Expenditures and Time Spent to Obtain Respective Energy Source
Energy SourceGH¢ per Month Minutes per Month
Connected Non-Connected Connected Non-Connected
Candles 7.0 2.6 40.2 21.5
Charcoal 42.1 14.7 56.8 43.2
Petrol 31.9 33.7 84.1 106.7
Car battery 7.7 4.9 80.1 91.5
Diesel 83.2 45.8 113.8 179.3
Kerosene 16.4 2.1 32.3 19.0
Dry cell batteries 1.6 2.7 16.0 20.5
Electricity from the grid 22.0 40.4
*Averages of electricity using firms
86
Table 44: Resale Value of Capital Endowment (in GH¢)
Connected Firms Non-connected Firms
TOTAL 3,713.64 1,630.88
Non-energy 2,722.80 1,354.7
Buildings 2,351.49 1,121.51
Furniture 190.66 32.91
Vehicles 12.57 10.97
Tools 173.69 181.39
Non-electric energy 323.36 275.80
Vehicles 152.67 182.26
Generators 46.18 0
Processing 2.17 27.44
Cooking 27.57 0.69
Electric energy 667.48 0.34
Telecommunications 201.25 0
Refrigeration 26.90 0
Processing 423.80 0
Hairdressing 35.01 0
Other 9.35 0.20
Voltage stabiliser 10.10 0.34
Decentralised electricity generation 51.48 0.34
As the usage of electricity has a considerable impact on lighting usage of firms, one might expect an effect on the operating hours. After nightfall, electricity provides lighting and therefore businesses potentially can continue their work. In fact, connected firms are working longer (see Table 45): grid-connected firms work approximately 11.5 hours per day, while non-connected firms only work 10.65 hours. This reflects the tendency of connected firms to close later, since both groups open roughly at the same time in the morning.
These longer opening hours obviously are also reflected in the labour input. Here, we measure labour input as working hours summed up over all employees. We use operation hours to approximate the labour input of the owner.
Table 45: Daily Operation Hours
Connected Non-Connected
Operation hours 11.47 hrs 10.65 hrs
Time open 7:12 am 7:08 am
Time close 6:40 pm 5:46 pm
87
Total weekly compensation of employees in money and in-kind does not differ significantly between connected firms and non-connected ones as comparison of mean values shows.
5. Impact Analysis
In the preceding sections we demonstrated that there are substantial differences in the economic activity and structure of grid connected and non-connected enterprises.
The differences in intermediate outcome variables we observed so far, however, cannot be interpreted caus-ally. The reason is that it can never be ruled out that selection or simultaneity biases distort the comparison. We now turn to the major indicator of this study, firm performance. Taking the difference in mean values of firm profits and revenue as a starting point, we dedicate more efforts to examine the impacts on firm profits: we first employ an OLS regression that controls for observable other influences, followed by a 2SLS that intends to reduce the mentioned biases from unobservable variables and simultaneity.
Table 46 shows the results of comparing labour input in connected firms to that of non-connected ones. Connected firms register more working hours than non-connected firms, reflecting simply the higher number of hired workers. In particular in light of many apprentices in the work force this result on working hours should not be overstated.
Generally there are no significant differences in the characteristics of the employed workforce apart from one: the percentage of family members employed. As depicted in Table 47, the percentage is substantially higher among non-connected firms. On average 32 % of the employees of non-connected firms are family members, whereas among connected firms the share only amounts to 13 %. This difference is also reflected in the com-pensation of employees. Non-connected firms pay less money than the connected ones do. This is plausible as family members are often paid in-kind.
Table 46: Labor Input per Week
Connected Non-Connected
Working hours employees (hours) 193.5 181.3
Working hours owner (hours) 69.5 61.8
Working hours total (hours) 262.1 243.1
Wage employees (GH¢)* 26.9 12.6
* * Monetary pay and compensation in goods for all employees
Table 47: Characteristics of Workforce and Compensation
Labour Connected Non-Connected
Number of Employees 3.24 3.72
% Male 0.66 0.61
% Female 0.34 0.39
% Family member 0.13 0.32
Average weekly working hour
per employee 57.93 56.51
88
5.1. Sales and Firm Revenue
Several questions were posed to elicit the firm revenue. First, we raised the mean value of sales for three dif-ferent months: revenues in the month prior to the survey as well as in a good and a bad month. In Table 48, the mean revenue-levels as well as values specified for each of the elicited months are displayed.
In all cases, the revenue-level of grid- using firms is significantly higher than the one of non-using firms. The directly elicited average sales value amounts to 776 GH¢ for connected firms and 375 GH¢ for non-connected ones. Note that higher output does not necessarily imply higher profits.
If we look at the figures for sales in a good and a bad month, a big difference is visible. It illustrates the fact that seasonality matters in the surveyed region. The month referred to as ‘the last month’ was October, which is the end of the second rainy season. As purchasing power in the predominantly agricultural economy is higher after harvests, we can expect this value to be rather high.
Putting output in relation to labour input provides insights on labour productivity, which is measured as revenue per total input of working hours. As Table 49 shows, the labour productivity among grid-connected firms is generally lower if both sectors are examined together. Differentiating between service and manufac-turing firms, however, shows that this is mainly due to the loww labour productivity of grid-connected manu-facturing firms. In the service sector, connected firms exhibit higher labour productivity.
The reason for this lies in the different sizes of firms and the employment of apprentices. Grid-connected manufacturing firms employ more workers. At the same time, the share of apprentices is much higher in the manufacturing sector and increases with firm size. Apprentices, in turn, work less efficiently than more expe-rienced workers, so that, as a consequence, the smaller non-connected firms have higher labour productivity. In the Brong Ahafo Region, it is very common that especially young men work as apprentices in their families’ or friends’ enterprise. Hence, the decision to employ these apprentices often is not an economic decision but rather a matter of social commitment. Apprentices have a rather observational role only and barely contribute to the production process. As a consequence, more labour input does not necessarily translate into higher revenue. In fact, we find a significant negative correlation of -0.2 between the number of employees and labour productivity.
Looking at labour productivity for larger manufacturing firms confirms that it is firm size that explains low productivity rather than grid connection status: among firms employing more than five workers grid- connected manufacturers are now more productive than their non-connected counterparts (2.32 vs. 2.01).
Table 48: Revenue per Month (in GH¢)
Revenue per Month (GH¢) Connected Non-Connected
Sales directly elicited (mean) 775.97 375.34
Sales in a bad month 377.93 113.84
Sales in a good month 839.93 594.29
Sales in the last month 725.33 310.43
Table 49: Labour Productivity: Revenue (in GH¢) per Total Input of Working Hours
Total Service Manufacturing
Connected Non-Connected Connected Non-Connected Connected Non-Connected
3.26 4.09 3.74 3.32 2.69 5.17
89
5.2. Firm Profits: Difference in Means
In this section, we now investigate the effect of being connected to the grid on the firm’s profits. The profits were calculated by subtracting all running expenses from monthly sales. A closer look into the data reveals that mean values of profits are dominated by few outliers both at the bottom and the top of the profit distri-bution: one manufacturing firm reveals a calculated loss, hence a negative profit of more than 5,000 GH¢, while one non-connected manufacturing firm exhibits profits of more than 5,000 GH¢. Also, among connected service firms there are two that turn out to have profits of more than 5,000 GH¢ and 9,000 GH¢, respectively. While we have no reason to doubt the accuracy of these figures it, nevertheless, appears reason-able to delete them from the sample for the subsequent analysis. The methodological reason is that, particu-larly in small sample sizes like the one underlying this study, it is possible that – by chance – a certain type of firm is oversampled. We suspect the aforementioned outliers to be such non-representative observations. Furthermore, statistical tests for influential observations show that the four mentioned variables are espe-cially influential. Table 50 now depicts the mean profits in the survey region – excluding those outliers. We see that connected firms exhibit substantially higher profits. These higher profits of connected firms can be observed both among service and manufacturing firms.
5.3. Ordinary Least Squares
Simply comparing the mean values of the two groups, of course, does not account for heterogeneity between firms. Therefore, using an OLS model, we regress profits on the connection dummy and a suite of control vari-ables. Results are presented in Table 51: as the first column shows, the coefficient of the connection dummy is not significantly different from zero. Besides this insignificance, the difference in profits between connected and non-connected firms turns negative, controlling for BDS and micro-finance usage, capital and labour input, entrepreneurial experience, education of the firm owner and gender. Connected firms earn 11 GH¢ less than non-connected firms. However, this negative difference is not statistically significant. In addition, we included a dummy for the sector in order to distinguish between service and manufacturing firms. Female firm owners exhibit significantly higher profits than their male counterparts. Firms that use credits have sub-stantially higher profits, a result that is statistically significant. BDS use, in contrast, has a negative effect, although the coefficient is not significant.
While capital usage has a significantly positive impact on profits, labour input is negative (but non-signifi-cant), which is in line with our descriptive and qualitative findings.
It comes as a surprise that better educated firm owners have lower profits (see secondary education dummy). Also, the correlation between profits and experience of the owner (measured by years s/he has been working in the firm) is negative, although nonsignificant. One possible explanation is that experience also captures firm age and recently created firms can be supposed to be more dynamic and closer to the market’s needs.
The GIZ project in the survey region as well as many practitioners assume that bundled services, i.e. electricity, BDS and micro-finance, are more effective than individually provided services. To examine this assumption we interact the grid connection dummy with BDS and micro-finance usage, respectively. Results on these OLS regression in Table 51 show some puzzling correlations. While the interacted connection-BDS variable that measures the effect for cases in which both services are used by a firm has a strong but nonsignificant posi-tive effect on firm profits, both the individual BDS and connection variables are negative (but nonsignificant). This would suggest that BDS and a grid connection only have a positive effect if enjoyed together. Otherwise, they rather harm the firm’s profits. This might support the pre-conceived notions of those practitioners who keep on spreading the anecdotal message that services have to be provided in a bundled way (Motta and
Table 50: Profits (in GH¢) – Difference in Means
Total Service Manufacturing
Connected firms 224.68 176.31 285.14
Non-connected firms 166.98 115.47 231.70
Difference 57.70 60.84 53.44
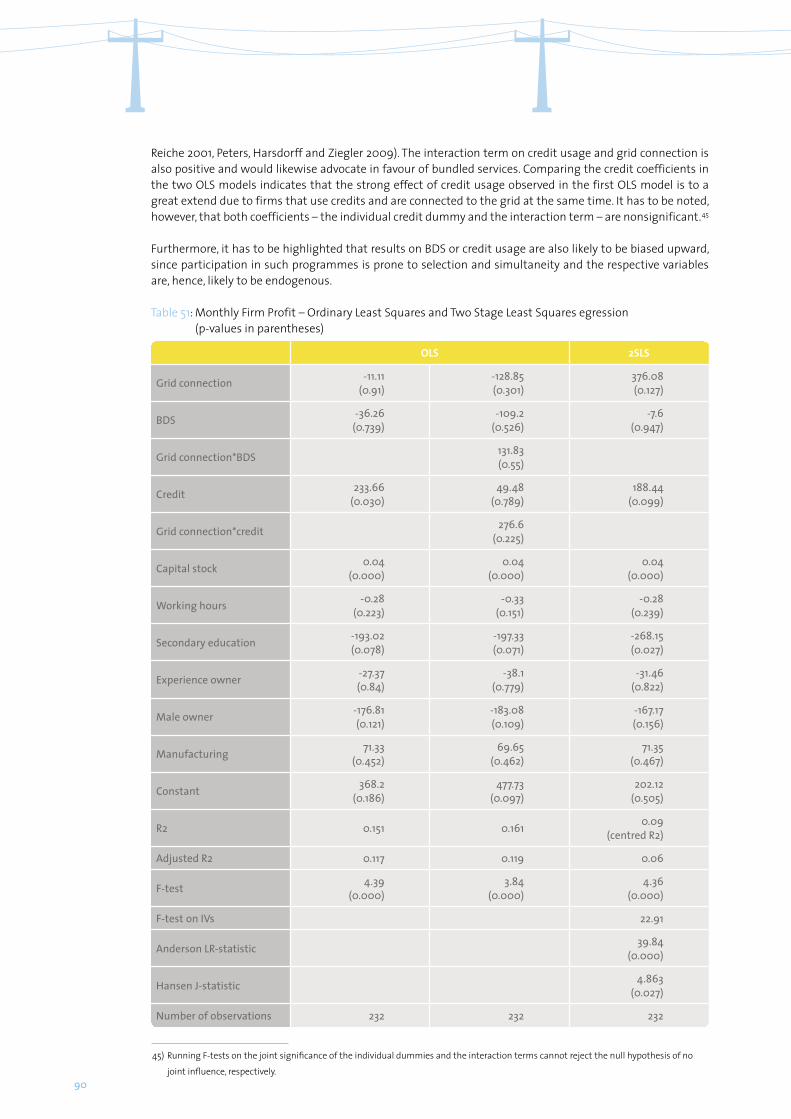
90
Reiche 2001, Peters, Harsdorff and Ziegler 2009). The interaction term on credit usage and grid connection is also positive and would likewise advocate in favour of bundled services. Comparing the credit coefficients in the two OLS models indicates that the strong effect of credit usage observed in the first OLS model is to a great extend due to firms that use credits and are connected to the grid at the same time. It has to be noted, however, that both coefficients – the individual credit dummy and the interaction term – are nonsignificant.45
Furthermore, it has to be highlighted that results on BDS or credit usage are also likely to be biased upward, since participation in such programmes is prone to selection and simultaneity and the respective variables are, hence, likely to be endogenous.
Table 51: Monthly Firm Profit – Ordinary Least Squares and Two Stage Least Squares egression (p-values in parentheses)
OLS 2SLS
Grid connection -11.11 (0.91)
-128.85(0.301)
376.08(0.127)
BDS -36.26 (0.739)
-109.2(0.526)
-7.6(0.947)
Grid connection*BDS 131.83 (0.55)
Credit 233.66 (0.030)
49.48(0.789)
188.44(0.099)
Grid connection*credit 276.6 (0.225)
Capital stock 0.04 (0.000)
0.04(0.000)
0.04(0.000)
Working hours -0.28 (0.223)
-0.33(0.151)
-0.28(0.239)
Secondary education -193.02 (0.078)
-197.33(0.071)
-268.15 (0.027)
Experience owner -27.37 (0.84)
-38.1(0.779)
-31.46(0.822)
Male owner -176.81 (0.121)
-183.08(0.109)
-167.17 (0.156)
Manufacturing 71.33 (0.452)
69.65(0.462)
71.35(0.467)
Constant 368.2 (0.186)
477.73(0.097)
202.12(0.505)
R2 0.151 0.161 0.09(centred R2)
Adjusted R2 0.117 0.119 0.06
F-test 4.39 (0.000)
3.84(0.000)
4.36(0.000)
F-test on IVs 22.91
Anderson LR-statistic 39.84(0.000)
Hansen J-statistic 4.863(0.027)
Number of observations 232 232 232
45) Running F-tests on the joint significance of the individual dummies and the interaction terms cannot reject the null hypothesis of no
joint influence, respectively.

91
5.4. Two Stage Least Squares
While OLS is an effective way to control for observable heterogeneity in the sample, unobservable variables that affect both right hand side variables and the outcome variable on the left hand side induce endogeneity problems. In this case, the treatment variable is particularly suspected to be endogenous. One reason is that omitted variables like motivation or managerial ability both influence the decision to connect and firm profits and might not be sufficiently captured by other control variables. In addition, we assume that the relation between the connection variable and profit is simultaneous. Therefore, a causal interpretation of the OLS results in Table 52 is not warranted.
In order to deal with this endogeneity, we apply a 2SLS approach. While finding appropriate identifying vari-ables is in many cases a prohibitive challenge, we draw upon two binary variables that fulfill the necessary conditions. The first variable indicates whether an enterprise is located in an industrial zone and the second indicates whether it is located in a dispersed area. Both are negatively correlated with the decision to connect. This can be partly explained by the fact that reliability of the grid is rather low in some industrial zones where transformers have often been originally established for residential users and, consequently, are overburdened by enterprise usage. Enterprises in dispersed areas are less likely to connect, simply because the distance to the grid is higher than in populated or market areas. At the same time, these two variables are not correlated with the firm’s profits. Insights during the field visit support this thesis. Moreover, also information that approximates the profit level of the firms, namely the number of consumers per day, shows no significant differ-ences. Also, a correlation with unobservable motivation characteristics of the owner is not to be expected.
These two variables are used as IV in a 2SLS regression. We conducted various tests to check the validity of the model.46 The application of the 2SLS approach confirms the results in all control variables, whose coefficients are only altered slightly. With regards to the treatment variable, the 2SLS estimation confirms the OLS results partly: there is no significant effect of being connected. What is surprising, however, is that the OLS result in Table 51 suggested that profits of connected firms are 11 GH¢ lower than those of non-connected ones. Purg-ing (at least parts of) the selection and simultaneity bias turns the estimated coefficient of the connection status positive and up to almost 380 GH¢. One would expect an upward bias triggered by the self-selection process and the simultaneity described above. Accordingly, it would be intuitive if the usage of IV reduces the estimated impact of the connection treatment.
Lassen (2005), who documents similarly counterintuitive findings of studies using instrumental variables (Dee 2004, Milligan, Moretti and Oreopoulos 2003, see also Miguel, Satyanath and Sergenti 2004), speculates that one cause may be classical measurement errors in the independent variables, which can induce attenu-ation bias in the estimate. To the extent that the predicted values used in an IV analysis typically have less variability than the actual variables and thereby mitigate the effects of measurement errors, the estimates would be expected to increase. An alternative explanation for the divergence between the OLS and IV esti-mates, noted by Angrist and Krueger (2001), is that the instruments reduce omitted variable bias by capturing only that part of the variability in the connection indicator that is uncorrelated with the omitted variables. The overall direction of this bias, however, is difficult to infer, as it will depend on both the net effect of the omitted variables on the dependent variable and on their correlation with the explanatory variable of interest.
5.5. Robustness of Results
In order to check the sensitiveness of the results with regards to the decision to drop the outliers described at the beginning of Section 5.2 we check the robustness of results by including them again. It can be seen in Table 52 that the results on average profits are highly sensitive to the treatment of these outliers. The comparison of mean
46) With respect to the identification of the models, three tests are reported at the bottom of Table 52. The first of these is a F-test of the
joint significance of the instruments from the first stage regressions. It easily rejects the null hypothesis of no joint effect in both models.
The second statistic, the Anderson canonical correlations likelihood ratio statistic, provides an additional test of whether the excluded
instruments are relevant. The null hypothesis is that the equation is under-identified. Again, in both models the null hypothesis is rejected
at the one percent level. The final test reports the Hansen J-statistic. The null hypothesis here is that the instruments are uncorrelated with
the error term and that the excluded instruments are correctly excluded from the estimated equation. The null hypothesis is not rejected
indicating that the instruments are good ones. Hence, altogether, technically the selected IV fulfil all conditions.
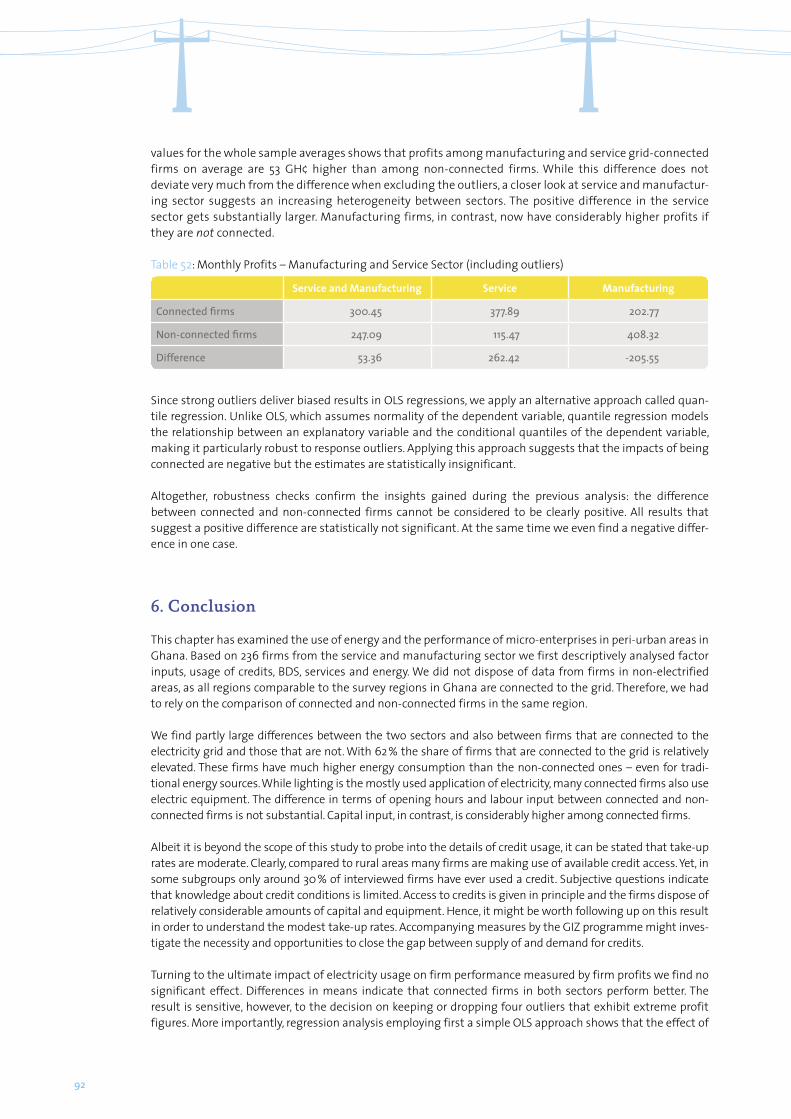
92
values for the whole sample averages shows that profits among manufacturing and service grid-connected firms on average are 53 GH¢ higher than among non-connected firms. While this difference does not deviate very much from the difference when excluding the outliers, a closer look at service and manufactur-ing sector suggests an increasing heterogeneity between sectors. The positive difference in the service sector gets substantially larger. Manufacturing firms, in contrast, now have considerably higher profits if they are not connected.
Since strong outliers deliver biased results in OLS regressions, we apply an alternative approach called quan-tile regression. Unlike OLS, which assumes normality of the dependent variable, quantile regression models the relationship between an explanatory variable and the conditional quantiles of the dependent variable, making it particularly robust to response outliers. Applying this approach suggests that the impacts of being connected are negative but the estimates are statistically insignificant.
Altogether, robustness checks confirm the insights gained during the previous analysis: the difference between connected and non-connected firms cannot be considered to be clearly positive. All results that suggest a positive difference are statistically not significant. At the same time we even find a negative differ-ence in one case.
6. Conclusion
This chapter has examined the use of energy and the performance of micro-enterprises in peri-urban areas in Ghana. Based on 236 firms from the service and manufacturing sector we first descriptively analysed factor inputs, usage of credits, BDS, services and energy. We did not dispose of data from firms in non-electrified areas, as all regions comparable to the survey regions in Ghana are connected to the grid. Therefore, we had to rely on the comparison of connected and non-connected firms in the same region.
We find partly large differences between the two sectors and also between firms that are connected to the electricity grid and those that are not. With 62 % the share of firms that are connected to the grid is relatively elevated. These firms have much higher energy consumption than the non-connected ones – even for tradi-tional energy sources. While lighting is the mostly used application of electricity, many connected firms also use electric equipment. The difference in terms of opening hours and labour input between connected and non-connected firms is not substantial. Capital input, in contrast, is considerably higher among connected firms.
Albeit it is beyond the scope of this study to probe into the details of credit usage, it can be stated that take-up rates are moderate. Clearly, compared to rural areas many firms are making use of available credit access. Yet, in some subgroups only around 30 % of interviewed firms have ever used a credit. Subjective questions indicate that knowledge about credit conditions is limited. Access to credits is given in principle and the firms dispose of relatively considerable amounts of capital and equipment. Hence, it might be worth following up on this result in order to understand the modest take-up rates. Accompanying measures by the GIZ programme might inves-tigate the necessity and opportunities to close the gap between supply of and demand for credits.
Turning to the ultimate impact of electricity usage on firm performance measured by firm profits we find no significant effect. Differences in means indicate that connected firms in both sectors perform better. The result is sensitive, however, to the decision on keeping or dropping four outliers that exhibit extreme profit figures. More importantly, regression analysis employing first a simple OLS approach shows that the effect of
Table 52: Monthly Profits – Manufacturing and Service Sector (including outliers)
Service and Manufacturing Service Manufacturing
Connected firms 300.45 377.89 202.77
Non-connected firms 247.09 115.47 408.32
Difference 53.36 262.42 -205.55

93
the connection variable is negative but statistically not significantly different from zero. In order to account for the presumably strong simultaneity and selection processes we additionally use a Two Stage Least Squares (2SLS) approach that requires identifying variables being correlated with the endogenous treatment variable and uncorrelated with the dependent variable. 2SLS confirms the non-significance of the difference between connected and non-connected firms.
Furthermore, we examined the joint effect of electricity connection and usage of BDS and micro-credits. The related regressions delivered somewhat puzzling results, assigning a substantial power to the participation in BDS programmes: electricity users seem to perform only better if they – at the same time – use some sort of BDS. These results, however, have to be interpreted with caution. First, most of these coefficients are not sig-nificant. In addition, BDS was included simply as a binary variable but has, as a matter of course, various forms from vocational training to close consulting activities. Second, qualitative information gained during field work rather suggests a low quality of obtainable BDS in the region. Therefore, it is likely that the BDS dummy rather captures other firm characteristics that have positive effects on profits. Methodologically, the em-ployed BDS dummy is presumed to be biased due to selection processes as well.
Altogether, our research shows that usage of electricity does not increase generated income by all means. The results have to be interpreted carefully, however. The sample size is relatively small, which might be particu-larly problematic using an outcome indicator (firm profits) that can be expected to be prone to measurement difficulties. This leads to a high standard deviation – a problem that can be compensated by a higher sample size. In fact, the descriptive findings especially on capital usage – connected firms are using substantially more appliances and machinery – suggest a positive effect of electricity usage.
Future research should follow up on this: first, in the case of the survey region by an ex-post survey after the implementation of the GIZ project. This will particularly improve the understanding of the joint influence of BDS and electricity. Since the GIZ project will intervene an incremental change of service provision can be expected in the meantime making evaluation of their impacts easier. Also, the effect of electrification on in-vestments and capital usage can be studied more profoundly. Second, in general, further studies should be conducted in other countries and set-ups in order to shed light on the circumstance under which electricity provision has stronger effects on firm performance. Not least, the sample size of future studies might be augmented in order to reduce the consequences of potential inaccuracies in the data.

94

95
Chapter 6: Micro-Enterprise Electricity Usage in Two Export-Oriented Fishing Communities at Lake Victoria, Uganda By Sven Neelsen and Jörg Peters47

96
Abstract
This paper aims to shed light on the nexus of electricity, firm performance and economic development in a dynamic rural area in Southern Uganda. Using quantitative firm-level data on 200 micro-enterprises comple-mented by qualitative case studies we find that newly-provided access to the grid increases the importance of electricity-using appliances and alters the sectoral distribution of economic activities. By contrast, we find no evidence for an expansionary effect of electrification on firm profits or worker remuneration. In fact, many entrepreneurs consider the direct gain from connecting to the grid to be small. Qualitative information, how-ever, suggests that a positive indirect impact of electrification on firm performance is induced by the overall expansive effect electrification has on local demand. The demand increase can be partly assigned to people moving into the electrified community from surrounding non-electrified areas. We conclude that if produc-tive energy promotion policies are put in place, they should address drawing up thorough business plans to enable local entrepreneurs to take informed connection and investment decisions.
1. Introduction
Decades of political turmoil and violent conflict have left Uganda as one of the poorest countries in the world. Since the early 1990s however, it is slowly, but steadily moving towards more peace and prosperity. An ambi-tious Structural Adjustment Programme sought to re-activate land, labour and capital for productive pur-poses and prudent fiscal and monetary policies have warranted moderate but constant economic growth and brought down inflation. Not least, the regulatory framework was liberalised to encourage private economic activity, foreign trade and investment.
This chapter aims to shed light on the nexus of electricity and mirco-enterprise performance in a dynamic rural area in Central Uganda. The non-primary sectors of two fishing communities, one with access to the electricity grid and one without, serve as the object of analysis. Both communities are fish landing sites at the shores of Lake Victoria with direct outlet channels to international markets. In summer 2008, we surveyed 200 micro-enterprises in these two regions using structured questionnaires. The information we obtained allows us to investigate the use of energy and its connection to firm structure and business performance. We complemented this initial more quantitative approach with three qualitative case studies of enterprises rep-resenting stylised firm types in the summer of 2009.
The remainder of this chapter is organised as follows: Section 2 introduces our empirical strategy for measur-ing the effects of grid access on firm performance and discusses comparability issues that complicate the intended cross-sectional comparison of the two surveyed regions. Section 3 describes the economic environ-ment in the surveyed regions including the availability of infrastructure, micro-finance and Business Develop-ment Services (BDS). Section 4 provides descriptive results on indicators for energy usage, firm structure and performance. We exemplify the role of electricity in three rural Ugandan enterprises by case studies presented in Section 5 before Section 6 concludes.
2. Empirical Strategy and Data
2.1. Sampling and Survey Design
In early 2008, two communities assumed to satisfy the comparability requirements set out in the overall PRODUSE methodology (Chapter 2) were identified in Central Uganda’s Buikwe district. Both Kiyindi and Ssenyi are economically active fishing communities on the shores of Lake Victoria. Kiyindi, with some 4,000 inhabitants, was connected to the grid in 2002. In the following, it is therefore referred to as the access region.
47) The authors are grateful for valuable comments and suggestions by Benjamin Attigah, Lucius Mayer-Tasch and Kilian Reiche. They
particularly thank Maya Hirsch for conducting the qualitative interviews.

97
Ssenyi currently has a population of approximately 3,000 and to date is not covered by the grid. Hence, we subsequently refer to it as the non-access region. The reliability of the electricity grid in the access region during the time of the survey was low. Due to load shedding schedules the grid is shut down every two days during evening hours. In addition, unannounced outages and voltage fluctuations decrease the quality of the electricity service. This lack of reliability has to be borne in mind when interpreting the results presented below.
For the initial structured interview survey carried out in August 2008, all enterprises operating in a permanent structure solely used for business purposes were included in the sampling population. This definition excluded home enterprises. No specific industries were over-sampled or omitted from the survey. Effectively, only micro-enterprises were surveyed, because no firms with more than 5 (permanent) employees existed in the surveyed regions at the time the study was carried out. To warrant representativeness, we applied strati-fied sampling with firm location as stratification criterion.
In the course of the initial survey a total of 228 firms were interviewed by six electrical engineering students of Makerere University, Kampala. The surveying was conducted under the supervision of one of the PRODUSE team members, who is also one of the authors of this chapter. After the discarding of incomplete question-naires, 200 valid interviews remained, of which 99 came from the non-access and 101 from the access region.The structured interviews were complemented by qualitative interviews with key informants conducted by the field supervisor. Key informants included senior staff of the Ministry of Energy and Mineral Development as well as of the private utility UMEME, of the Association of Microfinance Institutions of Uganda (AMFIU), of the BDS providers Enterprise Uganda and the Business Uganda Development Scheme (BUDS). In addition, interviews were conducted with the Mukono district authorities and administration, local leaders and devel-opment practitioners with expertise in energy, microfinance and various other fields. Valuable information was also provided in informal conversations with the inhabitants and entrepreneurs of the survey-areas.
2.2. Treatment, Comparability Issues and Indicators
The study originally intended to follow a methodological approach that uses cross-sectional comparisons between areas with and without grid access to identify causal effects of electrification on, for example, firm performance (Chapter 2, methodology).
Under the restriction that the choice of locations for data collection was limited to sites of existing GIZ ac-tivities in the Ugandan energy sector, local researchers identified two fishing communities on Lake Victoria – one electrified and one non-electrified – that fulfilled the minimum methodological requirements of this empirical approach. Both communities are so-called gazetted landing sites. Because certain sanitary require-ments are met in these sites, the fish landed here is permitted for export to the European and other interna-tional markets, creating large additional income opportunities for the local population.
During field work, however, it became evident that the income from fish trade in the non-access region was about one-fourth higher than in the access region. Therefore, and despite the prudent prior investigation through local researchers, the comparability of the access and the non-access regions turned out not to be fully satisfying from a methodological point of view. Because the two areas do not only differ in terms of access to electricity but also in terms of trade income, we cannot precisely distinguish the effects of one fac-tor from that of the other.
The possible bias resulting from this issue likely differs between the different firm performance indicators in our analysis. It is easy to see that the desired ultimate impact indicator, firm profits, can be expected to be severely distorted. With the fishery sector forming the main source of income in both regions, the higher volume of fish trade and thus purchasing power in the non-access area most likely leads to higher firm reve-nues and, ultimately, higher profits across the entire local economy. In such a scenario, it is hardly possible to disentangle the effects of electricity access and higher fishing revenues. While we nevertheless provide descriptive statistics on firm profits and employment, it is therefore difficult to derive robust insights on firm performance and direct income generation from our results.
98
There are, however, intermediate effects of electrification that can be expected to be not substantially distorted by the different income levels in the two regions: in particular, it is frequently expected that the structure of the local economy changes in the wake of electrification. We focus on three outcomes to proxy potential structural change: the patterns of capital usage, the sectoral distribution of economic activity and the variety of goods sold. Upon access to the grid we expect an increased importance of electricity using machinery and equipment and an increased relevance of the service sector. These indicators are examined by comparing, firstly, the regions, secondly, connected and non-connected firms and, thirdly, users and non-users of decentralised electricity.
Given the comparability problems making the quantitative impact assessment difficult, we complement the quantitative analysis by a supplementary qualitative inspection of stylised firm types. These case studies pro-vide examples for typical patterns of electricity usage that range from a carpentry firm that considers a grid connection not profitable to a comparatively large fish production site that critically depends on electricity use.
3. Economic Conditions in the Surveyed Area
The survey regions, situated on the shoreline of Lake Victoria, have greatly benefited from political reform and economic expansion in Uganda in recent years. Lake Victoria today is the single most important source of freshwater fish in the world. The value chain connects the survey region to global markets. The fish is caught on a small scale by local fishermen, immediately reloaded to trucks coming from Ugandan urban centres and cooled by crushed ice. Processing the fish next to the fishing sites is only possible with electricity (except for dried, of course, which is more targeted for the local market, however). If the capacity of the arriving trucks is not sufficient to pick up the catch of the day, the remaining fish rots before it can be transported away. Albeit only a small share of the income created in the Ugandan fishery sector trickles down to the starting point of the value chains, this share is large enough to provide accredited landing sites like the ones sampled in our study with rather exceptional financial means for rural Ugandan standards. For the surveyed communities, it is estimated that more than half of the working population is active in and around the fishery sector.
3.1. Roads and Energy Infrastructure
The two communities are located some 70 km from Kampala and are accessible by a 35-40 km dirt road branching off the well-maintained, but often congested Kampala-Jinja highway. For its larger part, the dirt road is in a bad condition and after heavy rainfalls it becomes almost unusable for regular vehicles.
Uganda exhibits an electrification rate among households of around 6 % with 42 % of households in Kampala and only 2-3 % of rural households being connected to the grid (NRECA 2011). The access area, connected to the grid in 2002 thus forms a rare exception to a countryside that is otherwise mostly cut off from grid electricity. Instead, where financial funds are available like in our non-access area, rural households and enterprises employ generator sets, photovoltaic systems or car or dry cell batteries to power electricity-using equipment.
Despite low overall access to the grid in Uganda, a growing demand for electricity often outdoes a stagnant supply-side. Load shedding is therefore frequent and as urban areas receive preferential supply, rural areas in the access region are most severely affected by the scarcity in electricity supply (see Section 2.1). During the time of surveying, scheduled outages took place in the evening hours of every second day. In addition, connected firms in the access region reported that unannounced blackouts occurred three times per week on average.
At the time of the survey in 2008, the cost of connecting to the grid without the installation of additional poles amounted to 300,000 UShs. For a one-pole service, the total fee increased to 420,000 UShs, which was roughly in line with the then reported connection cost in the survey region of an average of 404,595 UShs. One third of the connected firms were illicitly connected via other enterprises. The kWh-tariffs vary by level of consumption and time of use. For the low-voltage service an initial 15 kWh were sold at a reduced 62 UShs per kWh, each additional kWh cost 420 UShs. 280-470 UShs per kWh were charged for the three-phase low-voltage service.
99
3.2. Access to Finance and Business Development Services
The improvement of macro-economic conditions in Uganda has coincided with the development of one of the most diverse microfinance sectors in Africa. Micro-credit is provided through local savings associations, by NGOs and specialised microfinance institutions. Moreover, most commercial banks now run microfinance schemes (AMFIU 2007). The non-access-area has one formal microfinance institution that grants loans up to 10 million UShs. Credit and savings cooperatives exist in both communities and major microfinance and com-mercial banks run branches in a larger town located within 40 km of the landing sites. While many institu-tions require assets as collateral, the build-up of a successful credit history with escalating loan sizes can be sufficient. In principle, this makes credit available to all entrepreneurs regardless of their initial capital.
Micro-loan take-up rates among the surveyed firms are comparatively low: Only 20 % of enterprises had obtained formal credit with the average credit size amounting to 2.2 million UShs. Interest rates ranged from 20-30 %, depending on the institution and loan size and reportedly constituted an obstacle to increased bor-rowing for many firms. Of the 159 firms that had never applied for formal credit, 55 % cited excessive interest as one reason for non-application. Furthermore, widespread mistrust in microfinance institutions hindered the diversification of financing through formal sources. Cases of fraud had occurred in both survey-regions, with impostors having reportedly vanished after collecting deposits for loans that never materialised.
With regards to BDS, technical and managerial training were offered by BUDS and Enterprise Uganda, next to the activities of numerous NGOs. Yet, most programmes were tailored to the requirements and capacities of urban small and medium enterprises. The trainings were usually held in urban areas and are not free of charge. The uptake of BDS in rural areas was further complicated by the lack of organisation of a heterogene-ous micro-enterprise sector for which comprehensive business associations barely existed. The virtual absence of appropriate BDS was reflected by the marginal use of such services in the survey area. Less than 5 % of interviewed entrepreneurs had ever received a form of entrepreneurial training. For the few firms that did, it was mostly provided by private suppliers, for instance by an internal car manufacturer for an engine repair shop and a cosmetics firm for a hairdresser and retailer of beauty products.
3.3. The Typical Enterprise in the Survey Area
Table 53 presents characteristics of the average non-primary sector firm in the survey area, i.e. over both survey regions. The non-primary sector was service-intensive with more than half of the firms engaging mainly in the resale of goods they elsewhere purchased. Another 12 and 11 % were in hospitality services or hairdressing, respec-tively. Wood and metal manufacturing ranked fourth with 9 % of all interviewed enterprises. Reflecting this indus-try structure, the average capital endowment was about 1 million UShs (617 US $) – just slightly above the average monthly profit. The strong focus on services was also mirrored in a customer base that almost exclusively con-sisted of local private buyers. Unlike the areas’ export oriented fishery sector, direct external demand as a crucial driver of economic growth played a minor if any role in the survey areas’ secondary and tertiary sectors.
Finally, with both surveyed regions reported to have been on a fast growth track due to their accredited land-ing site status, well over 50 % of the interviewed enterprises had been founded a maximum three years prior to our survey.
4. Quantitative Evidence: Energy and Enterprise Outcomes
4.1. Energy Usage
Traditional or electric energy is used by more than 80 % of enterprises in both the access and non-access regions (see Table 55). Not surprisingly, the share of electricity users at 50 % is higher in the grid-access region, where 38 % of enterprises are connected to the grid. Non-connected users of electricity and also many enter-prises with a grid connection use decentralised electricity sources like generators, car batteries and photovoltaic
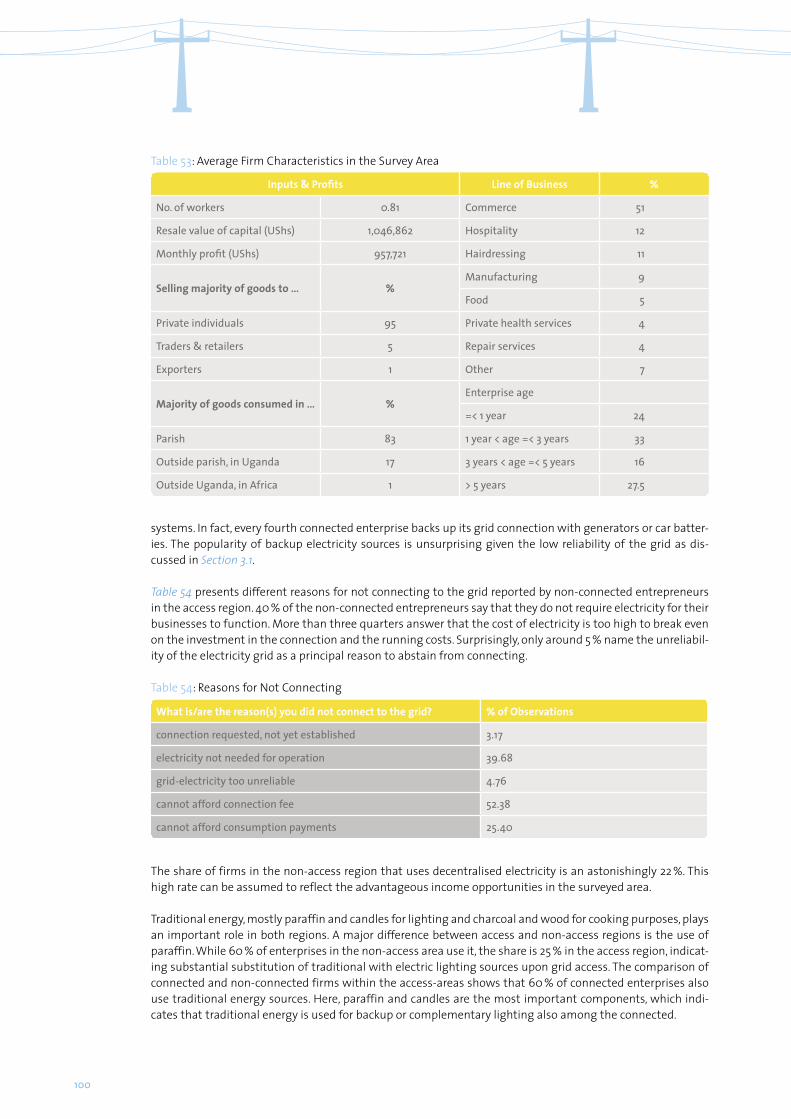
100
Table 53: Average Firm Characteristics in the Survey Area
Inputs & Profits Line of Business %
No. of workers 0.81 Commerce 51
Resale value of capital (UShs) 1,046,862 Hospitality 12
Monthly profit (UShs) 957,721 Hairdressing 11
Selling majority of goods to … %Manufacturing 9
Food 5
Private individuals 95 Private health services 4
Traders & retailers 5 Repair services 4
Exporters 1 Other 7
Majority of goods consumed in … %Enterprise age
=< 1 year 24
Parish 83 1 year < age =< 3 years 33
Outside parish, in Uganda 17 3 years < age =< 5 years 16
Outside Uganda, in Africa 1 > 5 years 27.5
systems. In fact, every fourth connected enterprise backs up its grid connection with generators or car batter-ies. The popularity of backup electricity sources is unsurprising given the low reliability of the grid as dis-cussed in Section 3.1.
Table 54 presents different reasons for not connecting to the grid reported by non-connected entrepreneurs in the access region. 40 % of the non-connected entrepreneurs say that they do not require electricity for their businesses to function. More than three quarters answer that the cost of electricity is too high to break even on the investment in the connection and the running costs. Surprisingly, only around 5 % name the unreliabil-ity of the electricity grid as a principal reason to abstain from connecting.
The share of firms in the non-access region that uses decentralised electricity is an astonishingly 22 %. This high rate can be assumed to reflect the advantageous income opportunities in the surveyed area.
Traditional energy, mostly paraffin and candles for lighting and charcoal and wood for cooking purposes, plays an important role in both regions. A major difference between access and non-access regions is the use of paraffin. While 60 % of enterprises in the non-access area use it, the share is 25 % in the access region, indicat-ing substantial substitution of traditional with electric lighting sources upon grid access. The comparison of connected and non-connected firms within the access-areas shows that 60 % of connected enterprises also use traditional energy sources. Here, paraffin and candles are the most important components, which indi-cates that traditional energy is used for backup or complementary lighting also among the connected.
Table 54: Reasons for Not Connecting
What is/are the reason(s) you did not connect to the grid? % of Observations
connection requested, not yet established 3.17
electricity not needed for operation 39.68
grid-electricity too unreliable 4.76
cannot afford connection fee 52.38
cannot afford consumption payments 25.40
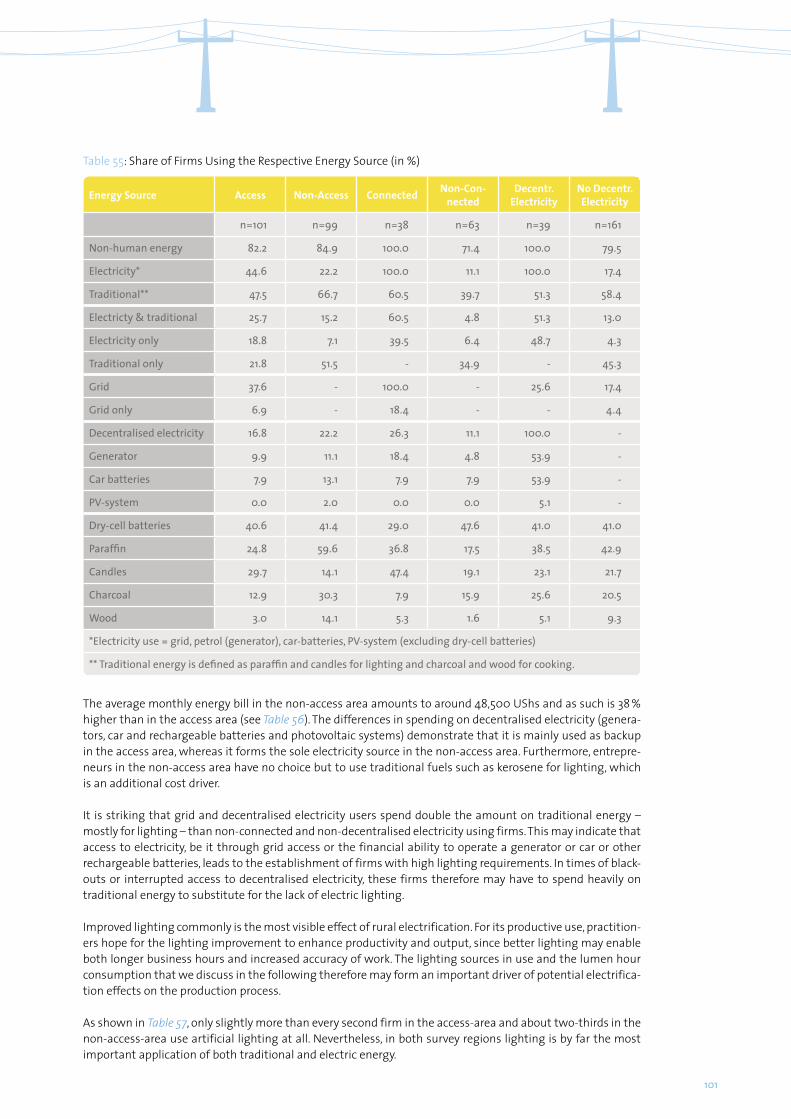
101
Table 53: Average Firm Characteristics in the Survey Area
Table 54: Reasons for Not Connecting
Table 55: Share of Firms Using the Respective Energy Source (in %)
Energy Source Access Non-Access Connected Non-Con-nected
Decentr. Electricity
No Decentr. Electricity
n=101 n=99 n=38 n=63 n=39 n=161
Non-human energy 82.2 84.9 100.0 71.4 100.0 79.5
Electricity* 44.6 22.2 100.0 11.1 100.0 17.4
Traditional** 47.5 66.7 60.5 39.7 51.3 58.4
Electricty & traditional 25.7 15.2 60.5 4.8 51.3 13.0
Electricity only 18.8 7.1 39.5 6.4 48.7 4.3
Traditional only 21.8 51.5 - 34.9 - 45.3
Grid 37.6 - 100.0 - 25.6 17.4
Grid only 6.9 - 18.4 - - 4.4
Decentralised electricity 16.8 22.2 26.3 11.1 100.0 -
Generator 9.9 11.1 18.4 4.8 53.9 -
Car batteries 7.9 13.1 7.9 7.9 53.9 -
PV-system 0.0 2.0 0.0 0.0 5.1 -
Dry-cell batteries 40.6 41.4 29.0 47.6 41.0 41.0
Paraffin 24.8 59.6 36.8 17.5 38.5 42.9
Candles 29.7 14.1 47.4 19.1 23.1 21.7
Charcoal 12.9 30.3 7.9 15.9 25.6 20.5
Wood 3.0 14.1 5.3 1.6 5.1 9.3
*Electricity use = grid, petrol (generator), car-batteries, PV-system (excluding dry-cell batteries)
** Traditional energy is defined as paraffin and candles for lighting and charcoal and wood for cooking.
The average monthly energy bill in the non-access area amounts to around 48,500 UShs and as such is 38 % higher than in the access area (see Table 56). The differences in spending on decentralised electricity (genera-tors, car and rechargeable batteries and photovoltaic systems) demonstrate that it is mainly used as backup in the access area, whereas it forms the sole electricity source in the non-access area. Furthermore, entrepre-neurs in the non-access area have no choice but to use traditional fuels such as kerosene for lighting, which is an additional cost driver.
It is striking that grid and decentralised electricity users spend double the amount on traditional energy – mostly for lighting – than non-connected and non-decentralised electricity using firms. This may indicate that access to electricity, be it through grid access or the financial ability to operate a generator or car or other rechargeable batteries, leads to the establishment of firms with high lighting requirements. In times of black-outs or interrupted access to decentralised electricity, these firms therefore may have to spend heavily on traditional energy to substitute for the lack of electric lighting.
Improved lighting commonly is the most visible effect of rural electrification. For its productive use, practition-ers hope for the lighting improvement to enhance productivity and output, since better lighting may enable both longer business hours and increased accuracy of work. The lighting sources in use and the lumen hour consumption that we discuss in the following therefore may form an important driver of potential electrifica-tion effects on the production process.
As shown in Table 57, only slightly more than every second firm in the access-area and about two-thirds in the non-access-area use artificial lighting at all. Nevertheless, in both survey regions lighting is by far the most important application of both traditional and electric energy.
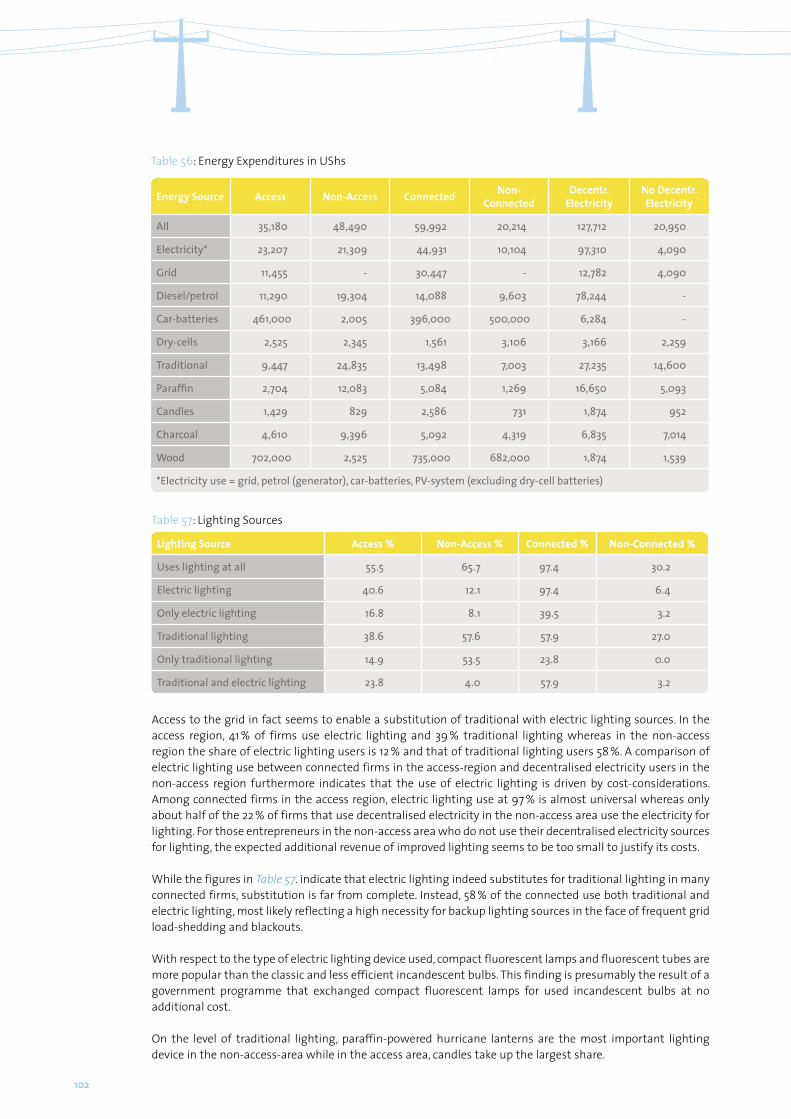
102
Table 56: Energy Expenditures in UShs
Energy Source Access Non-Access Connected Non- Connected
Decentr. Electricity
No Decentr. Electricity
All 35,180 48,490 59,992 20,214 127,712 20,950
Electricity* 23,207 21,309 44,931 10,104 97,310 4,090
Grid 11,455 - 30,447 - 12,782 4,090
Diesel/petrol 11,290 19,304 14,088 9,603 78,244 -
Car-batteries 461,000 2,005 396,000 500,000 6,284 -
Dry-cells 2,525 2,345 1,561 3,106 3,166 2,259
Traditional 9,447 24,835 13,498 7,003 27,235 14,600
Paraffin 2,704 12,083 5,084 1,269 16,650 5,093
Candles 1,429 829 2,586 731 1,874 952
Charcoal 4,610 9,396 5,092 4,319 6,835 7,014
Wood 702,000 2,525 735,000 682,000 1,874 1,539
*Electricity use = grid, petrol (generator), car-batteries, PV-system (excluding dry-cell batteries)
Table 57: Lighting Sources
Lighting Source Access % Non-Access % Connected % Non-Connected %
Uses lighting at all 55.5 65.7 97.4 30.2
Electric lighting 40.6 12.1 97.4 6.4
Only electric lighting 16.8 8.1 39.5 3.2
Traditional lighting 38.6 57.6 57.9 27.0
Only traditional lighting 14.9 53.5 23.8 0.0
Traditional and electric lighting 23.8 4.0 57.9 3.2
Access to the grid in fact seems to enable a substitution of traditional with electric lighting sources. In the access region, 41 % of firms use electric lighting and 39 % traditional lighting whereas in the non-access region the share of electric lighting users is 12 % and that of traditional lighting users 58 %. A comparison of electric lighting use between connected firms in the access-region and decentralised electricity users in the non-access region furthermore indicates that the use of electric lighting is driven by cost-considerations. Among connected firms in the access region, electric lighting use at 97 % is almost universal whereas only about half of the 22 % of firms that use decentralised electricity in the non-access area use the electricity for lighting. For those entrepreneurs in the non-access area who do not use their decentralised electricity sources for lighting, the expected additional revenue of improved lighting seems to be too small to justify its costs.
While the figures in Table 57. indicate that electric lighting indeed substitutes for traditional lighting in many connected firms, substitution is far from complete. Instead, 58 % of the connected use both traditional and electric lighting, most likely reflecting a high necessity for backup lighting sources in the face of frequent grid load-shedding and blackouts.
With respect to the type of electric lighting device used, compact fluorescent lamps and fluorescent tubes are more popular than the classic and less efficient incandescent bulbs. This finding is presumably the result of a government programme that exchanged compact fluorescent lamps for used incandescent bulbs at no additional cost.
On the level of traditional lighting, paraffin-powered hurricane lanterns are the most important lighting device in the non-access-area while in the access area, candles take up the largest share.
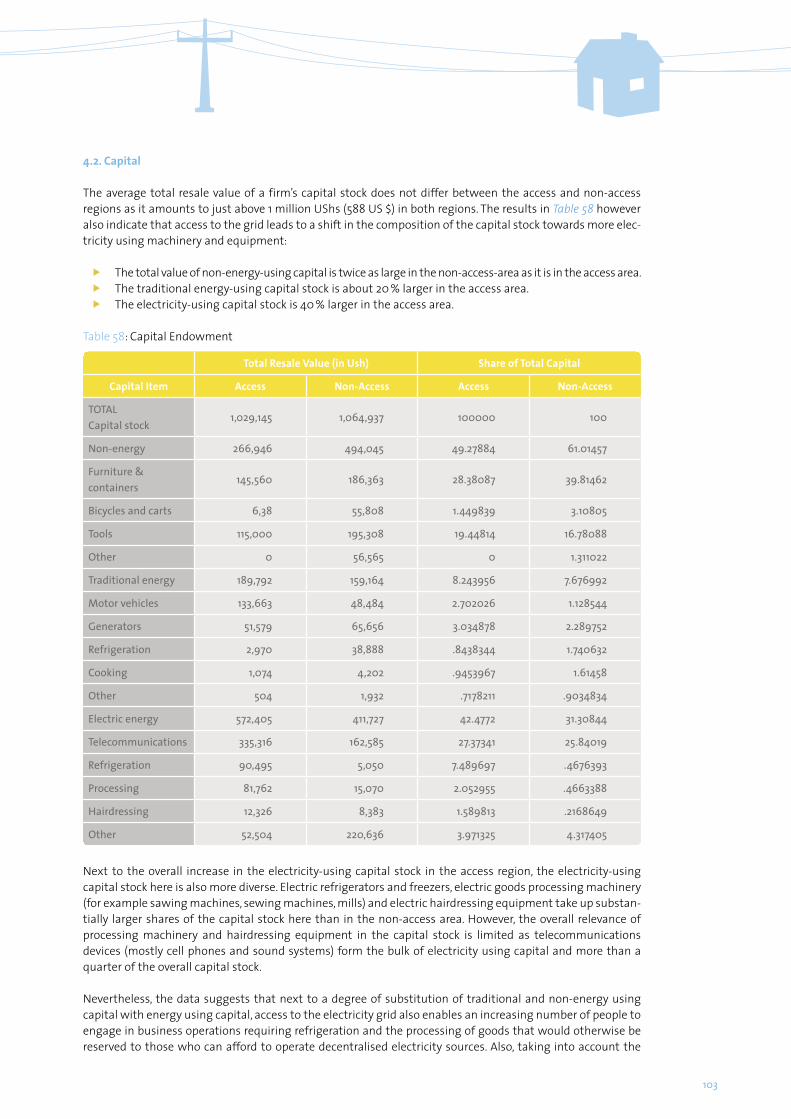
103
Next to the overall increase in the electricity-using capital stock in the access region, the electricity-using capital stock here is also more diverse. Electric refrigerators and freezers, electric goods processing machinery (for example sawing machines, sewing machines, mills) and electric hairdressing equipment take up substan-tially larger shares of the capital stock here than in the non-access area. However, the overall relevance of processing machinery and hairdressing equipment in the capital stock is limited as telecommunications devices (mostly cell phones and sound systems) form the bulk of electricity using capital and more than a quarter of the overall capital stock.
Nevertheless, the data suggests that next to a degree of substitution of traditional and non-energy using capital with energy using capital, access to the electricity grid also enables an increasing number of people to engage in business operations requiring refrigeration and the processing of goods that would otherwise be reserved to those who can afford to operate decentralised electricity sources. Also, taking into account the
4.2. Capital
The average total resale value of a firm’s capital stock does not differ between the access and non-access regions as it amounts to just above 1 million UShs (588 US $) in both regions. The results in Table 58 however also indicate that access to the grid leads to a shift in the composition of the capital stock towards more elec-tricity using machinery and equipment:
� The total value of non-energy-using capital is twice as large in the non-access-area as it is in the access area.� The traditional energy-using capital stock is about 20 % larger in the access area.� The electricity-using capital stock is 40 % larger in the access area.
Table 58: Capital Endowment
Total Resale Value (in Ush) Share of Total Capital
Capital Item Access Non-Access Access Non-Access
TOTAL Capital stock
1,029,145 1,064,937 100000 100
Non-energy 266,946 494,045 49.27884 61.01457
Furniture & containers
145,560 186,363 28.38087 39.81462
Bicycles and carts 6,38 55,808 1.449839 3.10805
Tools 115,000 195,308 19.44814 16.78088
Other 0 56,565 0 1.311022
Traditional energy 189,792 159,164 8.243956 7.676992
Motor vehicles 133,663 48,484 2.702026 1.128544
Generators 51,579 65,656 3.034878 2.289752
Refrigeration 2,970 38,888 .8438344 1.740632
Cooking 1,074 4,202 .9453967 1.61458
Other 504 1,932 .7178211 .9034834
Electric energy 572,405 411,727 42.4772 31.30844
Telecommunications 335,316 162,585 27.37341 25.84019
Refrigeration 90,495 5,050 7.489697 .4676393
Processing 81,762 15,070 2.052955 .4663388
Hairdressing 12,326 8,383 1.589813 .2168649
Other 52,504 220,636 3.971325 4.317405

104
higher overall incomes in the non-access region which can be expected to coincide with a higher capital stock ceteris paribus, the finding of similar overall value of capital stock across areas indicates that electricity access induces substantial investments, particularly in electricity-using appliances.
4.3. Employment and Operation Hours
A common hypothesis on the effect of electrification on businesses is that the improvement of lighting ser-vices enables the extension of business activities into night-time and thereby increases daily operation hours. The results we present in the prior section indicate that grid access increases the use of electric lighting both as a substitute of and complement to traditional lighting sources. This shift in lighting sources certainly coin-cides with improved lighting quality (lumen) during a given working hour. However, as is shown, our results do not suggest that grid access increases working hours. In fact, businesses in the non-access region operate slightly longer per day as they open 14 minutes earlier and close 22 minutes later than the average enterprise in the access region.
With respect to the comparison of connected and non-connected enterprises within the access region, the connected enterprises operate longer per day, as on average they open almost one hour earlier and close almost 1.5 hours later than non-connected firms. Yet, other factors than the availability of electric lighting appear to guide the entrepreneurial decision when and how long to operate. One such factor is time wise fluctuations in demand. Both communities are trading hubs that attract customers with substantial pur-chasing power from the surrounding, less developed fishing communities. These solvent external custom-ers are mainly served during daytime and by firms located next to the shoreline where the market and industrial area of the grid-connected community is situated. Since the external customers leave at around 6 pm to reach their home villages while it is still light, the majority of the shoreline businesses close early. Their lighting requirements are therefore limited. Further, because the external demand is mainly in retailed goods, no particular electric equipment is required to serve it. In summary, there is limited incentive for the profitable businesses on the shoreline to open longer hours and use electric lighting. By contrast, the enterprises that depend on electric lighting in the access region are primarily located in the more resi-dential parts of the community where the local population creates demand well into night-time. Electric lighting, hospitality (refrigeration) and entertainment (music, movie theatres) here play an important role. Consequently, the incentive to continue business operations after dark and to connect to the grid is much higher in the residential part of the grid-connected community. This is also why virtually all firms offering such services in the residential area are connected.
As for the users of decentralised electric energy sources, only half use electric lighting but on average they continue to operate until well after dark (8:25 pm; sunset is between 6:30 and 7pm). Combined with their higher overall levels of employment, decentralised electricity users show the highest level of labour input among all groups analysed in this study.
Table 59: Hours of Operation and Monthly Labour Input %)
Opening Time Closing Time Daily Hours of Operation
Monthly Hours of Labour Input
Access 08:08 19:12 11:04 565h 26min
Non-access 07:54 19:34 11:40 585h 12 min
Connected 07:36 20:04 12:28 720h 20min
Non-connected 08:27 18:40 10:13 472h 00 min
Decentral electricity 07:46 20:25 12:38 775h 25 min
Non-Decentralised electricity 08:04 19:07 11:03 526h 44min
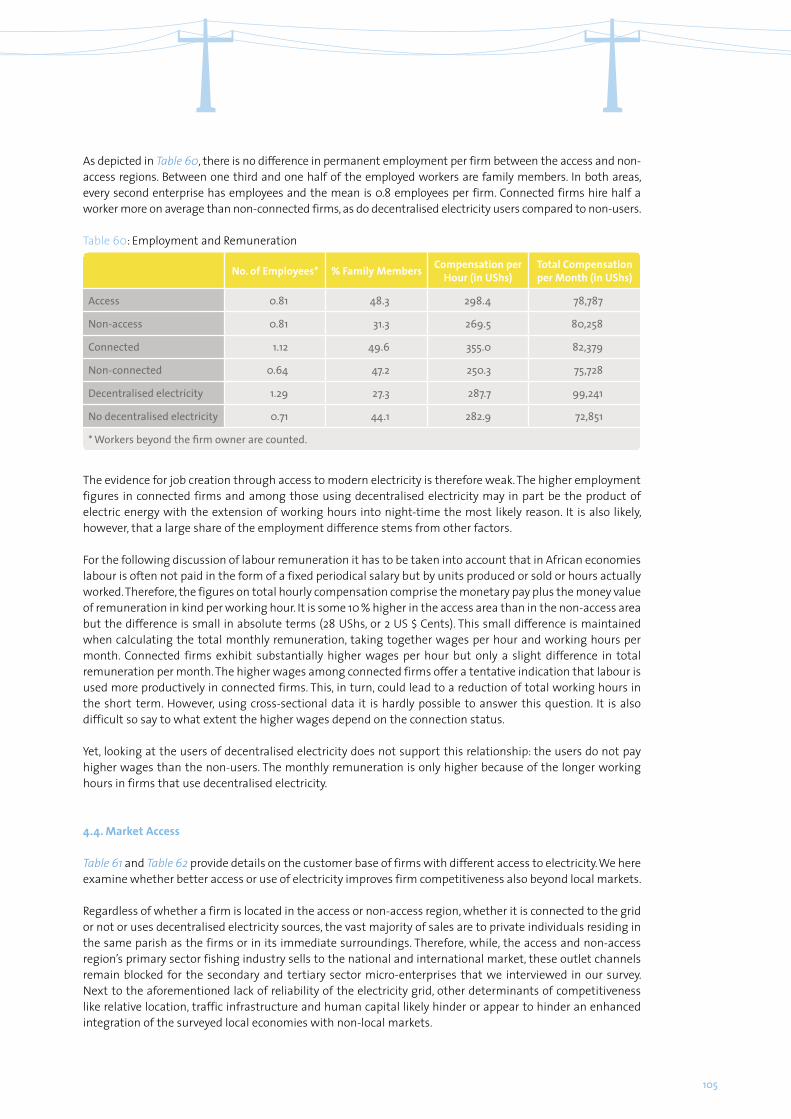
105
As depicted in Table 60, there is no difference in permanent employment per firm between the access and non-access regions. Between one third and one half of the employed workers are family members. In both areas, every second enterprise has employees and the mean is 0.8 employees per firm. Connected firms hire half a worker more on average than non-connected firms, as do decentralised electricity users compared to non-users.
The evidence for job creation through access to modern electricity is therefore weak. The higher employment figures in connected firms and among those using decentralised electricity may in part be the product of electric energy with the extension of working hours into night-time the most likely reason. It is also likely, however, that a large share of the employment difference stems from other factors.
For the following discussion of labour remuneration it has to be taken into account that in African economies labour is often not paid in the form of a fixed periodical salary but by units produced or sold or hours actually worked. Therefore, the figures on total hourly compensation comprise the monetary pay plus the money value of remuneration in kind per working hour. It is some 10 % higher in the access area than in the non-access area but the difference is small in absolute terms (28 UShs, or 2 US $ Cents). This small difference is maintained when calculating the total monthly remuneration, taking together wages per hour and working hours per month. Connected firms exhibit substantially higher wages per hour but only a slight difference in total remuneration per month. The higher wages among connected firms offer a tentative indication that labour is used more productively in connected firms. This, in turn, could lead to a reduction of total working hours in the short term. However, using cross-sectional data it is hardly possible to answer this question. It is also difficult so say to what extent the higher wages depend on the connection status.
Yet, looking at the users of decentralised electricity does not support this relationship: the users do not pay higher wages than the non-users. The monthly remuneration is only higher because of the longer working hours in firms that use decentralised electricity.
4.4. Market Access
Table 61 and Table 62 provide details on the customer base of firms with different access to electricity. We here examine whether better access or use of electricity improves firm competitiveness also beyond local markets.
Regardless of whether a firm is located in the access or non-access region, whether it is connected to the grid or not or uses decentralised electricity sources, the vast majority of sales are to private individuals residing in the same parish as the firms or in its immediate surroundings. Therefore, while, the access and non-access region’s primary sector fishing industry sells to the national and international market, these outlet channels remain blocked for the secondary and tertiary sector micro-enterprises that we interviewed in our survey. Next to the aforementioned lack of reliability of the electricity grid, other determinants of competitiveness like relative location, traffic infrastructure and human capital likely hinder or appear to hinder an enhanced integration of the surveyed local economies with non-local markets.
Table 60: Employment and Remuneration
No. of Employees* % Family Members Compensation per Hour (in UShs)
Total Compensation per Month (in UShs)
Access 0.81 48.3 298.4 78,787
Non-access 0.81 31.3 269.5 80,258
Connected 1.12 49.6 355.0 82,379
Non-connected 0.64 47.2 250.3 75,728
Decentralised electricity 1.29 27.3 287.7 99,241
No decentralised electricity 0.71 44.1 282.9 72,851
* Workers beyond the firm owner are counted.
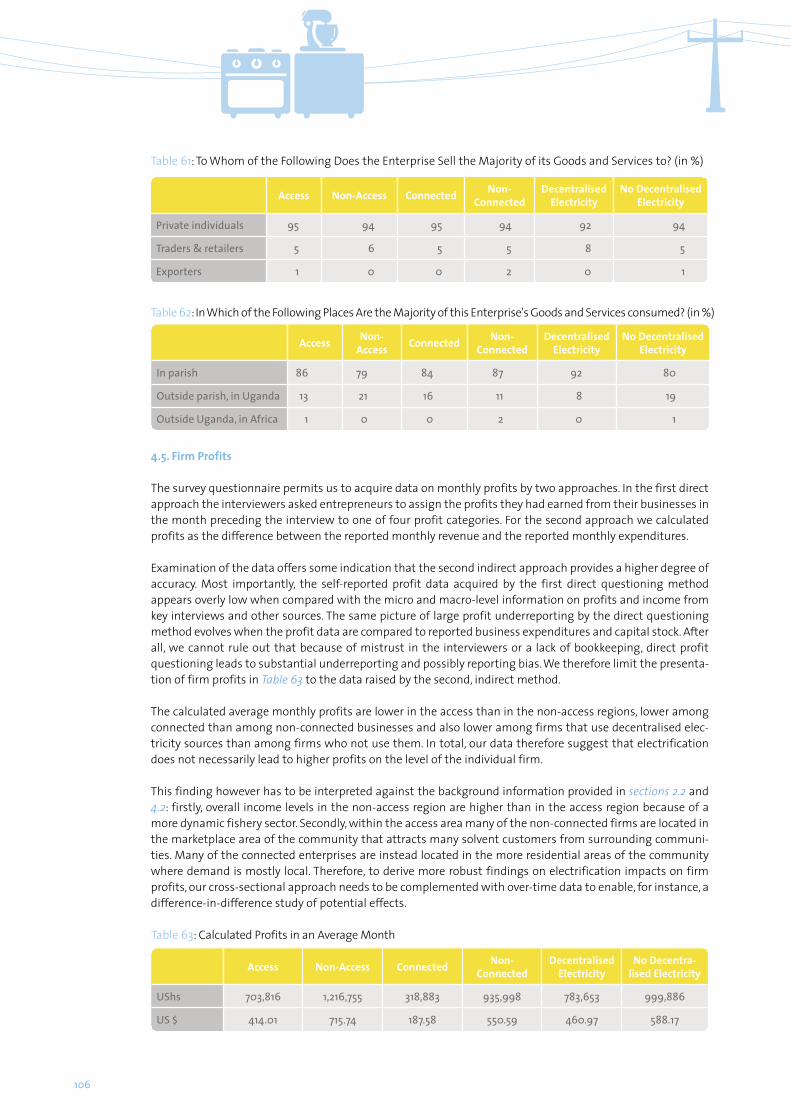
106
Table 61: To Whom of the Following Does the Enterprise Sell the Majority of its Goods and Services to? (in %)
Table 62: In Which of the Following Places Are the Majority of this Enterprise's Goods and Services consumed? (in %)
Access Non-Access Connected Non- Connected
Decentralised Electricity
No Decentralised Electricity
Private individuals 95 94 95 94 92 94
Traders & retailers 5 6 5 5 8 5
Exporters 1 0 0 2 0 1
Access Non-Access Connected Non-
ConnectedDecentralised
ElectricityNo Decentralised
Electricity
In parish 86 79 84 87 92 80
Outside parish, in Uganda 13 21 16 11 8 19
Outside Uganda, in Africa 1 0 0 2 0 1
4.5. Firm Profits
The survey questionnaire permits us to acquire data on monthly profits by two approaches. In the first direct approach the interviewers asked entrepreneurs to assign the profits they had earned from their businesses in the month preceding the interview to one of four profit categories. For the second approach we calculated profits as the difference between the reported monthly revenue and the reported monthly expenditures.
Examination of the data offers some indication that the second indirect approach provides a higher degree of accuracy. Most importantly, the self-reported profit data acquired by the first direct questioning method appears overly low when compared with the micro and macro-level information on profits and income from key interviews and other sources. The same picture of large profit underreporting by the direct questioning method evolves when the profit data are compared to reported business expenditures and capital stock. After all, we cannot rule out that because of mistrust in the interviewers or a lack of bookkeeping, direct profit questioning leads to substantial underreporting and possibly reporting bias. We therefore limit the presenta-tion of firm profits in Table 63 to the data raised by the second, indirect method.
The calculated average monthly profits are lower in the access than in the non-access regions, lower among connected than among non-connected businesses and also lower among firms that use decentralised elec-tricity sources than among firms who not use them. In total, our data therefore suggest that electrification does not necessarily lead to higher profits on the level of the individual firm.
This finding however has to be interpreted against the background information provided in sections 2.2 and 4.2: firstly, overall income levels in the non-access region are higher than in the access region because of a more dynamic fishery sector. Secondly, within the access area many of the non-connected firms are located in the marketplace area of the community that attracts many solvent customers from surrounding communi-ties. Many of the connected enterprises are instead located in the more residential areas of the community where demand is mostly local. Therefore, to derive more robust findings on electrification impacts on firm profits, our cross-sectional approach needs to be complemented with over-time data to enable, for instance, a difference-in-difference study of potential effects.
Table 63: Calculated Profits in an Average Month
Access Non-Access Connected Non- Connected
Decentralised Electricity
No Decentra-lised Electricity
UShs 703,816 1,216,755 318,883 935,998 783,653 999,886
US $ 414.01 715.74 187.58 550.59 460.97 588.17
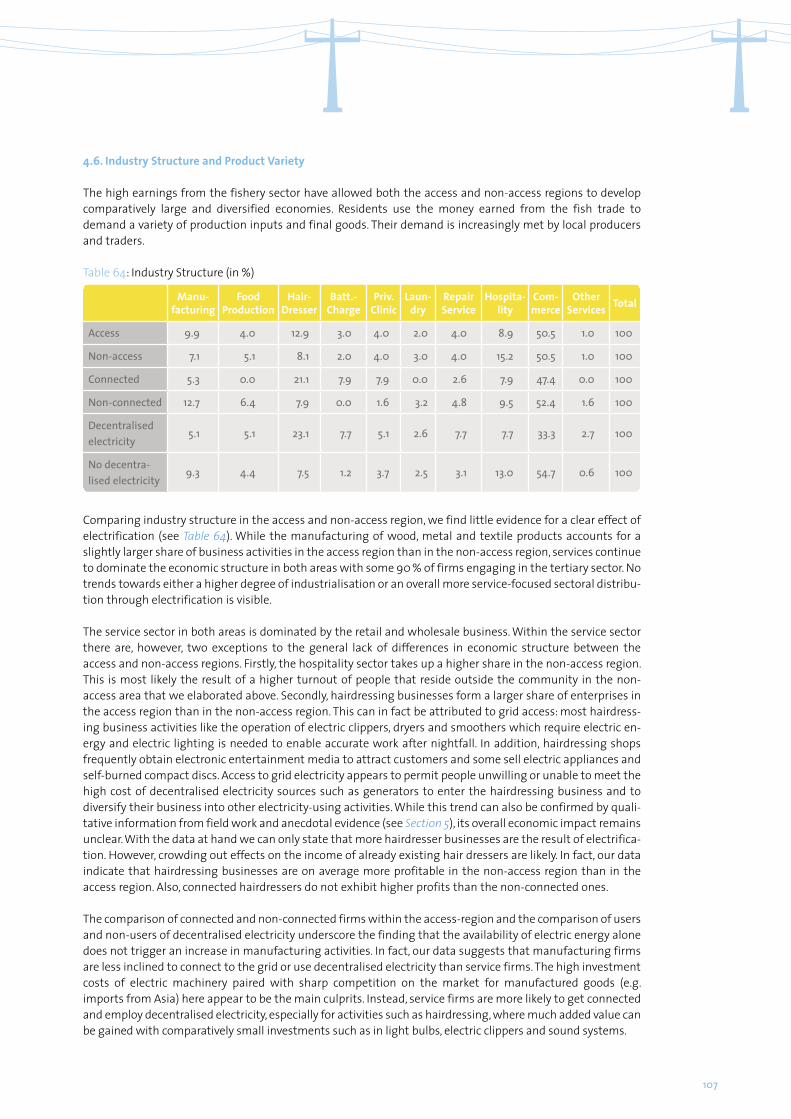
107
4.6. Industry Structure and Product Variety
The high earnings from the fishery sector have allowed both the access and non-access regions to develop comparatively large and diversified economies. Residents use the money earned from the fish trade to demand a variety of production inputs and final goods. Their demand is increasingly met by local producers and traders.
Comparing industry structure in the access and non-access region, we find little evidence for a clear effect of electrification (see Table 64). While the manufacturing of wood, metal and textile products accounts for a slightly larger share of business activities in the access region than in the non-access region, services continue to dominate the economic structure in both areas with some 90 % of firms engaging in the tertiary sector. No trends towards either a higher degree of industrialisation or an overall more service-focused sectoral distribu-tion through electrification is visible.
The service sector in both areas is dominated by the retail and wholesale business. Within the service sector there are, however, two exceptions to the general lack of differences in economic structure between the access and non-access regions. Firstly, the hospitality sector takes up a higher share in the non-access region. This is most likely the result of a higher turnout of people that reside outside the community in the non- access area that we elaborated above. Secondly, hairdressing businesses form a larger share of enterprises in the access region than in the non-access region. This can in fact be attributed to grid access: most hairdress-ing business activities like the operation of electric clippers, dryers and smoothers which require electric en-ergy and electric lighting is needed to enable accurate work after nightfall. In addition, hairdressing shops frequently obtain electronic entertainment media to attract customers and some sell electric appliances and self-burned compact discs. Access to grid electricity appears to permit people unwilling or unable to meet the high cost of decentralised electricity sources such as generators to enter the hairdressing business and to diversify their business into other electricity-using activities. While this trend can also be confirmed by quali-tative information from field work and anecdotal evidence (see Section 5), its overall economic impact remains unclear. With the data at hand we can only state that more hairdresser businesses are the result of electrifica-tion. However, crowding out effects on the income of already existing hair dressers are likely. In fact, our data indicate that hairdressing businesses are on average more profitable in the non-access region than in the access region. Also, connected hairdressers do not exhibit higher profits than the non-connected ones.
The comparison of connected and non-connected firms within the access-region and the comparison of users and non-users of decentralised electricity underscore the finding that the availability of electric energy alone does not trigger an increase in manufacturing activities. In fact, our data suggests that manufacturing firms are less inclined to connect to the grid or use decentralised electricity than service firms. The high investment costs of electric machinery paired with sharp competition on the market for manufactured goods (e.g. imports from Asia) here appear to be the main culprits. Instead, service firms are more likely to get connected and employ decentralised electricity, especially for activities such as hairdressing, where much added value can be gained with comparatively small investments such as in light bulbs, electric clippers and sound systems.
Table 64: Industry Structure (in %)
Manu-facturing
Food Production
Hair-Dresser
Batt.-Charge
Priv. Clinic
Laun-dry
RepairService
Hospita-lity
Com-merce
Other Services Total
Access 9.9 4.0 12.9 3.0 4.0 2.0 4.0 8.9 50.5 1.0 100
Non-access 7.1 5.1 8.1 2.0 4.0 3.0 4.0 15.2 50.5 1.0 100
Connected 5.3 0.0 21.1 7.9 7.9 0.0 2.6 7.9 47.4 0.0 100
Non-connected 12.7 6.4 7.9 0.0 1.6 3.2 4.8 9.5 52.4 1.6 100
Decentralised electricity
5.1 5.1 23.1 7.7 5.1 2.6 7.7 7.7 33.3 2.7 100
No decentra-lised electricity
9.3 4.4 7.5 1.2 3.7 2.5 3.1 13.0 54.7 0.6 100
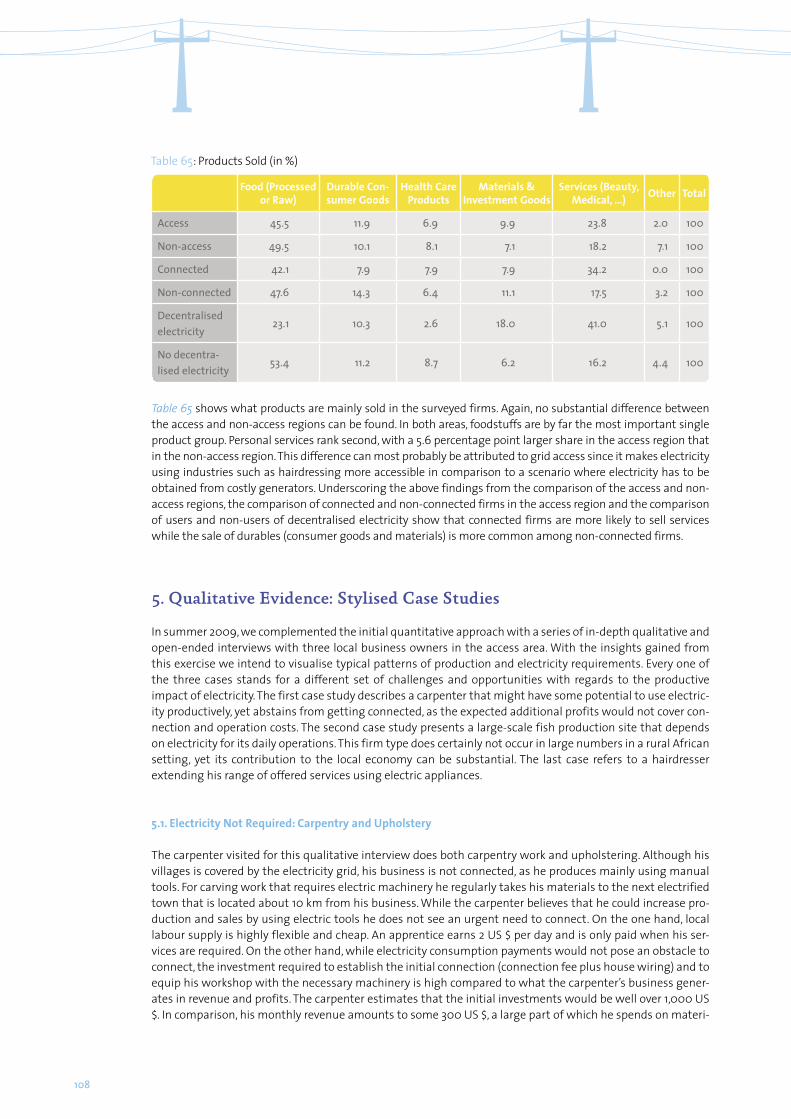
108
Table 65: Products Sold (in %)
Food (Processed or Raw)
Durable Con- sumer Goods
Health Care Products
Materials & Investment Goods
Services (Beauty, Medical, …) Other Total
Access 45.5 11.9 6.9 9.9 23.8 2.0 100
Non-access 49.5 10.1 8.1 7.1 18.2 7.1 100
Connected 42.1 7.9 7.9 7.9 34.2 0.0 100
Non-connected 47.6 14.3 6.4 11.1 17.5 3.2 100
Decentralised electricity
23.1 10.3 2.6 18.0 41.0 5.1 100
No decentra-lised electricity
53.4 11.2 8.7 6.2 16.2 4.4 100
Table 65 shows what products are mainly sold in the surveyed firms. Again, no substantial difference between the access and non-access regions can be found. In both areas, foodstuffs are by far the most important single product group. Personal services rank second, with a 5.6 percentage point larger share in the access region that in the non-access region. This difference can most probably be attributed to grid access since it makes electricity using industries such as hairdressing more accessible in comparison to a scenario where electricity has to be obtained from costly generators. Underscoring the above findings from the comparison of the access and non-access regions, the comparison of connected and non-connected firms in the access region and the comparison of users and non-users of decentralised electricity show that connected firms are more likely to sell services while the sale of durables (consumer goods and materials) is more common among non-connected firms.
5. Qualitative Evidence: Stylised Case Studies
In summer 2009, we complemented the initial quantitative approach with a series of in-depth qualitative and open-ended interviews with three local business owners in the access area. With the insights gained from this exercise we intend to visualise typical patterns of production and electricity requirements. Every one of the three cases stands for a different set of challenges and opportunities with regards to the productive impact of electricity. The first case study describes a carpenter that might have some potential to use electric-ity productively, yet abstains from getting connected, as the expected additional profits would not cover con-nection and operation costs. The second case study presents a large-scale fish production site that depends on electricity for its daily operations. This firm type does certainly not occur in large numbers in a rural African setting, yet its contribution to the local economy can be substantial. The last case refers to a hairdresser extending his range of offered services using electric appliances.
5.1. Electricity Not Required: Carpentry and Upholstery
The carpenter visited for this qualitative interview does both carpentry work and upholstering. Although his villages is covered by the electricity grid, his business is not connected, as he produces mainly using manual tools. For carving work that requires electric machinery he regularly takes his materials to the next electrified town that is located about 10 km from his business. While the carpenter believes that he could increase pro-duction and sales by using electric tools he does not see an urgent need to connect. On the one hand, local labour supply is highly flexible and cheap. An apprentice earns 2 US $ per day and is only paid when his ser-vices are required. On the other hand, while electricity consumption payments would not pose an obstacle to connect, the investment required to establish the initial connection (connection fee plus house wiring) and to equip his workshop with the necessary machinery is high compared to what the carpenter’s business gener-ates in revenue and profits. The carpenter estimates that the initial investments would be well over 1,000 US $. In comparison, his monthly revenue amounts to some 300 US $, a large part of which he spends on materi-

109
als, intermediate goods and transportation. The carpenter does not want to obtain a microcredit to connect and purchase electric equipment as he is unsure whether the interest payments and the pressure of regular payback would be justified by any potential increase in income from such an investment.
With regards to electricity requirements, the carpenter’s business is similar to a large number of enterprises in the local economy. Connecting to the grid would improve the production opportunities of these businesses. However, the required volume of investment is assumed to be out of proportion with its perceived short and mid-term benefits. Hence, these enterprises cannot be expected to connect in the near future. Consequently, no direct electrification impacts on productive use will occur here.
However, the carpenter and many other non-connected entrepreneurs in the access area report a positive development of demand in response to the extension of the grid to the community. This notion is supported by information acquired through interviews with local leaders that state that the establishment of the grid has led to growth of both the community’s population and economic activity.
5.2. Electricity is Crucial: Aquaculture
Recently founded by immigrated entrepreneurs from Europe, an aquaculture firm in the access region engages in the fishing, processing and marketing of silver fish. The product is sold both in the access-region and to neighbouring countries, mainly the Congo. An aquaculture plant for tilapia breeding that also includes facilities for cooling, processing, packaging of products as well as housing for employees was under construc-tion in summer 2009. The firm aims to commercialise Tilapia both on the national and the international market. Negotiations with customers in Belgium and the United Kingdom were reported to be under way at the time of the interview. Unlike most local competitors, it has the possibility to expand in the national and other African markets due to higher standards in terms of hygiene and packaging.
The total investment to set up the enterprise was about 100,000 US $. With 34 employees at present, the firm plans to employ about 300 people once in full operation. Because skilled personnel are scarce in the local com-munity, the firm brings in its own workers from other parts of the country.
Electricity is crucial for the enterprise’s current and future functioning. The firm uses electric pumps for the daily exchange of water in the aquaculture ponds and electric machinery to vacuum package its product. At its full future capacity the facilities are estimated to require 50 kW at an output of fifteen tons of fish per day.The firm has connected to the grid. Because it is located about half a kilometre from the main grid, connection costs amounted to some 15,000 US $. With electricity as an indispensable production factor, the enterprise counters the frequent load-shedding and unannounced power outages with different backup systems such as generators and batteries. It also keeps fresh water reserves for its ponds in case electricity and, thus, the electric water exchange pumps become unavailable for extended periods of time.
The aquaculture firm represents the large-scale often not locally financed business activities that crucially de-pend on electricity. The reliability and affordability of electricity are key determinants of their competitiveness on external markets. To the degree that the income generated through national and international trade flow back to the local community – for instance through wages being paid to employees who then spend them on locally offered consumption goods – local economic activity is stimulated that increases overall local welfare. Where investment opportunities exist, as in the case of the fishing communities along Lake Victoria, a further improve-ment of grid reliability can be expected to entice the setup of more firms like the aquaculture enterprise.
5.3. Electricity Improves Offered Services: Barber, Phone and Computer Shop
The interviewed entrepreneur runs a business that combines a barber shop and a retail and repair business for electronic appliances like TV sets, DVD players, mobile phones, computers and radios. He has spent his entire life in the access region. Since the grid was extended to the village about 5 years before the interview,
110
he has observed rapid growth both in terms of the village population and local economic activity. He states, for instance, that many fishermen from surrounding islands have moved their permanent homes and fami-lies to the area and believes that the availability of electricity to provide electric lighting and to power enter-tainment media are the main drivers of this development. In his opinion, the new residents’ additional demand has triggered increases in both the volume and variety of goods sold in the village. With a growing client base that is willing to pay a small surcharge on products rather than travel to urban areas to purchase them, merchants like him are able to offer higher quantities and a larger variety of products locally.
The entrepreneur started his business as a barber one year before the grid arrived. He then used a generator to provide adequate lighting and power the electric shavers and the TV set and sound system he had set up to attract customers. He connected to the grid as soon as it reached the village, then paying a connection fee of 350,000 UShs (186 US $). His monthly electricity bill typically amounts to 20,000 UShs (12 US $). The shop reports to have profited greatly from the expansion of the village that has taken place after the establishment of the electricity grid. Demand for the electric appliances and electronic repair services, which the enterprise started to offer shortly before electrification, has steadily increased. With the growth in demand and turnover he has obtained additional storage facilities and can now serve up to 5 barber shop customers at a time. His sound system has also affected surrounding businesses: petty traders in foods are now selling their products next to his store as they seek to benefit from the attraction of people by the store’s music.
The firm does not own a generator anymore. When power is cut off scissors are used instead of electric shav-ers to continue the hairdressing business. As load-shedding in the entrepreneur’s view is becoming ever more frequent he plans to again purchase a generator in the near future.
The business represents the broad class of enterprises that use electricity to provide goods and services they offer but that also are able to function on non-electric machinery or also provide other goods and services that do not require permanent access to electricity. Just like the carpentry business described above, the main potential for positive electrification impacts here are indirectly brought about by an electrification-induced population and thus customer base growth. Business with similar responses to electrification were found in interviews with restaurant and bar owners that use electric equipment for lighting, refrigeration and enter-tainment but perceive the expansion of their business mainly to be rooted in an overall increase in demand.
6. Conclusion
This paper has examined the use of energy and the performance of micro-enterprises in two fishing commu-nities along the Ugandan shore of Lake Victoria. In spite of careful preparation of the study and due to both project-related reasons and budgetary restrictions the analysis of the data was complicated by comparability issues between the region with access to grid electricity and the one without. The intended examination of impacts of electricity usage on firm performance was not possible in a way that would be entirely satisfac-tory from a methodologically rigorous point of view. Therefore, we applied a hands-on approach combining quantitative and qualitative methods. We examined intermediate indicators less likely to be distorted by the comparability problems. Furthermore, we conducted a supplementary qualitative case study on stylised firm types in order to visualise both electrification impact potentials and problems that may prevent such impacts from unfolding.
In the region that is connected to the electricity grid we find a 38 % connection rate among the surveyed mi-croenterprises. The share of enterprises that use decentralised electricity sources like generators is about 20 % in both the access and non-access regions showing that even when only an unreliable electricity grid is acces-sible firms tend to back-up against outages. Almost irrespective of the usage of electric energy, traditional energy sources for lighting in particular continue to play a crucial role in the surveyed firms’ energy portfolio. These high overall shares of electricity users in both regions further suggest a high demand for electric energy for African rural standards.

111
Both quantitative and qualitative information indicate that electrification effects on firm performance meas-ured by profits or employee’s income are small. In fact in our sample profits are smaller in the access area and for connected firms and users of decentralised electricity. For reasons that may stretch from a lack of a skilled workforce to access to finance and geographical remoteness, external markets remain inaccessible even after the grid is extended to her village. Particularly among small manufacturing firms, the effects of electricity on the production process appear to be weak. With regards to the structure of firms and that of the local econo-my as a whole, however, we observe moderate electrification effects. In particular, we find some evidence for a shift in firm investments towards electricity-using capital. Furthermore, the observed patterns of sales sug-gest that services and goods that are locally produced and provided slightly gain in importance in response to electrification. It has to be stated, however, that more robust analysis using a larger sample of communities is needed to confirm such structural impacts.
The qualitative case studies underscore the findings from the more quantitative approach. The first case, a one-man carpenter, who has no real productive interest in electricity, represents a type of enterprise very com-mon in the rural African economy. The second case, a large fish processing plant that requires electricity for its production process, may form an exception but it reflects the large potential for electrification to enhance welfare if an attractive business opportunity exists as is the case for Lake Victoria fishery. As the third example, the selected barber shop also offering electronic repair and entertainment services, shows the potential of electrification to increase the variety of goods and services and to open up business opportunities hitherto reserved to those who could afford decentralised electricity sources.
When measured at the level of the individual firm, the overall direct gain from connecting to the grid appears to be small. Opportunities opened up through electrification appear more specific. For instance, fish process-ing enterprises gain from electric cooling. Moreover, by being more affordable than decentralised electricity sources, grid electricity leads to the establishment of additional hairdressing businesses. A further positive impact of grid access on firm performance is induced by the overall expansive effect the establishment of the grid has on local demand, partly due to people moving from outside areas to the community. This view was confirmed in various interviews with village leaders and members of the district administration. Grid access apparently forms an important pull-factor that stimulates additional economic activity through the demand channel rather than through the supply side.
Yet, the influx of people into the grid-access area naturally coincides with (skilled) population losses in sur-rounding, non-electrified areas for which welfare losses are likely. While such effects must be considered in examining the net welfare effects of electrification, their analysis is beyond the scope of our paper.
With respect to complementary services in electrification projects that target the productive use of energy, our findings suggest that the productive take-up of electricity should not be encouraged by all means. The reason is that it is not clear from the outset that a grid connection or switching to electric machinery is ben-eficial for the enterprise. Rather, the capacity to take reasonable decisions has to be strengthened at the level of the individual firm. Promotion activities could, for example, assist entrepreneurs in the drawing up of a firm-specific business plan that includes a thorough assessment of possible gains from connecting. The plan should then serve entrepreneurs as a basis for the decision whether to get connected and to invest in electric appliances – or to rather abstain from a not worthwhile investment.
Methodologically, future surveys should try to draw observations from a larger number of settlements to limit structural bias such as the one faced in this study. Some structural differences may be hard to detect without a profound and in most cases prohibitively expensive pre-survey. Yet, the Uganda experience high-lights the necessity for extensive and prudent field investigations to enable the identification of areas that are suitable for cross-sectional impact measurement.

112

113
Chapter 7: Conclusions By Kilian Reiche, Jörg Peters and Lucius Mayer-Tasch

114
Conclusion
While the interest of policy makers in the nexus between electrification, productive electricity usage and development impacts has been increasing steadily over the last decade, the lack of robust evidence on causal effects of electrification is striking. The joint GIZ-ESMAP study Productive Use of Energy (PRODUSE) – Measur-ing Impacts of Electrification on Micro-enterprises in Sub-Saharan Africa is dedicated to improve the under-standing of this issue. In detail, the PRODUSE study pursued two overall objectives: (a) gaining insights on the interaction between electrification and productive electricity usage by examining the impact of electrification on micro-enterprises and (b) improving the available toolkit for (robust yet cost efficient) impact evaluation of electrification projects and programmes with a particular focus on productive usage.
PRODUSE has shown that proper usage of statistical techniques is required for deriving solid findings on these impacts and has demonstrated that methodological rigour is possible, even if available project evalua-tion budgets are small. The study has confirmed that the ex-ante differences between firms that get con-nected and those that do not get connected are substantial – which invalidates any determination of impacts by simply comparing these groups using descriptive statistics (as is all too often done in literature on electri-fication impacts). The true causal relations between electrification and firm performance may remain veiled and the importance of other factors may be neglected. Methods have to be used that account for observable and also for non-observable heterogeneity between connected and non-connected firms.
With regards to the first objective, i.e. gaining insights on the interaction between electricity access, produc-tive electricity usage, income generation and additional services, valuable and partly surprising findings could be provided based on field surveys carried out in Benin, Ghana and Uganda, in spite of the modest budget of the surveys. Stark differences between industries show up: while service firms tend to get connected to the grid, take-up rates in the manufacturing sector of rural areas were low in the countries that have been stud-ied. Connected firms in rural areas both the manufacturing and the service sectors use electricity mostly for lighting and phone charging. Some rural manufacturing firms also use electric appliances if it is essential for their production process (such as welders). In general, however, take-up of electric appliances remains mod-est. In the service sector more appliances are used, mostly refrigerators and entertainment devices. A slightly different picture prevails in the peri-urban set-up studied in Ghana. Here, grid connected firms employ much more electric machinery.
Altogether, in the three studies electricity usage did hardly translate into higher firm profits in a measurable way.48 In one country case study, Benin, it seems that the financial burden resulting from the investment in the connection and subsequent electricity bills can even reduce the profitability of firms, indicating that from a pure business perspective getting connected is not always a rational option.
These rather sobering results (i.e. the fact that we found no measurable positive effects of electricity access on firm performance in our three cases) were contrasted by some evidence indicating that electrification can lead to the creation of new firms, which generate additional income and, hence, impacts on the target popu-lation in the project regions. Small service and manufacturing firms are created offering goods and services that have previously been imported from other regions or simply not been offered in the area heretofore. In addition, individual cases could be observed, in which larger firms were attracted to the region by the availa-bility of electricity. While such direct investments could contribute substantially to income generation in the region, it is premature to claim that such firm creation occurs systematically. More research in other regions and with larger sample sizes is needed to further understand this potential process of electricity-induced firm creation and investments. This particularly includes studies that survey project target regions before and after electrification and compare firm creation at these two points in time, respectively. Furthermore, crowding out
48) One can think of a whole series of possible explanations for this result of our three case studies, such as lack of access to external
markets, lack of business skills, etc. One possible explanation, which has repeatedly been brought forth by this study’s peer reviewers, is
the low reliability of the electricity grid. However, none of our three case studies allows for clear conclusions regarding these explana-
tions. For example, the grid in the surveyed region in Northern Benin, was stable with short outages occurring only once every few days.
In Ghana and Uganda, both announced and unannounced outages occurred somewhat more frequently but even here only a small
number of entrepreneurs complained about reliability issues. Also, only few non-connected firms declared reliability as a major reason
for not connecting.

115
effects (i.e. people have to reduce their expenditures for the old product in order to buy the new one) have to be taken into account in order to assess the net benefit for a region.
Methodologically, PRODUSE has developed and applied an approach for gaining insight on how micro-enter-prises use electricity and the extent to which this changes their production process. In spite of this innovative contribution, PRODUSE cannot be more than a kick-off to further and broader investigations of the complex relationship between electricity access and productive processes and, eventually, economic development and poverty alleviation. It can be concluded that cross-sectional methods – if properly implemented – are a valid approach to identify causal effects. Furthermore, the ex-ante cross-sectional approach generates insights into firm characteristics and behaviour in a comparably, already electrified non-project region as well as in the project region that can inform the design and implementation of the planned electrification project. For example, the baseline data from the already electrified control group can be used during project implementa-tion for developing realistic business plans together with firms in the project area.
Nonetheless, it would be desirable to also collect over-time data in order to allow the application of differ-ence-in-differences analysis. In contrast to cross-sectional data, this accounts for unobservable heterogeneity between connected and non-connected firms, which in turn increases the robustness of results. Furthermore, it would be desirable to have bigger sample sizes in future studies, because even if the survey is focused on specific industries, the heterogeneity of firms and their responses is high so that small sample sizes are often not able to grasp potentially existing treatment effects in a statistically significant way. In addition, the scope of research might be extended to all sectors in one region and also neighbouring communities in order to capture demand movements and, hence, crowding out effects.
In particular, the fact that PRODUSE could not find much evidence on positive impacts on micro-enterprises in the three project cases in this report does by no means imply that there is no positive impact in other coun-tries and project set-ups.49
We strongly encourage development practitioners and policy makers to make use of rigorous evaluation methodologies such as the one used for PRODUSE50, when planning new energy interventions to i) improve project results and ii) contribute to a more solid overall understanding of the nexus between electrification, productive use and development impacts. As the literature review (Chapter 1) has shown, there are very few solid studies on this topic to date. Once a critical mass of robust evaluation studies has been conducted in a sufficiently broad variety of country, market and project contexts, it will be possible to draw more general conclusions about this nexus.51
One of the conclusions that can be drawn from the research efforts presented in this report is that project managers should be realistic in their expectations with regard to the economic impact of electrification pro-jects. If substantial productive take-up is intended by an electrification project, a typical strategy would be to include the major determinants for productive uptake in the programme’s geographic area targeting process (i.e. pick those areas first that look most promising for productive uses, because they are, for example, exhibit-ing some sort of export potentials). However, this may be in direct contrast to other selection criteria (such as poverty targeting).
The PRODUSE manual, which has been developed in parallel to this study, provides guidance on how to design and implement activities promoting productive use that can be integrated into broader electrification pro-
49) In addition, the size of the specific effect that electrification might have on firm performance in each of our three case studies might
have been too small to be detected with the relatively small sample sizes we have employed. In addition, we have deliberately focused on
MSME only, so that we cannot draw any conclusions on the possibility of significant positive impacts of productive uses of electricity in
home businesses.
50) See Chapter 2 (methodology) and the PRODUSE Impact M&E Guide in the annex.
51) The PRODUSE website is available as a platform for making available studies that fulfill these requirements.
52) See modules 5.3 and 5.4 of the PRODUSE manual Productive Use of Energy (PRODUSE) – A Manual for Electrification Practitioners, which
has been developed by GIZ and EUEI PDF. It can be accessed at www.produse.org/manual.

116
jects and enhance the impact of electrification projects and programmes on local economic development in general and firm productivity in specific. However, the results of our study show that productive use is not automatically associated with positive impacts on firm performance and other parameters. Promotion activities should therefore include support for proper business plan development52 for the targeted firms (i.e. the potential commercial electricity customers) in order to ensure the profitability of their investment into grid connections and electric appliances. Such promotion activities have to be open towards the results: connecting to the grid should not be promoted at all costs. The decision should rather be based on the business plan implying that the recommendation for an individual firm can as well be to abstain from a con-nection if the projected additional revenue is insufficient to recover the investment. This is essential in order to avoid predictable misallocations, which might drive some firms into financial problems (‘electrification trap’). Furthermore, the creation of promising new enterprises as observed in Benin and Uganda could be fa-cilitated by accompanying activities that support potential external investors in collecting the required infor-mation to prepare firm creation in the region. This could be done in cooperation with industry chambers or regional development programmes.
The three country studies also explored the provision of additional services: it could be observed that access to both finance and Business Development Services (BDS) was generally given in most of the surveyed areas. While firms in peri-urban Ghana use credits quite systematically, uptake of credits in rural areas is low. At the same time, many firms claim (in qualitative questions) that access to more equipment would help their business. Procedural difficulties are the most frequently stated reason for not applying for credits. The sur-vey instrument did not allow to further analyse this stated reason – i.e. if there is simply too much red tape in the investigated financial sectors or if actual formal requirements (such as a lack of collaterals) pose factual problems. Yet, we observed that most firms that decide to apply for a credit also receive one.
This leads to the recommendation to complement electrification projects by examining in a first step, if information about credit availability and terms is sufficient and accurate among entrepreneurs. If a knowledge gap exists, information campaigns might help to close it in order to increase usage of exter-nal finance in a profitable way.
BDS, on the other hand, were available in most but not all surveyed regions. If they are available, their quality differs substantially. This makes it very difficult to investigate their impact – in particular in in-teraction with another treatment such as electrification. In order to account for the heterogeneity in different BDS one would need a much larger sample size and several regions – covered and not covered by the respective service. While this was clearly beyond the scope of the PRODUSE study, further re-search should probe into the effect of BDS and its interaction with electrification.
On a more general note, the findings of the PRODUSE study suggest that (rural) electrification should not be reduced to its potential contribution to ‘productive uses’ and, hence, to economic growth in a narrower sense. Firstly, this poses the risk that claimed objectives are not achieved, as productive uptake seems to be moderate in the short term. Secondly and more importantly, this would neglect the ‘non-productive’ significance that electricity arguably has to people in rural areas. From the perspective of rural dwellers, electric lighting, television and mobile phone charg-ing revolutionise their lives. In this context, it should not be forgotten that ‘productive use’ in specific and economic growth in general are only proxies to measure improvements in people’s well-being. Electricity and modern energy services at large, however, directly affect the well-being of rural people – beyond any potential income generation.53 In the same vein, the UN has just included electricity access in the new Multidimensional Poverty Indicator (MPI).54 This general nexus between electrification and well-being is also in need of more robust evi-dence and might be addressed in future research using appropriate methods such as con-tingent valuation or experiments.
53) Fouquet and Pearson (2006) highlight the psychological effects that improved lighting potentially has on
people and also establish a connection to economic development in the long run. See also Bensch, Kluve and
Peters (2010).
54) The MPI is based on the Human Development Index (HDI) and formulates ten dimensions that capture
poverty. See UNDP (2010).

117

118

119
Annex: Impact Monitoring and Evaluation of Productive Electricity Use – An Implementation Guide for Project Managers By Jörg Peters, Gunther Bensch and Christoph M. Schmidt56
55

120
1. Introduction
The existing literature on the methodology of impact evaluations targets academic evaluation researchers or practitioners with a high affinity to becoming acquainted with evaluation methods.57 Practitioners who are rather interested in setting up a hands-on monitoring and evaluation (M&E) scheme to obtain robust insights into the impacts of concrete interventions, however, can hardly be expected to familiarise themselves with these methodological issues at the level of highbrow econometric research.
Intending to close this gap, the guide provides assistance on how to design an impact M&E system or an impact evaluation study for productive electricity use in elec¬trification interventions (PUE impact M&E system in the following) and is tailored to examine electricity take-up and income generation in small and micro-enterprises (SMEs).
It is targeting managers of electrification projects who are particularly interested in monitoring and evaluating the impacts of electrification on SMEs (whom we – for simplicity – hereafter call ‘project managers’)58. Still, it is in the same way geared towards researchers or practitioners in charge of the evaluation itself, the ‘researchers’.
The education of this audience with respect to methodological issues is not the focus of this discussion. Rather, its major aim is raising awareness for important parameters in the design of a PUE impact M&E sys-tem and the provision of project managers with an accessible menu of requisite steps, also intended to en-courage the further development of local evaluation capacities. While this guide focuses on evaluating the impacts of electrification on SMEs, the principal steps of the proposed PUE impact M&E system are inter-changeable and can be transferred to other development projects.
Three different modules are presented, representing the spectrum of potential approaches and their respec-tive advantages and limitations. Depending on the methodological approach, the PUE impact M&E system can either be implemented by project staff or external consultants or researchers with special evaluation skills have to be contracted. For the case in which such researchers are contracted, the present chapter guides the project manager on how to effectively steer and backstop the assignment.
In order to stress the demarcation between classical M&E and impact M&E, the guide reviews briefly the dif-ferent results of an intervention: outcomes, impacts and highly-aggregated impacts. Classical M&E systems typically monitor project activities and sometimes outcomes, but not impacts (ADB 2006). This is elaborated in Section 2 – also by discussing the problems and pitfalls that one encounters when the impacts of electrifi-cation on SMEs are to be evaluated.
Section 3 first introduces principal strategies to assess the impact of an intervention. Subsequently, three modules are presented: one simpler module based on a short SME survey (Module a), one module based on an extended and profound SME survey (Module b) and one module based on anecdotal case studies (Module c). Module (a) and (b) deliver data that can be analysed statistically. All modules have been applied during the PRODUSE study and within other projects.59 A discussion of their respective opportunities and limitations complements the proposal of the modules.
55) If information from this annex or parts of the addenda are used, please cite as: Peters, J., G. Bensch and C.M. Schmidt (2013) Impact Monito-
ring and Evaluation of Productive Electricity Use – An Implementation Guide for Project Managers. In: Mayer-Tasch, L., Mukherjee, M., Reiche,
K. (eds.), Productive Use of Energy (PRODUSE): Measuring Impacts of Electrification on Small and Micro-Enterprises in Sub-Saharan Africa.
56) The authors are grateful for valuable comments by Anna Brüderle, Nadja Kabierski-Chakrabarti, Lucius Mayer-Tasch, Kilian Reiche and
Colin Vance.
57) See Ravallion (2008) and Gertler et al. (2010) for examples of handbooks that comprehensively introduce the methodology of impact
evaluations.
58) The guide is not meant to replace existing handbooks and guides on impact M&E (see above and refer to Addendum 1) or, more
specifically, on evaluation or survey methodology (see for example Ravallion 2008, Iarossi 2007 and Warwick and Lininger 1975).
59) The impact M&E approaches presented here were applied as part of the PRODUSE study in Benin, Ghana and Uganda. Comparable M&E
studies were also implemented in Burkina Faso, Benin, Indonesia, Rwanda, Senegal and Mozambique. In addition to the PRODUSE report,
published reports are Bensch and Peters (2010), Bensch, Peters and Schraml (2010) and Harsdorff and Peters (2010). Methodologically
more elaborated methods are used, for example, in Bensch, Kluve and Peters (2011) or Peters, Vance and Harsdorff (2011).

121
Section 4 is the core of the guide and presents the process of designing a PUE impact study step by step. Step 1, ‘Getting Started’, pays particular attention to outlining the decision process, Step 2 describes the process of design-ing the study, Step 3 the survey preparation, Step 4 the implementation of the survey and Step 5 the data analysis and reporting. To facilitate its practical applicability, an addendum section contains references to further readings and, most importantly, sample questionnaires that have been used in the PRODUSE study and other evaluations.
2. Classical M&E vs. Impact M&E
2.1. Outcomes, Impacts and Highly-Aggregated Impacts
Any programme implemented in practice aims at making a genuine difference to the state of well-being in the target population. To this end, the programme directly influences the state of outcome variables that are intended to trigger intermediate impacts and, eventually, highly-aggregated impacts on income, nutrition or other variables of fundamental importance. In the case of productive electricity usage, one might consider the example of a programme that subsidises the extension or densification of the national grid. Here, a results chain which connects the intervention’s inputs and activities to its outcomes and impacts in generic terms, would, for example, consist of the following links: the desired outcome with regards to productive use is that SMEs get connected. An intermediate impact then is that the firm uses electricity productively for example by employing a machine or by extending its operating hours. The next step in the results chain then is the effect that this electricity usage has on the firm’s production process (increased productivity), while the highly- aggregated impact occurs at the level of the firm owner or the firm’s employees in the form of higher incomes (see Aid 1 for a simple visualisation of a PUE results chain).
Outcomes are typically clearly attributable to the project’s intervention. Both intermediate and highly-aggregated impacts, in contrast, might be caused by a combination of different factors. Apart from the project’s intervention, such other factors may be the firm’s development along its secular growth path, rising or falling demand for the firm’s products as a result of general economic development or changes in market prices of the firm’s products. In the project’s results chain, this insight is expressed as the so-called attribution gap between outcomes and im-pacts. Before attempting any quantification of either of them, the careful enumeration of what the outcomes and impacts are and what the project could achieve in principle should be the starting point of every evaluation effort.
The results chain also shows the difficulty of an impact evaluation: on the one hand, only the highly-aggregat-ed impact variables are of ultimate interest when gauging the effectiveness and success of a programme. The intermediate impact variables, higher profitability, for example, are no means to the end. On the other hand, the more aggregated the impact indicator is, the more difficult and costly it is to isolate the net effects of the intervention on the impact indicators. Taking our example, these are the effects of the electrification project alone. Gross effects, in contrast, also include influences due to external factors that would also have taken place in the absence of the project. Disentangling the electrification impact from these other influences is much more difficult for highly-aggregated impacts than for intermediate impacts. In other words, the attribu-tion of causes and effects becomes more difficult.
Therefore, the question of which level of results to monitor and evaluate is a crucial question to be addressed by the electrification project’s manager. In this spirit, an impact evaluation intends to go beyond the demands of a classical monitoring system by also investigating the indirect benefits (impacts) of the intervention. A classical monitoring system, by con¬trast, is basically restricted to tracking progress of programme imple-mentation and to the review of achievements of the programme’s intended direct benefits (outcomes). The present guide provides a pragmatic outline on how to design the implementation of a PUE impact M&E sys-tem that allows to assess both outcomes and impacts.
The approaches described in this guide mainly aim at intermediate impacts such as higher profitability or firm creation. Since, for instance, entrepreneurial activity is a promising avenue to economic development, these intermediate impacts can be considered as a prerequisite and, thus, as proxies for highly-aggregated impacts. While there is certainly no guarantee that intermediate impacts will ultimately translate into highly-

122
aggregated impacts, convincing evidence for the presence of intermediate impacts is an important piece of information when assessing whether the programme has induced positive, highly-aggregated impacts or not. Intermediary impacts can, hence, be seen as ‘stepping stones’ in the endeavour to identify the genuine impact of the intervention on the ultimately meaningful dimensions of people’s well-being.
2.2. Second Round Effects
Even if the net effect of electrification on connected firms (the micro-effect) can be isolated successfully, this is only one step towards a meaningful assessment of the programme’s impact. In order to obtain the benefi-cial effect on the local economy as a whole (the macro-effect), one needs to account for so-called second round effects. The most important second round effect is the crowding out effect. Crowding out effects occur if the benefit to one enterprise is at the expense of other enterprises. For example, if a small shop attracts more customers thanks to its new electric light bulbs, other non-connected shops may lose because their old customers now buy at the connected shop.
In principle, the intervention area as a whole only benefits, i.e. the regional macro-effect is only positive if (i) productive electricity usage replaces imported goods by locally produced ones or (ii) goods for export are pro-duced using electricity or (iii) the total productivity of the local economy increases, for example via increased usage of mills instead of mortar and pestle, liberating productive capacities for other purposes.
While it is difficult to fully account for such crowding out effects, they have to be kept in mind in both design-ing a PUE impact M&E system and interpreting its findings. At least an attempt should be made to obtain indicative evidence for such effects. This could be achieved, for example, by including non-connected SMEs in the PUE impact M&E system as a control group or by probing qualitatively into the question of where the customers of newly-connected enterprises are coming from.
Further second round effects are possible. Budget effects, for example, can be detected, if people in a village spend parts of their limited budget on new products (e.g. photocopies, cold drinks) that were not available before electrification. As a consequence, they reduce their expenditures on products they used to buy before electrification. This becomes very evident in the case of expenditures for electricity itself – a typically ‘imported’ good. People no longer buy their candles at the local shop, thereby shifting parts of the added value in the supply chain out of the region.
3. Developing a Productive Use Impact M&E System
The objective of a PUE impact M&E system is to obtain credible evidence for impacts of the project – taking into account the attribution difficulties described above. This means that some effort has to be designated to disentangle net project effects from gross effects. The guide presents different modules for a PUE impact M&E system that are suitable for evidencing different levels of impacts. Accordingly, they differ as well with regards to the required resources.
The fundamental decision to be taken by the project manager is whether evidence on impacts beyond the attribution gap should be provided to donors, partner institutions or the public. If the answer is yes, this guide shall help to design and implement appropriate impact M&E activities.
3.1. General strategies to isolate the project’s effect
The methodological challenge of any impact evaluation is to isolate the net effects of an intervention and caus-ally attribute changes in indicators specific to the intervention. For this reason, the evaluation strategy has to identify the counterfactual situation, i.e. what would have happened to the beneficiaries’ (e.g. connected SMEs’) relevant outcome variables (e.g. revenue) in the absence of the intervention. Comparing the counterfactual situ-ation to the factual situation – what has actually transpired after the intervention – provides a valuable assess-ment of the true impact of the project. As a matter of course, however, the counterfactual situation is unobserv-

123
able: we can never know for sure what change would have occurred among the beneficiary group if the programme had not been implemented and the programme impact can at best be estimated in a convincing manner.
To find such a convincing estimate, we have to plausibly approximate this unobservable counterfactual situ-ation. In practice, three main so-called identification strategies are available: (i) simple before-after compari-son (the same firms are interviewed before and after electrification), (ii) cross-sectional comparison (con-nected and non-connected firms are interviewed at one point in time) and (iii) before-after comparison with control group (firms are interviewed before electrification, some of which get connected; connected and non-connected firms are interviewed again after electrification). The three strategies differ in their methodologi-cal robustness, i.e. the extent to which the evaluation is able to deliver valid and reliable results on the net effects of the electrification. In general, the most robust approach is the before-after comparison with control group, while exemptions might exist, for example if no adequate control group is available. An in-depth expla-nation of these identification strategies can be found in Aid 2. This includes a discussion of the assumptions under which each strategy is able to obtain the net effect. In general, outcomes or impacts close to the attribution gap can be investigated using simpler approaches, while the – in view of the results chain – more remote impacts have to be addressed by more sophisticated ones. The choice of an adequate approach depends on the level of impacts the project manager wants to obtain credible evidence on (see Table 66 in Section 3.2). Of course, available funds also play an important role, since (iii) requires much more efforts than (i) or (ii).
3.2. Three PUE Impact M&E Modules In the following, we propose three modules for a PUE impact M&E system that are tailored to measure impacts in the context of productive electricity use and that have been field-tested in various developing countries: Module (a), based on a short enterprise survey, Module (b), based on a profound enterprise survey and Module (c), a case study approach based on semi-structured in-depth interviews.
Since Module (a) and (b) deliver data for quantitative statistical analysis and Module (c) delivers information that is interpreted qualitatively, the decision between the three proposed modules leads to the discussion about the pros and cons of so-called qualitative and quantitative research. It is important to highlight that the terms ‘quantitative’ and ‘qualitative’ do not refer to the nature of elicited information but only to how the col-lected data is analysed. The major demarcation between Module (a) and (b) on the one hand and Module (c) on the other is the sample size. In all three modules, both quantitative as well as qualitative questions can be included in the questionnaire. To sum it up, the advantage of the case study approach in Module (c) is the more open way in which interviews are conducted. Spontaneous adaptations of the interview are possible if deemed interesting by the interviewer and the interviewee can more readily deviate from an intended interview line. Owing to the nature of these interviews, a case study approach can only be based on a limited number of inter-views and, hence, delivers anecdotal insights only. This also leads to the advantage of larger sample size surveys – as proposed in Module (a) and (b) – which enable the researcher to average across many observations, thereby benefiting from the law of large numbers. The price of this advantage of generalisation is that the researcher is constricted to the corset of a structured questionnaire. One remedy is to combine the two general approach-es, i.e. to complement the larger sample size surveys by selected in-depth interviews (see White 2002).
In contrast to the profound survey, the short enterprise survey in Module (a) aims at ‘easy to get and handle’ information (see Table 66) and abstains completely from eliciting more aggregated impacts such as profits or improvements in market access. The aim of this modesty is to avoid difficult data processing (which includes dealing with missing values, see Step 5a) and deriving misleading findings on more complex issues that might result if no sufficient methodological effort is dedicated (e.g. with regards to sample size or advanced statisti-cal data analysis). Module (a) envisages providing evidence on outcomes and on impacts that are close to the attribution gap. The module then resorts to plausibility when linking the observed changes in the direct results and impacts of the intervention to higher impacts. If the survey, for example, shows a considerable take-up of machinery, one could plausibly assume that this also affects positively productivity and, hence, firm profits and employee wages. Module (b), the profound survey, by contrast, aims to provide direct evidence for such effects. A plausible counterfactual situation is established and the impact of electrification on, for exam-ple, firm profits can be assessed by comparing the electricity-using firm to its counterfactual.

124
Module (c), the case study approach, is included since SMEs are less homogenous and numerous than house-holds, making a statistical analysis more difficult. For example, only one or two larger firms might exist in a target region. Including them in a larger sample size survey is not reasonable, since the advantage of larger sample sizes – taking the average across many observations – cannot be exploited for obvious reasons. Restricting oneself to the corset of a structured questionnaire is, hence, not necessary. Doing more open and case study-like interviews is much more sensible in such a case. Another reason for applying the case study approach is to account for unintended effects or to probe deeper into certain issues than structured questionnaires can do (e.g. crowding out effects as delineated in Section 2.2). The findings, of course, have to be interpreted against the backdrop of the non-representative selection. Transferring them to other surroundings or enterprises can only be done to a limited extent (even more limited than for larger sample size studies). However, such case studies can definitely help to understand complex processes among beneficiaries and provide for anecdotal evidence of elec-trification impacts that can, not least, be fed into the design of future larger sample size surveys.
The following Table 66 catalogues the main features of the three modules introduced above – including their respective advantages and limitations. Of course, the components can be modified for specific reasons and the different parts of the three modules can be combined. Based on our experience in various projects, we believe that the modules are a reasonable compilation of M&E activities that are required to yield the described results and recommend that project managers design their PUE impact M&E system along these lines.
Please note that although Module (b) would be commonly referred to as the ‘rigorous’ way of doing M&E, this term is purposefully avoided. The reason is that, as White (2002) points out ‘… the real basis for rigor is the proper application of techniques. Badly or misleadingly applied, both quantitative and qualitative techniques give bad or misleading conclusions.’ In this sense, all modules proposed here can and should be applied rigorously.
Table 66: Potential Approaches for PUE impact M&E – An Overview
Module (a)Short Enterprise Survey
Module (b)Profound Enterprise Survey
Module (c)Anecdotal Case Study Approach
Main purpose
Providing evidence on impacts close to the project’s direct outcomes that can be assessed with a less extensive survey set-up and without applying advanced statistical data analysis for causal attribution. Relation to ultimate poverty impacts is instead established on a plausibi-lity basis only by results chains.
Providing evidence on the causal relationship between electrification and ultimate development indicators using state-of-the-art evaluation techniques.
Collect anecdotal evidence on electricity usage and its impacts. In particular on issues that can hardly be addressed in structured interviews (e.g. impacts on particular SMEs that do not qualify for the other two modules due to non-comparability).
Identification Strategy Background information ÒAid 2
Before-after comparison Cross-sectional, before-after compa- rison or before-after comparison with control group – The baseline survey in a before-after strategy allows to also obtain profound knowledge about the target region.60
Before-after comparison or retrospective questions (with critical qualitative assessment)
Sampling Method Also see Step 4e, Section 4
Simple random sampling Simple random sampling or stratified random sampling
Simple random sampling or non- random sampling of SMEs of parti- cular interest. If combined with one of the other two modules, typical firm types that have shown up during the surveys can be selected.
60) It can be particularly interesting from the project’s perspective to include an already electrified control region. This allows the project to
gain insights about the behaviour of the rural population/enterprises after electrification (see PRODUSE Chapter 3 and Peters (2009) for
methodological details of this approach).
61) Auspices bias refers to the frequently observed tendency of an interviewee to give a response the enumerator (does not) like(s) to hear.
For example, an entrepreneur in a connected firm might answer more positively in an electrification project’s impact survey, because s/he
is thankful for the project. Likewise, s/he might give biased answers because s/he expects additional support from the project.
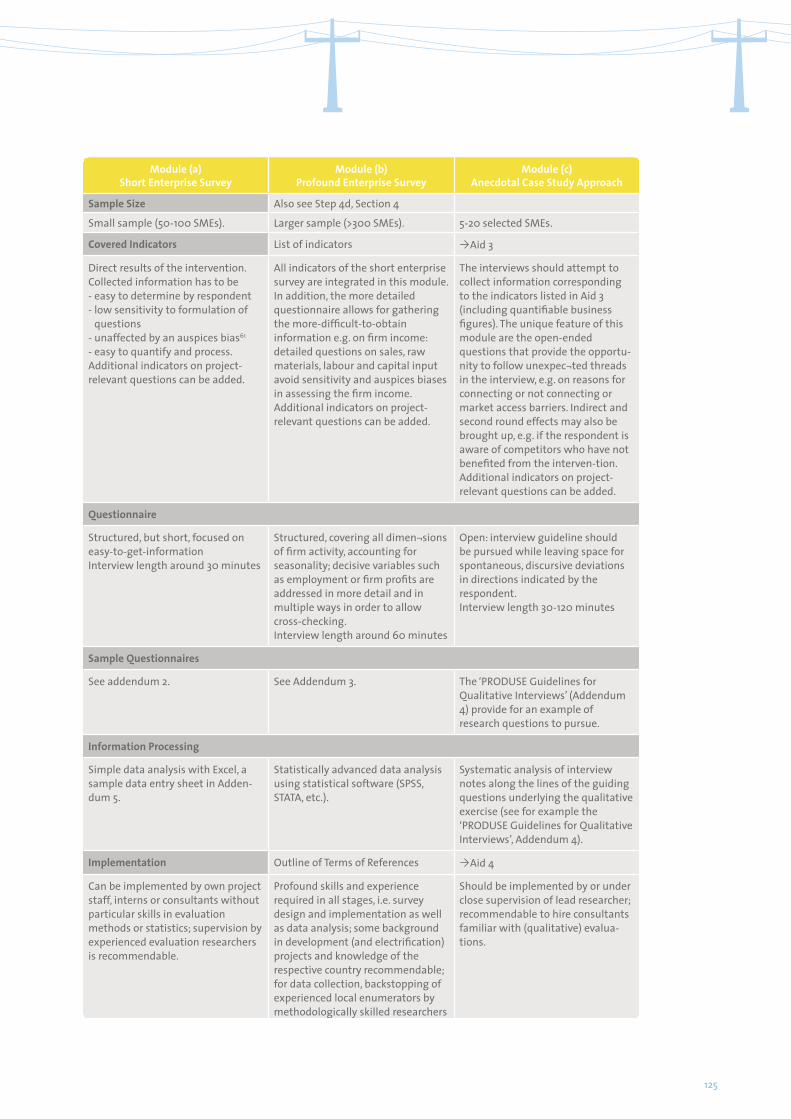
125
Module (a)Short Enterprise Survey
Module (b)Profound Enterprise Survey
Module (c)Anecdotal Case Study Approach
Sample Size Also see Step 4d, Section 4
Small sample (50-100 SMEs). Larger sample (>300 SMEs). 5-20 selected SMEs.
Covered Indicators List of indicators ÒAid 3
Direct results of the intervention.Collected information has to be- easy to determine by respondent- low sensitivity to formulation of
questions- unaffected by an auspices bias61
- easy to quantify and process.Additional indicators on project-relevant questions can be added.
All indicators of the short enterprise survey are integrated in this module. In addition, the more detailed questionnaire allows for gathering the more-difficult-to-obtain information e.g. on firm income: detailed questions on sales, raw materials, labour and capital input avoid sensitivity and auspices biases in assessing the firm income.Additional indicators on project-relevant questions can be added.
The interviews should attempt to collect information corresponding to the indicators listed in Aid 3 (including quantifiable business figures). The unique feature of this module are the open-ended questions that provide the opportu-nity to follow unexpec¬ted threads in the interview, e.g. on reasons for connecting or not connecting or market access barriers. Indirect and second round effects may also be brought up, e.g. if the respondent is aware of competitors who have not benefited from the interven-tion.Additional indicators on project-relevant questions can be added.
Questionnaire
Structured, but short, focused on easy-to-get-informationInterview length around 30 minutes
Structured, covering all dimen¬sions of firm activity, accounting for seasonality; decisive variables such as employment or firm profits are addressed in more detail and in multiple ways in order to allow cross-checking.Interview length around 60 minutes
Open: interview guideline should be pursued while leaving space for spontaneous, discursive deviations in directions indicated by the respondent.Interview length 30-120 minutes
Sample Questionnaires
See addendum 2. See Addendum 3. The ‘PRODUSE Guidelines for Qualitative Interviews’ (Addendum 4) provide for an example of research questions to pursue.
Information Processing
Simple data analysis with Excel, a sample data entry sheet in Adden-dum 5.
Statistically advanced data analysis using statistical software (SPSS, STATA, etc.).
Systematic analysis of interview notes along the lines of the guiding questions underlying the qualitative exercise (see for example the ‘PRODUSE Guidelines for Qualitative Interviews’, Addendum 4).
Implementation Outline of Terms of References ÒAid 4
Can be implemented by own project staff, interns or consultants without particular skills in evaluation methods or statistics; supervision by experienced evaluation researchers is recommendable.
Profound skills and experience required in all stages, i.e. survey design and implementation as well as data analysis; some background in development (and electrification) projects and knowledge of the respective country recommendable; for data collection, backstopping of experienced local enumerators by methodologically skilled researchers
Should be implemented by or under close supervision of lead researcher; recommendable to hire consultants familiar with (qualitative) evalua-tions.

126
4. Step-by-step Towards an Effective PUE Impact M&E System
The project manager might scrutinise the demands of the project, choose an appropriate identification approach (see Section 3.1) and apply it using one of the three modules (see Section 3.2). But what is the best sequence of making these choices and which are the questions to be addressed systematically in this pro-cess? This section presents a step-by-step guidance for designing a PUE impact M&E system, suggesting which stakeholders should be involved at which stages of the process. Steps 1 and 2 have to be carried out by the project manager or at least require his or her close involvement. Steps 3 to 5 are mostly the responsibility of the project staff members or of the external researchers to whom the implementation of the PUE impact M&E system is assigned. In order to complement the guidance and information provided here and for further readings, one may consult the M&E guides referred to in Addendum 1.
Step 1: Getting Started
Before thinking about the concrete design of the PUE impact M&E system in Step 2, the project manager should take the following basic considerations.
Step 1a: Decision on Whether to Do an Impact Evaluation
Do the additional benefits of a PUE impact M&E system compared to a classical M&E system justify the additional costs from the project’s perspective? If yes, continue with Step 1b.
The intention of conducting impact M&E should be communicated to all other project stakeholders including local partner institutions on both the political and implementation level (e.g. utilities, ministry). They should be included in the design process, if possible.
Step 1b: Examination of the Project’s Results Chain
The project’s results chain is the conceptual framework of the PUE impact M&E system. If no results chain with regards to productive electricity use exists, it has to be drafted by the project management in order to get a clear picture of which transmission channels from inputs to impacts exist. Accordingly, the results chain helps to determine appropriate outcome and impact indicators. Even if a results chain has already been established, a review is recommended at the time the PUE impact M&E system is designed, not least since adaptations in the project design might have occurred in the meantime. A stylised model results chain is provided in Aid 1.62
Step 2: Designing
The third step is then to design the PUE impact M&E system. This includes the following parameters:
� determination of the objectives of the PUE impact M&E system (Step 2a)� decision on the impact indicators (Step 2b)� choice of the appropriate module (Step 2c)� selection of staff members or external researchers to implement the PUE impact M&E system (Step 2d)� adaptation of selected module to project needs and particularities (Step 2e).
As depicted in Figure 8 decisions on a certain sub-step may have repercussions on previous sub-steps. For example, if it is decided in Step 2d to hire an external researcher, s/he should review the previous steps incl. the indicators to be examined. Likewise, the decision on which module to apply (Step 2c) can also affect the selec-tion of indicators (Step 2b).
62) Note that in reality a results chain is much more complex in most cases. The purpose of the results chain presented here is only to
illustrate the idea of a theory of change underlying the project and its importance to the impact M&E system.
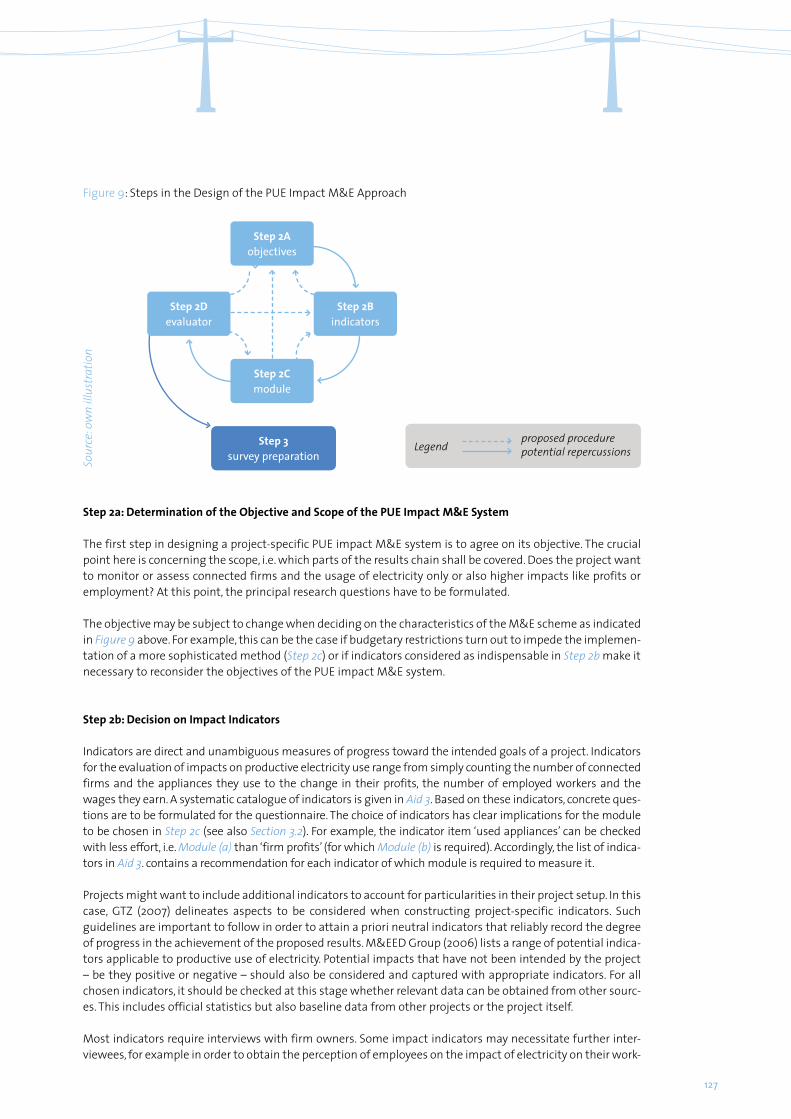
127
Figure 9: Steps in the Design of the PUE Impact M&E Approach
Step 2Aobjectives
Step 2Bindicators
Step 2Cmodule
Step 3survey preparation
<
<
<
<
<
<
<
<
Step 2Devaluator
<
<<
<
Legendproposed procedurepotential repercussions
Sour
ce: o
wn
illus
trat
ion
Step 2a: Determination of the Objective and Scope of the PUE Impact M&E System
The first step in designing a project-specific PUE impact M&E system is to agree on its objective. The crucial point here is concerning the scope, i.e. which parts of the results chain shall be covered. Does the project want to monitor or assess connected firms and the usage of electricity only or also higher impacts like profits or employment? At this point, the principal research questions have to be formulated.
The objective may be subject to change when deciding on the characteristics of the M&E scheme as indicated in Figure 9 above. For example, this can be the case if budgetary restrictions turn out to impede the implemen-tation of a more sophisticated method (Step 2c) or if indicators considered as indispensable in Step 2b make it necessary to reconsider the objectives of the PUE impact M&E system.
Step 2b: Decision on Impact Indicators
Indicators are direct and unambiguous measures of progress toward the intended goals of a project. Indicators for the evaluation of impacts on productive electricity use range from simply counting the number of connected firms and the appliances they use to the change in their profits, the number of employed workers and the wages they earn. A systematic catalogue of indicators is given in Aid 3. Based on these indicators, concrete ques-tions are to be formulated for the questionnaire. The choice of indicators has clear implications for the module to be chosen in Step 2c (see also Section 3.2). For example, the indicator item ‘used appliances’ can be checked with less effort, i.e. Module (a) than ‘firm profits’ (for which Module (b) is required). Accordingly, the list of indica-tors in Aid 3. contains a recommendation for each indicator of which module is required to measure it.
Projects might want to include additional indicators to account for particularities in their project setup. In this case, GTZ (2007) delineates aspects to be considered when constructing project-specific indicators. Such guidelines are important to follow in order to attain a priori neutral indicators that reliably record the degree of progress in the achievement of the proposed results. M&EED Group (2006) lists a range of potential indica-tors applicable to productive use of electricity. Potential impacts that have not been intended by the project – be they positive or negative – should also be considered and captured with appropriate indicators. For all chosen indicators, it should be checked at this stage whether relevant data can be obtained from other sourc-es. This includes official statistics but also baseline data from other projects or the project itself.
Most indicators require interviews with firm owners. Some impact indicators may necessitate further inter-viewees, for example in order to obtain the perception of employees on the impact of electricity on their work-

128
ing environment. Such research questions, however, are best included in complementary qualitative inter-views conducted in Module (c). Other examples are the impact on the community in total, on the local environment or impacts related to the choice of the electricity source.
Mini-grids fed by diesel generators, for example, may result in high long-term costs and dependency on external suppliers, whereas micro-hydro projects may interfere in the local water provision of households and farmers.
Step 2c: Choice of the Evaluation Module
One of the three modules proposed in Section 3.2. must to be selected: the Short Enterprise Survey, the Profound Enterprise Survey or the Anecdotal Case Study Approach. The module decision should be based on a comparison of the advantages and limitations of each module (see Table 66) with the objectives of the evaluation (see Step 2a) and the available budget. Modifications of the selected module can be carried out in line with particular needs of the project. An extensive calibration should be done by the staff member(s) or consultant(s) to whom the implementation of the PUE impact M&E system is assigned as we explain in the following Step 2d.
Step 2d: Assign the Implementation to Qualified Staff Members or External Experts
The different modules require different levels of skills and resources. The module presentation in Section 3.2 indicates the requirements in terms of methodological know-how and time requirements to implement each module. For Module (b), the hired researchers have to meet the following requirements: experience with impact evaluations, statistical skills, experience with development projects and, if possible, electrification projects. If it is intended to apply econometric methods during the data analysis, the researcher should be familiar with statistics and econometrics – at best documented by a list of publications in academic peer- reviewed journals in the fields of impact evaluation and applied econometrics.
Step 3: Survey Preparation
Survey preparation varies substantially between the different modules. For Module (a), the sub-steps of this task do mostly not apply, since its features are already pre-defined, e.g. the before-after approach is the only recommended identification strategy (Step 3a) and no control regions are to be included (Step 3e). Module (b) and (c), in contrast, require considerably more effort both with regard to desk and field work (Step 3e to 3h). The field work implies a mission of the researchers to visit the target and potential control regions but also to meet the project staff (in particular if the researchers are international experts), to finalise the methodology and to train the survey team.
Step 3a: Decision on Identification Strategy
As described in Section 3.1, there are different ways of identifying the impacts of electrification. An appropriate comparison, the so-called counterfactual situation, has to be established. If the PUE impact M&E system is set up at the beginning of the electrification project, in principle all strategies are possible. If it is decided after the project has electrified the target regions that impacts should be examined, the cross-sectional approach is the only possible one. Methodologically, the before-after comparison with a control group is the most robust approach – but, as a matter of course, it also requires more resources, since two surveys have to be done (be-fore and after) in two regions (project’s target region plus control region). Without special methodological and statistical skills, the cross-sectional comparison is the most difficult one for Module (a) and (b). Hence, as a general rule it is recommended to set up the PUE impact M&E system before the first regions are electrified and make either a simple before-after comparison or the extended version including a control group. If the cross-sectional approach is chosen (e.g. because it is too late to estabish a baseline), it has to be done by experienced evaluation researchers. See Aid 2. for a more profound description of the three approaches.

129
Step 3b: Submitting an Inception Report
An inception report should be drafted by the researchers to outline briefly the intended procedure at the out-set of the assignment. It provides an opportunity for the project staff to get acquainted with the intended approach and to intervene if deemed necessary. The submission of an inception report is, hence, particularly recommended in case the researcher is an external person or entity but can also be a valuable preparatory instrument for in-house discussions.
This inception report should best be structured as follows: (i) project description, (ii) methodology and (iii) implementation. The first section should present basic information on the electrification project including its results chain. The second chapter should first explain briefly the selection of modules. In a second step, adapta-tions to the chosen module(s) can be illustrated. The purpose of the third chapter is to present an outline of the data collection and analysis process supplemented by a time schedule. This should also include the envisaged sample size and sampling method – if possible, already specifying the different SME types to be interviewed.
Step 3c: Development of Questionnaire
Based on the proposed approach outlined in Step 3b, a questionnaire has to be developed that covers the requirements determined in steps 2a and 2b and that corresponds to the approach chosen in 2c. Of course, the questionnaire for Module (a) is much shorter than the one for Module (b). In all cases, the questionnaire should be well organised and furnished with complementary annotations for the enumerator, where necessary.
For Module (c), the questionnaire is more an interview guideline delineating the aspects that should be ad-dressed during the interview in spite of its principal openness. Sample questionnaires for Module (a) and (b) are provided in and Addendum 3. For Module (c), the PRODUSE guidelines for qualitative interviews that have been developed for the Uganda case study (see Addendum 4) contains a list of guiding questions; of course, this list cannot always be transferred one-to-one and needs to be adjusted to the particular case, since the research objective may deviate in other countries and projects.
At least for modules (a) and (b), pre-testing the questionnaire with 5-20 interviews is imperative to scrutinise the formulation of questions (the interviews for Module (c) are more conversational so that questions do not need to be as accurate). It is most suitable to do this pre-test with the already selected and trained enumera-tors (Step 3h). At the same time, the pre-test can serve as a training component for the enumerators. It is also highly recommendable for the researchers to do field trips to the target region and some focus group discus-sions with target group representatives to check the appropriateness and completeness of the questionnaire.
Step 3d: Selection of Field Work Team
For Module (a) the team may even consist of project staff only. Additionally, interns or consultants can be hired. By contrast, Module (b) requires one or two teams of around four enumerators and one field supervisor, depending on the sample size and availability of time and means of transport, of course. As a rule of thumb, one can expect 4 and 6 interviews per enumerator per day for Module (b) and (a), respectively. Interviews for Module (c) should be conducted by the hired researchers themselves, supported by local consultants familiar with the situation and social customs in the target region.
Step 3e: Choice of Control Regions
Information that allows assessing the comparability of potential control regions and the target region of the electrification project should already be collected as part of the preparatory desk work. In addition, a field trip to the target areas of the intervention is generally indispensable. While the comparability of villages can best be assessed on the ground by visual inspection, the following list of criteria can provide for some guidance:

130
� level of economic activity� distance to the capital and/or regional centres� population size� main source of income (agricultural and non-agricultural products)� road accessibility (distance to asphalt roads, accessibility by cars and/or trucks)� transit traffic� existence of a regular market in the village� political relevance� availability of other services (such as vocational training or microfinance) � presence of other development projects.
Talking to local key informants such as village chiefs, teachers or NGO representatives can help to get a better picture of the villages that are considered to be included.
Step 3f: Determination of Sample Size
The determination of the sample size for Module (a) or (b), in principle, is based on statistical considerations. However, a statistically accurate determination of the required sample size, commonly referred to as power analysis, will not be possible in most cases. This statistically appropriate sample size mainly depends on the specific impact indicators (e.g. firm profits or employment, usage of electric lighting) and the extent to which they are expected to change due to electrification: the smaller the expected change, the higher the sample size that is required to derive robust and clear interpretations from statistical results. To sum it up, if one finds sta-tistically significant evidence for an impact of electrification on, for example, firm profits, there are not so many reasons to worry about a sufficiently large sample size. The problem is rather whether to interpret a no-effect result as genuine evidence of no effect of the intervention or as a reflection of an insufficient sample size, given the setup of statistical significance tests. It might as well be the case that the sample size is simply too small to detect a positive impact. The objective of a power analysis is exactly to avoid such inconclusiveness.
See, for example, Magnani (1997) for an accessible presentation of power analysis.63 Among the parameters required to determine the sample size, are (with + or - indicating whether the parameter increases or de-creases the required sample size):
a) the number of firms in the target population [+]b) the heterogeneity of firms in the target region [+]c) the expected magnitude of the intervention’s impact (e.g. 20 % higher profits for connected SMEs in
comparison to comparable non-connected ones) [-]d) the desired degree of confidence that an observed change would not have occurred by chance (the
level of statistical significance) [+]e) the desired degree of confidence that an actual change of the magnitude specified above will be
detected (statistical power) [+]. 64
Only d) and e) are at the discretion of the researcher. To gauge the concrete realisation of all other parameters will be difficult in most cases, however. Nevertheless, a rough power calculation conducted with approximate values will indicate how the required sample size changes if, for example, firm profits are taken as an impact indicator compared to lighting hours usage (see Bloom 1995 for more details on sensitivity tests).
As a pragmatic alternative to power analysis, one might resort to rules of thumb: the purpose of any (quanti-tative) evaluation study is to compare samples of firms with each other, for example connected to non-con-nected firms or firms before electrification to the same firms after electrification. In order to allow for statisti-cal analysis, as a rule of thumb, the sample size per subgroup must not fall below 30 firms, e.g. 30 connected
63) As a matter of course, the presentation can only be superficial at this point. For further readings on the power of surveys see also Cohen
(1988).
64) For indicators expressed as proportions (e.g. share of energy expenditures in total SME expenditures before the intervention) the initial
or baseline level of the indicator additionally affects the required sample size.

131
65) In demarcation to the ideal situation case mentioned above, this is referred to as clustered random sampling. Because observations from
one cluster do not differ as much as observations from different clusters do, one needs a larger sample size to capture the variation
between firms. The choice of the sampling scheme therefore has repercussions for the sample size determination (see 4d and Warwick
and Lininger 1975).
and 30 non-connected firms. However, the number of relevant subgroups increases with the set of firm char-acteristics to be taken into account. For example, if the analysis furthermore distinguishes between com-merce and manufacturing firms, the required sample size already increases to 120. Assuming that more firm categories have to be accounted for (regional differences, firms sizes, industries, etc.) a sample size of 200-500 seems reasonable and allows for the application of many statistical tools. At least for Module (b) considerations on this rule of thumb and the subgroups to account for should be provided in the inception report (see Step 3b).
For Module (c), the number of interviewed firms can be determined according to the budget. Here as well, certain differences between firms that can be important for answering the research questions have to be taken into account.
For example, one might be interested in the (non-)use of electricity and its impacts on service firms supplying non-tradable goods and firms that are producing exportable goods as well as those producing non-exportable goods (exportable in this context refers to trade with regions beyond the intervention zone of the electrification intervention). In this case at least 1-2 representatives of each subgroup – further distinguished according to their connection status – should be visited.
Step 3g: Decision on Sampling Design
The purpose of sampling is to select firms for interviews from the totality of firms in the target region (and potentially in a control region) in a way that is governed by chance, not by the researcher’s or enumerator’s choice (probability sampling). The resulting randomness of sample selection is crucial for guaranteeing the representativeness of the collected data. Module (c) is an exception by allowing as well for purposive sampling of firms according to specific demands or ex-ante expectations. These expectations depend on the project setup and the target region. For example, one might expect special insights on impacts in export-oriented firms. For the qualitative part of the Uganda case study on electricity usage in two export oriented fishing communities at Lake Victoria (see Addendum 4), to take another example, three groups were identified beforehand: voluntary non-users, ‘non-performers’ that get connected but do not seem to benefit from the connection and ‘winners’ that get connected and seem to be able to improve their performance. The type of firms on which Module (c) should be targeted has to be elaborated on before the survey. This should also be addressed in the inception report (Step 3b). Yet, in a case in which Module (c) is combined with another mod-ule, the researchers can decide that firms to be interviewed qualitatively are selected after the survey accord-ing to, for example, stylised firm types determined during the surveys.
For Module (a) and (b) some form of probability sampling has to be applied. In the ideal situation, the research-ers have a comprehensive enumeration of all firms in the target area to draw a random sample from. In most cases, such a list will not be available, however, only a list of villages to be electrified. Often, more than a dozen villages are electrified, so that surveying all of them is hardly an option from a logistical and budgetary point of view. The first step of sampling is therefore to select a subset of villages.65 A random selection where the probability that a village is selected is directly linked to its population size is advisable (see e.g. Iarossi 2007 for details). In particular for Module (a) the researcher might simply pick a subset of villages from the target region – either by chance or based on certain ad-hoc representativeness considerations. For example, one could choose a certain number of villages from each of the (sub-)regions the project intervenes in. Per village, a certain number of firms then has to be selected – depending on the total sample size defined in Step 3f. The most pragmatic approach is simple random sampling (within the villages): if a list of firms exists, the field supervisor simply draws randomly the required number in the respective village. If no such list exists, the field supervisor assigns the enumerators to different parts of the village, where the number of firms can normally be obtained from some key informant. Since SMEs in rural parts of developing countries are often not recognisable as such, the key informant should furthermore be consulted about the location of the

132
individual enterprises. The first firm to be interviewed is picked by chance by the field supervisor or the enu-merator. Afterwards, the enumerator visits every nth firm along a predefined route – with the n depending on the required sample size and on the number of firms that exist in the respective part of the village.
In brief, as long as the interviewed firms are selected randomly, basic representativeness can be expected. Further structural sampling errors that occur in many settings can be avoided if the field research team con-forms to the following two principles: (i) cover the whole intervention area, especially in terms of centrally and remotely located firms and (ii) do not skip absent firms but revisit them later. Otherwise a certain part of the local economy (e.g. shops that only open in the evening hours) may be excluded from the sample.
In case of the profound enterprise survey – Module (b) – the hired consultants might consider other more elaborated forms of sampling, for example stratified random sampling. Here, firms are grouped into ‘strata’ beforehand. Stylised firm types such as ‘manufacturing’ and ‘services’ are one example of strata. Geography is another logical choice for stratification, because location is likely to be correlated with a number of other variables that are of relevance for the evaluation. For example, for a baseline study the enterprises in a village can be stratified into ‘village centre firms’ and ‘more remote firms’. If information on the outline of the upcom-ing grid is available, this may as well be used to stratify enterprises into firms located closer to the upcoming grid and those living further away. Stratified sampling ensures that the two groups are adequately repre-sented in the sample to be drawn and not – due to chance – underrepresented. If, for example, two in three firms in an intervention area are located in the village centre, two in three interviewed firms should be located there. For this approach it is necessary to know beforehand for each of the different ‘strata’ the number of SMEs it contains.
Another option is to purposefully oversample firms that are more likely to connect in the future in order to ensure that sufficient information is obtained about them. This option is particularly relevant if the research-er worries about the risk of a low electrification rate among SMEs in general or among SMEs of a specific firm type of interest. In our example, one might expect that the village centre firms are closer to the future power lines and therefore more likely to connect to the future grid. In the case of oversampling it is important to use weights during data analysis in order to reconstitute representativeness. Details on the implementation of the different sampling approaches and additional methods can be found in the standard literature on survey methodology (see, for example, Iarossi 2007, Magnani 1997 or Warwick and Lininger 1975). Apart from simple random sampling, all sampling approaches should be implemented by methodologically skilled researchers.
Step 3h: Training of Field Work Team
Interviews for Module (c) are conducted by the researchers themselves. The field work team for Module (a) can consist of project staff only. Additionally, interns or consultants can be hired. If enumerators or consultants are hired, they can be trained in a few hours to do the interviews, depending on the complexity of the questionnaire.
Module (b) requires a team of around four enumerators and one field supervisor, depending on the sample size and availability of means of transport. As a rule of thumb, an enumerator can conduct four interviews per day. They have to be trained and backstopped by a methodologically skilled researcher. During the training, the enumerators and the field supervisor have to become acquainted with the objective of the study and the meaning and purpose of each question. Furthermore, the enumerators have to be taught how to deal with non-responses, to pay attention to consistency problems and to report complementary qualitative informa-tion in written comments or verbally to the field work supervisor. The training takes around 1.5 days in the ‘classroom’ and should be interactive, e.g. by means of role plays of interviews.
The training can be combined with a pre-test of the questionnaire, which is in this case conducted by the freshly trained enumerators under supervision of the field supervisor and the researcher. It is recommendable to contract the same enumerators for data entry afterwards. Data entry should also be taught during the training course. Pre-test and data entry training take another 1.5-2 days.
In many regions, the employees of the SMEs to be interviewed will not speak English, French or Portuguese, so that some form of translation has to be applied. Whether the questionnaire itself is translated or enumera-

133
tors translate the questions in an ad-hoc manner depends on the particular region and the local language that is spoken.66 This should be discussed with the local survey partners familiar with the languages that are spoken in the survey region.
Step 4: Implementation
Step 4a: Conduct Survey
In particular for Module (a) and (b), a thorough logistical planning is a precondition for a successful implemen-tation of the survey. Transport to and within the target region has to be ensured. For Module (a), one enu-merator can do 6-7 interviews per day. The longer questionnaire in Module (b) normally makes it difficult to do more than 4 or 5 questionnaires per day. As a matter of course, in both cases this depends on the distance from the base camp to the survey village at the respective day and from the distance between the SMEs to be interviewed, which may be located in more than one village.
The sampling strategy determined in steps 3f and 3g has to be implemented in each village. In Module (b) this has to be done by the field supervisor, who assigns the enumerators to different parts of the village. The enu-merators should make sure that the interviewees are the actual owners with full insights into their firm’s operation – if necessary through an appointment or revisiting the firm later. In addition, it is recommended to do a short village level interview with, for example, the village chief to obtain an assessment of the local busi-ness environment, market access and most important barriers, reliability of the electricity grid and general income sources. After the first interviews have been completed, the questionnaires should be checked by the field supervisor for consistency and completeness. Potential problems and respective solutions can be discussed with the enumerators.
For Module (c) the interview length depends on the issues to be discussed with the respondent. But even if the number of questions is known, the duration is less predictable than for structured questionnaires, as sponta-neous deviations from the interview guideline are possible and even desired. If enterprises state that positive or negative impacts of electrification of whatever sort exist, the researcher should – on the spot – check for other potential sources of this impact. For example, the interviewee can be simply asked if other explanations are possible for why her/his situation has improved, e.g. if the firm benefits from other development projects (in general, the comparability criteria mentioned in Step 3e represent a useful starting point when trying to elicit potential triggers of change).
It seems reasonable to take two hours as the maximum duration for the qualitative interview to avoid over-burdening the enterprise. In this case, it might also be considered to give an in-kind remuneration to the respondent to compensate for her/his loss of time. In addition, the interview might be divided and spread over the day. Thereby, the interviewer also has the occasion to observe the business at different times of the day.
Step 4b: Data Entry
For Module (a) and (b) the entry of the collected data is a highly important step. If a proper digitalisation of the questionnaire information is not assured, even the best collected data will not be useful. Therefore, much effort has to be put into preparing an easy-to-use and trouble-free data entry template that helps to avoid data entry mistakes from the outset. In the same way, the training of staff to enter the data (preferably, this is done by the enumerators themselves, see Step 3h) and backstopping the data entry (which can be done by the field supervisor) including quality assurance are of particular importance. The best way is to supervise the entry of the first 3-4 waves of questionnaires directly and check afterwards for each questionnaire whether the data is entered correctly. Once the data entry staff seems to work independently, picking just a sample of questionnaires for quality control is sufficient.
66) To give an example, while Wolof is a widely spoken language in Senegal, also well-educated people are often unable to read it. Hence,
enumerators prefer to translate on the spot from French into Wolof. In Rwanda, in contrast, Kinyarwanda is also widely used as a written
language. Therefore, enumerators prefer to work with translated questionnaires. In Benin, many different languages are spoken within
one region, so that enumerators adapt on-site to the language the interviewed firm (or household) speaks. Translating the French
questionnaire into one local language would not make sense.

134
A code sheet for additional response categories or open questions has to be provided to the data entry staff (at best after the first 3-4 waves of questionnaires have produced the most common answers) to avoid time-consuming ex-post recoding and ensure uniform usage of codes. The data can be entered in an Excel spread-sheet and easily transferred to other statistical packages for data analysis afterwards. A sample data entry sheet is provided in Addendum 5.
For Module (c), the data can only be processed to the extent that it is quantifiable. Depending on the number of interviewed firms, this is not always necessary. For the main body of collected information one might rath-er speak of ‘digesting’ the interviews. How this is implemented depends on whether the interviews have been done by the principal researcher or by someone else. In the latter case, a systematic way of reporting the information has to be developed. This digestion step bears the risk that information gets lost and is time consuming – another reason for assigning the interview work directly to the researcher. The staff member who conducts the interviews should at least be in close contact with the researchers responsible for the final report, also during the reporting phase.
Step 5: Analysis and Presentation of Results
Step 5a: Information and Data Processing and Analysis
For Module (b), a common challenge is how to deal with non-responses inducing missing values in the data. One approach is to drop observations for which values are missing. To the extent that these values are not missing at random, however, this will induce biased estimates. One can easily imagine that specific firms, for example those exhibiting particularly high or particularly low profits, are more or less willing to respond to questions on profits. Hence, the researcher has to find ways to impute missing observations in order to avoid biased results. The easi-est way is to simply fill in mean values for certain subcategories of firms. For example, one might impute profits according to the number of customers. More sophisticated imputation algorithms are presented by King et al. (2001) or implemented in statistical software packages such as the module ICE within STATA.
For Module (a), the problem of missing data will be much less severe, as the principal idea of this module is to aim for the easy-to-get data. Variables for which one expects high non-response rates should consequently not be included in the Module (a) questionnaire.
For Module (a) and (b), basic data analysis can be done with Excel, which suffices to calculate frequencies, per-cent distributions (proportion), means, medians and ratios. Advanced data analysis for Module (b) (regressions, difference-in-differences, matching etc.) has to be done using special statistical software packages like SPSS or STATA. These techniques can only be applied by researchers familiar with statistics and econometrics – at best documented by a list of academic publications in the fields of impact evaluation and applied econometrics.
The applied methods should be based on the established literature on impact evaluation: Ravallion (2008) provides a comprehensive overview of impact evaluation methods in development projects. Peters (2009) proposes hands-on solutions in electrification projects that are feasible even with limited research budgets. Examples of applied evaluations in development projects are numerous. There are many excellent papers in the literature but most of them have been elaborated based on surveys or data sets beyond the scope of the PUE impact M&E systems presented here. The following papers, however, are examples for methodologically proper evaluations based on limited sample sizes and can be considered as role models for methods to be applied in Module (b): Becerril and Abdulai (2010), Becchetti and Costantino (2008), Bensch, Kluve and Peters (2011), Kondo et al. (2008), Peters, Vance and Harsdorff (2011), Schmook and Vance (2009).
For Module (c), the collected qualitative information has to be analysed systematically along the lines of the guiding research questions. This includes a critical assessment of who has been referred to as information sources and how to interpret the statements of the respondents.

135
Step 5b: Reporting
The final report of a PUE impact M&E effort should contain a documentation of the important steps sketched in this guide. First, the project should be described with a focus on its theory of change (results chain), this includes activities, important steps, regional foci, objectives and intended impacts. The study and survey implementation including sampling method and sample size as well as the identification strategy have to be presented. For Module (b), the extent to which the applied methods are in line with the related literature should be documented. In particular for Module (c), the analytical approach has to be clearly delineated in order to allow for inter-subjective verifiability.
The collected data can then be used to describe the socio-economic situation in the survey (and control) region. Only variables that are not expected to be affected by the project should be included in this descrip-tion. The variables to be affected, that is, the indicators selected from the list in Aid 3. (see Step 2b), can then be presented in the results chapter. Sample selection issues or other potential caveats that might distort the accuracy of the findings should be critically discussed.
Analysing, understanding and digesting the collected information requires sufficient time, which should be granted to the researchers. This should also involve a discussion of the preliminary results with the project staff and others, e.g. the local partner institution(s). The time for data analysis and reporting can range from around 2 months in Module (a), 3 months in Module (c) to 3-6 months in Module (b). In particular, if advanced statistics and econometrics are to be employed, the data analysis and reporting cannot be done in a few weeks. Note that the effective man-days to be budgeted are less. A longer period of 6 months is recommend-able in order to allow for review and ping-ponging processes that are required to draft an understandable report on a high methodological level delivering policy-relevant results.
Step 5c: Recommendations for the Project Implementation
Among the different objectives of a PUE impact M&E system are learning effects for the project itself. Therefore, beyond the pure analysis of the data and its reporting, researchers should derive recommendations useful for the project and beyond. In the first place, of course, this concerns suggestions to improve the potentials to gen-erate positive impacts (or also to avoid negative ones). For example, the PUE impact M&E might reveal that re-gional differences in impacts exist (e.g. due to different market access or different production patterns or enter-prise types). This would lead to the recommendation to focus more on certain regions or types of firms.
A potential recommendation could as well be to modify the communication towards the public based on which impacts could be evidenced or not. For example, in one segment a PUE impact M&E could find substan-tial benefits for the target group (e.g. households that enjoy lighting) and in another segment impacts are rather thin (e.g. no substantial productive take-up of electricity). The report should formulate this explicitly and recommend calibrating the communication of impacts (e.g. ‘Do not promise substantial productive use impacts, but highlight the social impact of the project among households’).
Beyond the recommendations directly linked to impact results and potentials, other insights gained during the field work should be captured and used for developing further recommendations. The field work during impact surveys always brings the researchers extremely close to the target region and its people as well as intermediate partners such as private or community operators. Experience in many projects has shown that this close interaction often reveals weaknesses of the project implementation as well as potentials to improve it.

136
5. Aid Items
The following aids are composed of short instructions that shall give guidance for and ease implementation of PUE impact M&E activities.
Aid 1. The Results Chain Concept and Demarcation Between Outcomes and Impacts .......................................136Aid 2. Strategies to Identify the Counterfactual Situation ................................................................................................136Aid 3. List of Indicators .....................................................................................................................................................................139Aid 4. Outline of Terms of Reference for Short-Term Experts ...........................................................................................142Aid 5. Outline of Inception Report ...............................................................................................................................................143
Aid 1. The Results Chain Concept and Demarcation Between Outcomes and Impacts
The demarcation between outcomes and impacts can be visualised using the results chain concept. For a stylised illustration, the results chain of an electrification project is presented that promotes the provision of electricity by supporting the national utility to extend the electricity grid (see Figure 10). In this case it is the ambition of the programme to connect households and SMEs. Hence, the outcomes of the programme are connected households or firms. For which purposes electricity is used in connected households and firms is of course also relevant to the project but it can hardly influence the usage of electricity. The usage of electricity lies beyond the so-called attribution gap and, therefore, is an intermediate impact. Everything that happens as a result of this usage, for example an increase in productivity, constitutes an impact. Here, potentially observed changes can hardly be attributed to the programme alone but may as well be due to external factors.
Please note that the results chain presented here cannot serve as a blueprint for electrification projects. The reality of electrification projects (and development projects in general), is much more complex. Figure 10 only serves to introduce the principle of the project’s theory of change and to highlight that it has to be clear before a PUE impact M&E can be designed, which results are considered as direct ones (hence: outcomes) and indirect ones (impacts). In most cases, it requires several results chains, not just one, to visualise the different channels via which the project intends to achieve its outcomes and impacts.
Aid 2. Strategies to Identify the Counterfactual Situation
In order to determine the true effect of electrification on the chosen outcome indicators, one would have to compare the outcome variable after electrification to the counterfactual situation of not having received it. The counterfactual situation shows how the firm would perform if it had not been connected. The impossibil-ity of this is obvious, since we can never observe both situations: the firm either gets connected once the electricity service is available or not. To solve this, an identification strategy is required that allows replacing the unobservable counterfactual situation by something that is observable. This section describes briefly the different strategies that exist and that are referred to in Section 3.2. Basically, one can compare the connected firm after the project to the same firm before electrification or, alternatively, one can compare the connected firm to another, unconnected firm at the same time.
In all approaches a particularity of electrification projects has to be taken into account: customers, be they households or enterprises, decide whether or not to connect to the grid or to obtain a solar home system. In most projects, comparatively high connection fees and installation costs prevent a considerable share of households and enterprises from getting connected. For evaluation purposes, this bears the temptation of comparing the connected firms to the non-connected ones in order to determine the impact of electrifica-tion. However, this comparison is very likely to be a comparison of apples and oranges, since the firms that have decided to connect or purchase a solar system are different from those that did not resulting in a self-selection bias (see below for examples).
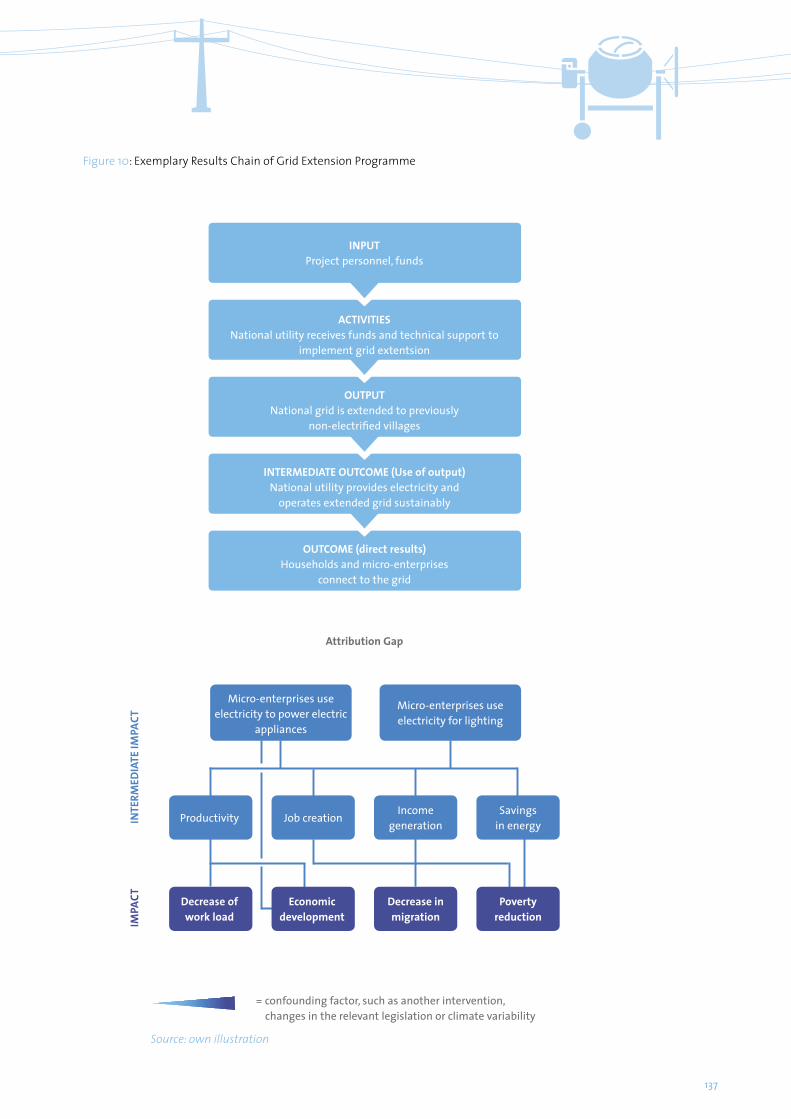
137
Figure 10: Exemplary Results Chain of Grid Extension Programme
Micro-enterprises useelectricity to power electric
appliances
Micro-enterprises use electricity for lighting
INPUTProject personnel, funds
Source: own illustration
OUTCOME (direct results)Households and micro-enterprises
connect to the grid
Attribution Gap
= confounding factor, such as another intervention, changes in the relevant legislation or climate variability
Decrease ofwork load
Productivity Job creationIncome
generationSavings
in energyINTE
RMED
IATE
IMPA
CTIM
PACT
INTERMEDIATE OUTCOME (Use of output)National utility provides electricity and
operates extended grid sustainably
OUTPUTNational grid is extended to previously
non-electrified villages
ACTIVITIESNational utility receives funds and technical support to
implement grid extentsion
Economicdevelopment
Povertyreduction
Decrease inmigration

138
1. Simple Before-After Comparison
For this approach, impact indicators are compared for the same firm before and after electrification. Any differ-ence is then attributed to the electrification intervention. The underlying assumption is that the firm before electrification is the counterfactual situation of the firm after electrification. In other words, performance of the firm would not have changed, had there been no electrification intervention. One can imagine that this does not hold true in many cases. For example, different harvest yields over time might affect the purchasing power of the firm’s customers in the region thereby affecting the firm’s performance. In addition, other external factors could change that are unobservable for the researchers. Only provided that such factors can be ruled out or somehow are taken into account, based on, for example, qualitative interviews with key informants, before-after comparison can be a valid approach. Quantifying these factors, if they exist, however, will be difficult in most cases.
An advantage of the before-after comparison is that it does not suffer from self-selection problems since only connected firms are examined.
2. Cross-Sectional Comparison
In the cross-sectional approach, connected firms are compared to non-connected firms. The difference in indicators is then considered as the impact. The basic identification assumption here is that the non-connect-ed firms behave like the connected ones would do if they had not connected to the grid. The result is the assump-tion that there are no systematic differences between those firms that get connected and those that do not.
However, this assumption is likely to be violated in an oversimplified approach: for example, one might expect that better-educated entrepreneurs are more likely to get connected. At the same time, better-educated entrepreneurs are likely to be more productive and, hence, have higher profits. As a consequence, these better-educated entrepreneurs are more likely to be connected and to exhibit better performance indicators at the same time. By simply comparing mean values in, for example, profits between connected and non-connected firms one would ascribe at least parts of the difference to the connection status that is, however, in fact induced by differences in the educational level.
Such confounding effects can be separated into observable and unobservable differences between connected and non-connected firms. The education of firm owners or employees, for example, is observable and can be accounted for by applying multivariate regression techniques. Thereby, the effect of being connected to the grid can be isolated holding other firm characteristics constant.
In contrast to the educational level, some of the differences may be hard to capture and remain unobserved. One example of a potentially unobserved difference that might violate the identification assumption is the entrepreneur’s motivation. It is hardly measurable, it potentially affects the decision to connect and might as well affect impact variables such as profits. Again, without controlling for the entrepreneur’s motivation one will ascribe parts of the difference between connected and non-connected firms to the grid connection, although the connected firm would also exhibit better performance outcomes without a connection, since it is due to the omitted variable motivation. This is commonly referred to as selection into treatment and even-tually leads to biased results.
Problems resulting from such systematic differences between firms have to be addressed both on the level of data collection and analysis. On the level of data collection, all important characteristics of firms and firm owners that potentially affect the decision to connect and the impact indicators should be included. The study team needs to assess what driving forces are behind the decision to connect. Variables that are difficult to capture with a structured questionnaire might be grasped in accompanying qualitative interviews.
On the level of data analysis, methods like matching can improve the comparability of connected and non-connected firms (PRODUSE Chapter 3, Peters, Vance and Harsdorff 2011 and Bensch, Kluve and Peters 2011). The quest for more comparable firms becomes easier, if the non-connected firms are taken from a region where electricity service is not available, i.e. that is not covered by the grid, for example (see again Peters, Vance and

139
Harsdorff 2011 and Bensch, Kluve and Peters 2011). The challenge in the implementation of such a control region approach is to find regions that are comparable to the region under evaluation. It is difficult to rule out that differences between regions that are invisible at the first (preparatory) glance are uncovered during the field work (see PRODUSE Chapter 5).
3. Before-After Comparison with Control Group
By using a control group the above-mentioned problems of simple before-after comparisons are widely elim-inated: the control group accounts for the fact that the environment of the firm under investigation is chang-ing over time, which might also influence the impact indicators. If, for example, harvest yields change and thereby the purchasing power of the local population as well, this will also affect the sales of firms in the re-gion. Simply comparing the before and after sales of a meanwhile connected firm would bias the assessed impact of electrification on sales. Including other non-connected firms from the region helps to estimate the effect of the changed harvest yields, so that this effect can be differenced out to get the net impact of electri-fication. Methodologically, this is done by comparing the change in impact indicators of connected firms to the change in impact indicators for non-connected firms. The remaining assumption that has to be formu-lated is that the environmental change, harvest yields for example, affect both connected and non-connected firms in the same way. If doubts about the validity of this assumption remain, propensity score matching can improve the comparability of control and connected firms and, hence, the validity of the assumption. As for the cross-sectional approach, the control enterprises are in the optimal case recruited from a comparable non-electrified region that remains non-electrified.
In addition, the problems arising from selection-into-treatment effects (see Section 2) are excluded as long as both unobserved characteristics affecting the decision to connect as well as the impact indicators remain constant over time.
4. Ex-Ante Impact Assessment and Ex-Post Evaluation
This approach combines the cross-sectional approach with the one of before-after comparison with a control group. At the baseline stage, a control region is selected that is already covered by the electricity service. This allows for a cross-sectional comparison of non-connected firms in the yet non-electrified project region to con-nected firms in a region that had been electrified before – be it in an earlier phase of the same electrification project or by another project (see Bensch, Kluve and Peters 2011 and Peters, Vance and Harsdorff 2011). In addition, an ex-post evaluation can be conducted using the control region (and those firms in the project region that chose not to get connected) to filter out the effects of changing external conditions (see Peters 2009).
The second, third and fourth approach presented, refer to non-experimental methods, which use statistical techniques to construct the counterfactual. Still, there is another group of impact evaluation methods known as random experiment designs, which are similar to controlled medical experiments in that they use randomi-sation to obtain the counterfactual. Since these designs are typically not applicable for productive use interven-tions, it shall only be referred to Gertler et al. (2010) and Ravallion (2008) at this point. Finally, another option (mentioned in Section 3.2) for the case in which no information has been gathered before project implementa-tion is to employ retrospective questions that try to elicit ex-post the information of interest from the inter-viewee (Bamberger 2010). These, however, have the strong disadvantage of being subject to respondent’s recall errors and should therefore be applied only in particular cases and their results should be interpreted cautiously.
Aid 3. List of Indicators
This list presents impact indicators for productive electricity use among SMEs. The observation fields of expected impacts are supplemented with indicators and sub-indicators (‘What to measure’) that represent options for possible choices to be made by the project. The following column indicates whether a specific indicator is deemed to be elicited by means of a short or a profound SME survey. Recommended indicators and sub-indicators as a minimum selection of essential impacts to be observed are highlighted in dark grey.
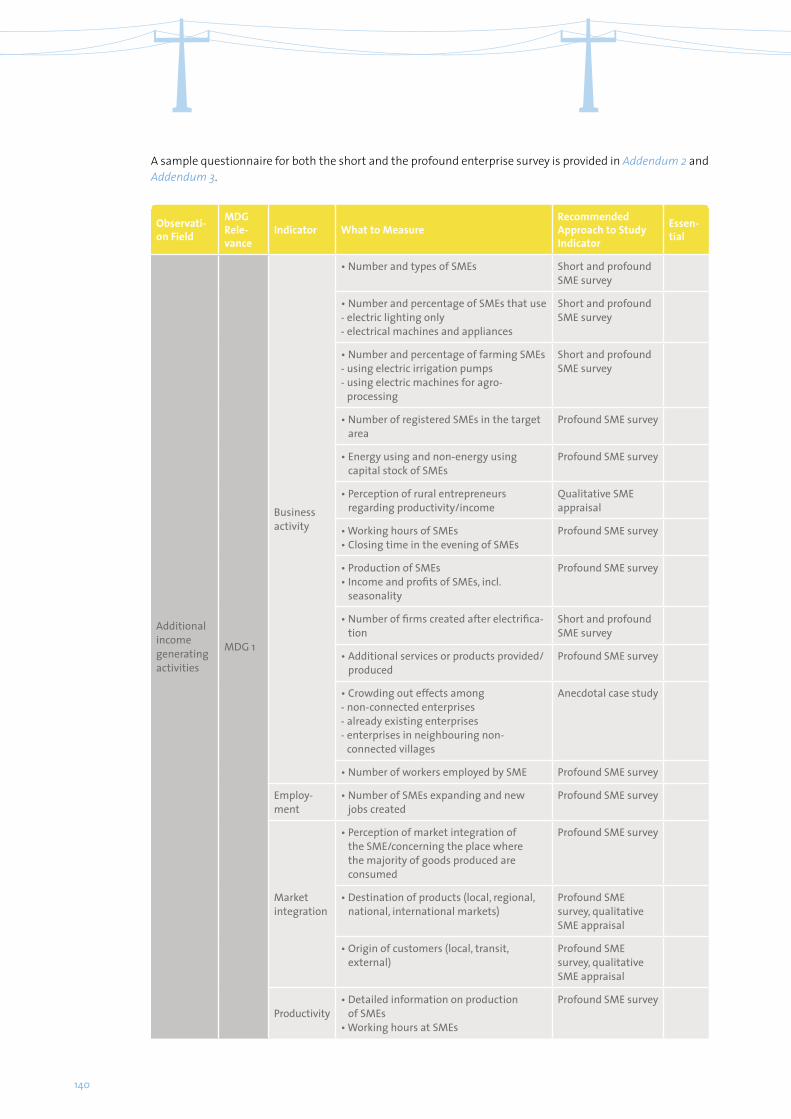
140
Observati-on Field
MDG Rele-vance
Indicator What to MeasureRecommended Approach to Study Indicator
Essen-tial
Additional income generating activities
MDG 1
Business activity
• Number and types of SMEs Short and profound SME survey
• Number and percentage of SMEs that use - electric lighting only- electrical machines and appliances
Short and profound SME survey
• Number and percentage of farming SMEs- using electric irrigation pumps- using electric machines for agro-
processing
Short and profound SME survey
• Number of registered SMEs in the target area
Profound SME survey
• Energy using and non-energy using capital stock of SMEs
Profound SME survey
• Perception of rural entrepreneurs regarding productivity/income
Qualitative SME appraisal
• Working hours of SMEs• Closing time in the evening of SMEs
Profound SME survey
• Production of SMEs• Income and profits of SMEs, incl.
seasonality
Profound SME survey
• Number of firms created after electrifica-tion
Short and profound SME survey
• Additional services or products provided/produced
Profound SME survey
• Crowding out effects among- non-connected enterprises- already existing enterprises- enterprises in neighbouring non-
connected villages
Anecdotal case study
• Number of workers employed by SME Profound SME survey
Employ-ment
• Number of SMEs expanding and new jobs created
Profound SME survey
Market integration
• Perception of market integration of the SME/concerning the place where the majority of goods produced are consumed
Profound SME survey
• Destination of products (local, regional, national, international markets)
Profound SME survey, qualitative SME appraisal
• Origin of customers (local, transit, external)
Profound SME survey, qualitative SME appraisal
Productivity • Detailed information on production
of SMEs• Working hours at SMEs
Profound SME survey
A sample questionnaire for both the short and the profound enterprise survey is provided in Addendum 2 and Addendum 3.
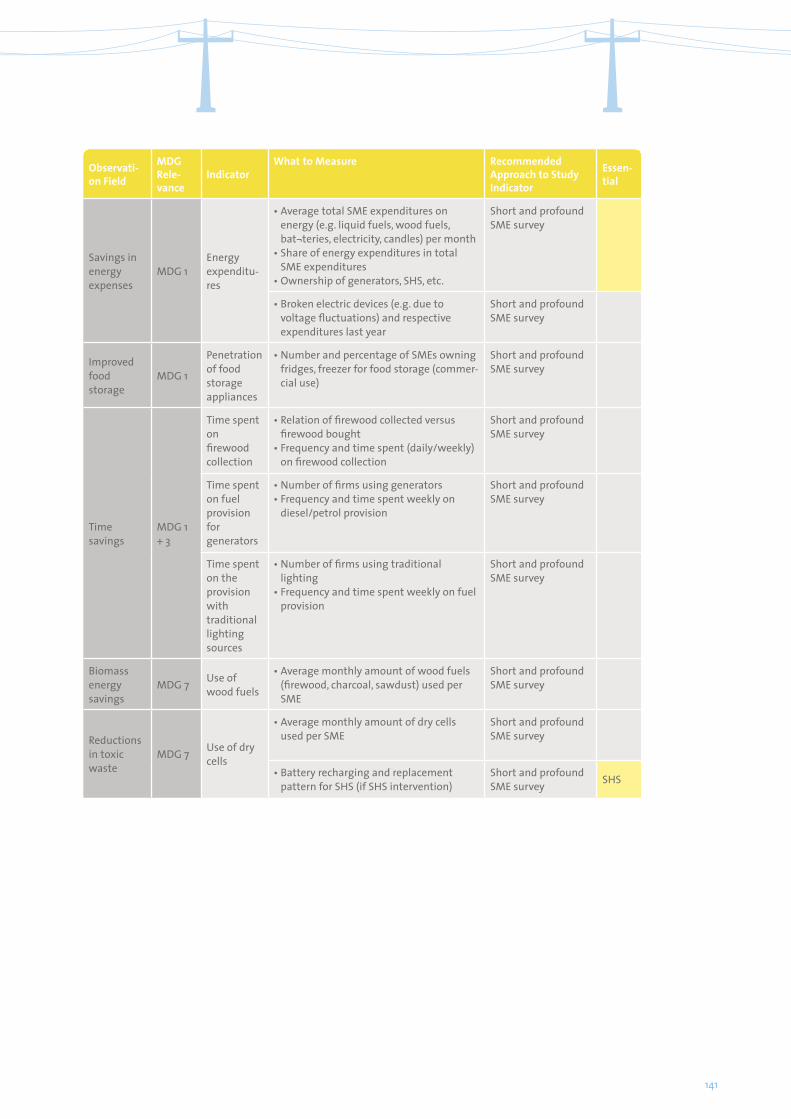
141
Observati-on Field
MDG Rele-vance
IndicatorWhat to Measure Recommended
Approach to Study Indicator
Essen-tial
Savings in energy expenses
MDG 1Energy expenditu-res
• Average total SME expenditures on energy (e.g. liquid fuels, wood fuels, bat¬teries, electricity, candles) per month
• Share of energy expenditures in total SME expenditures
• Ownership of generators, SHS, etc.
Short and profound SME survey
• Broken electric devices (e.g. due to voltage fluctuations) and respective expenditures last year
Short and profound SME survey
Improved food storage
MDG 1
Penetration of food storage appliances
• Number and percentage of SMEs owning fridges, freezer for food storage (commer-cial use)
Short and profound SME survey
Time savings
MDG 1 + 3
Time spent on firewood collection
• Relation of firewood collected versus firewood bought
• Frequency and time spent (daily/weekly) on firewood collection
Short and profound SME survey
Time spent on fuel provision for generators
• Number of firms using generators• Frequency and time spent weekly on
diesel/petrol provision
Short and profound SME survey
Time spent on the provision with traditional lighting sources
• Number of firms using traditional lighting
• Frequency and time spent weekly on fuel provision
Short and profound SME survey
Biomass energy savings
MDG 7 Use of wood fuels
• Average monthly amount of wood fuels (firewood, charcoal, sawdust) used per SME
Short and profound SME survey
Reductions in toxic waste
MDG 7 Use of dry cells
• Average monthly amount of dry cells used per SME
Short and profound SME survey
• Battery recharging and replacement pattern for SHS (if SHS intervention)
Short and profound SME survey SHS
142
Aid 4. Outline of Terms of Reference for Short-Term Experts
1. Background
In this section of the Terms of Reference (ToR) information shall be provided on the context of the evaluation, for example if the evaluation is embedded in an overarching monitoring and/or evaluation process. The relevance of the evaluation shall be outlined briefly. It shall furthermore be explained why the evaluation takes places at the projected point of time.
2. Object of the Evaluation
This section shall contain details on the project or programme that is going to be evaluated. These details com-prise basic information such as the name, project/programme period and geographic intervention zone same as description of the concrete activities of the intervention and the rationale behind them.
3. Objective of the evaluation
In this section of the ToR, the specific objectives of the evaluation have to be listed and – if deemed appropriate – shortly explained. These objectives may, for example: (i) serve as a data basis for monitoring activities, (ii) assess the impacts of the electrification intervention on an empirically sound basis or – more specifically – (iii) deter-mine the (net) employment and income effects of the SME electrification intervention or (iv) develop recommen-dations concerning potential complementary activities. If the study is a baseline, the objectives may rather be to (v) provide benchmark data for a potential ex-post impact evaluation, (vi) portray the local economic conditions in the project areas or (vii) reduce uncertainty about demand assumptions in the target region.
It is furthermore helpful to set up a list of questions in this section that the evaluation design is meant to help answering (e.g. which of the observed changes can be causally attributed to the SME electrification and which can only be plausibly attributed to it?).
4. Methods
The applied methods (including identification strategy and sample size) and its application to the concrete set-ting – shall be outlined in this section.
5. Implementation
The responsibilities of the different persons and organisations involved in the evaluation shall be defined here. This entails as well the definition of tasks to be executed by the evaluator. An indicative list of tasks is presented below:
a. Preparation of the Study
1. Desk study of relevant project documents 2. Preparation of an Inception Report (see Aid 5) 3. Recruitment of field work personnel 4. Design of a questionnaire based on sample questionnaires (Addendum 2 and Addendum 3) 5. Establishment of a data entry document/programme 6. Field trips to survey/project sites

143
7. Exploration and selection of control sites 8. First review of questionnaire 9. Planning organisation of the survey and logistics with the assistance of field work personnel 10. Training course for the survey team (supervisor and enumerators) concerning survey objective, design and execution as well as data compilation 11. Pre-test at one of the project sites 12. Final revision of questionnaire 13. Review of organisation and logistics for the survey logistics with the assistance field work personnel
b. Realisation of the Survey
15. Provision of organisational and methodological backstopping to the field work personnel 16. Adaptations of the intended survey methodology (sample size, target villages/ regions/ SMEs,
questionnaire, etc.), if needed
c. Compilation, Interpretation, Reporting and Presentation of Results
17. Preparation of a presentation of preliminary results 18. Analysis and interpretation of survey results 19. Compilation of a report of about xx pages 20. Revision of draft version in cooperation with project management staff members 21. Knowledge management: short paper (in note form) on practical experience made,
(methodological) lessons learned and recommendations
6. Timeline
Along the different tasks and task sets, a timeline for the whole survey process is to be established.
Aid 5. Outline of Inception Report
If consultants are engaged to design an impact M&E system or to conduct baseline or impact studies, they should be required to submit an inception report. The inception report has to be submitted by those who will implement the PUE Impact M&E. In particular, if external researchers are hired it is imperative. The purpose of the inception report is to familiarise those responsible for the PUE Impact M&E with the proposed methodo-logical approach at the outset of the research effort.
1. Project to Be Evaluated and Conditions
1.1. Basic Information on the Electrification ProjectBy means of the results chain the intervention shall be presented from the specific inputs up to the intended impacts. The overall objective of the project/programme shall as well be mentioned and put into relation to the results chain. It shall further be made clear since when the activities are being implemented (potentially address-ing different project/programme phases) and since when outcomes (and impacts) are expected to have started to materialise.

144
1.2. General Conditions and ContextSector and area specific conditions that are either favourable or affect adversely project implementation and the achievement of impacts are to be specified here. This includes particularly other donors’ activities in the interven-tion area(s).
2. Methodology
2.1. Methodological specifications of the PUE Impact M&E moduleIt should be explained briefly why which module(s) has or have been chosen. In this section, it shall only be briefly referred to the module characteristics, (i.) identification strategy, (ii.) sampling method and (iii.) covered indicators that have been chosen for the project under examination.
2.2. Methodological modifications of the PUE Impact M&E moduleIn case adaptations to the module characteristics mentioned in 2.1 are deemed necessary by the implementer of the M&E activity, these shall be presented and explained here.
3. Implementation
This chapter shall include a table depicting the concrete sample size – if possible, specifying the number of differ-ent types of SMEs to be interviewed. The data collection and data analysis process shall be outlined supplemented by a time schedule defining what (task) is going to be done by whom (persons involved) with what (resources) by when (date).

145
Addenda
Addendum 1. Selected other M&E Guides and Literature
The ‘Guide to Monitoring and Evaluation for Energy Projects’ prepared by the international working group of M&EED (Monitoring and Evaluation in Energy for Development) in 2006 proposes a step by step approach to building project-specific monitoring and evaluation procedures for energy access projects while being more concerned with monitoring:www.hedon.info/docs/MandEEDGuideFinalVersionEnglish.pdf
An extensive guide on ‘Monitoring and Evaluation in Rural Electrification Projects: A Demand-Oriented Ap-proach’ has been compiled by the Energy Sector Management Assistance Program (ESMAP) in 2003. This ap-proach intended to be both poverty and gender sensitive blends qualitative and quantitative techniques of participatory assessments and socio-economic impact surveys.http://go.worldbank.org/JN30SKKFR0
Within the series ‘Directions in Development’ the World Bank published in 2000 a ‘Handbook for Practitioners’ on ‘Evaluating the Impact of Development Projects on Poverty.’ It is a comprehensive guide both delivering the methodological evaluation background and guidance on good evaluation practise.http://go.worldbank.org/8E2ZTGBOI0
The publication by the Network of Networks on Impact Evaluation ‘Impact Evaluations and Development: NONIE Guidance on Impact Evaluation’ (2009) contains an introduction into the theory and practice of rigor-ous impact evaluation. The first block is on methodological and conceptual issues while the second deals with managing impact evaluation and addresses aspects of evaluability, benefits and costs and planning.http://www.worldbank.org/ieg/nonie/guidance.html
The book ‘Impact Evaluation in Practice’ published in 2010 is a comprehensive non-technical introduction to the topic of impact evaluation and its practice in development. The material ranges from motivating impact evaluation, to the advantages of different methodologies, to power calculations and costs. The book is geared specifically towards development practitioners and policymakers designing prospective impact evaluations.www.worldbank.org/ieinpractice
Addendum 2. Sample Questionnaire, short enterprise surveywww.produse.org/m&e_guide_addendum2
Addendum 3. Sample Questionnaire, profound enterprise surveywww.produse.org/m&e_guide_addendum3
Addendum 4. PRODUSE Guidelines for Qualitative Interviewswww.produse.org/m&e_guide_addendum4
Addendum 5. Sample Data Entry Sheet, short enterprise surveywww.produse.org/m&e_guide_addendum5
Disclaimer
Following these links means leaving this guide and entering an external web link. The links provide additional information that may be useful or interesting and is being provided consistent with the intended purpose of this guide. However, we cannot attest to the accuracy of information provided by this link or any other linked site. Providing links to an external web site does not constitute an endorsement by the authors of this guide of the sponsors of the site or the information or products presented on the site.

146
References
Abila, R. et al. (2003): Distribution of economic benefits from the fisheries of Lake Victoria. Retrieve from: https://iodeweb1.vliz.be/odin/bitstream/1834/2128/1/WLCK-87-92.pdf
ADB - African Development Bank (2006): Impact Evaluation. Methodological and Operational Issues. Manila, Philippines.
ADB - Asian Development Bank (2005): Assessing the Impact of Transport and Energy Infrastructure on Poverty Reduction. Manila.
ADB – Asian Development Bank (2010): Asian Development Bank's Assistance for Rural Electrification in Bhutan—Does Electrification Improve the Quality of Rural Life? Manila.
Alderdice, A. and Rogers, J. (2000): Renewable Energy for Microenterprise. National Renewable Energy Labora-tory. Golden/Colorado. Retrieved from: http://www.nrel.gov/docs/fy01osti/26188.pdf
AMFIU – Association of Microfinance Institutions of Uganda (2007): Microfinance Directory – Volume 3 - 2007. Association of Microfinance Institutions of Uganda.
Angrist, J.D. and Krueger, A.B. (1999): Empirical Strategies in Labor Economics. Handbook of Labor Economics, Vol. 3.
Angrist, J. D. and Krueger, A. B. (2001): Instrumental Variables and the Search for Identification: From Supply and Demand to Natural Experiments. The Journal of Economic Perspectives 15(4): 69-85.
Arnold, J.M. and Mattoo, A. and Narciso, G. (2008): Services Inputs and Firm Productivity in Sub-Saharan Africa: Evidence from Firm-Level Data. Journal of African Economies Vo. 17 (4), pp. 578-599.
Aschauer, D. A. (1989): Is Public Expenditure Productive? Journal of Monetary Economics, 23(2), pp. 177–200.
Ayogu, M. (1999): Before Prebendalism: A Positive Analysis of Core Infrastructure Investment in a Developing Fiscal Federalism. African Development Review 11 (2): 169–98.
Ayogu, M. (2007): Infrastructure and Economic Development in Africa: A Review. Journal of African Econo-mies, 16, AERC Supplement 1, pp. 75–126.
Balisacan, A. M. (2001): Pathways of Poverty Reduction: Rural Development and Transmissions Mechanisms in the Philippines. Paper presented at the Asia and Pacific Forum on Poverty: Reforming Policies and Institutions for Policy Reductions. Manila, 5-9 February.
Bamberger, M. (2010): Reconstructing Baseline Data for Impact Evaluation and Results Measurement. PREM notes, Special Series on Nuts and Bolts of M&E Systems, No. 4. World Bank.
Barnes, D.F. and Binswanger, H.P. (1986): Impact of Rural Electrification and Infrastructure on Agricultural Changes, 1960-1980.
Barnes, D.F. and Fitzgerald, K.B. and Peskin, H.M. (2002): The Benefits of Rural Electrification in India: Implica-tions for Education, Household Lighting and Irrigation. Background Study for India Rural Energy Access Strategy, SASEI, World Bank, Washington D.C. cited in: World Bank (2004). Rural Access to Electricity: Strategy Options for India. Discussion Paper, South Asia Energy and Infrastructure Unit. World Bank. Washington D.C.

147
Becchetti, L. and Costantino, M. (2008): The Effects of Fair Trade on Affiliated Producers: An Impact Analysis on Kenyan Farmers. World Development 36 (5): 823-842.
Becerril, J. and Abdulai, A. (2010): The Impact of Improved Maize Varities on Poverty in Mexico: A Propensity Score-Matching Approach. World Development, Vol. 38 (7), pp. 1024-1035.
Bensch, G. and Kluve, J. and J. Peters (2011): Impacts of rural Electrification in Rwanda. Journal of Development Effectiveness 3 (4): 567-588.
Bensch, G. and Peters, J. and Schraml, L. (2010): Energy Usage and Socio-economic Conditions in Mozambique. RWI Materialien 56.
Bensch, G. und Peers, J. (2010): Socio-Economic Impacts of Rural Electrification in Rwanda – An Ex-ante Assessment of GTZ Activities. RWI Materialien 60.
Bernard, T. and Torero, M. and Teffera, A. (2009), Welfare impact of Rural Electrification, “Short term” evidence from Ethiopia: A Report for the Ethiopian Electric Power Corporation and the World Bank, International Food Policy Institute.
Blalock, G. and Veloso, F.M. (2007): Imports, Productivity Growth, and Supply Chain Learning. World Develop-ment Vol. 35 (7), pp. 1134-1151.
Cabraal, A. and Barnes, D.F. and Agarwal, S. (2005): Productive Uses of Energy for Rural Development. Annual Review of Environment and Resources, 30, pp. 117–144.
Calderón, C. (2008): Infrastructure and Growth in Africa. Working Paper 3, Africa Infrastructure Country Diagnostic, World Bank. Washington, D.C.
Calderón, C. and Servén, L. (2008): Infrastructure and Economic Development in Sub- Saharan Africa. Policy Research Working Paper 4712, World Bank. Washington, D.C.
Calderón, J. (2005): Social Impact Evaluation Project: Fund for the Promotion of Micro-Hydro Power Stations (MHSP). Intermediate Technology Development Group ITDG. Lima, Peru.
Caliendo, M. and Kopeinig, S. (2008): Some Practical Guidance for the Implementation of Propensity Score Matching. Journal of Economic Surveys, Vol. 22 (1), pp. 31-72.
Canning, D. and Pedroni, P. (2004): The Effect of Infrastructure on Long Run Economic Growth. Department of Economics Working Paper 2004-04, Williams College.
Chong, A. and Hentschel, J. and Saavedra, J. (2003): Bundling Services and Household Welfare in Developing Countries: The Case of Peru. World Bank Policy Research Working Paper No. 3310.
CIA (2008): The World Factbook. Central Intelligence Agency. Retrieve from: https://www.cia.gov/library/publications/the-world-factbook/
Cuong, N.V. (2008): Is a Governmental Micro-Credit Program for the Poor Really Pro-Poor? Evidence from Vietnam. The Developing Economies, Vol. 46 (2), pp. 151-187.
Daniels, L. and Mead, D. (1998): The Contribution of Small Enterprises to Household and National Income in Kenya. Economic Development and Cultural Change, Vol. 47, pp. 45–71.

148
De Mel, S. and McKenzie, D.J. and Woodruff, C. (2009): Measuring Microenterprise Profits: Must We Ask How the Sausage is Made? Journal of Development Economics, Vol. 88 (1), pp. 19-31.
Dee, T. (2004): Are There Civic Returns to Education? Journal of Public Economics 88(9): 1697-1720.
Dehejia, R.H. and Wahba, S. (2002): Propensity Score-Matching Methods For Nonexperimental Causal Studies, The Review of Economics and Statistics Vol. 84 (1), pp. 151-161.
DFID - Department for International Development (2002): Energy for the Poor: Underpinning the Millennium Development Goals. London: Crown.
Dinkelman, T. (2008): The Effects of Rural Electrification on Employment: New Evidence from South Africa. Mimeo, University of Michigan.
Easterly, W. and Levine, R. (1997): Africa’s Growth Tragedy: Policies and Ethnic Divisions. Quarterly Journal of Economics 112 (4): 1203–50.
Eberhard, A. and Van Horen, C. (1995): Poverty and Power: Energy and the South African State. London: UCT and Pluto.
Edquist, H. and Henrekson, M. (2006): Technological Breakthroughs and Productivity Growth. Research Institute of Industrial Economics, IFN Working Paper No. 665.
Eifert, B. and Gelb, A. and Ramachandran, V. (2008): The Cost of Doing Business in Africa: Evidence from Enterprise Survey Data. In: World Development, Vol. 36, No. 9, pp. 1531-1546.
EnPoGen (2003a): Energy, Poverty and Gender: Impacts of Rural Electrification on Poverty and Gender in Indonesia. World Bank, Washington D.C.
EnPoGen (2003b): Energy, Poverty and Gender: Impacts of Rural Electrification on Poverty and Gender in Sri Lanka. World Bank, Washington D.C.
Escobal, J. (2005): The Role of Public Infrastructure in Market Development in Rural Peru. MPRA Paper No. 727.
Escribano, A. and Guasch, J.L. and Pena, J. (2009): Impact of Infrastructure Constraints on Firm Productivity in Africa. Working Paper 9, Africa Infrastructure Sector Diagnostic, World Bank. Washington, D.C.
ESD Africa – Extending Service Delivery Project Africa (2006): A Study of Productive Uses of PV Electricity in Rural Areas of Kenya: Final Report. Submitted to World Bank Energy Group, Africa Region.
Esfahani, H. S. and Ramirez, M.T. (2003): Institutions, Infrastructure, and Economic Growth. Journal of Development Economics 70: 443–77.
ESMAP - Energy Sector Management Assistance Program (2002): Rural Electrification and Development in the Philippines: Measuring the Social and Economic Benefits. Washington D.C.
ESMAP – Energy Sector Management Assistances Program (2003a): Rural Electrification and Development in the Philippines: Measuring the Social and Economic Benefits. ESMAP Report 255/02, Washington D.C.
ESMAP – Energy Sector Management Assistances Program (2003b): Monitoring and Evaluation in Rural Electrification Projects: A Demand-Oriented Approach, Washington D.C.
ESMAP - Energy Sector Management Assistance Program (2005): Study to promote productive uses of electricity in rural electrification projects in Tanzania. DataVision International Ltd.

149
Estache, A. (2010): A Survey of Impact Evaluations of Infrastructure Projects, Programs and Policies. ECARES working paper 2010-005. Université Libre de Bruxelles. Brussels.
EUEI PDF/GIZ (2011): Productive Use of Energy (PRODUSE) – A Manual for Electrification Practitioners. Eschborn.
Fan, S. and Chan-Kang, C. (2005): Road Development, Economic Growth, and Poverty Reduction in China. International Food Policy Research Institute Research Report 138.
Fan, S. and Hazell, P. and Thorat, S. (2000): Government Spending, Growth, and Poverty in Rural India. American Journal of Agricultural Economics 82 (4): 1038–1051.
Fan, S. and Jitsuchon, S. and Methakunnavut, N. (2004): The Importance of Public Investment for Reducing Rural Poverty in Middle-Income Countries: The Case of Thailand. International Food Policy Research Institute DSGD Discussion Paper 7.
Fan, S. and Nyange, D. and Rao, N. (2005): Public Investment and Poverty Reduction in Tanzania: Evidence from Household Survey Data. International Food Policy Research Institute DSGD Discussion Paper 18.
Fan, S. and Zhang, L. and Zhang, X. (2002): Growth, Inequality, and Poverty in Rural China: The Role of Public Investment. Research Report 125. International Food Policy Research Institute. Washington D.C.
Fedderke, J. and Bogetic, Z. (2006): Infrastructure and Growth in South Africa: Direct and Indirect Productivity Impacts of Nineteen Infrastructure Measures. World Bank Policy Research Working Paper, Washington D.C.
Fernandes, A. M. (2008): Firm Productivity in Bangladesh Manufacturing Industries. World Development, Vol. 36, Issue 10, p. 1725-1744.
FIRRI - Fisheries Resources Research Institute (2004): Annual Report 2003/2004. National Agricultural Research Organization. Retrieved from:http://www.firi.go.ug/publications_annual_report.htm
Fishbein, R. E. (2003): Survey of Productive Uses of Electricity in Rural Areas. Washington, D.C., Africa Energy Unit, World Bank.
Foster, V. and Briceno-Garmendia, C. (eds.) (2010): Africa’s Infrastructure: A Time for Transformation. Africa Infrastructure Country Diagnostic, Agence Française de Développement/World Bank. Retrieved from: http://www.infrastructureafrica.org/aicd/library/doc/552/africa%E2%80%99s-infrastructure-time-transformation
Foster, V. and Steinbuks, J. (2009): Paying the Price for Unreliable Power Supplies: In-House Generation of Electricity by Firms in Africa. Policy Research Working Paper 4913, World Bank. Washington, D.C.
Fouquet, R. and Pearson, P.J.G. (2006): Seven Centuries of Energy Services: The Price and Use of Light in the United Kingdom (1300-2000). The Energy Journal, 27 (1), 139-177.
Frondel, M. and Schmidt, C. M. (2005), Evaluating Environmental Programs: The Perspective of Modern Evaluation Research. Ecological Economics, Vol. 55 (4), pp. 515-526.
Gertler, P. J. and Martinez, J. and Premand, P. and Rawlings, L.B. and Vermeersch, C. M. J. (2010): Impact Evaluation in Practice. World Bank Publications. Washington, D.C., United States.
Ghosh, S. (2009): Electricity Supply, Employment and Real GDP in India: Evidence From Cointegration and Granger-Causality Tests. Energy Policy 37(8), pp. 2926–2929.

150
Goedhuys, M. and Sleuwaegen, L. (2010): High-Growth Entrepreneurial Firms in Africa: A Quantile Regression Approach. Small Business Economics Vol. 34, pp. 31-51.
Gramlich, E. M. (1994): Infrastructure Investment: A Review Essay. Journal of Economic Literature, 32 (3), pp. 1176-1196.
Grimm, M. and Hartwig, R. and Lay, J. (2011): How Much Does Utility Access Matter for the Performance of Micro and Small Enterprises? Retrieved from: http://www.iss.nl/fileadmin/ASSETS/iss/Documents/Research_and_projects/Unlocking_potential_Utility_Access.pdf.
Grogan, L. (2008): Community Electrification and Labour Market Development. Working paper, Department of Economics, University of Guelph.
Grogan, L. and Sadanand, A. (2009): Electrification and the Household. Paper presented at the 5th Annual Conference on Economic Growth and Development, December 16-18, 2009, Indian Statistical Institute. New Delhi.
GTZ - Deutsche Gesellschaft für Technische Zusammenarbeit (2009): Impact Assessment of the Solar Electrification of Micro Enterprises, Households and the Development of the Rural Solar Market. Authors: Harsdorff, M. and Bamanyaki, P. Kampala.
GTZ – Deutsche Gesellschaft für Technische Zusammenarbeit (2007): Impact Monitoring Guide. Salvador.
Harding, D.J. (2003): Counterfactual Models of Neighborhood Effects: The Effect of Neighborhood Poverty on Dropping Out and Teenage Pregnancy. American Journal of Sociology Vol. 109 (3), pp. 676–719.
Harsdorff, M. und Peters, J. (2010): On-Grid Rural Electrification in Benin - A Socio-economic Baseline Study on a GTZ Project. RWI Materialien 57.
Hill, H. and Kalirajan, K.P. (1993): Small Enterprise and Firm-Level Technical Efficiency in the Indonesian Garment Industry. Applied Economics Vol. 25, pp. 1137-1144.
Iarossi, G. (2007): The Power of Survey Design. A User’s Guide for Managing Surveys, Interpreting Results, and Influencing Respondents. World Bank.
IEA – International Energy Agency (2012): World Energy Outlook 2012. Paris.
IEG - Independent Evaluation Group (2008): The Welfare Impact of Rural Electrification: A reassessment of the costs and benefits. An IEG Impact Evaluation, World Bank. Washington, D.C.
Jacobson, A. (2007): Connective power: Solar Electrification and Social Change in Kenya. World Development, 35(1), pp. 144–162.
Jimenez, A. and Olson, K. (1998): Renewable Energy for Rural Health Clinics. Golden, CO: National Renewable Energy Laboratory. Retrieved from: http://www.nrel.gov/docs/legosti/fy98/25233.pdf.
Karanfil, F. (2009): How Many Times Again Will We Examine the Energy–Income Nexus Using a Limited Range of Traditional Econometric Tools? Energy Policy 36, 1191–1194.
Khandker, S. R. and Barnes, D. F. and Samad, H. A and Minh, N. H. (2009a): Welfare Impacts of Rural Electrification: Evidence from Vietnam. World Bank, Policy Research Working Paper 5057.

151
Khandker, S. R. and Barnes, D. F. and Samad, H. A. (2009b): Welfare Impacts of Rural Electrification: A Case Study from Bangladesh. World Bank, Policy Research Working Paper 4859.
King, G. and Honaker, J. and Joseph, A. and Scheve, K. (2001): Analyzing Incomplete Political Science Data: An Alternative Algorithm for Multiple Imputation. American Political Science Review, Vol. 95 (1): 49-69.
Kirubi, C. and Jacobson, A. and Kammen, D. M. and Mills, A. (2009): Community-Based Electric Micro-Grids Can Contribute to Rural Development: Evidence from Kenya. World Development, 73, pp. 1208–1221.
Kondo, T. and Orbeta, A. and Dingcong, C. and Infantado, C. (2008): Impact of Microfinance on Rural Households in the Philippines. Network of Networks on Impact Evaluation (NONIE) Working Paper No. 4.
Kooijman-van Dijk, A. (2008): The Power to Produce - The Role of Energy in Poverty Reduction Through Small Scale Enterprises in the Indian Himalayas. University of Twente. Enschede, Netherlands.
Kooijman-van Dijk, A. (2012): The Role of Energy in Creating Opportunities for Income Generation in the Indian Himalayas. Energy Policy, Vol. 41, pp. 529-536.
Lassen, D. (2005): The Effect of Information on Voter Turnout: Evidence from a Natural Experiment. American Journal of Political Science 49(1): 103-18.
Liedholm, C. and Mead, D. (1999): Small Enterprises And Economic Development - The Dynamics Of Micro And Small Enterprises. Taylor & Francis Ltd.
Little, I.M.D. (1987): Small Manufacturing Enterprises in Developing Countries. The World Bank Economic Review Vol. 1 (2), pp. 203-235.
M&EED Group (2006): A Guide to Monitoring and Evaluation for Energy Projects. Monitoring and Evaluation in Energy for Development International working group. Retrieve from:http://www.gvepinternational.org/sites/default/files/resources/MEED_Guide_final_version_english.pdf
MacKernan, S. M. (2002): The Impact of Microcredit Programs on Self-Employment Profits: Do Noncredit Program Aspects Matter? Review of Economics and Statistics, Vol. 84 (1), pp. 93-115.
Magnani, R. (1997): Sampling Guide. Food and Nutrition Technical Assistance Project (FANTA). Washington, D.C.
Martinot, E. and Chaurey, A. and Lew, D. and Moreira, J. R. and Wamukonya, N. (2002): Renewable Energy Markets in Developing Countries. Annual Review of Energy and the Environment, 27, pp. 309–348.
Meadows, K. and Riley, C. and Rao, G. and Harris, P. (2003): Modern Energy: Impacts on Micro- enterprises - A Literature Review into the Linkages Between Modern Energy and Micro-Enterprise. UK Department for International Development.
Miguel, E. and Satyanath, S. and Sergenti, E. (2004): Economic Shocks and Civil Conflict: An Instrumental Variables Approach. Journal of Political Economy 112(4): 725-53.
Milligan, K. and Moretti, E. N. and Oreopoulos, P. (2004): Does Education Improve Citizenship? Evidence from the U.S. and the U.K. Journal of Public Economics. 88(9-10): 1667-1695.
Morduch (1999): The Microfinance Promise. Journal of Economic Literature, Vol. 37 (4), pp. 1569-1614.

152
Motta, M. and Reiche, K. (2001): Rural Electrification, Micro-finance and Micro and Small Business (MSB) Development: Lessons for the Nicaragua Off-grid Rural Electrification Project, World Bank. Washington, D.C.
Neelsen, S. and Peters, J. (2011): The INGENS Uganda Case Study: Electricity Usage in Micro-Enterprises – Evidence from Lake Victoria, Uganda. Report for GTZ. Essen.
Noumba Um, P. and Straub, S. and Vellutini, C. (2009): Infrastructure and Economic Growth in the Middle East and North Africa. Policy Research Working Paper 5105, World Bank. Washington, D.C.
NRECA International (2011): Uganda Accelerated Rural Electrification Project (UAREP) Report, Draft dated April 27, 2011.
O’Sullivan, K. and Barnes, D.F. (2007): Energy Policies and Multitopic Household Surveys. Guidelines for Questionnaire Design in Living Standards Measurement Studies. World Bank Working Paper No. 90. Washington D.C.
OECD – Organisation for Economic Co-operation and Development (2009): Glossary of Key Terms in Evaluation and Results Based Management. Paris.
Peters, J. (2009): Evaluating Rural Electrification Projects: Methodological Approaches. Well-Being and Social Policy 5 (2): 25-40.
Peters, J. and Harsdorff, M. and Ziegler, F. (2009): Rural Electrification: Accelerating Impacts with Complementary Services. Energy for Sustainable Development, Vol. 13, p. 37-41.
Peters, J. and Vance, C. and Harsdorff, M. (2011): Grid Extension in Rural Benin – Micro-manufacturers in the Electrification Trap. World Development, Vol. 39 (5), pp. 773-783.
Pinstrup-Andersen, P. and Shimokawa, S. (2007): Rural Infrastructure and Agricultural Development. In: F. Bourguignon and B. Pleskovic ‘Rethinking Infrastructure for Development’, Annual World Bank Conference On Development Economics (ABCDE), Tokyo, pp. 175.
Practical Action (2012): Poor People’s Energy Outlook 2012 – Energy for Earning a Living. Retrieved from: http://practicalaction.org/ppeo2012
Prasad, G. and Dieden, S. (2007): Does Access to Electricity Enable the Uptake of Small and Medium Enterprises in South Africa? Paper presented at the Domestic Use of Energy Conference 2007.
Ravallion, M. (2008): Evaluating Anti-Poverty Programs. Handbook of Development Economics, 4. Amsterdam.
Ravallion, M. (2008): Evaluating Anti-Poverty Programs. In: Schultz, P. and Strauss, J. (eds.): Handbook of Development Economics, Volume 4, Amsterdam.
Ravallion, M. (2009): Evaluation in the Practice of Development. The World Bank Research Observer, Vol. 24 (1), pp. 29-53.
Ravallion, M. and Chen, S. (2005): Hidden Impact? Household Saving in Response to a Poor-Area Development Project. Journal of Public Economics, Vol. 89, pp. 2183-2204.
Ravallion, M. and Wodon, Q. (1998): Evaluating a Targeted Social Program When Placement is Decentralised, Policy Research Working Paper 1945, World Bank, Washington D.C.

153
Reinikka, R. and Svensson, J. (1999a): Confronting Competition: Firms’ Investment Response and Constraints in Uganda. In Assessing an African Success: Farms, Firms, and Government in Uganda’s Recovery, ed. Paul Collier and Ritva Reinikka. World Bank. Washington, D.C.
Reinikka, R. and Svensson, J. (1999b): How Inadequate Provision of Public Infrastructure and Services Affects Private Investment. Policy Research Working Paper 2262, World Bank. Washington, D.C.
Rosenbaum, Paul R. (1984): The Consequences of Adjustment for a Concomitant Covariate that has been affected by the Treatment. Journal of the Royal Statistical Society (Ser. A), Vol. 147, pp. 656–66.
Sari, R. and Soytas, U. (2007): The Growth of Income and Energy Consumption in Six Developing Countries. Energy Policy35, 889–898.
SE4All – Sustainable Energy for All (2013): Global Tracking Framework - Overview.
Schmidt, C. M. and Augurzky, B. (2001): The Propensity Score: A Means to An End. IZA Discussion Paper Series, 271.
Steel, W. (2008): Income Generation Through Energy and Complementary Services (INGENS). Survey of Micro and Small Enterprises in the Brong Ahafo Region of Ghana. Report to GIZ. Complete Draft. Mimeo.
Straub, S. (2008a): Infrastructure and Growth in Developing Countries: Recent Advances and Research Challenges. World Bank Policy Research Working Paper No. 4460.
Straub, S. (2008b): Infrastructure and Development: A Critical Appraisal of the Macro Level Literature. World Bank Policy Research Working Paper No. 4590.
Straub, S. and Vellutini, C. and Warlters, M. (2008): Infrastructure and Economic Growth in East Asia. Policy Research Working Paper 4589, World Bank. Washington, D.C.
UN – United Nations (2005): The Energy Challenge for Achieving the Millennium Development Goals. New York.
UN – United Nations (2010): Energy for a Sustainable Future. The Secretary General’s Advisory Group on Energy and Climate Change. New York.
UN – United Nations (2013): A New Global Partnership - Eradicate Poverty and Transform Economies through Sustainable Development. The Report of the High-Level Panel of Eminent Persons on the Post-2015 Develop-ment Agenda, New York.
UN-Energy – United Nations-Energy (2005): The Energy Challenge for Achieving the Millennium Develop-ment Goals. Brochure: United Nations.
UNDP – United Nations Development Programme (2010): The Real Wealth of Nations: Pathways to Human Development, Human Development Report 2010. New York.
UNDP - United Nations Development Programme (2011): Decentralized Energy Access and the Millenium Development Goals: An Assessment of the Development Benefits of Micro Hydropower in Rural Nepal. New York.
UNDP - United Nations Development Programme/WHO – World Health Organization (2009): The Energy Access Situation in Developing Countries. A Review Focusing on the Least Developed Countries and Sub-Sahara Africa. New York.

154
UNDP – United Nations Development Programme (2010): Human Development Report 2010. The Real Wealth of Nations – Pathways to Human Development.
UNDP/WHO – United Nations Development Programme/World Health Organization (2009): The Energy Access Situation in Developing Countries – A Review Focused on the Least Developed Countries and Sub-Saharan Africa. United Nations Development Programme and World Health Organization.
UNEP - United Nations Environment Programme (1999): Environmental Impacts of Trade Liberalization and Policies for the Sustainable Management of Natural Resources: A Case Study on Uganda’s Fisheries Sector. United Nations Environment Programme.
UN SDSN – United Nations Sustainable Development Solutions Network (2013): An Action Agenda for Sustainable Development. Report for the UN Secretary-General. Paris/New York.
Warwick, D. P. and Lininger, C. A. (1975): The Sample Survey: Theory and Practice. New York.
White, H. (2002): Combining Quantitative and Qualitative Approaches in Poverty Analysis. World Development 30 (3): 511-522.
White, R. D. (2002): GEF/FAO Workshop on Productive Uses of Renewable Energy: Experience, Strategies, and Project Development. FAO Headquarters. Rome, Italy, June 18-20, 2002.
Wolde-Rufael, Y. (2009): Energy Consumption and Economic Growth: The Experience of African Countries Revisited. Energy Economics, Volume 31, Issue 2, pp. 217-224.
World Bank (1995): Rural Electrification: a Hard Look at Costs and Benefits. Oper. Eval. Dep. Précis No. 90. Washington D.C.
World Bank (1996): Rural Energy and Development: Improving Energy Supplies for 2 Billion People. Washington D.C.
World Bank (2006): Energy for Development in Rural Bangladesh. Unpublished Manuscript, Washington D.C.
World Bank (2010): Getting Electricity - A Pilot Indicator Set from the Doing Business Project. Washington D.C.