polykystose renale autosomique dominante : … .pdf · introduction ! pkad : ! maladie rénale...
TRANSCRIPT
POLYKYSTOSE RENALE AUTOSOMIQUE DOMINANTE : ACTUALITES THERAPEUTIQUES
Isabelle SEGALEN Service de Néphrologie
CHRU BREST
CUEN des CCA Mars 2013
INTRODUCTION
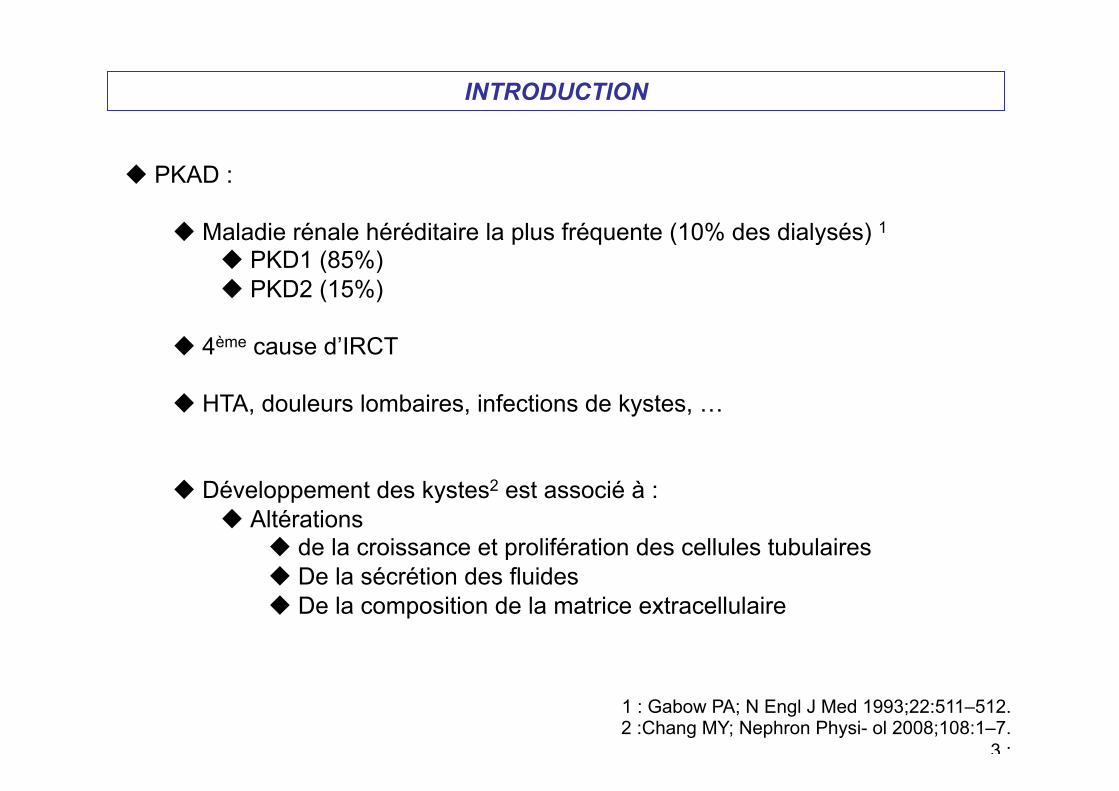
u PKAD :
u Maladie rénale héréditaire la plus fréquente (10% des dialysés) 1
u PKD1 (85%) u PKD2 (15%)
u 4ème cause d’IRCT
u HTA, douleurs lombaires, infections de kystes, …
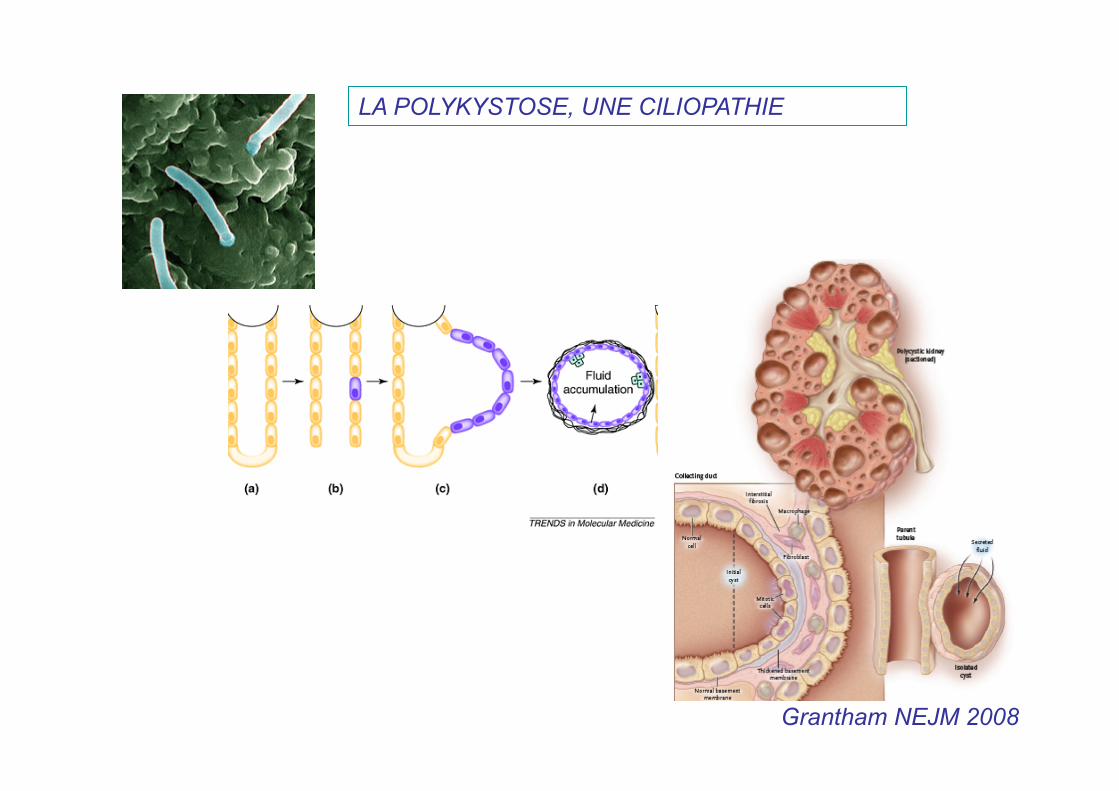
u Développement des kystes2 est associé à : u Altérations
u de la croissance et prolifération des cellules tubulaires u De la sécrétion des fluides u De la composition de la matrice extracellulaire
1 : Gabow PA; N Engl J Med 1993;22:511–512. 2 :Chang MY; Nephron Physi- ol 2008;108:1–7.
3 :
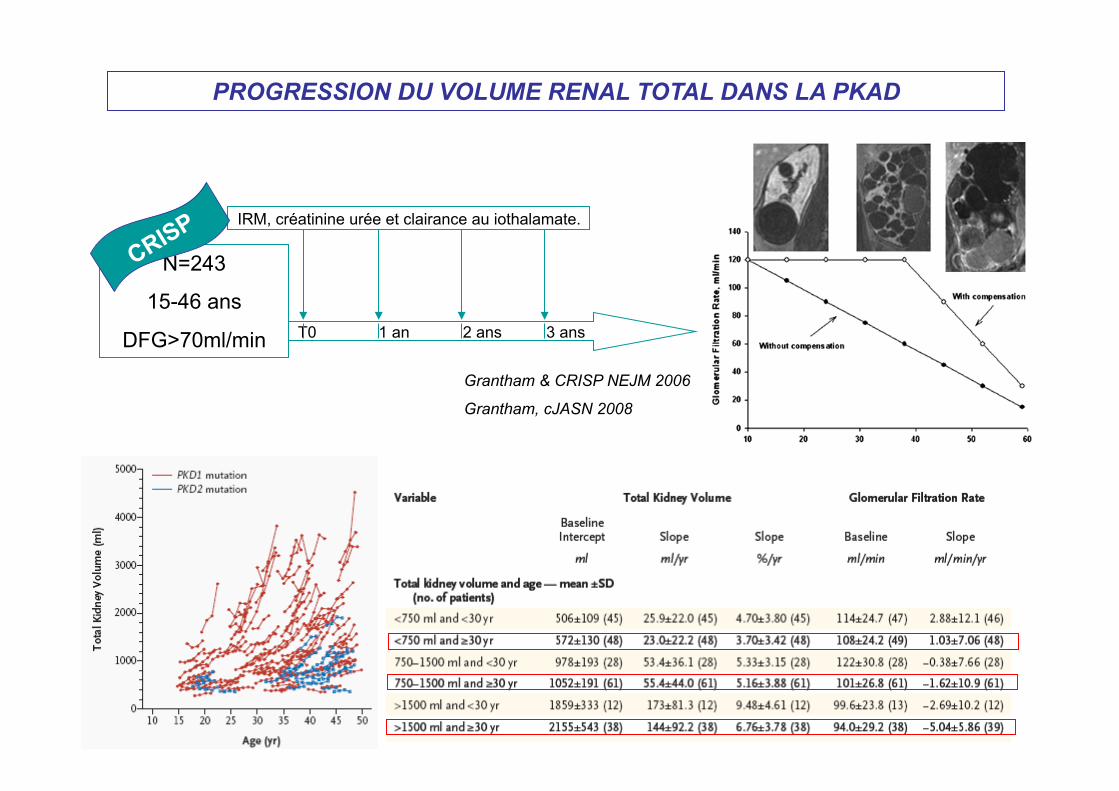
PROGRESSION DU VOLUME RENAL TOTAL DANS LA PKAD
N=243
15-46 ans
DFG>70ml/min T0 1 an 2 ans 3 ans
IRM, créatinine urée et clairance au iothalamate.
Grantham & CRISP NEJM 2006
Grantham, cJASN 2008

ETUDE HALT PKD NCT00283686
Etude A :
15-49 ans
GFR > 60 mL/min
TA>130/80 ou ttt
Lisinopril +Telmisartan TAS 110-130 TAD70-80
Lisinopril + Placebo TAS 110-130 TAD 70-80
Lisinopril +Telmisartan TAS 95-110 TAD 60-75
Lisinopril + Placebo TAS 95-110 TAD 60-75
Etude B :
18-64 ans
GFR 25-60 mL/min Lisinopril + Placebo TA 110-130/80
Lisinopril + Telmisartan TA 110-130/80
4 ans, résultats annoncés pour avril 2013
4 à 6 ans, résultats annoncés pour avril 2013
TKV 0, 2, 4 ans
↓ à 50% DFG, IRT ou décès.
558 patients
486 patients

MECANISMES MOLECULAIRES
Grantham NEJM 2008
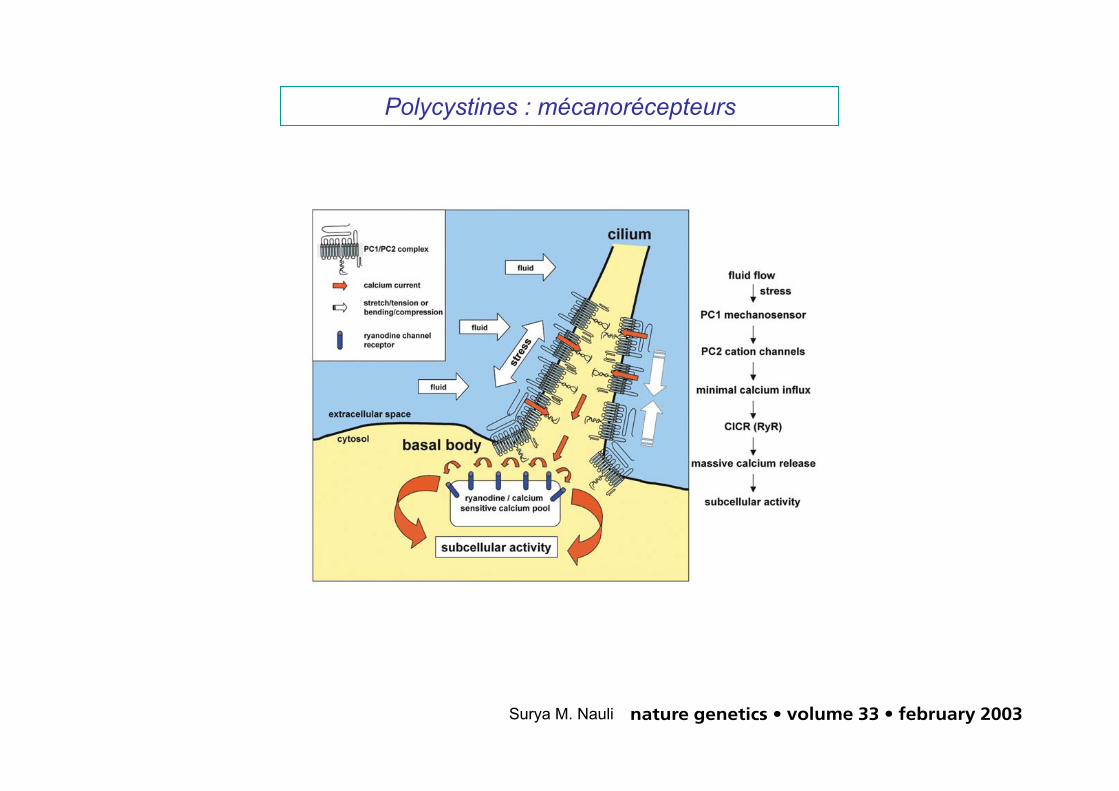
LA POLYKYSTOSE, UNE CILIOPATHIE
article
nature genetics • volume 33 • february 2003 135
propose that the inability torespond to flow contributes tocyst formation but that alter-ation in other downstream orparallel signaling pathways maybe responsible for modificationof the phenotypes.
Polaris and cystin, which aremutated in two mouse modelsfor PKD that are not related tohuman disease, have recentlybeen localized to primary ciliain cultured renal epithe-lia12,14,18. Although the func-tion of cystin is unknown,polaris seems to be critical forciliogenesis, as mice withmutant polaris develop short-ened cilia or no cilia in kidneyepithelia. In light of our findingthat cells with mutant PC1 areseemingly normal but do notsense fluid flow, we propose thatthe structural and functionalintegrity of the primary ciliumis critical for normal kidney celldifferentiation and organ mor-phogenesis. Defects in eithermay be key events in tubuledilatation and cyst formation.The mechanism behind thisdevelopmental control may beanalogous to the mechanism bywhich normal blood vessels sense fluid shear stress and sponta-neously remodel the vascular wall and change the lumen diameterto maintain a nearly constant fluid shear stress throughout the vas-culature22,23. Similarly, cells that lack PC1 and flow-induced Ca2+
influx may respond as if the stress levels were constitutively high,resulting in tissue remodeling and a compensatory increase in thediameters of renal tubules and other ciliated ducts1,2 (biliary andpancreatic), which are the cardinal features of PKD.
MethodsEmbryonic kidney cell culture. We generated timed pregnancies by inter-crossing mice heterozygous with respect to both the Pkd1del34 allele24 andthe temperature-sensitive SV40 large T antigen (Charles River). Asdescribed previously24,25, Pkd1del34 was created by replacing exon 34 ofPkd1 with a neomycin resistance gene, which results in a frame shift short-ly after exon 33. This mutation is predicted to result in a truncated PC1protein of 3,532 amino-acid residues lacking the C-terminal half of thetransmembrane domains and the entire C-terminal intracellular domain.We isolated kidneys from Pkd1del34/del34 or wild-type E15.5 embryos, disso-ciated them with collagenase and plated them out in Dulbecco’s modifiedEagle medium containing 2% fetal bovine serum, 0.75 µg l–1 interferon-γ, 1.0 g l–1 insulin, 0.67 mg l–1 sodium selenite, 0.55 g l–1 transferrin,0.2 g l–1 ethanolamine, 36 ng ml–1 hydrocortisone, 0.10 µM 2,3,5-triido-L-thyronine, 100 units penicillin-G (base) in combination with 0.30 mgml–1 additional glutamine, 100 µg streptomycin sulfate and 0.1 mM citrateto maintain penicillin potency. We obtained all cell culture supplementsfrom Invitrogen except for interferon-γ, hydrocortisone and 2,3,5-triido-L-thyronine, which we obtained from Sigma. We determined the geno-types of these cells as described previously24. For cell sorting, we grew cellsto confluence for 3 d at 37 °C. After trypsinization, we incubated 106
cells ml–1 with 10 µg ml–1 DBA (Vector Lab) and carried out cell sorting asdescribed42. We added 11.0 g l–1 sodium pyruvate to maintain cell viabilityin suspension media. We only used cells from passages 3–18 after sorting.Unless otherwise stated, we purchased all chemicals from Sigma.
Immunolocalization of PC1 and PC2. We sectioned mouse embryonic kid-neys (E15.5) to a thickness of 5 µm and grew tubular epithelial cells to vari-ous degrees of confluence. After fixation, we incubated samples overnight at4 °C with a purified antibody against PC1 (1:1,000 dilution) and then withsecondary antibody against rabbit labeled with fluorescein isothiocyanate(1:500 dilution) for 1 h at room temperature. For double labeling, we co-labeled antibodies to the cilia markers α-tubulin or γ-tubulin (1:10,000)with the antibody against PC1 and then secondary antibody against mouselabeled with Texas Red (1:500 dilution) as described previously28.
Ca2+ microfluorimetry. We grew epithelial cells for at least 2 d in theabsence of interferon-γ to induce optimal differentiation. We formulated anon-fluorescent, CO2-independent medium for Fura-2 Ca2+ imaging(pH 7.3), which contained 1.26 mM CaCl2, 0.81 mM MgSO4, 5.37 mMKCl, 0.44 0mM KH2PO4, 137 mM NaCl, 0.34 mM Na2HPO4, 5.55 mM D-glucose, 2.0 mM L-glutamine, 1.0 mM sodium pyruvate, 20.0 mM HEPESbuffer and 1% bovine serum albumin. We used the same buffer withoutCaCl2 and MgSO4 as Ca2+-free buffer with 1 mM of ethylene glycol tetra-aceticacid (EGTA). In some experiments, we incubated cells with caffeine (30 mM),ryanodine (30µM), GDPβS (10µM), U73122 (10µM) or 2-APB (10µM) for45 min before flow activation. In other experiments, we incubated cells withantibodies against PC1 or PC2 at a dilution of 1:50 for at least 45 min. We thenwashed cells at least three times with phosphate-buffered saline.
The experimental setup for flow has previously been described indetail21. Briefly, we incubated cells for 30 min with the Ca2+ sensitive probeFura2-AM (5 µM) at 37 °C. We then washed cells three times to removeexcess Fura2-AM and placed them in a perfusion chamber with a thicknessof 0.0254 cm and width of 1.0 cm (GlycoTech). The chamber was posi-tioned under a Nikon Diaphot microscope equipped with a CCD camerausing IPLab software for Macintosh. We captured paired Fura images every5 s at excitation wavelengths of 340 nm and 380 nm. After equilibration inthe microscopy media for at least 10 min, we then stimulated the primarycilia of these cells at a fluid shear stress of 0.75 dyne cm–2. We radiometri-cally calculated the Ca2+ level relative to the baseline value using Rmin andRmax values of 0.3 and 6.0, respectively.
Fig. 8 Schematic diagram of mechanisms of fluid shear stress and Ca2+ signaling in mouse embryonic kidney cells. Ciliaact as antennae to sense fluid movement. PC1, with its large extracellular domains, acts as a sensory molecule for fluidshear stress that transmits the signal from the extracellular fluid environment to PC2, which, in turn, produces sufficientCa2+ influx to activate intracellular ryanodine receptors (RyR) through Ca2+-induced Ca2+ release (CICR). The resultinglocal increase in the cytosolic Ca2+ concentration then regulates numerous molecular activities inside the cell that con-tribute to tissue development.
©20
03 N
atur
e Pu
blis
hing
Gro
up h
ttp://
ww
w.n
atur
e.co
m/n
atur
egen
etic
s
Polycystines : mécanorécepteurs
article
134 nature genetics • volume 33 • february 2003
response to thrombin observed in the mutant cells may thereforereflect an imbalance in G-protein signaling due to mutant PC1which, in turn, promotes enhanced Ca2+ release or transport bymeans of a different molecular pathway. We have also shown thatPC1 does not activate Gq5, a G-protein involved in intraorganel-lar Ca2+ release through the InsP3 receptor. Consistent with theseresults, we found no evidence for the involvement of the InsP3receptor in response to flow.
Since the Pkd1del34 mouse model was generated24, severalmouse models with mutations in Pkd1 have been estab-lished25,35–37. The phenotype associated with the Pkd1del34 muta-tion is similar to but slightly milder25,37 than those associated withother Pkd1 mutations in terms of kidney and pancreatic cysts,perinatal lethality, hydrops fetalis and polyhydroamnios in thehomozygotes24,25 and liver disease in the heterozygotes38. The rela-tively mild phenotype seems to be a mutation-specific effect that
may be related to high levels of mutant PC1 inPkd1del34/del34 mice; high levels of PC1 are alsofound in kidneys of many individuals withautosomal dominant PKD28,39,40. Recentgenotype–phenotype correlation studies inindividuals with PKD also showed that 5!PKD1 mutations seem to result in more severephenotypes than do 3! mutations41. Someextrarenal phenotypes, such as hemorrhageand congestive heart failure, have been foundonly in some mice with mutations in Pkd1,which may be due to the nature of the muta-tion and the specific background mousestrains. In view of the data presented here, we
Fig. 7 Ca2+-induced Ca2+ release was required for flow-induced Ca2+ responses. Two pathways that lead tointraorganellar Ca2+ release were examined (a). Paral-lel experiments on fluid shear stress with and withouttreatment of caffeine (b) or ryanodine (c) showed thatemptying the ryanodine-sensitive pool or inhibition ofryanodine receptors (RyR), which are activated byincreases in the cytosolic Ca2+ concentration undernormal physiological conditions, significantly inhib-ited increases of cytosolic Ca2+ in response to flow.d–f, Inhibitors of heterotrimeric G-proteins (d), phos-pholipase C (e) or InsP3 receptors (f) did not inhibit theCa2+ signal. n = 6 for caffeine and U73122 treatments;n = 12 for all others.
Fig. 6 Specificity of antibodies against polycystins. a, Western-blot analysesshowed that the antibody against PC1 recognized a high molecular-weightPC1 band in induced but not in uninduced PC1 stably transfected 293T cells.b–d, The direct effects of antibodies against PC2 on channel activities wereshown by outside-out patches excised in wild-type cells and by westernblots and immunoprecipitation studies. The changes in open state proba-bility (Po) of the PC2 channels were measured at –110 mV before and afteraddition of p96525 (b; n = 4), p57 (c; n = 7) and p58 (d; n = 5) at a dilution of1:50, 1:50 and 1:500, respectively. The calibration bar represents negativeinward current.
a b c
d
a
b
c
d
e
f
©20
03 N
atur
e Pu
blis
hing
Gro
up h
ttp://
www.
natu
re.c
om/n
atur
egen
etic
s
Surya M. Nauli
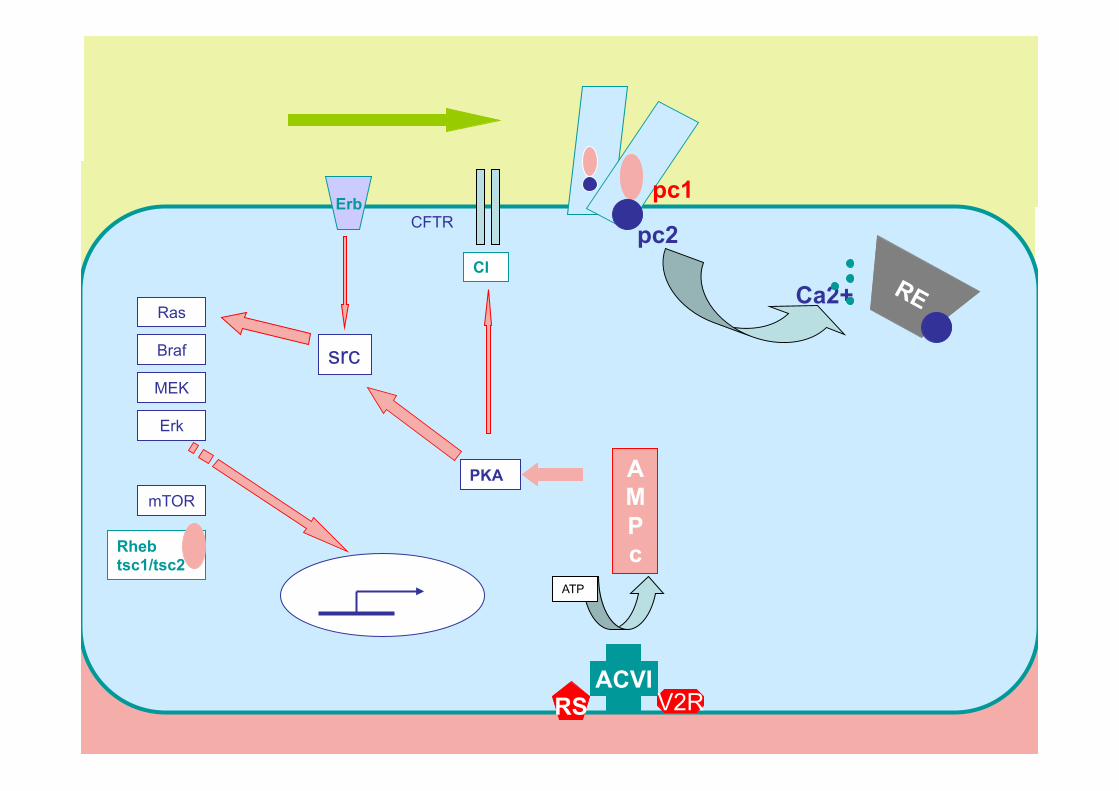
pc1
pc2
Ca2+
ACVI RS V2R
ATP
AMPc
PKA
src
Ras
Braf
MEK
Erk
mTOR
Rheb tsc1/tsc2
Cl
Erb CFTR
RESTAURATION DU SIGNAL CALCIQUE
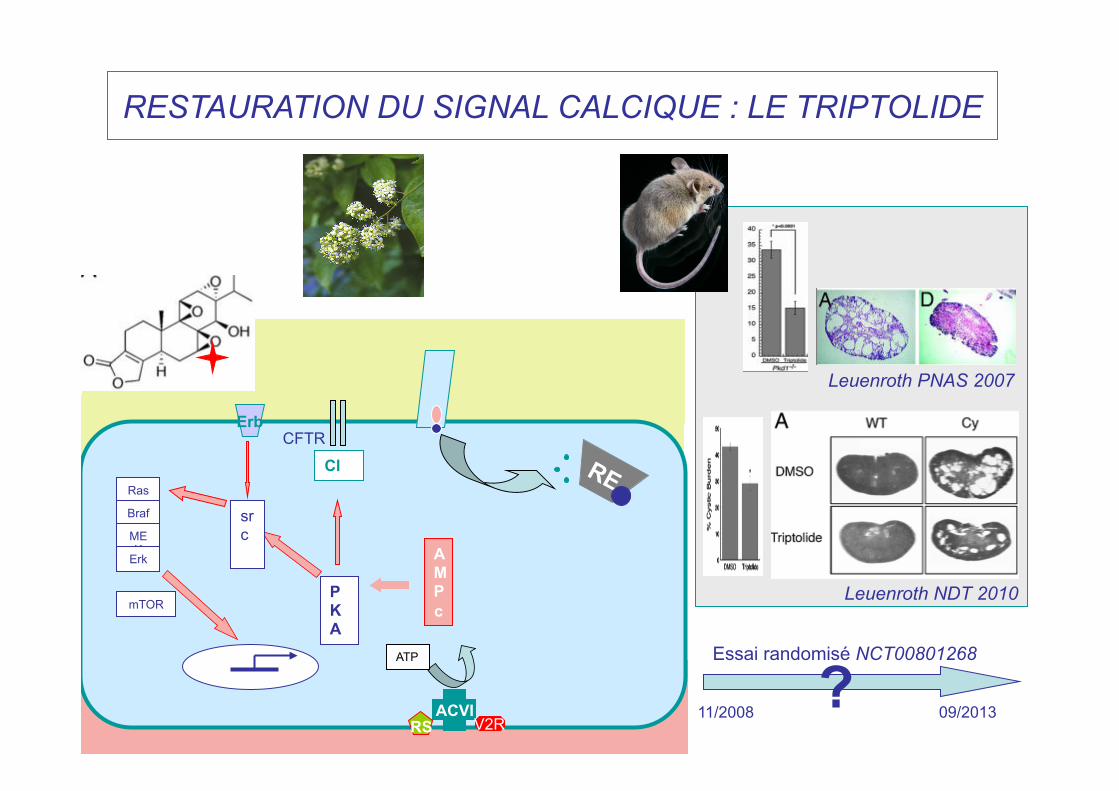
RESTAURATION DU SIGNAL CALCIQUE : LE TRIPTOLIDE
ACVI RS V2R
ATP
AMPc
PKA
src
Ras
Braf
MEK
Erk
mTOR
Cl
Erb CFTR
Leuenroth PNAS 2007
Leuenroth NDT 2010
11/2008 09/2013
Essai randomisé NCT00801268 ?
DIMINUTION DE LA SYNTHESE D’AMPc
- Inhibiteur du récepteur de la vasopressine. - Analogues de la Somatostatine.
ACVI RS V2R
ATP
AMPc
PKA
src
Ras
Braf
MEK
Erk
mTOR
Cl
Erb CFTR
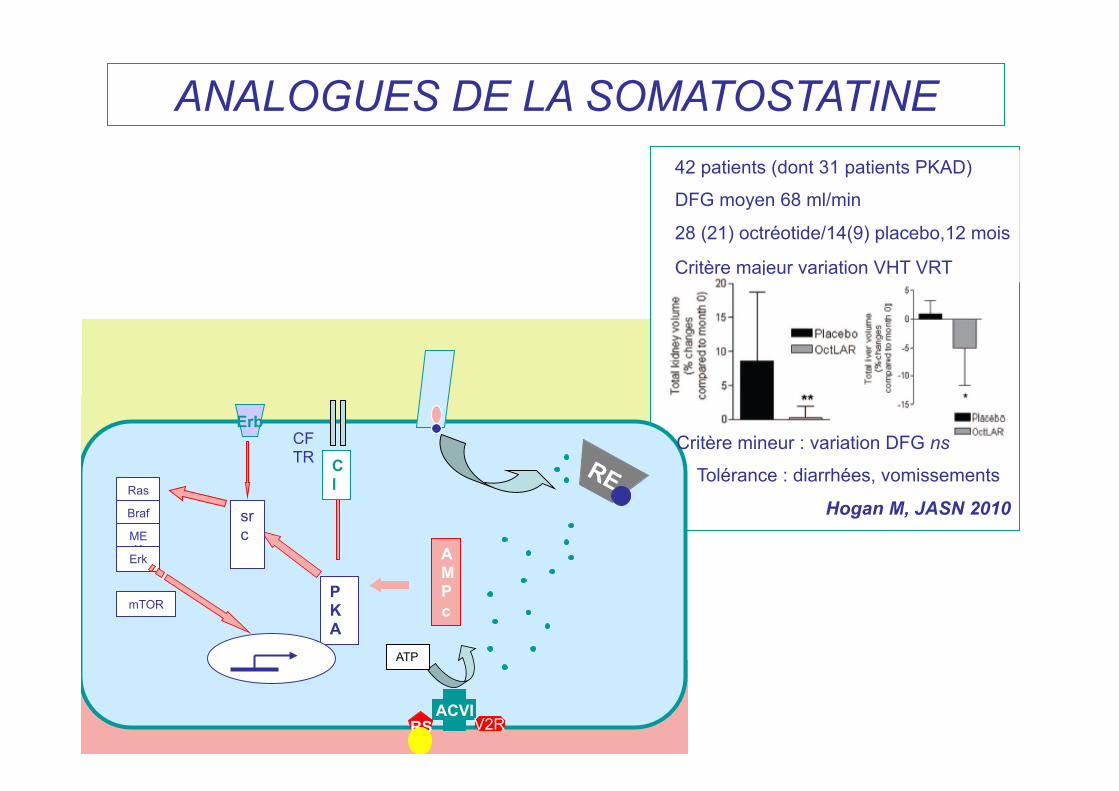
ANALOGUES DE LA SOMATOSTATINE 42 patients (dont 31 patients PKAD)
DFG moyen 68 ml/min
28 (21) octréotide/14(9) placebo,12 mois
Critère majeur variation VHT VRT
Critère mineur : variation DFG ns
Tolérance : diarrhées, vomissements
Hogan M, JASN 2010
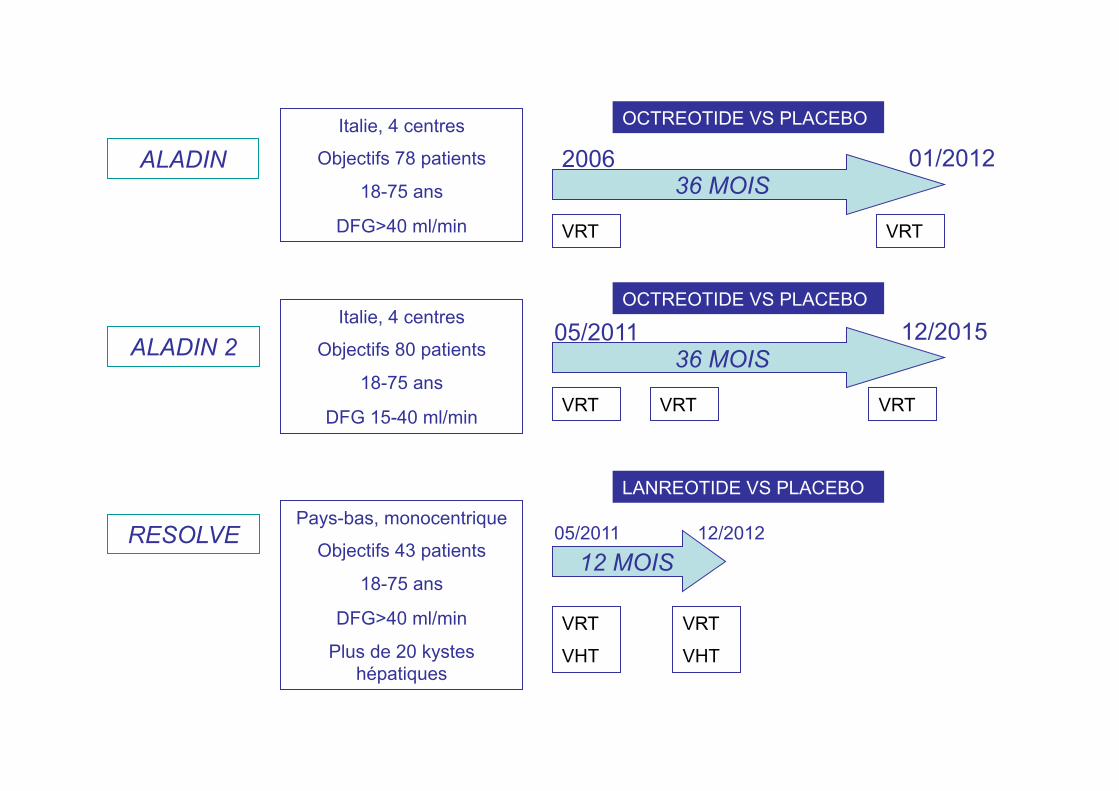
ALADIN
ALADIN 2
RESOLVE
Italie, 4 centres
Objectifs 78 patients
18-75 ans
DFG>40 ml/min
36 MOIS
12/2015 05/2011
VRT VRT
Italie, 4 centres
Objectifs 80 patients
18-75 ans
DFG 15-40 ml/min
36 MOIS
01/2012 2006
VRT VRT VRT
OCTREOTIDE VS PLACEBO
OCTREOTIDE VS PLACEBO
Pays-bas, monocentrique
Objectifs 43 patients
18-75 ans
DFG>40 ml/min
Plus de 20 kystes hépatiques
12 MOIS
VRT
VHT
VRT
VHT
05/2011 12/2012
LANREOTIDE VS PLACEBO
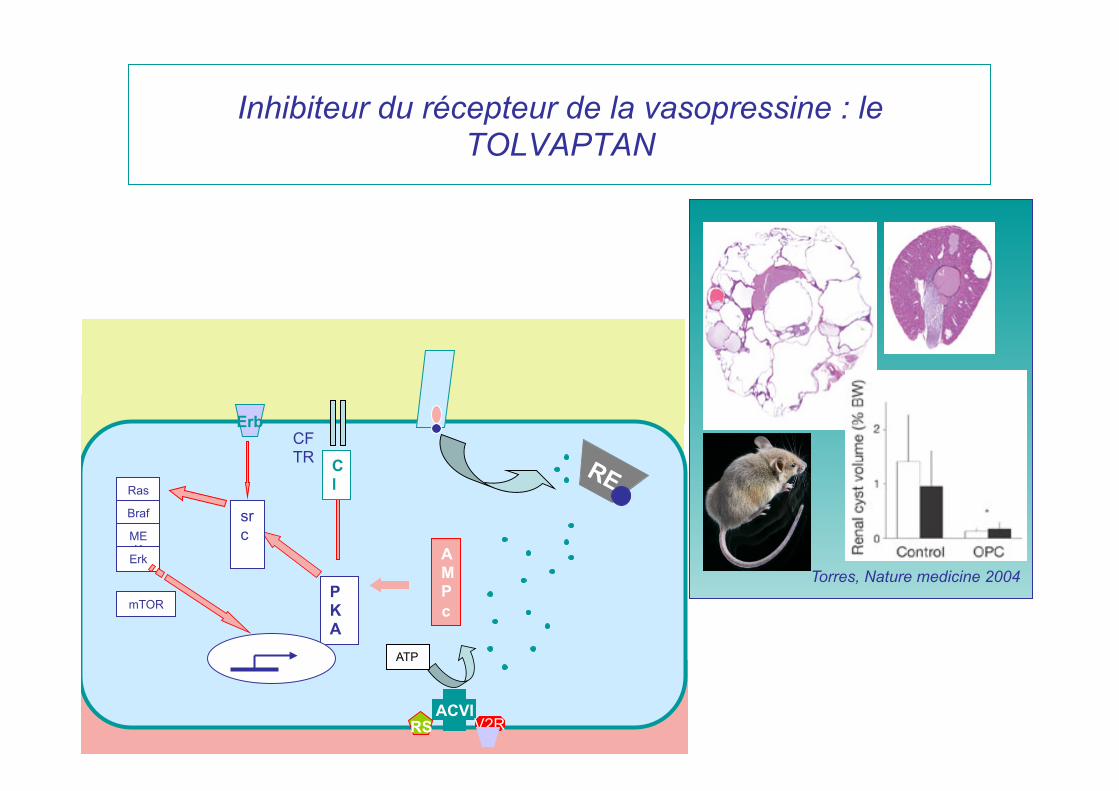
Inhibiteur du récepteur de la vasopressine : le TOLVAPTAN
ACVI RS V2R
ATP
AMPc
PKA
src
Ras
Braf
MEK
Erk
mTOR
Cl
Erb CFTR
Torres, Nature medicine 2004
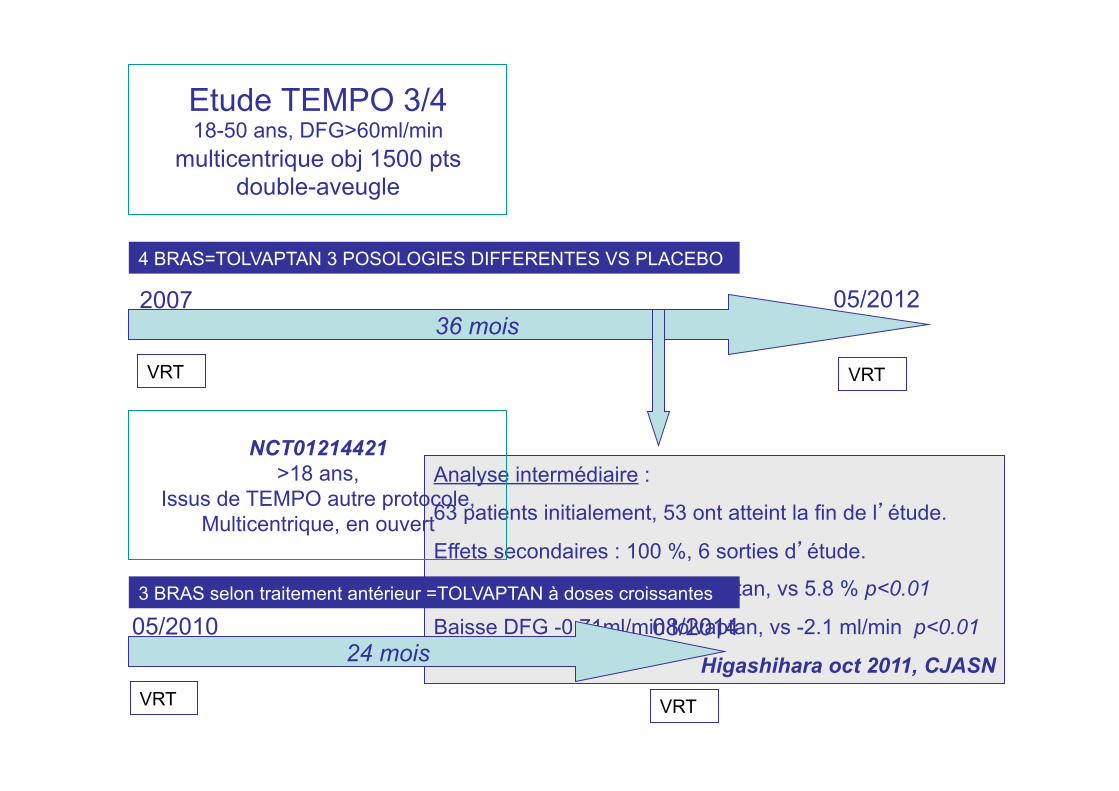
Etude TEMPO 3/4 18-50 ans, DFG>60ml/min
multicentrique obj 1500 pts double-aveugle
36 mois
VRT
VRT
2007
4 BRAS=TOLVAPTAN 3 POSOLOGIES DIFFERENTES VS PLACEBO
05/2012
Analyse intermédiaire :
63 patients initialement, 53 ont atteint la fin de l’étude.
Effets secondaires : 100 %, 6 sorties d’étude.
Augmentation VRT 1.7 % tolvaptan, vs 5.8 % p<0.01
Baisse DFG -0.71ml/min tolvaptan, vs -2.1 ml/min p<0.01
Higashihara oct 2011, CJASN
NCT01214421 >18 ans,
Issus de TEMPO autre protocole, Multicentrique, en ouvert
24 mois 05/2010 08/2014 3 BRAS selon traitement antérieur =TOLVAPTAN à doses croissantes
VRT
VRT
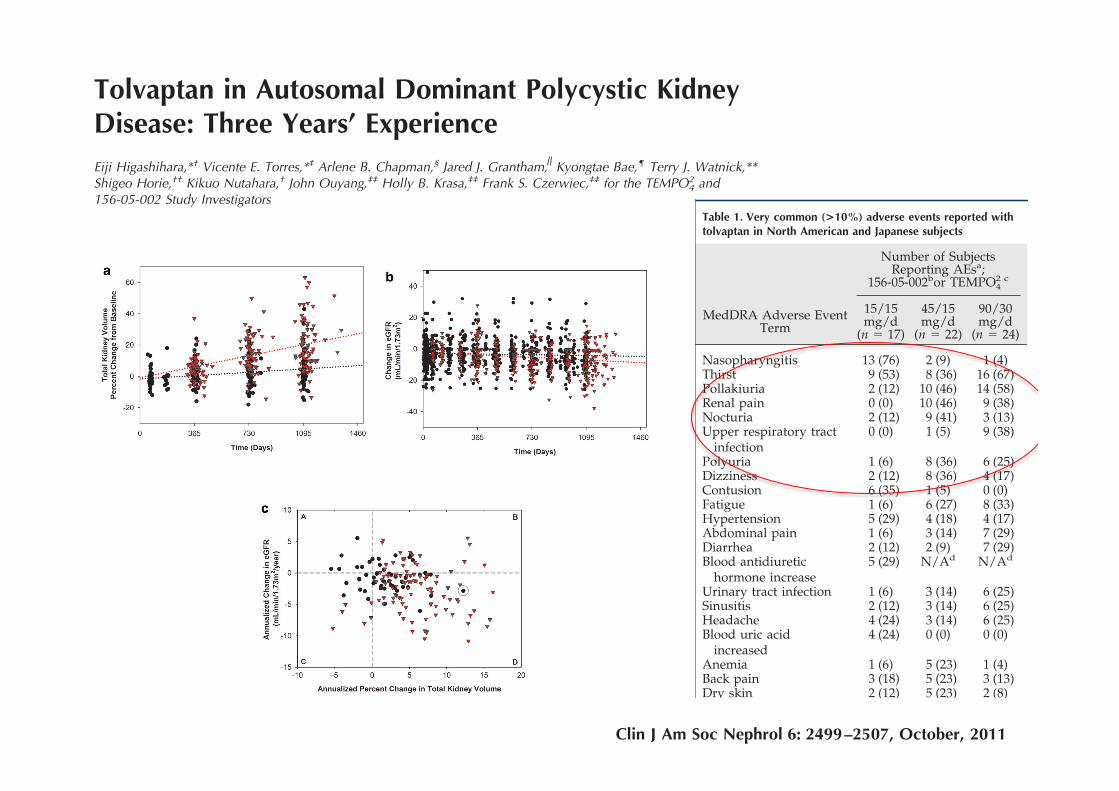
Tolvaptan in Autosomal Dominant Polycystic KidneyDisease: Three Years’ ExperienceEiji Higashihara,*† Vicente E. Torres,*‡ Arlene B. Chapman,§ Jared J. Grantham, Kyongtae Bae,¶ Terry J. Watnick,**Shigeo Horie,†† Kikuo Nutahara,† John Ouyang,‡‡ Holly B. Krasa,‡‡ Frank S. Czerwiec,‡‡ for the TEMPO4
2 and156-05-002 Study Investigators
SummaryBackground and objectives Autosomal dominant polycystic kidney disease (ADPKD), a frequent cause ofend-stage renal disease, has no cure. V2-specific vasopressin receptor antagonists delay disease progressionin animal models.
Design, setting, participants, and measurements This is a prospectively designed analysis of annual total kid-ney volume (TKV) and thrice annual estimated GFR (eGFR) measurements, from two 3-year studies oftolvaptan in 63 ADPKD subjects randomly matched 1:2 to historical controls by gender, hypertension, age,and baseline TKV or eGFR. Prespecified end points were group differences in log-TKV (primary) and eGFR(secondary) slopes for month 36 completers, using linear mixed model (LMM) analysis. Sensitivity analysesof primary and secondary end points included LMM using all subject data and mixed model repeated mea-sures (MMRM) of change from baseline at each year. Pearson correlation tested the association betweenlog-TKV and eGFR changes.
Results Fifty-one subjects (81%) completed 3 years of tolvaptan therapy; all experienced adverse events(AEs), with AEs accounting for six of 12 withdrawals. Baseline TKV (controls 1422, tolvaptan 1635 ml) andeGFR (both 62 ml/min per 1.73 m2) were similar. Control TKV increased 5.8% versus 1.7%/yr for tolvaptan(P ! 0.001, estimated ratio of geometric mean 0.96 [95% confidence interval 0.95 to 0.97]). Correspondingannualized eGFR declined: "2.1 versus "0.71 ml/min per 1.73 m2/yr (P # 0.01, LMM group difference 1.1ml/min per 1.73 m2/yr [95% confidence interval 0.24 to 1.9]). Sensitivity analyses including withdrawnsubjects were similar, whereas MMRM analyses were significant at each year for TKV and nonsignificantfor eGFR. Increasing TKV correlated with decreasing eGFR (r # "0.21, P ! 0.01).
Conclusion ADPKD cyst growth progresses more slowly with tolvaptan than in historical controls, but AEsare common.
Clin J Am Soc Nephrol 6: 2499–2507, 2011. doi: 10.2215/CJN.03530411
IntroductionAutosomal dominant polycystic kidney disease(ADPKD) is an inherited disorder which, over de-cades, results in progressive development of mul-tiple renal cysts, urinary concentration defects, hy-pertension, and ultimately ESRD (1– 4). Kidney andback pain from cyst hemorrhage, stones, infection,biomechanical stresses, stretching of the renal cap-sule, or pressure on other organs can impact qualityof life (5). Less common extrarenal manifestationssuch as cerebral aneurysms may be life-threatening.
Studies in animal models have implicated argi-nine vasopressin and its second messenger cAMPas important promoters of cyst cell proliferationand fluid secretion into cysts (6). Suppression ofvasopressin release by forced hydration, geneticcrosses between cyst-prone animals and those lack-ing vasopressin, and vasopressin V2 receptor block-
ade consistently reduce cyst burden and protectrenal function (6). These compelling preclinicalstudies provided a rationale for vasopressin V2 re-ceptor antagonism as a preventive therapy for hu-man ADPKD.
Total kidney volume (TKV) is a practical, inter-mediate end point of later outcomes in ADPKDincluding pain, hypertension, renal insufficiency,and ESRD. The Consortium of Radiologic ImagingStudies of Polycystic Kidney Disease (CRISP) andother studies are establishing the relationship be-tween TKV growth and important clinical outcomes(7–9). However, it will take years of study to provewhether a treatment that slows TKV expansion willpositively affect estimated GFR (eGFR), ESRD, ordeath. The current study explores the potential useof TKV as a surrogate for ADPKD therapies target-ing vasopressin V2 signaling.
†Kyorin UniversitySchool of Medicine,Mitaka, Tokyo, Japan;‡Mayo Clinic College ofMedicine, Rochester,Minnesota; §EmoryUniversity School ofMedicine, Atlanta,Georgia; !KansasUniversity MedicalCenter, Kansas City,Kansas; ¶University ofPittsburgh School ofMedicine, Pittsburgh,Pennsylvania; **JohnsHopkins University,Baltimore, Maryland;††Teikyo UniversitySchool of Medicine,Tokyo, Japan;and ‡‡OtsukaPharmaceuticalDevelopment andCommercialization,Inc., Rockville,Maryland
Correspondence: Dr.Vicente E. Torres,Division of Nephrologyand Hypertension,Mayo Clinic, 200 FirstStreet SW, Rochester,MN 55905. Phone:507-284-7572; Fax:507-266-9315; E-mail:[email protected]
*E.H. and V.E.T.contributed equally tothis report as the 156-05-002 and 156-04-250(TEMPO4
2) leaders. Allinvestigators are listedin the Appendix.
www.cjasn.org Vol 6 October, 2011 Copyright © 2011 by the American Society of Nephrology 2499
Article
systolic BP !90 mmHg, serious cardiac or hepatic disease,or a history of significant bleeding or bleeding tendency.
The primary objective of TEMPO42 and 156-05-002 stud-
ies was to confirm the long-term safety and tolerability oftolvaptan. Subject safety was assessed by regular monitor-ing of adverse events (AEs), directed physical examina-tions, vital signs, laboratory, and electrocardiogram mea-surements. The secondary objective of these trials was toacquire pilot efficacy data. Efficacy was assessed bychanges in urine osmolality (Uosm), TKV, eGFR, andhypertension status. Pharmacokinetic/pharmacodynamicanalyses were also performed. This report focuses on com-parisons of tolvaptan to historical matched-control trajec-
Table 1. Very common (>10%) adverse events reported withtolvaptan in North American and Japanese subjects
Number of SubjectsReporting AEsa;
156-05-002bor TEMPO42 c
MedDRA Adverse EventTerm
15/15mg/d
(n " 17)
45/15mg/d
(n " 22)
90/30mg/d
(n " 24)
Nasopharyngitis 13 (76) 2 (9) 1 (4)Thirst 9 (53) 8 (36) 16 (67)Pollakiuria 2 (12) 10 (46) 14 (58)Renal pain 0 (0) 10 (46) 9 (38)Nocturia 2 (12) 9 (41) 3 (13)Upper respiratory tract
infection0 (0) 1 (5) 9 (38)
Polyuria 1 (6) 8 (36) 6 (25)Dizziness 2 (12) 8 (36) 4 (17)Contusion 6 (35) 1 (5) 0 (0)Fatigue 1 (6) 6 (27) 8 (33)Hypertension 5 (29) 4 (18) 4 (17)Abdominal pain 1 (6) 3 (14) 7 (29)Diarrhea 2 (12) 2 (9) 7 (29)Blood antidiuretic
hormone increase5 (29) N/Ad N/Ad
Urinary tract infection 1 (6) 3 (14) 6 (25)Sinusitis 2 (12) 3 (14) 6 (25)Headache 4 (24) 3 (14) 6 (25)Blood uric acid
increased4 (24) 0 (0) 0 (0)
Anemia 1 (6) 5 (23) 1 (4)Back pain 3 (18) 5 (23) 3 (13)Dry skin 2 (12) 5 (23) 2 (8)Dyspnea 0 (0) 1 (5) 5 (21)Constipation 1 (6) 0 (0) 5 (21)Dehydration 3 (18) 0 (0) 2 (8)Gastritis 3 (18) 0 (0) 0 (0)Palpitations 3 (18) 3 (14) 1 (4)Gastritis erosive 3 (18) 0 (0) 0 (0)Vertigo 3 (18) 0 (0) 0 (0)Dental caries 3 (18) 0 (0) 0 (0)Bronchitis 1 (6) 4 (18) 2 (8)Abdominal distension 1 (6) 3 (14) 4 (17)Nausea 1 (6) 1 (5) 4 (17)Cough 0 (0) 0 (0) 4 (17)Edema, peripheral 1 (6) 3 (14) 3 (13)Hypotension 0 (0) 3 (14) 3 (13)Arthralgia 1 (6) 3 (14) 3 (13)Chest pain 1 (6) 3 (14) 2 (8)Dry eye 0 (0) 3 (14) 2 (8)Polydipsia 0 (0) 3 (14) 1 (4)Erythema 0 (0) 3 (14) 0 (0)Weight increase 0 (0) 3 (14) 0 (0)Blood creatinine increase 2 (12) 1 (5) 3 (13)Viral upper respiratory
tract infection0 (0) 1 (5) 3 (13)
Dyspepsia 0 (0) 1 (5) 3 (13)Dry mouth 0 (0) 0 (0) 3 (13)Vomiting 0 (0) 1 (5) 3 (13)Insomnia 1 (6) 1 (5) 3 (13)Rash 0 (0) 0 (0) 3 (13)Muscle spasms 0 (0) 0 (0) 3 (13)Anxiety 0 (0) 0 (0) 3 (13)
Table 1. (Continued)
Number of SubjectsReporting AEsa;
156-05-002bor TEMPO42 c
MedDRA AdverseEvent Term
15/15mg/d
(n " 17)
45/15mg/d
(n " 22)
90/30mg/d
(n " 24)
Pain in extremity 2 (12) 2 (9) 0 (0)Blood triglyceride
increase2 (12) 0 (0) 2 (8)
Hyperuricemia 2 (12) 0 (0) 2 (8)Arthropod sting 2 (12) 1 (5) 1 (4)Tinea pedis 2 (12) 1 (5) 0 (0)Musculoskeletal pain 2 (12) 0 (0) 1 (4)Neck pain 2 (12) 0 (0) 1 (4)Keratitis 2 (12) 0 (0) 0 (0)Gastric polyps 2 (12) 0 (0) 0 (0)Malaise 2 (12) 0 (0) 0 (0)Muscle injury 2 (12) 0 (0) 0 (0)Alanine
aminotransferaseincreased
2 (12) 0 (0) 0 (0)
Blood cholesterolincrease
2 (12) 0 (0) 0 (0)
Blood glucose increase 2 (12) 0 (0) 0 (0)Hemoglobin decrease 2 (12) 0 (0) 0 (0)Blood phosphorus
increase2 (12) 0 (0) 0 (0)
Spinal; osteoarthritis 2 (12) 0 (0) 0 (0)Intervertebral disc
protrusion2 (12) 0 (0) 0 (0)
Intracranial aneurysm 2 (12) 0 (0) 0 (0)Eczema 2 (12) 0 (0) 0 (0)Pruritus 2 (12) 0 (0) 0 (0)Upper respiratory tract
inflammation2 (12) 0 (0) 0 (0)
An adverse event (AE) is a new or worsening untowardsymptom or sign occurring after receiving at least one dose oftolvaptan. Medical Dictionary for Regulatory Activities.a Values in parentheses are percentage.b Subjects receiving at least one dose from Japanese 156-05-002(n " 17) studies.c Subjects receiving at least one dose from U.S. 156-04-250TEMPO4
2 (n " 46) studies who were randomized to separatedose groups.d Not applicable (n/A) because antidiuretic hormone(vasopressin) was not assessed in TEMPO.
Clin J Am Soc Nephrol 6: 2499–2507, October, 2011 Tolvaptan in ADPKD, Higashihara et al. 2501
Most were mild or moderate in severity. Table 1 lists verycommon AEs (reported in !10% of patients; SupplementalTable 1 lists all AEs). Small mean increases from baselinewere seen for serum creatinine and uric acid, starting at theearliest time points. No clinically meaningful trends wereseen for any hematology, urinalysis, or ECG parameter.
Twelve (19%) patients withdrew from the study. Rea-sons for withdrawal are shown in Supplemental Table 2.AEs accounted for six (50%) of the withdrawals, includingrenal impairment, acute renal failure, benign pituitary tu-mor, transient ischemic attack, eye swelling, and subarach-noid hemorrhage with a fatal outcome.
Urine osmolality below 300 mOsm/kg!H2O was used inthe TEMPO4
2 and 156-05-002 study as a target for tolvaptaninhibition of vasopressin activity. The TEMPO4
2 and 156-05-002 mean (median) Uosm premorning dose was 264(228) and 343 (310) mOsm/kg per H2O. This was belowmean (median) baseline levels of 472 (409) and 478 (461)mOsm/kg per H2O.
Tolvaptan subject cohorts were closely matched to con-trols for gender and hypertension status, age, height, race,and baseline parameter of interest. Mean TKV was 13%lower, and age was 5 years younger in the TKV controls(Table 2). Forty-five percent and 37% of tolvaptan-treatedpatients and 47% and 23% of CRISP matches were treatedwith angiotensin-converting enzyme inhibitors or angioten-sin II receptor blockers. Forty-two percent of subjects in theMDRD study were treated with angiotensin-converting en-zyme inhibitors (16).
TKV growth in tolvaptan-treated subjects was 1.7%/yrcompared with 5.8%/yr for control CRISP subjects (P "0.001, ratio of geometric mean [RGM] 0.96, 95% confidenceinterval 0.95 to 0.97) (Table 3, Figure 3a). This represents a70% slower growth rate per year in tolvaptan-treated pa-tients. A similar result was obtained when all completersand withdrawn subjects were included in the analysis:1.7%/yr and 5.8%/yr, respectively (P " 0.001, RGM 0.96,95% confidence interval 0.95 to 0.97) (Supplemental Table3). The corresponding slopes of eGFR were #0.71 intolvaptan-treated patients and #2.1 ml/min per 1.73m2/yr in CRISP (n $ 66) and MDRD (n $ 36) controlsubjects (P $ 0.01, linear mixed model [LMM] group dif-ference 1.1, 95% confidence interval 0.24 to 1.9) for a groupdifference of approximately 65% (Table 3, Figure 3b). Re-sults were similar, but less marked (15% effect size), for theall completers and withdrawn group comparison; #1.7versus #2.0 ml/min per 1.73 m2/yr (P $ 0.02, LMM groupdifference 0.95, 95% confidence interval 0.13 to 1.8) (Sup-plemental Table 3).
The effect of tolvaptan on kidney growth was confirmedby the MMRM sensitivity analysis. At each visit, averageTKV trended upward or downward as expected (Table 4).Over 3 years, mean TKV increased by 98 ml (5.3%, from1635 to 1734 ml) in the all completers tolvaptan-treatedgroup, compared with 300 ml (19%, from 1422 to 1722 ml)in the matched control group. These TKV changes were allsignificantly different between the groups at each yearlyassessment. In contrast, eGFR declined from a mean of 61.6to 55.9 for all completers treated subjects and from 61.9 to55.4 ml/min per 1.73 m2 for matched controls. Althoughthe difference between groups in the mean change at year
Figure 3. | Change in total kidney volume and renal function over 3years of tolvaptan compared with matched control and their cor-relation for individual subjects. The primary analysis for slope of totalkidney volume (TKV) and estimated GFR (eGFR) use each parameter’sannualized change and a linear mixed model to test for group differ-ences. Because these data are not easily displayed, subjects completing3 years of tolvaptan (black circles) and their controls (red triangles) aredisplayed for TKV (a) and eGFR (b). Control subjects were matched 1:2by gender, presence of hypertension, age, and either baseline TKV (a) orbaseline eGFR (b). Values for change from baseline (as percent TKV orml/min per 1.73 m2 per year) are plotted, and dotted lines representinga linear regression of group trend were drawn. (c) These subjects’annualized change in eGFR (by MDRD formula) and the annualizedpercent change in TKV were plotted, and the entire data set’s correlation(r $ #0.21, P " 0.01) was evaluated. Dashed lines marking a zerochange in TKV and eGFR parameters are drawn, creating quadrantsrepresenting improvement in both parameters (A), improvement ineGFR but worsened TKV (B), worsened eGFR but improved TKV (C),and worsening in both parameters (D) are shown. The data point circledrepresents the subject in whom compliance with tolvaptan was notsupported by tolvaptan metabolite data.
2504 Clinical Journal of the American Society of Nephrology
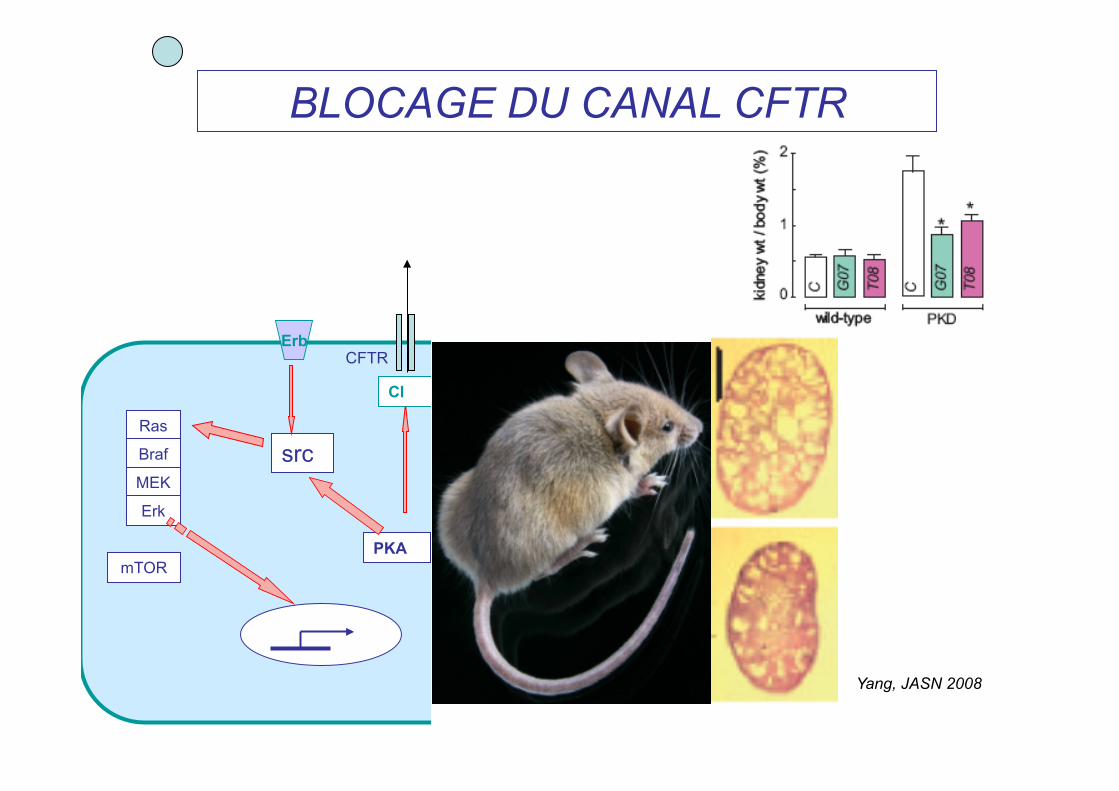
- Inhibiteur du canal CFTR - Activateur de l’AMPK
DIMINUTION DE LA SECRETION INTRA-KYSTIQUE
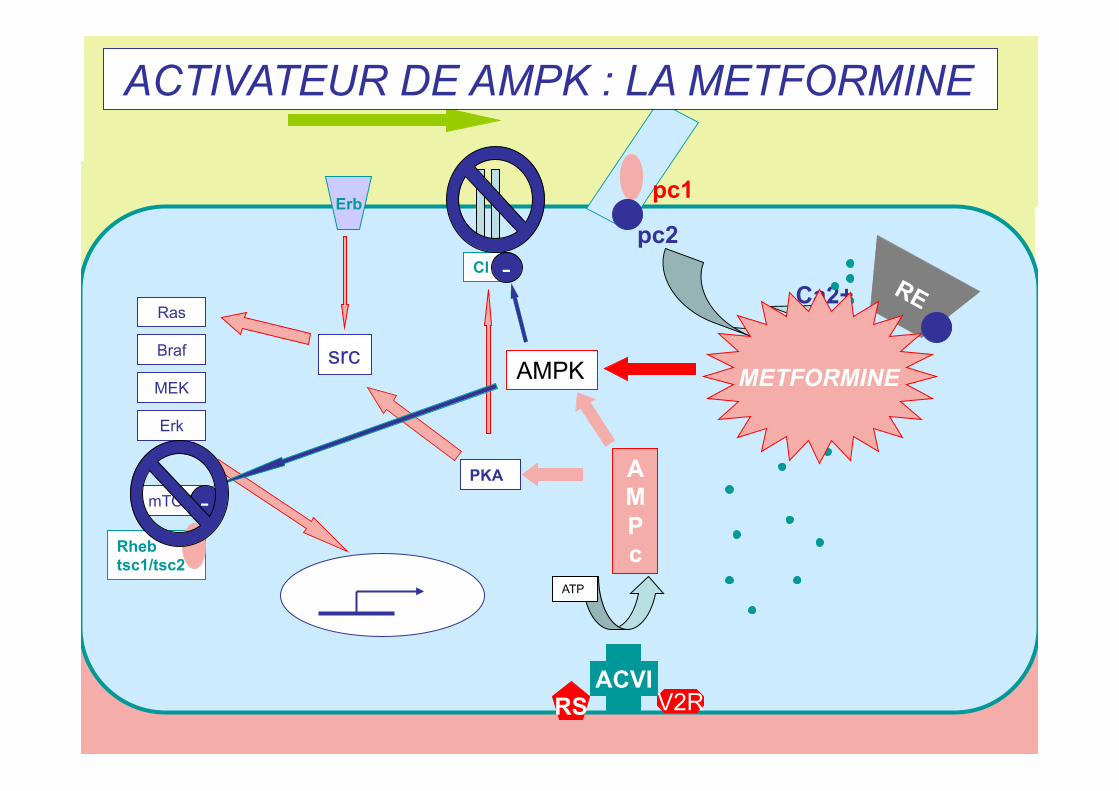
pc1
pc2
Ca2+
ACVI RS V2R
ATP
AMPc
PKA
src
Ras
Braf
MEK
Erk
mTOR
Rheb tsc1/tsc2
Cl
Erb
AMPK
-
-
METFORMINE
ACTIVATEUR DE AMPK : LA METFORMINE
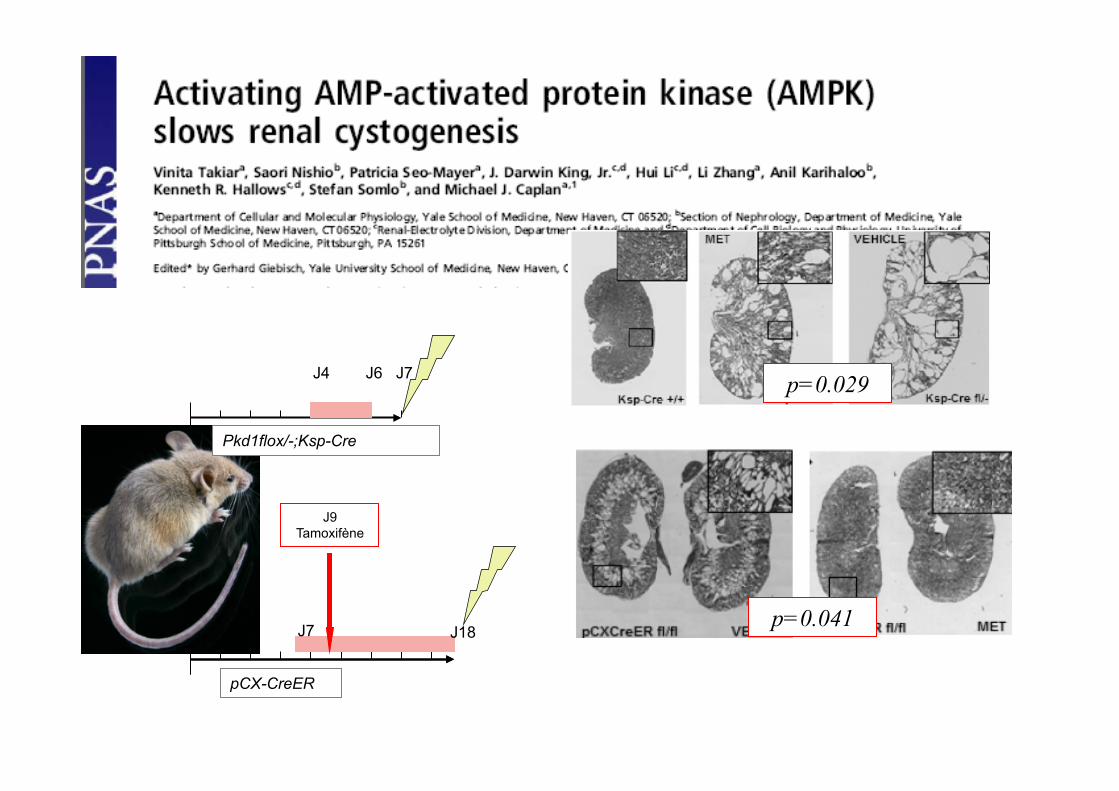
J4 J6 J7
J7
J9 Tamoxifène
J18
Pkd1flox/-;Ksp-Cre
pCX-CreER
p=0.041
p=0.029
pc1 pc2
Ca2+
ACVI RS V2R
ATP
AMPc
PKA
src Ras
Braf
MEK
Erk
mTOR
Cl
Erb CFTR
BLOCAGE DU CANAL CFTR
Yang, JASN 2008
INHIBITION DES VOIES DE LA PROLIFERATION
Ca2+
ACVI RS V2R
ATP
AMPc
PKA
src Ras
Braf
MEK Erk
mTOR
Cl
Erb
-
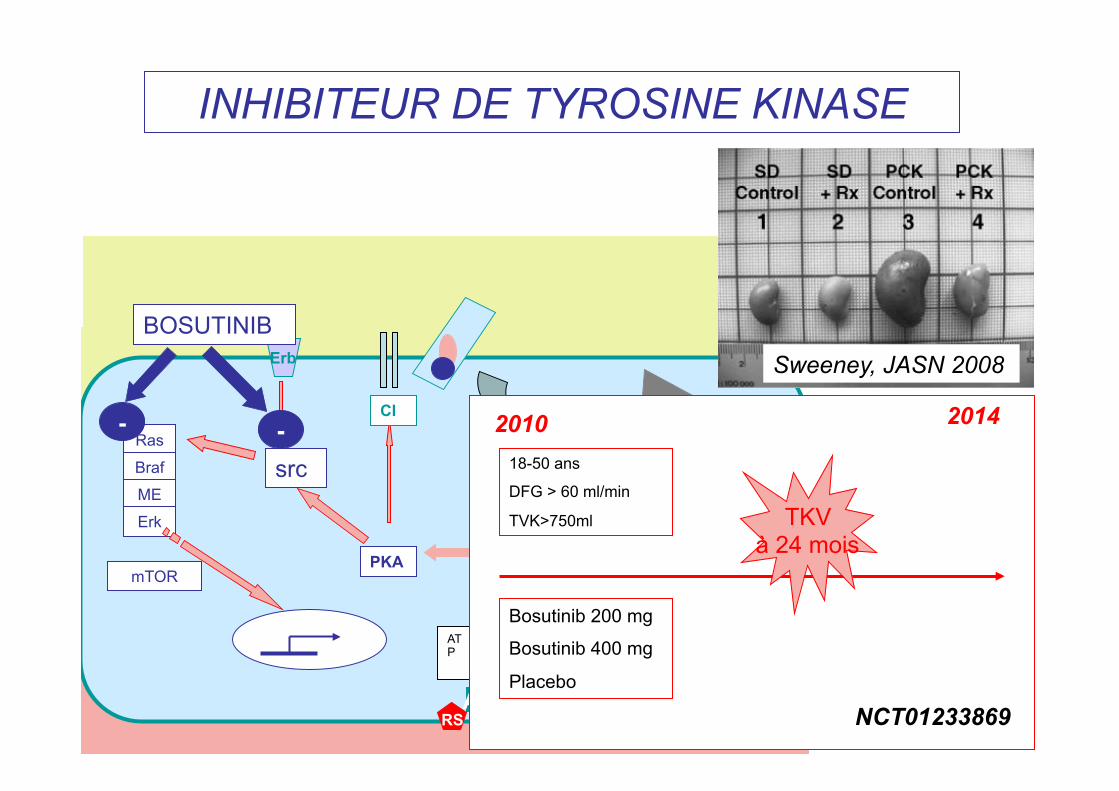
BOSUTINIB
INHIBITEUR DE TYROSINE KINASE
Sweeney, JASN 2008
Bosutinib 200 mg
Bosutinib 400 mg
Placebo
18-50 ans
DFG > 60 ml/min
TVK>750ml
2010 2014
TKV à 24 mois
NCT01233869
-
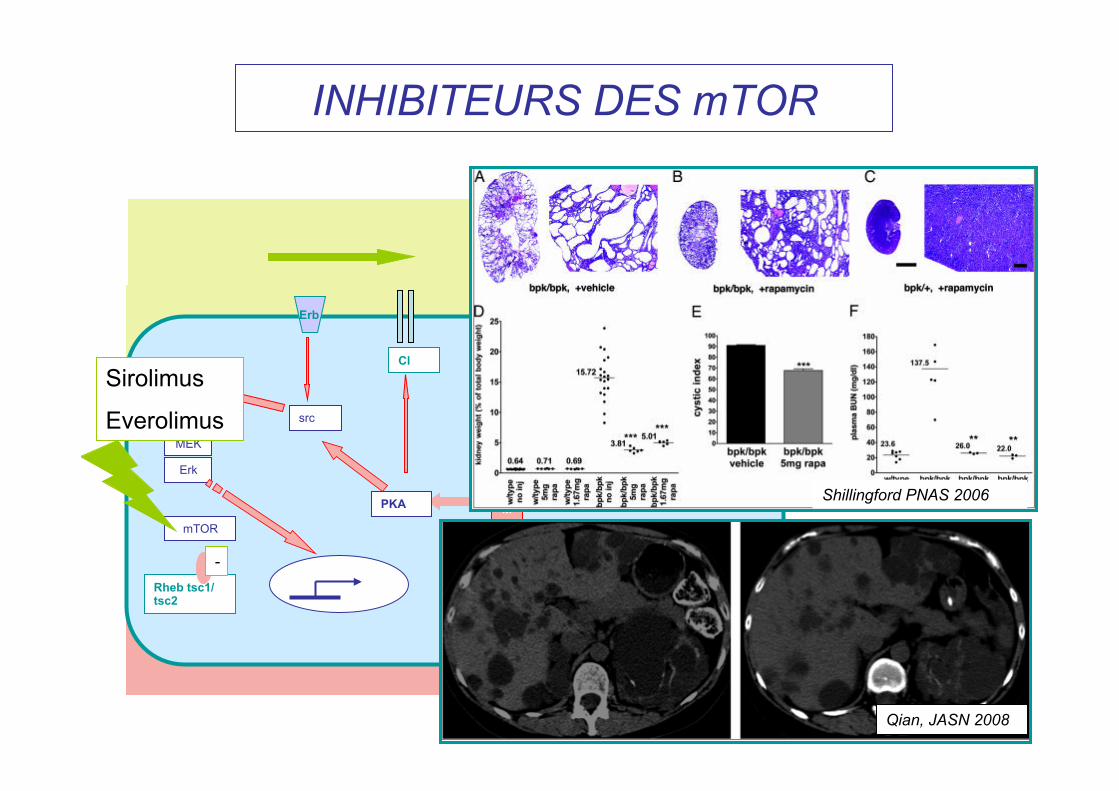
INHIBITEURS DES mTOR
pc1
pc2
Ca2+
ACVI RS V2R
ATP
AMPc
PKA
src
Ras
Braf
MEK
Erk
mTOR
Rheb tsc1/tsc2
Cl
Erb
Sirolimus
Everolimus
-
Shillingford PNAS 2006
Qian, JASN 2008
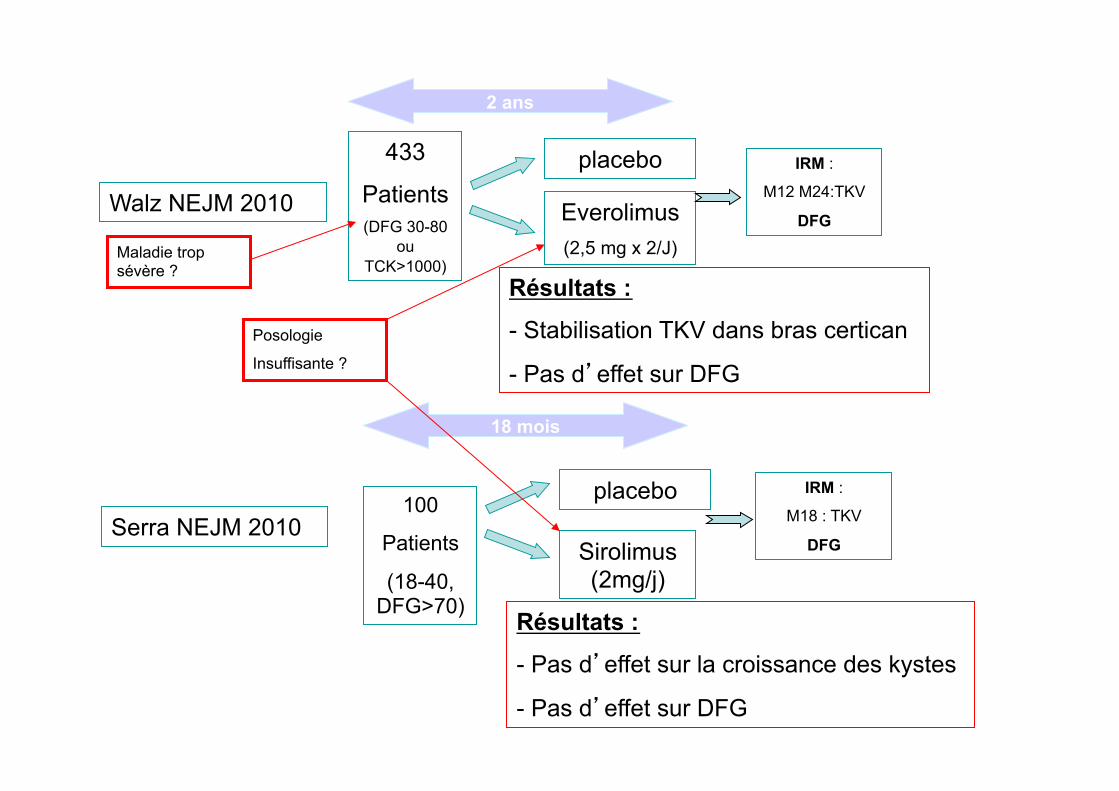
Walz NEJM 2010
433
Patients (DFG 30-80
ou TCK>1000)
2 ans
Everolimus (2,5 mg x 2/J)
placebo IRM :
M12 M24:TKV
DFG
Serra NEJM 2010 100
Patients
(18-40, DFG>70)
18 mois
Sirolimus (2mg/j)
placebo IRM :
M18 : TKV
DFG
Résultats :
- Stabilisation TKV dans bras certican
- Pas d’effet sur DFG
Résultats :
- Pas d’effet sur la croissance des kystes
- Pas d’effet sur DFG
Posologie
Insuffisante ?
Maladie trop sévère ?
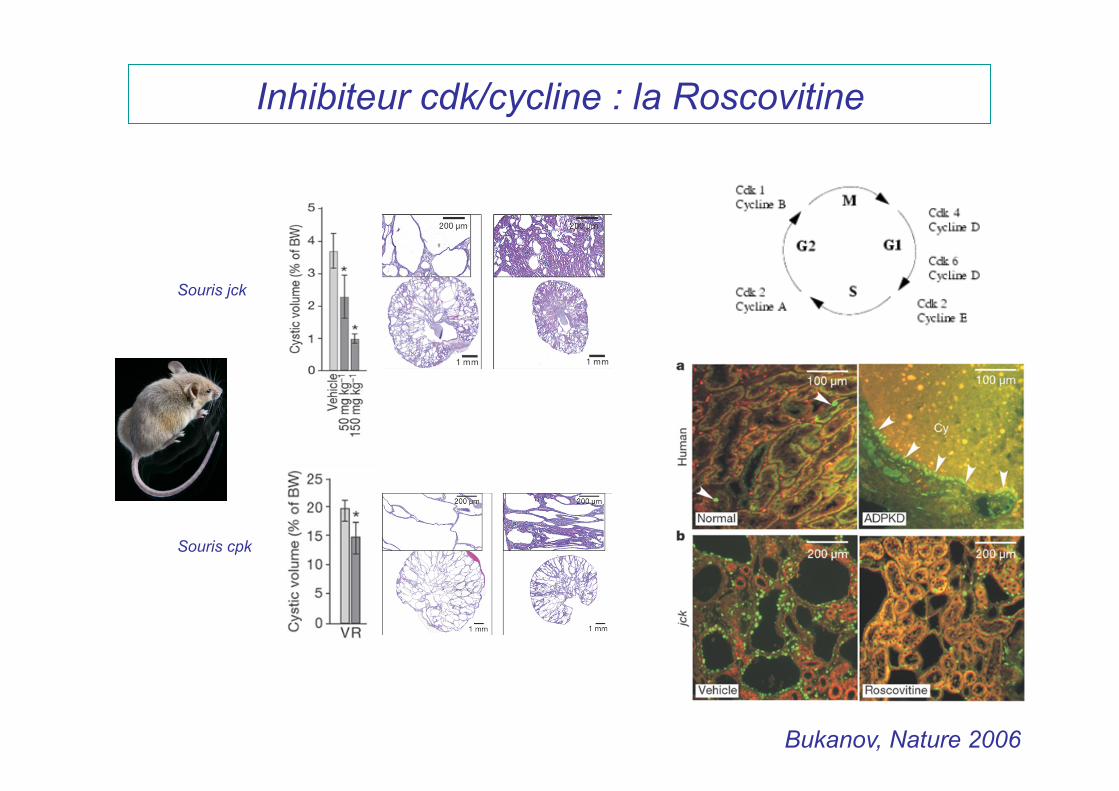
Inhibiteur cdk/cycline : la Roscovitine
Souris jck
Souris cpk
Bukanov, Nature 2006
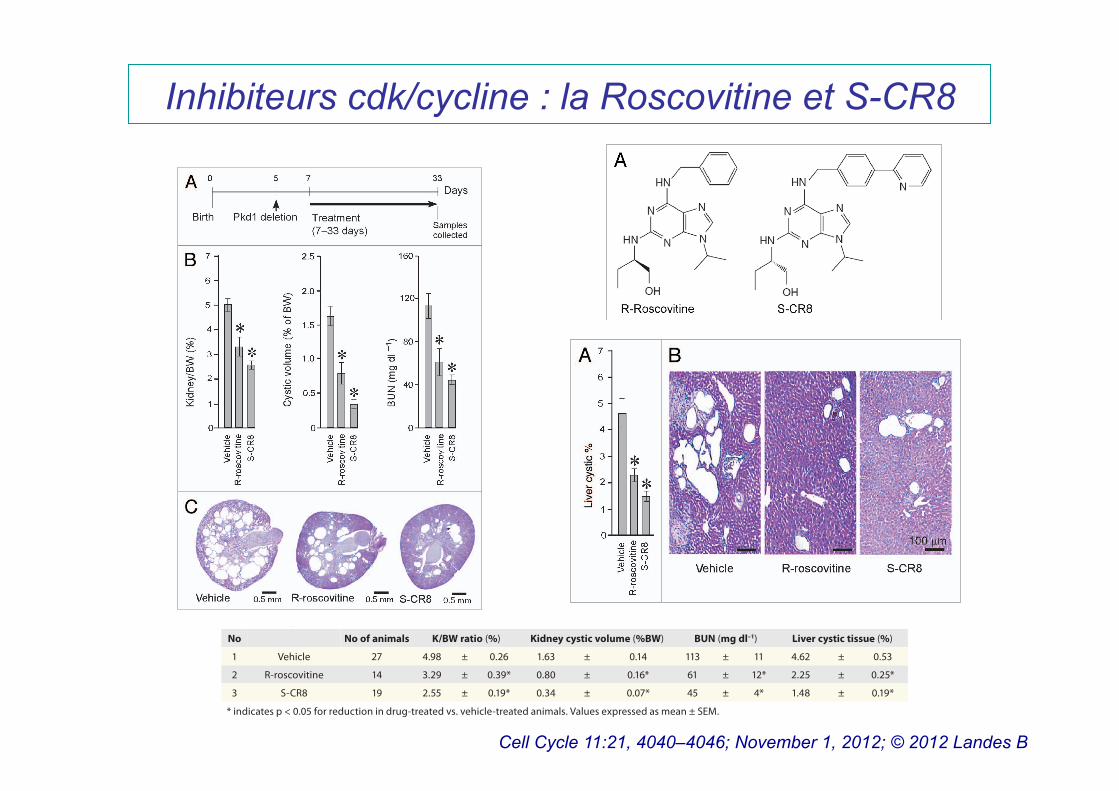
Inhibiteurs cdk/cycline : la Roscovitine et S-CR8
Cell Cycle 11:21, 4040–4046; November 1, 2012; © 2012 Landes B
©20
12 L
ande
s B
iosc
ienc
e. D
o no
t dis
tribu
te.
4042 Cell Cycle Volume 11 Issue 21
ADPKD has been made in recent years, providing the foundation for translation of preclinical therapeutic approaches into clinical development.7,36 Of particular interest is a recent discovery that proteins disrupted in ADPKD and other forms of cystic diseases map to a common site: primary cilia.21-23 There is a direct link between cilia, centrosomes and cell cycle dysregulation in PKD as reviewed in refs. 37 and 38. Through use of the CDK inhibitor R-roscovitine, we have recently shown that treatment of jck and cpk mice with slowly progressive and aggressive forms of PKD, respectively, resulted in a striking inhibition of cystic disease and improvement of renal function.29 Because these models do not carry mutations in Pkd1 or Pkd2 genes that are responsible for human ADPKD, therapeutic benefits of targeting the dysregu-lated cell cycle need to be validated in orthologous models. In fact, it has been previously shown that polycystins directly arrest
Assessment of CDK inhibitors effect on hepatic cystogene-sis. Because our Pkd1 cKO mice develop liver cysts in addition to PKD, we next examined the effect of CDK inhibition on hepatic cystogenesis. In contrast to kidney cystic disease, hepatic cysto-genesis appears to be much less severe under conditions we used to induce Pkd1 gene deletion (see Fig. 2A). At postnatal day 33, the sporadic surface cysts are usually visible in the vehicle-treated group with a cystic area accounting for less than 5% of the total hepatic area (Table 1). To assess the percentage of hepatic cysts, liver sections of animals treated with either vehicle or CDK inhib-itors R-roscovitine and S-CR8 were H&E stained, scanned with light microscopy and digitized followed by Metamorph analysis. Percentage of cystic liver tissue in mice treated with R-roscovitine and S-CR8 was significantly decreased as compared with the vehicle-treated group (Fig. 3A and B; Table 1). Similar to the effects on kidney cysts, S-CR8 was more effective in reducing liver cyst growth relative to R-roscovitine.
CDK inhibitors target dysregulated cell cycle and apop-tosis in cystic kidneys. To elucidate the mechanisms by which CDK inhibitors affect PKD in an orthologous mouse model, we probed key pathways of cystogenesis using western blotting of kidney lysates from Pkd1 cKO mice treated with CDK inhibitors R-roscovitine and S-CR8. First, we examined the effects of CDK inhibitors on cell cycle progression. As shown in Figure 4A, Rb phosphorylation (p-Rb) was significantly increased in Pkd1 cKO kidneys (indicating cell cycle activation) and decreased in samples treated with either R-roscovitine or S-CR8 (suggesting G1/S cell cycle inhibition). We also observed significant upregu-lation of cyclinD3 (cycD3) expression and decreased cyclinD1 phosphorylation at Thr286 (p-cycD1) in vehicle-treated cystic kidneys, indicative of cell cycle activation and reversal of these patterns in samples treated with CDK inhibitors. Activation of Erk1/2, known to regulate cyclinD1, was effectively inhibited in treated samples. PCNA levels were decreased in treated samples, indicating inhibition of proliferation. Overall, S-CR8 showed more effective cell cycle blockade compared with R-roscovitine (Fig. 4A).
Next, we tested the effect of CDK inhibitors on apoptosis in treated kidneys. As shown in Figure 4B, we detected increased apoptosis in Pkd1 cKO kidneys evident by induction of caspase 2, an initiator of the mitochondrial apoptotic pathway; caspase 8, an activator of extrinsic apoptotic pathway; as well as decreased Bcl-XL expression and increase in ApaF1, as compared with wild-type (WT) kidneys. Interestingly, aberrant expression of apoptotic markers was normalized in kidneys treated with R-roscovitine and to a lesser extent in kidneys treated with S-CR8.
We also examined the effect of R-roscovitine and S-CR8 on the level of RNA polymerase II-dependent transcription, as shown in Figure 4C. Both compounds decreased CDK7 expres-sion levels and effectively inhibited RNA pol II phosphorylation in treated kidneys.
Discussion
A significant progress in understanding the molecular mecha-nisms responsible for the development and progression of
Figure 2. CDK inhibitors R-roscovitine and S-CR8 inhibit renal cysto-genesis in Pkd1-conditional knockout mice. (A) Time frame of induc-tion of Pkd1 deletion with tamoxifen and schedule of treatment with R-roscovitine and S-CR8. (B) Quantitative analysis of e!ect of R-rosco-vitine and S-CR8 on cystogenesis in kidney measured as kidney/body weight (BW) ratio, cystic volume and blood urea nitrogen (BUN); * p < 0.05 compared with vehicle control. Error bars indicate SEM; (C) Repre-sentative kidney sections (H&E staining) from treated mice and vehicle control suggest preservation of kidney parenchyma in animals treated with CDK inhibitors as compared with vehicle-treated group.
©20
12 L
ande
s B
iosc
ienc
e. D
o no
t dis
tribu
te.
www.landesbioscience.com Cell Cycle 4043
of S-CR8 in cellular cystic assay parallels previous findings on the survival of several tumor cell lines.34 It is possible that cellular effects of S-CR8 represent cumulative or synergistic effects on a subset of specific CDKs. In addition, target accessibility within a cell, permeability and subcellular compartment localiza-tion may also contribute to the observed differences in cellular assays.
Unlike tumorigenesis, cystogenesis is accompa-nied by an increase in apoptosis shown to be causally linked to cystic transformation: deletion of anti-apoptotic Bcl-2 and AP-2β genes in mice results in cystic disease.41,42 Also, in vitro formation of cysts by MDCK cells grown in collagen matrix is accompa-nied by increased apoptosis.43 Direct inhibition of apoptosis in vivo was shown to ameliorate PKD in mouse models.44 It has been proposed that an imbal-ance between pro-apoptotic and pro-proliferative fac-tors plays a critical role in the development of cystic kidney disease.10 Our data suggest that anti-prolifer-ative mechanistic effects of R-roscovitine and S-CR8 combined with their anti-apoptotic effects seen in Pkd1 cKO-treated kidneys are responsible for thera-peutic efficacy.
Cystic epithelial cells in multiple forms of PKD are characterized by increased rates of both prolif-
eration and apoptosis. Given the structural similarity between R-roscovitine and S-CR8 and similar kinase-inhibitory profiles, it is expected that they induce similar molecular responses in treated cells. Indeed, both compounds affected cell cycle and apoptosis in treated samples. At the same time, we observed some subtle differences between the two compounds. Specifically, S-CR8 showed a mechanistically stronger effect on cell cycle machinery, but a somewhat milder effect on attenuation of apoptosis relative to R-roscovitine. Notably, S-CR8 demon-strated better in vivo efficacy than R-roscovitine in reducing cystogenesis and preserving renal function, suggesting that dys-regulated cell cycle and proliferation rather than apoptosis may play a pivotal role in promoting cystogenesis in the Pkd1 cKO model.
The relationship between proliferation and apoptosis in ADPKD is complex and not completely understood. While cas-pase inhibition slowed cystic disease progression in Han:SPRD rats, effective rapamycin treatment of the orpk-rescue mouse model and Pkd1 cKO model was associated with increased apop-tosis.17,44,45 It has been shown recently that Cdc25A plays an important role in driving renal and hepatic cystogenesis in several animal models, providing further support for a key role of cell
cell cycle progression in G1 through mechanisms that converge on the induction of p21 and CDK2 inhibition and are important in maintaining centrosome integrity.24-26 Herein, we demonstrate effective blockade of PKD in an orthologous model of ADPKD with a conditionally inactivated Pkd1 gene using the CDK inhib-itors R-roscovitine and S-CR8, a more potent and selective ana-log. Unlike many of the first generation CDK inhibitors that lack specificities and target multiple families of kinases, roscovitine is a highly selective, orally bioavailable compound targeting a small subset of CDKs that have been tested in clinical settings.39,40 The need to further improve its relatively low potency and metabolic stability has led to the generation of an improved, highly potent derivative, S-CR8.33
Mechanistic studies showed effective blockade of the cell cycle, attenuation of apoptosis and transcriptional inhibition with both R-roscovitine and S-CR8. Notably, both compounds displayed similar protein kinase selectivity profiles character-ized by targeting CDK2/cyclinA, CDK2/cyclinE, CDK5/p25, CDK7/cyclinH and CDK9/cyclinT with approximately 2–3-fold greater potency of S-CR8 for each individual target.33 On the other hand, S-CR8 showed ~80-fold greater potency over R-roscovitine in cellular assay. This remarkably potent effect
Table 1. Anti-cystic effect of CDK inhibitors R-roscovitine and S-CR8 in Pkd1 cKO mice
No No of animals K/BW ratio (%) Kidney cystic volume (%BW) BUN (mg dl–1) Liver cystic tissue (%)
1 Vehicle 27 4.98 ± 0.26 1.63 ± 0.14 113 ± 11 4.62 ± 0.53
2 R-roscovitine 14 3.29 ± 0.39* 0.80 ± 0.16* 61 ± 12* 2.25 ± 0.25*
3 S-CR8 19 2.55 ± 0.19* 0.34 ± 0.07* 45 ± 4* 1.48 ± 0.19*
* indicates p < 0.05 for reduction in drug-treated vs. vehicle-treated animals. Values expressed as mean ± SEM.
Figure 3. CDK inhibitors R-roscovitine and S-CR8 e!ectively inhibit hepatic cysto-genesis in Pkd1 cKO mice. (A) Quantitative assessment of e!ects of R-roscovitine and S-CR8 on percentage of liver cysts. * p < 0.05 compared with vehicle control. Hepatic cystic areas are decreased in R-roscovitine and S-CR8-treated animals. Data are expressed as means ± SEM. (B) Representative light microscopic (H&E staining) images of liver sections from animals treated with R-roscovitine, S-CR8 and vehicle. Treatment with R-roscovitine and S-CR8 reduced hepatic cystogenesis. Scale bars, 100 μm.
©20
12 L
ande
s B
iosc
ienc
e. D
o no
t dis
tribu
te.
www.landesbioscience.com Cell Cycle 4041
REPORT REPORT
Results
CDK inhibitor S-CR8 potently inhibits cystogenesis in vitro. To improve drug-like properties of R-roscovitine (metabolic sta-bility, potency and selectivity), extensive medicinal chemistry studies identified a new and improved analog S-CR8, shown in Figure 1A.33,34 We have used a standard assay of MDCK cys-togenesis in vitro to assess potency of S-CR8 as described pre-viously.29,35 R-roscovitine was tested in parallel for comparison. MDCK cysts were grown in 96-well plates containing collagen gel with FBS-containing media for 4 d. Increasing concentrations of compounds were added to cysts and incubated for additional 4 d. Percent of inhibition of cystogenesis by each compound was mea-sured by standard Alamar Blue assay (Fig. 1B) and confirmed by visual observation of cultured cysts under light microscope (not shown). The assay showed that both R-roscovitine and S-CR8 compounds reduce cyst formation in vitro in a dose-dependent manner with an IC50 of 16 μM and 0.2 μM, respectively. These data indicate that S-CR8 is approximately 80-fold more potent than R-roscovitine in cellular assay. This observation is in agree-ment with previously published data suggesting greater antitu-mor potency for S-CR8 compared with R-roscovitine in multiple cell lines (100-fold on the average of more than 65 cell lines).33
R-roscovitine and S-CR8 effectively inhibit renal cystic dis-ease progression in Pkd1-conditional knockout mice. To deter-mine whether CDK inhibition is an effective approach for the treatment of ADPKD, we sought to demonstrate the effect of R-roscovitine in an orthologous mouse model. This model has a germline Pkd1-null allele (Pkd1tm1Gzbd), a conditional knock-out allele with lox sites flanking exons 21–23 (Pkd1tm1Gztn) and a tamoxifen-inducible Cre-gene.32 As shown previously, condi-tional inactivation of the Pkd1 gene at day 5 results in a rapid onset PKD that is gender-independent.32 Cysts in the liver are also observed in this model. Similar to other models with con-ditionally inactivated Pkd1 gene, the majority of cysts originate from distal nephron segments and collecting ducts.17 In the cur-rent study, cystogenesis was induced with tamoxifen at postnatal day 5. Animals received daily injections of either R-roscovitine (100 mg/kg IP, once a day) or vehicle control from day 7–33 (Fig. 2A). The R-roscovitine-treated group showed a significant inhibition of PKD, evident by a decrease in kidney to body weight ratio, cystic volume and blood urea nitrogen (BUN) (Fig. 2B and Table 1). Effective reduction of cystic tissue in a representative R-roscovitine treated kidney is illustrated in Figure 2C.
In parallel, we also investigated the in vivo effect of S-CR8, a more potent and selective CDK inhibitor with a similar CDK inhibitory profile. Administration of S-CR8 (2.5 mg/kg IP, twice daily) was highly effective in inhibiting PKD progression in the conditional Pkd1-knockout model (Fig. 2A–C). Both com-pounds were equally well-tolerated in the course of treatment. As expected, S-CR8 was more dose-potent and showed greater PKD inhibition compared with R-roscovitine. Overall, these data support the conclusion that CDK inhibitors R-roscovitine and S-CR8 are effective in attenuating the progression of renal cystogenesis and improving kidney function in an orthologous Pkd1-linked mouse model of ADPKD.
differentiation of tubular epithelial cells.25 Polycystin-2 is capable of binding helix-loop-helix protein Id2 and preventing its trans-location to the nucleus, thus blocking cell cycle progression.26 The translocation of Id2 in cells with mutated polycystins is linked to downregulation of p21 leading to increase of CDK2 activity and cell cycle progression.
We have shown previously that pharmacological inhibi-tion of cell cycle progression with the cyclin-dependent kinase (CDK) inhibitor R-roscovitine effectively attenuates cystogenesis in jck and cpk models of PKD.27-30 Mechanistic studies demon-strated that roscovitine inhibited cystogenesis through cell cycle arrest, transcriptional regulation and inhibition of apoptosis. Importantly, roscovitine treatment suppressed cAMP and aqua-porin 2 in the cystic kidneys, suggesting that CDK inhibition targets the most proximal step in cystogenesis.31
To further validate CDK inhibition as an approach to treat ADPKD, preclinical efficacy needs to be established in an orthol-ogous model. The goals of this study were to confirm efficacy of R-roscovitine in an orthologous mouse model of ADPKD with a conditionally inactivated Pkd1 gene (Pkd1 cKO)32 and to assess the efficacy of the second generation analog of roscovitine, S-CR8, a more potent and selective CDK inhibitor.33 We demon-strate effective inhibition of both renal and hepatic cystogenesis with R-roscovitine and S-CR8 compounds. Mode of action stud-ies demonstrate that both compounds act through blockade of cell cycle and proliferation and attenuation of apoptosis.
Figure 1. Comparative analysis of inhibitory activities of CDK inhibitors S-CR8 and R-roscovitine on cystogenesis in vitro. (A) Chemical struc-tures of R-roscovitine and its derivative, S-CR8. (B) In vitro inhibition of cystic growth in MDCK 3D collagen-based assay. Values were measured in quadruplets in two independent experiments.
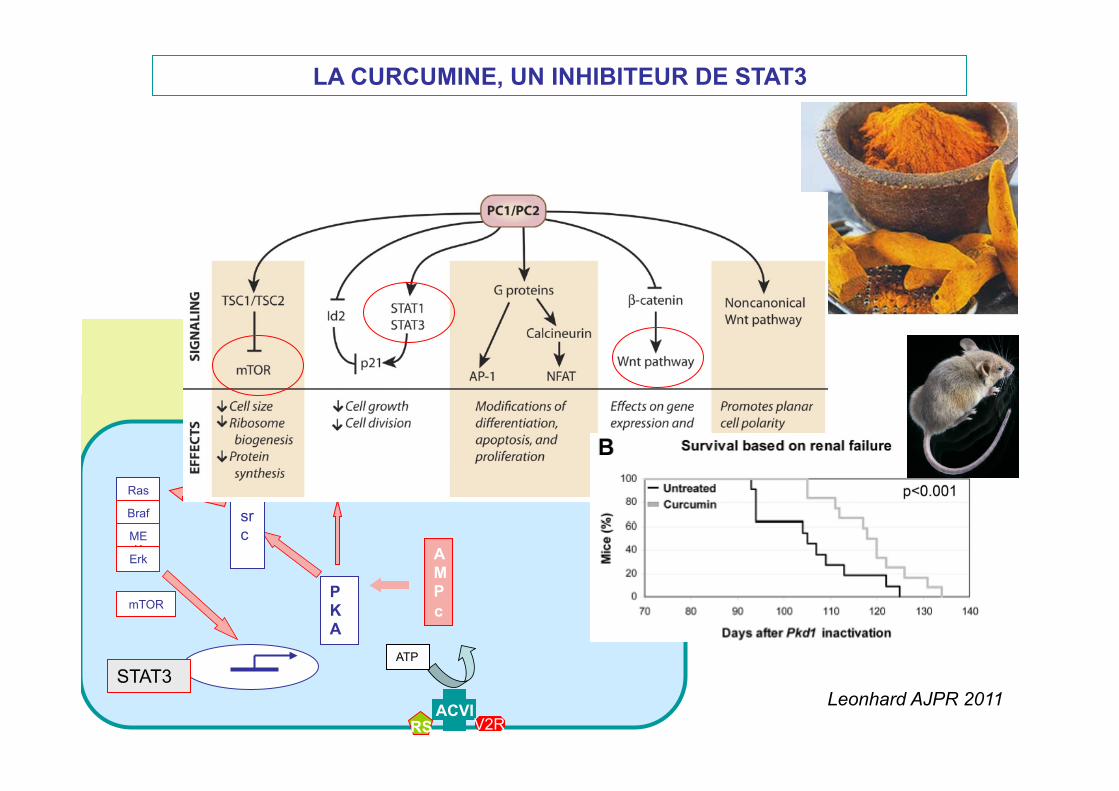
LA CURCUMINE, UN INHIBITEUR DE STAT3
ACVI RS V2R
ATP
AMPc
PKA
src
Ras
Braf
MEK
Erk
mTOR
Cl
Erb CFTR
STAT3
Chapin, JCB 2010
Leonhard AJPR 2011

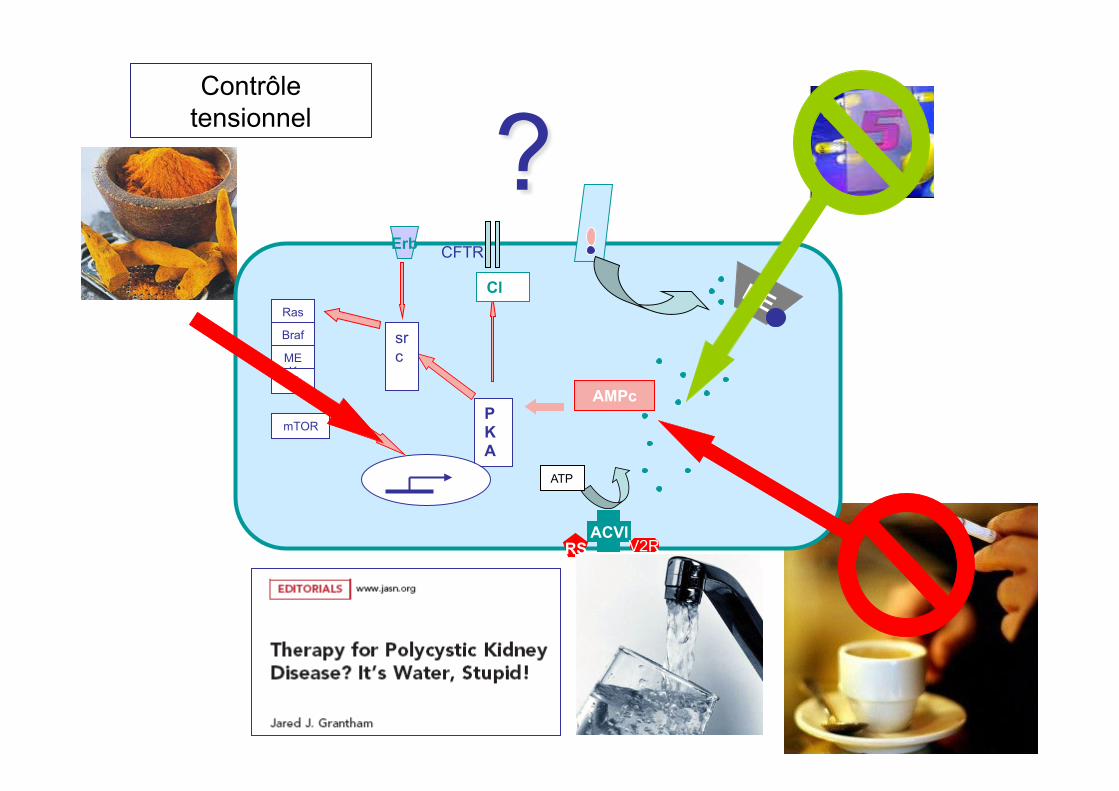
ET EN ATTENDANT, QUE FAIRE ?
ACVI RS V2R
ATP
AMPc PKA
src
Ras
Braf
MEK
Erk
mTOR
Cl
Erb CFTR
? Contrôle
tensionnel
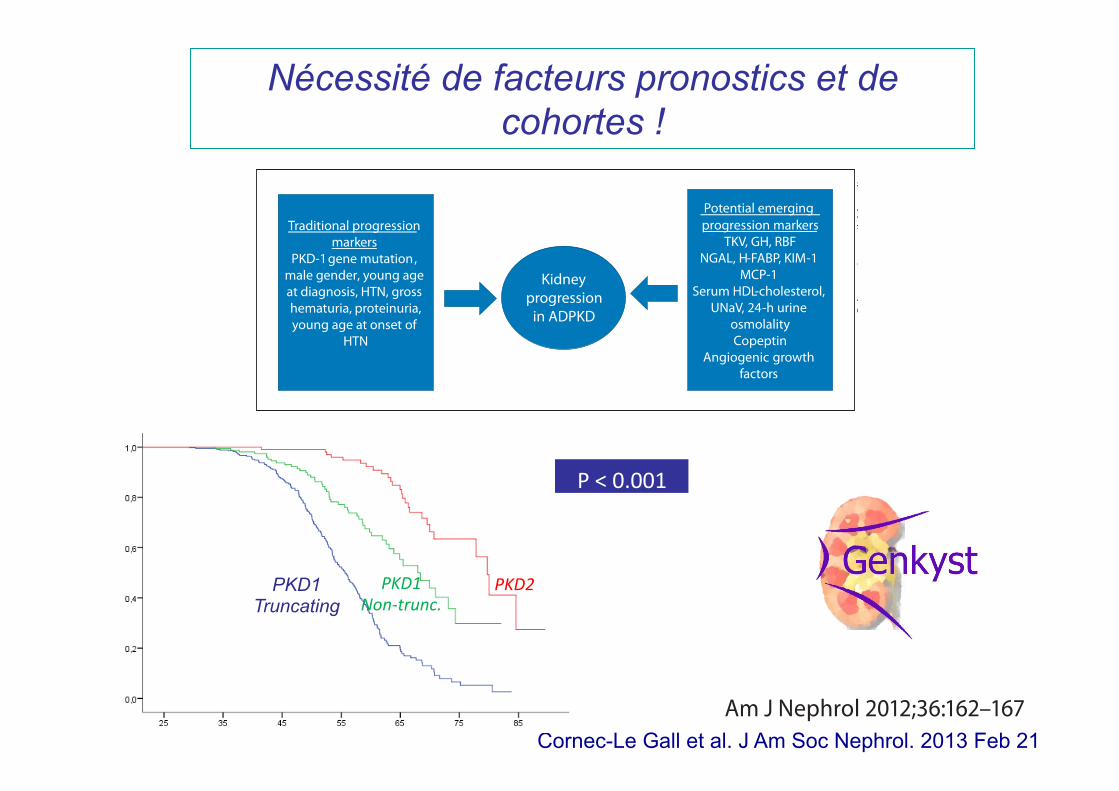
Nécessité de facteurs pronostics et de cohortes !
Markers of Polycystic Kidney Disease Am J Nephrol 2012;36:162–167 163
apy in treating hypertension in ADPKD. While cause and effect remains to be proven, there are several epidemio-logical studies which demonstrate improved prognosis in ADPKD in association with better control of hyperten-sion and RAS inhibition [11, 12] . Nevertheless, even with this improved care which has been associated with later progression to ESRD [11] and improved survival [12] in ADPKD, there is a great need to identify early risk factors and more definitive treatment.
Currently, kidney function in ADPKD patients is monitored by observing changes in serum creatinine and estimated GFR. However, kidney function may remain preserved until the 4th to 6th decade of life, when ad-vanced renal cystic involvement has occurred. Clinical markers are therefore needed to identify the early pro-gression of ADPKD. Recent advances have led to greater understanding of the mechanisms of ADPKD and sev-eral potential early markers have been found to be associ-ated with renal disease progression ( fig. 1 ).
Total Kidney Volume
ADPKD is a systemic disorder characterized by gross enlargement of the kidneys over time due to multiple cysts that originate from the tubular epithelium of the nephrons. Recent evidence indicates that the progressive increase in kidney volume in patients with ADPKD is primarily due to the accumulation of fluid within innu-merable cysts and the proliferation of mural epithelial cells [13, 14] . It is evident that kidneys of patients with ADPKD progressively increase in volume beginning at birth and progress through life. [14] . According to sev-eral cross-sectional and longitudinal human studies, an inverse correlation between GFR and total kidney volume (TKV) has been described [3, 15–17] . The Consortium for
Radiologic Imaging Studies of Polycystic Kidney Disease study (CRISP) funded by the National Institutes of Health was established to develop methods that reliably measure disease progression in ADPKD over a relatively short pe-riod of time [15] . The CRISP cohort confirmed with MRI that cystic growth and renal enlargement is significant prior to impairment of renal function [15] , as had been shown with renal ultrasound [16] . The CRISP cohort also revealed that normotensive patients have smaller cyst and renal volumes compared to hypertensive counterparts [15] . Renal ultrasound studies in children have also dem-onstrated this relationship between kidney volumes and blood pressure [8] . Longitudinal studies of animal mod-els support the hypothesis that reducing the rate of kid-ney volume enlargement may improve kidney prognosis in ADPKD patients [14] .
Noninvasive radiologic methods have therefore been developed to monitor the rates of renal cyst and volume enlargement in ADPKD patients [18, 19] . Thus, it hasbeen proposed that TKV can be used as a marker ofADPKD progression. For clinicians, incorporating mea-surements of TKV by ultrasonography [16] , computed to-mography [18] or MRI [15] may allow prediction of the kidney enlargement rate of ADPKD patients [3, 20] . More-over, intervals as short as 6–12 months between measure-ments may be adequate to determine an effect of treatment to reduce the rate of kidney volume progression [21] . Esti-mating the growth rate of TKV therefore can be important in stratifying at-risk ADPKD patients [16, 20] . The pa-tients with the more rapid kidney enlargement should be monitored more frequently and receive optimal care, in-cluding blood pressure control. There is a prospective, randomized study in hypertensive ADPKD patients which demonstrated that reversal of left ventricular hypertrophy was significantly better with a blood pressure goal of less than 120/80 mm Hg as compared to 140/90 mm Hg [22] .
Traditional progression markers
PKD-1 , gene mutationmale gender, young age at diagnosis, HTN, gross
proteinuria,hematuria,young age at onset of
HTN
Kidney progression
in ADPKD
Potential emerging progression markers
TKV, GH, RBF NGAL, H-FABP, KIM-1
MCP-1 Serum HDL-cholesterol,
UNaV, 24-h urine osmolality Copeptin
Angiogenic growth factors
Fig. 1. Mechanisms of ADPKD.
Colo
r ver
sion
ava
ilabl
e on
line
Fax +41 61 306 12 34E-Mail [email protected]
In-Depth Topic Review
Am J Nephrol 2012;36:162–167 DOI: 10.1159/000341263
Emergent Early Markers of Renal Progression in Autosomal-Dominant Polycystic Kidney Disease Patients: Implications for Prevention and Treatment
Imed Helal Berenice Reed Robert W. Schrier
Division of Renal Diseases and Hypertension, University of Colorado Denver, Aurora, Colo. , USA
Introduction
Autosomal-dominant polycystic kidney disease(ADPKD) is the primary genetic cause of kidney disease and the 4th most common cause of end-stage renal dis-ease (ESRD) after diabetes, hypertension and glomerulo-nephritis [1, 2] . ADPKD constitutes 2.3% of patients on chronic dialysis [2] , and may present with a faster decline in glomerular filtration rate (GFR) than other renal dis-eases [3] . The clinical course of ADPKD is highly vari-able, and progression to ESRD occurs between the 4th and 6th decades [4] , although severe disease may occur in children [5] . In adults with ADPKD, several risk factors for faster progression have been identified, including PKD-1 gene mutation, male gender, young age at diagno-sis, presence of hypertension, hematuria, proteinuria, and young age at onset of hypertension [4–7] .
Early onset of hypertension, even in childhood, has been found to occur in ADPKD [8] . Moreover, compared to matched patients with essential hypertension, plasma renin activity and aldosterone are more stimulated in hy-pertensive ADPKD patients [9] . Furthermore, all compo-nents of the renin-angiotensin system (RAS) have been found in ADPKD kidneys [10] . With the availability of RAS inhibitors, these agents have become the initial ther-
Key Words Autosomal-dominant polycystic kidney disease ! Kidney volume ! Hyperfiltration ! Renal blood flow
Abstract Autosomal-dominant polycystic kidney disease (ADPKD) is the most common single cause of end-stage renal disease after diabetes, hypertension and glomerulonephritis. The clinical course of ADPKD is highly variable. Even with optimal care and therapy monitoring, currently the progression of ADPKD is slowed but not stopped. Newer treatments will no doubt become available in the future, but their side effect profiles will always need to be considered. Therefore, mark-ers to distinguish ADPKD patients with a poor versus a good prognosis will be helpful. Several risk factors influencing kid-ney disease progression in ADPKD have been identified in the current era. The present review will discuss the spectrum of early markers of ADPKD renal disease progression. Spe-cifically, the volume of total kidney, hypertension, glomeru-lar hyperfiltration, renal blood flow, microalbuminuria, uric acid, and urinary molecular markers will be discussed. On this background, implications for the prevention and treat-ment of kidney disease progression in ADPKD are also dis-cussed.
Copyright © 2012 S. Karger AG, Basel
Received: February 6, 2012 Accepted June 22, 2012 Published online: July 26, 2012
NephrologyAmerican Journal of
Robert W. Schrier University of Colorado Denver , Division of Renal Diseases and Hypertension Box C-281, 1270 East 19th, RC2 7th f loor, Room 7001Aurora, CO 80045 (USA) Tel. +1 303 724 4837, E-Mail Robert.schrier @ ucdenver.edu
© 2012 S. Karger AG, Basel0250–8095/12/0362–0162$38.00/0
Accessible online at:www.karger.com/ajn
Cornec-Le Gall et al. J Am Soc Nephrol. 2013 Feb 21
PKD1 Truncating
PKD1 Non-‐trunc.
PKD2
P < 0.001

Merci pour votre attention