parametric design and multi-objective optimisation of … · 2020-01-21 · parametric design and...
TRANSCRIPT
Parametric design and multi-objective optimisation of
containerships
Alexandros PRIFTIS, Evangelos BOULOUGOURIS,
Osman TURAN
Department of Naval Architecture, Ocean and Marine
Engineering
University of Strathclyde
Glasgow, United Kingdom
Apostolos PAPANIKOLAOU
Hamburgische Schiffbau Versuchsanstalt GmbH
Hamburg, Germany
Abstract—The introduction of new regulations by the
International Maritime Organisation, the fluctuation of fuel price
levels, along with the continuous endeavour of the shipping
industry for economic growth and profits has led the
shipbuilding industry to explore new and cost-efficient designs
for various types of merchant ships. In this respect, proper use of
modern computer-aided design/computer-aided engineering
systems (CAD/CAE) extends the design space, while generating
competitive designs in short lead time. The present paper deals
with the parametric design and optimisation of containerships.
The developed methodology, which is based on the
CAESES/Friendship-Framework software system, is
demonstrated by the conceptual design and multi-objective
optimisation of a midsized, 6,500 TEU containership. The
methodology includes a complete parametric model of the ship’s
external and internal geometry and the development and coding
of all models necessary for the determination of the design
constraints and the design efficiency indicators, which are used
for the evaluation of parametrically generated designs. Such
indicators defining the objective functions of a multi-objective
optimisation problem are herein the energy efficiency design
index, the required freight rate, the ship’s zero ballast container
box capacity and the ratio of the above to below deck number of
containers. The set-up multi-objective optimisation problem is
solved by use of the genetic algorithms.
Keywords—parametric; design; holistic; multi-objective;
optimisation; containership
I. INTRODUCTION
A. Container shipping industry
Global containerised trade has been facing constant growth since 1996. It is worth mentioning that in 2014, there was a 5.3% growth, which can be translated to a total movement of 171 million TEUs in one year [1].
The fluctuation of fuel price has caused changes in the operation of ships. Since 2008, the fuel price has dropped and nowadays heavy fuel oil (HFO) costs as low as 250 $/t. Marine diesel oil (MDO) has been following similar course and can be found at prices of around 450 $/t [2]. However, this does not always result in lower shipping rates. The introduction of emission control areas (ECAs) has affected the fuel type ships use. Use of low sulphur fuel is now required in certain parts of
the world. The price difference between fuel types can be significant. Hence, it is imperative that cost-efficient designs are created to overcome this encumbrance [3].
Lately, the shipping industry has adopted several practices to reduce fuel consumption. One of them is slow steaming. Traveling at lower speeds, vessels can achieve major fuel savings, as well as lower energy efficiency design index (EEDI) levels [4, 5].
Port efficiency has become one of the most important factors in containership design. The less time containerships spend in port; the more time is available for cruising at sea. That can be translated to lower cruising speeds and reduced fuel consumption [6]. Thus, port efficiency is included in the optimisation criteria of this study.
B. State of international regulations
Recently, there have been developments in the international maritime regulations that greatly affect future ship designs and herein particularly container-ships.
One major development is the introduction of the EEDI [7, 8]. The EEDI relates the toxic gas emissions of a ship to her transportation work and is in fact an indicator of a vessel’s energy efficiency. The requirement for new ships started with some baseline values in 2013, which will be being lowered successively in three steps until 2025. It is evident that EEDI is a ship efficiency performance indicator that should be minimised in the frame of a ship design optimisation.
New rules have been recently developed regarding the control and management of ships’ ballast water and sediments and are applied to all ships as of September 2017 [9]. Although various systems and technologies dealing with ballast water treatment are currently available, their installation increases the overall building and operational costs. Therefore, research has been focusing lately at solutions to reduce the amount of required ballast water. This issue is magnified for containerships, which inherently carry more ballast water, even at the design load condition.
Finally, as far as safety regulations are concerned, a new generation of intact stability criteria is currently being developed by the IMO [10]. The introduction of ships with
newly developed characteristic and operation modes has challenged the assumption that the current criteria are sufficient to prove their stability. Hence, the new criteria, which will complement the existing regulations, will be performance-based and will address four modes of stability failure; parametric roll, pure loss of stability, stability under dead ship condition and surf-riding/broaching [11]. As far as containerships are concerned, parametric roll is one of the most important modes of stability failure [12]. Hence, the draft criteria of level 1 and 2 for parametric roll failure mode per SDC 2/WP.4 are applied as part of the optimisation process in this study.
II. PARAMETRIC CAD MODELLING
In recent years, several authors have presented significant CAD methodologies dealing with ship design process and inherently its optimisation [13, 14, 15]. A common characteristic of most of the earlier presented works is that they are dealing with specific aspects of ship design or with new system approaches to the design process. On the other hand, the present study deals with a fast, holistic optimisation of a 6,500 TEU containership, focusing on optimisation of the ship’s arrangements, while considering all side effects on ship design, operation and economy (Fig. 3) [16]. Holism is interpreted as a multi-objective optimisation of ship design and is based on the main idea that a system, along with its properties, should be viewed and optimised as a whole and not as a collection of parts [17].
A. Geometric model
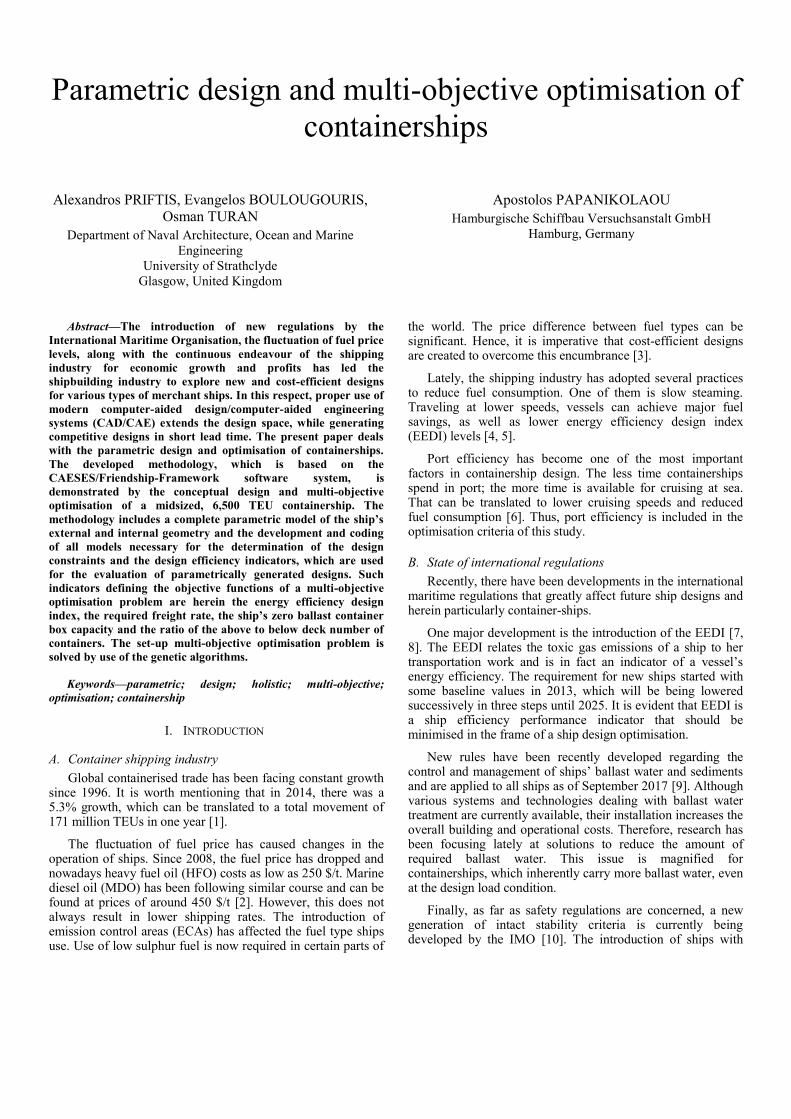
The model is produced within CAESES/Friendship-Framework [18] and consists of four main parts; the aft body, the fore body, the main frame and the main deck (Fig. 1). Several parameters are defined at this stage to control certain parts of the hull.
Fig. 1. Modelled aft and fore body
To create an adequately faired and smooth hull surface, a Lackenby transformation takes place [19]. By adjusting the prismatic coefficient (cP) and the longitudinal centre of buoyancy (LCB), the final hull of the model is produced [20].
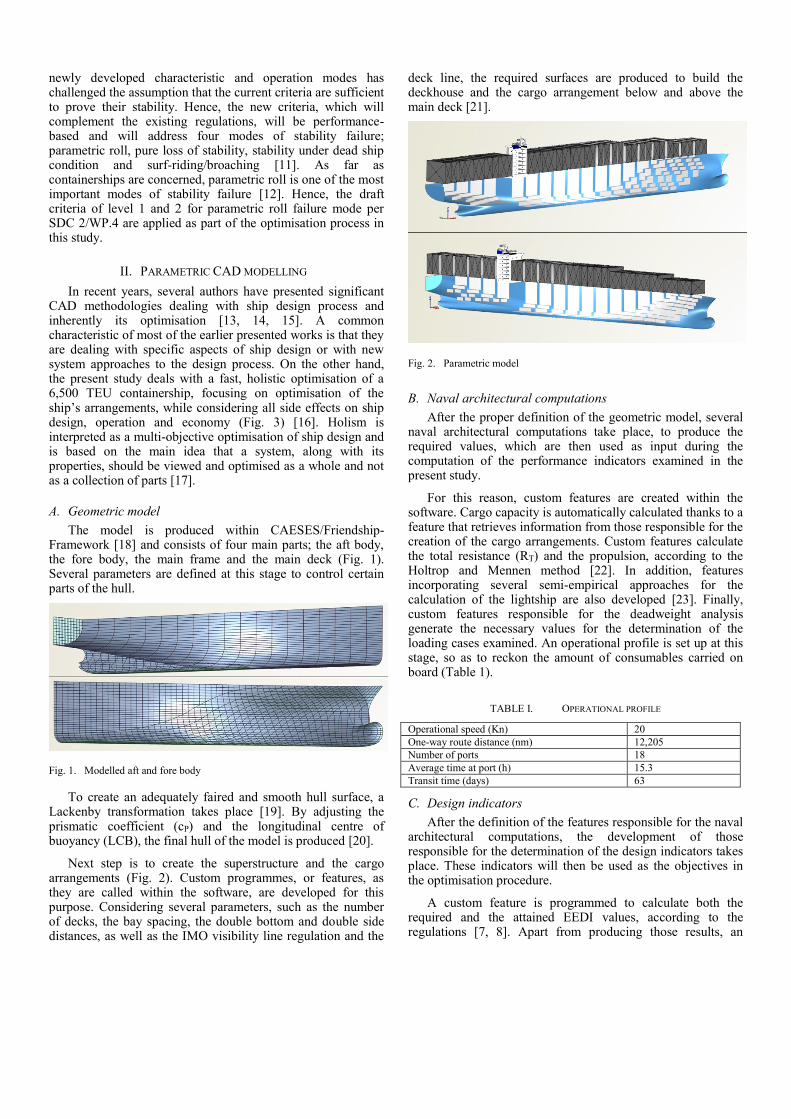
Next step is to create the superstructure and the cargo arrangements (Fig. 2). Custom programmes, or features, as they are called within the software, are developed for this purpose. Considering several parameters, such as the number of decks, the bay spacing, the double bottom and double side distances, as well as the IMO visibility line regulation and the
deck line, the required surfaces are produced to build the deckhouse and the cargo arrangement below and above the main deck [21].
Fig. 2. Parametric model
B. Naval architectural computations
After the proper definition of the geometric model, several naval architectural computations take place, to produce the required values, which are then used as input during the computation of the performance indicators examined in the present study.
For this reason, custom features are created within the software. Cargo capacity is automatically calculated thanks to a feature that retrieves information from those responsible for the creation of the cargo arrangements. Custom features calculate the total resistance (RT) and the propulsion, according to the Holtrop and Mennen method [22]. In addition, features incorporating several semi-empirical approaches for the calculation of the lightship are also developed [23]. Finally, custom features responsible for the deadweight analysis generate the necessary values for the determination of the loading cases examined. An operational profile is set up at this stage, so as to reckon the amount of consumables carried on board (Table 1).
TABLE I. OPERATIONAL PROFILE
Operational speed (Kn) 20
One-way route distance (nm) 12,205
Number of ports 18
Average time at port (h) 15.3
Transit time (days) 63
C. Design indicators
After the definition of the features responsible for the naval architectural computations, the development of those responsible for the determination of the design indicators takes place. These indicators will then be used as the objectives in the optimisation procedure.
A custom feature is programmed to calculate both the required and the attained EEDI values, according to the regulations [7, 8]. Apart from producing those results, an
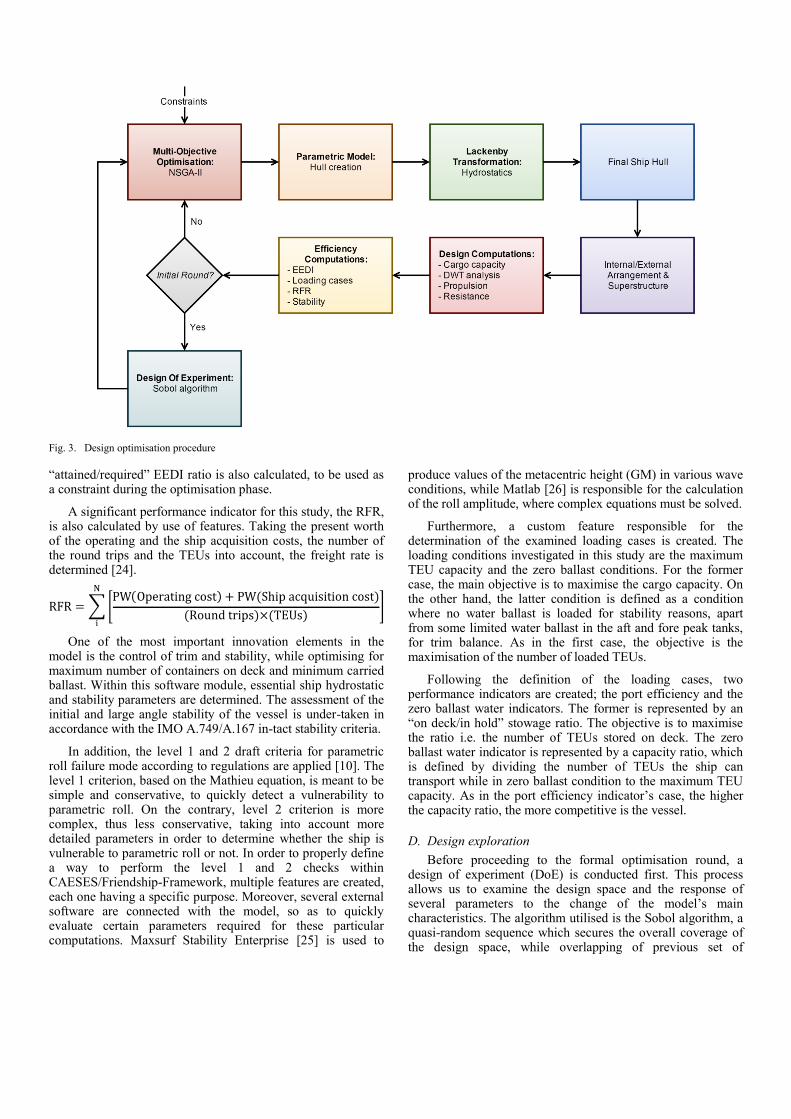
Fig. 3. Design optimisation procedure
“attained/required” EEDI ratio is also calculated, to be used as a constraint during the optimisation phase.
A significant performance indicator for this study, the RFR, is also calculated by use of features. Taking the present worth of the operating and the ship acquisition costs, the number of the round trips and the TEUs into account, the freight rate is determined [24].
One of the most important innovation elements in the model is the control of trim and stability, while optimising for maximum number of containers on deck and minimum carried ballast. Within this software module, essential ship hydrostatic and stability parameters are determined. The assessment of the initial and large angle stability of the vessel is under-taken in accordance with the IMO A.749/A.167 in-tact stability criteria.
In addition, the level 1 and 2 draft criteria for parametric roll failure mode according to regulations are applied [10]. The level 1 criterion, based on the Mathieu equation, is meant to be simple and conservative, to quickly detect a vulnerability to parametric roll. On the contrary, level 2 criterion is more complex, thus less conservative, taking into account more detailed parameters in order to determine whether the ship is vulnerable to parametric roll or not. In order to properly define a way to perform the level 1 and 2 checks within CAESES/Friendship-Framework, multiple features are created, each one having a specific purpose. Moreover, several external software are connected with the model, so as to quickly evaluate certain parameters required for these particular computations. Maxsurf Stability Enterprise [25] is used to
produce values of the metacentric height (GM) in various wave conditions, while Matlab [26] is responsible for the calculation of the roll amplitude, where complex equations must be solved.
Furthermore, a custom feature responsible for the determination of the examined loading cases is created. The loading conditions investigated in this study are the maximum TEU capacity and the zero ballast conditions. For the former case, the main objective is to maximise the cargo capacity. On the other hand, the latter condition is defined as a condition where no water ballast is loaded for stability reasons, apart from some limited water ballast in the aft and fore peak tanks, for trim balance. As in the first case, the objective is the maximisation of the number of loaded TEUs.
Following the definition of the loading cases, two performance indicators are created; the port efficiency and the zero ballast water indicators. The former is represented by an “on deck/in hold” stowage ratio. The objective is to maximise the ratio i.e. the number of TEUs stored on deck. The zero ballast water indicator is represented by a capacity ratio, which is defined by dividing the number of TEUs the ship can transport while in zero ballast condition to the maximum TEU capacity. As in the port efficiency indicator’s case, the higher the capacity ratio, the more competitive is the vessel.
D. Design exploration
Before proceeding to the formal optimisation round, a design of experiment (DoE) is conducted first. This process allows us to examine the design space and the response of several parameters to the change of the model’s main characteristics. The algorithm utilised is the Sobol algorithm, a quasi-random sequence which secures the overall coverage of the design space, while overlapping of previous set of
sequences is avoided [27]. Through the DoE, the investigation of the feasibility boundaries is ultimately achieved, allowing us to detect the trends of the design variables (Table 2) regarding the optimisation objectives. In our case, the design engine is assigned to create 250 variants of the initial model.
TABLE II. DESIGN VARIABLES
Design variable Min. value Max. value
Bays 18 20
Rows 14 18
Tiers in hold 8 10
Tiers on deck 6 8
Double bottom (m) 2.00 2.75
Double side (m) 2.00 2.75
ΔcP -0.06 0.06
ΔLCB -0.026 0.026
Bilge radius (m) 4 6
Moreover, the constraints are set (Table 3), to have a clear view of which of the subsequent variants violate criteria that must be met.
TABLE III. DESIGN CONSTRAINTS
Constraint Value
“Attained/Required” EEDI ≤ 1
GZ area (0-30 deg) ≥ 0.055 m-rad
GZ area (0-40 deg) ≥ 0.09 m-rad
GZ area (30-40 deg) ≥ 0.03 m-rad
Initial GM ≥ 0.15 m
Angle at GZmax ≥ 30 deg
GZmax ≥ 0.2 m
Homo weight/TEU (max. TEU capacity) ≥ 6 t
Homo weight/TEU (Z.B. condition) ≥ 7 t
Trim at full load departure condition ≤ 0.5% LBP
Parametric roll criteria = 1 (pass)
E. Multi-objective optimisation
The last step to complete our work is to run the formal optimisation round. To achieve that, the non-dominated sorting genetic algorithm II (NSGA-II) is utilised [28]. During each run, five generations are created, having a population size of fifty-two, each. The design variable extents remain the same, as the design space proved to be well defined, following the DoE phase. As far as the constraints are concerned, apart from the ones defined in the previous stage, two additional are set to delimit the maximum TEU capacity of the ship variants. Therefore, an upper (7,000 TEUs) and lower (6,000 TEUs) limit is defined. Unlike the previous phase, in this case, apart from the evaluation of various parameters of the model, several objectives are defined:
Minimisation of the RFR
Maximisation of the capacity ratio
Minimisation of the EEDI
Maximisation of the stowage ratio
Minimisation of the overall ship resistance
The results of a multi-disciplinary optimization procedure might not provide a straightforward solution to a problem. For this reason, several case scenarios are created, to determine the
optimal of the top solutions to the problem. In our project, three distinctive scenarios are defined, where the significance of each objective is acknowledged differently by assigning specific “weights” following the utility functions technique of decision making theory (Table 4). In scenario 1, all 5 explored objectives are equally important. On the other hand, in scenarios 2 and 3, the RFR and capacity ratio are chosen to be more significant for the decision maker (designer, operator).
TABLE IV. CASE SCENARIOS
Objective Scenario 1 Scenario 2 Scenario 3
RFR 20% 50% 20%
Capacity ratio 20% 20% 50%
EEDI 20% 10% 10%
Stowage ratio 20% 10% 10%
Ship resistance 20% 10% 10%
After obtaining the results of each run, the data is normalised according to the scenarios. Afterwards, the normalised data is ranked, to find the optimal variant of our model.
III. DISCUSSION OF RESULTS
A. Base model
Before proceeding to the actual results, some essential information about the base model is presented, in order to have a clear perspective of the initial hull (Tables 5-6).
TABLE V. BASE MODEL DESIGN VARIABLE VALUES
Design variable Base model value
Bays 19
Rows 16
Tiers in hold 9
Tiers on deck 6
Double bottom (m) 2.0
Double side (m) 2.1
ΔcP -0.01125
ΔLCB -0.00375
Bilge radius (m) 5
TABLE VI. BASE MODEL DESIGN OBJECTIVE VALUES
Objective Base model value
RFR ($/TEU) 582.35
Capacity ratio 0.5206
EEDI 8.80
Stowage ratio 0.9451
Ship resistance (kN) 1559
B. Design of experiment
The DoE phase enables the exploration of the huge design space, which is impossible in traditional ship design procedures. The following observations can be made.
As far as the correlation between the number of bays and the RFR is concerned, it is evident that as the former increases, the values of the latter appear in lower numbers. The same behaviour can be observed as to the dependency on number of rows (Figs 4-5).
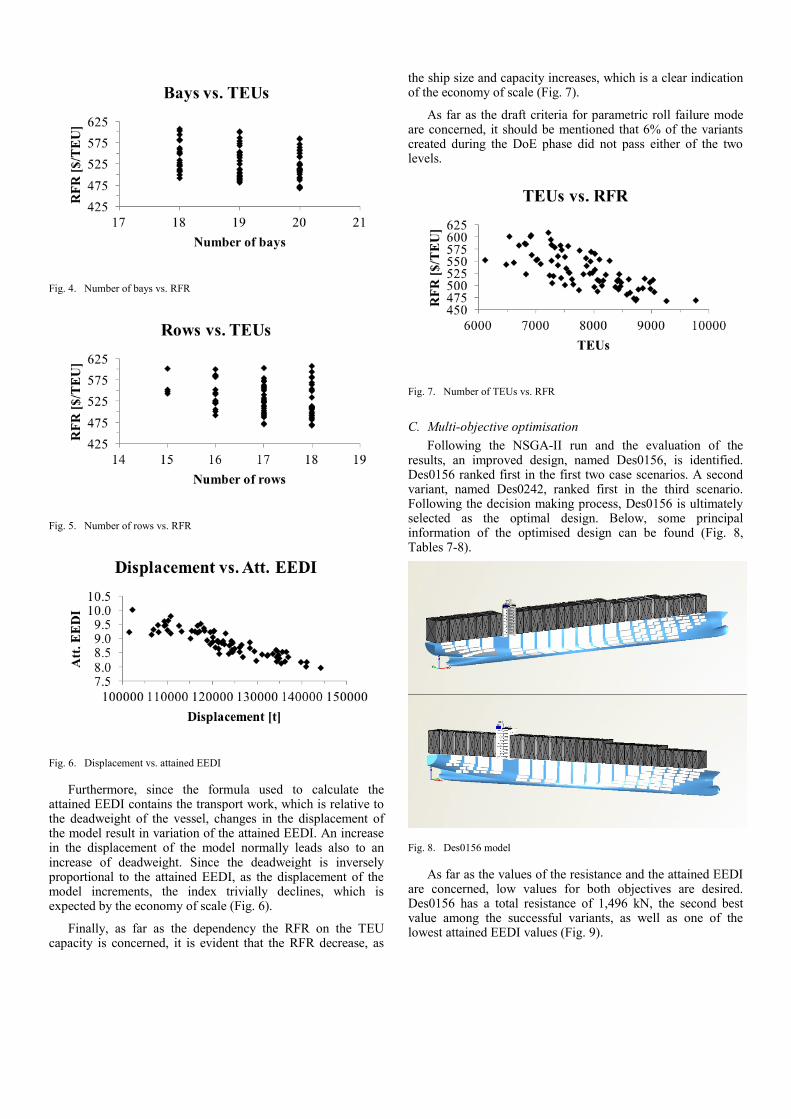
Fig. 4. Number of bays vs. RFR
Fig. 5. Number of rows vs. RFR
Fig. 6. Displacement vs. attained EEDI
Furthermore, since the formula used to calculate the attained EEDI contains the transport work, which is relative to the deadweight of the vessel, changes in the displacement of the model result in variation of the attained EEDI. An increase in the displacement of the model normally leads also to an increase of deadweight. Since the deadweight is inversely proportional to the attained EEDI, as the displacement of the model increments, the index trivially declines, which is expected by the economy of scale (Fig. 6).
Finally, as far as the dependency the RFR on the TEU capacity is concerned, it is evident that the RFR decrease, as
the ship size and capacity increases, which is a clear indication of the economy of scale (Fig. 7).
As far as the draft criteria for parametric roll failure mode are concerned, it should be mentioned that 6% of the variants created during the DoE phase did not pass either of the two levels.
Fig. 7. Number of TEUs vs. RFR
C. Multi-objective optimisation
Following the NSGA-II run and the evaluation of the results, an improved design, named Des0156, is identified. Des0156 ranked first in the first two case scenarios. A second variant, named Des0242, ranked first in the third scenario. Following the decision making process, Des0156 is ultimately selected as the optimal design. Below, some principal information of the optimised design can be found (Fig. 8, Tables 7-8).
Fig. 8. Des0156 model
As far as the values of the resistance and the attained EEDI are concerned, low values for both objectives are desired. Des0156 has a total resistance of 1,496 kN, the second best value among the successful variants, as well as one of the lowest attained EEDI values (Fig. 9).
TABLE VII. DES0156 DESIGN VARIABLE VALUES
Design variable Des0156 value
Bays 20
Rows 15
Tiers in hold 8
Tiers on deck 8
Double bottom (m) 2.50
Double side (m) 2.42
ΔcP -0.04662
ΔLCB -0.01680
Bilge radius (m) 4.242
TABLE VIII. DES0156 OBJECTIVE VALUES
Objective Des0156 value
RFR ($/TEU) 504.86
Capacity ratio 0.5233
EEDI 9.04
Stowage ratio 1.5186
Ship resistance (kN) 1496
Fig. 9. Resistance vs. attained EEDI
Fig. 10. Capacity vs. stowage ratio
In case of the two examined ratios -stowage and capacity- we can observe an inversely proportional trend. Variants which feature high stowage ratio are characterised by low capacity ratio and vice versa. This is the main difference between the two identified designs, Des0156 and Des0242 (Fig. 10).
As far as the relationship between the RFR and the two ratios is concerned, an optimal design would feature a low RFR value and high stowage and capacity ratios. Des0156 features the lowest RFR between the successful variants, at 504.86
$/TEU, as well as one of the highest stowage ratios (Fig. 11). On the other hand, Des0242 achieved one of the highest capacity ratios (Fig. 12).
With regard to the criteria for parametric roll failure mode, it should be noted that 8.1% of the produced variants did not pass either of the two levels. By including the design parameters that affect the criteria for parametric rolling in the optimisation process, it was possible to optimise the containership model in such way to successfully pass the draft criteria for parametric roll failure mode. Indeed, this is proved by the fact that almost 92% of the produced variants were not vulnerable to parametric rolling.
Fig. 11. Stowage ratio vs. RFR
Fig. 12. Capacity ratio vs. RFR
Finally, a one-to-one comparison between the initial and the improved design is made, to show the percentage differences in several elements (Table 9).
As far as the main dimensions are concerned, the improved design features an additional bay, while the number of rows and tiers below the main deck are decreased by one. Also, an extra tier above the main deck is carried in the improved design. It should be noted that Des0156 is one of the very few produced variants that feature eight tiers above the main deck. Due to stability restrictions, most of the successful design variants can carry only up to six or seven tiers of containers above the main deck. The extra tier found in Des0156 offers the advantage of an increased stowage and capacity ratio, as well as a reduced RFR, due to the higher total number of TEUs
carried on board. In addition, the homogenous weight of each TEU in the maximum TEU capacity loading condition is 7.2 t, while in the zero ballast loading condition it is 21.3 t. Hence it is ensured that the containers will not collapse due to over-stacking, since the maximum number of tiers under and over the main deck is eight and the maximum superimposed load each ISO container can withstand is 192 kg, according to regulations [29]. Furthermore, the double bottom and double side distances are higher in Des0156’s case, while the bilge radius is reduced compared to the baseline design.
TABLE IX. BASELINE DESIGN VS. DES0156
Data Baseline Des0156 Difference
Bays 19 20 +1
Rows 16 15 –1
Tiers in hold 9 8 –1
Tiers on deck 6 8 +2
Double bottom (m) 2.0 2.50 +0.50
Double side (m) 2.1 2.42 +0.32
Bilge radius (m) 5 4.242 –0.758
RT (kN) 1559 1496 –4.04%
Max. TEU capacity 6487 6984 +7.66%
Z.B. TEU capacity 3377 3655 +8.23%
Capacity ratio 0.5206 0.5233 +0.52%
Stowage ratio 0.9451 1.5186 +60.68%
RFR ($/TEU) 582.35 504.86 –13.31%
EEDI 8.80 9.04 +2.73%
Overall, the improvement of the initial containership design is obvious. Des0156 manages to perform better in every objective, apart from the attained EEDI value. Nevertheless, the design complies with the EEDI regulations. As a matter of fact, the attained/required EEDI ratio for the current state of the rules is equal to 0.563, providing a safe gap from the maximum allowed value set by regulations. On top of that, Des0156 manages to be a future-proof design, as the attained EEDI value of 9.04 is in fact well below the value of 12.49, which represents the reference line EEDI value when the reduction factor reaches the most conservative level of 30% in 2025. A notable improvement can be observed in the port efficiency factor and the RFR objectives, where an increase of 61% and a decrease of 13% are achieved, respectively.
IV. SUMMARY AND CONCLUDING REMARKS
Through the work presented in this paper, the advantages of the utilisation of modern design optimisation in the shipbuilding industry are demonstrated. By incorporating this type of parametric optimisation process in the early stages of ship design, a much improved design can be produced, providing numerous benefits to a potential builder and end user (ship owner). Furthermore, it is demonstrated that using modern CAD/CAE systems, it is possible to explore the huge design space with little effort, while generating excellent/partly innovative results within very short lead times. The presented methodology and the implemented CAD system allow the integration of more advanced tools for the improved modelling of e.g. ship’s hydrodynamics or ship’s strength. The optimisation can include other areas of ship design as main objectives, such as structural strength or seakeeping, allowing naval architects to achieve a greater degree of holism in the design process [17].
It is evident that the relation of the design process with statutory regulations should be included in the optimisation process as well, as new rules are introduced every year. The present study incorporated new tools for the newly developed second generation criteria for parametric roll failure mode. The results indicate how the model should be designed to pass certain criteria to comply with international regulations, while it becomes clear that specific design parameters, such as the bilge radius and consequently, the midship coefficient, affect the above. Future work could of course include the rest of the second generation intact stability criteria as part of the optimisation procedure.
As far as the results of the current application are concerned, some general observations can be made and conclusions drawn.
Almost 57% of the successful variants produced during the optimisation process feature 20 bays and 15 rows. Since wider designs may be more prone to increased transverse accelerations in seaways, this observation seems to be valid, as the parametric rolling is considered in this optimisation study. The optimal design is also characterised by the same bays and rows arrangement. Moreover, the highest ranked designs feature the minimum allowed number of tiers in hold. This can be explained by the fact that the maximisation of the stowage ratio is desired in this study. Hence, the number of TEUs below the main deck should be minimal.
The methodology presented in this study can be also applied to other containership sizes and ship types [6, 30]. More phases of the ship’s life cycle can be integrated to future studies, resulting in more comprehensive holistic ship design investigations [17].
ACKNOWLEDGEMENTS
The authors would like to express their sincere gratitude to the following people for their manifold support: Dr. Pierre Sames (DNV GL), Dr. Stefan Harries (Friendship Systems), Martin Köpke (HAPAG Lloyd, former GL), George Koutroukis (former NTUA-SDL), Lampros Nikolopoulos (STARBULK, former NTUA-SDL), Elias Soultanias (former NTUA-SDL), Aimilia Alisafaki (NTUA-SDL), Christos Gkerekos (UoS) and Sotirios Chouliaras (UoS).
REFERENCES
[1] CLARKSON RESEARCH SERVICES 2015. Review of Maritime Transport.
[2] SHIP & BUNKER. 2016. Ship & Bunker [Online]. Available: http://shipandbunker.com/prices [Accessed September 2016].
[3] KOUTROUKIS, G., PAPANIKOLAOU, A., NIKOLOPOULOS, L., SAMES, P. & KÖPKE, M. 2013. Multi-objective optimization of container ship design. 15th International Maritime Association of the Mediterranean - IMAM 2013. A Coruña, Spain: Taylor & Francis Group (CRC).
[4] TOZER, D. 2008. Container Ship Speed Matters. London, UK: Lloyd's Register Group.
[5] WHITE, R. 2010. Ocean shipping lines cut speed to save fuel costs. Available: http://articles.latimes.com/2010/jul/31/business/la-fi-slow-sailing-20100731.
[6] SOULTANIAS, I. 2014. Parametric ship design and holistic design optimisation of a 9K TEU container carrier. Diploma, National Technical University of Athens.
[7] IMO 2012a. Consideration of the energy efficiency design index for new ships - minimum propulsion power to maintain the maneuverability in adverse conditions. In: INTERNATIONAL MARITIME ORGANISATION (ed.). London.
[8] IMO 2012b. Guidelines on the method of calculation of the attained energy efficiency design index (EEDI) for new ships. In: INTERNATIONAL MARITIME ORGANISATION (ed.). London.
[9] IMO 2004. BWM - International Convention for the Control and Management of Ships' Ballast Water and Sediments. In: IMO (ed.). London.
[10] IMO 2015. Development of second generation intact stability criteria. In: INTERNATIONAL MARITIME ORGANISATION (ed.). London.
[11] PETERS, W., BELENKY, V., BASSLER, C., SPYROU, K. J., UMEDA, N., BULIAN, G. & ALTMAYER, B. 2011. The Second Generation Intact Stability Criteria: An Overview of Development. In: SNAME (ed.) Annual Meeting of the Society of Naval Architects and Marine Engineers (SNAME). Houston, Texas.
[12] SPYROU, K. J. 2005. Design Criteria for Parametric Rolling. Oceanic Engineering International, 9, 11-27.
[13] BROWN, A. & SALCEDO, J. 2003. Multiple-Objective Optimization in Naval Ship Design. Naval Engineers Journal, 115, 49-62.
[14] CAMPANA, E. F., LIUZZI, G., LUCIDI, S., PERI, D., PICCIALLI, V. & PINTO, A. 2009. New global optimization methods for ship design problems. Optimization and Engineering, 10, 533-555.
[15] MIZINE, I. & WINTERSTEEN, B. 2010. Multi-level hierarchical system approach in computerized ship design. 9th International Conference on Computer and IT Applications in the Maritime Industries (COMPIT ’10). Gubbio, Italy.
[16] PRIFTIS, A. 2015. Parametric Design and Multi-Objective Optimization of a 6,500 TEU Container Ship. Diploma, National Technical University of Athens.
[17] PAPANIKOLAOU, A. 2010. Holistic ship design optimization. Computer-Aided Design, 42, 1028-1044.
[18] FRIENDSHIP SYSTEMS 2016. CAESES. 4.1.0 ed.
[19] LACKENBY, H. 1950. On the systematic geometrical variation of ship forms. Transactions of INA, 92, 289-316.
[20] ABT, C. & HARRIES, S. 2007. Hull variation and improvement using the generalised Lackenby method of the FRIENDSHIP-Framework. The Naval Architect, 166-167.
[21] IMO 1991. Navigation bridge visibility and functions. In: IMO (ed.). London.
[22] HOLTROP, J. & MENNEN, G. G. J. 1978. An approximate power prediction method. International Shipbuilding Progress, 25, 166-170.
[23] PAPANIKOLAOU, A. 2014. Ship Design: Methodologies of Preliminary Design, Netherlands, Springer.
[24] WATSON, D. G. M. 1998. Practical Ship Design, UK, Elsevier.
[25] BENTLEY SYSTEMS 2014. Maxsurf Stability. Windows Version 20 ed.
[26] MATHWORKS 2014. MATLAB. R2014a ed.
[27] MOHD AZMIN, F. & STOBART, R. 2015. Benefiting from Sobol Sequences Experiment Design Type for Model-based Calibration. SAE Technical Papers, 1.
[28] DEB, K., PRATAP, A., AGARWAL, S. & MEYARIVAN, T. 2002. A fast and elitist multiobjective genetic algorithm: NSGA-II. IEEE Transactions on Evolutionary Computation, 6, 182-197.
[29] IMO 2014. IMO/ILO/UNECE Code of Practice for Packing of Cargo Transport Units (CTU Code). In: ORGANISATION, I. M. (ed.). London.
[30] KÖPKE, M., PAPANIKOLAOU, A., HARRIES, S., NIKOLOPOULOS, L. & SAMES, P. 2014. CONTiOPT - Holistic optimisation of a high efficiency and low emission containership. Transport Research Arena 2014. Paris, France.