original article distribution and population structure of the
TRANSCRIPT
ORIGINAL ARTICLE
Distribution and population structure of the fishHelicolenus dactylopterus dactylopterus (Delaroche, 1809)in the Central Mediterranean (Southern Tyrrhenian Sea)Laura Pirrera, Teresa Bottari, Barbara Busalacchi, Daniela Giordano, Larissa Modica, Anna Perdi-chizzi, Francesco Perdichizzi, Adriana Profeta & Paola Rinelli
Institute of Coastal Marine Environment (IAMC) – CNR of Messina, Messina, Italy
Problem
The blue-mouth, Helicolenus dactylopterus dactylopterus
(Delaroche, 1809) (Pisces: Scorpaenidae), is a medium-
sized scorpionfish widespread in the whole Mediterranean
basin on the coarse and mud-sandy bottoms of the conti-
nental shelf and mostly on the slope as deep as 1000 m
(Fischer et al. 1987). The blue-mouth is widely distrib-
uted in the Eastern Atlantic, from the Norwegian coasts
to the south-west coast of Africa (Hureau & Litvinenko
1986). Helicolenus dactylopterus, common throughout all
Italian seas (Relini et al. 1999), represents, among bathyal
Keywords
Helicolenus dactylopterus dactylopterus;
recruitment pattern; Southern Tyrrhenian Sea;
spatial distribution; trawl bottom.
Correspondence
Laura Pirrera, Institute of Coastal Marine
Environment (IAMC) – CNR of Messina,
Messina, Italy.
E-mail: [email protected]
Conflicts of interest
The authors declare no conflicts of interest.
doi:10.1111/j.1439-0485.2009.00327.x
Abstract
The blue-mouth, Helicolenus dactylopterus dactylopterus (Delaroche, 1809)
(Pisces: Scorpaenidae), is a scorpionfish widespread in the whole Mediterra-
nean basin, where it plays an important ecological role in deep-sea fish com-
munities. The depauperation of this large-size sedentary and slow-growing fish
can be an index of overexploitation. This species is found throughout all Italian
seas; the juveniles are mainly located around 150–300 m depth, whereas the
adult specimens are spread over a wider depth range from 200 m to as deep as
1000 m. The abundance in number and weight, the spatial distribution, the
population structure, the growth and the recruitment pattern of H. dactylopte-
rus were analysed in this study. The present paper integrates data from 11 bot-
tom trawl surveys carried out in the Southern Tyrrhenian Sea (Central
Mediterranean) along Calabrian and Sicilian coasts, within the framework of
the MEDITS Project. A total of 1412 specimens of H. dactylopterus weighting
20.051 kg were caught. The species appeared in 40% of the 296 hauls analysed,
throughout the whole depth range surveyed. The highest values of frequency of
occurrence (>67%) were obtained in the slope, whereas in the shelf they fell to
around 16%. On the continental shelf the species was found between 106 and
196 m depth, and in the slope between 400 and 645 m. The highest mean den-
sity index (NÆkm)2) value was obtained in the 100–200 m depth stratum,
whereas the highest mean biomass index (kgÆkm)2) value was recorded in the
deeper 200–500 m stratum. The length distribution of the specimens ranged
between 2.5 and 24.5 cm. From the Von Bertalanffy growth model the follow-
ing parameters for the whole population were obtained: L¥: 30 cm; K:
0.16 year)1; t0: )0.02. The sampled population is composed mainly of the
young-of-the-year fraction, which can reach up to 98% of the whole catch.
Recruits (age 0+) and juveniles (age up 4 years) are limited to waters shallower
than 500 m, whereas adults are present below this depth.
Marine Ecology. ISSN 0173-9565
Marine Ecology 30 (Suppl.1) (2009) 161–174 ª 2009 Blackwell Verlag GmbH 161
teleosts, more than a negligible fraction of the commercial
catch in several Italian fisheries (IREPA, 2008). In partic-
ular, this species is exploited in deep-sea fisheries targeted
at deep-water crustaceans. The study of H. dactylopterus
population dynamics is important because the depaupera-
tion of this large-size sedentary and slow-growing fish can
be an index of the overexploitation of fishing grounds.
The life history of H. dactylopterus is well known in the
Mediterranean Sea, both in the western and the central
basin: (i) bathymetric distribution and population struc-
ture by D’Onghia et al. (1992) in the Ionian Sea and
by Massutı et al. (2001) and Ribas et al. (2006) off the
Iberian Peninsula; (ii) age and growth in the Ligurian
Sea (Peirano & Tunesi 1986; Ragonese 1989), Strait of
Sicily (Ragonese & Reale 1992, 1995), South-western
Adriatic (Ungaro & Marano 1995), North-eastern
Ionian Sea (D’Onghia et al. 1996), South-western Adri-
atic (Romanelli et al. 1997) and off the Iberian Penin-
sula (Massutı et al. 2000a,b); (iii) reproductive biology
in the North-western Mediterranean by Munoz et al.
(1999, 2000, 2002a,b); (iv) diet by Froglia (1976) and
Macpherson (1979); (v) exploitation rate by Ragonese
& Reale (1992) and Ungaro & Marano (1995).
In the present paper, the abundance in number and
weight, the spatial distribution, the population structure,
the growth and the recruitment pattern of H. dactylopte-
rus are discussed.
Material and Methods
Collection methods
Helicolenus dactylopterus dactylopterus specimens were col-
lected during 11 bottom trawl surveys, carried out within
the framework of international European MEDITS Project,
from 1995 to 2005, in the southernmost part of the Tyr-
rhenian Sea (Central Mediterranean) along the Calabrian
and Sicilian coasts (Bertrand et al. 2002).The surveyed area
extended from Cape Suvero to Cape S. Vito, within the
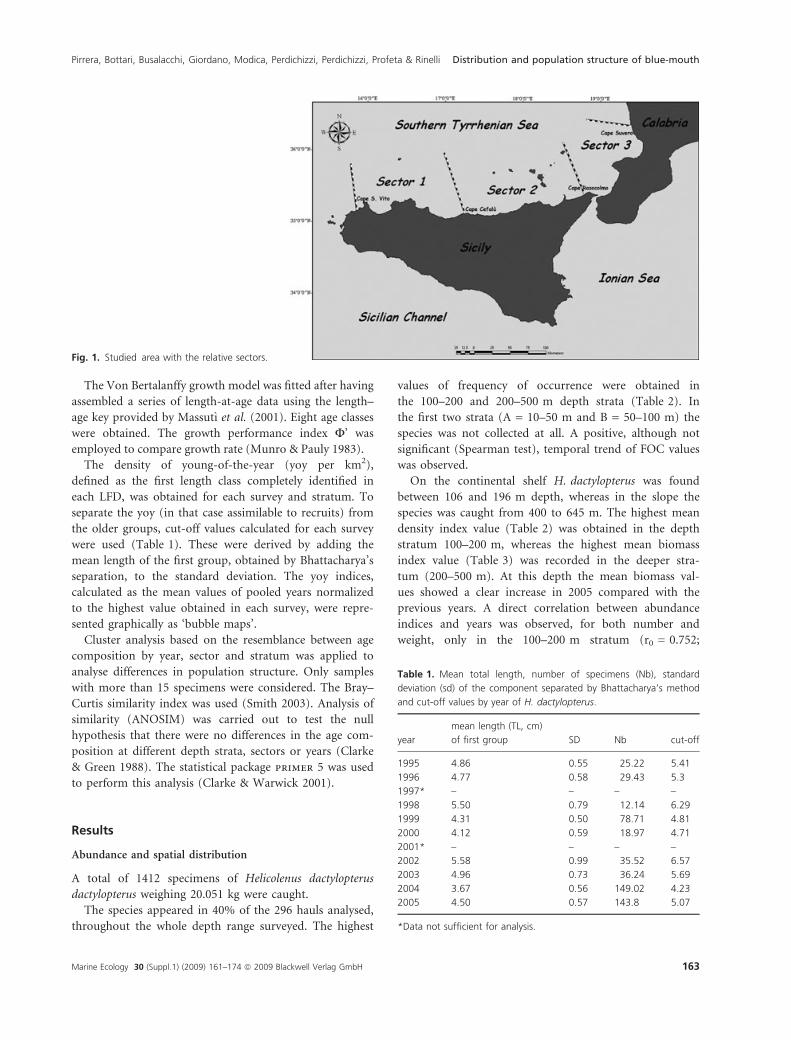
isobath of 800 m, for a total area of 7256 km2 (Fig. 1).
Sampling procedures were the same in all surveys,
according to the MEDITS project protocol (Bertrand
et al. 2002, Anonymous 2007). Sampling was carried out
randomly and the hauls were proportionately distributed
in five bathymetric strata: stratum A: 10–50 m (622 km2);
stratum B: 50–100 m (1003 km2); stratum C: 100–200 m
(1224 km2); stratum D: 200–500 m (1966 km2); stratum
E: 500–800 m (2441 km2). An experimental sampling gear
with a cod-end mesh size of 20 mm was used. The haul
duration was 30 min in the shelf (10–200 m), and 60 min
in the slope (>200 m).
In each haul, the number and weight of each were
recorded, and the total length (TL, cm) of the specimens
was measured to the nearest 0.5 cm. The sex was deter-
mined by macroscopic examination of the gonads.
Data analyses
With regard to distribution and abundance of the species,
three indicators were estimated:
1 frequency of occurrence (FOC), as % of positive (i.e.
with at least one specimen) hauls;
2 abundance, as density index (DI) expressed as NÆkm)2;
3 abundance, as biomass index (BI) expressed as
kgÆkm)2.
The mean abundance indices and their corresponding
coefficient of variation (CV% = SD ⁄ mean) were esti-
mated according to the classic swept-area approach (Gun-
derson 1993), but considering the area effectively trawled
in the given stratum (Anonymous 2007).
The Spearman coefficient (r0) was used to test the sig-
nificance of the correlation between abundance values,
both in number and weight, of the whole area, and years.
Density and biomass indices by year were interpolated
using GIS software (ArcMap 9.2 by ESRI): data were
mediated and normalized and then spatially elaborated by
the deterministic interpolation method (IDW: Inverse
Distance Weighting).
Moreover, given the extension of the studied area, the
abundance in number and weight was analysed according
to three geographic sectors distinguished by the homoge-
neity of their physiographic characteristics: (i) from Cape
S. Vito to Cape Cefalu (Sicily); (ii) from Cape Cefalu to
Cape Rasocolmo (Sicily); and (iii) from Cape Rasocolmo
(Sicily) to Cape Suvero (Calabria) (Fig. 1).
ANOVA was used to check the null hypotheses that
abundance and biomass do not change among years, sec-
tors and depth strata. Before ANOVA, the assumptions of
normality of data and homogeneity of variance were
tested using one-way Kolmogorov–Smirnov (K–S) and
Levene’s tests, respectively. As a consequence of the non-
normality of the DI dataset, the values were log-trans-
formed [ln(x + 1)] in all analyses. The Student–New-
man–Keuls test was applied to verify which of the mean
values of biomass and abundance indices were signifi-
cantly different from the others.
The Spearman non-parametric test was applied to test
differences in time of the median length. Length fre-
quency distributions (LFDs) for each year were com-
puted. The differences between years were tested with the
Kruskal–Wallis test. LFDs were resolved into Gaussian
components with Bhattacharya’s method implemented in
the software package fisat II (Gayanilo et al. 2005). The
separation of cohorts was used for the description of
growth and to obtain numbers of recruits or the juvenile
fraction of the population.
Distribution and population structure of blue-mouth Pirrera, Bottari, Busalacchi, Giordano, Modica, Perdichizzi, Perdichizzi, Profeta & Rinelli
162 Marine Ecology 30 (Suppl.1) 30 (Suppl.1) (2009) 161–174 ª 2009 Blackwell Verlag GmbH
The Von Bertalanffy growth model was fitted after having
assembled a series of length-at-age data using the length–
age key provided by Massutı et al. (2001). Eight age classes
were obtained. The growth performance index F’ was
employed to compare growth rate (Munro & Pauly 1983).
The density of young-of-the-year (yoy per km2),
defined as the first length class completely identified in
each LFD, was obtained for each survey and stratum. To
separate the yoy (in that case assimilable to recruits) from
the older groups, cut-off values calculated for each survey
were used (Table 1). These were derived by adding the
mean length of the first group, obtained by Bhattacharya’s
separation, to the standard deviation. The yoy indices,
calculated as the mean values of pooled years normalized
to the highest value obtained in each survey, were repre-
sented graphically as ‘bubble maps’.
Cluster analysis based on the resemblance between age
composition by year, sector and stratum was applied to
analyse differences in population structure. Only samples
with more than 15 specimens were considered. The Bray–
Curtis similarity index was used (Smith 2003). Analysis of
similarity (ANOSIM) was carried out to test the null
hypothesis that there were no differences in the age com-
position at different depth strata, sectors or years (Clarke
& Green 1988). The statistical package primer 5 was used
to perform this analysis (Clarke & Warwick 2001).
Results
Abundance and spatial distribution
A total of 1412 specimens of Helicolenus dactylopterus
dactylopterus weighing 20.051 kg were caught.
The species appeared in 40% of the 296 hauls analysed,
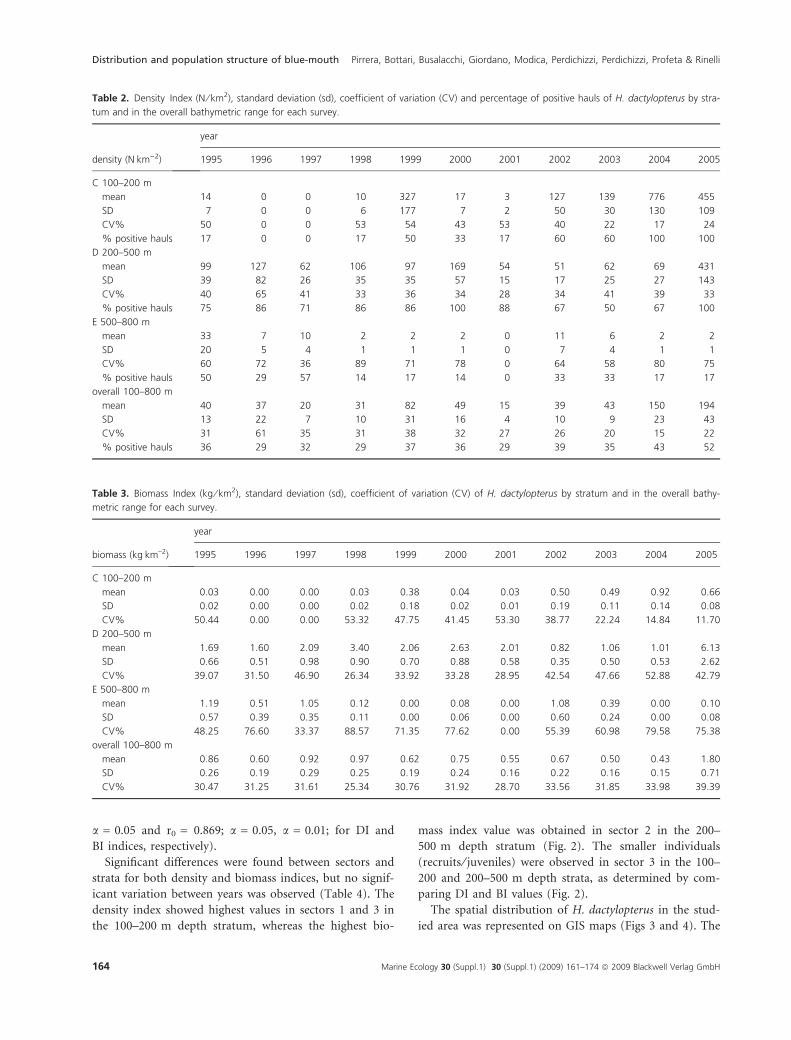
throughout the whole depth range surveyed. The highest
values of frequency of occurrence were obtained in
the 100–200 and 200–500 m depth strata (Table 2). In
the first two strata (A = 10–50 m and B = 50–100 m) the
species was not collected at all. A positive, although not
significant (Spearman test), temporal trend of FOC values
was observed.
On the continental shelf H. dactylopterus was found
between 106 and 196 m depth, whereas in the slope the
species was caught from 400 to 645 m. The highest mean
density index value (Table 2) was obtained in the depth
stratum 100–200 m, whereas the highest mean biomass
index value (Table 3) was recorded in the deeper stra-
tum (200–500 m). At this depth the mean biomass val-
ues showed a clear increase in 2005 compared with the
previous years. A direct correlation between abundance
indices and years was observed, for both number and
weight, only in the 100–200 m stratum (r0 = 0.752;
Table 1. Mean total length, number of specimens (Nb), standard
deviation (sd) of the component separated by Bhattacharya’s method
and cut-off values by year of H. dactylopterus.
year
mean length (TL, cm)
of first group SD Nb cut-off
1995 4.86 0.55 25.22 5.41
1996 4.77 0.58 29.43 5.3
1997* – – – –
1998 5.50 0.79 12.14 6.29
1999 4.31 0.50 78.71 4.81
2000 4.12 0.59 18.97 4.71
2001* – – – –
2002 5.58 0.99 35.52 6.57
2003 4.96 0.73 36.24 5.69
2004 3.67 0.56 149.02 4.23
2005 4.50 0.57 143.8 5.07
*Data not sufficient for analysis.
Fig. 1. Studied area with the relative sectors.
Pirrera, Bottari, Busalacchi, Giordano, Modica, Perdichizzi, Perdichizzi, Profeta & Rinelli Distribution and population structure of blue-mouth
Marine Ecology 30 (Suppl.1) (2009) 161–174 ª 2009 Blackwell Verlag GmbH 163
a = 0.05 and r0 = 0.869; a = 0.05, a = 0.01; for DI and
BI indices, respectively).
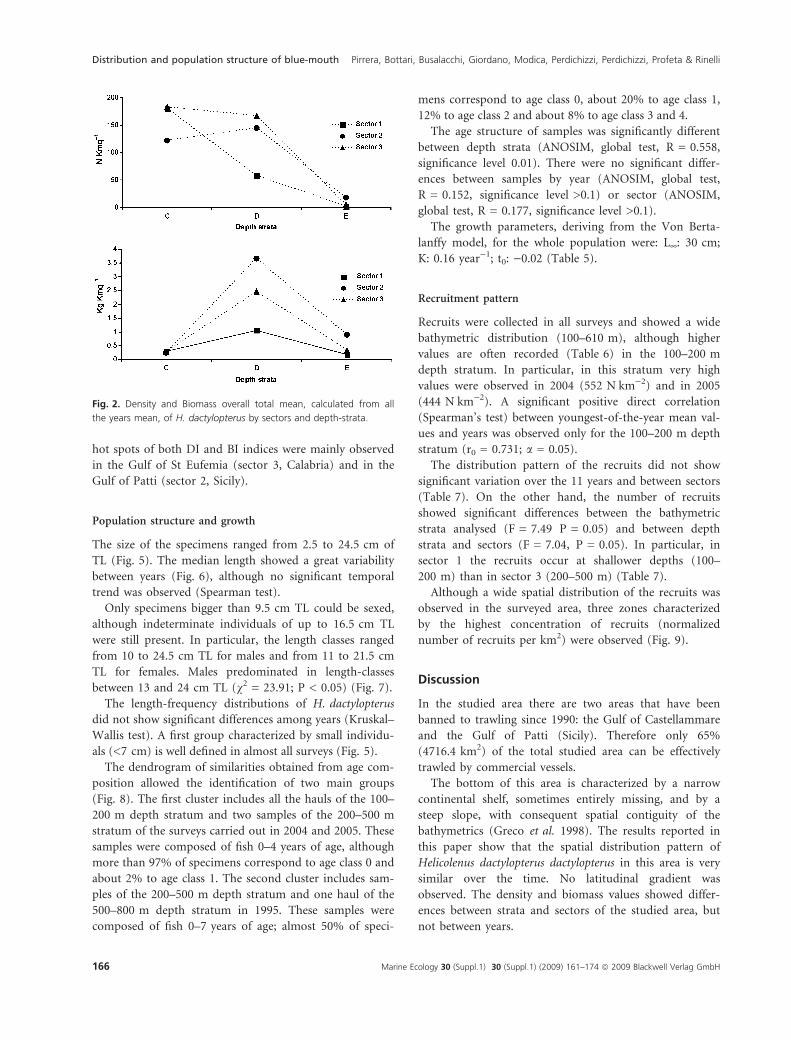
Significant differences were found between sectors and
strata for both density and biomass indices, but no signif-
icant variation between years was observed (Table 4). The
density index showed highest values in sectors 1 and 3 in
the 100–200 m depth stratum, whereas the highest bio-
mass index value was obtained in sector 2 in the 200–
500 m depth stratum (Fig. 2). The smaller individuals
(recruits ⁄ juveniles) were observed in sector 3 in the 100–
200 and 200–500 m depth strata, as determined by com-
paring DI and BI values (Fig. 2).
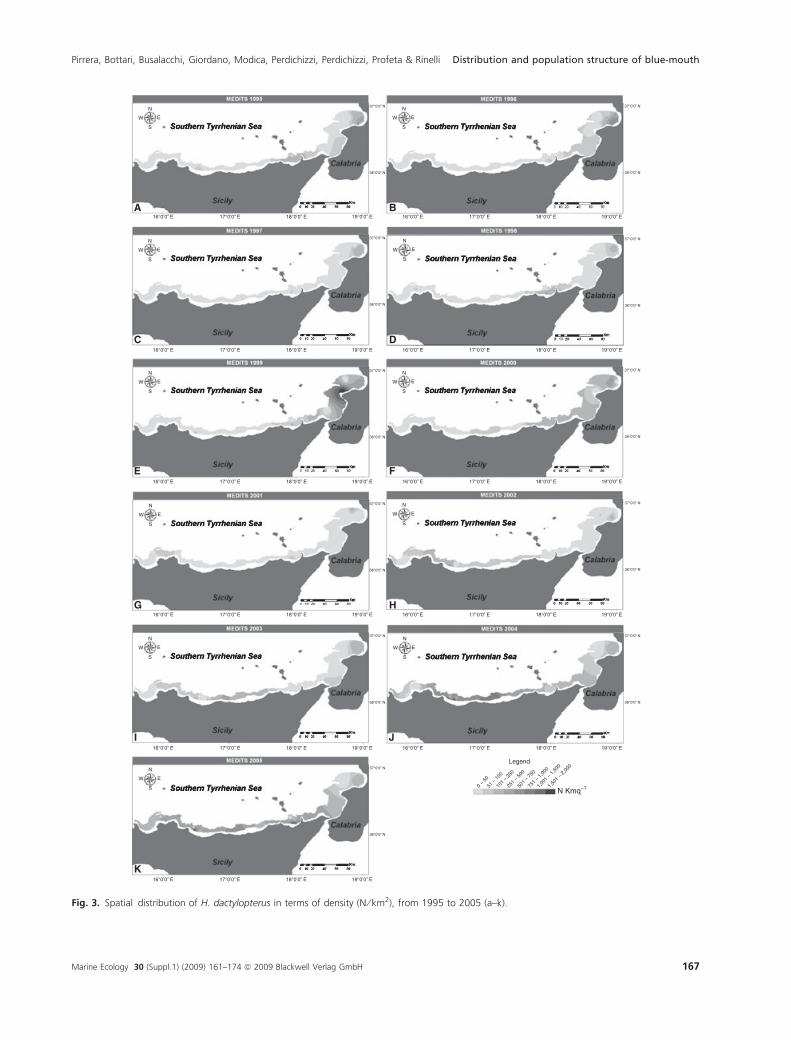
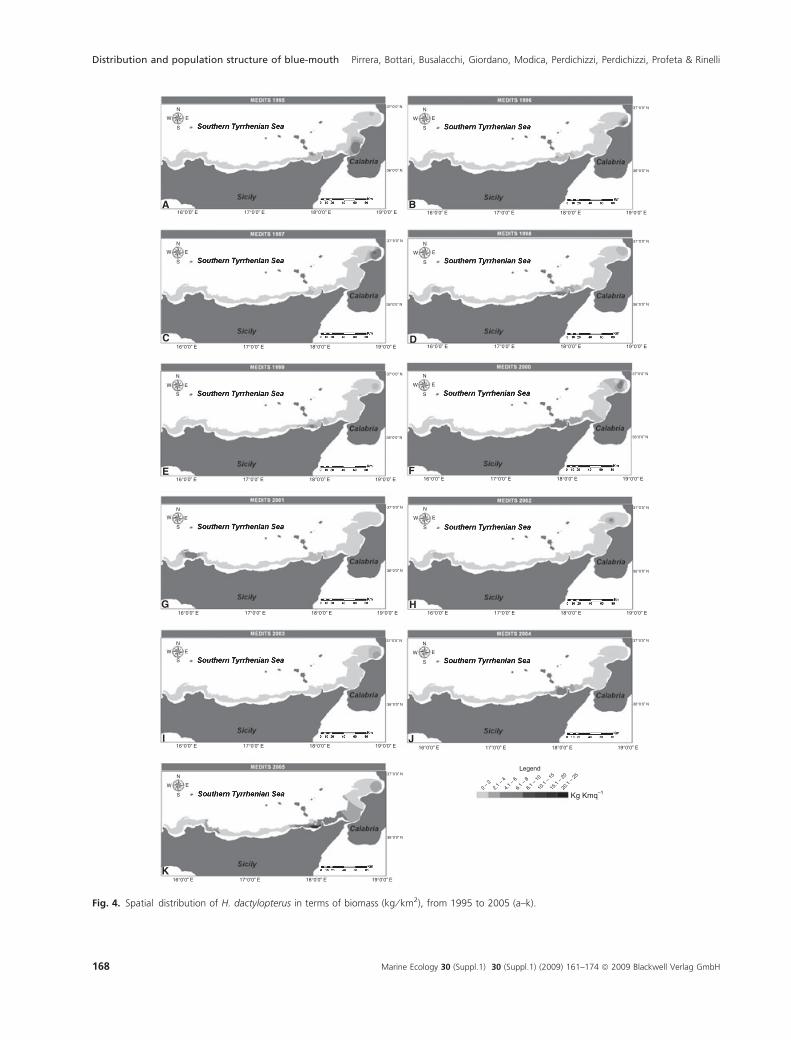
The spatial distribution of H. dactylopterus in the stud-
ied area was represented on GIS maps (Figs 3 and 4). The
Table 3. Biomass Index (kg ⁄ km2), standard deviation (sd), coefficient of variation (CV) of H. dactylopterus by stratum and in the overall bathy-
metric range for each survey.
biomass (kgÆkm–2)
year
1995 1996 1997 1998 1999 2000 2001 2002 2003 2004 2005
C 100–200 m
mean 0.03 0.00 0.00 0.03 0.38 0.04 0.03 0.50 0.49 0.92 0.66
SD 0.02 0.00 0.00 0.02 0.18 0.02 0.01 0.19 0.11 0.14 0.08
CV% 50.44 0.00 0.00 53.32 47.75 41.45 53.30 38.77 22.24 14.84 11.70
D 200–500 m
mean 1.69 1.60 2.09 3.40 2.06 2.63 2.01 0.82 1.06 1.01 6.13
SD 0.66 0.51 0.98 0.90 0.70 0.88 0.58 0.35 0.50 0.53 2.62
CV% 39.07 31.50 46.90 26.34 33.92 33.28 28.95 42.54 47.66 52.88 42.79
E 500–800 m
mean 1.19 0.51 1.05 0.12 0.00 0.08 0.00 1.08 0.39 0.00 0.10
SD 0.57 0.39 0.35 0.11 0.00 0.06 0.00 0.60 0.24 0.00 0.08
CV% 48.25 76.60 33.37 88.57 71.35 77.62 0.00 55.39 60.98 79.58 75.38
overall 100–800 m
mean 0.86 0.60 0.92 0.97 0.62 0.75 0.55 0.67 0.50 0.43 1.80
SD 0.26 0.19 0.29 0.25 0.19 0.24 0.16 0.22 0.16 0.15 0.71
CV% 30.47 31.25 31.61 25.34 30.76 31.92 28.70 33.56 31.85 33.98 39.39
Table 2. Density Index (N ⁄ km2), standard deviation (sd), coefficient of variation (CV) and percentage of positive hauls of H. dactylopterus by stra-
tum and in the overall bathymetric range for each survey.
density (NÆkm)2)
year
1995 1996 1997 1998 1999 2000 2001 2002 2003 2004 2005
C 100–200 m
mean 14 0 0 10 327 17 3 127 139 776 455
SD 7 0 0 6 177 7 2 50 30 130 109
CV% 50 0 0 53 54 43 53 40 22 17 24
% positive hauls 17 0 0 17 50 33 17 60 60 100 100
D 200–500 m
mean 99 127 62 106 97 169 54 51 62 69 431
SD 39 82 26 35 35 57 15 17 25 27 143
CV% 40 65 41 33 36 34 28 34 41 39 33
% positive hauls 75 86 71 86 86 100 88 67 50 67 100
E 500–800 m
mean 33 7 10 2 2 2 0 11 6 2 2
SD 20 5 4 1 1 1 0 7 4 1 1
CV% 60 72 36 89 71 78 0 64 58 80 75
% positive hauls 50 29 57 14 17 14 0 33 33 17 17
overall 100–800 m
mean 40 37 20 31 82 49 15 39 43 150 194
SD 13 22 7 10 31 16 4 10 9 23 43
CV% 31 61 35 31 38 32 27 26 20 15 22
% positive hauls 36 29 32 29 37 36 29 39 35 43 52
Distribution and population structure of blue-mouth Pirrera, Bottari, Busalacchi, Giordano, Modica, Perdichizzi, Perdichizzi, Profeta & Rinelli
164 Marine Ecology 30 (Suppl.1) 30 (Suppl.1) (2009) 161–174 ª 2009 Blackwell Verlag GmbH
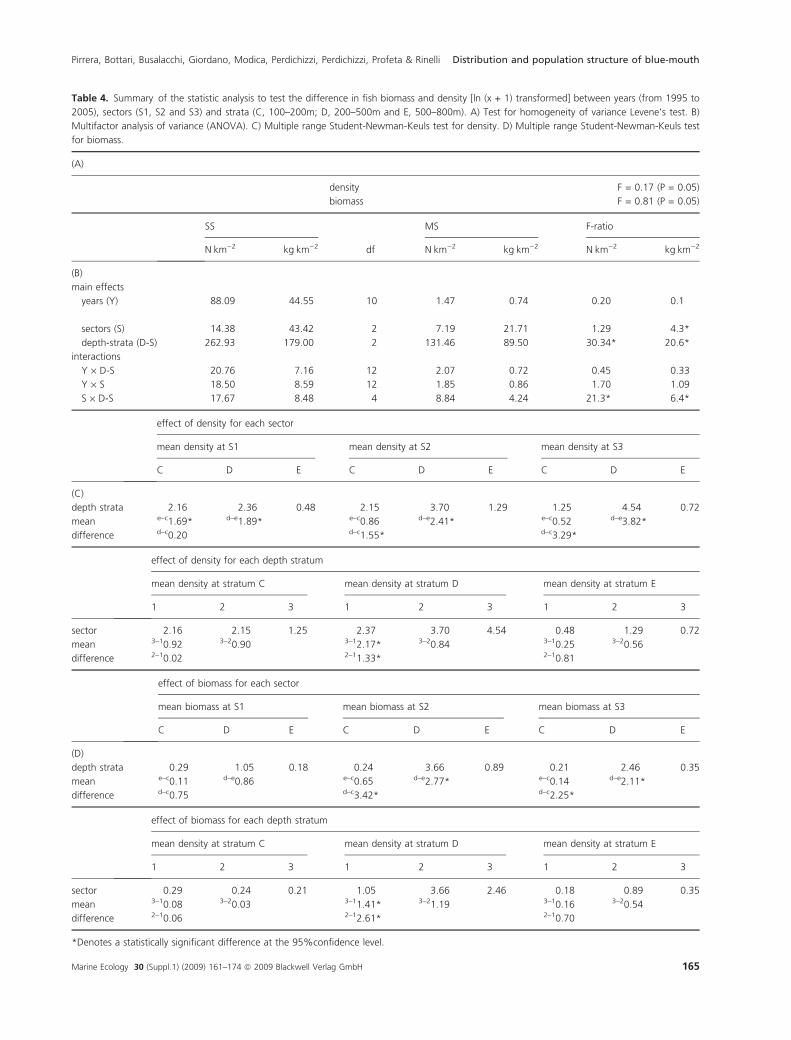
Table 4. Summary of the statistic analysis to test the difference in fish biomass and density [ln (x + 1) transformed] between years (from 1995 to
2005), sectors (S1, S2 and S3) and strata (C, 100–200m; D, 200–500m and E, 500–800m). A) Test for homogeneity of variance Levene’s test. B)
Multifactor analysis of variance (ANOVA). C) Multiple range Student-Newman-Keuls test for density. D) Multiple range Student-Newman-Keuls test
for biomass.
(A)
density F = 0.17 (P = 0.05)
biomass F = 0.81 (P = 0.05)
SS
df
MS F-ratio
NÆkm)2 kgÆkm)2 NÆkm)2 kgÆkm)2 NÆkm)2 kgÆkm)2
(B)
main effects
years (Y) 88.09 44.55 10 1.47 0.74 0.20 0.1
sectors (S) 14.38 43.42 2 7.19 21.71 1.29 4.3*
depth-strata (D-S) 262.93 179.00 2 131.46 89.50 30.34* 20.6*
interactions
Y · D-S 20.76 7.16 12 2.07 0.72 0.45 0.33
Y · S 18.50 8.59 12 1.85 0.86 1.70 1.09
S · D-S 17.67 8.48 4 8.84 4.24 21.3* 6.4*
effect of density for each sector
mean density at S1 mean density at S2 mean density at S3
C D E C D E C D E
(C)
depth strata 2.16 2.36 0.48 2.15 3.70 1.29 1.25 4.54 0.72
mean e–c1.69* d–e1.89* e–c0.86 d–e2.41* e–c0.52 d–e3.82*
difference d–c0.20 d–c1.55* d–c3.29*
effect of density for each depth stratum
mean density at stratum C mean density at stratum D mean density at stratum E
1 2 3 1 2 3 1 2 3
sector 2.16 2.15 1.25 2.37 3.70 4.54 0.48 1.29 0.72
mean 3–10.92 3–20.90 3–12.17* 3–20.84 3–10.25 3–20.56
difference 2–10.02 2–11.33* 2–10.81
effect of biomass for each sector
mean biomass at S1 mean biomass at S2 mean biomass at S3
C D E C D E C D E
(D)
depth strata 0.29 1.05 0.18 0.24 3.66 0.89 0.21 2.46 0.35
mean e–c0.11 d–e0.86 e–c0.65 d–e2.77* e–c0.14 d–e2.11*
difference d–c0.75 d–c3.42* d–c2.25*
effect of biomass for each depth stratum
mean density at stratum C mean density at stratum D mean density at stratum E
1 2 3 1 2 3 1 2 3
sector 0.29 0.24 0.21 1.05 3.66 2.46 0.18 0.89 0.35
mean 3–10.08 3–20.03 3–11.41* 3–21.19 3–10.16 3–20.54
difference 2–10.06 2–12.61* 2–10.70
*Denotes a statistically significant difference at the 95%confidence level.
Pirrera, Bottari, Busalacchi, Giordano, Modica, Perdichizzi, Perdichizzi, Profeta & Rinelli Distribution and population structure of blue-mouth
Marine Ecology 30 (Suppl.1) (2009) 161–174 ª 2009 Blackwell Verlag GmbH 165
hot spots of both DI and BI indices were mainly observed
in the Gulf of St Eufemia (sector 3, Calabria) and in the
Gulf of Patti (sector 2, Sicily).
Population structure and growth
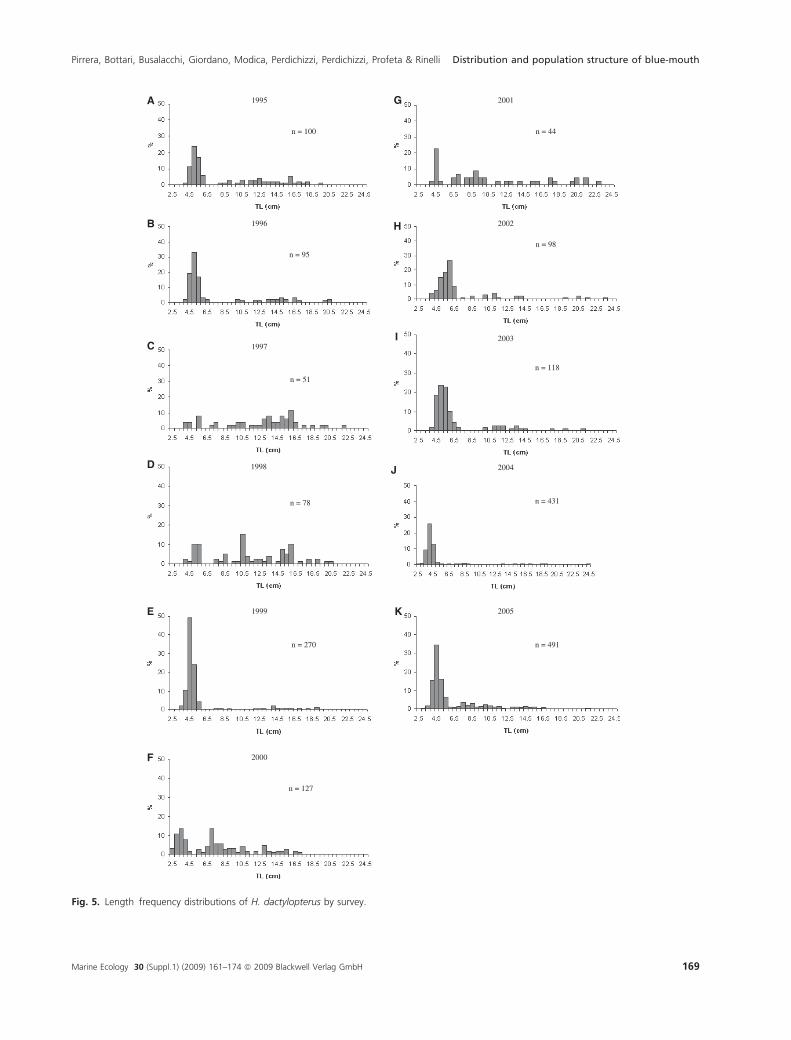
The size of the specimens ranged from 2.5 to 24.5 cm of
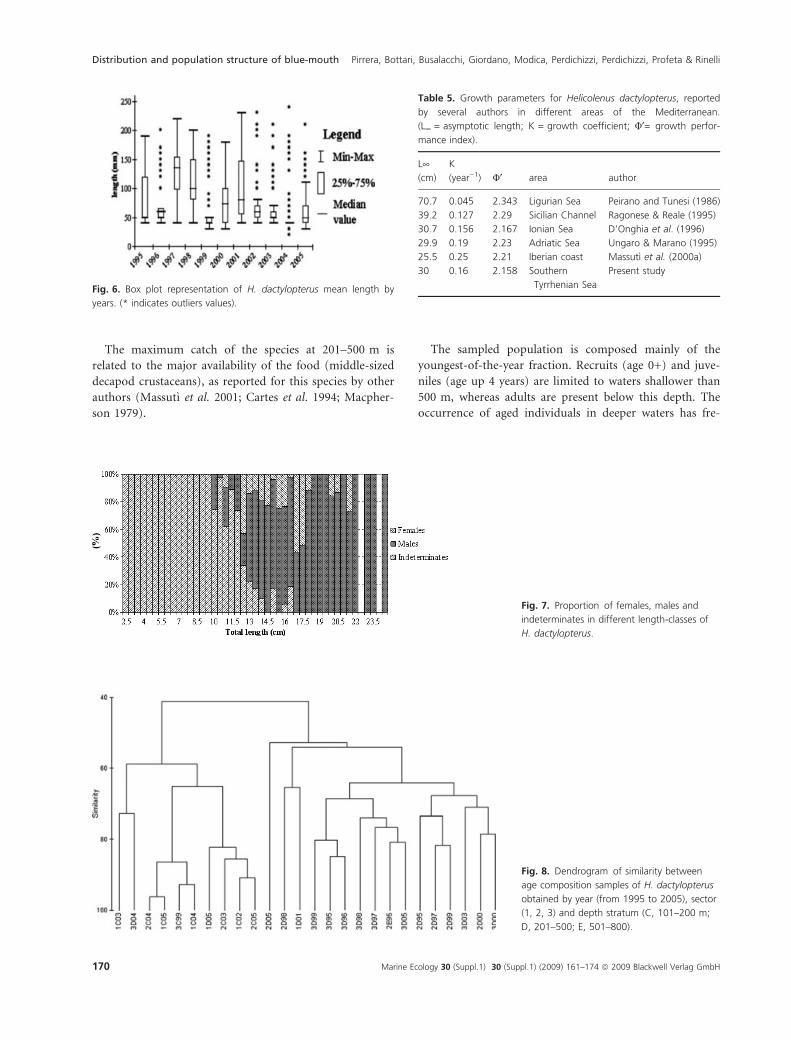
TL (Fig. 5). The median length showed a great variability
between years (Fig. 6), although no significant temporal
trend was observed (Spearman test).
Only specimens bigger than 9.5 cm TL could be sexed,
although indeterminate individuals of up to 16.5 cm TL
were still present. In particular, the length classes ranged
from 10 to 24.5 cm TL for males and from 11 to 21.5 cm
TL for females. Males predominated in length-classes
between 13 and 24 cm TL (v2 = 23.91; P < 0.05) (Fig. 7).
The length-frequency distributions of H. dactylopterus
did not show significant differences among years (Kruskal–
Wallis test). A first group characterized by small individu-
als (<7 cm) is well defined in almost all surveys (Fig. 5).
The dendrogram of similarities obtained from age com-
position allowed the identification of two main groups
(Fig. 8). The first cluster includes all the hauls of the 100–
200 m depth stratum and two samples of the 200–500 m
stratum of the surveys carried out in 2004 and 2005. These
samples were composed of fish 0–4 years of age, although
more than 97% of specimens correspond to age class 0 and
about 2% to age class 1. The second cluster includes sam-
ples of the 200–500 m depth stratum and one haul of the
500–800 m depth stratum in 1995. These samples were
composed of fish 0–7 years of age; almost 50% of speci-
mens correspond to age class 0, about 20% to age class 1,
12% to age class 2 and about 8% to age class 3 and 4.
The age structure of samples was significantly different
between depth strata (ANOSIM, global test, R = 0.558,
significance level 0.01). There were no significant differ-
ences between samples by year (ANOSIM, global test,
R = 0.152, significance level >0.1) or sector (ANOSIM,
global test, R = 0.177, significance level >0.1).
The growth parameters, deriving from the Von Berta-
lanffy model, for the whole population were: L¥: 30 cm;
K: 0.16 year)1; t0: )0.02 (Table 5).
Recruitment pattern
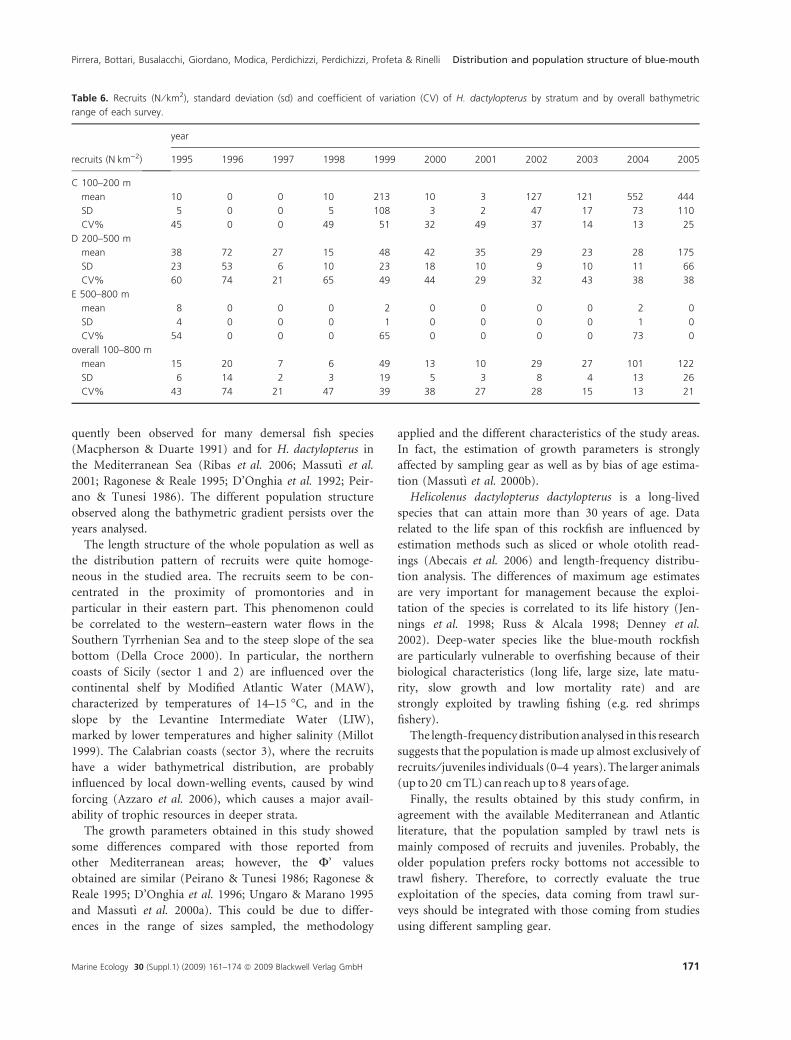
Recruits were collected in all surveys and showed a wide
bathymetric distribution (100–610 m), although higher
values are often recorded (Table 6) in the 100–200 m
depth stratum. In particular, in this stratum very high
values were observed in 2004 (552 NÆkm)2) and in 2005
(444 NÆkm)2). A significant positive direct correlation
(Spearman’s test) between youngest-of-the-year mean val-
ues and years was observed only for the 100–200 m depth
stratum (r0 = 0.731; a = 0.05).
The distribution pattern of the recruits did not show
significant variation over the 11 years and between sectors
(Table 7). On the other hand, the number of recruits
showed significant differences between the bathymetric
strata analysed (F = 7.49 P = 0.05) and between depth
strata and sectors (F = 7.04, P = 0.05). In particular, in
sector 1 the recruits occur at shallower depths (100–
200 m) than in sector 3 (200–500 m) (Table 7).
Although a wide spatial distribution of the recruits was
observed in the surveyed area, three zones characterized
by the highest concentration of recruits (normalized
number of recruits per km2) were observed (Fig. 9).
Discussion
In the studied area there are two areas that have been
banned to trawling since 1990: the Gulf of Castellammare
and the Gulf of Patti (Sicily). Therefore only 65%
(4716.4 km2) of the total studied area can be effectively
trawled by commercial vessels.
The bottom of this area is characterized by a narrow
continental shelf, sometimes entirely missing, and by a
steep slope, with consequent spatial contiguity of the
bathymetrics (Greco et al. 1998). The results reported in
this paper show that the spatial distribution pattern of
Helicolenus dactylopterus dactylopterus in this area is very
similar over the time. No latitudinal gradient was
observed. The density and biomass values showed differ-
ences between strata and sectors of the studied area, but
not between years.
Fig. 2. Density and Biomass overall total mean, calculated from all
the years mean, of H. dactylopterus by sectors and depth-strata.
Distribution and population structure of blue-mouth Pirrera, Bottari, Busalacchi, Giordano, Modica, Perdichizzi, Perdichizzi, Profeta & Rinelli
166 Marine Ecology 30 (Suppl.1) 30 (Suppl.1) (2009) 161–174 ª 2009 Blackwell Verlag GmbH
N
16°0’0” EA B
C D
E F
G H
I J
K
17°0’0” E 18°0’0” E 19°0’0” E
37°0’0” N
36°0’0” N
37°0’0” N
36°0’0” N
37°0’0” N
36°0’0” N
37°0’0” N
36°0’0” N
37°0’0” N
36°0’0” N
37°0’0” N
36°0’0” N
37°0’0” N
36°0’0” N
37°0’0” N
36°0’0” N
37°0’0” N
36°0’0” N
37°0’0” N
36°0’0” N
37°0’0” N
36°0’0” N
16°0’0” E 17°0’0” E 18°0’0” E 19°0’0” E
16°0’0” E 17°0’0” E 18°0’0” E 19°0’0” E
16°0’0” E 17°0’0” E 18°0’0” E 19°0’0” E
16°0’0” E 17°0’0” E 18°0’0” E 19°0’0” E
16°0’0” E 17°0’0” E
0 –
50
51 –
100
101
– 25
0
251
– 50
0
501
– 75
0
751
– 1,
000
1,00
1 –
1,50
0
1,50
1 –
2,00
0
18°0’0” E
Legend
N Kmq–1
19°0’0” E
16°0’0” E 17°0’0” E 18°0’0” E 19°0’0” E
16°0’0” E 17°0’0” E 18°0’0” E 19°0’0” E
16°0’0” E 17°0’0” E 18°0’0” E 19°0’0” E
16°0’0” E 17°0’0” E 18°0’0” E 19°0’0” E
16°0’0” E 17°0’0” E 18°0’0” E 19°0’0” E
E
S
W
N
E
S
W
N
E
S
W
N
E
S
W
N
E
S
W
N
E
S
W
N
E
S
W
N
E
S
W
N
E
S
W
N
E
S
W
N
E
S
W
Fig. 3. Spatial distribution of H. dactylopterus in terms of density (N ⁄ km2), from 1995 to 2005 (a–k).
Pirrera, Bottari, Busalacchi, Giordano, Modica, Perdichizzi, Perdichizzi, Profeta & Rinelli Distribution and population structure of blue-mouth
Marine Ecology 30 (Suppl.1) (2009) 161–174 ª 2009 Blackwell Verlag GmbH 167
N
16°0’0” EA B
C D
E F
G H
I J
K
17°0’0” E 18°0’0” E 19°0’0” E
37°0’0” N
36°0’0” N
37°0’0” N
36°0’0” N
37°0’0” N
36°0’0” N
37°0’0” N
36°0’0” N
37°0’0” N
36°0’0” N
37°0’0” N
36°0’0” N
37°0’0” N
36°0’0” N
37°0’0” N
36°0’0” N
37°0’0” N
36°0’0” N
37°0’0” N
36°0’0” N
37°0’0” N
36°0’0” N
16°0’0” E 17°0’0” E 18°0’0” E 19°0’0” E
16°0’0” E 17°0’0” E 18°0’0” E 19°0’0” E
16°0’0” E 17°0’0” E 18°0’0” E 19°0’0” E
16°0’0” E 17°0’0” E 18°0’0” E 19°0’0” E
16°0’0” E 17°0’0” E
0 –
22.
1 –
4
4.1
– 6
6.1
– 8
8.1
– 10
10.1
– 1
5
15.1
– 2
0
20.1
– 2
5
18°0’0” E
Legend
Kg Kmq–1
19°0’0” E
16°0’0” E 17°0’0” E 18°0’0” E 19°0’0” E
16°0’0” E 17°0’0” E 18°0’0” E 19°0’0” E
16°0’0” E 17°0’0” E 18°0’0” E 19°0’0” E
16°0’0” E 17°0’0” E 18°0’0” E 19°0’0” E
16°0’0” E 17°0’0” E 18°0’0” E 19°0’0” E
E
S
W
N
E
S
W
N
E
S
W
N
E
S
W
N
E
S
W
N
E
S
W
N
E
S
W
N
E
S
W
N
E
S
W
N
E
S
W
N
E
S
W
Fig. 4. Spatial distribution of H. dactylopterus in terms of biomass (kg ⁄ km2), from 1995 to 2005 (a–k).
Distribution and population structure of blue-mouth Pirrera, Bottari, Busalacchi, Giordano, Modica, Perdichizzi, Perdichizzi, Profeta & Rinelli
168 Marine Ecology 30 (Suppl.1) 30 (Suppl.1) (2009) 161–174 ª 2009 Blackwell Verlag GmbH
n = 44
n = 98
n = 118
2001
2002
2003
2004
2005
1995
1996
n = 100
n = 95
1997
n = 51
1998
n = 78
1999
n = 270 n = 491
n = 431
A
B
C
D
E
F
G
H
I
J
K
2000
n = 127
Fig. 5. Length frequency distributions of H. dactylopterus by survey.
Pirrera, Bottari, Busalacchi, Giordano, Modica, Perdichizzi, Perdichizzi, Profeta & Rinelli Distribution and population structure of blue-mouth
Marine Ecology 30 (Suppl.1) (2009) 161–174 ª 2009 Blackwell Verlag GmbH 169
The maximum catch of the species at 201–500 m is
related to the major availability of the food (middle-sized
decapod crustaceans), as reported for this species by other
authors (Massutı et al. 2001; Cartes et al. 1994; Macpher-
son 1979).
The sampled population is composed mainly of the
youngest-of-the-year fraction. Recruits (age 0+) and juve-
niles (age up 4 years) are limited to waters shallower than
500 m, whereas adults are present below this depth. The
occurrence of aged individuals in deeper waters has fre-
Fig. 6. Box plot representation of H. dactylopterus mean length by
years. (* indicates outliers values).
Fig. 7. Proportion of females, males and
indeterminates in different length-classes of
H. dactylopterus.
Fig. 8. Dendrogram of similarity between
age composition samples of H. dactylopterus
obtained by year (from 1995 to 2005), sector
(1, 2, 3) and depth stratum (C, 101–200 m;
D, 201–500; E, 501–800).
Table 5. Growth parameters for Helicolenus dactylopterus, reported
by several authors in different areas of the Mediterranean.
(L¥ = asymptotic length; K = growth coefficient; U¢= growth perfor-
mance index).
L¥(cm)
K
(year)1) U¢ area author
70.7 0.045 2.343 Ligurian Sea Peirano and Tunesi (1986)
39.2 0.127 2.29 Sicilian Channel Ragonese & Reale (1995)
30.7 0.156 2.167 Ionian Sea D’Onghia et al. (1996)
29.9 0.19 2.23 Adriatic Sea Ungaro & Marano (1995)
25.5 0.25 2.21 Iberian coast Massutı et al. (2000a)
30 0.16 2.158 Southern
Tyrrhenian Sea
Present study
Distribution and population structure of blue-mouth Pirrera, Bottari, Busalacchi, Giordano, Modica, Perdichizzi, Perdichizzi, Profeta & Rinelli
170 Marine Ecology 30 (Suppl.1) 30 (Suppl.1) (2009) 161–174 ª 2009 Blackwell Verlag GmbH
quently been observed for many demersal fish species
(Macpherson & Duarte 1991) and for H. dactylopterus in
the Mediterranean Sea (Ribas et al. 2006; Massutı et al.
2001; Ragonese & Reale 1995; D’Onghia et al. 1992; Peir-
ano & Tunesi 1986). The different population structure
observed along the bathymetric gradient persists over the
years analysed.
The length structure of the whole population as well as
the distribution pattern of recruits were quite homoge-
neous in the studied area. The recruits seem to be con-
centrated in the proximity of promontories and in
particular in their eastern part. This phenomenon could
be correlated to the western–eastern water flows in the
Southern Tyrrhenian Sea and to the steep slope of the sea
bottom (Della Croce 2000). In particular, the northern
coasts of Sicily (sector 1 and 2) are influenced over the
continental shelf by Modified Atlantic Water (MAW),
characterized by temperatures of 14–15 �C, and in the
slope by the Levantine Intermediate Water (LIW),
marked by lower temperatures and higher salinity (Millot
1999). The Calabrian coasts (sector 3), where the recruits
have a wider bathymetrical distribution, are probably
influenced by local down-welling events, caused by wind
forcing (Azzaro et al. 2006), which causes a major avail-
ability of trophic resources in deeper strata.
The growth parameters obtained in this study showed
some differences compared with those reported from
other Mediterranean areas; however, the F’ values
obtained are similar (Peirano & Tunesi 1986; Ragonese &
Reale 1995; D’Onghia et al. 1996; Ungaro & Marano 1995
and Massutı et al. 2000a). This could be due to differ-
ences in the range of sizes sampled, the methodology
applied and the different characteristics of the study areas.
In fact, the estimation of growth parameters is strongly
affected by sampling gear as well as by bias of age estima-
tion (Massutı et al. 2000b).
Helicolenus dactylopterus dactylopterus is a long-lived
species that can attain more than 30 years of age. Data
related to the life span of this rockfish are influenced by
estimation methods such as sliced or whole otolith read-
ings (Abecais et al. 2006) and length-frequency distribu-
tion analysis. The differences of maximum age estimates
are very important for management because the exploi-
tation of the species is correlated to its life history (Jen-
nings et al. 1998; Russ & Alcala 1998; Denney et al.
2002). Deep-water species like the blue-mouth rockfish
are particularly vulnerable to overfishing because of their
biological characteristics (long life, large size, late matu-
rity, slow growth and low mortality rate) and are
strongly exploited by trawling fishing (e.g. red shrimps
fishery).
The length-frequency distribution analysed in this research
suggests that the population is made up almost exclusively of
recruits ⁄ juveniles individuals (0–4 years). The larger animals
(up to 20 cm TL) can reach up to 8 years of age.
Finally, the results obtained by this study confirm, in
agreement with the available Mediterranean and Atlantic
literature, that the population sampled by trawl nets is
mainly composed of recruits and juveniles. Probably, the
older population prefers rocky bottoms not accessible to
trawl fishery. Therefore, to correctly evaluate the true
exploitation of the species, data coming from trawl sur-
veys should be integrated with those coming from studies
using different sampling gear.
Table 6. Recruits (N ⁄ km2), standard deviation (sd) and coefficient of variation (CV) of H. dactylopterus by stratum and by overall bathymetric
range of each survey.
recruits (NÆkm)2)
year
1995 1996 1997 1998 1999 2000 2001 2002 2003 2004 2005
C 100–200 m
mean 10 0 0 10 213 10 3 127 121 552 444
SD 5 0 0 5 108 3 2 47 17 73 110
CV% 45 0 0 49 51 32 49 37 14 13 25
D 200–500 m
mean 38 72 27 15 48 42 35 29 23 28 175
SD 23 53 6 10 23 18 10 9 10 11 66
CV% 60 74 21 65 49 44 29 32 43 38 38
E 500–800 m
mean 8 0 0 0 2 0 0 0 0 2 0
SD 4 0 0 0 1 0 0 0 0 1 0
CV% 54 0 0 0 65 0 0 0 0 73 0
overall 100–800 m
mean 15 20 7 6 49 13 10 29 27 101 122
SD 6 14 2 3 19 5 3 8 4 13 26
CV% 43 74 21 47 39 38 27 28 15 13 21
Pirrera, Bottari, Busalacchi, Giordano, Modica, Perdichizzi, Perdichizzi, Profeta & Rinelli Distribution and population structure of blue-mouth
Marine Ecology 30 (Suppl.1) (2009) 161–174 ª 2009 Blackwell Verlag GmbH 171
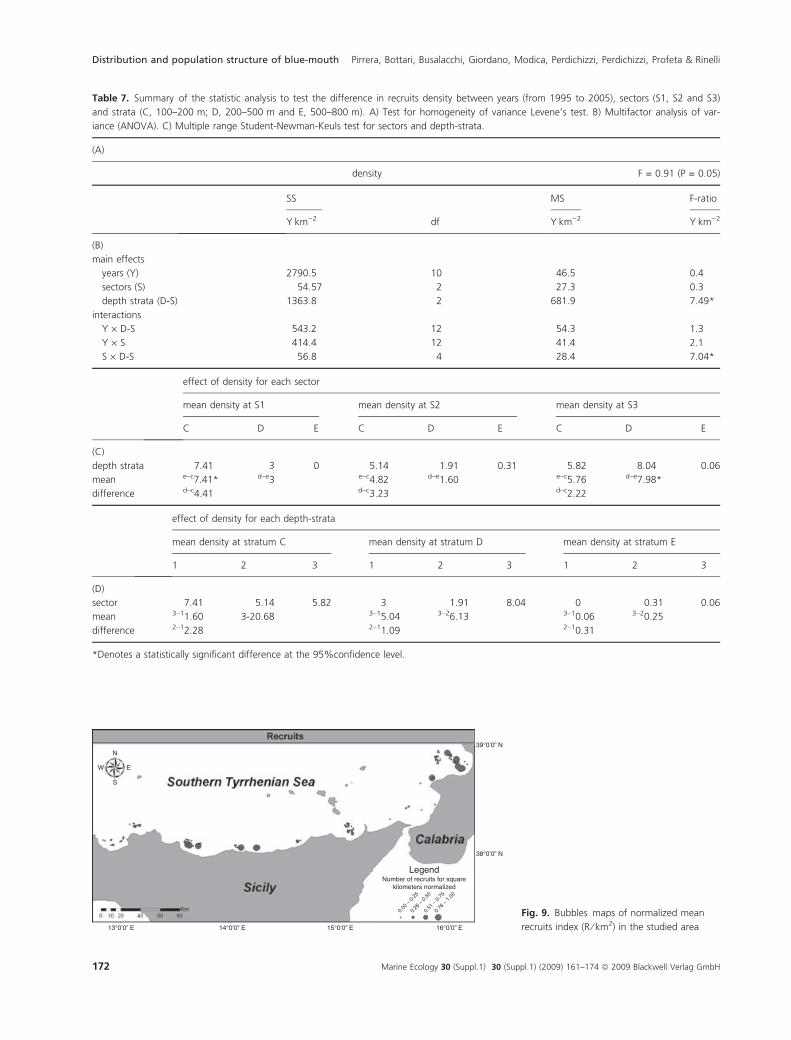
Table 7. Summary of the statistic analysis to test the difference in recruits density between years (from 1995 to 2005), sectors (S1, S2 and S3)
and strata (C, 100–200 m; D, 200–500 m and E, 500–800 m). A) Test for homogeneity of variance Levene’s test. B) Multifactor analysis of var-
iance (ANOVA). C) Multiple range Student-Newman-Keuls test for sectors and depth-strata.
(A)
density F = 0.91 (P = 0.05)
SS
df
MS F-ratio
YÆkm)2 YÆkm)2 YÆkm)2
(B)
main effects
years (Y) 2790.5 10 46.5 0.4
sectors (S) 54.57 2 27.3 0.3
depth strata (D-S) 1363.8 2 681.9 7.49*
interactions
Y · D-S 543.2 12 54.3 1.3
Y · S 414.4 12 41.4 2.1
S · D-S 56.8 4 28.4 7.04*
effect of density for each sector
mean density at S1 mean density at S2 mean density at S3
C D E C D E C D E
(C)
depth strata 7.41 3 0 5.14 1.91 0.31 5.82 8.04 0.06
mean e–c7.41* d–e3 e–c4.82 d–e1.60 e–c5.76 d–e7.98*
difference d–c4.41 d–c3.23 d–c2.22
effect of density for each depth-strata
mean density at stratum C mean density at stratum D mean density at stratum E
1 2 3 1 2 3 1 2 3
(D)
sector 7.41 5.14 5.82 3 1.91 8.04 0 0.31 0.06
mean 3–11.60 3-20.68 3–15.04 3–26.13 3–10.06 3–20.25
difference 2–12.28 2–11.09 2–10.31
*Denotes a statistically significant difference at the 95%confidence level.
N
E
S
13°0’0” E 14°0’0” E 15°0’0” E 16°0’0” E
0.00
– 0
.25
0.26
– 0
.50
0.51
– 0
.75
0.76
– 1
.00
38°0’0” N
Legend Number of recruits for square
kilometers normalized
39°0’0” N
W
Fig. 9. Bubbles maps of normalized mean
recruits index (R ⁄ km2) in the studied area
Distribution and population structure of blue-mouth Pirrera, Bottari, Busalacchi, Giordano, Modica, Perdichizzi, Perdichizzi, Profeta & Rinelli
172 Marine Ecology 30 (Suppl.1) 30 (Suppl.1) (2009) 161–174 ª 2009 Blackwell Verlag GmbH
References
Abecais D., Costa A.R., Pereira J.G., Pinho M.R. (2006) Age
and growth of bluemouth, Helicolenus dactylopterus (Delar-
oche, 1809) from the Azores. Fisheries Research, 79, 148–154.
Anonymous (2007) International bottom trawl survey in the
Mediterranean (MEDITS). MEDITS survey, Instruction man-
ual, version 5. IFREMER, Nantes cedex France, April 2007, 62 pp.
Azzaro F., Raffa F., Marini A., Rinelli P. (2006) Caratteristiche
idrobiologiche del Golfo di S. Eufemia (Tirreno sud orien-
tale): estate 2005. Biologia Marina Mediterranea, 13(2), 228–
229.
Bertrand J., Gil De Sola L., Papacostantinou C., Relini G., Sou-
plet A. (2002) The general specifications of the MEDITS
surveys. Scientia Marina, 66, II (suppl. 2), 9–17.
Cartes J.E., Sorbe J.C., Sarda F. (1994) Spatial distribution of
deep-sea decapods and euphausiids near the bottom in the
northwestern Mediterranean. Journal of Experimental Marine
Biology and Ecology, 179, 131–144.
Clarke K.R., Green R.H. (1988) Statistical design and analysis
for a biological effects study. Marine Ecology Progress Series,
46, 213–226.
Clarke K.R., Warwick R.M. (2001) Changes in Marine Commu-
nities: an Approach to Statistical Analysis and Interpretation
(2nd edition), PRIMER-E, Plymouth.
D’Onghia G., Matarrese A., Tursi A. (1992) Biologia di Heli-
colenus dactylopterus (Delaroche, 1809): Distribuzione e ac-
crescimento sui fondali batiali del mar Ionio. Oebalia,
17(Suppl.), 129–131.
D’Onghia G., Mastrototaro F., Panza M. (1996) On the growth
and mortality of rockfish, Helicolenus dactylopterus (Delar-
oche 1809), from the Ionian Sea. FAO Fisheries Report, n.
533, 143–152.
Della Croce N. (2000) Il Mar Tirreno. Atti Associazione Itali-
ana Oceanologia e Limnologia, 13(2), 363–378.
Denney N.H., Jennings S., Reynolds J.D. (2002) Life-history
correlates of maximum population growth rates in marine
fishes. Proceedings of the Royal Society of London: Biological
Sciences, 269, 2229–2237.
Fischer W., Bauchot M.L., Schneider M. (1987) Fiches FAO
d’Identification des Especes pour les Besoins de la Peche. Medi-
terranee et Mer Noire. Zone de Peche 37. 2. FAO, Rome.
Vertebres: 761–1530 pp.
Froglia C. (1976) Observations on the feeding of Helicolenus
dactylopterus (Delaroche) (Pisces, Scorpaenidae) in the Med-
iterranean Sea. Rapports et Process-Verbaux des Reunions du
la Commission Internationale Pour l’Exploration Scientique de
la Mer Mediterranee, 23(8), 47–48.
Gayanilo F.C. Jr, Sparre P., Pauly D. (2005) The FAO-ICLARM
stock assessment tools II (FiSAT) user’s guide. FAO, Rome: 168.
Greco S., Rinelli P., Giordano D., Perdichizzi F. (1998) Valutazione
delle risorse demersali da Capo Suvero a San Vito lo Capo (Tir-
reno meridionale). Biologia Marina Mediterranea, 5(3), 74–84.
Gunderson D.R. (1993) Surveys of fisheries resources. John
Wiley & Sons, New York: 248 pp.
Hureau J.C., Litvinenko N.I. (1986) Scorpaenidae In: White-
head P.J.P., Bauchot M.L., Hureau J.C., Nielsen J., Tortonese
E. (Eds), Fishes of the North-eastern Atlantic and the Mediter-
ranean. UNESCO, Paris, 3, 1211–1229.
IREPA (2008). Osservatorio economico sulle strutture produttive
della pesca marittima in Italia. 2006 IREPA. Franco Angeli,
Milan: 288 pp.
Jennings S., Reynolds J.D., Mills S.C. (1998) Life history
correlates of responses to fisheries exploitation. Proceedings
of the Royal Society of London: Biological Sciences, 265,
333–339.
Macpherson E. (1979) Estudio sobre el regimen alimentario de
algunos peces en el Mediterraneo occidental. The Zoological
Miscellany, 5, 93–107.
Macpherson E., Duarte C.M. (1991) Bathymetric trends in
demersal fish size: is there a general relationship? Marine
Ecology Progress Series, 71, 103–112.
Massutı E., Morales Nin B., Moranta J., Prats L. (2000a)
Bathymetric distribution and biological parameters of the
blue-mouth Helicolenus dactylopterus (Pisces: Scorpaenidae),
on the trawling bottoms off the Iberian Mediterranean coast.
Resources halieutiques de la Mediterranee, 7, 141–150.
Massutı E., Morales Nin B., Moranta J. (2000b) Age and
growth of blue-mouth, Helicolenus dactylopterus (Osteichth-
yes: Scorpaenidae), in the western Mediterranean. Fisheries
Research, 46, 165–176.
Massutı E., Moranta J., Gil De Sola L., Morales Nin B., Prats
L. (2001) Distribution and population structure of the rock-
fish Helicolenus dactylopterus (Pisces: Scorpaenidae), in the
western Mediterranean. Journal of the Marine Biological
Association of the United Kingdom, 81, 129–141.
Millot C. (1999) Circulation in the Western Mediterranean
Sea. Journal of Marine Systems, 20, 423–442.
Munoz M., Casadevall M., Bonet S. (1999) Annual reproduc-
tive cycle of Heliconeus dactylopterus dactylopterus (Teleostei:
Scorpaeniformes) with special reference to the ovaries sperm
storage. Journal of the Marine Biological Association of the
United Kingdom, 79, 3.
Munoz M., Casadevall M., Bonet S., Quagio-Grassiotto I.
(2000) Sperm storage structures in the ovary of Helicolenus
dactylopterus dactylopterus (Teleostei: Scorpaenidae): an ul-
trastructural study. Environmental Biology of Fishes, 58, 53–
59.
Munoz M., Casadevall M., Bonet S. (2002a) Gametogenesis of
Helicolenus dactylopterus dactylopterus (Teleostei: Scorpaeni-
formes). Sarsia, 87(2), 119–127.
Munoz M., Koya Y., Casadevall M. (2002b) Histochemical
analysis of sperm storage in Helicolenus dactylopterus dactyl-
opterus (Teleostei: Scorpaenidae). Journal of Experimental
Zoology. Part A: Comparative Experimental Biology, 292(2),
156–164.
Munro J.L., Pauly D. (1983) A simple method for comparing
the growth of fishes and invertebrates. Fishbyte, 1, 5–6.
Peirano A., Tunesi L. (1986) Preliminary notes on the biology
of Helicolenus dactylopterus (Delaroche, 1809) in the
Pirrera, Bottari, Busalacchi, Giordano, Modica, Perdichizzi, Perdichizzi, Profeta & Rinelli Distribution and population structure of blue-mouth
Marine Ecology 30 (Suppl.1) (2009) 161–174 ª 2009 Blackwell Verlag GmbH 173
Ligurian Sea. Rapport de la Commission Internationale pour
l’exploration scientifique de la Mer Mediterranee, 30, 233.
Ragonese S. (1989) L’applicazione dell’equazione di Von Berta-
lanffy generale: il caso di Helicolenus dactylopterus (Delar-
oche) (Pisces: Scorpaenidae) del Tirreno settentrionale.
Oebalia, 15, 753–762.
Ragonese S., Reale B. (1992) Estimation of mortality rates and
critical age of Helicolenus dactylopterus (Pisces: Scorpaenifor-
mes) in the Sicilian Channel (Central Mediterranean Sea).
Rapport de la Commission Internationale pour l’exploration
scientifique de la Mer Mediterranee, 33, 307.
Ragonese S., Reale B. (1995) Distribuzione e crescita dello
scorfano di fondale, Helicolenus dactylopterus (Delaroche,
1809), nello Stretto di Sicilia (Mar Mediterraneo). Biologia
Marina Mediterranea, 2(2), 269–273.
Relini G., Bertrand J., Zamboni A. (1999) Synthesis of the
knowledge on bottom fishery resources in Central Mediter-
ranean, Italy and Corsica. Biologia Marina Mediterranea,
6(suppl.1), 868.
Ribas D., Munoz M., Casadevall M., Gil De Sola L. (2006)
How does the northern Mediterranean population of Heli-
colenus dactylopterus dactylopterus resist fishing pressure?
Fisheries research, 79, 285–293.
Romanelli M., Palladino S., Tarulli E., Ferretti M. (1997) Stima
dell’accrescimento di Helicolenus dactylopterus dactylopterus
(Delaroche, 1809), nello Stretto di Sicilia (Mar Mediterra-
neo). Biologia Marina Mediterranea, 2, 269–273.
Russ G.R., Alcala A.C. (1998) Natural fishing experiments in
marine reserves. Coral Reefs, 17, 399–416.
Smith A. (2003) A simple multivariate technique to improve
the design of a sampling strategy for age-based fishery moni-
toring. Fisheries Research, 64, 79–85.
Ungaro N., Marano G. (1995) Analytical models for Mediter-
ranean species: an application on the Helicolenus dactylopte-
rus (Delaroche) resource in the lower Adriatic. Rapport de la
Commission Internationale pour l’exploration scientifique de la
Mer Mediterranee., 34, 260.
Distribution and population structure of blue-mouth Pirrera, Bottari, Busalacchi, Giordano, Modica, Perdichizzi, Perdichizzi, Profeta & Rinelli
174 Marine Ecology 30 (Suppl.1) 30 (Suppl.1) (2009) 161–174 ª 2009 Blackwell Verlag GmbH