original article computer-aided identification of novel
TRANSCRIPT

© Journal for Modeling in Ophthalmology 2016; 2:59-69Original article
Computer-aided identification of novel ophthalmic artery waveform parameters in healthy subjects and glaucoma patientsLucia Carichino1, Giovanna Guidoboni1,2,3, Alice Chandra Verticchio Vercellin4, Giovanni Milano4, Carlo Alberto Cutolo5, Carmine Tinelli6, Annalisa De Silvestri6, Sergey Lapin7,8, Joshua C. Gross3, Brent Siesky3, Alon Harris3
1Department of Mathematical Sciences, Indiana University Purdue University Indianapolis, Indianapolis, IN, USA; 2Institut de Recherche Mathématique Avancée UMR 7501, Université de Strasbourg, Strasbourg, France; 3Eugene and Marilyn Glick Eye Institute, Indiana University School of Medicine, Indianapolis, IN, USA; 4University Eye Clinic, Foundation IRCCS, Policlinico San Matteo, Pavia, Italy; 5University Eye Clinic, DiNOGMI, University of Genoa, Genoa, Italy; 6Clinical Epidemiology and Biometric Unit, Foundation IRCCS, Policlinico San Matteo, Pavia, Italy; 7Washington State University, Pullman, WA, USA; 8Kazan Federal University, Kazan, Russian Federation
Abstract
Purpose: Arterial waveform parameters (WPs) are commonly used to monitor and diagnose systemic diseases. Color Doppler Imaging (CDI) is a consolidated technique to measure blood velocity profile in some of the major ocular vessels. This study proposes a computer-aided manipulation process of ophthalmic artery (OA) CDI images to classify and quantify WPs that might be significant in the assessment of glaucoma.Methods: Fifty CDI images acquired by four different operators on nine healthy individuals and 38 CDI images of 38 open-angle glaucoma (OAG) patients were considered. An ad-hoc semi-automated image processing code was implemented to detect the digitalized OA velocity waveform and to extract the WPs. Concordance correlation coefficient (CCC), two-sample t-test and Pearson’s correlation coefficient were used to test for similarities, differences and associations among variables.
Correspondence: Lucia Carichino, 402 N. Blackford St, LD 270, 46202 Indianapolis, USA. E-mail: [email protected]
L. Carichino et al.60
Results: The OA-CDI images manipulation proposed showed a higher concordance between measured peak systolic velocity (PSV) data and extracted PSV data (0.80≤CCC≤0.98) than on end diastolic velocity (EDV) (0.45≤CCC≤0.63) and resistive index (RI) (0.30≤CCC≤0.58) data. In OAG patients, EDV, RI, subendocardial viability ratio (SEVR), period (T), area ratio (f) and normalized distance between ascending and descending limb (DAD/T) were found statistically correlated to at least one of the following factors: gender, age, ocular medications and year of diagnosis. When compared to healthy individuals, OAG patients OA-CDI profiles showed statistically higher values of f (p < 0.001) and DAD/T (p = 0.002) (p-values corrected by age and gender).Conclusion: The proposed computer-aided manipulation of OA-CDI images allowed to identify DAD/T as a novel WP that vary significantly among healthy individuals and OAG patients, and among female and male OAG patients. Future studies on lon-gitudinal OAG data are suggested to investigate the potential of DAD/T to predict severity and progression of the disease.
Key words: color Doppler imaging, glaucoma, image processing, ophthalmic artery, velocity, waveform parameters
1. Introduction
Ophthalmic disease encompasses many risk factors and physiological pathways, including those of the ocular vasculature. For instance, vascular deficits have been identified in open-angle glaucoma (OAG),1-4 diabetes,5,6 and age-related macular degeneration (AMD),7-10 among other diseases. Additionally, vascular deficits are more prone in certain groups such as those of African descent.11 Geometric and hemodynamic features of the ocular vasculature can be visualized and measured using various techniques, such as fundus imaging, optical coherence tomography (OCT), Heidelberg retinal flowmetry (HRF), confocal scanning laser flowmetry, cannon laser blood flowmeter, retinal angiography, and Color Doppler imaging (CDI). In this article, we focus on CDI and the computer-aided extraction of arterial waveform parameters (WPs).
CDI is a consolidated technique to measure blood velocity profile in some of the major ocular vessels, including the ophthalmic artery (OA), the central retinal artery (CRA), the posterior ciliary arteries (PCAs), as well as the central retinal vein (CRV). CDI measurements are noninvasive, collected data is not affected by poor ocular media, and absolute velocity measurements can be confirmed.12 CDI studies have shown significant blood velocity derangements in the OA, CRA, and PCAs in association with diabetic retinopathy,13 glaucoma,14-17 and they have also been utilized to estimate the intracranial pressure (ICP) noninvasively.18
For decades, CDI has demonstrated its effectiveness and reliability in measuring

Analysis of CDI-OA images in glaucoma 61
different vascular beds in the eye and throughout the body.12 For example, CDI is commonly used in the fields of radiology,19,20 cardiology,21-24 and obstetrics.25,26 Interestingly, since the arterial waveform changes as we move along the arterial tree, various WPs have been proposed in the scientific literature. Typical WPs utilized in ophthalmology are peak systolic velocity (PSV), end diastolic velocity (EDV) and resistive index (RI).27 Galassi et al. demonstrated that CDI EDV and RI of the ophthalmic artery are correlated with the risk of visual field progression in patients with OAG.28 Recently, several WPs commonly used in renal and hepatic arteries to predict transplant failures and detect stenosis might provide new insights in the characterization of the OA velocity waveform in glaucoma patients.29 In the present study, we further advance the analysis of CDI measurements by proposing a com-puter-aided manipulation process of ophthalmic artery CDI images that enables the extraction of a novel set of WPs that might help better characterize the disease status in glaucoma.
2. Methods
In this study CDI images obtained form healthy individuals and glaucoma patients are considered. The CDI images of healthy individuals were collected at the University Eye Clinic, Foundation IRCCS, Policlinico San Matteo, Pavia, Italy, and the CDI images of glaucoma patients were collected at the Eugene and Marilyn Glick Eye Institute, Indiana University School of Medicine, Indianapolis, IN, USA. In Pavia, the Siemens Antares Stellar Plus™, probe VFX 9-4 MHz vascular linear array, was used to obtain 50 CDI images acquired by 4 different operators on 9 healthy individuals. In Indianapolis, the Philips HDI 5000 SonoCT Ultrasound System with the microvascu-lar small parts clinical option (Philips Medical Systems, Bothell, Washington, USA), 7.5 MHz linear probe, was used to obtain CDI images of 38 glaucoma patients within the Indianapolis Glaucoma Progression Study. The baseline characteristics of the study group are described in Table 1. The PSV, EDV and RI raw data are obtained directly from the ultrasound machine as an average of the values measured over at least three cardiac cycles.
An ad-hoc semi-automated image processing code was implemented in MATLAB to analyze the CDI images, detect the digitalized OA velocity waveforms and extract the WPs (Fig. 1). The image processing consists of several steps:
1. The CDI image in red-green-blue (RGB) color scale is converted into grayscale format;
2. The resulting grayscale image is analyzed to extract the time scale, velocity scale, cardiac cycle period and height of PSV (all of them measured in terms of image pixels);
3. The original grayscale image is cropped, using the previously extracted

Table 1. Baseline characteristics of the healthy individuals and glaucoma patients included in the study.
Healthy Glaucoma
Number of patients 9 38
Females 5 19
Males 4 19
Age 24 ± 2 70 ± 13
Years of glaucoma diagnosis at the time of the visit - 17 ± 10
Intraocular pressure [mmHg] 14 ± 3 16 ± 4
Heart rate (HR) [bpm] - 67 ± 12
Systolic blood pressure (SBP) [mmHg] 117 ± 7 138 ± 21
Diastolic blood pressure (DBP) [mmHg] 70 ± 8 84 ± 11
Mean arterial pressure (MAP) [mmHg] 86 ± 7 102 ± 13
Systolic ocular perfusion pressure (SOPP) [mmHg] 103 ± 8 77 ± 15
Diastolic ocular perfusion pressure (DOPP) [mmHg] 56 ± 8 41 ± 8
Mean ocular perfusion pressure (MOPP) [mmHg] 43 ± 5 53 ± 10
Ocular medications - 25 (66%)
Systemic medications - 22 (58%)
Peak systolic velocity (PSV) raw [cm/s] 40 ± 7 26 ± 10
End diastolic velocity (EDV) raw [cm/s] 8 ± 2 6 ± 3
Resistive index (RI) raw 0.80 ± 0.05 0.78 ± 0.7
Fig. 1. A summary of the semi-automated image manipulation process used to extract the ophthalmic artery waveform parameters. Starting from the CDI image (left), the digitalized OA velocity waveform is detected (center) and the corresponding waveform parameters are extracted (right).
L. Carichino et al.62
Analysis of CDI-OA images in glaucoma 63
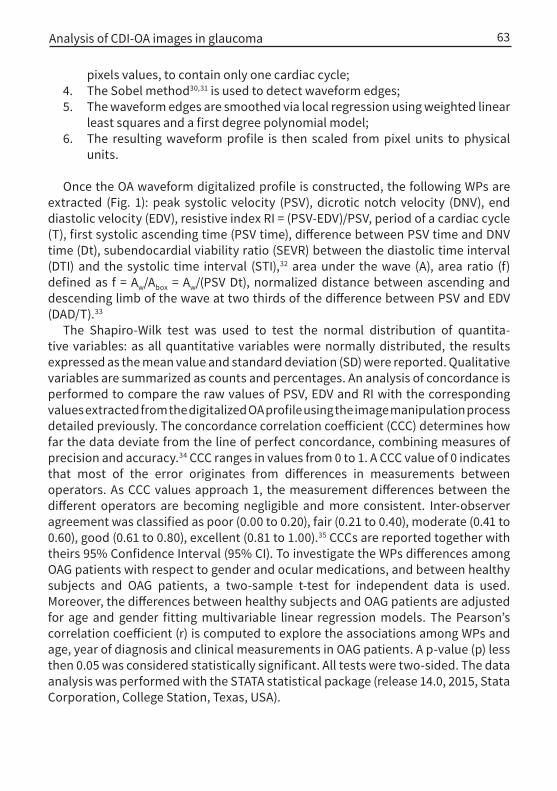
pixels values, to contain only one cardiac cycle; 4. The Sobel method30,31 is used to detect waveform edges;5. The waveform edges are smoothed via local regression using weighted linear
least squares and a first degree polynomial model;6. The resulting waveform profile is then scaled from pixel units to physical
units.
Once the OA waveform digitalized profile is constructed, the following WPs are extracted (Fig. 1): peak systolic velocity (PSV), dicrotic notch velocity (DNV), end diastolic velocity (EDV), resistive index RI = (PSV-EDV)/PSV, period of a cardiac cycle (T), first systolic ascending time (PSV time), difference between PSV time and DNV time (Dt), subendocardial viability ratio (SEVR) between the diastolic time interval (DTI) and the systolic time interval (STI),32 area under the wave (A), area ratio (f) defined as f = Aw/Abox = Aw/(PSV Dt), normalized distance between ascending and descending limb of the wave at two thirds of the difference between PSV and EDV (DAD/T).33
The Shapiro-Wilk test was used to test the normal distribution of quantita-tive variables: as all quantitative variables were normally distributed, the results expressed as the mean value and standard deviation (SD) were reported. Qualitative variables are summarized as counts and percentages. An analysis of concordance is performed to compare the raw values of PSV, EDV and RI with the corresponding values extracted from the digitalized OA profile using the image manipulation process detailed previously. The concordance correlation coefficient (CCC) determines how far the data deviate from the line of perfect concordance, combining measures of precision and accuracy.34 CCC ranges in values from 0 to 1. A CCC value of 0 indicates that most of the error originates from differences in measurements between operators. As CCC values approach 1, the measurement differences between the different operators are becoming negligible and more consistent. Inter-observer agreement was classified as poor (0.00 to 0.20), fair (0.21 to 0.40), moderate (0.41 to 0.60), good (0.61 to 0.80), excellent (0.81 to 1.00).35 CCCs are reported together with theirs 95% Confidence Interval (95% CI). To investigate the WPs differences among OAG patients with respect to gender and ocular medications, and between healthy subjects and OAG patients, a two-sample t-test for independent data is used. Moreover, the differences between healthy subjects and OAG patients are adjusted for age and gender fitting multivariable linear regression models. The Pearson’s correlation coefficient (r) is computed to explore the associations among WPs and age, year of diagnosis and clinical measurements in OAG patients. A p-value (p) less then 0.05 was considered statistically significant. All tests were two-sided. The data analysis was performed with the STATA statistical package (release 14.0, 2015, Stata Corporation, College Station, Texas, USA).

L. Carichino et al.64
3. Results
When considering all individuals included in the study, i.e., healthy individuals and glaucoma patients, the analysis showed an excellent concordance on PSV (CCC = 0.85; 95%CI 0.77-0.93), a good concordance on EDV (CCC = 0.63; 95%CI: 0.49-0.78) and a fair concordance on RI (CCC = 0.33; 95% CI: 0.14-0.52). When considering only glaucoma patients, the analysis showed a good concordance on PSV (CCC = 0.80; 95%CI: 0.69-0.91), a good concordance on EDV (CCC = 0.62; 95% CI: 0.46-0.78) and a fair concordance on RI (CCC = 0.30; 95%CI: 0.09-0.52). When considering only healthy individuals, the analysis showed an excellent concordance on PSV (CCC = 0.99; 95%CI: 0.97-1.00), a moderate concordance on EDV (CCC=0.45; 95%CI: 0.15-0.74) and a moderate concordance on RI (CCC = 0.58; 95%CI: 0.31-0.85).
When compared to male glaucoma patients, female glaucoma patients showed statistically higher values of the ratio DAD/T (p = 0.002), and statistically lower values of SEVR (p = 0.031). No statistical difference was found in the remaining WPs when comparing glaucoma patients of different gender. Glaucoma patients taking ocular medications showed significantly higher values of T (p = 0.005) and SEVR (p = 0.002) when compared to glaucoma patients not taking ocular medications. No statistical difference was found in the remaining WPs when comparing glaucoma patients taking ocular medications with glaucoma patients not taking ocular medications.
Glaucoma patients’ age is positively correlated with RI (r = 0.52; p < 0.001) and negatively correlated with EDV (r = -0.35; p = 0.030). No statistical correlation was found among the remaining WPs and glaucoma patients’ age. The years of glaucoma diagnosis at the time of the visit is negatively correlated with T (r = -0.41; p = 0.015) and SEVR (r = -0.36; p = 0.038). No statistical correlation was found among the remaining WPs and glaucoma patients’ years of diagnosis at the time of the visit. Among the set of clinical measurements of heart rate (HR), systolic blood pressure (SBP), diastolic blood pressure (DBP), mean arterial pressure (MAP), intraocular pressure (IOP), systolic ocular perfusion pressure (SOPP), diastolic ocular perfusion pressure (DOPP) and mean ocular perfusion pressure (MOPP), HR is the only parameter that showed statistical correlations with some of the WPs in glaucoma patients: HR is negatively correlated with T (r = -0.65), PSV time (r = -0.41), SEVR (r = -0.39), f (r = -0.35).
When compared to healthy individual, glaucoma patients showed significantly higher values of f (p < 0.001) and DAD/T (p < 0.001), and statistically lower values of A (p = 0.041), Dt (p = 0.008), PSV (p = 0.004) and EDV (p = 0.033) (Fig. 2). If the comparison is adjusted by gender and age (fitting a multivariable linear regression model), then, glaucoma patients showed significantly higher values of f (p < 0.001) and DAD/T (p = 0.002), and significantly lower values of RI (p = 0.002) when compared with healthy individuals. No statistical difference was found in the other WPs when comparing glaucoma patients with healthy individuals.

Fig. 2. Digitalized OA velocity profile of a healthy individual (left) and a glaucoma patient (right).
Analysis of CDI-OA images in glaucoma 65
4. Discussion and conclusions
Over the past decades, CDI has gained popularity as a reliable tool to measure blood flow in a variety of vascular beds throughout the body. For instance, analysis of different WPs in cardiology has led to novel approaches in diagnosis and prognosis.21-
24 When measuring ocular blood flow, PSV, EDV, and RI have been traditionally used, and several studies have shown that OAG patients have reduced blood velocity with respect to these parameters when compared to healthy patients. However, novel approaches to analyzing CDI waveform parameters in ophthalmology have trailed behind the advancements of WP characterization in other fields of medicine. In this study, we investigated whether new approaches to analyzing WPs using comput-er-aided manipulation of OA-CDI images could distinguish between healthy subjects and OAG patients.
The OA-CDI images manipulation proposed here showed a higher concordance between PSV raw data and extracted PSV data than on EDV and RI data. Note that, the raw PSV, EDV and RI values were obtained averaging over at least three cardiac cycles; instead the corresponding parameters extracted via the OA-CDI manipula-tion process correspond to just one of those cardiac cycles. Moreover, CDI PSV mea-surements have been found to be more reproducible and accurate then EDV and RI measurements.36-38
There now is strong evidence that OAG patients have a vascular contribution to their disease. Several previous studies have suggested that OAG patients have reduced ocular blood flow velocities compared to healthy subjects. Most recently, Abegão Pinto et al. showed that when examining the ocular vasculature of 614 subjects using CDI, OAG patients had lower PSV and EDV when compared to healthy

L. Carichino et al.66
subjects.39 In our study we found that OAG patients had a statistically significant higher DAD/T than did healthy subjects. This is interesting because when Oliva and Roztocil33 examined patients with obliterating atherosclerosis by Doppler ultrasound and then analyzed the waveform to identify P/L, which is identical to DAD/T here, they found that P/L identified the severity of the disease and the presence or absence of progression based on the variability coefficients. We also found that OAG patients had a statistically significant higher area ratio f than did healthy individuals. Of note, f represents another method to measure the shape of the wave in the systolic portion of the cardiac cycle similar to that proposed by Oliva and Roztocil. The correlation between DAD/T, vascular status, and OAG could prove to enhance the screening of OAG, and potentially serve as a marker for progression.
It has long been debated whether men or women are at higher risk of OAG. Recently, Kapetanakis et al. found that men were more likely to have OAG.40 However, Vajaranant et al. found that older women were more at risk for OAG.41 Additionally, it is thought that post-menopausal women could be at a higher risk of OAG due to the loss of estrogen and its protective vascular effects.42 In our study we found a statistically significant increase in DAD/T in females when comparing male and female patients with OAG whose average age was 70 ± 13. This is significant because by examining ultrasonography waveforms in a non-traditional way, it may be possible to differentiate between female and male patients at higher risk and predict severity for OAG.
It is well-known that age is a risk factor for OAG,43 and its been proposed that while age alone may not give rise to disease, its advancement generates vulnerable vascular beds that increase susceptibility to further insults.44 In our study, we found that age correlated positively with RI and negatively with EDV. To date, there have been only a few reports specifically detailing ocular blood flow parameters as they correlate with age.45-47 These findings suggest that, similar to other vascular beds,48 the OA is susceptible to the atherosclerotic effects of aging.
Although the correlation with DAD/T, glaucoma, and gender shows very promising results, there were, however, several limitations to the study design. The difference in mean age between healthy and OAG patients was 46 years. Due to the role of age on general health and disease process, future studies comparing age-matched healthy and OAG patients might provide closer evaluation between healthy subjects and OAG. The total number of enrolled subjects was 47, with nine healthy subjects. In future studies, analysis of a larger population with equal numbers of healthy subjects and OAG patients would provide greater insight into the potential role of DAD/T. Some of the OAG patients were taking potentially vasoactive OAG medications throughout the study, and however, since they were not prescribed a uniform treatment regimen, we did not expect a uniform bias. Future studies with more steady treatment protocols could mitigate bias among vasoactive OAG medications taken by participants.
In summary, our computed-aided analysis of OA velocity waveforms obtained

Analysis of CDI-OA images in glaucoma 67
References1. Costa VP, Harris A, Anderson D, et al. Ocular perfusion pressure in glaucoma. Acta Ophthalmol
2014;92(4):e252-266.2. Cherecheanu AP, Garhofer G, Schmidl D, Werkmeister R, Schmetterer L. Ocular perfusion pressure
and ocular blood flow in glaucoma. Curr Opin Pharmacol 2013;13(1):36-42.3. Yanagi M, Kawasaki R, Wang JJ, et al. Vascular risk factors in glaucoma: a review. Clin Exper Ophthal-
mol 2011;39(3):252-258.4. Schmidl D, Garhofer G, Schmetterer L. The complex interaction between ocular perfusion pressure
and ocular blood flow - relevance for glaucoma. Exper Eye Res 2011;93(2):141-155.5. Gerber AL, Harris A, Siesky B, et al. Vascular Dysfunction in Diabetes and Glaucoma: A Complex Rela-
tionship Reviewed. J Glaucoma 2015;24(6):474-479.6. Lee E, Harris A, Siesky B, et al. The influence of retinal blood flow on open-angle glaucoma in patients
with and without diabetes. Eur J Ophthalmol 2014;24(4):542-549.7. Harris A, Chung HS, Ciulla TA, Kagemann L. Progress in measurement of ocular blood flow and rele-
vance to our understanding of glaucoma and age-related macular degeneration. Progr Ret Eye Res 1999;18(5):669-687.
via CDI were able to distinguish WP values between healthy subjects and OAG patients, as well as between gender among OAG patients. In future studies, analysis of DAD/T should be examined in relationship to longitudinal data of OAG patients to investigate the potential to predict severity and progression of the disease is suggested.
Acknowledgements
The authors would like to thank Annahita Amireskandari for her help in gathering data and the Centro per la Comunicazione e la Ricerca of the Ghislieri College of Pavia, Italy, for supporting the project ‘Investigation of hemodynamic of the optic nerve with color Doppler imaging in normal tension glaucoma’. This work has been partially supported by the NSF DMS-1224195, NIH 1R21EY022101-01A1, a grant from Research to Prevent Blindness (RPB, NY, USA), an Indiana University Collab-orative Research Grant of the Office of the Vice President for Research, the Chair Gutenberg funds of the Cercle Gutenberg (France) and the Labex IRMIA (University of Strasbourg, France).
Dr. Alon Harris would like to disclose that he receives remuneration from Stemnion, Biolight, Nano Retina, AdOM, Science Based Health, Isarna Therapeu-tics, and Ono Pharmaceuticals for serving as a consultant. Dr. Harris also holds an ownership interest in AdOM, Nano Retina, and Oxymap. All relationships listed above are pursuant to Indiana University’s policy on outside activities. None of the other authors listed have any financial disclosures. There are no conflicts of interest to report.

L. Carichino et al.68
8. Pemp B, Schmetterer L. Ocular blood flow in diabetes and age-related macular degeneration. Can J Ophthalmol/J Can Ophtalmol 2008;43(3):295-301.
9. Ciulla TA, Harris A, Martin BJ. Ocular perfusion and age-related macular degeneration. Acta Ophthal-mol Scand 2001;79(2):108-115.
10. Ehrlich R, Harris A, Kheradiya NS, et al. Age-related macular degeneration and the aging eye. Clin Interv Aging 2008;3(3):473-482.
11. Siesky B, Harris A, Racette L, et al. Differences in ocular blood flow in glaucoma between patients of African and European descent. J Glaucoma 2015;24(2):117-121.
12. Harris A, Jonescu-Cuypers CP, Kagemann L, et al. Atlas of Ocular Blood Flow. Vascular Anatomy, Pathophysiology, and Metabolism. Philadelphia, PA: Elsevier 2010.
13. Meng N, Liu J, Zhang Y, et al. Color Doppler Imaging Analysis of Retrobulbar Blood Flow Velocities in Diabetic Patients Without or With Retinopathy: A Meta-analysis. J Ultrasound Med 2014;33(8):1381-1389.
14. Srikanth K, Kumar MA, Selvasundari S, Prakash ML. Colour Doppler Imaging of Ophthalmic Artery and Central Retinal Artery in Glaucoma Patients with and without Diabetes Mellitus. J Clin Diagn Res 2014;8(4):VC01-VC02.
15. Suprasanna K, Shetty CM, Charudutt S, Kadavigere R. Doppler evaluation of ocular vessels in patients with primary open angle glaucoma. J Clin Ultrasound 2014;42(8):486-491.
16. Abegao Pinto L, Vandewalle E, Willekens K, Marques-Neves C, Stalmans I. Ocular pulse amplitude and Doppler waveform analysis in glaucoma patients. Acta Ophthalmol 2014;92(4):e280-285.
17. Jimenez-Aragon F, Garcia-Martin E, Larrosa-Lopez R, et al. Role of color Doppler imaging in early diagnosis and prediction of progression in glaucoma. BioMed Res Internat 2013;2013:871689.
18. Querfurth HW, Arms SW, Lichy CM, Irwin WT, Steiner T. Prediction of intracranial pressure from non-invasive transocular venous and arterial hemodynamic measurements: a pilot study. Neurocrit Care 2004;1(2):183-194.
19. Leoniuk J, Lukasiewicz A, Szorc M, et al. Doppler ultrasound detection of preclinical changes in foot arteries in early stage of type 2 diabetes. Polish J Radiol 2014;79:283-289.
20. Tahmasebpour HR, Buckley AR, Cooperberg PL, Fix CH. Sonographic examination of the carotid arteries. Radiographics 2005;25(6):1561-1575.
21. Correale M, Totaro A, Ieva R, et al. Tissue Doppler imaging in coronary artery diseases and heart failure. Curr Cardiol Rev 2012;8(1):43-53.
22. Kadappu KK, Thomas L. Tissue Doppler imaging in echocardiography: value and limitations. Heart Lung Circ 2015;24(3):224-233.
23. Choi J, Heo R, Hong GR, et al. Differential effect of 3-dimensional color Doppler echocardiography for the quantification of mitral regurgitation according to the severity and characteristics. Circ Cardio-vasc Imaging 2014;7(3):535-544.
24. Wunderlich NC, Beigel R, Siegel RJ. Management of mitral stenosis using 2D and 3D echo-Doppler imaging. JACC Cardiovasc Imaging 2013;6(11):1191-205.
25. He J, Yan G. Research on Ovary Blood Flow Before and After Uterine Artery Embolization with the Application of Color Doppler Blood Imaging. J Reprod Med 2015;60(11-12):513-520.
26. Saini AP, Ural S, Pauliks LB. Quantitation of fetal heart function with tissue Doppler velocity imag-ing-reference values for color tissue Doppler velocities and comparison with pulsed wave tissue Doppler velocities. Artificial Organs 2014;38(1):87-91.
27. Pourcelot L. Applications cliniques de l’examen Doppler transcutane. Velocimetrie Ultrasonore Doppler 1974;34:780-785.
28. Galassi F, Sodi A, Ucci F, et al. Ocular hemodynamics and glaucoma prognosis: a color Doppler imaging study. Arch Ophthalmol 2003;121(12):1711-1715.
29. Abegao Pinto L, Vandewalle E, De Clerck E, Marques-Neves C, Stalmans I. Ophthalmic artery Doppler waveform changes associated with increased damage in glaucoma patients. Invest Ophthalmol Vis Sci 2012;53(4):2448-2453.
30. Parker JR. Algorithms for image processing and computer vision. New York: Wiley Computer Pub 1997.

Analysis of CDI-OA images in glaucoma 69
31. Lim JS. Two-dimensional signal and image processing. Englewood Cliffs, N.J.: Prentice Hall 1990.32. Savage MT, Ferro CJ, Pinder SJ, Tomson CR. Reproducibility of derived central arterial waveforms in
patients with chronic renal failure. Clin Sci 2002;103(1):59-65.33. Oliva I, Roztocil K. Toe pulse wave analysis in obliterating atherosclerosis. Angiol 1983;34(9):610-619.34. Lin LI. A concordance correlation coefficient to evaluate reproducibility. Biometrics 1989;45(1):255-
268.35. Altman DG. Practical statistics for medical research. 1st ed. London, New York: Chapman and Hall
1991.36. Founti P, Harris A, Papadopoulou D, et al. Agreement among three examiners of colour Doppler
imaging retrobulbar blood flow velocity measurements. Acta Ophthalmol 2011;89(8):e631-634.37. Harris A, Williamson TH, Martin B, Shoemaker JA, Sergott RC, Spaeth GL, et al. Test/Retest repro-
ducibility of color Doppler imaging assessment of blood flow velocity in orbital vessels. J Glaucoma 1995;4(4):281-286.
38. Quaranta L, Harris A, Donato F, et al. Color Doppler imaging of ophthalmic artery blood flow velocity: a study of repeatability and agreement. Ophthalmology 1997;104(4):653-658.
39. Abegao Pinto L, Willekens K, Van Keer K, et al. Ocular blood flow in glaucoma - the Leuven Eye Study. Acta Ophthalmol 2016.
40. Kapetanakis VV, Chan MP, Foster PJ, et al. Global variations and time trends in the prevalence of primary open angle glaucoma (POAG): a systematic review and meta-analysis. Brit J Ophthalmol 2016;100(1):86-93.
41. Vajaranant TS, Nayak S, Wilensky JT, Joslin CE. Gender and glaucoma: what we know and what we need to know. Curr Opin Ophthalmol 2010;21(2):91-99.
42. Schmidl D, Schmetterer L, Garhofer G, Popa-Cherecheanu A. Gender differences in ocular blood flow. Curr Eye Res 2015;40(2):201-212.
43. Akpek EK, Smith RA. Overview of age-related ocular conditions. Am J Managed Care 2013;19(5 Suppl):S67-75.
44. Ehrlich R, Kheradiya NS, Winston DM, et al. Age-related ocular vascular changes. Graefe’s Arch Clin Exper Ophthalmol 2009;247(5):583-591.
45. Modrzejewska M, Siesky B, Amireskandari A, et al. Parameters characterizing age-dependent ret-robulbar circulation in healthy subjects measured by color Doppler ultrasonography. Curr Eye Res 2015;40(7):729-736.
46. Michelson G, Harazny J, Schmieder RE, et al. Fourier analysis of the envelope of the ophthalmic artery blood flow velocity: age- and blood pressure related impact. Hypertension 2007;50(5):964-969.
47. Maruyoshi H, Kojima S, Kojima S, et al. Waveform of ophthalmic artery Doppler flow predicts the severity of systemic atherosclerosis. Circ J 2010;74(6):1251-1256.
48. Wang JC, Bennett M. Aging and atherosclerosis: mechanisms, functional consequences, and poten-tial therapeutics for cellular senescence. Circ Res 2012;111(2):245-259.