original article chemxpress 6(3), 071-090, (2014) · et electrochimie, dØpartement de chimie,...
TRANSCRIPT
Electrochemical determination of iron(II) at a Nafion-1,10-phenanthroline-modified carbon paste electrode: Assessingthe correlation between preconcentration potential, surface
morphology and impedance measurements
Abdoulkadri Ayouba Mahamane1, Boubié Guel*,1, Paul-Louis Fabre2
1Laboratoire de Chimie Moléculaire et des Matériaux, Equipe Chimie Physique
et Electrochimie, Département de Chimie, Université de Ouagadougou 03
BP 7021 Ouagadougou 03, (BURKINA FASO)2Laboratoire de Génie Chimique UMR CNRS 5503, Bât.2R1 � 118 route de Narbonne
31062 Toulouse Cedex 09, (FRANCE)E-mail: [email protected]; [email protected]
Abstract : The electrochemical behavior of a Nafion-1,10-phenanthroline-modified carbon paste electrode(CMCPE: Chemically Modified Carbon Paste Elec-trode) immersed in a supporting electrolyte 0.1 mol.L-1
acetate buffer solution (pH 4.5) containing iron(II) metalion has been studied, using cyclic voltammetry, differ-ential-pulse voltammetry and impedance spectroscopy.Optimal analytical parameters (preconcentration poten-tial and time, pH, electrode rotation) for iron(II) metalion determination have been established and correlatedwith the surface morphology of the CMCPE surface,the chemical composition analysis of the surface andthe impedance measurements of the CMCPE immersedin the supporting electrolyte. Assuming a simple ap-proach based on a redox polymer-modified electrode,
the experimental impedance values were fitted to anequivalent circuit model. It was shown that among vari-ous potentials used for iron(II) accumulation in theNafion-film, the potential of +1.3 V vs. Ag/AgCl/3 mol.L-1 KCl allowed a better differential-pulse determina-tion of the examined iron(II) metal ion in the supportingelectrolyte. The work was expanded to real applica-tions with the determination of iron(II) metal ion ingroundwater samples collected in a village located atthe outskirts of Ouagadougou, the Capital of BurkinaFaso. Global Scientific Inc.
Keywords : Iron(II) metal ion; Nafion-1,10-phenanthroline-modified carbon paste electrode; Dif-ferential-pulse voltammetry; Impedance measurements.
Original Article ChemXpress 6(3), 071-090, (2014)
ISSN(Print) : 2320 �1967ISSN(Online) : 2320 �1975
id14631421 pdfMachine by Broadgun Software - a great PDF writer! - a great PDF creator! - http://www.pdfmachine.com http://www.broadgun.com
.72
Original ArticleChemXpress 6(3), 2014
INTRODUCTION
Stripping Voltammetric methods have been appliedto the determination of many elements such as metalions because of their low cost, easy operation, goodsensitivity, high selectivity and very low limits of detec-tion[1]. Numerous advantages that have been reachedin such measurements include the following: needlessof preliminary separations, low level of contamination,and possibility of distinction between different redoxand or binding states[1-7]. Different techniques of strip-ping voltammetry consist in a preconcentration steponto the electrode and a further voltammetric mea-surement. As a consequence, voltammetric determi-nations can be greatly improved with respect to sensi-tivity and selectivity[2].
The most current approaches based on strippingprocedures include anodic or cathodic strippingvoltammetry (ASV or CSV) at both a hanging mer-cury drop electrode (HMDE) and a thin mercury filmelectrode (MFE)[8-12]. However, due to the toxicity ofmercury and difficulties related to the determination ofmetal ions that do not form amalgam with mercury,techniques using mercury free-electrode have beendeveloped. These techniques included not only ordi-nary solid electrodes such as glassy carbon, carbonpaste, gold, bismuth film, carbon film but also chemi-cally modified electrodes[13-30]. Chemically modifiedelectrodes (CME) generated a great interest since themid-1970s[31,32], and have been employed by severalgroups to enhance sensitivity and selectivity ofvoltammetric measurements for the determination ofmetal ions, organic and bio-organic species. Amongthese, chemically modified carbon paste electrodes(CMCPEs) have shown well-recognized advantagesbecause they are very easy to make and can be pre-pared with a variety of modifier loading levels, and theyshow a low background current[2,3,33-35]. Moreover,fresh modified-electrode surface can be generated rap-idly and reproducibly[2,3]. Many groups have reportedthe use of CMCPEs in the field of electroanalysis.
Baldwin and co-workers used carbon paste elec-trode modified by 2,9-dimethyl-1,10-phenanthroline forthe detection of copper and nickel[23,24]. The 2-methyl-8-hydroxyquinone has been used as a modifier agentfor the detection of copper[36]. Incorporation of poly
(1,8-diaminonaphtalene) in carbon paste electrode lead-ing to a conducting polymer has been demonstratedand used for the determination of lead[37]. Silver[38,39]
and gold[40,41] have been determined using ion-ex-changer-and chelating resin-modified carbon paste elec-trodes. Determination of metal ions by ion-exchangeusing typical resins in carbon paste has been re-ported[42,43]. Lead (II) and Cadmium (II) have beendetermined at a diaceyldioxime modified carbon pasteelectrode by differential pulse stripping voltammetry[44].Monomeric and polymeric cyclodextrins modified car-bon paste electrodes have been investigated for thedetermination of carcinogenic polycyclic aromaticamines[45]. Electrochemical determination of iron metalions has been the subject of several studies[2,3,9,10,29,30].Zhao and co-workers described a new concept for thedifferential pulse voltammetric determination of iron(II),based on complexation of the metal ion by a modifierreagent, 1,10-phenanthroline, and then accumulation inan ion-exchanger (Nafion) incorporated in the carbonpaste electrode[2]. They also reported the differentialpulse voltammetric determination of iron(II) at a Nafion-film-coated carbon paste electrode, based on the for-mation of the 2,2�-bipyridyl complex of the metal ion
and its accumulation in the Nafion film at the electrode[3].However, all the previous studies didn�t report the use
of impedance techniques for the characterization of theas-prepared electrochemical sensor implemented fortrace iron determination. As electrochemical impedancetechniques have become an important tool when inves-tigating the electrochemical properties of modified elec-trodes[46-51], the present work also included this studyin the case of iron incorporated in a Nafion-1,10-phenanthroline-modified carbon paste electrode. To thebest of our knowledge, impedance techniques have notbeen used to characterize trace iron incorporated in theNafion-1,10-phenanthroline-modified carbon paste.Moreover, any correlations have not yet been estab-lished between the preconcentration potential used forthe metal ion incorporation into the Nafion-1,10-phenanthroline-modified carbon paste electrode, thesurface morphology and the impedance measurements.It is clear that such correlations may appear important,both from a fundamental and applied standpoint, wheninvestigating complexation and adsorption processes onelectrode surfaces, electron transfer and reaction
73
Original ArticleChemXpress 6(3), 2014
mechanism, kinetics of electron transfer processes.Since the performance of the electrochemical sensordepends greatly on the parameters of these surface pro-cesses, one must be careful to understand fully theirrole in the whole process before using the sensor foranalytical determination in different environmental ma-trices. Although the Nafion-1,10-phenanthroline-modi-fied carbon paste electrode has already been used foriron(II) determination at the laboratory scale, we thinkthat more data are needed in developing country to as-sess their analytical utility by application to real-lifegroundwater samples in rural environment where con-centrations of iron(II) metal ions, which are higher thanthe guideline values in drinking water given by the WorldHealth Organization (WHO), are detected.
The present work was prompted by a desire torevisit the field of Nafion-film-coated carbon paste elec-trode in voltammetric determination of iron(II) with twoobjectives. The first one was to characterize the sensorby electrochemical impedance spectroscopy as well asby cyclic voltammetry and differential-pulse voltammetryin order to obtain mechanistic information related to theoxidation and reduction of ferroïn (Fe(phen)
33+/
Fe(phen)32+) system into the modified carbon paste elec-
trode. The sensor is prepared by using the complex-ation of iron(II) with a reagent modifier, 1,10-phenanthroline, and then accumulation by an ion-ex-changer (Nafion) incorporated in the carbon paste elec-trode. However, in our context the previous proceduredescribed by Zhao and co-workers[2] was combinedwith the spin-coating technique[52,53]. We expected thatbetter and enhanced peak currents could also beachieved with these two combined procedures. Greatefforts were made to understand impedance measure-ments at the interface, and to correlate them with thepreconcentration potential applied for iron incorpora-tion into the Nafion -1,10-phenanthroline-modified car-bon paste electrode. Data obtained from impedanceanalysis allowed the proposal of a scheme describingcharge transfers at the Nafion-1,10-phenanthroline-modified electrode. The surface morphology of thechemically modified carbon paste electrode was alsoinvestigated and linked to the optimal analytical condi-tions for iron(II) determination. The second objectiveof this work was to demonstrate the performance ofthe sensor by application to the determination of iron(II)
contents in various real groundwater samples collectedin a village located at the outskirts of Ouagadougou,the Capital of Burkina Faso. The results obtained con-stitute the first study of iron(II) determination at ground-water sites in Burkina Faso and will provide a baselineof spatial and temporal changes of iron(II) pollution inthe country.
EXPERIMENTAL
Reagents and solutions
All chemicals were of analytical grade. An iron(II)stock solution was prepared by dissolving the requiredamount of ammonium iron(II) sulphate (99.999 %,Sigma Aldrich) in 0.01 mol.L-1 sulphuric acid (96.3 %VWR). Diluted working solutions for optimization stud-ies were prepared by diluting the stock solution withMillipore water.
1,10-phenanthroline (99 %), paraffin oil and Nafionsolution 5 wt % (d = 0.924) were purchased from SigmaAldrich. Graphite powder (99.9995%) was purchasedfrom Alfa Aesar.
Apparatus, cell and electrodes
The electrochemical experiments (cyclic andvoltammetric measurements) were carried out using aVoltalab 50 PGstat potentiostat (Radiometer,Copenhague) running with the VoltaMaster software(version 4.0). The voltammetric cell (25 mL) consistedin a MDE 150 stand (Radiometer Model) with an EDI101 rotating disk modified carbon paste electrode, anAg/AgCl, 3 mol.L-1 KCl reference electrode (Eref =0.205 V / NHE; Radiometer model TR020) and aplatinum wire as the counter electrode (radiometermodel TM020).
Impedance measurements were obtained with aµAUTOLABIII/FRA (Eco Chemie, Netherlands)
driven by the FRA software. All experiments were car-ried out at room temperature (25°C). Measurements
have been carried out at the free potential of the inter-face, in a frequency range between 50 mHz and 50kHz and with the perturbation amplitude of 10 mV.
The chemically modified carbon paste electrode(CMCPE) was made by thoroughly mixing appropri-ated amounts of 1,10-phenanthroline 10 wt % (SigmaAldrich) and Nafion solution 5 wt % (d = 0.924, Sigma
.74
Original ArticleChemXpress 6(3), 2014
Aldrich) with 1 g of graphite powder (99.9995 %, AlfaAesar) in a first step, and then mixing with 0.360 mL ofparaffin oil in a second step using a mortar and pestleuntil a uniformly wetted paste was obtained. The pastewas inserted into the cavity of the electrode (EDI Tip).The chemically modified carbon paste surface wassmoothed on a transparent paper until the surface tooka shiny appearance. Then the electrode surface wascoated with the Nafion by a spin-coating technique us-ing a methanolic solution of Nafion (400 µL of Nafion
in 300 µL of pure methanol). Using a micro syringe,
about 4 µL of the methanolic was placed on the elec-
trode surface. The electrode was spun at a rotation of1000 rpm after deposition of the Nafion coating solu-tion, maintaining the EDI disc in an upward position.The surface was then kept ten minutes at room tem-perature to let the solvent evaporate. This spin-coatingprocedure allows a better surface preparation[52,53]. Theelectrode surface could be renewed by simply extrud-ing a small amount from the tip of the electrode.
Surface morphology analysis of the electrodes (barecarbon paste electrode, modified carbon paste elec-trode and iron(II)-modified carbon paste electrode) wascarried out using a scanning electron microscopy (SEMHITACHI computer-controlled with the software TM-100) coupled with an EDX (software SwiftED-TM)for chemical analysis of electrode surfaces.
Recommended analytical method
The supporting electrolyte solution (20 mL), con-taining the acetate buffer (pH 4.5) and the examinediron(II) ion at a given concentration, was pipetted intothe micro-voltammetric cell. A fresh electrode surfacewas immersed in the supporting electrolyte solution anda defined preconcentration (accumulation) potential wasapplied to the CMCPE for a selected time period, whilethe rotating disk electrode (RDE) was under rotation at1000 rpm. At the end of the preconcentration time, therotation of the electrode was stopped and the solutionwas left to equilibrate for 30 s. The voltammogram wasthen recorded by scanning the potential in the cathodicdirection using cyclic and differential pulse voltammetry.The parameters used for the differential voltammetrywere a potential step height of 1 mV, pulse amplitude of60 mV and duration of 20 ms. Recovery of Fe(II) inthe analyzed samples was estimated using the standard
addition methods by introducing aliquots of iron stan-dard solution and recording the corresponding differ-ential-pulse voltammograms. After each electrochemi-cal determination, the cleaning procedure of the elec-trode surface was the following: transferring of the elec-trode in 1.0 mol.L-1 sodium hydroxide solution understirring for several minutes and then rinsing thoroughlywith water and immersing in a stirred blank acetatebuffer solution of pH 4.5 (NaOAc/AcOH)[2].
All the measurements were carried out at room tem-perature (25°C) and without solution deoxygenating.
Measurements were automated and controlled throughthe software parameters. In this work, the anodic con-tribution of current is taken as positive and the cathodicone as negative.
RESULTS AND DISCUSSION
Electrochemical behavior of iron(II) on the chemi-cally modified carbon paste electrode
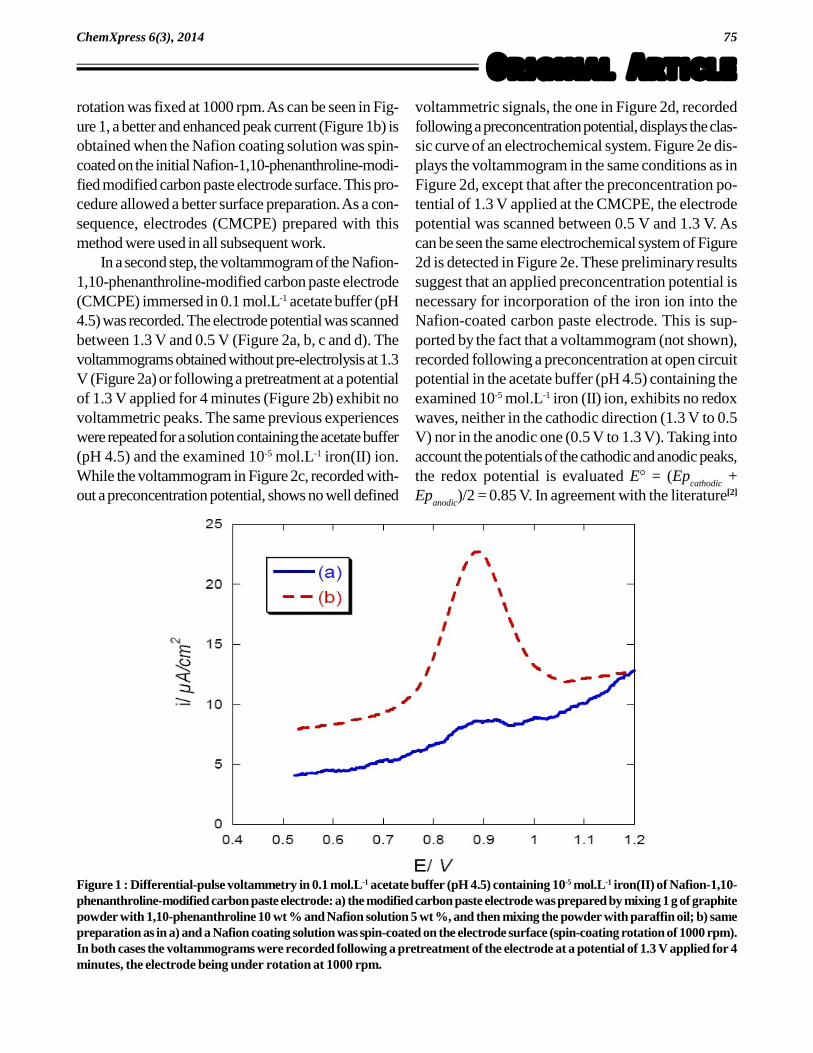
The first step of our investigations was to assesswhether the spin-coating procedure[52,53] combined withthe one described in the literature[2] could lead to sig-nificant results in differential-pulse peak current mea-surements of trace iron(II) in a sample solution. Wefirst set the experimental conditions as previously de-scribed: 1 g of graphite powder was mixed with thedesired weights of 1,10-phenanthroline and Nafion so-lution, and then mixing with paraffin oil[2]. By varyingthe amount of reagents in the carbon paste, we foundthat the optimum conditions were the following: 1,10-phenanthroline 10 wt % and Nafion solution 5 wt %.The as-prepared Nafion-1,10-phenanthroline-modifiedcarbon paste electrode was cleaned and the differen-tial-pulse voltammogram was recorded between 1.3 Vand 0.5 V (Figure 1a), after immersing the electrode ina solution containing the acetate buffer (pH 4.5) and theexamined 10-5 mol.L-1 iron(II) ion and following a pre-treatment of the electrode at a potential of 1.3 V appliedfor 4 minutes. The differential-pulse voltammogram inFigure 1b was recorded in the same conditions as inFigure 1a, except that in this case the surface of theNafion-1,10-phenanthroline-modified carbon pasteelectrode was coated with the Nafion by a spin-coatingtechnique using a methanolic solution of Nafion (400 µL
of Nafion in 300 µL of pure methanol). The spin-coating
75
Original ArticleChemXpress 6(3), 2014
rotation was fixed at 1000 rpm. As can be seen in Fig-ure 1, a better and enhanced peak current (Figure 1b) isobtained when the Nafion coating solution was spin-coated on the initial Nafion-1,10-phenanthroline-modi-fied modified carbon paste electrode surface. This pro-cedure allowed a better surface preparation. As a con-sequence, electrodes (CMCPE) prepared with thismethod were used in all subsequent work.
In a second step, the voltammogram of the Nafion-1,10-phenanthroline-modified carbon paste electrode(CMCPE) immersed in 0.1 mol.L-1 acetate buffer (pH4.5) was recorded. The electrode potential was scannedbetween 1.3 V and 0.5 V (Figure 2a, b, c and d). Thevoltammograms obtained without pre-electrolysis at 1.3V (Figure 2a) or following a pretreatment at a potentialof 1.3 V applied for 4 minutes (Figure 2b) exhibit novoltammetric peaks. The same previous experienceswere repeated for a solution containing the acetate buffer(pH 4.5) and the examined 10-5 mol.L-1 iron(II) ion.While the voltammogram in Figure 2c, recorded with-out a preconcentration potential, shows no well defined
voltammetric signals, the one in Figure 2d, recordedfollowing a preconcentration potential, displays the clas-sic curve of an electrochemical system. Figure 2e dis-plays the voltammogram in the same conditions as inFigure 2d, except that after the preconcentration po-tential of 1.3 V applied at the CMCPE, the electrodepotential was scanned between 0.5 V and 1.3 V. Ascan be seen the same electrochemical system of Figure2d is detected in Figure 2e. These preliminary resultssuggest that an applied preconcentration potential isnecessary for incorporation of the iron ion into theNafion-coated carbon paste electrode. This is sup-ported by the fact that a voltammogram (not shown),recorded following a preconcentration at open circuitpotential in the acetate buffer (pH 4.5) containing theexamined 10-5 mol.L-1 iron (II) ion, exhibits no redoxwaves, neither in the cathodic direction (1.3 V to 0.5V) nor in the anodic one (0.5 V to 1.3 V). Taking intoaccount the potentials of the cathodic and anodic peaks,the redox potential is evaluated E° = (Ep
cathodic +
Epanodic
)/2 = 0.85 V. In agreement with the literature[2]
Figure 1 : Differential-pulse voltammetry in 0.1 mol.L-1 acetate buffer (pH 4.5) containing 10-5 mol.L-1 iron(II) of Nafion-1,10-phenanthroline-modified carbon paste electrode: a) the modified carbon paste electrode was prepared by mixing 1 g of graphitepowder with 1,10-phenanthroline 10 wt % and Nafion solution 5 wt %, and then mixing the powder with paraffin oil; b) samepreparation as in a) and a Nafion coating solution was spin-coated on the electrode surface (spin-coating rotation of 1000 rpm).In both cases the voltammograms were recorded following a pretreatment of the electrode at a potential of 1.3 V applied for 4minutes, the electrode being under rotation at 1000 rpm.

.76
Original ArticleChemXpress 6(3), 2014
and the redox potential of ferroïn (Fe(phen)3
3+/Fe(phen)
32+), E° = 1.06 V / NHE = 0.86 V / Eref), the
electrochemical system observed in Figures 2d and 2eis assigned to the tris(phen)iron couple (ferroïn couple).
Using a simple model of a redox polymer-modified elec-trode[52], one may suggest that during preconcentration,Fe2+ diffuses through the Nafion polymer and is oxi-dized into Fe(phen)
33+ in the carbon paste electrode.
The potential scan gives the evidence of the reversibleelectron transfer:
Nafion is a perfluorosulphonate cation-exchangeresin with RSO
3- sites. The iron Fe2+ can be exchanged
and accumulated by Nafion by forming complexes with
RSO3
- sites in the Nafion-modified electrode film[2].Through the Nafion-film, the iron Fe2+ can diffuse[52]
and be complexed by phenanthroline in the carbonpaste electrode. That is why in Figure 2c, the ferroïn
system can be guessed in the residual current. Fur-thermore, by applying an anodic preconcentrationpotential of 1.3 V at the CMCPE, the iron Fe2+ whichis complexed into Fe(phen)
32+ is oxidized into
Fe(phen)3
3+ in the carbon paste electrode. This pro-cess induces the accumulation of Fe(phen)
33+ and an
iron Fe2+ flow through the Nafion film. Then scanningthe electrode potential in the (1.3 V to 0.5 V) domainshows the reduction of the accumulated Fe(phen)
33+
and its reoxidation.
Figure 2 : Cyclic voltammetry CV and differential-pulse voltammetry DPV in 0.1 mol.L-1 acetate buffer (pH 4.5) of Nafion-1,10-phenanthroline-modified carbon paste electrode (CMCPE): a) CV without preconcentration potential; b) CV followingpreconcentration potential; c) CV without preconcentration potential and [Fe2+] = 50 µmol.L-1; d) CV following preconcentrationpotential with [Fe2+] = 50 µmol.L-1; e) CV following the preconcentration potential with [Fe2+] = 50 µmol.L-1, the voltammogramwas recorded between 0.5 V and 1.3 V; (f) DPV following the preconcentration potential with [Fe2+] = 50 µmol.L-1,(preconcentration potential: 1.3 V; preconcentration time: 4 min; electrode rotation: 1000 rpm).
77
Original ArticleChemXpress 6(3), 2014
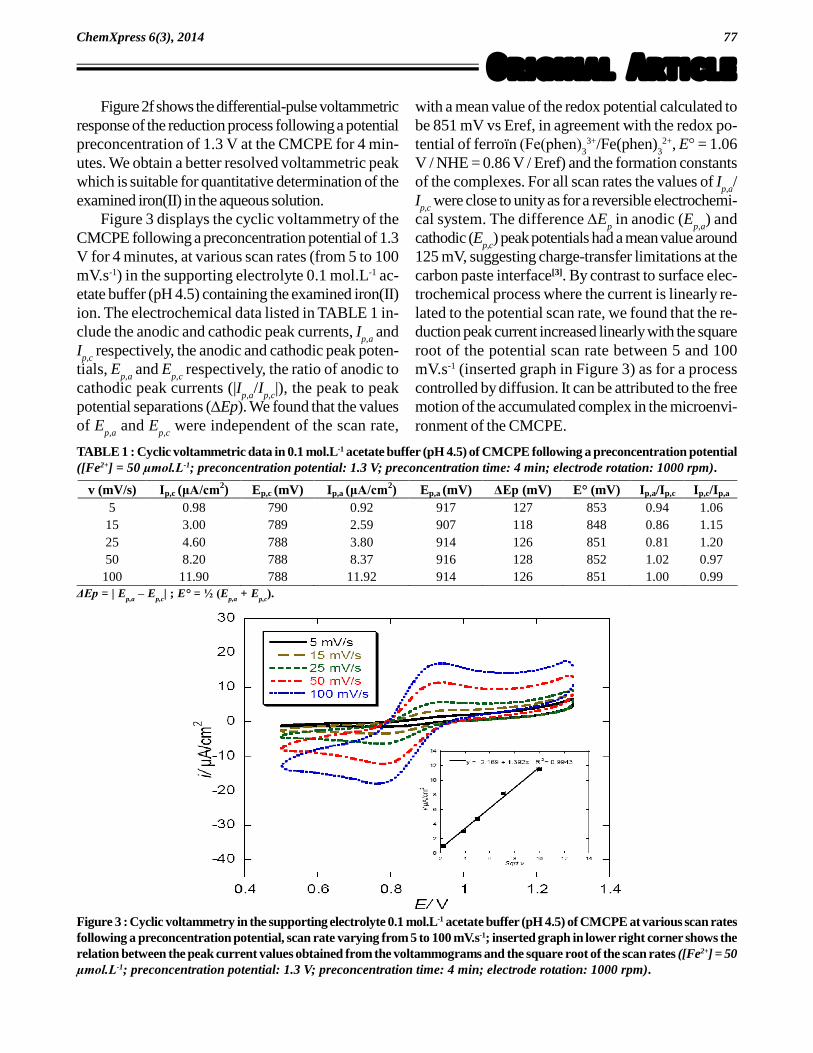
Figure 2f shows the differential-pulse voltammetricresponse of the reduction process following a potentialpreconcentration of 1.3 V at the CMCPE for 4 min-utes. We obtain a better resolved voltammetric peakwhich is suitable for quantitative determination of theexamined iron(II) in the aqueous solution.
Figure 3 displays the cyclic voltammetry of theCMCPE following a preconcentration potential of 1.3V for 4 minutes, at various scan rates (from 5 to 100mV.s-1) in the supporting electrolyte 0.1 mol.L-1 ac-etate buffer (pH 4.5) containing the examined iron(II)ion. The electrochemical data listed in TABLE 1 in-clude the anodic and cathodic peak currents, I
p,a and
Ip,c
respectively, the anodic and cathodic peak poten-tials, E
p,a and E
p,c respectively, the ratio of anodic to
cathodic peak currents (|Ip,a
/Ip,c
|), the peak to peakpotential separations (Ep). We found that the valuesof E
p,a and E
p,c were independent of the scan rate,
with a mean value of the redox potential calculated tobe 851 mV vs Eref, in agreement with the redox po-tential of ferroïn (Fe(phen)
33+/Fe(phen)
32+, E° = 1.06
V / NHE = 0.86 V / Eref) and the formation constantsof the complexes. For all scan rates the values of I
p,a/
Ip,c
were close to unity as for a reversible electrochemi-cal system. The difference E
p in anodic (E
p,a) and
cathodic (Ep,c
) peak potentials had a mean value around125 mV, suggesting charge-transfer limitations at thecarbon paste interface[3]. By contrast to surface elec-trochemical process where the current is linearly re-lated to the potential scan rate, we found that the re-duction peak current increased linearly with the squareroot of the potential scan rate between 5 and 100mV.s-1 (inserted graph in Figure 3) as for a processcontrolled by diffusion. It can be attributed to the freemotion of the accumulated complex in the microenvi-ronment of the CMCPE.
ÄEp = | Ep,a
� Ep,c
| ; E° = ½ (Ep,a
+ Ep,c
).
TABLE 1 : Cyclic voltammetric data in 0.1 mol.L-1 acetate buffer (pH 4.5) of CMCPE following a preconcentration potential([Fe2+] = 50 µmol.L-1; preconcentration potential: 1.3 V; preconcentration time: 4 min; electrode rotation: 1000 rpm).
v (mV/s) Ip,c (ìA/cm2) Ep,c (mV) Ip,a (ìA/cm
2) Ep,a (mV) ÄEp (mV) E° (mV) Ip,a/Ip,c Ip,c/Ip,a 5 0.98 790 0.92 917 127 853 0.94 1.06
15 3.00 789 2.59 907 118 848 0.86 1.15 25 4.60 788 3.80 914 126 851 0.81 1.20 50 8.20 788 8.37 916 128 852 1.02 0.97 100 11.90 788 11.92 914 126 851 1.00 0.99
Figure 3 : Cyclic voltammetry in the supporting electrolyte 0.1 mol.L-1 acetate buffer (pH 4.5) of CMCPE at various scan ratesfollowing a preconcentration potential, scan rate varying from 5 to 100 mV.s-1; inserted graph in lower right corner shows therelation between the peak current values obtained from the voltammograms and the square root of the scan rates ([Fe2+] = 50µmol.L-1; preconcentration potential: 1.3 V; preconcentration time: 4 min; electrode rotation: 1000 rpm).
.78
Original ArticleChemXpress 6(3), 2014
Optimum conditions for electrochemical determi-nation of iron(II)
(a) Influence of the supporting electrolyte and pHdependence
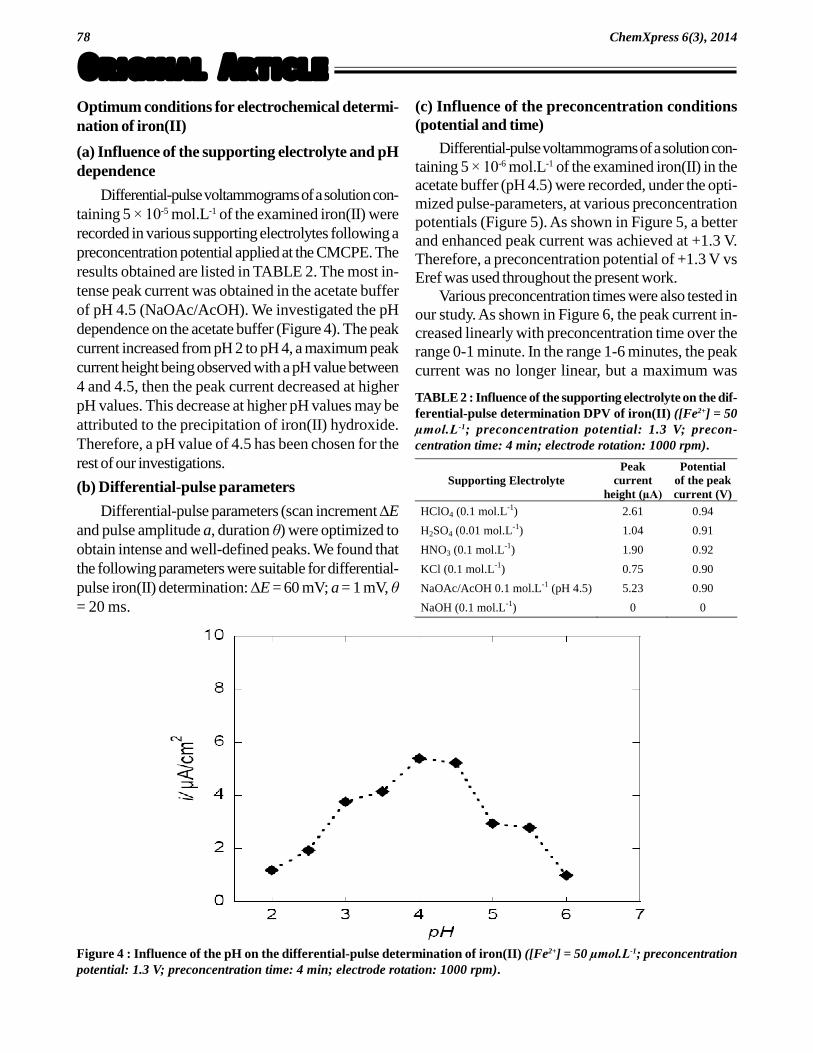
Differential-pulse voltammograms of a solution con-taining 5 × 10⁻⁵ mol.L-1 of the examined iron(II) wererecorded in various supporting electrolytes following apreconcentration potential applied at the CMCPE. Theresults obtained are listed in TABLE 2. The most in-tense peak current was obtained in the acetate bufferof pH 4.5 (NaOAc/AcOH). We investigated the pHdependence on the acetate buffer (Figure 4). The peakcurrent increased from pH 2 to pH 4, a maximum peakcurrent height being observed with a pH value between4 and 4.5, then the peak current decreased at higherpH values. This decrease at higher pH values may beattributed to the precipitation of iron(II) hydroxide.Therefore, a pH value of 4.5 has been chosen for therest of our investigations.
(b) Differential-pulse parameters
Differential-pulse parameters (scan increment Eand pulse amplitude a, duration è) were optimized toobtain intense and well-defined peaks. We found thatthe following parameters were suitable for differential-pulse iron(II) determination: E = 60 mV; a = 1 mV, è= 20 ms.
(c) Influence of the preconcentration conditions(potential and time)
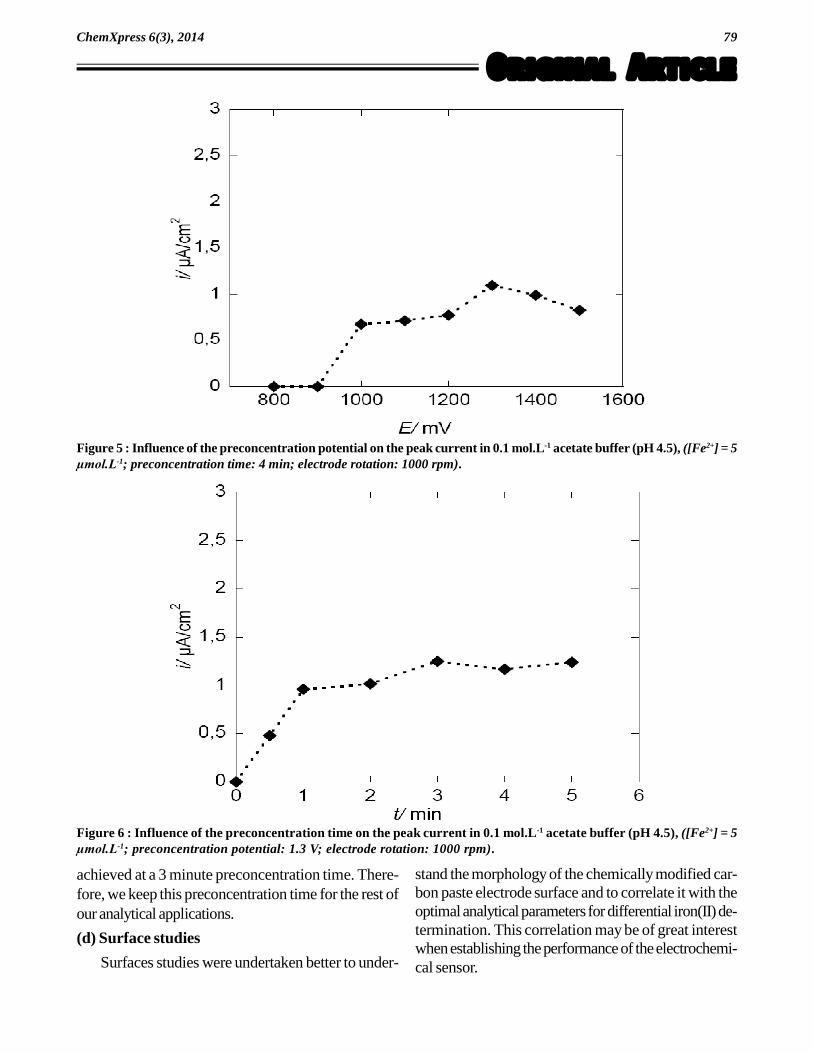
Differential-pulse voltammograms of a solution con-taining 5 × 10⁻⁶ mol.L-1 of the examined iron(II) in theacetate buffer (pH 4.5) were recorded, under the opti-mized pulse-parameters, at various preconcentrationpotentials (Figure 5). As shown in Figure 5, a betterand enhanced peak current was achieved at +1.3 V.Therefore, a preconcentration potential of +1.3 V vsEref was used throughout the present work.
Various preconcentration times were also tested inour study. As shown in Figure 6, the peak current in-creased linearly with preconcentration time over therange 0-1 minute. In the range 1-6 minutes, the peakcurrent was no longer linear, but a maximum was
TABLE 2 : Influence of the supporting electrolyte on the dif-ferential-pulse determination DPV of iron(II) ([Fe2+] = 50µmol.L-1; preconcentration potential: 1.3 V; precon-centration time: 4 min; electrode rotation: 1000 rpm).
Supporting Electrolyte Peak
current height (µA)
Potential of the peak current (V)
HClO4 (0.1 mol.L-1) 2.61 0.94
H2SO4 (0.01 mol.L-1) 1.04 0.91
HNO3 (0.1 mol.L-1) 1.90 0.92
KCl (0.1 mol.L-1) 0.75 0.90
NaOAc/AcOH 0.1 mol.L-1 (pH 4.5) 5.23 0.90
NaOH (0.1 mol.L-1) 0 0
Figure 4 : Influence of the pH on the differential-pulse determination of iron(II) ([Fe2+] = 50 µmol.L-1; preconcentrationpotential: 1.3 V; preconcentration time: 4 min; electrode rotation: 1000 rpm).
79
Original ArticleChemXpress 6(3), 2014
Figure 5 : Influence of the preconcentration potential on the peak current in 0.1 mol.L-1 acetate buffer (pH 4.5), ([Fe2+] = 5µmol.L-1; preconcentration time: 4 min; electrode rotation: 1000 rpm).
Figure 6 : Influence of the preconcentration time on the peak current in 0.1 mol.L-1 acetate buffer (pH 4.5), ([Fe2+] = 5µmol.L-1; preconcentration potential: 1.3 V; electrode rotation: 1000 rpm).
achieved at a 3 minute preconcentration time. There-fore, we keep this preconcentration time for the rest ofour analytical applications.
(d) Surface studies
Surfaces studies were undertaken better to under-
stand the morphology of the chemically modified car-bon paste electrode surface and to correlate it with theoptimal analytical parameters for differential iron(II) de-termination. This correlation may be of great interestwhen establishing the performance of the electrochemi-cal sensor.
.80
Original ArticleChemXpress 6(3), 2014
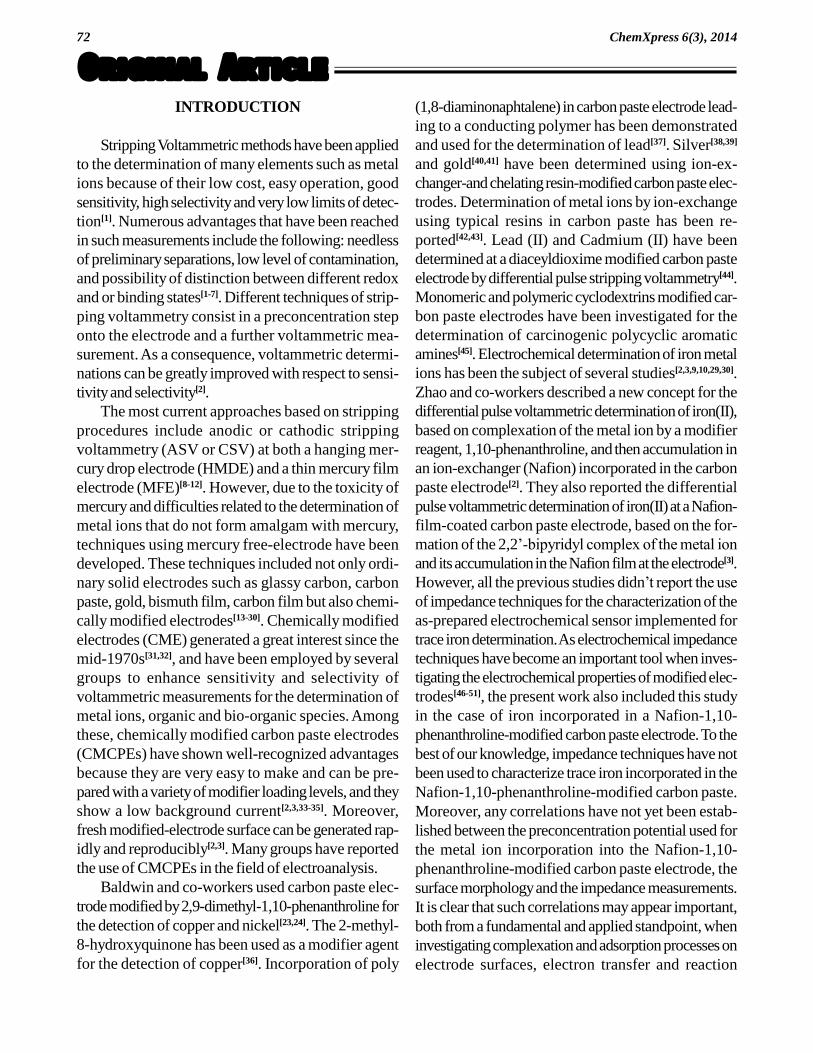
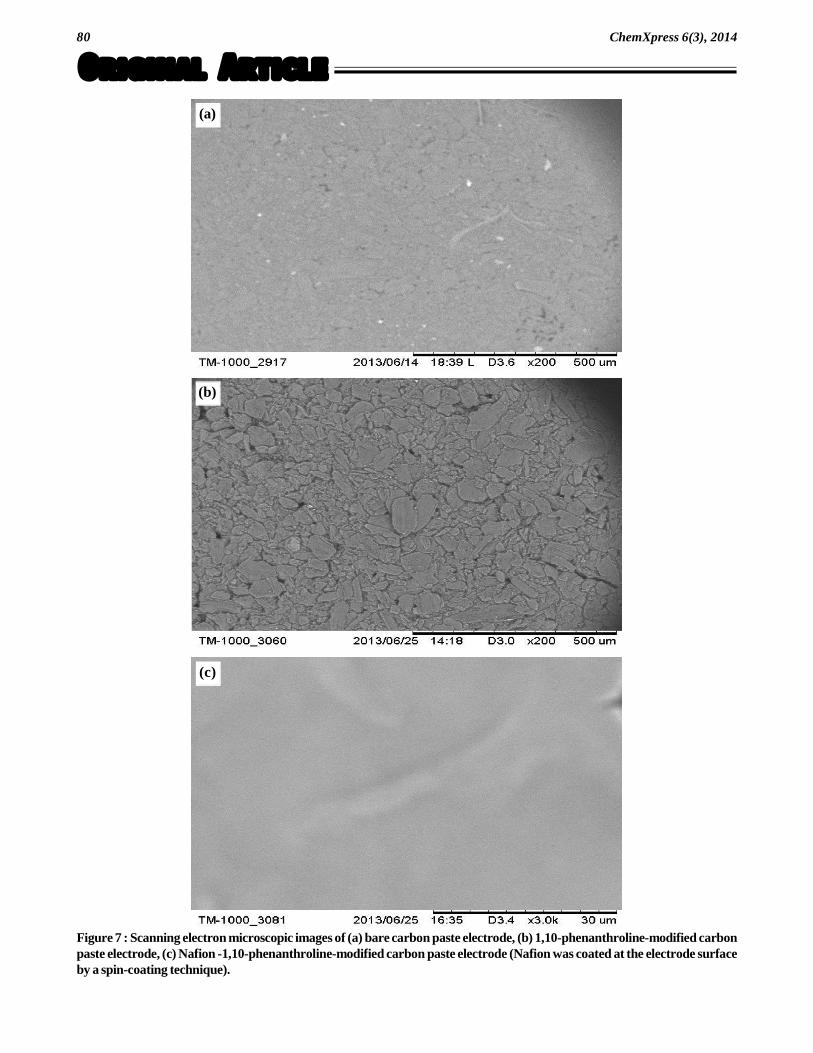
Figure 7 : Scanning electron microscopic images of (a) bare carbon paste electrode, (b) 1,10-phenanthroline-modified carbonpaste electrode, (c) Nafion -1,10-phenanthroline-modified carbon paste electrode (Nafion was coated at the electrode surfaceby a spin-coating technique).
(a)
(b)
(c)
81
Original ArticleChemXpress 6(3), 2014
Figure 7 shows the SEM image of a bare carbonpaste electrode (Figure 7a), the 1,10-phenanthroline-modified carbon paste electrode (Figure 7b) and theNafion -1,10-phenanthroline-modified carbon pasteelectrode (Figure 7c).
The bare carbon paste in Figure 7a, before the in-corporation of 1,10-phenanthroline, exhibits a poroussurface. Results of chemical composition analysis per-formed by EDX show neither trace of iron nor any for-eign metal elements (TABLE 3). After incorporation of1,10-phenanthroline, the surface becomes rough withthe presence of small plates ranging from 7.6 to 91 ìm
in diameter (Figure 7b). Chemical composition analysisdoes not reveal the presence of iron or any foreign metalelements (TABLE 3). In contrast, the surface morphol-ogy of the Nafion -1,10-phenanthroline-modified car-bon paste electrode (Figure 7c) reveals a great differ-ence compared with the bare or 1,10-phenanthroline-modified carbon paste electrode (Figure 7a and 7b).The surface in Figure 7c appears smoother and the smallplates which were observed in Figure 7b are no longervisible. Once again, chemical composition analysis doesnot reveal the presence of iron or any foreign metalelements (TABLE 3).
In the recommended analytical procedure, afterimmersing the electrode surface into the measuringelectrochemical cell, a potential is applied to the elec-trode under rotation of the rotating disk electrode.Selecting a preconcentration time of 3 minutes, vari-ous potential (+1.0 V, 1.3 V and 1.5 V vs Eref) wereapplied at the CMCPE immersed in the supportingelectrolyte 0.1 mol.L-1 acetate buffer (pH 4.5) con-taining the examined iron(II). We investigated first lowconcentrations of iron(II), varying from 10-6 � 10-4
mol.L-1. In all cases, the level of incorporated iron in
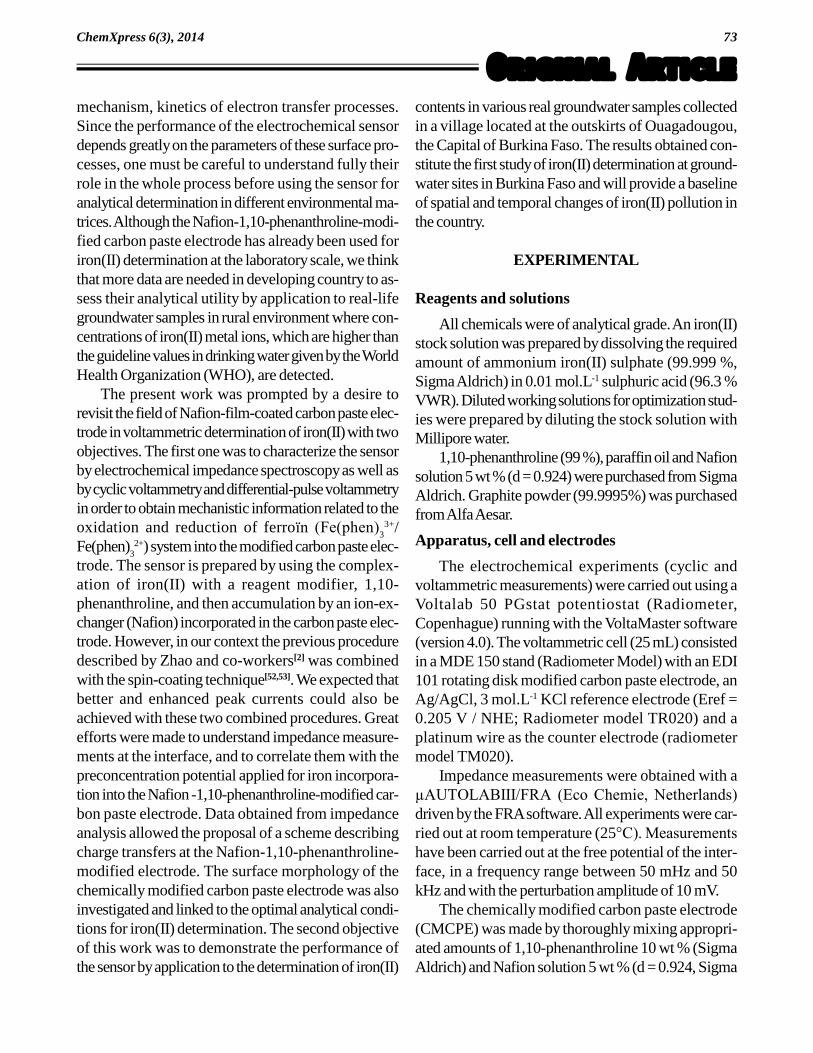
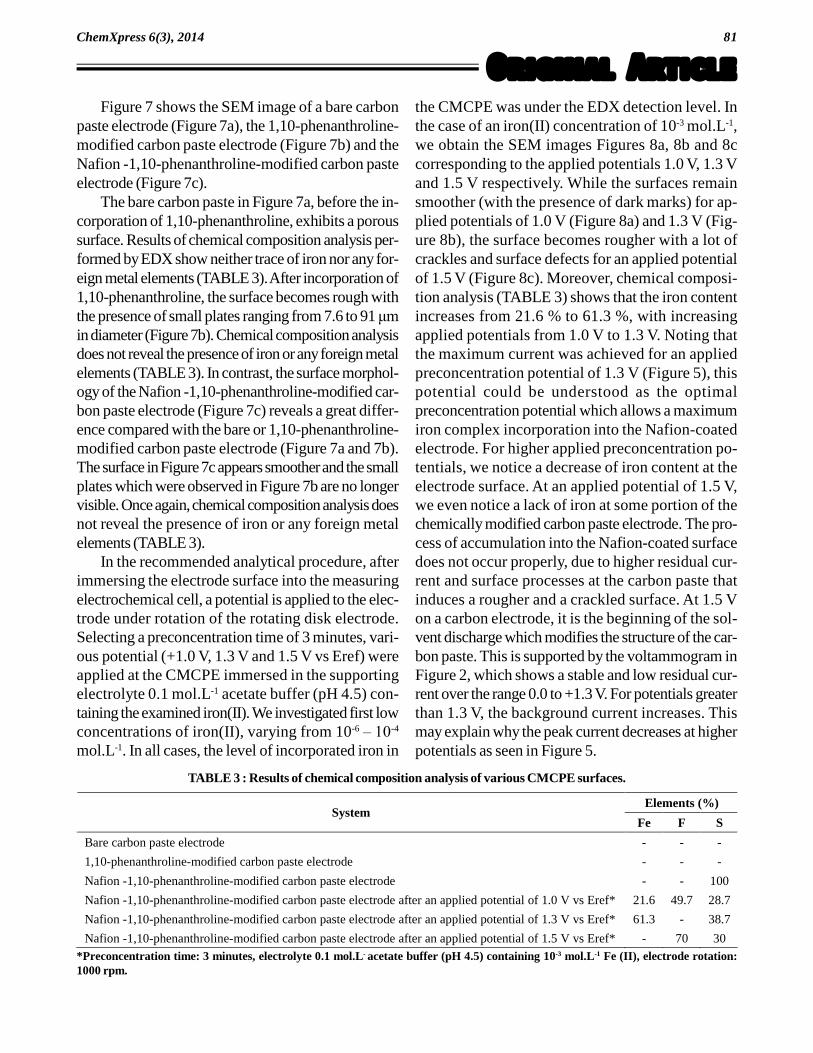
the CMCPE was under the EDX detection level. Inthe case of an iron(II) concentration of 10-3 mol.L-1,we obtain the SEM images Figures 8a, 8b and 8ccorresponding to the applied potentials 1.0 V, 1.3 Vand 1.5 V respectively. While the surfaces remainsmoother (with the presence of dark marks) for ap-plied potentials of 1.0 V (Figure 8a) and 1.3 V (Fig-ure 8b), the surface becomes rougher with a lot ofcrackles and surface defects for an applied potentialof 1.5 V (Figure 8c). Moreover, chemical composi-tion analysis (TABLE 3) shows that the iron contentincreases from 21.6 % to 61.3 %, with increasingapplied potentials from 1.0 V to 1.3 V. Noting thatthe maximum current was achieved for an appliedpreconcentration potential of 1.3 V (Figure 5), thispotential could be understood as the optimalpreconcentration potential which allows a maximumiron complex incorporation into the Nafion-coatedelectrode. For higher applied preconcentration po-tentials, we notice a decrease of iron content at theelectrode surface. At an applied potential of 1.5 V,we even notice a lack of iron at some portion of thechemically modified carbon paste electrode. The pro-cess of accumulation into the Nafion-coated surfacedoes not occur properly, due to higher residual cur-rent and surface processes at the carbon paste thatinduces a rougher and a crackled surface. At 1.5 Von a carbon electrode, it is the beginning of the sol-vent discharge which modifies the structure of the car-bon paste. This is supported by the voltammogram inFigure 2, which shows a stable and low residual cur-rent over the range 0.0 to +1.3 V. For potentials greaterthan 1.3 V, the background current increases. Thismay explain why the peak current decreases at higherpotentials as seen in Figure 5.
TABLE 3 : Results of chemical composition analysis of various CMCPE surfaces.
Elements (%) System
Fe F S
Bare carbon paste electrode - - -
1,10-phenanthroline-modified carbon paste electrode - - -
Nafion -1,10-phenanthroline-modified carbon paste electrode - - 100
Nafion -1,10-phenanthroline-modified carbon paste electrode after an applied potential of 1.0 V vs Eref* 21.6 49.7 28.7
Nafion -1,10-phenanthroline-modified carbon paste electrode after an applied potential of 1.3 V vs Eref* 61.3 - 38.7
Nafion -1,10-phenanthroline-modified carbon paste electrode after an applied potential of 1.5 V vs Eref* - 70 30 *Preconcentration time: 3 minutes, electrolyte 0.1 mol.L- acetate buffer (pH 4.5) containing 10-3 mol.L-1 Fe (II), electrode rotation:1000 rpm.
.82
Original ArticleChemXpress 6(3), 2014
Figure 8 : Scanning electron microscopic images of a Nafion -1,10-phenanthroline-modified carbon paste electrode after anapplied potential of (a) 1.0 V, (b) 1.3 V and (c) 1.5 V. ([Fe2+] = 1 mmol.L-1; supporting electrolyte 0.1 mol.L-1 acetate buffer (pH4.5); preconcentration time: 3 min; electrode rotation: 1000 rpm).
(a)
(b)
(c)
83
Original ArticleChemXpress 6(3), 2014
Impedance measurements
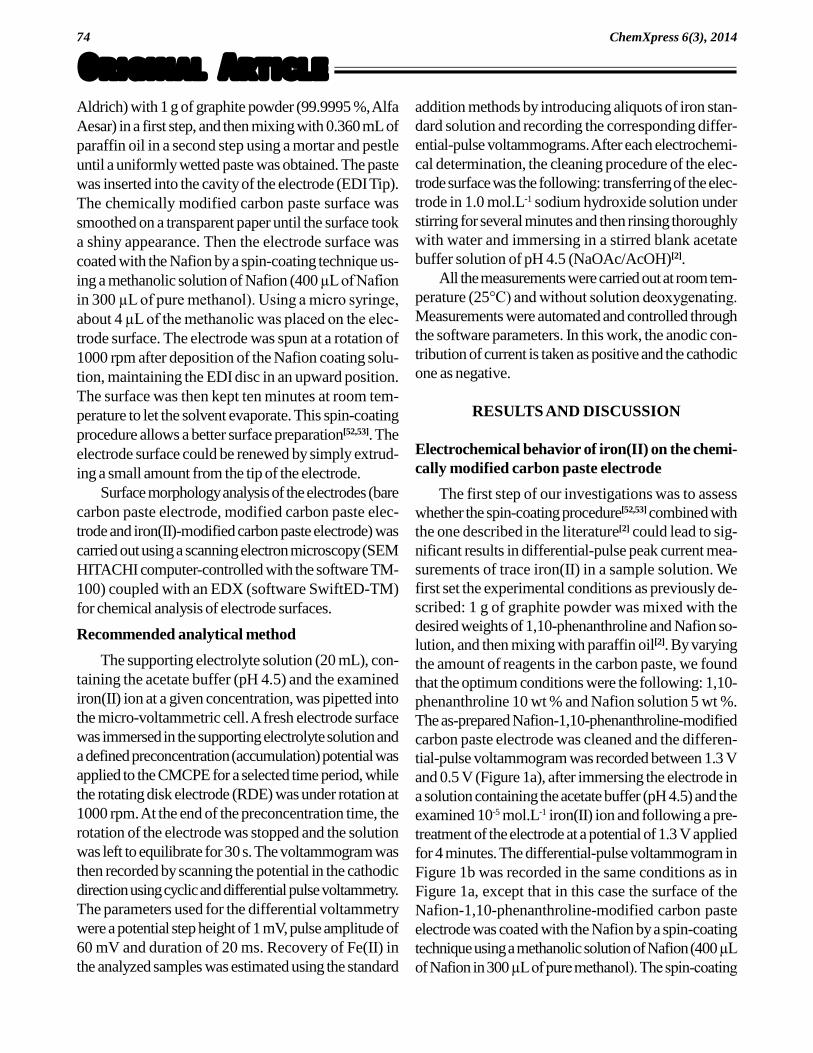
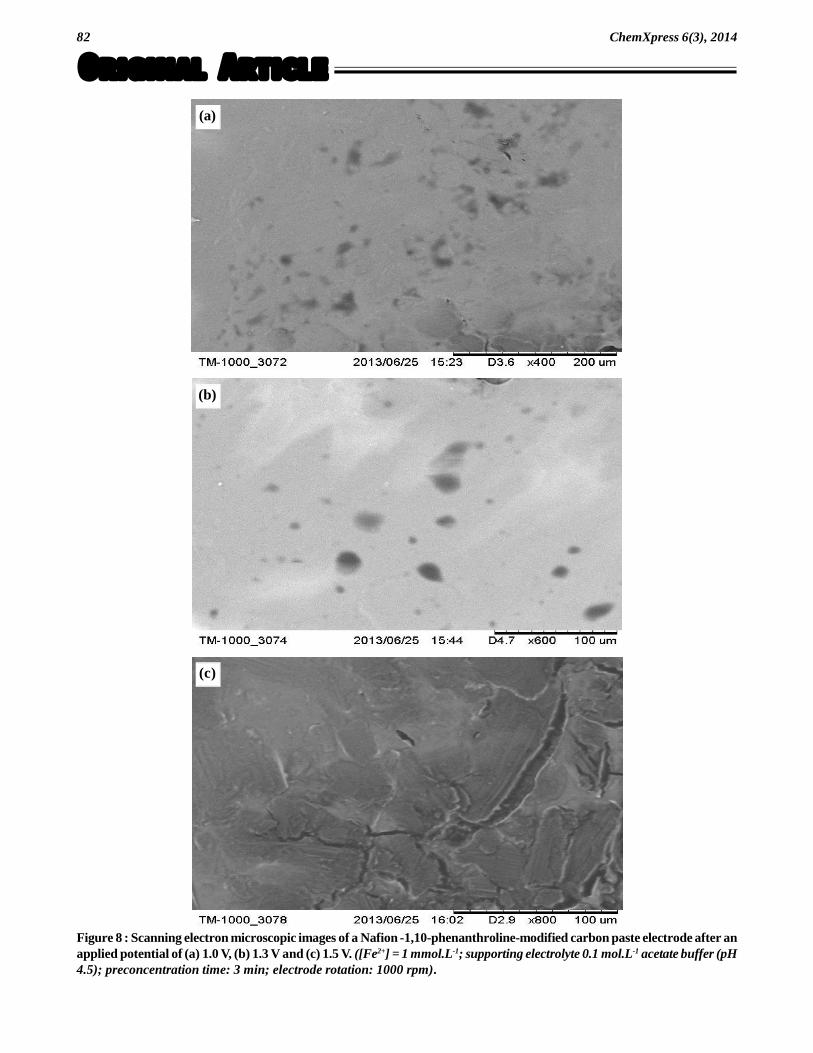
To better understand the features of the CMCPEcorresponding to various preconcentration potentialsapplied at the electrode immersed in the supporting elec-trolyte (10-5 mol.L-1 Fe2+ in 0.1 mol.L-1 of an acetatebuffer pH 4.5), electrochemical impedance spectros-copy experiments were carried out at open circuit po-tential under a pure diffusion regime. The Nyquist plotsare displayed in Figure 9.
At first, according to a simple Randles scheme, theNyquist plot of the CMCPE shows a straight line (Fig-ure 9a), which is a constant phase element behaviorwith a huge resistor. The high resistance reflects thatwith no iron(II) there is no charge transfer at the elec-trodes. After the preconcentration process, the recordedNyquist plots (Figure 9b, c and d) are no more linear,but include at higher frequencies a semicircle portionlying on the real-axis followed by a straight line. It isseen from Figure 9 that the smallest semicircle portionwas achieved in the case where the appliedpreconcentration potential was 1.3 V. A charge trans-fer resistance (Figure 9c) of around 3000 is evalu-ated by the estimated diameter of the semicircle; this is
in agreement with a high concentration of the redoxcouple. A preconcentration potential of 1 V leads to acharge transfer resistance (Figure 9b) of around 1.1104 ; this potential is insufficient to yield a convenientconcentration of the redox couple. The largest semi-circle region was obtained for a preconconcentrationpotential of 1.5 V, the evaluated charge transfer resis-tance (Figure 9d) is around 2 104 . While thepreconcentration should accumulate the redox couple,the destructuration effect observed by the SEM imagesprevents the charge transfer to proceed: although theiron complex concentration should increase, the chargetransfer resistance increases.
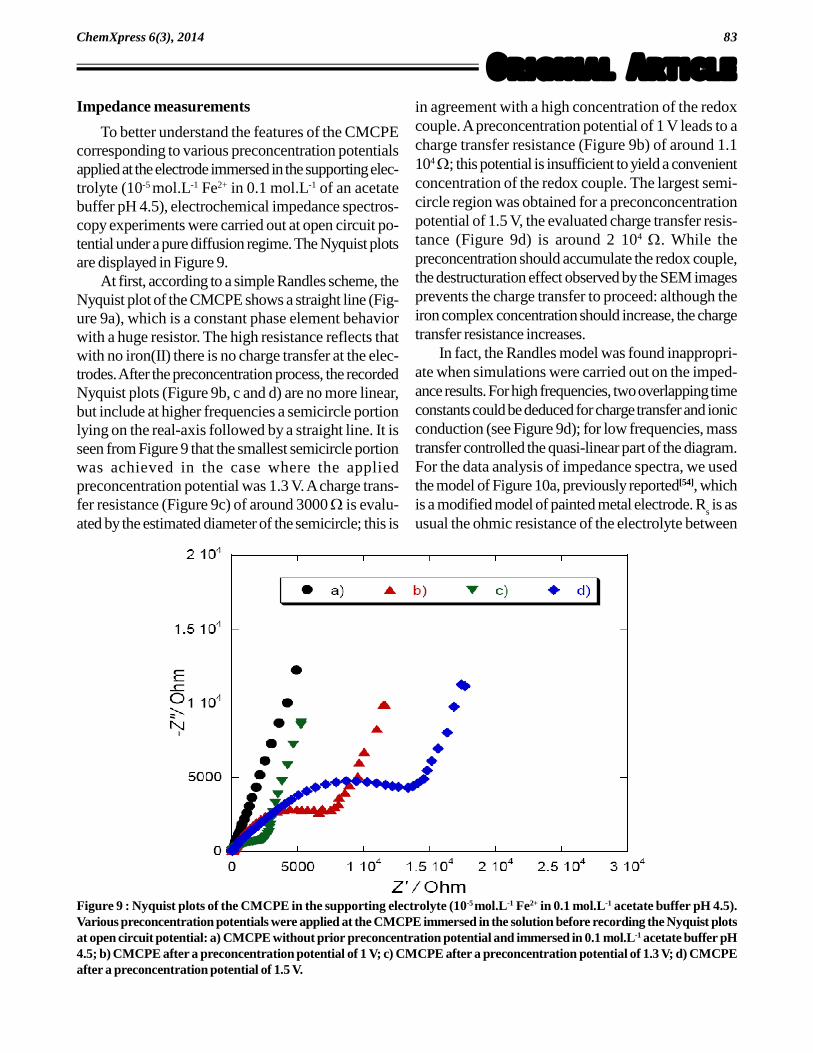
In fact, the Randles model was found inappropri-ate when simulations were carried out on the imped-ance results. For high frequencies, two overlapping timeconstants could be deduced for charge transfer and ionicconduction (see Figure 9d); for low frequencies, masstransfer controlled the quasi-linear part of the diagram.For the data analysis of impedance spectra, we usedthe model of Figure 10a, previously reported[54], whichis a modified model of painted metal electrode. R
s is as
usual the ohmic resistance of the electrolyte between
Figure 9 : Nyquist plots of the CMCPE in the supporting electrolyte (10-5 mol.L-1 Fe2+ in 0.1 mol.L-1 acetate buffer pH 4.5).Various preconcentration potentials were applied at the CMCPE immersed in the solution before recording the Nyquist plotsat open circuit potential: a) CMCPE without prior preconcentration potential and immersed in 0.1 mol.L-1 acetate buffer pH4.5; b) CMCPE after a preconcentration potential of 1 V; c) CMCPE after a preconcentration potential of 1.3 V; d) CMCPEafter a preconcentration potential of 1.5 V.
.84
Original ArticleChemXpress 6(3), 2014
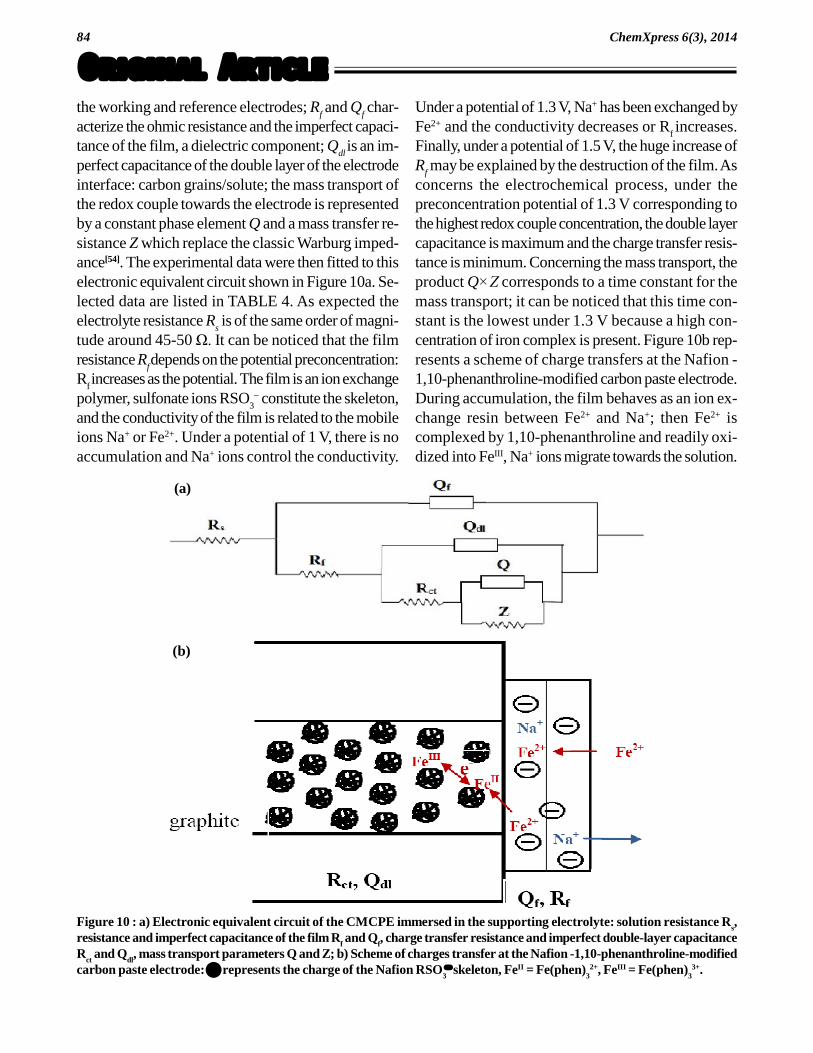
the working and reference electrodes; Rf and Q
f char-
acterize the ohmic resistance and the imperfect capaci-tance of the film, a dielectric component; Q
dl is an im-
perfect capacitance of the double layer of the electrodeinterface: carbon grains/solute; the mass transport ofthe redox couple towards the electrode is representedby a constant phase element Q and a mass transfer re-sistance Z which replace the classic Warburg imped-ance[54]. The experimental data were then fitted to thiselectronic equivalent circuit shown in Figure 10a. Se-lected data are listed in TABLE 4. As expected theelectrolyte resistance R
s is of the same order of magni-
tude around 45-50 Ù. It can be noticed that the filmresistance R
f depends on the potential preconcentration:
Rf increases as the potential. The film is an ion exchange
polymer, sulfonate ions RSO3 constitute the skeleton,
and the conductivity of the film is related to the mobileions Na+ or Fe2+. Under a potential of 1 V, there is noaccumulation and Na+ ions control the conductivity.
Under a potential of 1.3 V, Na+ has been exchanged byFe2+ and the conductivity decreases or R
f increases.
Finally, under a potential of 1.5 V, the huge increase ofR
f may be explained by the destruction of the film. As
concerns the electrochemical process, under thepreconcentration potential of 1.3 V corresponding tothe highest redox couple concentration, the double layercapacitance is maximum and the charge transfer resis-tance is minimum. Concerning the mass transport, theproduct Q×Z corresponds to a time constant for themass transport; it can be noticed that this time con-stant is the lowest under 1.3 V because a high con-centration of iron complex is present. Figure 10b rep-resents a scheme of charge transfers at the Nafion -1,10-phenanthroline-modified carbon paste electrode.During accumulation, the film behaves as an ion ex-change resin between Fe2+ and Na+; then Fe2+ iscomplexed by 1,10-phenanthroline and readily oxi-dized into FeIII, Na+ ions migrate towards the solution.
(a)
(b)
Figure 10 : a) Electronic equivalent circuit of the CMCPE immersed in the supporting electrolyte: solution resistance Rs,
resistance and imperfect capacitance of the film Rf and Q
f, charge transfer resistance and imperfect double-layer capacitance
Rct and Q
dl, mass transport parameters Q and Z; b) Scheme of charges transfer at the Nafion -1,10-phenanthroline-modified
carbon paste electrode: represents the charge of the Nafion RSO3 skeleton, FeII = Fe(phen)
32+, FeIII = Fe(phen)
33+.
85
Original ArticleChemXpress 6(3), 2014
at the electrode surface was maximum; SEM imagesrevealed that at potentials greater than 1.3 V a rougherand crackled surface appeared (Figure 8).
Analytical applications
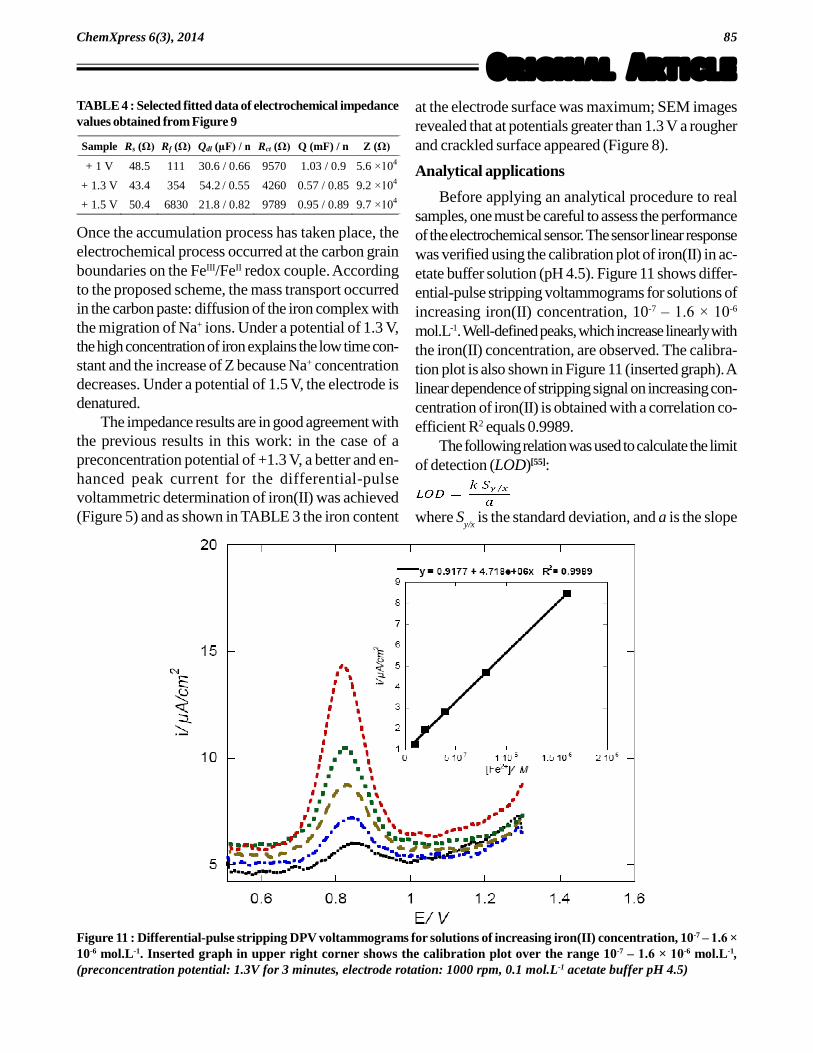
Before applying an analytical procedure to realsamples, one must be careful to assess the performanceof the electrochemical sensor. The sensor linear responsewas verified using the calibration plot of iron(II) in ac-etate buffer solution (pH 4.5). Figure 11 shows differ-ential-pulse stripping voltammograms for solutions ofincreasing iron(II) concentration, 10-7 � 1.6 × 10⁻⁶
mol.L-1. Well-defined peaks, which increase linearly withthe iron(II) concentration, are observed. The calibra-tion plot is also shown in Figure 11 (inserted graph). Alinear dependence of stripping signal on increasing con-centration of iron(II) is obtained with a correlation co-efficient R2 equals 0.9989.
The following relation was used to calculate the limitof detection (LOD)[55]:
where Sy/x
is the standard deviation, and a is the slope
TABLE 4 : Selected fitted data of electrochemical impedancevalues obtained from Figure 9
Sample Rs (Ù) Rf (Ù) Qdl (µF) / n Rct (Ù) Q (mF) / n Z (Ù)
+ 1 V 48.5 111 30.6 / 0.66 9570 1.03 / 0.9 5.6 ×10⁴
+ 1.3 V 43.4 354 54.2 / 0.55 4260 0.57 / 0.85 9.2 ×10⁴
+ 1.5 V 50.4 6830 21.8 / 0.82 9789 0.95 / 0.89 9.7 ×10⁴
Once the accumulation process has taken place, theelectrochemical process occurred at the carbon grainboundaries on the FeIII/FeII redox couple. Accordingto the proposed scheme, the mass transport occurredin the carbon paste: diffusion of the iron complex withthe migration of Na+ ions. Under a potential of 1.3 V,the high concentration of iron explains the low time con-stant and the increase of Z because Na+ concentrationdecreases. Under a potential of 1.5 V, the electrode isdenatured.
The impedance results are in good agreement withthe previous results in this work: in the case of apreconcentration potential of +1.3 V, a better and en-hanced peak current for the differential-pulsevoltammetric determination of iron(II) was achieved(Figure 5) and as shown in TABLE 3 the iron content
Figure 11 : Differential-pulse stripping DPV voltammograms for solutions of increasing iron(II) concentration, 10-7 � 1.6 ×
10-6 mol.L-1. Inserted graph in upper right corner shows the calibration plot over the range 10-7 � 1.6 × 10⁻⁶ mol.L-1,(preconcentration potential: 1.3V for 3 minutes, electrode rotation: 1000 rpm, 0.1 mol.L-1 acetate buffer pH 4.5)
.86
Original ArticleChemXpress 6(3), 2014
of the calibration plot, and k is a constant equal to 3 asrecommended by IUPAC[56]. The standard deviationwas S
y/x = 0.056 and a = 4.7 × 10⁶, leading to the limit
of detection of 3.6 × 10⁻⁸ mol.L-1 (0.00202 mg/L).We estimated the accuracy by analyzing a certified
solution of iron(II) (0.1 mg/L) using the standard addi-tion method. A recovery of 99.01 % was obtained. Therelative standard deviation (precision of the method)for five determinations of 1 × 10⁻⁶ mol.L-1 iron(II) was1.5 %. The results are very satisfactory and indicatethat the proposed method can be used for iron(II) de-termination in aqueous samples.
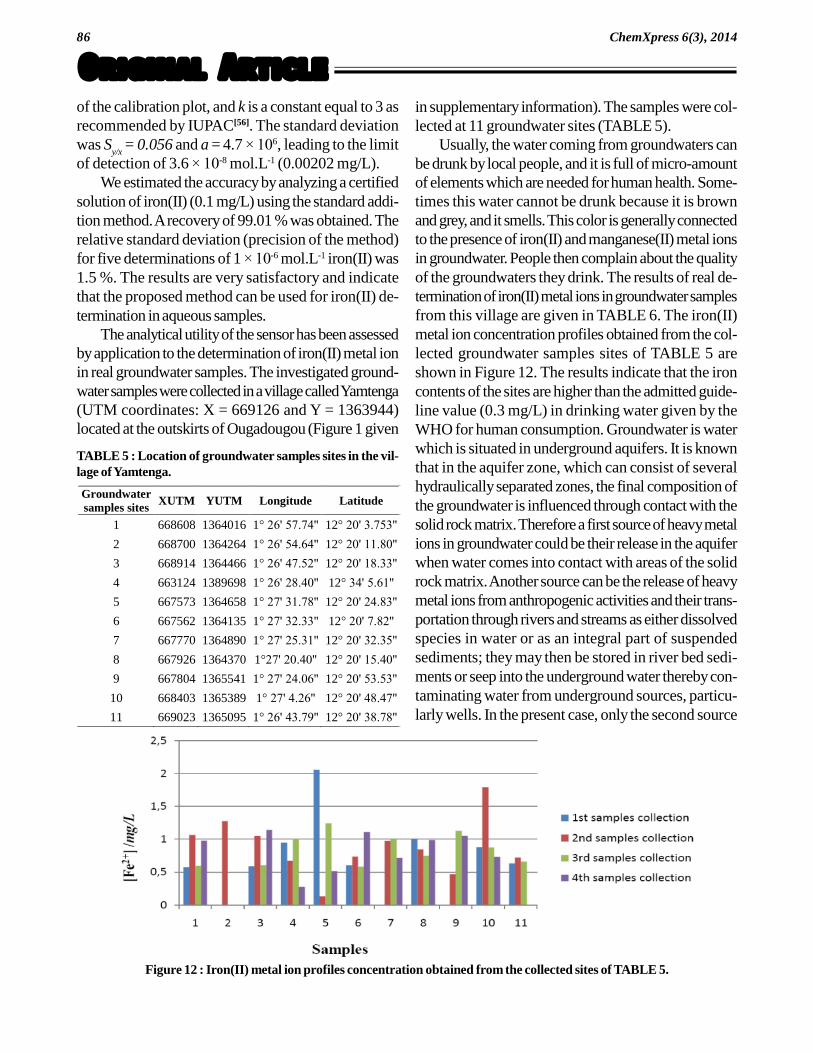
The analytical utility of the sensor has been assessedby application to the determination of iron(II) metal ionin real groundwater samples. The investigated ground-water samples were collected in a village called Yamtenga(UTM coordinates: X = 669126 and Y = 1363944)located at the outskirts of Ougadougou (Figure 1 given
in supplementary information). The samples were col-lected at 11 groundwater sites (TABLE 5).
Usually, the water coming from groundwaters canbe drunk by local people, and it is full of micro-amountof elements which are needed for human health. Some-times this water cannot be drunk because it is brownand grey, and it smells. This color is generally connectedto the presence of iron(II) and manganese(II) metal ionsin groundwater. People then complain about the qualityof the groundwaters they drink. The results of real de-termination of iron(II) metal ions in groundwater samplesfrom this village are given in TABLE 6. The iron(II)metal ion concentration profiles obtained from the col-lected groundwater samples sites of TABLE 5 areshown in Figure 12. The results indicate that the ironcontents of the sites are higher than the admitted guide-line value (0.3 mg/L) in drinking water given by theWHO for human consumption. Groundwater is waterwhich is situated in underground aquifers. It is knownthat in the aquifer zone, which can consist of severalhydraulically separated zones, the final composition ofthe groundwater is influenced through contact with thesolid rock matrix. Therefore a first source of heavy metalions in groundwater could be their release in the aquiferwhen water comes into contact with areas of the solidrock matrix. Another source can be the release of heavymetal ions from anthropogenic activities and their trans-portation through rivers and streams as either dissolvedspecies in water or as an integral part of suspendedsediments; they may then be stored in river bed sedi-ments or seep into the underground water thereby con-taminating water from underground sources, particu-larly wells. In the present case, only the second source
Figure 12 : Iron(II) metal ion profiles concentration obtained from the collected sites of TABLE 5.
Groundwater samples sites XUTM YUTM Longitude Latitude
1 668608 1364016 1° 26' 57.74'' 12° 20' 3.753''
2 668700 1364264 1° 26' 54.64'' 12° 20' 11.80''
3 668914 1364466 1° 26' 47.52'' 12° 20' 18.33''
4 663124 1389698 1° 26' 28.40'' 12° 34' 5.61''
5 667573 1364658 1° 27' 31.78'' 12° 20' 24.83''
6 667562 1364135 1° 27' 32.33'' 12° 20' 7.82''
7 667770 1364890 1° 27' 25.31'' 12° 20' 32.35''
8 667926 1364370 1°27' 20.40'' 12° 20' 15.40''
9 667804 1365541 1° 27' 24.06'' 12° 20' 53.53''
10 668403 1365389 1° 27' 4.26'' 12° 20' 48.47''
11 669023 1365095 1° 26' 43.79'' 12° 20' 38.78''
TABLE 5 : Location of groundwater samples sites in the vil-lage of Yamtenga.
87
Original ArticleChemXpress 6(3), 2014
CONCLUSION
Differential pulse voltammetric determination ofiron(II) using Nafion-1,10-phenanthroline-modifiedelectrode has been studied. Optimal analytical param-eters for iron(II) determination have been ascertained.SEM image corresponding to a maximum recovery ofthe examined iron(II) ion, chemical composition analy-sis and impedance measurements were in good agree-ment with the preconcentration potential of +1.3 V vsEref used for the accumulation/differential pulsevoltammetric determination of iron(II) at the Nafion-1,10-phenanthroline-modified carbon paste electrode.Assuming a simple model based on a redox polymer-modified electrode, the impedance measurementsshowed that the lowest charge transfer resistance couldbe achieved for a preconcentration potential of +1.3 Vvs Eref applied at the CMCPE immersed in a support-ing electrolyte containing the acetate buffer pH 4.5 andthe examined iron(II) ion.
The performance of the electrochemical sensor wasverified by analyzing a reference standard solution of
iron(II). The results, estimated as recovery and stan-dard deviation, were satisfactory. Real groundwaterssamples were also analyzed in a village by the standardaddition method. Determination of other heavy metalsions are under investigation in our laboratory. The presentdata constitute the first study on iron(II) contaminatedgroundwaters in Burkina Faso and will be extended toothers rural environment where heavy metals ions pol-lution (Cu2+, Tl+, Mn2+ and Fe2+) has been detected.The next step of our work will be the implementation ofan adsorption column for the removal of these ions fromgroundwaters in rural environment.
ACKNOWLEDGEMENTS
This work was sponsored by the International Sci-ence Programme (ISP/IPICS) Uppsala, Sweden. Theirfinancial support is gratefully acknowledged.Abdoulkadri Ayouba Mahamane would like to thankthe ISP/IPICS for receiving fellowships to stay at theUniversity of Toulouse (Laboratoire de Génie
Chimique). This work was also made possible withinthe framework of the Institutional cooperation �FRI-
OR� between the University of Paul Sabatier-Toulouse
III (France) and the University of Ouagadougou(Burkina Faso).
REFERENCES
[1] M.Esteban, E.Casassas; Stripping electroanalyticaltechniques in environmental analysis, Trends inAnal.Chem., 13(3), 110 (1994).
[2] Z.Gao, P.Li, G.Wang, Z.Zhao; Preconcentration anddifferential-pulse voltammetric determination ofiron(II) with Nafion-1,10-phenanthroline-modifiedcarbon paste electrodes, Anal.Chim.Acta, 241(1),137 (1990).
[3] Z.Gao, P.Li, Z.Zhao; Determination of iron(II) withchemically-modified carbon paste electrodes,Talanta, 38(10), 1177 (1991).
[4] Imane Adraoui, Aziz Amine; Détermination des
métaux lourds par voie électrochimique, Les
Technologies de Laboratoire, 2(4), 16 (2007).[5] E.Czop, A.Economou, A.Bobrowski; A study of in
situ plated tin-film electrode for the determinationof trace metals by means of square-wave anodicstripping voltammetry, Electrochim.Acta, 56(5),2206 (2011).
of pollution will be used to explain the high content ofiron(II) metal ions. The first one is improbable becausethe geological map (Figure 2 given in supplementaryinformation) has shown that iron is not a major con-stituent of the area and could not enter the aquifer bydissolution of rock and soil.
TABLE 6 : Determination of iron(II) from real groundwaterssamples by the standard addition method. The iron(II) con-tents are expressed in mg/L.
Groundwater samples
1st samples collection
(06 November 2010)
2nd samples collection
(06 February 2011)
3rd samples collection (30 July
2011)
4th samples collection
(22 October 2011)
1 0.576 1.068 0.594 0.98
2 - 1.276 - -
3 0.586 1.046 0.606 1.142
4 0.948 0.672 1.006 0.276
5 2.06 0.132 1.244 0.514
6 0.606 0.736 0.582 1.11
7 - 0.976 1.002 0.718
8 1.002 0.848 0.748 0.99
9 - 0.47 1.13 1.052
10 0.88 1.792 0.876 0.73
11 0.634 0.722 0.662 -
.88
Original ArticleChemXpress 6(3), 2014
[6] E.M.Ghoneim; Simultaneous determination ofMn(II), Cu(II) and Fe(III) as 2-(52 -bromo-22 -pyridylazo)-5-diethylaminophenol complexes byadsorptive cathodic stripping voltammetry at a car-bon paste electrode, Talanta, 82(2), 646 (2010).
[7] B.S.Sherigara, Y.Shivaraj, R.J.Mascarenhas,A.K.Satpati; Simultaneous determination of lead,copper and cadmium onto mercury film supportedon wax impregnated carbon paste electrode: As-sessment of quantification procedures by anodicstripping voltammetry, Electrochim.Acta, 52(9),3137 (2007).
[8] J.Wang; Stripping Analysis: Principles, Instrumen-tation and Applications, VCH Publishers, DeerfieldBeach, Florida, 160 (1985).
[9] N.Abo El-Maali, Y.M.Temerk, M.Sh-Abd El-Aziz;Application of stripping voltammetry at a staticmercury drop electrode for the determination of alu-minium and iron in Portland cement, Anal.Chim.Acta, 353(2-3), 313 (1997).
[10] J.Zhao, W.Jin; A study on the adsorptionvoltammetry of the iron(III)-2-(52 -bromo-22 -pyridylazo)-5-diethylaminophenol system,J.Electroanal.Chem., 267(1-2), 271 (1989).
[11] J.Wang; Analytical Electrochemistry, Third Edition,WILEY-VCH Publishers, United States of America,250 (2006).
[12] A.Economou, P.R.Fielden; Mercury film electrodes:Developments, trends and potentialities for elec-troanalysis, Analyst, 128(3), 205 (2003).
[13] J.Wang, J.Lu; Adsorptive stripping voltammetry oftrace manganese in the presence of 2-(52 -bromo-22 -pyridylazo)-5-diethylaminophenol (5-Br-PADAP), Talanta, 42(3), 331 (1995).
[14] S.Tanaka, K.Sugawara, M.Taga; Adsorptionvoltammetry of the copper (II) 2-(52 -bromo-22 -pyridylazo)-5-diethylaminophenol complex, Talanta,37(10), 1001 (1990).
[15] J.Lu, W.Jin, S.Wang; Adsorption voltammetry ofthe vanadium-2-(52 -bromo-22 -pyridylazo)-5-diethylaminophenol (5-Br-PADAP) system,Anal.Chim.Acta, 238, 375 (1990).
[16] M.A.Nolan, S.P.Kounaves; Microfabricated arrayof Iridium microdisks as a substrate for direct de-termination of Cu2+ or Hg2+ using square-wave an-odic stripping voltammetry, Anal.Chem., 71(16),3567 (1999).
[17] K.Kalcher, J.-M.Kauffmann, J.Wang, I.�vancara,
K.Vytøas, C.Neuhold, Z.Yang; Sensors based oncarbon paste in electrochemical analysis: A review
with particular emphasis on the period 1990-1993,Electroanal., 7(1), 5 (1995).
[18] J.Wang, B.Tian; Mercury-free disposable lead sen-sors based on potentiometric stripping analysis ofgold-coated screen-printed electrodes, Anal.Chem.,65(11), 1529 (1993).
[19] J.Wang, J.-M.Lu, S.B.Hocevar, P.A.M.Farias; Bis-muth-coated carbon electrodes for anodic strippingvoltammetry, Anal.Chem., 72(14), 3218 (2000).
[20] S.B.Hocevar, I.Svancara, K.Vytras, B.Ogorevc;Novel electrode for electrochemical stripping analy-sis based on carbon paste modified with bismuthpowder, Electrochim.Acta, 51(4), 706 (2005).
[21] E.A.Hutton, B.Ogorevc, S.B.Hocevar, M.R.Smyth;Bismuth film microelectrode for direct voltammetricmeasurement of trace cobalt and nickel in somesimulated and real body fluid samples, Anal.Chim.Acta, 557(1-2), 57 (2006).
[22] S.V.Prabhu, R.P.Baldwin; Constant potentialamperometric detection of carbohydrates at a cop-per-based chemically modified electrode, Anal.Chem., 61(8), 852 (1989).
[23] S.V.Prabhu, R.P.Baldwin, L.Kryger; Chemicalpreconcentration and determination of copper at achemically modified carbon-paste electrode contain-ing 2,9-dimethyl-1,10-phenanthroline, Anal.Chem.,59(8), 1074 (1987).
[24] K.N.Thomson, L.Kryger, R.P.Baldwin;Voltammetric determination of traces of nickel(II)with a medium exchange flow system and a chemi-cally modified carbon paste electrode containingdimethylglyoxyme, Anal.Chem., 60(2), 151 (1988).
[25] J.Wang, M.Bonakdar; Preconcentration andvoltammetric measurement of mercury with acrown-ether modified carbon-paste electrode,Talanta, 35(4), 277 (1988).
[26] J.F.Price, R.P.Baldwin; Preconcentration and de-termination of ferrocenecarboxaldehyde at a chemi-cally modified platinum electrode, Anal.Chem.,52(12), 1940 (1980).
[27] K.N.Thomson, R.P.Baldwin; Amperometric detec-tion of nonelectroactive cations in flow systems ata cupric hexacyanoferrate electrode, Anal.Chem.,61(23), 2594 (1989).
[28] L.A.Coury, Jr., E.M.Birch, W.R.Heineman;Gamma-irradiated polymer modified-graphite elec-trodes with enhance response to catechol, Anal.Chem., 60(6), 553 (1988).
[29] A.Komersová, M.Barto�, K.Kalcher, K.Vytøas;Trace iron determination in aminoisophthalic acid
89
Original ArticleChemXpress 6(3), 2014
using differential-pulse cathodic strippingvoltammetry at carbon paste electrodes, J.Pharm.Biomed.Anal., 16(8), 1373 (1998).
[30] R.Segura, M.Inés Toral, V.Arancibia; Determina-
tion of iron in water samples by adsorptive strippingvoltammetry with a bismuth film electrode in thepresence of 1-(2-piridylazo)-2-naphthol, Talanta,75(4), 973 (2008).
[31] R.F.Lane, A.T.Hubbard; Electrochemistry ofchemisorbed molecules.I.Reactants connected toelectrodes through olefinic substituents,J.Phys.Chem., 77(11), 1401 (1973).
[32] P.R.Moses, L.Wier, R.W.Murray; Chemically modi-fied tin oxide electrode, Anal.Chem., 47(12), 1882(1975).
[33] C.Mariame, M.El Rhazi, I.Adraoui; Determinationof Traces of Copper by Anodic Stripping volta-mmetry at a rotating carbon paste disk electrodemodified with poly(1,8-diaminonaphtalene),J.Anal.Chem., 64(6), 632 (2009).
[34] I.Adraoui, M.El Rhazi, A.Amine, C.Mariame; Ap-plications analytiques des films minces de mercureprotégés par du fibrinogène pour la détermination
du plomb et du cadmium dans les échantillons
d�eaux usées et d�eaux de mer, Afrique SCIENCE,
2(3), 263 (2006).[35] R.J.Mascarenhas, A.K.Satpati, S.Yellapa,
B.S.Sherigara; Wax-impregnated carbon paste elec-trode modified with mercuric oxalate for the simul-taneous determination of heavy metal ions in me-dicinal plants and Ayurvedic tablets, Anal.Sci., 22(6),871 (2006).
[36] S.B.Khoo, S.X.Guo; Rapidly renewable and repro-ducible electropolymerized surface at a monomermodified carbon paste electrode, J.Electroanal.Chem., 465(1), 102 (1999).
[37] S.Majid, M.El Rhazi, A.Amine, A.Currili, G.Palleschi;Carbon paste electrode bulk-modified with the con-ducting polymer poly(1,8-Diaminonaphathalene):Application to lead determination, Microchim.Acta,143(2-3), 195 (2003).
[38] G.T.Cheek, R.F.Nelson; Applications of chemicallymodified electrodes to analysis of metal ions,Anal.Lett., A11(5), 393 (1978).
[39] P.Li, Z.Gao, Y.Xu, G.Wang, Z.Zhao; Determinationof trace amounts of silver with a chemically modi-fied carbon paste electrode, Anal.Chim.Acta, 229,213 (1990).
[40] Kurt Kalcher; Voltammetric determination of traceamounts of gold with a chemically modified carbon
paste electrode, Anal.Chim.Acta, 177, 175 (1985).[41] Z.Gao, P.Li, S.Dong, Z.Zhao; Voltammetric deter-
mination of trace amounts of gold(III) with a car-bon paste electrode modified with a chelating resin,Anal.Chim.Acta, 232, 367 (1990).
[42] P.Hernandez, E.Alda, L.Hernandez; Determinationof mercury(II) using a modified electrode with zeo-lite, Fresenius Zeit.Anal.Chem., 327(7), 676(1987).
[43] L.Hernandez, P.Hernandez, M.H.Blanco,M.Sanchez; Determination of copper(II) with acarbon paste modified with an ion-exchange resin,Analyst (London), 113(1), 41 (1988).
[44] C.Hu, K.Wu, X.Dai, S.Hu; Simultaneous determi-nation of lead(II) and cadmium(II) at adiacetyldioxime modified carbon paste electrode bydifferential pulse stripping voltammetry, Talanta,60(1), 17 (2003).
[45] A.Ferancova, E.Korgova, J.Labuda, J.Zima,J.Barek; Cyclodextrin modified carbon paste basedelectrodes as sensors for the determination of car-cinogenic polycyclic aromatic amines, Electroanal.,14(23), 1668 (2002).
[46] D.Savitri, C.K.Mitra; Modeling the surface phenom-ena in carbon paste electrodes by low frequencyimpedance and double-layer capacitance measure-ments, Bioelectroch.Bioenerg., 48(1), 163 (1999).
[47] M.Muti, A.Erdem, A.Calishan, A.Sinag, T.Yumak;Electrochemical behavior of carbon paste electrodesenriched with tin oxide nanoparticles usingvoltammetry and impedance spectroscopy, ColloidSurface B, 86(1), 154 (2011).
[48] A.Rodríguez-López, D.Torres, J.Mojica-Gomez,
C.Estrada-Artega, R.Antaño- López; Characteriza-
tion by electrochemical impedance spectroscopy ofmagnetic nanoparticles supported on carbon pasteelectrode, Electrochim.Acta, 56(23), 8078 (2011).
[49] Ren-Xia Xu, Xin-Yao Yu, Chao Gao, Yu-Jing Jiang,Dong-Dong Han, Jin-Huai Liu, Xing-Jiu Huang;Non-conductive nanomaterial enhanced electro-chemical response in stripping voltammetry: The useof nanostructured magnesium silicate hollowspheres for heavy metal ions detection, Anal.Chim.Acta, 790, 31 (2013).
[50] H.Bagheri, A.Afkhami, H.Khoshafar, M.Rezaei,A.Shirzadmehr; Simultaneous electrochemical de-termination of heavy metals using atriphenylphosphine/MWCNTs composite carbonionic liquid electrode, Sensor Actuat B-Chem., 186,451 (2013).
.90
Original ArticleChemXpress 6(3), 2014
[51] S.Wang, Y.Wang, L.Zhou, J.Li, S.Wang, H.Liu;Fabrication of an effective electrochemical platformbased on grapheme and AuNPs for high sensitivedetection of trace Cu2+, Electrochim.Acta, 132, 7(2014).
[52] C.Gabrielli, O.Hass, H.Takenouti; Impedance analy-sis of electrodes modified with a reversible redoxpolymer film, J.Appl.Electrochem., 17(1), 82(1987).
[53] Jyh-Myng Zen, Yuan-Shih Ting; Square-wavevoltammetric stripping analysis of lead(II) at aNafion®/copper-mercury film electrode, Anal.Chim.Acta, 332(1), 59 (1996).
[54] S.-Y.Shi, Z.-H.Fang, J.-R.Ni; Electrochemical im-pedance spectroscopy of marmatite-carbon-pasteelectrode in the presence and absence ofAcidithiobacillus ferroxidans, Electrochem.Commun., 7(11), 1177 (2005).
[55] F.Quentel; Voltammetric study of molybdenum inthe presence of phenanthroline, Electroanal., 11(18),1355 (1999).
[56] Gary L.Long, J.D.Winefordner; Limit of detection.A closer look at the IUPAC definition, Anal.Chem.,55(7), 712A (1983).