method titan: inference of copy number architectures in clonal … · 2019-08-06 · method titan:...
TRANSCRIPT
Method
TITAN: inference of copy number architecturesin clonal cell populations from tumorwhole-genome sequence dataGavin Ha,1,2 Andrew Roth,1,2 Jaswinder Khattra,1 Julie Ho,3 Damian Yap,1
Leah M. Prentice,3 Nataliya Melnyk,3 Andrew McPherson,1,2 Ali Bashashati,1
Emma Laks,1 Justina Biele,1 Jiarui Ding,1,4 Alan Le,1 Jamie Rosner,1 Karey Shumansky,1
Marco A. Marra,5 C. Blake Gilks,6 David G. Huntsman,3,7 Jessica N. McAlpine,8
Samuel Aparicio,1,7 and Sohrab P. Shah1,4,7
1Department of Molecular Oncology, British Columbia Cancer Agency, Vancouver, BC V5Z 1L3, Canada; 2Bioinformatics Training
Program, University of British Columbia, Vancouver, BC V5Z 4S6, Canada; 3Centre for Translational and Applied Genomics, Vancouver,
BC V5Z 4E6, Canada; 4Department of Computer Science, University of British Columbia, Vancouver, BC V6T 1Z4, Canada; 5Genome
Sciences Centre, British Columbia Cancer Agency, Vancouver, BC V5Z 1L3, Canada; 6Genetic Pathology Evaluation Centre, Vancouver
General Hospital, Vancouver, BC V6H 3Z6, Canada; 7Department of Pathology and Laboratory Medicine, University of British Columbia,
Vancouver, BC V6T 2B5, Canada; 8Department of Gynecology and Obstetrics, University of British Columbia, Vancouver, BC V5Z 1M9,
Canada
The evolution of cancer genomes within a single tumor creates mixed cell populations with divergent somatic mutationallandscapes. Inference of tumor subpopulations has been disproportionately focused on the assessment of somatic pointmutations, whereas computational methods targeting evolutionary dynamics of copy number alterations (CNA) and lossof heterozygosity (LOH) in whole-genome sequencing data remain underdeveloped. We present a novel probabilisticmodel, TITAN, to infer CNA and LOH events while accounting for mixtures of cell populations, thereby estimating theproportion of cells harboring each event. We evaluate TITAN on idealized mixtures, simulating clonal populations fromwhole-genome sequences taken from genomically heterogeneous ovarian tumor sites collected from the same patient. Inaddition, we show in 23 whole genomes of breast tumors that the inference of CNA and LOH using TITAN criticallyinforms population structure and the nature of the evolving cancer genome. Finally, we experimentally validated sub-clonal predictions using fluorescence in situ hybridization (FISH) and single-cell sequencing from an ovarian cancerpatient sample, thereby recapitulating the key modeling assumptions of TITAN.
[Supplemental material is available for this article.]
Tumor progression follows the principles of clonal evolution
(Nowell 1976). Accumulation of genomic alterations is patterned
by phylogenetic branching, creating a substrate for natural selec-
tion. Invariably, this leads to the emergence of distinct cell populations
(clones) with divergent genotypes and associated phenotypes
(Aparicio andCaldas 2013). Here, we define a clone as a population
of cells related by descent from a unitary origin and uniquely
identified by the complement of fixed genetic marks comprising
its clonal genotype. Genetic marks can consist of somatic muta-
tions such as point mutations, genome rearrangements, copy
number alterations (CNA), and loss of heterozygosity (LOH), of
which CNA and LOH are the focus of this study. We define the
cellular prevalence of a somatic mutation as the proportion of cells
harboring an aberration in the overall (bulk) tumor cell population
(Aparicio and Caldas 2013). Cellular prevalence can be measured
approximately through sequencing a bulk sample, ormore precisely
in independent analysis of single cells (Navin et al. 2011). The dy-
namics of cellular prevalence of a mutation are reflective of growth
(dis)advantages in the presence of treatment or microenvironment-
induced selective pressures and are thus a useful indicator of the
biology underpinning tumor progression.
The clonal evolution theory implies that extant clones are
related genetically through a phylogenetic tree. In suchpopulation
structures, cellular prevalence of a genetic alteration is generally
a function of its evolutionary timing: High-prevalence mutations
are acquired earlier than low-prevalence mutations. Thus, ances-
tralmutations are found at the root of the tree, whereas descendent
mutations are situated toward the leaves. We explored the result-
ing patterns of alterations acquired after expansion of the ancestral
clone, which generates three types of cells in a tumor sample: nor-
mal (nonmalignant) cells, tumor cells harboring the alteration, and
tumor cells without the alteration. This concept applies to all forms
of genomic aberrations, including CNA and LOH, despite a dispro-
portionate emphasis onpointmutations in the literature (Shah et al.
2009, 2012; Ding et al. 2012; Gerstung et al. 2012; Cibulskis et al.
2013; Landau et al. 2013; Larson and Fridley 2013; Roth et al. 2014).
� 2014 Ha et al. This article, published in Genome Research, is available under aCreative Commons License (Attribution 4.0 International), as described at http://creativecommons.org/licenses/by/4.0.
Corresponding author: [email protected] published online before print. Article, supplemental material, and pub-lication date are at http://www.genome.org/cgi/doi/10.1101/gr.180281.114.Freely available online through the Genome Research Open Access option.
24:1881–1893 Published by Cold Spring Harbor Laboratory Press; ISSN 1088-9051/14; www.genome.org Genome Research 1881www.genome.org
Cold Spring Harbor Laboratory Press on August 9, 2017 - Published by genome.cshlp.orgDownloaded from
Indeed, tumorswith diverse intratumoral patterns of CNA and LOH
have been described in breast (Navin et al. 2011; Nik-Zainal et al.
2012), ovarian (Bashashati et al. 2013), renal (Gerlinger et al. 2012,
2014), and brain tumors (Sottoriva et al. 2013).
Whole-exome (WES) and -genome (WGS) sequencing of a
single biopsy are emerging as the dominant experimental designs
in large cohort studies of tumor genomic landscapes, with con-
sortia such as the International Cancer Genome Consortium
(ICGC) poised to generate on the order of 10,000 tumor-normal
WGS libraries in the next few years (The International Cancer
Genome Consortium 2010). Characterization of clonal popula-
tions from such data sets has been primarily focused on point
mutations, which require targeted deep sequencing. Measuring
cellular prevalences of CNA and LOH presents unique challenges
because these events can span megabases, rendering targeted deep
sequencing of alleles infeasible. Moreover, heterogeneousmixtures
of cells in tumor biopsies present a major limitation in accurate
interpretation of WGS data. CNA and LOH events present in only
minor cell populations will have diminished statistical signals and
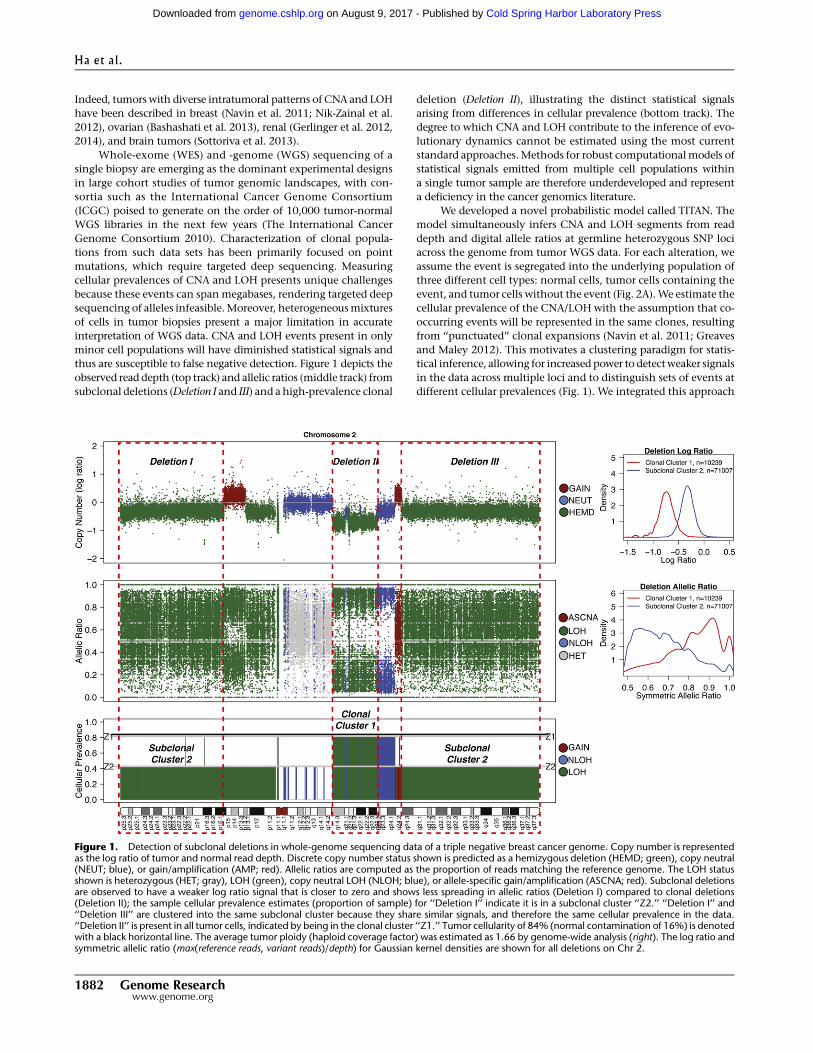
thus are susceptible to false negative detection. Figure 1 depicts the
observed read depth (top track) and allelic ratios (middle track) from
subclonal deletions (Deletion I and III) and a high-prevalence clonal
deletion (Deletion II), illustrating the distinct statistical signals
arising from differences in cellular prevalence (bottom track). The
degree to which CNA and LOH contribute to the inference of evo-
lutionary dynamics cannot be estimated using the most current
standard approaches. Methods for robust computationalmodels of
statistical signals emitted from multiple cell populations within
a single tumor sample are therefore underdeveloped and represent
a deficiency in the cancer genomics literature.
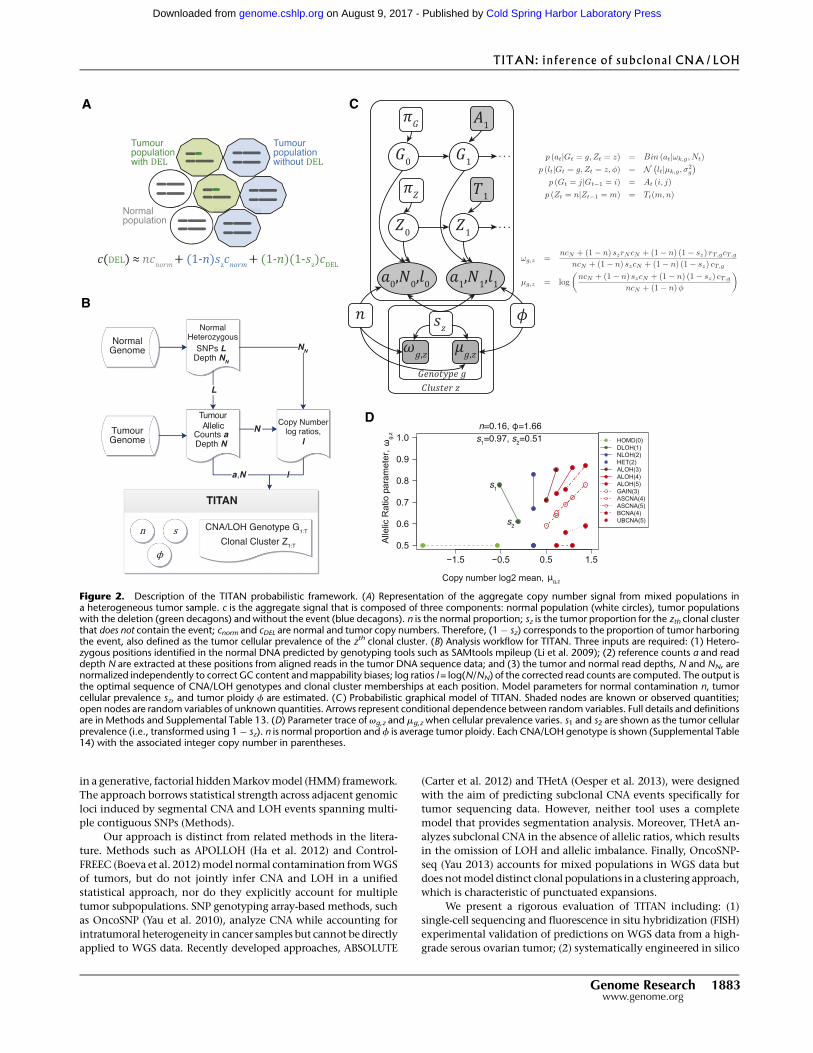
We developed a novel probabilistic model called TITAN. The
model simultaneously infers CNA and LOH segments from read
depth and digital allele ratios at germline heterozygous SNP loci
across the genome from tumor WGS data. For each alteration, we
assume the event is segregated into the underlying population of
three different cell types: normal cells, tumor cells containing the
event, and tumor cells without the event (Fig. 2A).We estimate the
cellular prevalence of the CNA/LOH with the assumption that co-
occurring events will be represented in the same clones, resulting
from ‘‘punctuated’’ clonal expansions (Navin et al. 2011; Greaves
and Maley 2012). This motivates a clustering paradigm for statis-
tical inference, allowing for increased power to detectweaker signals
in the data across multiple loci and to distinguish sets of events at
different cellular prevalences (Fig. 1). We integrated this approach
Figure 1. Detection of subclonal deletions in whole-genome sequencing data of a triple negative breast cancer genome. Copy number is representedas the log ratio of tumor and normal read depth. Discrete copy number status shown is predicted as a hemizygous deletion (HEMD; green), copy neutral(NEUT; blue), or gain/amplification (AMP; red). Allelic ratios are computed as the proportion of reads matching the reference genome. The LOH statusshown is heterozygous (HET; gray), LOH (green), copy neutral LOH (NLOH; blue), or allele-specific gain/amplification (ASCNA; red). Subclonal deletionsare observed to have a weaker log ratio signal that is closer to zero and shows less spreading in allelic ratios (Deletion I) compared to clonal deletions(Deletion II); the sample cellular prevalence estimates (proportion of sample) for ‘‘Deletion I’’ indicate it is in a subclonal cluster ‘‘Z2.’’ ‘‘Deletion I’’ and‘‘Deletion III’’ are clustered into the same subclonal cluster because they share similar signals, and therefore the same cellular prevalence in the data.‘‘Deletion II’’ is present in all tumor cells, indicated by being in the clonal cluster ‘‘Z1.’’ Tumor cellularity of 84% (normal contamination of 16%) is denotedwith a black horizontal line. The average tumor ploidy (haploid coverage factor) was estimated as 1.66 by genome-wide analysis (right). The log ratio andsymmetric allelic ratio (max(reference reads, variant reads)/depth) for Gaussian kernel densities are shown for all deletions on Chr 2.
1882 Genome Researchwww.genome.org
Ha et al.
Cold Spring Harbor Laboratory Press on August 9, 2017 - Published by genome.cshlp.orgDownloaded from
in a generative, factorial hiddenMarkovmodel (HMM) framework.
The approach borrows statistical strength across adjacent genomic
loci induced by segmental CNA and LOH events spanning multi-
ple contiguous SNPs (Methods).
Our approach is distinct from related methods in the litera-
ture. Methods such as APOLLOH (Ha et al. 2012) and Control-
FREEC (Boeva et al. 2012)model normal contamination fromWGS
of tumors, but do not jointly infer CNA and LOH in a unified
statistical approach, nor do they explicitly account for multiple
tumor subpopulations. SNP genotyping array-based methods, such
as OncoSNP (Yau et al. 2010), analyze CNA while accounting for
intratumoral heterogeneity in cancer samples but cannot be directly
applied to WGS data. Recently developed approaches, ABSOLUTE
(Carter et al. 2012) and THetA (Oesper et al. 2013), were designed
with the aim of predicting subclonal CNA events specifically for
tumor sequencing data. However, neither tool uses a complete
model that provides segmentation analysis. Moreover, THetA an-
alyzes subclonal CNA in the absence of allelic ratios, which results
in the omission of LOH and allelic imbalance. Finally, OncoSNP-
seq (Yau 2013) accounts for mixed populations in WGS data but
does notmodel distinct clonal populations in a clustering approach,
which is characteristic of punctuated expansions.
We present a rigorous evaluation of TITAN including: (1)
single-cell sequencing and fluorescence in situ hybridization (FISH)
experimental validation of predictions on WGS data from a high-
grade serous ovarian tumor; (2) systematically engineered in silico
Figure 2. Description of the TITAN probabilistic framework. (A) Representation of the aggregate copy number signal from mixed populations ina heterogeneous tumor sample. c is the aggregate signal that is composed of three components: normal population (white circles), tumor populationswith the deletion (green decagons) and without the event (blue decagons). n is the normal proportion; sz is the tumor proportion for the zth clonal clusterthat does not contain the event; cnorm and cDEL are normal and tumor copy numbers. Therefore, (1� sz) corresponds to the proportion of tumor harboringthe event, also defined as the tumor cellular prevalence of the zth clonal cluster. (B) Analysis workflow for TITAN. Three inputs are required: (1) Hetero-zygous positions identified in the normal DNA predicted by genotyping tools such as SAMtools mpileup (Li et al. 2009); (2) reference counts a and readdepth N are extracted at these positions from aligned reads in the tumor DNA sequence data; and (3) the tumor and normal read depths, N and NN, arenormalized independently to correct GC content andmappability biases; log ratios l = log(N/NN) of the corrected read counts are computed. The output isthe optimal sequence of CNA/LOH genotypes and clonal cluster memberships at each position. Model parameters for normal contamination n, tumorcellular prevalence sz, and tumor ploidy f are estimated. (C ) Probabilistic graphical model of TITAN. Shaded nodes are known or observed quantities;open nodes are random variables of unknown quantities. Arrows represent conditional dependence between random variables. Full details and definitionsare in Methods and Supplemental Table 13. (D) Parameter trace of vg,z and mg,z when cellular prevalence varies. s1 and s2 are shown as the tumor cellularprevalence (i.e., transformed using 1� sz). n is normal proportion and f is average tumor ploidy. Each CNA/LOH genotype is shown (Supplemental Table14) with the associated integer copy number in parentheses.
TITAN: inference of subclonal CNA/LOH
Genome Research 1883www.genome.org
Cold Spring Harbor Laboratory Press on August 9, 2017 - Published by genome.cshlp.orgDownloaded from
mixtures with WGS data from multiple intrapatient samples; (3)
artificially embedded CNA and LOH events in diploid chromo-
somes; and (4) 23 triple negative breast cancer (TNBC) genomes.
We compared TITANwith four publishedmethods to demonstrate,
with quantitative benchmarking on the ground truth data sets,
that TITAN has higher sensitivity to detect low cellular prevalence
events without decreasing specificity and has the capacity to ac-
curately estimate cellular prevalences. Application of TITAN to 23
TNBC samples shows that a substantial proportion of clonal di-
versity is captured in the CNA/LOH dimensions, with low cellular
prevalence LOH impacting allele-specific expression inferred from
matched RNA-seq data. Finally, results from FISH and single-cell
sequencing validation experiments confirm that predicted CNA/
LOH events were consistent with our key modeling assumption:
Distinct cell populations can be identified through inference of
CNA/LOH from WGS data. Together, these data show that the
cellular prevalence profile of the copy number architecture from
WGS provides an effective route to inferring clonal populations in
patient tumor samples. Finally, we suggest how the deployment of
TITAN in large-scale clinical studies can dissect the interplay be-
tween clonal evolution, DNA repair deficiencies, and response to
therapy.
ResultsTITAN is a statisticalmodel for predicting segmental CNA and LOH
from matched tumor and normal WGS data. The input to the
model is the full set of germline heterozygous SNP loci (identified
from the normal sample) and the corresponding read depth and
allele ratios at these SNP positions from the tumor. The output is a
set of segmental CNA and LOH events, clonal cluster member-
ships, and estimated cellular prevalences (Fig. 2B). The tumor and
sample cellular prevalences are defined as the proportion of the
tumor cells and the proportion of the sample (including normal
cells) that harbor a CNA/LOH event, respectively. The model is
predicated on four main assumptions: (1) joint analysis of allelic
ratio and tumor sequence coverage (depth) at ;1–3 million het-
erozygous germline SNP loci reflects the underlying somatic ge-
notype of the tumor; (2) segmental regions of CNA and LOH
span tens to thousands of contiguous SNP loci; (3) the observed
sequencing signal is an aggregated measure of heterogeneous cel-
lular populations, including normal and tumor subpopulations
(Fig. 2A,D); and (4) sets of genetic aberrations observed at similar
cellular prevalences possibly co-occurred in the same clone. We
incorporated these assumptions into a two-chain factorial HMM
(Fig. 2C; Methods; Supplemental Methods).
In order to evaluate and experimentally validate TITAN pre-
dictions, we used the genomes from a set of five synchronously
resected pretreatment high-grade serous (HGS) ovarian cancer
specimens (DG1136a,c,e,g,i) from the same patient. We obtained
Illumina HiSeq 2500 WGS 100-bp paired-end data, sequenced at
;303, for each tumor sample and the patient’s matched normal
DNA for a total of six data sets. There were ;2.3 million high con-
fidence heterozygous SNPs in the normal genome of DG1136.
Across the five tumor samples, there were 2816 CNA/LOH events
(Supplemental Table 1), with a range of event sizes (Supplemental
Fig. 1) covering an average of;1.5M SNPs per sample.We used these
data to generate two types of benchmarking data sets for which these
original events formed the ground truth ‘‘positive set’’ in the quan-
titative evaluation. First, we simulated synthetic embedding of
sampled CNA/LOH events into diploid chromosomes; and second,
we systematically admixed the related but distinct CNA/LOH pro-
files from the tumor samples in knownquantities to simulatemixed
tumor populations. Finally, provision over the biological material
allowed for experimental validation of TITAN predictions using
FISH and single-cell sequencing.
Simulated CNA spike-in experiment demonstrates accuratedetection for varying event sizes
We profiled the CNA landscape of DG1136a using two com-
plementary methods: HMMcopy (Ha et al. 2012) and Control-
FREEC (Boeva et al. 2012). Both methods identified a large
deletion (Chr16:46464744–90173515) and an amplification
(Chr8:97045605–144155272) of interest (Supplemental Fig. 2;
Supplemental Table 1A). From these events, we randomly sampled
log ratios and allele counts for nonconsecutive sets of 10, 100, and
1000 positions. The sampled data were then inserted into diploid
heterozygous chromosomes (Chr 1, 2, 9, and 18) at consecutive
SNP positions to simulate segmental CNA and LOH events (Sup-
plemental Methods). In total, there were four deletions and four
amplifications for each event size. Median genomic sizes of these
events were 6.9 kb, 82 kb, and 1.2 Mb. We also included one de-
letion and one amplification event spanning 10,000 SNPs (median
12.5 Mb) (Supplemental Table 2A). To vary cellular prevalences,
we generated spike-in events sampled from two simulated tumor-
normal admixtures at 80% and 60% of the original DG1136a data
set, computationally admixed with its matched normal WGS data
(Supplemental Methods; Supplemental Figs. 3–6).
TITAN was run, from a range of one to five clonal clusters, on
the entire simulated sample (containing 78 events), including the
chromosomes without spike-in events. The run with four clonal
clusters was selected as optimal based on the S_Dbw validity index
(Supplemental Methods; Halkidi et al. 2002). All 54 events of 100
SNPs or larger were detected (true positive rate [TPR] $ 0.9); how-
ever, only 11 of 24 events of 10 SNPs were recalled (Supplemental
Table 2B). The global false positive rate (FPR) was 0.04, which was
computed by considering all SNP positions in Chr 1, 2, 9, and 18
where no spike-in data was inserted.
The tumor cellular prevalence estimates for two of the TITAN
clonal clusters were 0.52 and 0.36, which were within range of the
expected values of 0.52 and 0.39 (Supplemental Methods). For
deletions and amplifications, respectively, the cellular prevalence
for 24 (89%) and 10 (37%) events with 100 SNPs or larger were
correctly estimated (TPR $ 0.9) (Supplemental Figs. 3–6; Supple-
mental Table 2C). Despite the prevalence estimates of many am-
plifications not matching expected values, the events were still
predicted to be subclonal but with a lower prevalence in some
instances. On balance, the spike-in experiments demonstrate that
TITAN is accurate at detecting (sub)clonal events of varying sizes,
but illustrate a potential limitation in detection of very small (10
SNP) events and estimation of the true prevalence for amplifica-
tions (see Discussion).
TITAN confers improved sensitivity for low-prevalenceevents in simulated tumor subpopulations
To assess the performance of TITAN using benchmarking data sets
that are more representative of clonal mixtures, we designed sys-
tematic experiments that simulated genomes with multiple tumor
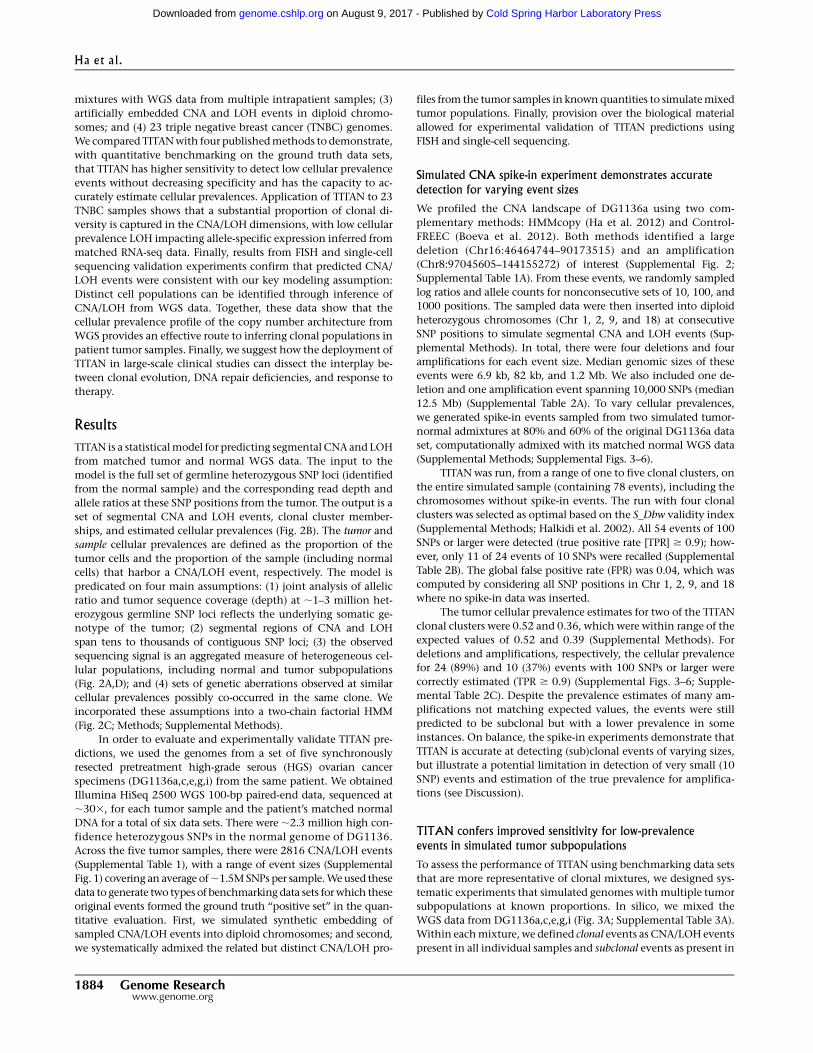
subpopulations at known proportions. In silico, we mixed the
WGS data from DG1136a,c,e,g,i (Fig. 3A; Supplemental Table 3A).
Within eachmixture, we defined clonal events as CNA/LOH events
present in all individual samples and subclonal events as present in
Ha et al.
1884 Genome Researchwww.genome.org
Cold Spring Harbor Laboratory Press on August 9, 2017 - Published by genome.cshlp.orgDownloaded from
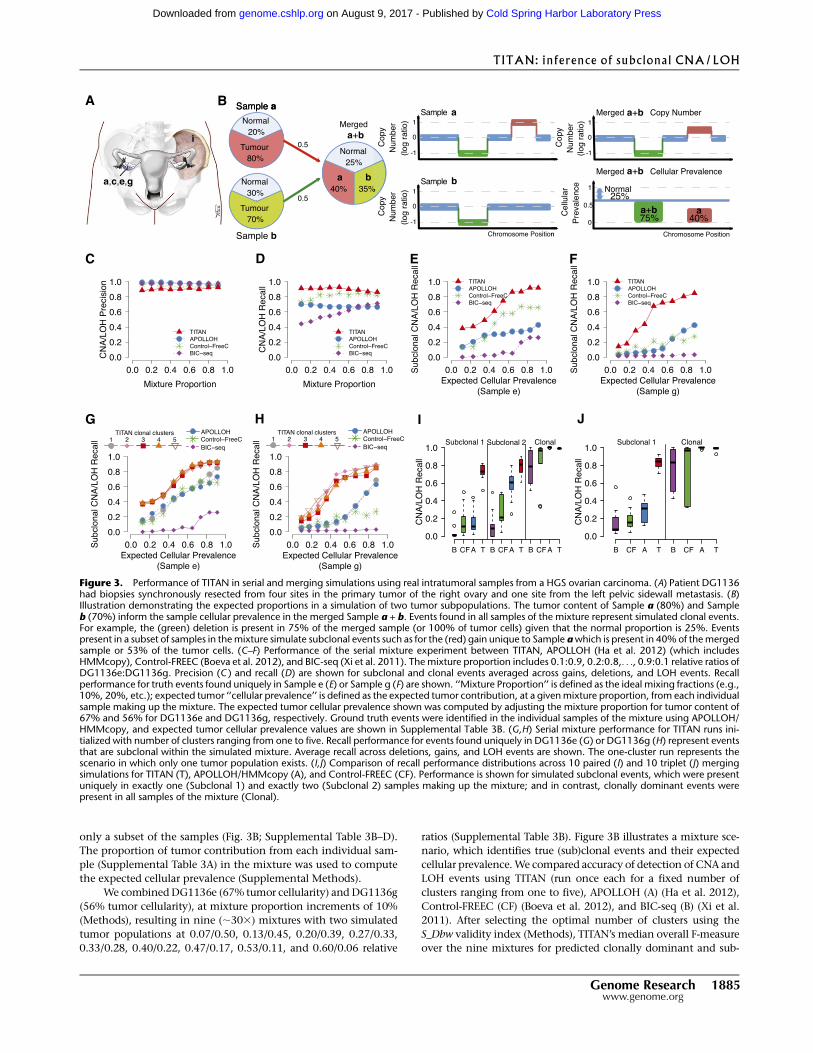
only a subset of the samples (Fig. 3B; Supplemental Table 3B–D).
The proportion of tumor contribution from each individual sam-
ple (Supplemental Table 3A) in the mixture was used to compute
the expected cellular prevalence (Supplemental Methods).
We combinedDG1136e (67% tumor cellularity) and DG1136g
(56% tumor cellularity), at mixture proportion increments of 10%
(Methods), resulting in nine (;303) mixtures with two simulated
tumor populations at 0.07/0.50, 0.13/0.45, 0.20/0.39, 0.27/0.33,
0.33/0.28, 0.40/0.22, 0.47/0.17, 0.53/0.11, and 0.60/0.06 relative
ratios (Supplemental Table 3B). Figure 3B illustrates a mixture sce-
nario, which identifies true (sub)clonal events and their expected
cellular prevalence.We compared accuracy of detection of CNA and
LOH events using TITAN (run once each for a fixed number of
clusters ranging from one to five), APOLLOH (A) (Ha et al. 2012),
Control-FREEC (CF) (Boeva et al. 2012), and BIC-seq (B) (Xi et al.
2011). After selecting the optimal number of clusters using the
S_Dbw validity index (Methods), TITAN’s median overall F-measure
over the nine mixtures for predicted clonally dominant and sub-
Figure 3. Performance of TITAN in serial and merging simulations using real intratumoral samples from a HGS ovarian carcinoma. (A) Patient DG1136had biopsies synchronously resected from four sites in the primary tumor of the right ovary and one site from the left pelvic sidewall metastasis. (B)Illustration demonstrating the expected proportions in a simulation of two tumor subpopulations. The tumor content of Sample a (80%) and Sampleb (70%) inform the sample cellular prevalence in the merged Sample a + b. Events found in all samples of the mixture represent simulated clonal events.For example, the (green) deletion is present in 75% of the merged sample (or 100% of tumor cells) given that the normal proportion is 25%. Eventspresent in a subset of samples in themixture simulate subclonal events such as for the (red) gain unique to Sample awhich is present in 40%of themergedsample or 53% of the tumor cells. (C–F) Performance of the serial mixture experiment between TITAN, APOLLOH (Ha et al. 2012) (which includesHMMcopy), Control-FREEC (Boeva et al. 2012), and BIC-seq (Xi et al. 2011). The mixture proportion includes 0.1:0.9, 0.2:0.8,. . ., 0.9:0.1 relative ratios ofDG1136e:DG1136g. Precision (C ) and recall (D) are shown for subclonal and clonal events averaged across gains, deletions, and LOH events. Recallperformance for truth events found uniquely in Sample e (E) or Sample g (F) are shown. ‘‘Mixture Proportion’’ is defined as the ideal mixing fractions (e.g.,10%, 20%, etc.); expected tumor ‘‘cellular prevalence’’ is defined as the expected tumor contribution, at a givenmixture proportion, from each individualsample making up the mixture. The expected tumor cellular prevalence shown was computed by adjusting the mixture proportion for tumor content of67% and 56% for DG1136e and DG1136g, respectively. Ground truth events were identified in the individual samples of the mixture using APOLLOH/HMMcopy, and expected tumor cellular prevalence values are shown in Supplemental Table 3B. (G,H) Serial mixture performance for TITAN runs ini-tialized with number of clusters ranging from one to five. Recall performance for events found uniquely in DG1136e (G) or DG1136g (H) represent eventsthat are subclonal within the simulated mixture. Average recall across deletions, gains, and LOH events are shown. The one-cluster run represents thescenario in which only one tumor population exists. (I,J) Comparison of recall performance distributions across 10 paired (I) and 10 triplet (J) mergingsimulations for TITAN (T), APOLLOH/HMMcopy (A), and Control-FREEC (CF). Performance is shown for simulated subclonal events, which were presentuniquely in exactly one (Subclonal 1) and exactly two (Subclonal 2) samples making up the mixture; and in contrast, clonally dominant events werepresent in all samples of the mixture (Clonal).
TITAN: inference of subclonal CNA/LOH
Genome Research 1885www.genome.org
Cold Spring Harbor Laboratory Press on August 9, 2017 - Published by genome.cshlp.orgDownloaded from
clonal events was 0.90. This was similar to APOLLOH (0.91) and
Control-FREEC (0.88), but higher thanBIC-seq (0.73) (Supplemental
Fig. 7A; Supplemental Table 4A). Although the precision for all
approaches performed comparably (Fig. 3C), TITAN had higher
sensitivity—median 0.91 compared to 0.85 (A), 0.83 (CF), and 0.58
(B), respectively (Fig. 3D).
TITAN’s sensitivity gains could be primarily attributed to im-
proved sensitivity to subclonal events (Fig. 3E,F). Accordingly, we
observed improved performance for runs with two or more clusters,
but notwhen runwithone cluster (Fig. 3G,H).Over the range of two
to five clusters, recall was similar for subclonal events, suggesting
TITAN is relatively stable in its predictions when accounting for
more than one tumor subpopulation. Despite this stability, we ex-
plored the utility of unbiasedmodel selection to choose the optimal
number of clusters. We note that three clusters fit the scenario in
which events may be clonally dominant (present in both samples)
or subclonal, having one of two possible unique cellular prevalences
contributing from the individual samples. Using the S_Dbw validity
index, three clusters were appropriately selected as the optimal
number for the majority of the mixtures (Supplemental Table 3B).
The subclonal predictions using the optimal cluster runs consistently
outperformed the other methods (Fig. 3E,F). In addition, perfor-
mance gains were maintained across ranges of event lengths of 10–
100 kb, 100 kb–1 Mb, 1–10 Mb, and >10 Mb (Supplemental Fig. 8).
Next, we used the DG1136 data sets to generate 10 pairwise
(61–693 coverage) and 10 triplet (95–1033 coverage) merged com-
binations of the five intratumor samples, mixed at approximately
equal proportions (Supplemental Table 3C,D). In the triplet-merged
samples (Supplemental Fig. 9; Supplemental Table 4B), TITAN per-
formed comparably for all (clonal and subclonal) amplifications
(0.85 median F-measure) relative to APOLLOH (0.85), Control-
FREEC (0.85), and BIC-seq (0.60). For deletions and LOH events,
TITAN showed statistically significant improvement over the
other algorithms (0.91 compared to 0.87 [A], 0.83 [CF], and 0.60
[B]; two-sample Wilcoxon rank-sum test
P < 0.001) and LOH events (0.96 com-
pared to 0.94 [A] and 0.85 [CF]; P < 0.001).
Similar performance was observed in the
pairwise-merged samples with compara-
ble F-measure for all amplifications (me-
dian 0.87 compared to 0.87 [A], 0.85 [CF],
and 0.70 [B]) and statistically signifi-
cant improvement in F-measure for dele-
tions (0.95 compared to 0.92 [A], 0.87 [CF],
and 0.69 [B]; P < 0.005) and LOH events
(0.98 compared to 0.96 [A] and 0.89
[CF]) (Supplemental Fig. 10; Supplemental
Table 4C).
As shown for the serial mixture sim-
ulation, TITAN was more sensitive for sub-
clonal events than the other methods in
both pairwise and triplet merging simula-
tions. Events unique to only one sample
(subclonal in the mixture) were predicted
with statistically higher recall by TITAN
(Fig. 3I,J) (two-sampleWilcoxon rank-sum
tests, P < 0.001). TITAN was also more
sensitive to subclonal deletion and LOH
events present in exactly two samples in
the triplet-merged mixture (P < 0.001),
whereas amplifications were comparable
(Fig. 3I). All methods accurately predicted
clonally dominant events for each merged simulation. Therefore,
while maintaining accuracy of clonal events, TITAN showed clear
advantages in detection of the engineered subclonal events. We
attribute this increase in sensitivity directly to the consideration of
heterogeneous cell populations in the model.
Accurate estimation of cellular prevalence and normalcontamination
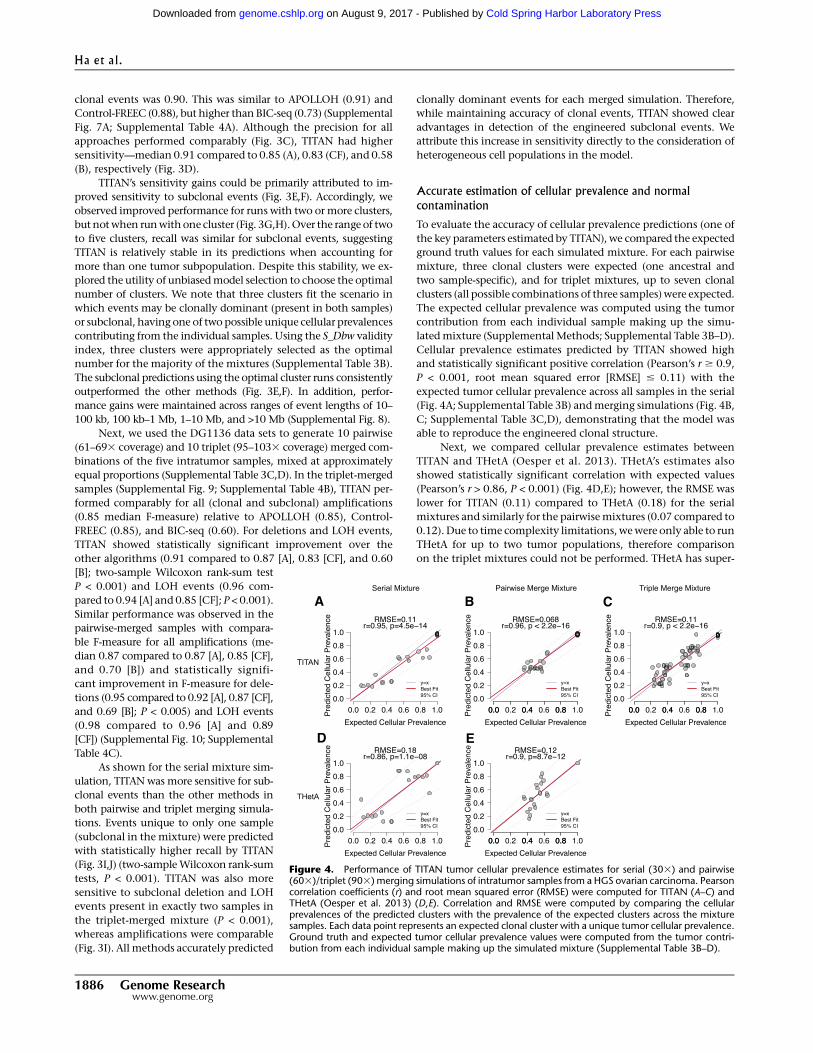
To evaluate the accuracy of cellular prevalence predictions (one of
the key parameters estimated by TITAN), we compared the expected
ground truth values for each simulated mixture. For each pairwise
mixture, three clonal clusters were expected (one ancestral and
two sample-specific), and for triplet mixtures, up to seven clonal
clusters (all possible combinations of three samples)were expected.
The expected cellular prevalence was computed using the tumor
contribution from each individual sample making up the simu-
latedmixture (Supplemental Methods; Supplemental Table 3B–D).
Cellular prevalence estimates predicted by TITAN showed high
and statistically significant positive correlation (Pearson’s r $ 0.9,
P < 0.001, root mean squared error [RMSE] # 0.11) with the
expected tumor cellular prevalence across all samples in the serial
(Fig. 4A; Supplemental Table 3B) andmerging simulations (Fig. 4B,
C; Supplemental Table 3C,D), demonstrating that the model was
able to reproduce the engineered clonal structure.
Next, we compared cellular prevalence estimates between
TITAN and THetA (Oesper et al. 2013). THetA’s estimates also
showed statistically significant correlation with expected values
(Pearson’s r > 0.86, P < 0.001) (Fig. 4D,E); however, the RMSE was
lower for TITAN (0.11) compared to THetA (0.18) for the serial
mixtures and similarly for the pairwisemixtures (0.07 compared to
0.12). Due to time complexity limitations, wewere only able to run
THetA for up to two tumor populations, therefore comparison
on the triplet mixtures could not be performed. THetA has super-
Figure 4. Performance of TITAN tumor cellular prevalence estimates for serial (303) and pairwise(603)/triplet (903) merging simulations of intratumor samples from a HGS ovarian carcinoma. Pearsoncorrelation coefficients (r) and root mean squared error (RMSE) were computed for TITAN (A–C) andTHetA (Oesper et al. 2013) (D,E). Correlation and RMSE were computed by comparing the cellularprevalences of the predicted clusters with the prevalence of the expected clusters across the mixturesamples. Each data point represents an expected clonal cluster with a unique tumor cellular prevalence.Ground truth and expected tumor cellular prevalence values were computed from the tumor contri-bution from each individual sample making up the simulated mixture (Supplemental Table 3B–D).
Ha et al.
1886 Genome Researchwww.genome.org
Cold Spring Harbor Laboratory Press on August 9, 2017 - Published by genome.cshlp.orgDownloaded from
polynomial time andmemory complexity when twoormore tumor
subpopulations are considered. Moreover, complexity increases
with the number of input regions; thus, fewer than 15 segments
were required for reasonable runtimes, resulting in lower resolution
when inferring subclonal events. Finally, we also used an orthogo-
nal approach (Control-FREEC) to estimate tumor content used to
compute the expected cellular prevalence and observed similar
correlations and RMSE results for TITAN and THetA (Supplemental
Fig. 11; Supplemental Table 5).
Global normal contamination impacts the ability of themodel
to reconcile the presence of subclonality. We assessed the ability of
themodel to correctly estimate the global normal contamination in
the model. TITAN estimates showed significantly positive correla-
tion for the serial mixtures (Pearson’s r = 0.96, P < 0.0001, RMSE =
0.023), pairwise mixtures (r = 0.86, P = 0.0014, RMSE = 0.047), and
the tripletmixtures (r = 0.74, P = 0.014, RMSE = 0.048) relative to the
expected normal proportion (Supplemental Fig. 12A–C; Supple-
mental Table 3B–D). TITAN’s estimates were considerably more ac-
curate than THetA for the serial (r = 0.93, P < 0.0002, RMSE = 0.23)
and pairwisemixtures (r = 0.51, P = 0.14, RMSE = 0.3) (Supplemental
Fig. 12D,E). Therefore, in addition to increased sensitivity for
detecting subclonal events, TITAN showed accurate inference
of cellular prevalence and normal proportion, indicating the
model formulation more closely models the mixture of cells
generating the data. This not only contributes to increased accuracy
in detection, but also adds an interpretive layer to estimating
the composition of both tumor and normal cells being sequenced.
Characterization of the subclonal copy number alterationlandscape in triple negative breast cancers
Having established quantitative accuracy with benchmarking data
sets, we next analyzed a set of 23 triple negative breast cancers
(TNBC) with paired tumor-normal whole-genome sequencing (Ha
et al. 2012; Shah et al. 2012). We applied TITAN to predict regions
of (sub)clonal CNA and LOH in the TNBC genomes (Supplemental
Table 6) and profile the patterns of cell population structure inferred
fromthe genomearchitecture. Six caseswere clonally homogeneous
(i.e., one clonal cluster) with cellular prevalence between 0.91 and
0.97, whereas the remaining 17 cases were more heterogeneous
(between two and six clonal clusters) and cellular prevalence esti-
mates ranging from0.17 to 0.98 (Supplemental Table 7A). In the 17
heterogeneous cases, the proportion of the genome altered by
subclonal events ranged from0.16 and 0.73, with 12 cases having a
higher proportion of subclonal alterations than clonal events
(Supplemental Table 7B). This emphasizes the importance of
considering mixed populations, which if neglected will lead to
vastly different interpretations of the data and preclude inference
of evolutionary patterns.
For four of the TNBC cases, whole-exome capture datawas also
available. We applied TITAN to this exome sequencing data to dem-
onstrate that the method can also be used for data for targeted ge-
nomic regions. Across the four samples, therewere 79,097 (;19,700
per sample) overlapping SNP positions between the exome and
WGS data, of which 55,846 (71%) were concordant for predicted
copy number between the TITAN results for the two data types
(Supplemental Fig. 13; Supplemental Table 8). However, in theWGS
data, TITAN appears to resolve the signal into a potentially higher
number of clonal clusters, possibly due to 1003 more SNP loci
(Supplemental Table 8).
For 22 of the TNBC cohort, we also analyzed the transcriptomes
sequenced via RNA-seq (Ha et al. 2012; Shah et al. 2012) to assess
whether the clonality of LOH predictions influences allele-specific
expression. Using the transcriptome allelic ratio (TAR; proportion
of reference read counts) as an orthogonal measure, we compared
TITAN cellular prevalence estimates to expected allelic imbalance
in expression. We considered only RNA-seq positions within de-
letion LOH segments and estimated the expected baseline TAR as a
function of the cellular prevalence sz +ð1�szÞ
2 .
The first term corresponds to the tumor cells having only one
copy or allele, and the second term represents all other cells without
the LOH event (i.e., diploid and heterozygous). Across the 22 TNBC
cases and each clonal cluster, the TAR was significantly correlated
with the predicted cellular prevalence (Pearson’s r = 0.71, P = 1.5 3
10�10) (Supplemental Fig. 14A). TAR values were observed to be
more imbalanced than could be explained by deletion LOH alone.
This could be attributed to epigenetic silencing of one or both alleles
in cells without LOH. When higher copy number events are con-
sidered, such as amplified LOH, this can also result inmore imbalance
than expected due to stronger representation of the homozygous
allele if expression is positively correlated with copy number
(Supplemental Fig. 14B). These results indicate that a substantial
proportion ofmonoallelic expression is associatedwith coincident
subclonal LOH prediction, providing evidence that despite the pres-
ence in only aminor cell population, these events are impacting the
transcriptional program in these tumors.
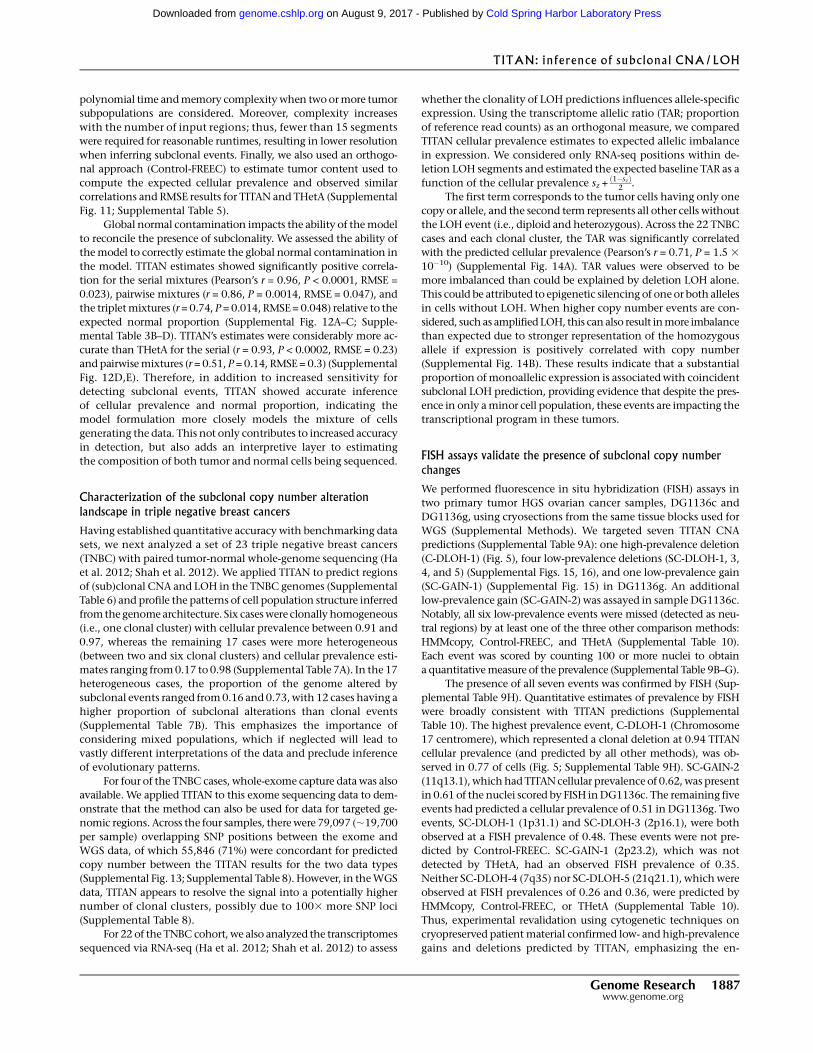
FISH assays validate the presence of subclonal copy numberchanges
We performed fluorescence in situ hybridization (FISH) assays in
two primary tumor HGS ovarian cancer samples, DG1136c and
DG1136g, using cryosections from the same tissue blocks used for
WGS (Supplemental Methods). We targeted seven TITAN CNA
predictions (Supplemental Table 9A): one high-prevalence deletion
(C-DLOH-1) (Fig. 5), four low-prevalence deletions (SC-DLOH-1, 3,
4, and 5) (Supplemental Figs. 15, 16), and one low-prevalence gain
(SC-GAIN-1) (Supplemental Fig. 15) in DG1136g. An additional
low-prevalence gain (SC-GAIN-2) was assayed in sample DG1136c.
Notably, all six low-prevalence events were missed (detected as neu-
tral regions) by at least one of the three other comparison methods:
HMMcopy, Control-FREEC, and THetA (Supplemental Table 10).
Each event was scored by counting 100 or more nuclei to obtain
a quantitativemeasure of the prevalence (Supplemental Table 9B–G).
The presence of all seven events was confirmed by FISH (Sup-
plemental Table 9H). Quantitative estimates of prevalence by FISH
were broadly consistent with TITAN predictions (Supplemental
Table 10). The highest prevalence event, C-DLOH-1 (Chromosome
17 centromere), which represented a clonal deletion at 0.94 TITAN
cellular prevalence (and predicted by all other methods), was ob-
served in 0.77 of cells (Fig. 5; Supplemental Table 9H). SC-GAIN-2
(11q13.1), whichhadTITANcellular prevalence of 0.62, was present
in 0.61 of the nuclei scored by FISH inDG1136c. The remaining five
events had predicted a cellular prevalence of 0.51 in DG1136g. Two
events, SC-DLOH-1 (1p31.1) and SC-DLOH-3 (2p16.1), were both
observed at a FISH prevalence of 0.48. These events were not pre-
dicted by Control-FREEC. SC-GAIN-1 (2p23.2), which was not
detected by THetA, had an observed FISH prevalence of 0.35.
Neither SC-DLOH-4 (7q35) nor SC-DLOH-5 (21q21.1), whichwere
observed at FISH prevalences of 0.26 and 0.36, were predicted by
HMMcopy, Control-FREEC, or THetA (Supplemental Table 10).
Thus, experimental revalidation using cytogenetic techniques on
cryopreserved patient material confirmed low- and high-prevalence
gains and deletions predicted by TITAN, emphasizing the en-
TITAN: inference of subclonal CNA/LOH
Genome Research 1887www.genome.org
Cold Spring Harbor Laboratory Press on August 9, 2017 - Published by genome.cshlp.orgDownloaded from
hanced sensitivity conferred by modeling the presence of multi-
ple populations.
Validation of TITAN predictions using single-cell sequencingconfirm the presence of multiple tumor populations
We further validated the CNA predictions from DG1136g using
single-cell sequencing of targeted positions. The nuclei were iso-
lated and sorted from disaggregated frozen tissue blocks and se-
quenced using multiplex PCR reactions and Fluidigm access array
technology (Supplemental Methods). Two sets of events, Set1 and
Set2 (Supplemental Tables 11A, 12A), each included one high-
prevalence clonal LOH event, two subclonal deletions, and two
heterozygous diploid regions (Supplemental Fig. 17). For each set,
42 single cells were sorted, followed by library construction and
sequencing; statistical analysis was then carried out independently
for the two sets (Supplemental Methods).
This experiment focused on LOH events because confirma-
tion of homozygosity (the absence of one allele) in single-cell se-
quencing is generally unambiguous. For statistical robustness, we
interrogated multiple SNPs within each prediction of LOH (10–11
SNPs) and heterozygous (2–3 SNPs) negative control regions. We
Figure 5. Fluorescence in situ hybridization (FISH) validation of TITAN predictions for Chromosomes 1 and 17 in DG1136g. (A) Subclonal hemizygousdeletion, SC-DLOH-1, in Chromosome 1 was validated using BAC probe RP11-795A13 (orange, Chr1:69851036–70025173). Control probe for copyneutral regions was RP11-159J14 (green, Chr1:69454844–69606688). FISH imaging shows tumor cells with a deletion (green arrow) and diploid (whitearrow) at this region. (B) Clonal deletion, C-DLOH-1, in Chromosome 17 was validated using the centromeric probe, CEP 17. The BAC probes RP11-147K16 (orange, Chr17:3294803–3452243) and RP11-982O5 (blue, Chr17:55475584–55662513) were used as controls. The majority of cells wereobserved to harbor the deletion. FISH count prevalence was computed as the proportion of nuclei with event:control count ratio that is <1 (deletion) or >1(gain) (Supplemental Table 9H). FISH imaging is shown at 633 magnification. Copy number predictions are shown using log ratios (normalized tumordepth/normal depth). Copy neutral (blue), hemizygous deletion (green), and copy gain (red) predictions are shown. Cellular prevalence estimates forclonal cluster 1 (Z1) and cluster 2 (Z2) predicted by TITAN are shown; tumor cellularity is indicated by the black horizontal line.
Ha et al.
1888 Genome Researchwww.genome.org
Cold Spring Harbor Laboratory Press on August 9, 2017 - Published by genome.cshlp.orgDownloaded from
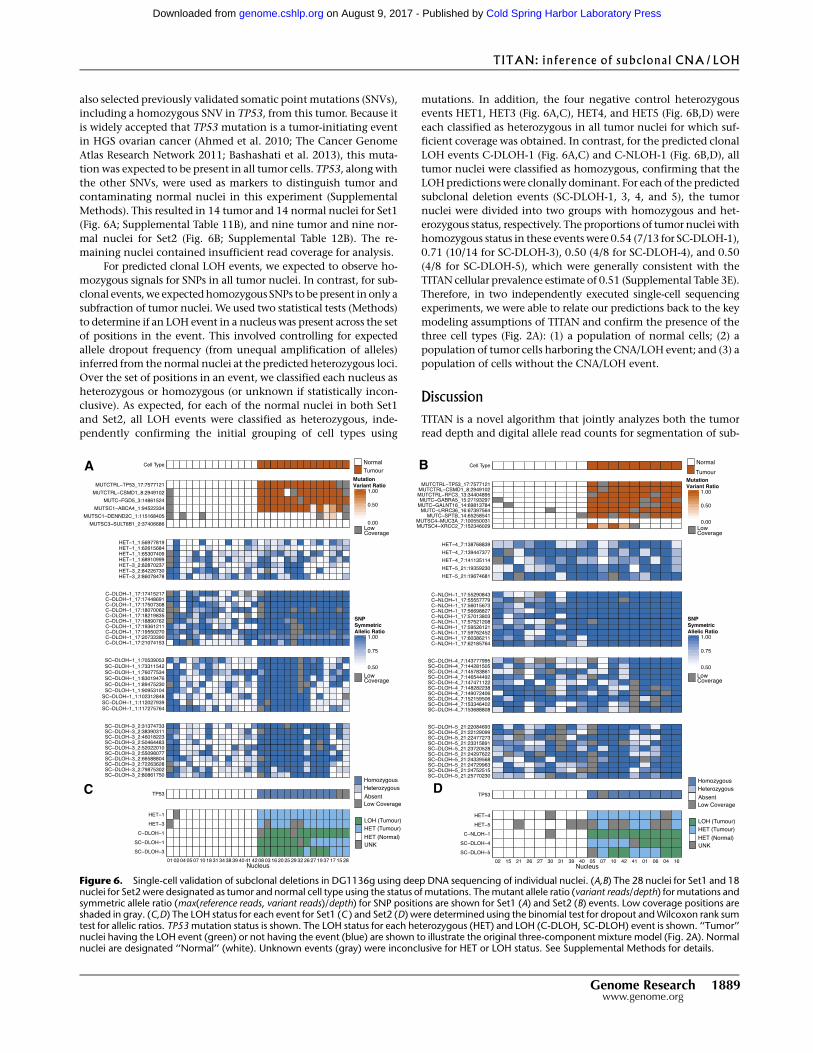
also selected previously validated somatic pointmutations (SNVs),
including a homozygous SNV in TP53, from this tumor. Because it
is widely accepted that TP53 mutation is a tumor-initiating event
in HGS ovarian cancer (Ahmed et al. 2010; The Cancer Genome
Atlas Research Network 2011; Bashashati et al. 2013), this muta-
tion was expected to be present in all tumor cells. TP53, along with
the other SNVs, were used as markers to distinguish tumor and
contaminating normal nuclei in this experiment (Supplemental
Methods). This resulted in 14 tumor and 14 normal nuclei for Set1
(Fig. 6A; Supplemental Table 11B), and nine tumor and nine nor-
mal nuclei for Set2 (Fig. 6B; Supplemental Table 12B). The re-
maining nuclei contained insufficient read coverage for analysis.
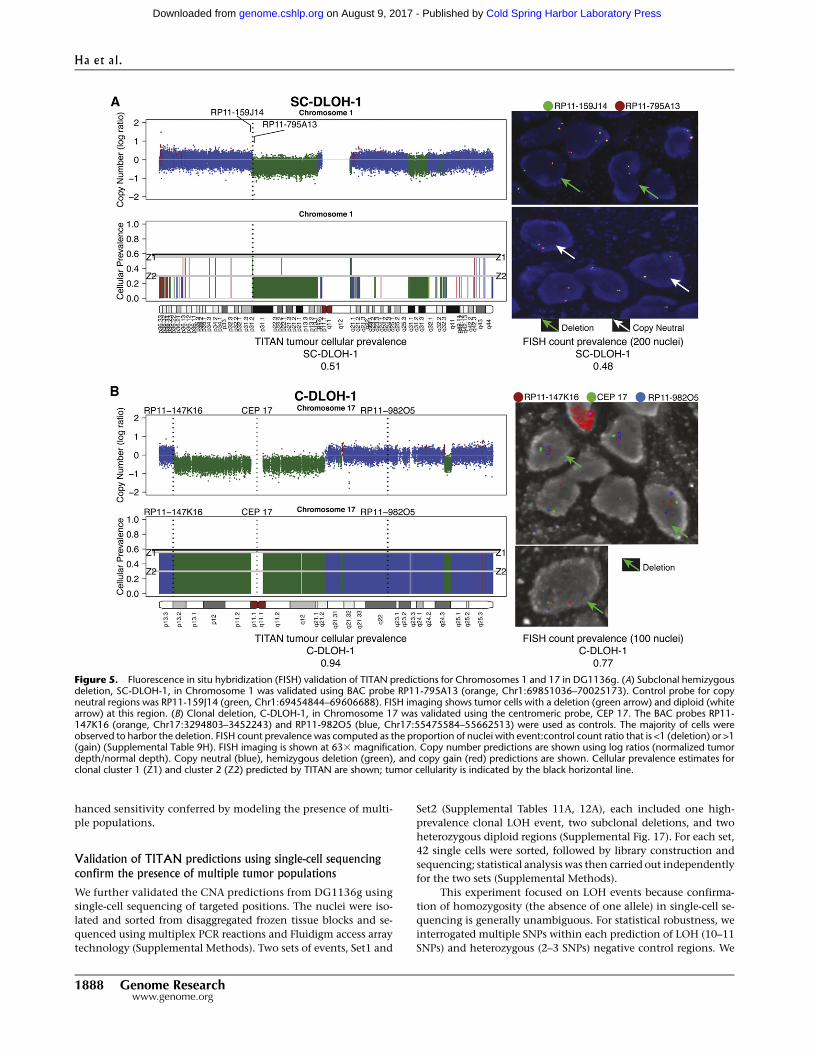
For predicted clonal LOH events, we expected to observe ho-
mozygous signals for SNPs in all tumor nuclei. In contrast, for sub-
clonal events, we expectedhomozygous SNPs to be present in only a
subfraction of tumor nuclei. We used two statistical tests (Methods)
to determine if an LOH event in a nucleus was present across the set
of positions in the event. This involved controlling for expected
allele dropout frequency (from unequal amplification of alleles)
inferred from the normal nuclei at the predicted heterozygous loci.
Over the set of positions in an event, we classified each nucleus as
heterozygous or homozygous (or unknown if statistically incon-
clusive). As expected, for each of the normal nuclei in both Set1
and Set2, all LOH events were classified as heterozygous, inde-
pendently confirming the initial grouping of cell types using
mutations. In addition, the four negative control heterozygous
events HET1, HET3 (Fig. 6A,C), HET4, and HET5 (Fig. 6B,D) were
each classified as heterozygous in all tumor nuclei for which suf-
ficient coverage was obtained. In contrast, for the predicted clonal
LOH events C-DLOH-1 (Fig. 6A,C) and C-NLOH-1 (Fig. 6B,D), all
tumor nuclei were classified as homozygous, confirming that the
LOHpredictionswere clonally dominant. For each of the predicted
subclonal deletion events (SC-DLOH-1, 3, 4, and 5), the tumor
nuclei were divided into two groups with homozygous and het-
erozygous status, respectively. The proportions of tumor nuclei with
homozygous status in these eventswere 0.54 (7/13 for SC-DLOH-1),
0.71 (10/14 for SC-DLOH-3), 0.50 (4/8 for SC-DLOH-4), and 0.50
(4/8 for SC-DLOH-5), which were generally consistent with the
TITAN cellular prevalence estimate of 0.51 (Supplemental Table 3E).
Therefore, in two independently executed single-cell sequencing
experiments, we were able to relate our predictions back to the key
modeling assumptions of TITAN and confirm the presence of the
three cell types (Fig. 2A): (1) a population of normal cells; (2) a
population of tumor cells harboring the CNA/LOH event; and (3) a
population of cells without the CNA/LOH event.
DiscussionTITAN is a novel algorithm that jointly analyzes both the tumor
read depth and digital allele read counts for segmentation of sub-
Figure 6. Single-cell validation of subclonal deletions in DG1136g using deep DNA sequencing of individual nuclei. (A,B) The 28 nuclei for Set1 and 18nuclei for Set2 were designated as tumor and normal cell type using the status of mutations. Themutant allele ratio (variant reads/depth) formutations andsymmetric allele ratio (max(reference reads, variant reads)/depth) for SNP positions are shown for Set1 (A) and Set2 (B) events. Low coverage positions areshaded in gray. (C,D) The LOH status for each event for Set1 (C ) and Set2 (D) were determined using the binomial test for dropout andWilcoxon rank sumtest for allelic ratios. TP53mutation status is shown. The LOH status for each heterozygous (HET) and LOH (C-DLOH, SC-DLOH) event is shown. ‘‘Tumor’’nuclei having the LOH event (green) or not having the event (blue) are shown to illustrate the original three-component mixture model (Fig. 2A). Normalnuclei are designated ‘‘Normal’’ (white). Unknown events (gray) were inconclusive for HET or LOH status. See Supplemental Methods for details.
TITAN: inference of subclonal CNA/LOH
Genome Research 1889www.genome.org
Cold Spring Harbor Laboratory Press on August 9, 2017 - Published by genome.cshlp.orgDownloaded from
clonal CNA and LOH in whole-genome sequencing of tumors. The
advantages of TITAN are threefold. First, the proper deconvolution
of signals in the sequencing reads using the proposed sampling
model allows for improved performance for predicting CNA and
LOH (Fig. 3C,D). Second, the algorithm is more sensitive to sub-
clonal events, which generally have more diluted signals, dem-
onstrated by the serial and merging mixture experiments from a
HGS ovarian cancer data set (Fig. 3E–J). Third, estimation of tumor
cellular prevalence and normal proportion is a powerful feature
that enables inference of evolutionary clonal dynamics of the tu-
mor’s genome at CNA and LOH scales (Fig. 4; Supplemental Fig.
12). Importantly, using deep sequencing of single nuclei, we were
able to successfully confirm the presence of six (sub)clonal LOH
and two subclonal copy number gain events. FISH experiments
confirmed that TITAN was able to detect low-prevalence events
that were not predicted by three other methods. In summary, re-
sults from experiments over a broad range of synthetic data, pa-
tient tumor data, and experimental validation have established
that, through appropriate statistical modeling, the composition of
cell populations in source tumor samples can be accurately iden-
tified by inference of CNA and LOH events in WGS data, and
consideration of mixed population leads to enhanced accuracy.
We demonstrated single-cell analysis as a viable experimental
validation for unambiguously confirming the presence of TITAN-
predicted (sub)clonal LOH events at the resolution of individual
cells. The quantification of cellular prevalencewas still challenging
due to the small numbers of nuclei, and inference of patterns of
clonal evolution was limited by the analysis of only three LOH
events in each cell. Scaling up the numbers of tumor nuclei and
LOH events will enable the statistical analysis of mutual exclusion
and co-occurrence of events that are unattainable from single bulk
tumor biopsies and construction of clonal evolutionary phyloge-
nies (Potter et al. 2013). More conventional FISH experiments also
corroborated TITAN predictions, including low-prevalence dele-
tions and gains. Interestingly, for two events, prevalences deter-
mined by FISH were lower (0.26 and 0.36) than TITAN cellular
prevalence estimates. Although TITAN may have over-clustered
them into a higher prevalence clonal cluster, the presence of these
predicted CNAs was still confirmed by FISH. Moreover, the lack of
prediction of these events by any of the other competing methods
illustrates TITAN’s enhanced sensitivity. These results also suggest
that ;0.30 prevalence may fall below the model’s ability to accu-
rately resolve the clustering for samples sequenced at;303. Thus,
higher sequence coverage may be required for greater accuracy in
cellular prevalence estimates.
TITAN has several limitations due to its specific modeling
assumptions. TITAN does not model more than one aberrated ge-
notype at the same locus, but instead assumes that clones har-
boring the subclonal event coexist with tumor population(s) that
have a normal (diploid heterozygous) genotype. An example of this
limitation is shown in Figure 1, in which the event at Chr 2q23.3–
q24.1 is likely an aggregated signal from a tumor populationwith a
hemizygous deletion and another with a copy neutral LOH (sub-
sequent duplication). In particular, it is difficult to distinguish
among coexisting clones that harbor amplifications of variable
copies. In order to model multiple tumor genotypes, the mixture
representation model (Fig. 2A) will need to be reformulated; yet
given only tumor read depth and allele counts, the joint analysis of
these signals may yield multiple solutions.
The primary aim of TITAN is the improved sensitivity for
detecting subclonal CNA/LOH events, and we have demonstrated
this performance in benchmarking mixtures up to ;903 se-
quencing coverage (Figs. 3I, 4C); however, this is limited to re-
solving events in major clones at detectable prevalences. The full
enumeration of clonal cell populations, includingminor clones, is a
limitation of TITAN and remains a difficult problem in the analysis
of single tumor biopsies. This was demonstrated with FISH, which
revealed the presence of rare, isolated nuclei harboring genotypes
not detectable by TITAN. Solutions to address these limitations will
require integration of additional data, such as somatic SNVs (Carter
et al. 2012; Fischer et al. 2014; Roth et al. 2014), genomic rearrange-
ment breakpoints, increased coverage of sequencing (Nik-Zainal
et al. 2012),multipatient biopsies (Bashashati et al. 2013; Gerlinger
et al. 2014), and ultimately, single-cell analysis (Navin et al. 2011;
Potter et al. 2013).
TITAN estimates parameters using the EM algorithm; how-
ever, this approachmay return locally optimal solutions influenced
by the initializations prior to inference. Informed initializations
of the key parameters, normal proportion and tumor ploidy, using
orthogonal sources provided by histopathology may improve
EM-converged parameter values and overall predictions. Also, we
determined the optimal number of clonal clusters that best
represented the expected number of clonal groups in the sample
by using a modified internal evaluation measure S_Dbw. A more
robust solution would be to integrate the model selection directly
into the framework, such as representing the clonal cluster group-
ings using a phylogenetic tree to relate inferred clones into their
ancestral lineages.
Our results indicate that neglecting to model WGS data as a
composite of different tumor populations with diverse somatic ge-
nomes results in an incomplete representation of a tumor’s CNA
and LOH landscapes. This is exemplified by the analysis of the
TNBC genomes, which suggested that the somatic copy number
architecture in tumors might have evolved substantially. It was
recently shown that the inference of subclonal mutations impacts
the outcome of chronic lymphocytic leukemia under treatment-
based selective pressures (Landau et al. 2013). Whether similar
outcome correlations are detectable when CNA and LOH are the
aberrations measured for evolutionary patterns remains an open
question. We anticipate that the TITAN framework will provide a
robust analytical route for studying the degree to which clonal
evolution, driven from the CNA and LOH perspective, influences
treatment sensitivity.
A downstream clinical application of TITAN will be the iden-
tification of tumors with DNA repair defects that wouldmake them
susceptible to genotoxic drugs. Compromised homologous recom-
bination (HR) due to loss of BRCA1/2 is a dominant molecular fea-
ture of HGS ovarian cancer (The Cancer Genome Atlas Research
Network 2011) and other epithelial malignancies (Yang et al. 2013).
HR defects lead to accrual of genomic structural changes through
unrepaired double-strand genomic breaks (Lord and Ashworth
2012). HR-deficient cells carry the genomic footprints of progressive
accumulation of structural genomic aberrations, including regions
of CNA and LOH. Tumors exhibiting subclonal CNA and LOH
events are likely to have acquired HR defects and would be good
candidates for treatment with platinum-based drugs or PARP in-
hibitors (Mukhopadhyay et al. 2012; Wang et al. 2012). Large-scale
whole-genome sequencing studies of epithelial cancers coupled
with reliable homologous recombination deficiency assays will be
an appropriate way to test this hypothesis.
In conclusion, the TITAN statistical framework represents a
significant advance in the field of copy number and LOH analysis
for tumor genome sequencing data. The implications for clonal
evolution of point mutations in clinical trajectories are well docu-
Ha et al.
1890 Genome Researchwww.genome.org
Cold Spring Harbor Laboratory Press on August 9, 2017 - Published by genome.cshlp.orgDownloaded from
mented; we suggest that TITAN will enable the execution of com-
plementary studies to investigate the role of genome architecture in
driving the evolutionary selection of clonal cell populations.
Methods
The TITAN statistical modelTo model tumors containing multiple tumor subpopulations, weassumed the observed measurements were generated from a com-posite of three types of cell populations (Yau et al. 2010) with rel-ative proportions as follows: n: the proportion of nonmalignantcells; (1 � n)sz: the proportion of tumor cells with normal geno-type; and (1 � n)(1 � sz): the sample cellular prevalence or the pro-portion of tumor cells harboring the CNA or LOH event of interest(Fig. 2A). sz is the proportion of tumor cells that is diploid het-erozygous (and therefore normal) at the locus. Thus, (1 � sz) is thetumor cellular prevalence or the proportion of the tumor populationcontaining the event. We assume multiple somatic events sharesimilar cellular prevalence and thus can be assigned to one of a fi-nite number of clonal clusters, z 2 Z. This allows for sufficient datapoints to robustly infer the model parameters by borrowing sta-tistical strength. The simultaneous inference and clustering ofeach data point to z 2 Z is the primary distinguishing feature overrelatedwork (Van Loo et al. 2010; Yau et al. 2010; Carter et al. 2012;Oesper et al. 2013; Yau 2013).
The inputs to the model are quantities readily extracted fromWGS sequence data (Fig. 2B). The analysis requires the genome-wide set of T germline heterozygous SNP positions derived fromthe normal genome, which generally ranges from 1 to 3 millionper patient. At each SNP, copy number data from the tumorgenome is represented by the log ratio between the tumor andnormal read depths l1:T. We assume l1:T is Gaussian distributed:l1:T;N ðl1:T jmg;z;s
2g Þ.Weassume the reference allelic read counts from
the tumor a1:T are binomial distributed a1:T ; Bin(a1:T|N1:T, vg,z),where N1:T represents the sequencing depth at each position. Thecluster-specific parameters mg,z and vg,z are functions of sz (Fig. 2D),and therefore represent the signals from the three types of cellpopulations. This formulation enables TITAN to be more sensitiveto events with lower cellular prevalences.
Segmental CNA and LOH events span many contiguous SNPpositions, thereby inducing spatial correlation along the chro-mosome. To capitalize on expected shared signals from adjacentpositions, TITAN was implemented as a two-factor hiddenMarkovmodel (HMM) in which the hidden genotypesG1:Tand the hiddenclonal cluster memberships Z1:T comprise the two chains (Fig. 2C).The state space is dynamically expanded as a function of clonalcluster membership, resulting in|G|3 |Z|number of state tuples (g 2G, z 2 Z) (Supplemental Table 14). The HMM is fit to the data usingexpectation maximization (EM) as described in the SupplementalMethods.
The final output of TITAN is a list of segment boundaries thatrepresent CNA and LOH events with accompanying estimates ofthe genotype, the cellular prevalence (1 � sz), and clonal popu-lation cluster membership for each event. In addition, estimationof global parameters n, the normal proportion, and f, the estimatedploidy, are output. The parameters of the probabilistic graphicalmodel (Fig. 2C) are defined in Supplemental Table 13, and fullmathematical details are described in Supplemental Methods.
Analysis workflow
The analysis workflow of TITAN for tumor whole-genome se-quencing data is shown in Figure 2B. First, germline heterozygousSNP positions L= ftigjTi=1 are identified from the normal genome
using SAMtools mpileup (Li et al. 2009). The analysis focuses on;1–3 million loci genome-wide per patient and allows for identi-fication of somatic allelic imbalance events (Ha et al. 2012). Fromthe tumor genome data, the read counts mapping to the referencebase (A allele) and total depth at all positions in L are extracted andrepresented as a1:T and N1:T, respectively.
The tumor copy number is normalized for GC content andmappability biases using only the normalization component ofHMMcopy (http://bioconductor.org/packages/2.11/bioc/html/HMMcopy.html). Briefly, the genome is divided into bins of 1 kb,and read count is represented as the number of reads overlappingeachbin. Loess curve fitting and correctionwasperformedon tumorand normal samples, separately. The corrected read counts for theoverlapping 1-kb bin at each position of interest t 2 L,Nt , andN
N
t isused to compute the log ratio, l1:T = logðN1:T=N
N
1:T Þ.TITAN jointly analyzes the data l1:T, a1:T, N1:T to segment the
data into regions of CNA/LOH and estimate normal contamina-tion, tumor ploidy, and cellular prevalences for Z number of clonalclusters. For a range of i = 1 to 5, TITAN is run once for the set ofclonal cluster states Zi := {1, . . ., i}, where |Zi| = i is the number ofclonal clusters. The optimal number of clusters i is then chosenusing theminimum S_Dbw validity index (SupplementalMethods).
In silico mixture experiments simulating multiple tumorsubpopulations
Five intrapatient samples from patient DG1136 were used tosimulate multiple cellular populations by mixing combinationsof samples at knownproportions. For the predefined serialmixtureexperiment, nine whole-genome mixtures at;303 coverage weregenerated by sampling reads from DG1136e and DG1136g atmixing proportions of 10% increments (0.1e/0.9g, 0.2e/0.8g,. . .,0.8e/0.2g, 0.9e/0.1g). The expected relative tumor content con-tributions from the two samples were computed for each mixturebased on tumor cellularity of 67% and 56%, respectively, as con-sensus estimates by APOLLOH and the pathological review (Sup-plemental Table 3B). HMMcopy and APOLLOH (Ha et al. 2012)results from the individual samples were used as ground truthCNAand LOH events, respectively, with default parameters (http://compbio.bccrc.ca/software/apolloh). For the merging of two orthree samples at approximately equal proportions, five intratumorsamples were merged together to generate 10 pairs at ;603 cover-age (Supplemental Table 3C) and 10 triplets at ;903 coverage(Supplemental Table 3D) for each combination. This was doneusing SAMtools (Li et al. 2009) merge command.
Precision, recall, and F-measure were computed based on copynumber status at heterozygous germline SNP positions from theindividual samples (prior to mixing) predicted by APOLLOH/HMMcopy. Performance was calculated for deletions, gains, andLOH independently and averaged together for overall assessmentshown in Figure 3C–J. The number of SNPs for ground truth dele-tion, amplification, and LOH events used to calculate performancemetrics are given in Supplemental Tables 1, 3, and 4. See Supple-mental Methods for more details.
Statistical tests for single-cell sequencing experiments
Two statistical tests were used to determine if an event in a nucleuswas statistically significant for LOH. First, we addressed allelicdropout, which is the preferential amplification of one allele at aheterozygous locus, leading to a homozygous signal that may bemistaken for LOH. Using the expected allelic dropout rate (DOR) of0.28 (Set1) and 0.48 (Set2) determined from the normal nuclei(Supplemental Tables 11C, 12C), we applied a one-tailed binomialtest in which the null hypothesis asserts that the proportion of
TITAN: inference of subclonal CNA/LOH
Genome Research 1891www.genome.org
Cold Spring Harbor Laboratory Press on August 9, 2017 - Published by genome.cshlp.orgDownloaded from
homozygous positions is not greater than the expected DOR. Thesecond test examined whether the allelic ratio distribution (Fig.6A,B) across the positions for an event showed a statistically signif-icant difference compared to the expected heterozygous allelic ratio(HAR) as determined from the normal nuclei. Finally, themaximumof the (Benjamini and Hochberg [FDR] adjusted) P-values betweenthe two tests was used to determine if an event was statisticallysignificant (FDR < 0.05) for LOH status, or heterozygous (HET)otherwise; events were designated as unknown or ambiguous fornonsignificant FDR and absence of a heterozygous position (Sup-plemental Tables 11E,F, 12E,F; Benjamini and Hochberg 1995).
Additional methods on mathematical details of the TITANmodel, the inference algorithm, and software aswell as experimentalprotocols for generating the validation data are provided in theSupplemental Methods.
Data accessThe ovarian cancer genome sequence data, including the single-celldata, have been submitted to the European Genome-phenomeArchive (EGA; https://www.ebi.ac.uk/ega/) under accession num-ber EGAS00001000547. TITAN is available at http://compbio.bccrc.ca/software/titan/ and can be downloaded fromBioconductorunder the R package, TitanCNA.
AcknowledgmentsWe thank the British Columbia Cancer Foundation for researchfunding support. In addition, thisworkwas funded by theCanadianInstitutes for Health Research (CIHR), Genome Canada/GenomeBritish Columbia, Canadian Cancer Society Research Institute, andthe Terry Fox Research Institute grants to S.P.S. and S.A. S.P.S. issupported by the Michael Smith Foundation for Health Researchand is the Canada Research Chair (CRC) in Computational CancerGenomics. S.A. is the CRC in Molecular Oncology. G.H. is sup-ported by the Natural Sciences and Engineering Research Councilof Canada. We thank Dr. Sarah Mullaly for critical reading of themanuscript.
Author contributions: S.P.S. oversaw the project. S.P.S., S.A., andG.H. conceived and wrote the manuscript. G.H., S.P.S. and A.R.designed the algorithm. G.H. implemented the software and car-ried out all analytical experiments. A.R., A.M., L.M.P., A.B., J.D.,A.L., J.R., andK.S.were responsible for data analysis anddiscussions.J.K., D.Y., E.L., and J.B. performed the single-cell sequencing ex-periment. J.H., N.M., and L.M.P. performed the FISH assays. C.B.G.,D.G.H., and J.N.M. did sample preparation and histopathologicalreview. M.A.M. carried out genome sequencing.
References
Ahmed AA, Etemadmoghadam D, Temple J, Lynch AG, Riad M, Sharma R,Stewart C, Fereday S, Caldas C, Defazio A, et al. 2010. Driver mutationsin TP53 are ubiquitous in high grade serous carcinoma of the ovary.J Pathol 221: 49–56.
Aparicio S, Caldas C. 2013. The implications of clonal genome evolutionfor cancer medicine. N Engl J Med 368: 842–851.
Bashashati A, Ha G, Tone A, Ding J, Prentice LM, Roth A, Rosner J,Shumansky K, Kalloger S, Senz J, et al. 2013. Distinct evolutionarytrajectories of primary high-grade serous ovarian cancers revealedthrough spatial mutational profiling. J Pathol 231: 21–34.
Benjamini Y, Hochberg Y. 1995. Controlling the false discovery rate:a practical and powerful approach to multiple testing. J Roy Stat Soc BMet 57: 289–300.
Boeva V, Popova T, Bleakley K, Chiche P, Cappo J, Schleiermacher G,Janoueix-Lerosey I, Delattre O, Barillot E. 2012. Control-FREEC: a toolfor assessing copy number and allelic content using next-generationsequencing data. Bioinformatics 28: 423–425.
The Cancer Genome Atlas Research Network. 2011. Integrated genomicanalyses of ovarian carcinoma. Nature 474: 609–615.
Carter SL, Cibulskis K, Helman E, McKenna A, Shen H, Zack T, Laird PW,Onofrio RC,WincklerW,Weir BA, et al. 2012. Absolute quantification ofsomatic DNA alterations in human cancer. Nat Biotechnol 30: 413–421.
Cibulskis K, Lawrence MS, Carter SL, Sivachenko A, Jaffe D, Sougnez C,Gabriel S, Meyerson M, Lander ES, Getz G, et al. 2013. Sensitivedetection of somatic point mutations in impure and heterogeneouscancer samples. Nat Biotechnol 31: 213–219.
Ding L, Ley TJ, Larson DE, Miller CA, Koboldt DC, Welch JS, Ritchey JK,Young MA, Lamprecht T, McLellan MD, et al. 2012. Clonal evolution inrelapsed acute myeloid leukaemia revealed by whole-genomesequencing. Nature 481: 506–510.
Fischer A, V�azquez-Garc�ıa I, Illingworth CJR, Mustonen V. 2014.High-definition reconstruction of clonal composition in cancer.Cell Rep 7: 1740–1752.
Gerlinger M, Rowan AJ, Horswell S, Larkin J, Endesfelder D, Gronroos E,Martinez P, Matthews N, Stewart A, Tarpey P, et al. 2012. Intratumorheterogeneity and branched evolution revealed by multiregionsequencing. N Engl J Med 366: 883–892.
Gerlinger M, Horswell S, Larkin J, Rowan AJ, Salm MP, Varela I, Fisher R,McGranahan N, Matthews N, Santos CR, et al. 2014. Genomicarchitecture and evolution of clear cell renal cell carcinomas definedby multiregion sequencing. Nat Genet 46: 225–233.
Gerstung M, Beisel C, Rechsteiner M, Wild P, Schraml P, Moch H,Beerenwinkel N. 2012. Reliable detection of subclonalsingle-nucleotide variants in tumour cell populations. Nat Commun3: 811.
GreavesM,Maley CC. 2012. Clonal evolution in cancer.Nature 481: 306–313.Ha G, Roth A, Lai D, Bashashati A, Ding J, Goya R, Giuliany R, Rosner J,
Oloumi A, Shumansky K, et al. 2012. Integrative analysisof genome-wide loss of heterozygosity and monoallelic expressionat nucleotide resolution reveals disrupted pathways in triple-negativebreast cancer. Genome Res 22: 1995–2007.
Halkidi M, Batistakis Y, Vazirgiannis M. 2002. Clustering validity checkingmethods: part ii. SIGMOD Rec 31: 19–27.
The International Cancer Genome Consortium. 2010. Internationalnetwork of cancer genome projects. Nature 464: 993–998.
Landau DA, Carter SL, Stojanov P, McKenna A, Stevenson K, Lawrence MS,Sougnez C, Stewart C, Sivachenko A, Wang L, et al. 2013. Evolution andimpact of subclonal mutations in chronic lymphocytic leukemia. Cell152: 714–726.
Larson NB, Fridley BL. 2013. PurBayes: estimating tumor cellularity andsubclonality in next-generation sequencing data. Bioinformatics 29:1888–1889.
Li H, Handsaker B, Wysoker A, Fennell T, Ruan J, Homer N, Marth G,Abecasis G, Durbin R, Subgroup GPDP, et al. 2009. The sequencealignment/map format and SAMtools. Bioinformatics 25: 2078–2079.
Lord CJ, Ashworth A. 2012. The DNA damage response and cancer therapy.Nature 481: 287–294.
Mukhopadhyay A, Plummer ER, Elattar A, Soohoo S, Uzir B, Quinn JE,McCluggage WG, Maxwell P, Aneke H, Curtin NJ, et al. 2012.Clinicopathological features of homologous recombination-deficientepithelial ovarian cancers: sensitivity to PARP inhibitors, platinum,and survival. Cancer Res 72: 5675–5682.
Navin N, Kendall J, Troge J, Andrews P, Rodgers L, McIndoo J, Cook K,Stepansky A, Levy D, Esposito D, et al. 2011. Tumour evolution inferredby single-cell sequencing. Nature 472: 90–94.
Nik-Zainal S, Van Loo P,Wedge DC, Alexandrov LB, Greenman CD, Lau KW,Raine K, Jones D,Marshall J, RamakrishnaM, et al. 2012. The life historyof 21 breast cancers. Cell 149: 994–1007.
Nowell PC. 1976. The clonal evolution of tumor cell populations. Science194: 23–28.
Oesper L, Mahmoody A, Raphael BJ. 2013. THetA: inferring intra-tumorheterogeneity from high-throughput DNA sequencing data. GenomeBiol 14: R80.
Potter NE, Ermini L, Papaemmanuil E, Cazzaniga G, Vijayaraghavan G, Titley I,Ford A,Campbell P, Kearney L,GreavesM, et al. 2013. Single-cellmutationalprofiling and clonal phylogeny in cancer. Genome Res 23: 2115–2125.
Roth A, Khattra J, Yap D, Wan A, Laks E, Biele J, Ha G, Aparicio S,Bouchard-Cot�e A, Shah SP, et al. 2014. PyClone: statistical inferenceof clonal population structure in cancer. Nat Methods 11: 396–398.
Shah SP, Morin RD, Khattra J, Prentice L, Pugh T, Burleigh A, Delaney A,Gelmon K, Guliany R, Senz J, et al. 2009. Mutational evolutionin a lobular breast tumour profiled at single nucleotide resolution.Nature 461: 809–813.
Shah SP, Roth A, Goya R, Oloumi A, HaG, Zhao Y, Turashvili G, Ding J, Tse K,Haffari G, et al. 2012. The clonal and mutational evolution spectrumof primary triple-negative breast cancers. Nature 486: 395–399.
Sottoriva A, Spiteri I, Piccirillo SGM, Touloumis A, Collins VP, Marioni JC,Curtis C, Watts C, Tavar�e S. 2013. Intratumor heterogeneity in humanglioblastoma reflects cancer evolutionary dynamics. Proc Natl Acad Sci110: 4009–4014.
Ha et al.
1892 Genome Researchwww.genome.org
Cold Spring Harbor Laboratory Press on August 9, 2017 - Published by genome.cshlp.orgDownloaded from
Van Loo P, Nordgard SH, Lingjærde OC, Russnes HG, Rye IH, Sun W,Weigman VJ, Marynen P, Zetterberg A, Naume B, et al. 2010. Allele-specific copy number analysis of tumors. Proc Natl Acad Sci 107: 16910–16915.
Wang ZC, Birkbak NJ, Culhane AC, Drapkin R, Fatima A, Tian R, SchwedeM,Alsop K, Daniels KE, Piao H, et al. 2012. Profiles of genomic instability inhigh-grade serous ovarian cancer predict treatment outcome. ClinCancer Res 18: 5806–5815.
Xi R, Hadjipanayis AG, Luquette LJ, Kim TM, Lee E, Zhang J, Johnson MD,Muzny DM,Wheeler DA, Gibbs RA, et al. 2011. Copy number variationdetection in whole-genome sequencing data using the Bayesianinformation criterion. Proc Natl Acad Sci 108: E1128–E1136.
Yang L, Luquette LJ, Gehlenborg N, Xi R, Haseley PS, Hsieh CH, Zhang C,Ren X, Protopopov A, Chin L, et al. 2013. Diverse mechanisms of
somatic structural variations in human cancer genomes. Cell 153: 919–929.
Yau C. 2013. OncoSNP-SEQ: a statistical approach for the identification ofsomatic copy number alterations from next-generation sequencing ofcancer genomes. Bioinformatics 29: 2482–2484.
Yau C, Mouradov D, Jorissen RN, Colella S, Mirza G, Steers G, Harris A,Ragoussis J, Sieber O, Holmes CC, et al. 2010. A statisticalapproach for detecting genomic aberrations in heterogeneoustumor samples from single nucleotide polymorphism genotypingdata. Genome Biol 11: R92.
Received September 6, 2013; accepted in revised form July 23, 2014.
TITAN: inference of subclonal CNA/LOH
Genome Research 1893www.genome.org
Cold Spring Harbor Laboratory Press on August 9, 2017 - Published by genome.cshlp.orgDownloaded from
10.1101/gr.180281.114Access the most recent version at doi:2014 24: 1881-1893 originally published online July 24, 2014Genome Res.
Gavin Ha, Andrew Roth, Jaswinder Khattra, et al. populations from tumor whole-genome sequence dataTITAN: inference of copy number architectures in clonal cell
Material
Supplemental
http://genome.cshlp.org/content/suppl/2014/08/28/gr.180281.114.DC1
References
http://genome.cshlp.org/content/24/11/1881.full.html#ref-list-1
This article cites 37 articles, 7 of which can be accessed free at:
Open Access
Open Access option.Genome ResearchFreely available online through the
License
Commons Creative
.http://creativecommons.org/licenses/by/4.0
License (Attribution 4.0 International), as described at , is available under a Creative CommonsGenome ResearchThis article, published in
ServiceEmail Alerting
click here.top right corner of the article or
Receive free email alerts when new articles cite this article - sign up in the box at the
http://genome.cshlp.org/subscriptionsgo to: Genome Research To subscribe to
© 2014 Ha et al.; Published by Cold Spring Harbor Laboratory Press
Cold Spring Harbor Laboratory Press on August 9, 2017 - Published by genome.cshlp.orgDownloaded from