integrated fluidized bed-membrane process … · universitÉ de montrÉal integrated fluidized...
TRANSCRIPT
UNIVERSITÉ DE MONTRÉAL
INTEGRATED FLUIDIZED BED-MEMBRANE PROCESS FOR ADVANCED
IRON AND MANGANESE CONTROL IN DRINKING WATER
SEYEDEH LALEH DASHTBAN KENARI
DÉPARTEMENT DES GÉNIES CIVIL, GÉOLOGIQUE ET DES MINES
POLYTECHNIQUE MONTRÉAL
THÈSE PRÉSENTÉE EN VUE DE L’OBTENTION
DU DIPLÔME DE PHILOSOPHIAE DOCTOR
(GÉNIE CIVIL)
AVRIL 2017
© Seyedeh Laleh Dashtban Kenari, 2017.
UNIVERSITÉ DE MONTRÉAL
POLYTECHNIQUE MONTRÉAL
Cette thèse intitulée :
INTEGRATED FLUIDIZED BED-MEMBRANE PROCESS FOR ADVANCED IRON AND
MANGANESE CONTROL IN DRINKING WATER
présentée par : DASHTBAN KENARI Seyedeh Laleh
en vue de l’obtention du diplôme de : Philosophiae Doctor
a été dûment acceptée par le jury d’examen constitué de :
M. COMEAU Yves, Ph. D., président
M. BARBEAU Benoit, Ph. D., membre et directeur de recherche
M. PERRIER Michel, Ph. D., membre
M. TOBIASON John E., Ph. D., membre

iii
DEDICATION
To my beloved parents & ever-kind and supportive husband

iv
ACKNOWLEDGEMENTS
This is the opportune moment to acknowledge all who in one way or another contributed to the
completion of this thesis. First and foremost, I wish to express my deep and sincere gratitude to my
supervisor Prof. Benoit Barbeau for his solid support, caring and patience, as well as providing me
with an excellent atmosphere for conducting my research. His vast knowledge and logical way of
thinking helped me throughout this process.
I acknowledge the members of my committee, Prof. John Tobiason, Prof. Michel Perrier and Prof.
Yves Comeau, for taking interest in my work, examining my thesis and providing insightful
comments.
I also gratefully acknowledge the financial support of RES’EAU-WATERNET, a NSERC (Natural
Sciences and Engineering Research Council of Canada) collaborative strategic network, which
made this research work possible.
Special thanks go to my friend, Émile Sylvestre, for translating the abstract of this thesis into
French. I am very grateful to all my colleagues in our research group and my fellow labmates and
officemates for their cooperative manner and friendly support.
My deepest appreciation goes to the technicians and research associates in the Department of Civil,
Geological and Mining Engineering, particularly Mireille Blais, Yves Fontaine, Julie Philibert,
Jacinthe Mailly, Marcellin Fotsing and Valentin Pfeiffer for their excellent assistance. In addition,
I thank the secretaries of the Department of Civil, Geological and Mining Engineering for helping
us and providing us with an ideal atmosphere in which to advance our projects.
I genuinely express my profound gratefulness to my beloved husband, Jaber Shabanian, as I owe
my success to his love, patience, heartfelt sympathy, and support.
And last but not least, from the bottom of my heart, I would like to express my endless gratitude to
my mother, father, lovely brothers and sister, and in-laws for the absolute support they have
provided me throughout my entire life, and without whose love, spiritual encouragement and
altruism I would not have finished this thesis. Words are powerless to express what I feel in my
heart for them.
v
RÉSUMÉ
Le fer et le manganèse se retrouvent généralement dans les sources d'eau naturelles,
particulièrement en eaux souterraines, qui contiennent fréquemment des niveaux élevés de ces
minéraux sous forme dissoute. Les concentrations de fer et de manganèse peuvent causer des
problèmes esthétiques à l’eau potable et entrainer des coûts supplémentaires pour le nettoyage ou
le renouvellement des conduites obstruées. Les usines de traitement de l'eau ont donc intérêt à
éliminer ces minéraux de l'eau potable. De plus, plusieurs préoccupations en santé publique sont
liées à la consommation du manganèse à l’eau potable. Par conséquent, Santé Canada (2016) a
récemment proposé des lignes directrices pour protéger les enfants de ses effets neurotoxiques. La
stratégie traditionnelle d'élimination du fer et du manganèse, par oxydation et la filtration en
profondeur, a certaines limites, comme le faible taux d'oxydation du manganèse dissous (Mn(II))
et la formation d'oxyde de manganèse colloïdal, ce dernier étant difficile à retenir par la filtration
en profondeur. L'application de membranes d'ultrafiltration (UF)/microfiltration (MF) a récemment
été proposée en alternative pour leur capacité à éliminer efficacement les matières
particulaires/colloïdales, les organismes pathogènes et les virus (seulement l’UF) par un procédé
compact. Ce choix, permet à l’utilisateur de répondre à des normes règlementaires de plus en plus
strictes à l’eau traitée. Cependant, le colmatage des membranes limite l'application de ce procédé.
Par conséquent, le développement d'un procédé de prétraitement, pouvant diminuer le colmatage
de la membrane, est nécessaire. L'élimination du Mn(II) par adsorption sur des milieux recouverts
d'oxyde de manganèse suivie d'une oxydation catalytique du manganèse adsorbé, est un procédé
efficace et économique. Toutefois, comme la capacité des sites d’adsorption disponibles est
principalement régi par le pH, la concentration en chlore et le niveau de recouvrement d'oxyde de
manganèse, elle a un impact important sur la performance du procédé. De plus, le taux de charge
hydraulique (TCH), la concentration de Mn(II), la température et la dureté peuvent influencer la
performance du procédé. Cependant, peu d'informations sont présentement disponibles sur l'impact
de ces paramètres. De plus, les milieux recouverts d'oxyde de manganèse ont uniquement été
étudiés en lits fixes, ce qui amène certaines limitations, comme un mauvais contact fluide-solide,
une accumulation rapide de pertes de charge et un rétro-lavage fréquent conduisant à des TCH
faibles. Ainsi, le développement d'un procédé pouvant éliminé efficacement des niveaux élevés de
fer et de manganèse et opéré à des TCH élevés est souhaitable.
vi
L'objectif principal de ce projet de recherche est de développer un procédé hybride à lit fluidisé de
pyrolucite (LFP)-membrane pour améliorer le contrôle du fer et du manganèse dans l'eau potable
(la limite cible de 0,02 mg Mn/L et 0,02 mg Fe/L dans l'eau traitée). Les objectifs spécifiques du
projet sont: (1) déterminer les caractéristiques (distribution de la taille des particules (DTP),
potentiel ζ et dimension fractale) des colloïdes/particules de l'hydroxyde ferrique et du dioxyde de
manganèse qui sont générés en conditions d'oxydation typiques prévalent dans l'eau sous
différentes conditions physico-chimiques (pH, force ionique et dureté), (2) évaluer la performance
du procédé par membrane UF pré-oxydée par rapport à l'élimination du fer et du manganèse et le
niveau de colmatage sous différentes conditions chimiques de l'eau, (3) déterminer les mécanismes
de colmatage et la réversibilité du colmatage pour les membranes UF tubulaires en céramique et à
fibres creuses en polymères, (4) étudier l’application d'un contacteur LFP pour réduire la
concentration de Mn(II) dans les eaux souterraines sous les 0,02 mg/L en opérant à des conditions
de TCH élevées et sous autres conditions, (5) opérer une usine pilote pour comparer les
performances d'un contacteur fixe par rapport à un contacteur à lit fluidisé pour le contrôle du fer
et du manganèse dans une nappe phréatique naturelle en condition d’opération à long terme afin de
d’évaluer la faisabilité de ce processus pour les petites collectivités et les communautés rurales, et
(6) comparer la performance d'un procédé hybride membranaire LFP-MF/UF par rapport à un
procédé classique avec MF/UF membrane incluant une pré-oxydation (en ce qui concerne
l'élimination du fer et du manganèse ainsi que l'atténuation du colmatage) sous différentes
conditions chimiques.
En première partie de ce projet, la performance des membranes UF en céramique et en polymère
avec une pré-oxydation en ligne pour le contrôle du fer/manganèse a été évaluée. En raison de
l'impact possible des caractéristiques du fer et du manganèse oxydés sur la performance
membranaire, cette recherche vise d'abord à déterminer le diamètre (DTP), le potentiel ζ et la
dimension fractale de ces agrégats, en fonction du pH, de la force ionique et de la dureté en utilisant
la diffraction laser (DL), la diffusion dynamique de la lumière (DDL) et le fractionnement par
filtration membranaire en série. Pour le dioxyde de manganèse, le potentiel ζ a
proportionnellement diminué par rapport au pH mais la force ionique et, surtout, la dureté l’ont
augmenté, entrainant la formation de plus gros agrégats. En revanche, le potentiel ζ et le DTP des
agrégats d'hydroxyde ferrique n'ont pas été significativement altérés par la chimie de l'eau. À l'étape
suivante, le colmatage des membranes UF en céramique et en polymère a été évalué en utilisant les
vii
modèles de loi de blocage et de résistance en série. Les résultats montrent que les paramètres
chimiques de l'eau testée n'ont pas eu d'impact significatif sur l'efficacité d'élimination du
fer/manganèse (> 99,5% pour toutes les conditions), mais ils ont permis d'expliquer le niveau du
colmatage causé par les agrégats de dioxyde de manganèse. Contrairement au manganèse, le gâteau
formé par les agrégats d'hydroxyde ferrique a exercé une résistance très faible et comparable sur
les deux membranes pour toutes les conditions testées en accord avec les caractéristiques d'agrégats
similaires. En général, bien que qu’un comportement de colmatage similaire eût été observé pour
les membranes de céramique et de polymère, la réversibilité du colmatage a différé.
Pour la deuxième partie de ce projet, un contacteur LFP a été utilisé comme processus autonome
pour traiter les eaux souterraines contenant des niveaux élevés de Mn(II). Une étude à échelle pilote
a été menée en conditions dynamiques en utilisant de l'eau souterraine synthétique pour déterminer
l'impact des conditions d’opération (TCH et température) et de la composition de l'eau souterraine
(concentration Mn(II), dureté calcique et pH) sur l'élimination de Mn(II). Les résultats montrent un
enlèvement quasi-total du manganèse (≈ 100%) en moins de 1 min dans toutes les conditions
testées. L'adsorption de Mn(II) sur la pyrolucite s'est avérée être le seul mécanisme responsable de
l'élimination du manganèse. Un taux d'adsorption plus élevé a été obtenu avec des TCH élevés.
L'augmentation du résiduel de chlore libre à l'effluent de 1,0 à 2,0-2,6 mg Cl2/L a augmenté le
temps d'opération nécessaire avant une nouvelle régénération de 6 jours à plus de 12 jours. La
turbidité à l'eau traitée est restée inférieure à 0,2 NTU pendant toute la période d'essai.
Pour la partie suivante, des lits fixes et fluidisés de pyrolucite à échelle pilote ont été testés en
parallèle pour comparer les performances à long terme de ces procédés pour éliminer le fer et/ou
le manganèse d'une eau souterraine naturelle dans laquelle du Fe(II)/Mn(II) a parfois été ajouté. La
configuration de la plaque de distribution située au fond du LFP a fortement influencé le relargage
du manganèse particulaire de la pyrolucite et la turbidité à l'eau traitée. Après avoir installé une
plaque de distribution optimale, un enlèvement efficace du manganèse (< 0,02 mg/L en sortie) a
été obtenu par le contacteur LFP à un TCH très élevé (45 m/h). Le même résultat a également été
obtenu pour le lit fixe à TCH de 20 m/h. En présence d'une concentration élevée de fer, le contacteur
LFP n'a pas réussi à contrôler correctement la concentration de fer et de manganèse en dessous de
la limite cible de 0,02 mg/L alors que le contacteur à lit fixe a permis à lui seul un enlèvement
presque complet mais à défaut de lavages fréquents du lit filtrant (3 d). Une étude plus approfondie
de l'application d'un processus rentable en aval du LFP serait nécessaire.
viii
Enfin, un procédé hybride LFP-MF/UF intégré a été proposé pour améliorer le contrôle du fer et
du manganèse. Une étude à échelle laboratoire a été faite pour évaluer la performance de ce procédé
et la comparer avec le procédé classique de pré-oxydation-MF/UF sous différentes conditions. Les
modèles de loi de blocage et de résistance en série ont été utilisés pour mieux comprendre les
mécanismes de colmatage de la membrane et sa réversibilité. Le flux membranaire et les
concentrations en calcium et en acides humiques dans les eaux d'alimentation ont eu un impact
notable sur le comportement de filtration des membranes en céramique et en polymère. La présence
d'acides humiques a influencé la compressibilité du gâteau formé par le fer oxydé et le manganèse.
L'ion calcium favorise l'agrégation du dioxyde de manganèse et des acides humiques, ce qui a
entrainé un colmatage considérable. L'application d'un LFP comme procédé de prétraitement a
atténué le colmatage des membranes en éliminant plus de 75% du fer et 95% du manganèse dans
l'eau. Dans l'ensemble, ce travail apporte des informations supplémentaires sur le colmatage du fer
oxydé et du manganèse pour le traitement de l'eau et propose un nouveau procédé permettant un
meilleur contrôle du fer et du manganèse.
ix
ABSTRACT
Iron and manganese are commonly found in natural water supplies, particularly groundwater,
which frequently contains high levels of these minerals in dissolved form. The occurrence of iron
and manganese in drinking water mainly gives rise to aesthetic issues as well as additional cost for
cleaning or renewing clogged pipes; thus, it is of interest for water treatment utilities to remove
these minerals from drinking water. In addition, health concern is also associated with manganese
intake from water ingestion. Consequently, Health Canada (2016) has recently proposed a health-
based guidance to protect children from neurotoxic effects. The traditional removal strategy for
iron and manganese, i.e., oxidation and depth filtration, is subject to some limitations, such as slow
oxidation rate of dissolved manganese (Mn(II)) and formation of colloidal manganese oxide that is
difficult to retain by depth filtration. Alternatively, application of ultrafiltration
(UF)/microfiltration (MF) membrane has been proposed more recently because they can properly
remove particulate/colloidal materials, pathogens and viruses (only UF) in a compact process.
Thus, the treated water can meet the increasingly stringent regulations. However, membrane
fouling has limited the application of this process. Therefore, developing a pretreatment process,
which can alleviate membrane fouling is of great interest. The Mn(II) removal through sorption
onto manganese oxide coated media followed by catalytic oxidation of adsorbed manganese, is an
effective and economical method. Nonetheless, maintenance of available sorption sites, which is
mainly governed by pH, chlorine concentration and manganese oxide coating level, strongly affects
the process performance. In addition, hydraulic loading rate (HLR), Mn(II) concentration,
temperature and hardness may further influence the process performance. However, there is
currently little information available on the impact of these parameters. Moreover, manganese
oxide coated media has been solely studied in fixed beds which have some limitations, such as poor
fluid-solid contact, rapid head loss buildup and frequent backwash, leading to low HLRs. Thus,
developing a process which can efficiently remove elevated levels of iron and manganese and be
operated under high HLRs is of great interest.
The main objective of this research project is to develop an integrated pyrolucite fluidized bed
(PFB)-membrane hybrid process for improved iron and manganese control in drinking water (target
limit of 0.02 mg Mn/L and 0.02 mg Fe/L in treated water). On a more detailed level, the following
specific objectives are defined: (1) determine the characteristics (i.e., particle size distribution

x
(PSD), ζ -potential and fractal dimension) of ferric hydroxide and manganese dioxide
colloids/particles, which are generated during typical oxidation conditions prevailing in water of
various physicochemical characteristics (i.e., pH, ionic strength and hardness), (2) evaluate the
performance of pre-oxidation-UF membrane process with respect to iron and manganese removal,
and the extent of fouling under various water chemistry conditions, (3) determine the fouling
mechanisms and reversibility of the fouling in tubular ceramic and hollow fiber polymeric UF
membranes, (4) investigate the potential application of a PFB contactor to remove elevated
concentrations of Mn(II) from groundwater down to below 0.02 mg/L while operating under high
HLRs and different conditions, (5) conduct a field pilot plant comparing the performances of a
fixed vs. fluidized bed contactors for iron and manganese control on a natural groundwater during
a long-term operation in order to demonstrate the feasibility of this process for small rural
communities, (6) compare the performance of a PFB-MF/UF membrane hybrid process with the
conventional pre-oxidation-MF/UF membrane process (with respect to iron and manganese
removal as well as fouling mitigation) under variable water chemistry conditions.
In the first part of this project, the performance of a ceramic and a polymeric UF membrane with
in-line pre-oxidation for iron/manganese control was evaluated. Due to the possible impact of
oxidized iron/manganese characteristics on membrane performance, this research, first, focused on
determining the PSD, ζ -potential and fractal dimension of these aggregates, as a function of pH,
ionic strength and hardness using laser diffraction (LD), dynamic light scattering (DLS) and
fractionation through serial membrane filtration techniques. For manganese dioxide, the ζ -
potential was found to decrease as the pH decreased and the ionic strength and, especially, hardness
increased, resulting in the formation of larger aggregates. In contrast, the ζ -potential and PSD of
ferric hydroxide aggregates was not significantly altered by water chemistry. In the next step,
fouling of a ceramic and a polymeric UF membranes was evaluated using the blocking law and
resistance-in-series models. Results suggest that the water chemistry tested did not produce
significant impacts on the iron/manganese removal efficiencies (> 99.5% under all conditions)
while it did contribute to explain the extent of fouling caused by manganese dioxide aggregates.
Unlike manganese, the cake formed by ferric hydroxide aggregates exerted very low and
comparable resistance on both membranes under all conditions tested, in agreement with the similar
aggregate characteristics. In general, although a similar fouling behavior was found for the ceramic
and polymeric membranes, the reversibility of the fouling differed from one another.
xi
In the second part of this project, a PFB contactor was introduced as a stand-alone process to treat
groundwater containing high levels of Mn(II). A lab pilot-scale study was conducted under
dynamic conditions using synthetic groundwater to elucidate the impact of operational conditions
(HLR and temperature) and groundwater composition (Mn(II) concentration, calcium hardness and
pH) on Mn(II) removal. Results indicated almost complete manganese removal (≈ 100%) in less
than 1 min under all conditions tested. Adsorption of Mn(II) onto pyrolucite was proven to be the
only mechanism responsible for manganese removal. Higher adsorption rate was achieved under
elevated HLRs. Increasing the effluent free chlorine residual from 1.0 to 2.0-2.6 mg Cl2/L extended
the operation time before further regeneration from 6 days to more than 12 days. Turbidity of the
treated water remained below 0.2 NTU during the entire test period.
In the next part, pilot-scale pyrolucite fixed and fluidized bed contactors were tested in parallel to
compare the long-term performance of these processes for iron and/or manganese removal from a
natural groundwater which was occasionally supplemented with Fe(II)/Mn(II). The configuration
of the distributor plate located at the bottom of the PFB strongly influenced the release of particulate
manganese from pyrolucite and the turbidity of the treated water. After installing an optimal
distributor plate, effective manganese removal (< 0.02 mg/L) was achieved through the PFB
contactor at very high HLR (45 m/h). The same result was also found for the fixed bed at HLR of
20 m/h. Under elevated iron concentration, the PFB contactor failed to properly control the iron
and manganese concentration below the target limit of 0.02 mg/L while the fixed bed contactor
alone provided almost complete removal but required frequent backwash of the filter bed (3 d).
Further study should address the application of a cost-effective process downstream of the PFB.
Finally, an integrated PFB-MF/UF hybrid process was proposed for improved iron and manganese
control. A lab-scale study was undertaken to assess the performance of this process and compare it
with the conventional pre-oxidation-MF/UF process under different conditions. Blocking law and
resistance-in-series models were used to elucidate the membrane fouling mechanisms and its
reversibility. Membrane flux and calcium and humic acids concentrations in the feed waters had
both a notable impact on the filtration behavior of the ceramic and polymeric membranes. The
presence of humic acids influenced the compressibility of the cake formed by oxidized iron and
manganese. Calcium ion promoted aggregation of manganese dioxide and humic acids, thus,
considerably impacted fouling. Application of a PFB as a pretreatment process mitigated
membrane fouling by removing more than 75% and 95% of iron and manganese from water,

xii
respectively. Overall, this work provides further insight on the fouling of oxidized iron and
manganese in water treatment and proposes a new process, which can fulfil appropriate iron and
manganese control.
xiii
TABLE OF CONTENTS
DEDICATION .............................................................................................................................. III
ACKNOWLEDGEMENTS .......................................................................................................... IV
RÉSUMÉ ........................................................................................................................................ V
ABSTRACT .................................................................................................................................. IX
TABLE OF CONTENTS ........................................................................................................... XIII
LIST OF TABLES ...................................................................................................................... XX
LIST OF FIGURES ...................................................................................................................XXII
LIST OF ABBREVIATIONS .............................................................................................. XXVIII
CHAPTER 1 INTRODUCTION ............................................................................................... 1
1.1 Background ...................................................................................................................... 1
1.2 Structure of dissertation .................................................................................................... 4
CHAPTER 2 LITERATURE REVIEW .................................................................................... 6
2.1 Iron and manganese in natural water systems .................................................................. 6
2.2 Water quality concerns and regulations ........................................................................... 8
2.3 Traditional methods for iron and manganese control in drinking water .......................... 9
2.3.1 Direct oxidation and particle removal .......................................................................... 9
2.3.1.1 Oxidation of iron and manganese ......................................................................... 9
2.3.1.2 Removal of oxidized particles by conventional treatment ................................. 16
2.3.2 Manganese removal by sorption and oxidation within filters .................................... 17
2.3.2.1 Filter media for NGE process ............................................................................. 20
2.3.2.2 Effect of surface manganese oxide coating level on manganese removal ......... 23
2.3.2.3 Effect of pH on manganese removal .................................................................. 24
2.3.2.4 Effect of free chlorine on manganese removal ................................................... 26
xiv
2.3.2.5 Effect of NOM on manganese removal .............................................................. 27
2.3.2.6 Effect of HLR, feed Mn concentration and temperature on manganese removal ..
............................................................................................................................ 28
2.3.2.7 Effect of operation mode (fixed bed vs. fluidized bed state) on manganese
removal ............................................................................................................................ 29
2.4 Membrane filtration ........................................................................................................ 31
2.4.1 Membrane rejection mechanisms ............................................................................... 32
2.4.2 Parameters impact initial membrane permeability ..................................................... 34
2.4.3 Membrane fouling ...................................................................................................... 35
2.4.3.1 Models for membrane fouling mechanisms ....................................................... 37
2.4.3.2 Fouling of inorganic colloids/particles ............................................................... 39
2.4.4 Iron and manganese removal by LPMs ...................................................................... 42
CHAPTER 3 RESEARCH OBJECTIVES, HYPOTHESES, AND METHODOLOGY ....... 45
3.1 Critical review of previous research ............................................................................... 45
3.2 Objectives and hypotheses ............................................................................................. 47
3.3 Methodology .................................................................................................................. 49
3.3.1 Characteristics of ferric hydroxide and manganese dioxide colloids/particles and the
performance of ceramic and polymeric UF membrane .......................................................... 50
3.3.1.1 Characteristics of synthetic feedwater (SFW) .................................................... 50
3.3.1.2 Experimental set-up and procedure .................................................................... 50
3.3.1.3 Particle characterization ..................................................................................... 52
3.3.2 Performance of lab pilot-scale PFB contactor for manganese removal ..................... 52
3.3.2.1 Characteristics of synthetic groundwater (SGW) ............................................... 52
3.3.2.2 Experimental set-up and procedure .................................................................... 53
xv
3.3.3 Performance of pilot-scale pyrolucite fixed and fluidized bed contactors for iron and
manganese removal ................................................................................................................ 54
3.3.3.1 Characteristics of groundwater ........................................................................... 54
3.3.3.2 Experimental set-up and procedure .................................................................... 55
3.3.4 Performance of the PFB-MF/UF hybrid process compared to that of conventional pre-
oxidation-MF/UF process ....................................................................................................... 57
3.3.4.1 Characteristics of SFW ....................................................................................... 57
3.3.4.2 Experimental set-up and procedure .................................................................... 57
3.3.4.3 Characterization of membrane fouling ............................................................... 59
CHAPTER 4 ARTICLE 1 : SIZE AND ZETA POTENTIAL OF OXIDIZED IRON AND
MANGANESE IN WATER TREATMENT: INFLUENCE OF PH, IONIC STRENGTH AND
HARDNESS ........................................................................................................................... 61
4.1 Introduction .................................................................................................................... 62
4.2 Materials and methods .................................................................................................... 64
4.2.1 Materials ..................................................................................................................... 64
4.2.2 Synthetic water preparation ........................................................................................ 64
4.2.3 Experimental procedure ............................................................................................. 65
4.2.4 Particle size measurement techniques ........................................................................ 66
4.2.4.1 Light scattering ................................................................................................... 66
4.2.4.2 Fractionation through serial membrane filtration ............................................... 67
4.2.5 Zeta potential analysis ................................................................................................ 67
4.3 Results and discussion .................................................................................................... 68
4.3.1 Effect of pH on particle size of oxidized manganese in water ................................... 68
4.3.2 Effect of ionic strength on particle size of oxidized manganese in water .................. 72
4.3.3 Effect of hardness on particle size of oxidized manganese in water .......................... 75
xvi
4.3.4 Effect of pH, ionic strength and hardness on particle size of oxidized iron in water . 77
4.4 Conclusions .................................................................................................................... 80
CHAPTER 5 ARTICLE 2 : UNDERSTANDING ULTRAFILTRATION FOULING OF
CERAMIC AND POLYMERIC MEMBRANES CAUSED BY OXIDIZED IRON AND
MANGANESE IN WATER TREATMENT ................................................................................ 82
5.1 Introduction .................................................................................................................... 83
5.2 Materials and methods .................................................................................................... 85
5.2.1 UF membranes ........................................................................................................... 85
5.2.2 Preparation of synthetic feedwater (SFW) ................................................................. 86
5.2.3 Experimental procedure ............................................................................................. 88
5.2.4 Membrane cleaning procedures .................................................................................. 89
5.2.5 Particle characterization ............................................................................................. 90
5.2.6 Iron and manganese analysis ...................................................................................... 92
5.2.7 Membrane fouling characterization ............................................................................ 92
5.2.7.1 Constant flux blocking law model for compressible cake layer ........................ 92
5.2.7.2 Resistance-in-series model for quantifying membrane fouling ......................... 94
5.3 Results and discussion .................................................................................................... 94
5.3.1 Iron and manganese removal performance in oxidation and UF hybrid process ....... 94
5.3.2 Characterization of manganese dioxide fouling in UF membranes ........................... 95
5.3.2.1 Effect of pH ........................................................................................................ 95
5.3.2.2 Effect of ionic strength ....................................................................................... 98
5.3.2.3 Effect of hardness ............................................................................................. 100
5.3.3 Characterization of ferric hydroxide fouling in UF membranes .............................. 101
5.3.4 Resistance-in-series model analysis ......................................................................... 104
5.4 Conclusions .................................................................................................................. 107
xvii
CHAPTER 6 ARTICLE 3 : PYROLUCITE FLUIDIZED BED REACTOR (PFBR): A
ROBUST AND COMPACT PROCESS FOR REMOVING MANGANESE FROM
GROUNDWATER ...................................................................................................................... 109
6.1 Introduction .................................................................................................................. 110
6.2 Material and Methods ................................................................................................... 112
6.2.1 Synthetic Groundwater (SGW) Preparation ............................................................. 113
6.2.2 Lab-Pilot Experimental Set-up and Pyrolucite Characteristics ................................ 113
6.2.3 Operation of the Experimental set-up ...................................................................... 113
6.2.4 Experimental Matrix ................................................................................................. 114
6.2.5 PFBR Stability Experiments .................................................................................... 114
6.2.6 Analytical Methods .................................................................................................. 115
6.3 Results and Discussion ................................................................................................. 116
6.3.1 Short-term (4h) PFBR performance ......................................................................... 116
6.3.2 Long-Term Stability of the PFBR ............................................................................ 123
6.4 Conclusions .................................................................................................................. 124
CHAPTER 7 ARTICLE 4 : COMPARISON OF PYROLUCITE FIXED AND FLUIDIZED
BEDS FOR IRON AND MANGANESE CONTROL IN GROUNDWATER: A PILOT-SCALE
STUDY ......................................................................................................................... 126
7.1 Introduction .................................................................................................................. 127
7.2 Materials and methods .................................................................................................. 130
7.2.1 Materials: chemicals, source water and pyrolucite filter media ............................... 130
7.2.2 Pilot plant configuration ........................................................................................... 131
7.2.3 Pilot plant operation ................................................................................................. 133
7.2.4 Analytical methods ................................................................................................... 134
7.3 Results and discussion .................................................................................................. 135
xviii
7.3.1 Effect of distributor in fluidized bed contactor ........................................................ 135
7.3.2 Iron and manganese removal performance in pilot plant ......................................... 139
7.3.2.1 Experiments with un-spiked natural groundwater ............................................ 139
7.3.2.2 Experiments with manganese-spiked natural groundwater .............................. 142
7.3.2.3 Experiments with iron-spiked natural groundwater ......................................... 143
7.3.3 Evolutions of head losses in the fixed and fluidized bed contactors ........................ 147
7.4 Conclusions .................................................................................................................. 149
CHAPTER 8 ARTICLE 5 : INTEGRATED PYROLUCITE FLUIDIZED BED-
MEMBRANE HYBRIDE PROCESS FOR IMPROVED IRON AND MANGANESE CONTROL
IN DRINKING WATER ............................................................................................................. 151
8.1 Introduction .................................................................................................................. 152
8.2 Materials and methods .................................................................................................. 155
8.2.1 Pyrolucite filter media and MF/UF membranes ....................................................... 155
8.2.2 Preparation of synthetic feedwater (SFW) ............................................................... 156
8.2.3 Experimental procedure ........................................................................................... 157
8.2.4 Analytical methods ................................................................................................... 160
8.2.5 Characterization of membrane fouling ..................................................................... 160
8.2.5.1 Constant flux blocking law model .................................................................... 160
8.3 Results and discussion .................................................................................................. 162
8.3.1 Iron and manganese removal performance .............................................................. 162
8.3.2 Comparison of membrane fouling for the pre-oxidation-MF/UF process vs. the PFB-
MF/UF hybrid process .......................................................................................................... 165
8.3.2.1 Soft water condition (hardness = 2 mg CaCO3/L) ........................................... 165
8.3.2.2 Moderately hard water condition (hardness = 100 mg CaCO3/L) .................... 170
8.3.2.3 Moderately hard water containing humic acids ............................................... 171
xix
8.3.3 Resistance-in-series model analysis ......................................................................... 174
8.4 Conclusions .................................................................................................................. 176
CHAPTER 9 GENERAL DISCUSSION .............................................................................. 178
9.1 Characteristics of oxidized iron and manganese in water treatment ............................ 178
9.2 Fouling of UF membranes caused by oxidized iron and manganese ........................... 180
9.3 Application of PFB for manganese removal ................................................................ 183
9.4 Pilot-scale study on fixed vs. fluidized pyrolucite beds for iron and manganese control ..
...................................................................................................................................... 185
9.5 Performance of a PFB-MF/UF hybrid process for improved iron and manganese control
...................................................................................................................................... 189
CHAPTER 10 CONCLUSION AND RECOMMENDATIONS ............................................ 193
BIBLIOGRAPHY ....................................................................................................................... 198
xx
LIST OF TABLES
Table 1.1. Theoretical reaction stoichiometry for oxidation of Fe(II) and Mn(II) (Sommerfeld,
1999). ...................................................................................................................................... 16
Table 1.2. Schematic diagrams of fouling mechanisms proposed by Hermia (1982). ................... 38
Table 2.1. Characteristics of SFW. ................................................................................................. 50
Table 2.2. Specifications of ceramic and polymeric UF membranes. ............................................ 51
Table 2.3. Characteristics of SGW. ................................................................................................ 53
Table 2.4. Characteristics of commercial pyrolucite (LayneOx™ brand). .................................... 53
Table 2.5. Characteristics of the groundwater tested in this study. ................................................ 54
Table 2.6. Characteristics of commercial pyrolucite (MangOxTM brand). ..................................... 55
Table 2.7. Characteristics of the SFW tested in this study. ............................................................ 57
Table 3.1. Comparison of apparent ζ -potential of ferric hydroxide and manganese dioxide particles
under various water characteristics. ....................................................................................... 69
Table 4.1. Specifications of ceramic and polymeric membranes utilized in this study. ................ 86
Table 4.2. Characteristics of ferric hydroxide and manganese dioxide particles at various water
chemistry conditions. .............................................................................................................. 87
Table 4.3. Summary of the blocking law model parameters and average specific cake resistances
for the ceramic and polymeric membranes. ........................................................................... 98
Table 5.1. Summary of pyrolucite media characteristics. ............................................................ 113
Table 5.2. The average mass transfer coefficient at different HLR. ............................................ 122
Table 6.1. Characteristics of the groundwater tested in this study. .............................................. 130
Table 6.2. Characteristics of commercial pyrolucite. ................................................................... 131
Table 7.1. Characteristics of commercial pyrolucite. ................................................................... 155
Table 7.2. Characteristics of the synthetic water tested in this study. .......................................... 157

xxi
Table 7.3. Compressibility coefficients ( 'n ) for the deposited cake layer in pre-oxidation-
microfiltration (MF)/ultrafiltration (UF) process. ................................................................ 167
xxii
LIST OF FIGURES
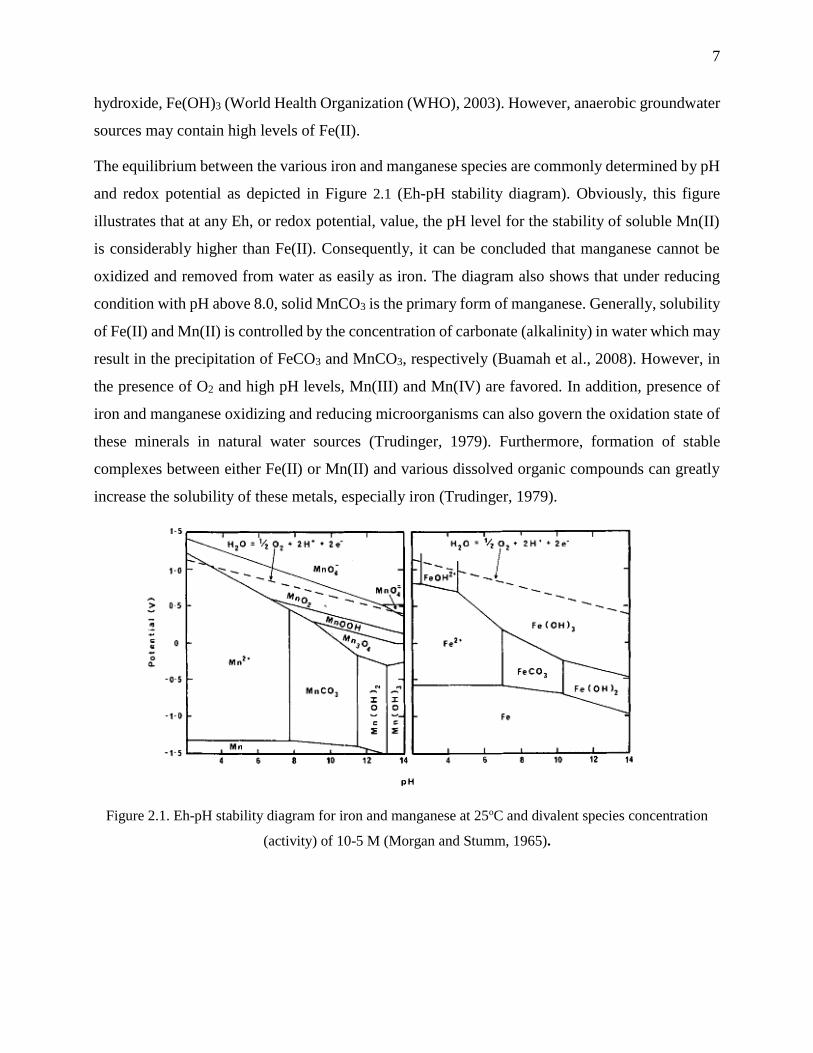
Figure 1.1. Eh-pH stability diagram for iron and manganese at 25oC and divalent species
concentration (activity) of 10-5 M (Morgan and Stumm, 1965). ............................................. 7
Figure 1.2. Pyrolucite ore. .............................................................................................................. 22
Figure 1.3. Effect of surface oxide coating level on Mn(II) uptake capacity of media. pH = 6-6.2,
Mn(II)0 = 1.0 mg/L and in the absence of free chlorine (Knocke et al., 1990b). .................. 24
Figure 1.4. Influence of pH on the sorption of Mn(II) onto MnO2(s) (Morgan and Stumm, 1964).
................................................................................................................................................ 24
Figure 1.5. Effect of pH on Mn(II) uptake capacity of media: manganese oxide coating = 3 mg
Mn/g media , Mn(II)0 = 1.0 mg/L and in the absence of free chlorine (Knocke et al., 1990b).
................................................................................................................................................ 25
Figure 1.6. Effect of pre-filter chlorination on Mn (II) uptake capacity of media: manganese oxide
coating level = 18 mg Mn/g media, Mn(II)0 = 1.0 mg/L and at pH = 6-6.2 (Knocke et al.,
1990b). .................................................................................................................................... 27
Figure 1.7. Effect of superficial fluid velocity on mass transfer coefficient in both fixed and
fluidized bed contactors (Bošković-Vragolović et al., 2009). ................................................ 31
Figure 1.8. Membrane rejection mechanisms: (a) Straining (b) Cake filtration (c) Adsorption
(Montgomery Watson Harza (MWH), 2005). ........................................................................ 33
Figure 2.1. Schematic diagram of the bench-scale UF setup with peroxidation step. ................... 51
Figure 2.2. Schematic diagram of the long-term experimental plan. ............................................. 54
Figure 2.3. Schematic of pilot plant experimental set-ups. Left: Fixed bed. Right: Fluidized bed.
................................................................................................................................................ 56
Figure 2.4. Schematic of the pilot-scale PFB- MF/UF hybrid process. ......................................... 58
Figure 3.1. Size fractions of manganese after oxidation at different pH values using membrane
filters. ...................................................................................................................................... 68
Figure 3.2. Comparison of PSD for manganese dioxide at different pH values measured by DLS
and LD, A) at pH = 6, B) at pH = 7, C) at pH = 8. ................................................................. 70
xxiii
Figure 3.3. Size fractions of manganese after oxidation at different ionic strength using membrane
filters. ...................................................................................................................................... 72
Figure 3.4. Comparison of PSD for manganese dioxide at different ionic strength measured by DLS
and LD, A) at 0.5 mM, B) at 1 mM, C) at 10 mM. ................................................................ 74
Figure 3.5. Size fractions of manganese after oxidation at different hardness of water using
membrane filters. .................................................................................................................... 75
Figure 3.6. Comparison of PSD for manganese dioxide at different hardness (mg CaCO3/L) of
water measured by LD. .......................................................................................................... 76
Figure 3.7. Size fractions of iron in water after oxidation with sodium hypochlorite at different pH,
ionic strength and hardness. ................................................................................................... 77
Figure 3.8. Comparison of PSD for ferric hydroxide at different water characteristics measured by
LD, A) Effect of pH, B) Effect of ionic strength (mM), C) Effect of hardness (mg CaCO3/L).
................................................................................................................................................ 79
Figure 4.1. Schematic diagram of the bench-scale UF setup with peroxidation step. ................... 88
Figure 4.2. Typical results of static light scattering for fractal dimension calculation. ................. 92
Figure 4.3. Effect of pH on constant flux/dead-end UF of manganese dioxide suspensions using (a)
a ceramic membrane and (b) a polymeric membrane. Ionic strength = 0.5 mM, T = 23oC.
Instantaneous normalized pressures from experimental data are shown as discrete points. Solid
lines represent the model fits using the constant flux blocking law model for compressible
cake (Eq. (4.8)). ...................................................................................................................... 97
Figure 4.4. Effect of ionic strength (pH = 7.0) on constant flux/dead-end UF of manganese dioxide
suspensions using (a) a ceramic membrane and (b) a polymeric membrane. Instantaneous
normalized pressures from experimental data are shown as discrete points. T = 23oC. Solid
lines represent the model fits using the constant flux blocking law model for compressible
cake (Eq. (4.8)). ...................................................................................................................... 99
Figure 4.5. Effect of calcium hardness (IS = 10 mM) on constant flux/dead-end UF of manganese
dioxide suspensions using (a) a ceramic membrane and (b) a polymeric membrane. T = 23oC.
Instantaneous normalized pressures from experimental data are shown as discrete points. 101
xxiv
Figure 4.6. Constant flux/dead-end UF of ferric hydroxide suspensions under different pH, ionic
strength and harness conditions using a ceramic membrane (a1 & a2) and a polymeric
membrane (b1 & b2). Instantaneous normalized pressures from experimental data are shown
as wisker-boxes points. Figures a1 and b1 use an identical Y-axis scale than the equivalent
Mn figures (Figure 4.3, Figure 4.4, and Figure 4.5) while Figures a2 and b2 present a blow-up
Y-axis scale. ......................................................................................................................... 103
Figure 4.7. Resistance-in-series model analysis for the constant flux/dead-end UF of manganese
dioxide suspension under different (a) pH, (b) ionic strength, and (c) hardness conditions by
the ceramic and polymeric membranes. T = 23oC. .............................................................. 105
Figure 4.8. Resistance-in-series model analysis for the constant flux/dead-end UF of ferric
hydroxide suspension under different (a) pH, (b) ionic strength, and (c) hardness conditions
by the ceramic and polymeric membranes. T = 23oC. ......................................................... 106
Figure 5.1. Schematic diagram of the long-term experimental plan. ........................................... 115
Figure 5.2. Mn removal performance over the height of PFBR as a function of time. Influent SGW:
Mn0 = a) 0.5, b) 1.0, c) 2.3-2.4, d) 3-3.2 mg/L, T= 9±1oC, pH = 7.0±0.1, chlorine = 1-1.3
mg/L, alkalinity and hardness = 200 mg CaCO3/L. ............................................................. 117
Figure 5.3. Mn removal performance over the height of PFBR as a function of time. Influent SGW:
Mn0 = a) 0.5, b) 1.0-1.1, c) 2.3-2.4, d) 3.2-3.3 mg/L, T= 23±1oC, pH = 7.0±0.1, chlorine =
1.2-1.4 mg/L, alkalinity and hardness = 200 mg CaCO3/L. ................................................. 118
Figure 5.4. Effect of pH on Mn removal performance over height of PFBR. Influent SGW: Mn0 =
1.0-1.1 mg/L, T= 9±1oC, chlorine = 1.2-1.4 mg/L, hardness = 200 mg CaCO3/L, alkalinity =
50 mg CaCO3/L. ................................................................................................................... 120
Figure 5.5. Effect of HLR on a) Mn removal performance and b) specific Mn adsorption rate over
height of PFBR. Influent SGW: Mn0 = 2.2-2.4 mg/L, T= 9±1oC, pH = 7.0±0.1, chlorine = 1.2-
1.4 mg/L, hardness and alkalinity = 200 mg CaCO3/L. ....................................................... 121
Figure 5.6. Stability of the PFBR for Mn control at effluent free chlorine concentrations of a) 1.0
mg/L b) 2.0-2.6 mg/L. Mn0 = 0.8-1.3 mg/L, T= 10±2oC, pH = 7.0±0.1, HLR ≈ 40 m/h (10%
expansion), alkalinity = 150-200 mg CaCO3/L and hardness = 200 mg CaCO3/L. ............. 124
xxv
Figure 6.1. Schematic of pilot plant experimental set-ups. Left: Fixed bed. Right: Fluidized bed.
.............................................................................................................................................. 132
Figure 6.2. Schematic drawing of various distributors for fluidized bed contactor. .................... 133
Figure 6.3. Bed pressure drop profile in the pyrolucite fluidized bed contactor during decreasing
superficial fluid velocity (Distributor C). T= 8oC. ............................................................... 136
Figure 6.4. Effect of distributor configuration on the performance of pyrolucite fluidized bed
contactor for dissolved manganese (Mn) removal. Initial Mn (Mn0) = 0.09-0.15 mg/L, T = 8-
12oC and pH = 7.0-7.2. ......................................................................................................... 137
Figure 6.5. Effect of distributor configuration on the release of particulate manganese (Mn) along
the height of pyrolucite fluidized bed contactor. Initial Mn (Mn0) = 0.09-0.15 mg/L, T = 8-
12oC and pH = 7.0-7.2. ......................................................................................................... 138
Figure 6.6. Evolutions of normalized manganese (Mn) concentrations as a function of empty bed
contact time. Pyrolucite fluidized bed at (a) hydraulic loading rate (HLR) of 32 m/h (10% bed
expansion), (b) 45 m/h (20% bed expansion), and (c) fixed bed at HLR of 20 m/h.
Groundwater conditions: Initial Mn (Mn0) = 01.0±09.0 mg/L, Initial iron = 00.0±01.0 mg/L
and T= 8oC............................................................................................................................ 141
Figure 6.7. Evolutions of normalized manganese (Mn) concentrations as a function of empty bed
contact time. (a) Pyrolucite fluidized bed at hydraulic loading rate (HLR) of 45 m/h (20% bed
expansion) and (b) fixed bed at HLR of 20 m/h (b). Groundwater conditions: Initial Mn (Mn0)
= 03.0±35.0 mg/L, Initial iron = 00.0±01.0 mg/L and T= 8oC. .......................................... 143
Figure 6.8. Evolutions of normalized manganese (Mn) concentrations as a function of empty bed
contact time. (a) Pyrolucite fluidized bed at hydraulic loading rate (HLR) of 45 m/h (20% bed
expansion) and (b) fixed bed at HLR of 20 m/h. Groundwater conditions: Initial Mn (Mn0) =
01.0±11.0 mg/L, Initial iron = 02.0±18.0 mg/L and T= 9oC. ............................................... 145
Figure 6.9. Evolutions of normalized iron (Fe) concentrations as a function of empty bed contact
time. (a) Pyrolucite fluidized bed at hydraulic loading rate (HLR) of 45 m/h (20% bed
expansion) and (b) fixed bed at HLR of 20 m/h. Groundwater conditions: Initial Fe (Fe0) =
02.0±18.0 mg/L and T= 9oC. ................................................................................................ 146
xxvi
Figure 6.10. Evolution of (a) head loss and (b) turbidity in fixed and fluidized bed contactors under
different experimental conditions. T= 9oC. .......................................................................... 148
Figure 7.1. Schematic of the pilot-scale pyrolucite fluidized bed (PFB)-microfiltration
(MF)/ultrafiltration (UF) hybrid process. SFW: Synthetic feed water. ................................ 158
Figure 7.2. Iron (Fe) and manganese (Mn) concentrations for increasing empty bed contact times
inside the pyrolucite fluidized bed (PFB). Assays conducted under various water quality
conditions: a) hardness ≈ 0 mg CaCO3/L, b) hardness = 100 mg CaCO3/L and c) hardness =
100 mg CaCO3/L + Humic acids. Alkalinity = 50 mg CaCO3/L, T = 20oC, pH = 7.0 and
hydraulic loading rate (HLR) = 41 m/h. ............................................................................... 163
Figure 7.3. Iron (Fe) and manganese (Mn) concentrations in the permeate of the two process
configurations tested under various water quality conditions at different experimental time: a)
pre-oxidation + microfiltration (MF), b) pre-oxidation + ultrafiltration (UF), c) pyrolucite
fluidized bed (PFB) + MF and d) PFB + UF. T = 20oC, pH = 7.0 and flux = 300 LMH. ... 164
Figure 7.4. Comparison of membrane fouling for the pre-oxidation-microfiltration
(MF)/ultrafiltration (UF) process and the pyrolucite fluidized bed (PFB)-MF/UF hybrid
process under soft water condition (hardness ≈ 0 mg CaCO3/L): (a) instantaneous
transmembrane pressure (TMP) from experimental data and the model fits using the constant
flux blocking model for compressible cake (solid lines) (Eq. (1)) and (b) foulant resistance. T
= 20oC and pH = 7.0. ............................................................................................................ 166
Figure 7.5. Particle size distribution of oxidized iron (Fe) and manganese (Mn) aggregates in the
membrane feed water using the serial filtration technique. a) Hardness ≈ 0 mg CaCO3/L, b)
Hardness = 100 mg CaCO3/L, and c) Hardness = 100 mg CaCO3/L + humic acid ≈ 2 mg/L, T
= 20oC and pH = 7.0. ............................................................................................................ 169
Figure 7.6. Comparison of membrane fouling in pre-oxidation-microfiltration (MF)/ultrafiltration
(UF) process and pyrolucite fluidized bed (PFB)-MF/UF hybrid process under moderately
hard water condition (hardness = 100 mg CaCO3/L): (a) instantaneous transmembrane
pressure (TMP) from experimental data and the model fits using the constant flux blocking
model for compressible cake (solid lines) (Eq. (1)) and (b) fouling resistance. T = 20oC and
pH = 7.0. ............................................................................................................................... 171
xxvii
Figure 7.7. Comparison of membrane fouling in pre-oxidation-microfiltration (MF)/ultrafiltration
(UF) process and pyrolucite fluidized bed (PFB)-MF/UF hybrid process under moderately
hard water condition (hardness = 100 mg CaCO3/L) and ≈ 2 mg/L humic acid: (a)
instantaneous transmembrane pressure (TMP) from experimental data and the model fits using
the constant flux blocking model for compressible cake (solid lines) (Eq. (1)) and (b) fouling
resistance. T = 20oC and pH = 7.0. ....................................................................................... 172
Figure 7.8. Resistance-in-series analysis for the constant flux/dead-end microfiltration
(MF)/ultrafiltration (UF) of ferric hydroxide and manganese dioxide suspensions under (a)
hardness ≈ 0 mg CaCO3/L, (b) hardness = 100 mg CaCO3/L, and (c) hardness = 100 mg
CaCO3/L + 2 mg/L humic acids. T = 20oC. ......................................................................... 175
xxviii
LIST OF ABBREVIATIONS
APHA American Public Health Association
Ca2+ Calcium Ion
ClO2 Chlorine Dioxide
CR Continuous Regeneration
DBPs Disinfection by Products
DLS Dynamic Light Scattering
DM Demineralized
DOC Dissolved Organic Carbon
EDL Electrostatic Double Layer
FBR Fluidized Bed Reactor
Fe Iron
Fe(II) Ferrous Iron
Fe(III) Ferric Iron
Fe(OH)3 Ferric Hydroxide
GAC Granular Activated Carbon
HLR Hydraulic Loading Rate
HOCl Hypochlorous Acid
H2O2 Hydrogen Peroxide
IOCS Iron Oxide Coated Sand
IR Intermittent Regeneration
KMnO4 Potassium Permanganate
LD Laser Diffraction
LPMs Low Pressure Membranes
xxix
MDDELCC Ministère du Développement Durable de l’Environnement et de la Lutte contre les
Changements Climatiques
MF Microfiltration
Mn Manganese
Mn(II) Reduced Manganese
MnO2 Manganese Dioxide
MnO4- Permanganate
MW Molecular Weight
MWCO Molecular Weight Cut Off
MWH Montgomery Watson Harza
NF Nanofitration
NGE Natural Greensand Effect
NOM Natural Organic Matter
NSERC Natural Sciences and Engineering Research Council of Canada
O3 Ozone
OCl- Hypochlorite
PAA Poly-Acrylic Acid
PES Polyethersulfone
PFB Pyrolucite Fluidized Bed
PFBR Pyrolucite Fluidized Bed Reactor
PSD Particle Size Distribution
PVC Polyvinyl Chloride
PVDF Polyvinylidene Fluoride
PVP Polyvinylpyrrolidone
RO Reverse Osmosis
xxx
SFW Synthetic Feedwater
SGW Synthetic Groundwater
SiC Silicon Carbide
SMCL Secondary Maximum Contaminant Level
THM Trihalomethane
TiO2 Titanium dioxide
TMP Transmembrane Pressure
TOC Total Organic Carbon
UF Ultrafiltration
USEPA United States Environmental Protection Agency
WHO World Health Organization
ZrO2 Zirconium dioxide

1
CHAPTER 1 INTRODUCTION
1.1 Background
Iron and manganese naturally co-occur in surface and ground water supplies as a result of
weathering and leaching of metal-bearing minerals, rocks and soils rich in organic matter, thermal
stratification in lakes and contamination by industrial effluents. Among different water sources,
groundwater frequently contains significant levels of dissolved iron (Fe(II)) and manganese
(Mn(II)) due to more reduced redox conditions. Nearly 44% of population in United States and
30% of population in Canada, mostly living in small rural communities, relies on groundwater as
a source of drinking water. The presence of iron and manganese in drinking water is principally
regarded as creating aesthetic and operational issues, including colored water formation, increased
turbidity, metallic taste and odor, staining of laundry and plumbing fixture, and pipeline clogging,
which may result in customer complaints (World Health Organization (WHO), 2008). In this
regard, the United States Environmental Protection Agency (USEPA) (2004) and the Canadian
Drinking Water Quality Guidelines (Health Canada, 2014) have established an aesthetic objective
limit of 0.3 and 0.05 mg/L for total iron and manganese concentrations in drinking water,
respectively. However, iron and manganese concentrations as low as 0.05 (World Health
Organization, 2003) and 0.02 mg/L (Sly et al., 1990), respectively, may still give rise to adverse
aesthetic impacts. As a result, Health Canada (2016) has lately proposed an aesthetic objective limit
of 0.02 mg/L for total manganese in drinking water. Furthermore, manganese control in drinking
water is receiving more attention owing to its potential neurotoxicity (Wasserman et al., 2006;
Tuschl et al., 2013). Epidemiological studies reported that exposure to manganese in drinking water
is associated with neurological impacts in children, such as intellectual impairment and poor
neurobehavioral function (Bouchard et al., 2011; Oulhote et al., 2014), even at fairly low
manganese concentrations in treated water. Consequently, Health Canada (2016) has recently
proposed a health-based maximum acceptable concentration of 0.1 mg/L for manganese in drinking
water. Thus, effective iron and manganese removal (target limit of 0.02 mg Mn/L and 0.02 mg
Fe/L) is becoming an important objective of drinking water treatment.
One of the common treatment strategies for Fe(II) and Mn(II) control in drinking water, especially
in North America, includes oxidation of dissolved species to particulate forms, ferric hydroxide
2
and manganese dioxide, followed by separation of oxidized particles from water. Unlike Fe(II),
which is rapidly oxidized by a weak oxidant, direct oxidation of Mn(II) requires the application of
a strong oxidant, such as potassium permanganate (KMnO4) or ozone (O3) (Knocke et al., 1990b),
which always brings the risk of permanganate (MnO4-) escaping into treated water and therefore
producing pink water (Gregory and Carlson, 2003). In addition, traditional processes for
particulate/colloidal matter removal from water include coagulation, flocculation, sedimentation
and granular media filtration, which have drawbacks of operating in successive steps requiring
significant contact time and, consequently, large process footprint. Moreover, oxidized manganese
may not be effectively removed by such treatment technologies (Carlson et al., 1997) because of
its propensity to form colloidal manganese dioxide (Morgan and Stumm, 1964). Alternatively,
compact membrane processes, such as microfiltration (MF) and ultrafiltration (UF), are
increasingly retrofitted in water treatment plants for filtration of dilute suspensions based on size
exclusion (Crittenden et al., 2012). However, management of membrane fouling is an important
limitation of this technology, which requires a systematic study to identify the contribution of
different parameters. Although organic matter dominantly controls membrane fouling in surface
water systems, management of fouling caused by iron/manganese is of importance for many
MF/UF/NF/RO groundwater systems. This is particularly important for manganese removal since
colloidal manganese oxides are prone to severely foul membranes (Choo et al., 2005). Thus,
developing a pretreatment process, which can properly alleviate the fouling of the membrane,
would be a good option.
Several factors influence the fouling of a MF/UF membrane; namely, membrane type (e.g., tubular
vs. hollow fiber), material (e.g., ceramic vs. polymeric) and pore size (e.g., MF vs. UF), operating
conditions (e.g., flux), process configuration (e.g., dead end vs. cross flow), cleaning strategies and
feed water characteristics (Crittenden et al., 2012; Lee and Kim, 2014). Application of ceramic
membrane has been receiving growing attention owing to its inherent advantages over the
conventional polymeric membrane, such as superior chemical, thermal and mechanical stability,
which allow water practitioners to exert more aggressive physical and chemical cleaning,
prolonging the membrane life expectancy. Despite the high potential application of ceramic
membrane for iron/manganese control, the fundamental fouling behavior caused by ferric
hydroxide and manganese dioxide aggregates has not yet been documented. Previous studies on
some inorganic minerals, rather than oxidized iron and manganese, have revealed the influence of

3
pH, ionic strength and salt valency on the characteristics of inorganic aggregates (Faibish et al.,
1998; Ramachandra Rao et al., 1999; Zhao et al., 2005; Duan et al., 2014), and, subsequently, on
the performance of the membrane due to their impact on particle-particle and particle-membrane
interactions (Lee et al., 2003; Santiwong et al., 2008). Furthermore, permeability of MF/UF
membranes may be also altered by these parameters, although salt rejection is negligible (Huisman
and Dutre, 1997; Faibish et al., 1998; Zhao et al., 2005; Manttari et al., 2006). Thus, understanding
the characteristics and behavior of oxidized iron and manganese aggregates is of interest for
application of UF/MF membranes.
Considering the propensity of MnOx(s) to adsorb dissolved metal ions (Morgan and Stumm, 1964),
a process, termed Natural Greensand Effect (NGE), was historically developed for Mn(II) control.
Based on NGE process, Mn(II) removal is achieved through sorption of Mn(II) onto MnOx(s)
surface, e.g. MnOx(s) coated sand, followed by auto-catalytic oxidation of adsorbed Mn(II) in the
presence of an oxidant. NGE process allows two modes of operation depending on the presence of
free chlorine: intermittent regeneration (IR) and continuous regeneration (CR) (Knocke et al.,
1990a). In IR operation mode, the MnOx(s) surface adsorbs Mn(II) until available sorption sites are
occupied and breakthrough arisen. KMnO4 or free chlorine solution is then used to restore the
adsorption capacity of the filter media (i.e., regeneration of the filter media). In CR mode, a free
chlorine solution is continuously spiked into the feed water just prior entering the column, thus the
adsorption sites are continuously regenerated and become available. Nevertheless, maintenance of
available adsorption sites, which is governed by the MnOx(s) coating level, chlorine concentration
and pH, strongly affect the performance of NGE process (Knocke et al., 1990a). In addition, the
process performance may be further influenced by the hydraulic loading rate (HLR), Mn(II)
concentration, temperature and hardness.
Adsorption of Mn(II) onto MnOx(s)-coated sand is normally performed in packed bed contactors
operated at relatively low HLRs (6-12 m/h) to remove low feed water Mn(II) concentrations (< 0.5
mg/L) (Hargette and Knocke, 2001; Yang et al., 2008; Piispanen and Sallanko, 2010). Under higher
HLRs, rapid head loss buildup gives rise to frequent backwash, high energy expenses and large
amount of backwash water production, which are important limitations of a packed bed
configuration. Knocke et al. (2010) have shown that application of post-filtration adsorptive
contactors filled with large size (2.0-2.4 mm) pyrolucite (a natural manganese dioxide ore) media
could overcome these constraints. HLRs as high as 32-50 m/h (16-20 gpm/ft2) were successfully
4
tested under low manganese concentrations (< 0.1 mg/L). The backwash frequency was
approximately every other month.
Alternatively, a fluidized bed adsorptive contactor could offer a number of promising benefits in
comparison with the fixed bed contactors because the adsorption sites can be effectively used in
fluidized state due to the better fluid-solid contact, which offers a higher adsorption rate. In
addition, it allows application of small size pyrolucite media (effective diameter of 0.4 mm) with
high specific surface area at high HLRs that is favorable for adsorption kinetic while it
simultaneously eliminates the head loss increase.
In order to come up with a novel process, which can properly overcome the problems encountered
in the abovementioned methods, a pyrolucite fluidized bed (PFB) contactor was proposed as a
pretreatment for membrane filtration. Due to the specific configuration of the fluidized bed, the
number of available active sites for sorption is more than for the fixed-bed and it allows operating
at relatively high HLRs. An increased HLR reduces the process footprint and therefore capital
costs. This hybrid process could be a promising alternative for the treatment of groundwater
containing high levels of iron and manganese, especially for groundwaters requiring primary
disinfection which could be achieved with UF membranes.
1.2 Structure of dissertation
This thesis is subdivided in eight chapters. Following an in-depth review on common methods for
iron and manganese control in drinking water (Chapter 1), the research objectives and methodology
are presented (Chapter 2). Chapters 3 through 7 present results of this research in the form of 4
published articles and 1 submitted manuscript. The first article intends to determine the
characteristics of oxidized iron and manganese aggregates in water treatment under different water
chemistry conditions (Chapter 3, published in Journal of Environmental Engineering). The second
article aims at understanding UF fouling of ceramic and polymeric membranes caused by oxidized
iron and manganese under different water quality (Chapter 4, published in Journal of Membrane
Science). The next chapter proposes a PFB as a robust and compact process for manganese removal
from groundwater (Chapter 5, published in Water Research). Chapter 6 compares the long-term
performance of pilot-scale pyrolucite fixed and fluidized bed contactors for iron and manganese
control in natural groundwater (submitted to the Journal of Environmental Chemical Engineering).

5
Chapter 7 proposes an integrated PFB-MF/UF hybrid process for improved iron and manganese
control in drinking water (published in Water Research). Finally, a general discussion is provided
in Chapter 8 followed by conclusions and recommendations.
6
CHAPTER 2 LITERATURE REVIEW
This chapter presents a summary of previous research studies conducted in areas relevant to the
removal of soluble iron and manganese from water. It includes sections on the geochemistry of iron
and manganese in natural water systems, water quality concerns and regulations, traditional
methods for iron and manganese control in drinking water, and the use of membrane filtration for
the removal of these species.
2.1 Iron and manganese in natural water systems
Iron and manganese are both abundant and naturally-occurring elements in the earth’s crust that
frequently co-occur in natural water sources. Manganese is commonly found at concentrations
below 0.3 mg/L, while iron generally presents at concentrations five to twenty times higher than
manganese (Buamah et al., 2008). They usually occur in groundwater and anoxic hypolimnion
layer of reservoirs at high concentrations due to dissolution of these minerals from rocks and soils
under low redox potential and pH values. Likewise, groundwater containing high levels of iron (7-
15 mg Fe/L) and manganese (2 mg Mn/L) has been reported in the province of Quebec (Ellis et al.,
2000). Another research by Barbeau et al. (2011) revealed that the concentration of manganese in
drinking water supplied by groundwater in southern Quebec can reach up to 2.7 mg/L. In addition,
the leakage of industrial wastewater might also be responsible for heavy metal contamination of
water sources (United States Environmental Protection Agency (USEPA), 2004). Furthermore,
agricultural applications of manganese-containing fungicides have also been identified as a
possible source of groundwater manganese contamination (van Wendel de Joode et al., 2016).
Manganese can exist in numerous oxidation states between 0 and +7 (Trudinger, 1979). Among
these oxidation states, Mn(II), Mn(III), Mn(IV) and Mn(VII) are commonly encountered in water
treatment practices. In natural water sources with pH values between 5-8, manganese
predominantly exists in dissolved form, Mn(II) or Mn+2. Mn(III), MnOOH, and Mn(IV), MnO2,
are insoluble forms of manganese. Mn(VII), the highest oxidized form of manganese, is a strong
oxidant, exists in the form of MnO4- anion. Morgan and Stumm (1964) revealed that insoluble
manganese in water can also occur as mixed oxides, termed MnOx (where 1 < 𝑥 < 2).
Iron compounds presents in natural waters in two oxidation states, Fe(II) and Fe(III). Dissolved
state of iron, Fe(II), is generally unstable in surface waters and precipitated as insoluble Fe(III)
7
hydroxide, Fe(OH)3 (World Health Organization (WHO), 2003). However, anaerobic groundwater
sources may contain high levels of Fe(II).
The equilibrium between the various iron and manganese species are commonly determined by pH
and redox potential as depicted in Figure 2.1 (Eh-pH stability diagram). Obviously, this figure
illustrates that at any Eh, or redox potential, value, the pH level for the stability of soluble Mn(II)
is considerably higher than Fe(II). Consequently, it can be concluded that manganese cannot be
oxidized and removed from water as easily as iron. The diagram also shows that under reducing
condition with pH above 8.0, solid MnCO3 is the primary form of manganese. Generally, solubility
of Fe(II) and Mn(II) is controlled by the concentration of carbonate (alkalinity) in water which may
result in the precipitation of FeCO3 and MnCO3, respectively (Buamah et al., 2008). However, in
the presence of O2 and high pH levels, Mn(III) and Mn(IV) are favored. In addition, presence of
iron and manganese oxidizing and reducing microorganisms can also govern the oxidation state of
these minerals in natural water sources (Trudinger, 1979). Furthermore, formation of stable
complexes between either Fe(II) or Mn(II) and various dissolved organic compounds can greatly
increase the solubility of these metals, especially iron (Trudinger, 1979).
Figure 2.1. Eh-pH stability diagram for iron and manganese at 25oC and divalent species concentration
(activity) of 10-5 M (Morgan and Stumm, 1965).

8
2.2 Water quality concerns and regulations
Iron and manganese are objectionable constituents of water mainly for aesthetic and/or operational
issues. Soluble iron and manganese in water distribution systems may be oxidized by oxygen or
free chlorine, which is applied as a secondary disinfectant, resulting in the deposition of blackish-
brown manganese dioxide and/or reddish-brown iron hydroxide. This can cause discoloration of
water, staining of laundry and plumbing fixtures, an unpleasant metallic taste to water, and, in
severe case, the reduction in hydraulic capacity of pipes or an increase in required energy for
pumping water through the pipes; hence, it represents additional costs to municipality.
Furthermore, in the case of insufficient secondary disinfectant residual, the presence of these metals
in distribution system may promote the growth of iron and manganese utilizing bacteria, resulting
in clogging of the pipelines or creating additional aesthetic problems (Sly et al., 1990; World Health
Organization (WHO), 2008). A recent study further revealed that bio-chemical oxidation and
sorption of iron and manganese significantly influence the accumulation of these species in water
distribution network (Prasad and Danso-Amoako, 2014). In this regard, the United States
Environmental Protection Agency (USEPA), (2004) has established secondary maximum
contaminant levels of 0.3 mg/L and 0.05 mg/L for total iron and manganese in drinking water,
respectively. However, consumer complaints regarding aesthetic issues have been reported at
concentrations of iron and manganese as low as 0.05 (World Health Organization (WHO), 2003)
and 0.02 mg/L (Sly et al., 1990), respectively. Consequently, Health Canada (2016) has recently
proposed an aesthetic objective limit of 0.02 mg/L for total manganese in drinking water.
Therefore, it is recommended to keep the level of these minerals in drinking water as low as
possible.
Over the last decade, numerous studies have reported adverse health impacts from manganese
intake from drinking water. The reader is referred to the recent Health Canada (2016) literature
review for a complete description of studies related to manganese neurotoxicity. For example,
although manganese is an essential nutrient for human health, it has been indicated that exposure
to elevated levels of manganese in drinking water may cause neurological disorders, especially, in
children (Wasserman et al., 2006; Dion et al., 2016; Oulhote et al., 2014; Bouchard et al., 2011).
Consequently, to prevent potential health effect, health-based guidelines of 0.5, 0.4, 0.3 and 0.1
mg/L manganese in drinking water have been recommended by California Department of Public
9
Health (CDPH) (2010), World Health Organization (WHO) (2008), United States Environmental
Protection Agency (USEPA) (2004) and Health Canada (2016), respectively. The Health Canada
guideline is currently under review and the final recommendation is expected in 2017. The
Minnesota Department of Health followed the same approach as Health Canada and established a
manganese level of 0.1 mg/L for infants less than 1 year old, and 0.3 mg/L for children > 1 year
old and adults (MDH, 2012).
No health guideline value has been proposed for iron at concentrations normally found in drinking
water (World Health Organization (WHO), 2008).
2.3 Traditional methods for iron and manganese control in drinking
water
There are several available methods for iron and manganese removal from water depending on the
speciation of these elements and water quality. The most common methods are as follows:
Oxidation of Fe(II) and Mn(II) to particulate forms, ferric iron (Fe(III)) and manganic
manganese (Mn(IV)), using a strong oxidant, followed by removal of the precipitates
through depth granular media filtration;
Sorption of Mn(II) onto manganese oxide coated media followed by autocatalytic oxidation
of adsorbed manganese using oxygen or chlorine; however, in this process, Fe(II) may be
readily oxidized in water and, thus, removed through granular media filtration.
These techniques are discussed in detail in the following sections.
2.3.1 Direct oxidation and particle removal
2.3.1.1 Oxidation of iron and manganese
In general, removal of manganese from water is more difficult than iron because of its slower
oxidation rate (Knocke et al., 1991) and its tendency to form colloidal particles when it is rapidly
oxidized in water (Morgan and Stumm, 1964).
Oxygen (from air), chlorine and KMnO4 are the most common oxidants applied in water treatment
practices. In addition to these, O3, chlorine dioxide (ClO2) and hydrogen peroxide (H2O2) are also
used for iron/manganese oxidation (Sommerfeld, 1999).
10
Oxidation of Fe(II) and Mn(II) in water most often forms iron hydroxide (Fe(OH)3) and manganese
dioxide (MnO2), respectively. Knocke et al. (1990a) revealed that oxidation from the bulk solution
is the only mechanism responsible for Fe(II) removal in low-dissolved organic carbon (DOC)
waters. However, oxidation of Mn(II) involves three steps: solution-phase oxidation, adsorption of
Mn(II) onto MnO2(s) particles and subsequent oxidation of adsorbed ions on the oxide surface,
which are depicted on the following equations:
Mn(II) + Ox → MnO2(s) (Oxidation) (1.1)
Mn(II) + MnO2(s) → Mn(II).MnO2(s) (Adsorption) (1.2)
Mn(II).MnO2(s) + Ox → 2MnO2(s) (Oxidation) (1.3)
The following discussion reviews details of iron and manganese oxidation by different oxidants
that are commonly used in water treatment plants:
Aeration. In many cases, aeration is the first pretreatment that has been used prior to filtration. It
helps to oxidize iron in varying rates depending on the pH of water, temperature and the presence
of organic matter (Sommerfeld, 1999; Azizi et al., 2013). Although aeration can theoretically be
employed to oxidize Mn(II) to MnO2(s), the oxidation reaction is too slow under the pH of most
natural waters, and thus a long detention time is required (Griffin, 1960; Wong, 1984). Likewise,
Phatai et al. (2010) showed that the maximum Mn(II) removal efficiency using aeration alone was
40% even at pH 9.0. Under an elevated pH of 11.0 only 70% of Mn(II) could be oxidized by
aeration (Kaya et al., 2005). Therefore, previous results indicate that aeration alone cannot
satisfactorily oxidize Mn(II) even under high pH values (Azizi et al., 2013; Phatai et al., 2010).
Another disadvantage related to this process is the high capital cost incurred due to the large-size
retention tank that would be required.
Chlorination. Chlorine is a stronger oxidizing agent than oxygen which has been used for many
years as a water treatment chemical because it is economical, readily available, easy to feed and
can be used both for the oxidation of inorganic contaminants and as a disinfectant. There are two
options for dosing chlorine, as a gas forced into water under pressure or as a solution of calcium
hypochlorite or sodium hypochlorite pumped into water (Sommerfeld, 1999). The end-product is
however the same: a mixture of hypochlorous acid (HOCl) and hypochlorite ion (OCl-) which
proportion is pH-dependent.
11
The stoichiometric amounts of chlorine required for oxidizing 1mg/L of Fe(II) and Mn(II) are 0.64
and 1.3 mg/L, respectively. However, in reality, the required chlorine has been found to be much
higher than the stoichiometric amount owing to the additional chlorine demand caused by organic
matter, ammonia and other reduced compounds in water such as hydrogen sulfide (Sommerfeld,
1999). Knocke et al. (1990a) found that Fe(II) and Mn(II) oxidation by chlorine was impacted by
several factors including water pH, temperature, chlorine dosage and retention time. They revealed
that the reaction rate between Fe(II) and chlorine was rapid even under low pH and temperature.
Typically, at pH 5.0, complete oxidation of Fe(II) was observed within 10-15 seconds. Even though
a considerable reduction in Fe(II) oxidation rate was noticed by decreasing temperature, effective
Fe(II) oxidation was observed within 15 seconds (at pH 6.0) or 90 seconds (at pH 5.0) at 2°C
(Knocke et al., 1990a).
The oxidation rate of Mn(II) by chlorine is highly dependent on pH. It has been indicated that even
under a chlorine dosage 4 times greater than the stoichiometric value, a minimum of three hours
contact time was necessary at pH 7.0 to oxidize 30% of Mn(II) in water (Knocke et al., 1990a).
However, when the pH was increased to 9.0, Mn(II) was effectively controlled within 1 hour to
below 0.05 mg/L. Also, it has been shown that the reduction of temperature from 25°C to 14°C
declined the reaction rate significantly while increasing the reaction time by three or four times
could not compensate this reduction (Knocke et al., 1990a). Consequently, direct oxidation of
Mn(II) via chlorination is often unpractical because of the too slow oxidation rate even under high
chlorine dosage (Griffin, 1960; Knocke et al., 1990a; Allard et al., 2013). In addition, the resultant
oxidized Mn(II) may form negatively charged colloidal particles that can be difficult to remove by
granular media filtration (Griffin, 1960; Wong, 1984). Nevertheless, chlorine is one of the most
popular oxidant used for Mn removal applications in North America where it is combined with
catalytic filters (e.g. greensand) to achieve removal trough adsorption-oxidation (cf. Eqs. 1.2 and
1.3). This treatment strategy will be further discussed in section 1.3.2
Chlorine dioxide treatment. ClO2 is a powerful oxidant and disinfectant. It is being used for
improving the removal of compounds that cause taste and odor, for the oxidation of iron and
manganese and the inactivation of chlorine-resistant pathogens such as Giardia. Unlike chlorine,
it does not produce organic disinfection by products (DBPs) (Gopal et al., 2007), although it
generates chlorite and chlorate which are also regulated DBPs.
12
ClO2 reacts quickly with the soluble forms of iron and manganese at pH ranges more than 7.0. The
reaction rate increased when pH, temperature and initial Mn(II) concentration were increased
(Vanbenschoten et al., 1992) and decreased in the presence of natural organic matter (NOM)
(Gregory and Carlson, 2003). For Fe(II) and Mn(II) oxidation, the theoretical stoichiometric
requirements of ClO2 are 0.24 mg ClO2/mg Fe(II) and 2.45 mg ClO2/mg Mn(II). However,
laboratory results showed that at least twice the theoretical value would be necessary for effective
soluble manganese removal (Knocke et al., 1990a). This oxidant has been shown to be the most
effective, more than KMnO4 and O3, for removing low initial Mn(II) concentrations (0.06 and 0.2
mg/L) in the presence of NOM (3.4 mg/L). It could consistently produce final Mn(II) < 0.01 mg/L
within 1.5-3 minutes in various initial Mn(II) concentrations while the occurrence of undesirable
MnO4- was not observed (Gregory and Carlson, 2003). Although ClO2 is an effective oxidant for
iron and manganese removal, its application has been limited due to the production of undesired
by-products, i.e. chlorite and chlorate (Gopal et al., 2007). The USEPA (2004) regulated the
combined residual of ClO2, chlorite and chlorate in treated water at 1.0 mg/L. Therefore, the
formation of chlorite often limits the maximum applicable ClO2 dosage to 1.4 to 2.0 mg ClO2/L,
assuming that 50-70% of ClO2 is converted into chlorite. Hence, with this high stoichiometric
requirement, application of ClO2 is only well suited for waters with very low oxidant demand.
In the province of Quebec (Canada), chlorine dioxide has been successfully used during the 1990s
in settled waters to oxidize manganese in surface water applications. Even under very low water
temperature (1oC), manganese oxidation was achieved by chlorine dioxide in the water column
above the filter (contact time of approx. 20 min in winter). This practice was progressively
abandoned due to the significant replacement costs of ClO2 generators and concerns related to
chlorite as a DBP.
Ozonation. O3 is a powerful oxidant that is being employed extensively as a strong disinfectant
owing to its numerous advantages over chlorine. Moreover, ozonation is efficient in removing taste
and odor from water (Camel and Bermond, 1998).
The theoretical stoichiometric dose of O3 for oxidation of Fe(II) and Mn(II) is 0.88 mg O3/mg
Mn(II) and 0.43 mg O3/mg Fe(II). The second-order rate constant for the direct reaction of Mn(II)
with O3 is extremely fast as it was estimated as 1.5 x 10³ M-1 s-1 (Jacobsen et al., 1998). However,
in the presence of moderate concentrations of organic matter like humic substances, two to five
13
times as much O3 dose was required (Knocke et al., 1990a; Reckhow et al., 1991). This was due to
competition between Mn(II) and organic substances for the oxidant. Gregory and Carlson (2003)
also revealed the importance of initial Mn(II) concentration, especially, in the presence of NOM.
Accordingly, the oxidation kinetics for low Mn(II) concentrations (0.06 and 0.2 mg/L) were
significantly slower than for high concentrations (1 mg/L), which resulted in soluble Mn(II)
residual > 0.02 mg/L. The formation of MnO4- was observed in many cases in low Mn(II) source
waters. The MnO4- formation was attributed to the higher required O3 dose under elevated NOM
content and the complexation of Mn(II) by NOM (Gregory and Carlson, 2003; Reckhow et al.,
1991; Gregory and Carlson, 2001). However, a mechanistic study by Reisz et al. (2008) revealed
that the MnO4- formation is most likely caused by the presence of Fe(II) in water rather than
complexation of Mn(II) by NOM. MnO4- is an undesirable product in treated water since it is a
Mn(II) species with a relatively long half-life and pink color, which may subsequently be slowly
reduced to MnO2(s) in the distribution system and may contribute to water quality complaints due
to turbidity and discoloration of water (Gregory and Carlson, 2001). At high Mn(II) concentrations,
the formation of MnO4- is reduced as the theoretical oxidant dosage required is 2.2 mg O3/mg
Mn(II). In addition, under high initial Mn(II) concentrations, oxidized Mn(IV) progressively
formed during the reaction may react with Mn(II) through the adsorption/oxidation pathway.
Therefore, Mn(II) control via ozonation can be especially difficult to do in waters with low Mn(II)
concentrations (e.g. < 100 µg/L) and/or in the presence of Fe(II).
Iron is rapidly oxidized by O3 to an insoluble form in the absence of organic matter (Reckhow et
al., 1991). The second-order kinetic rate constant has been estimated as 8.2 x 10⁵ M-1 s-1 (Logager
et al., 1992) which makes the reaction controlled by mass-transfer conditions. However, retardation
in iron removal rate with increasing organic content has been shown (Reckhow et al., 1991). In
fact, these substances inhibit oxidation of Fe(II) by O3 by either complex formation with the Fe(II)
or providing a competing oxidant demand. El Araby et al. (2009) showed that oxidation of Fe(II)
was faster than Mn(II) while under low O3 dose only iron removal was achieved. Although over
ozonation did not affect iron removal, manganese removal efficiency was decreased because of
MnO4- formation (Sung et al., 2015). In addition, the removal of Fe(II) and Mn(II) via ozonation is
pH, temperature and alkalinity dependent, especially, for manganese (El Araby et al., 2009). As
expected, increasing the temperature from 5 to 25°C slowed down the kinetic of iron and
manganese oxidation by O3 (El Araby et al., 2009). The removal performance was increased by
14
increasing the alkalinity, particularly for manganese, owing to the higher stability of dissolved O3
in the presence of radical scavengers such as bicarbonate and carbonate.
In addition to the abovementioned defects, oxidation by O3 is energy intensive and has the potential
to produce bromate, a suspected carcinogen (Cavanagh et al., 1992). Moreover, O3 is an expensive
oxidant and requires more capital expenditures for its application than other oxidants. Susceptibility
to the degradation of polymeric membranes due to its oxidative attack is another restriction
encountered in ozonation (Montgomery Watson Harza (MWH), 2005) which limits its use prior to
polymeric membrane filtration. In summary, ozonation is rarely selected for the oxidation of
manganese in water, unless other treatment objectives (e.g. oxidation of geosmine) justify its
application within the overall treatment strategy.
Potassium permanganate treatment. KMnO4 is a strong oxidant that has been traditionally used
for Fe(II) and Mn(II) oxidation. Theoretical stoichiometric dose of KMnO4 for oxidizing 1 mg/L
Fe(II) and Mn(II) is 0.94 and 1.92 mg/L, respectively. However, the presence of significant amount
of dissolved organic matter will remarkably increase the oxidant demand to achieve effective Fe(II)
and Mn(II) oxidation (Carlson and Knocke, 1999). In addition, the presence of organic matter
retards the oxidation rate of these species (Carlson and Knocke, 1999; Vercellotti, 1988). These
results emphasize the negative effect related to the formation of Fe(II) and Mn(II) complexes with
organic substances found in water (Carlson and Knocke, 1999; Theis and Singer, 1974). For
instance, the second order kinetic rate constant for oxidation of Mn(II) by MnO4- in water with <
0.5 mg/L and 3.3 mg/L dissolved organic matter is 104.24 M-1 s-1 (Vanbenschoten et al., 1992) and
101.90 M-1 s-1 (Carlson and Knocke, 1999), respectively. In addition, the rate of Fe(II) and Mn(II)
oxidation by KMnO4 is also influenced by pH, temperature and initial concentration of these
species (Knocke et al., 1991; Vanbenschoten et al., 1992; Vercellotti, 1988) while the oxidation
rate was increased by increasing these parameters. Van Benschoten et al. (1992) revealed that
manganese oxidation at pH values between 6.0 and 8.0 occurred in less than 20 seconds at 25°C;
however, this reaction was incomplete after 30 seconds at 7°C and pH 7.0. Gregory and Carlson
(2003) found that the initial concentration of Mn(II) dramatically impacted the required contact
time for oxidation. Accordingly, for an initial Mn(II) concentration of 0.06 mg/L, 20 min contact
time was needed while the required contact time reduced to 3 min for an initial Mn(II) concentration
of 1 mg/L (T = 9oC, pH = 7 and total organic carbon (TOC) = 3.4 mg/L).
15
Unlike chlorine, the reaction of KMnO4 with organic compounds will not generate toxic
trihalomethane (THM), but may even slightly reduce them by oxidizing certain THM precursors
(Ficek and Boll, 1980). Other advantages of using this oxidant include the oxidation of compounds
causing taste and odor (Ficek and Boll, 1980). The main disadvantages are related to the cost (which
is higher than for bleach solution) and the formation of additional manganese as an oxidant by-
product. Up to recently, the later was not perceived negatively but this consideration is slowly
changing as manganese health-based regulations are being proposed (Health Canada, 2016) or put
in place (MDH, 2012). Therefore, it becomes important to count on an efficient post-treatment of
coagulation-granular media filtration or low-pressure membranes to remove the manganese oxides.
In addition, if manganese level fluctuates, adjusting the KMnO4 dose is critical and overdosing
causes adverse effects (Azizi et al., 2013; Roccaro et al., 2007). Thus, the dosages must be
monitored and optimized regularly. In summary, MnO4- is one of the most common oxidation
strategy employed in the water industry for manganese control as it has been shown to be effective,
even for the treatment of groundwaters with elevated manganese concentrations. As for any
oxidant, its application conditions are highly site-specific and should account for the formation of
the manganese oxides which must be adequately removed once formed.
Hydrogen peroxide treatment. H2O2 is a weak oxidant for Fe(II) and Mn(II) removal
(Sommerfeld, 1999). Potgieter et al. (2005) revealed that oxidation by H2O2 yields unsatisfactory
Fe(II) removal in water containing organic carbon and it shows no significant oxidative effect on
Mn(II).
Theoretical reaction stoichiometry for oxidation of Fe(II) and Mn(II) with common oxidants are
presented in Table 2.1.
As stated earlier, oxidation of Mn(II) involves solution-phase oxidation, adsorption and surface
oxidation. Van Benschoten et al. (1992) developed a model to predict Mn(II) oxidation rate by
ClO2 and KMnO4. They concluded that for these reactive oxidants, adsorption of Mn(II) to the
MnO2(s) surface is the rate-limiting reaction since direct solution-phase oxidation is kinetically
favored over surface oxidation except at low temperature and/or low pH when the solution-phase
oxidation rate is expected to be slow (e.g., pH = 5.5, T = < 14°C). Considering this fact, Mn(II)
removal by reactive oxidants is dependent upon oxidant addition at alkaline pH with a sufficient
reaction time to allow oxidation of Mn(II) to MnO2(s). Subsequently, MnO2(s) must be removed by

16
a standard solid-liquid separation technique. In contrast, for weaker oxidants such as molecular
oxygen and chlorine, the adsorption step was found to be faster than the solution-phase oxidation
reaction (Casale et al., 2002). Thus Mn(II) removal successfully occurs in filters where oxide-
coated media provides a large surface area for adsorption and evidently enhances the rate of surface
oxidation of adsorbed manganese.
Table 2.1. Theoretical reaction stoichiometry for oxidation of Fe(II) and Mn(II) (Sommerfeld, 1999).
Oxidant Oxidation reactions Stoichiometric ratio
(mg oxidant:mg Mn/Fe)
O2 (aq) Mn2+ + 1/2O2 + H2O ⟹ MnO2(s) + 2H+
2Fe2+ + 1/2O2 + 5H2O ⟹ 2Fe(OH)3(s) + 4H+
0.29:1
0.14:1
HOCl Mn2+ + HOCl + H2O ⟹ MnO2(s) +Cl- + 3H+
2Fe2+ + HOCl + 5H2O ⟹ 2Fe(OH)3(s) + Cl- + 5H+
1.30:1
0.64:1
ClO2 Mn2+ + 2ClO2 +2 H2O ⟹ MnO2(s) +2ClO2- + 4H+
5Fe2+ + ClO2 + 13H2O ⟹ 5Fe(OH)3(s) + Cl- + 11H+
2.45:1
0.24:1
KMnO4 3Mn2+ + 2MnO4- + 2H2O ⟹ 5MnO2(s) + 4H+
3Fe2+ + MnO4- + 7H2O ⟹ 3Fe(OH)3(s) + MnO2(s) + 5H+
1.92:1
0.94:1
O3 Mn2+ + O3 + H2O ⟹ MnO2(s) +O2 + 2H+
2Fe2+ + O3 + 5H2O ⟹ 2Fe(OH)3(s) + O2 + 4H+
0.88:1
0.43:1
2.3.1.2 Removal of oxidized particles by conventional treatment
Once Fe(II) and Mn(II) have been converted to particulate forms via oxidation, the particles must
be removed by a solid-liquid separation technique. Commonly, utilities exploit the conventional
treatment process consisting of coagulation, flocculation, clarification and filtration to remove
particles (Potgieter et al., 2005; Zogo et al., 2011). Ferric sulfate, ferric chloride, aluminum sulfate
(alum) and pre-hydrolyzed aluminum salts are the common coagulants used in water treatment
plants. However, for utilities whose goal is to remove iron and manganese from water for drinking
purposes, the application of ferric sulfate and ferric chloride at low pH (4.5- 5.5) for enhanced
coagulation may lead to challenging conditions for manganese oxidation. Alum application is
typically also optimal in a pH range of 5.8-6.3 which may slow down manganese oxidation kinetic
(Knocke et al., 2010). Since oxidation of Mn(II) with strong oxidants may lead to the formation of
colloidal solid (Morgan and Stumm, 1964; Tobiason et al., 2016), it may not be effictively removed
through direct filtration without an optimized coagulation (Tobiason et al., 2016; Carlson et al.,
17
1997). The negative charge on the colloidal manganese oxides produce repulsion forces with the
filter media which may prevent particle adhesion to the media.
In order to resolve the conflicting issue of NOM removal by coagulation (improved at lower pH)
and the oxidation of manganese (improved at higher pH), many utilities will raise the pH of settled
waters in the range of 6.5-7.0 and add chlorine before filtration in order to improve the filtration
performance. Carlson et al. (1997) demonstrated that chlorine injection on top of the filter media,
consisting of significant MnOx(s), improved manganese removal significantly. In this process the
filter media would function to remove Mn(II) via surface adsorption followed by surface-catalyzed
Mn(II) oxidation by chlorine (Knocke et al., 1990b). However, raising the pH too high before
filtration (e.g. 8.0) may negatively impact manganese removal since elevated pH promotes solution
phase oxidation of Mn(II) and generates colloidal manganese oxides which are hardly captured
through filtration (Hargette and Knocke, 2001). Another treatment strategy has recently been
proposed by Knocke et al. (2010). The treatment involves the construction of post-contactor (i.e.
after the granular media filters) which are dedicated for the Mn(II) removal though sorption-
oxidation on MnOx(s) filters (e.g. pyrolucite). The two main advantages of this techniques are (i)
that the performance of the conventional coagulation/settling/filtration performance can be
optimized for NOM/turbidity removal, (ii) chlorine addition in settled water can be abandoned
which reduces THM/AHA formation and (iii) the operation of the post-contactor can be done at
very high filtration rate (up to 49 m/h) since these filters do not remove particulate matter.
Correspondingly, a recent study demonstrated a successful Mn(II) removal in full-scale plant at
HLR of 25 m/h using second-stage contactors (Bazilio et al., 2016).
Mn(II) removal by sorption and subsequent autocatalytic oxidation is discussed in more details in
the following section. Finally, membrane filtration as an alternative to traditional media filtration
is being used more frequently in water treatment plants. More specific discussion regarding this
process is presented in section 1.4.
2.3.2 Manganese removal by sorption and oxidation within filters
As discussed earlier, another method for manganese removal from aqueous solution is the
adsorption of Mn(II) onto the MnOx(s) surface. Morgan and Stumm (1964) investigated the surface
properties of hydrous MnO2(s), which has high specific surface area of 300 m2/g of MnO2(s), and
found that this oxide has a high affinity for Mn(II) adsorption, especially at alkaline pH values

18
above the zero point of charge. The point of zero charge of MnO2(s) lies between pH 1.5 and 4.6
(Healy et al., 1966). Mn(II) adsorption mechanism by MnOx(s) has been interpreted as ion exchange
and/or surface complex formation where hydrogen ions are released while Mn(II) is adsorbed
(Morgan and Stumm, 1964). Likewise, a study conducted by Hu et al. (2004) suggested that ion
exchange might be the principal mechanism for Mn(II) adsorption onto MnOx(s).
The MnO2(s) can be employed as a coating on the surface of the filtration media (coated sand,
anthracite and gravel) or as a natural ore (e.g., pyrolucite). Microscopic studies on manganese oxide
coated media indicated that this coating has the capability to remove both particulate and dissolved
inorganic species (Merkle et al., 1996). In addition, a strong adsorption capacity of MnOx(s) for
other transition and heavy metal ions such as iron (He et al., 2010), copper (Lee et al., 2004) and
arsenic (Chang et al., 2012) has been reported. In this process, MnOx(s) initially provides the
sorption sites for Mn(II) and subsequently catalyzes the oxidation of adsorbed Mn(II) by free
chlorine (autocatalytic oxidation) (Knocke et al., 1990b). This phenomenon has been termed the
“NGE” process. Therefore, the media plays a dual function in NGE process, and thus, allowing two
modes of operation to remove manganese: IR and CR. The regeneration is necessary to restore the
adsorption capacity of the media (Knocke et al., 1990b).
IR process. The IR process is best suited for waters containing soluble Mn(II) concentrations of ≤
0.2 mg/L (Knocke et al., 1990b) with low concentrations of iron. In this operation mode, the filter
media adsorbs Mn(II) in the absence of a strong oxidant. After treating a specific quantity of water,
since the adsorbed Mn(II) is hardly oxidized by the oxide coating (there is no evidence of auto-
catalytic oxidation) at near neutral pH values (Knocke et al., 1990b), the adsorption capacity of the
media is consumed (exhaustion of the filter media) and a regeneration is required. In order to
regenerate the filter media, the appropriate concentration of KMnO4 or chlorine must be applied
whether in up-flow or down-flow mode (Knocke et al., 1990b).
Therefore, sorption of Mn(II) ions onto the oxide coated filter media appears to be the only
mechanism responsible for Mn(II) removal (Knocke et al., 1990b), which can be illustrated in the
following Eq. (1.4) that shows the ion exchange mechanism (Tiwari et al., 2007):
≡S−OH + Mn2+ ⟹ ≡S−O−Mn+ + H+ (1.4)
where S is the manganese atom in the oxide surface.
19
Other restrictions facing to this type of operation are the recommended pH of water, which must
be higher than 7.0, and the presence of a significant manganese oxide coating level on the filter
media. Increasing the pH, especially, for utilities applying alum coagulation may cause problems
due to elevated aluminum concentration in the treated water (Zogo et al., 2011). In addition, other
drawbacks of this process are the production of a large volume of waste water during regeneration,
which may contain high levels of oxidant, and the 15 to 30 minutes ripening period following filter
re-start (to reduce the possible release of MnOx(s) into finished water) (Knocke et al., 1990b).
However, IR might be an appropriate option for treating water supplies containing high levels of
NOM (in order to prevent the possible formation of DBPs). It is also simpler to operate as no
continuous chemical injection is required. This characteristic has made this treatment a common
option for the treatment of iron/manganese in residential applications.
CR process. The CR process is well suited to treat waters with high levels of iron and manganese.
The CR mode involves feeding an oxidant to raw water just prior to filtration. The Quebec Design
Guidance Manual states that this configuration can treat up to 10, 5 and 2 mg/L of iron, manganese
and hydrogen sulfide, respectively (Ministère du développement durable de l’environnement et
lutte contre les changements climatiques (MDDELCC), 2016). However, for iron and manganese
concentrations above 5 and 1 mg/L, respectively, providing a settler before filtration is
recommended. Free chlorine is the ideal oxidant for CR process since it only promotes oxidation
of adsorbed Mn(II) within the oxide coated media while stronger oxidants, such as KMnO4, ClO2
and O3, promote solution phase oxidation of Mn(II) leading to generation of colloidal MnO2(s),
which may not be removed through filtration. Moreover, free chlorine is a cheap and readily
available oxidant. Thus, the filter media would function to remove Mn(II) via surface adsorption
followed by surface-catalyzed Mn(II) oxidation by chlorine, as follows (Coffey et al., 1993):
Mn2+ + MnO(OH)2(s) ⇔ MnO2MnO(s) + 2H+ (reversible adsorption) (1.5)
MnO2MnO(s) + HOCl ⇒ 2MnO2(s) + H+ + Cl- (autocatalytic oxidation) (1.6)
Thus, the maintenance of the available sorption site is an important issue. Accordingly, in order to
achieve a continuous regeneration, free chlorine concentration should be adjusted such that a free
chlorine residual of 0.5 - 1.0 mg/L is maintained in the effluent (Knocke et al., 1990b). In this
process, the mechanism of iron removal mainly includes solution oxidation of Fe(II) by chlorine
followed by removal of particulate Fe(OH)3(s) through the filter bed (traditional filtration).
20
2.3.2.1 Filter media for NGE process
Effective Mn(II) removal does not take place until a manganese oxide coating develops on the filter
media (Griffin, 1960; Eley and Nicholson, 1993). It may take several weeks or even months to
naturally develop this coating on the filter media (Azizi et al., 2013). The development period is
mainly related to the oxidant concentration, pH and soluble Mn(II) level in the water supply
(Knocke et al., 1990b). Another issue is associated with the stability and durability of this coating
as it can be partially washed out during backwash (Azizi et al., 2013). The following sections
presents the most common filtration media used in the NGE process.
Manganese greensand. Commercial manganese greensand is a well-known purple-black granular
filter media having been used to remove iron, manganese and hydrogen sulfide from groundwater
since the 1950s. The product was mined in New Jersey and sold by Inverness® which still supplies
a similar product sold as the GreenSandPlus™. It is made from glauconite mineral (greensand)
processed with KMnO4 to produce a thin layer of MnO2(s) on the granules. According to the
supplier, this media has typically an effective size of 0.3-0.35 mm, uniformity coefficient of less
than 1.6, MnO2 content of 25-45% and is commonly used at superficial flow rates of 7 to 12 m/h
(3 to 5 gpm/ft2) (Sommerfeld, 1999). The filter efficiency is severely reduced at pH values less
than 6.8 (Barlokova and Ilavsky, 2009). In addition, organic substances, oils and hydrogen sulfide
can adversely affect the process performance. Rapid media exhaustion was observed even at
moderate levels of iron and manganese (0.4 mg/L of each metal) and pH 7.2 (Barlokova and
Ilavsky, 2009).
Over the last decades, many other manganese-coated media were made commercially available
(e.g. Katalox-Lite, MTM). These media are designed to have a lower density than greensand (e.g.
MTM uses a plastic core while Katalox uses zeolite like Greensand but claims higher than 10%
MnO2 content).
Birm. Birm (Burgess Iron Removal Method) is another commercial manganese coated sand
(aluminum silicate) having the capacity to oxidize iron. It is typically applied for household water
treatment, but has been also used in municipal water treatment plants. According to the supplier,
this media has typically an effective size of 0.48 mm, specific gravity of 2.0 and MnO2 content of
25-45%. Birm is known as a catalytic media that can catalyze oxidation of iron by oxygen. In order
to achieve an effective process, the water to be treated should have a pH of 6.8-9.0. It might be also

21
used for manganese removal, but in this case the pH of water should be preferably above 8.0. In
this process, aeration is required for treating groundwater having low dissolved oxygen (Osmo
Sistemi Company website). Lee et al. (2009) showed that although chlorination greatly increase
the removal efficiency of laboratory prepared manganese coated sand, it does not have a significant
effect on the removal capacity of Birm. Barlokova and Ilavsky (2009) revealed that a regeneration
is necessary to restore media activity for manganese removal. In addition, the water to be treated
must not contain oils (≈ 0 mg/L), sulfates (≈ 0 mg/L) and high level of organic substances (> 5
mg/L) and free chlorine (> 0.5 mg/L) (Barlokova and Ilavsky, 2009).
Pyrolucite. Pyrolucite or pyrolusite is the common name of black MnO2 mineral consisting of 70
to 85% MnO2 by weight, as is shown in Figure 2.2. The crushed and angular ore provides extensive
surface sites available for iron and manganese removal. Thus, there is no need to develop a
manganese oxide coating in order to remove manganese using this media. However, conditioning
the virgin filter media with KMnO4 or NaOCl solution is required to activate the sorption sites prior
to filtration (Zuravnsky, 2006). Effective manganese removal can be achieved even at a high HLR
of 24 to 29 m/h (10 to 12 gpm/ft2). Typically, sufficient concentration of chlorine is supplied to
keep the pyrolucite continuously regenerated (Osmo Sistemi Company website). Pyrolucite is a
hard media with a high specific gravity of about 4.0. Thus, a high backwash rate is required to
fluidize the bed at least 30%, which is a disadvantage of this media as it produces more wastewater
during backwash than a lighter media such as Birm or greensand.
It has been shown that pyrolucite media has a larger capacity for Mn(II) removal than either
manganese oxide coated gravel or torpedo sand (Knocke, et al. 2010; Zuravnsky, 2006). This can
be attributed to both higher specific concentration of MnO2(s) on the media and larger specific
surface area of pyrolucite, which provide high amount of available active sites on its surface. The
pyrolucite is commercialized under various names (e.g., MangOXTM, Pyrolox®, FiloxTM, etc.).
Birnessite. Bruins et al. (2015b) revealed that the predominant component in MnOx(s) coatings
extracted from conventional aeration-filtration groundwater treatment plants is Birnessite which
provides a very effective manganese removal performance. Birnessite is a poorly crystalline
structure of manganese oxides. The average valence number of manganese in Birnessite ranges
from +3.5 to +3.9. This compound is extremely suitable for manganese removal because of its
layered structure, which may readily undergo oxidation-reduction and cation-exchange reactions
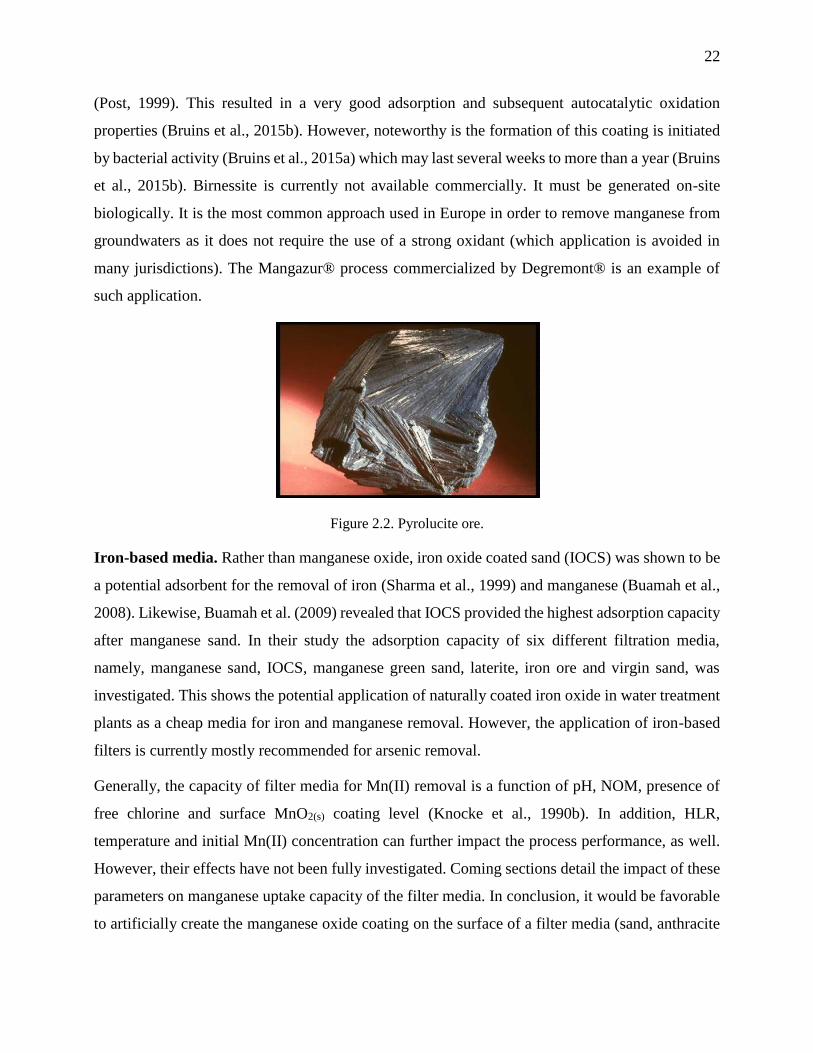
22
(Post, 1999). This resulted in a very good adsorption and subsequent autocatalytic oxidation
properties (Bruins et al., 2015b). However, noteworthy is the formation of this coating is initiated
by bacterial activity (Bruins et al., 2015a) which may last several weeks to more than a year (Bruins
et al., 2015b). Birnessite is currently not available commercially. It must be generated on-site
biologically. It is the most common approach used in Europe in order to remove manganese from
groundwaters as it does not require the use of a strong oxidant (which application is avoided in
many jurisdictions). The Mangazur® process commercialized by Degremont® is an example of
such application.
Figure 2.2. Pyrolucite ore.
Iron-based media. Rather than manganese oxide, iron oxide coated sand (IOCS) was shown to be
a potential adsorbent for the removal of iron (Sharma et al., 1999) and manganese (Buamah et al.,
2008). Likewise, Buamah et al. (2009) revealed that IOCS provided the highest adsorption capacity
after manganese sand. In their study the adsorption capacity of six different filtration media,
namely, manganese sand, IOCS, manganese green sand, laterite, iron ore and virgin sand, was
investigated. This shows the potential application of naturally coated iron oxide in water treatment
plants as a cheap media for iron and manganese removal. However, the application of iron-based
filters is currently mostly recommended for arsenic removal.
Generally, the capacity of filter media for Mn(II) removal is a function of pH, NOM, presence of
free chlorine and surface MnO2(s) coating level (Knocke et al., 1990b). In addition, HLR,
temperature and initial Mn(II) concentration can further impact the process performance, as well.
However, their effects have not been fully investigated. Coming sections detail the impact of these
parameters on manganese uptake capacity of the filter media. In conclusion, it would be favorable
to artificially create the manganese oxide coating on the surface of a filter media (sand, anthracite
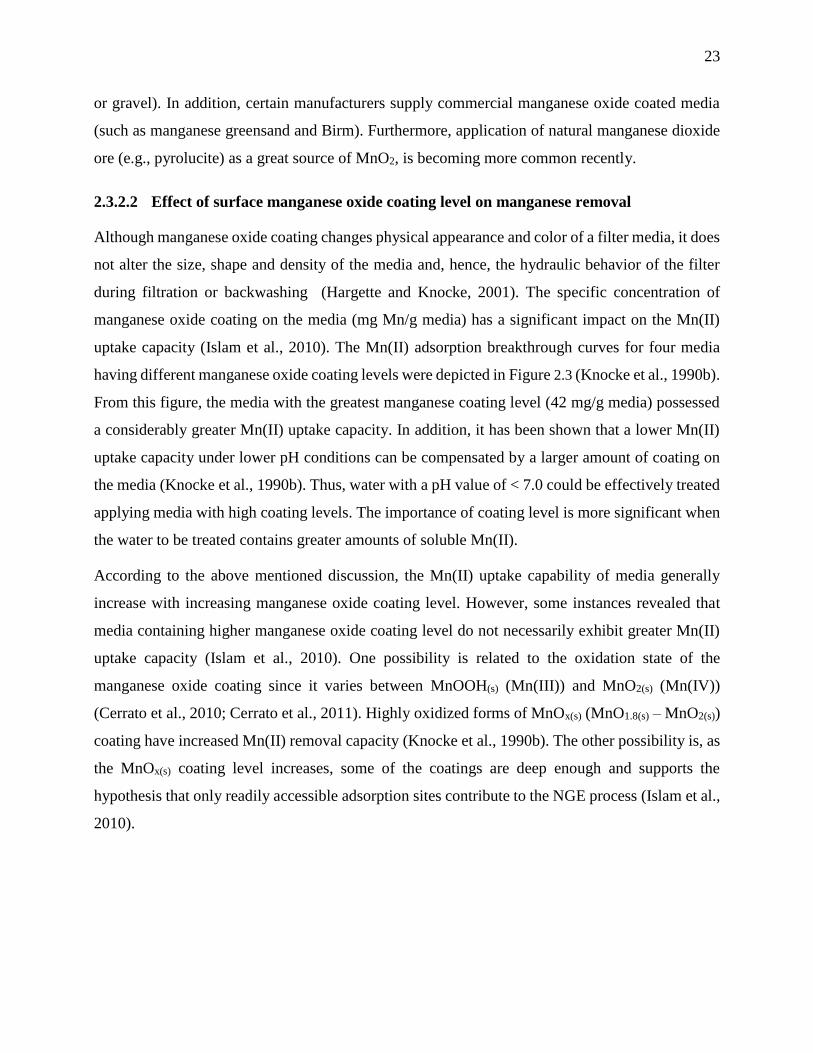
23
or gravel). In addition, certain manufacturers supply commercial manganese oxide coated media
(such as manganese greensand and Birm). Furthermore, application of natural manganese dioxide
ore (e.g., pyrolucite) as a great source of MnO2, is becoming more common recently.
2.3.2.2 Effect of surface manganese oxide coating level on manganese removal
Although manganese oxide coating changes physical appearance and color of a filter media, it does
not alter the size, shape and density of the media and, hence, the hydraulic behavior of the filter
during filtration or backwashing (Hargette and Knocke, 2001). The specific concentration of
manganese oxide coating on the media (mg Mn/g media) has a significant impact on the Mn(II)
uptake capacity (Islam et al., 2010). The Mn(II) adsorption breakthrough curves for four media
having different manganese oxide coating levels were depicted in Figure 2.3 (Knocke et al., 1990b).
From this figure, the media with the greatest manganese coating level (42 mg/g media) possessed
a considerably greater Mn(II) uptake capacity. In addition, it has been shown that a lower Mn(II)
uptake capacity under lower pH conditions can be compensated by a larger amount of coating on
the media (Knocke et al., 1990b). Thus, water with a pH value of < 7.0 could be effectively treated
applying media with high coating levels. The importance of coating level is more significant when
the water to be treated contains greater amounts of soluble Mn(II).
According to the above mentioned discussion, the Mn(II) uptake capability of media generally
increase with increasing manganese oxide coating level. However, some instances revealed that
media containing higher manganese oxide coating level do not necessarily exhibit greater Mn(II)
uptake capacity (Islam et al., 2010). One possibility is related to the oxidation state of the
manganese oxide coating since it varies between MnOOH(s) (Mn(III)) and MnO2(s) (Mn(IV))
(Cerrato et al., 2010; Cerrato et al., 2011). Highly oxidized forms of MnOx(s) (MnO1.8(s) – MnO2(s))
coating have increased Mn(II) removal capacity (Knocke et al., 1990b). The other possibility is, as
the MnOx(s) coating level increases, some of the coatings are deep enough and supports the
hypothesis that only readily accessible adsorption sites contribute to the NGE process (Islam et al.,
2010).
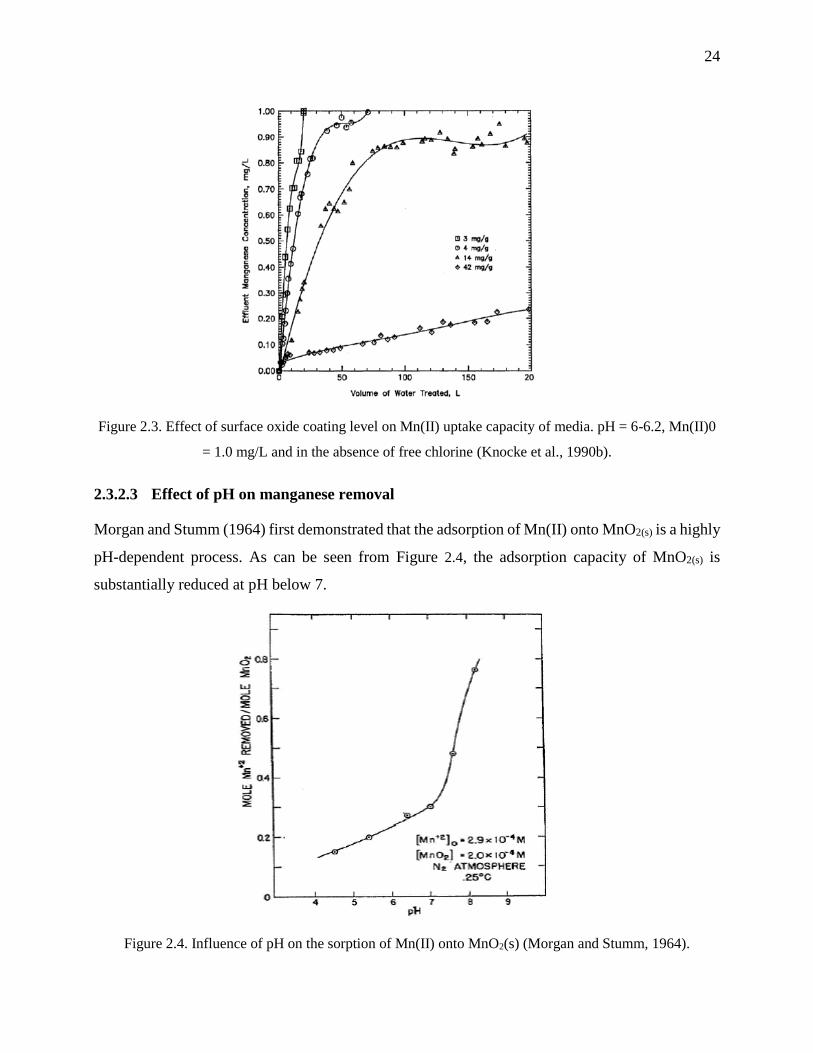
24
Figure 2.3. Effect of surface oxide coating level on Mn(II) uptake capacity of media. pH = 6-6.2, Mn(II)0
= 1.0 mg/L and in the absence of free chlorine (Knocke et al., 1990b).
2.3.2.3 Effect of pH on manganese removal
Morgan and Stumm (1964) first demonstrated that the adsorption of Mn(II) onto MnO2(s) is a highly
pH-dependent process. As can be seen from Figure 2.4, the adsorption capacity of MnO2(s) is
substantially reduced at pH below 7.
Figure 2.4. Influence of pH on the sorption of Mn(II) onto MnO2(s) (Morgan and Stumm, 1964).

25
Later, the same results were obtained by Knock et al. (1990b), as illustrated in Figure 2.5. This was
attributed to the changes in the surface charge of the MnOx(s) due to pH changes. As the solution
pH increases, the oxide surface charge become increasingly more negative (Knocke et al., 1990b;
Hu et al., 2004). This lead to both an increase in Mn(II) adsorption rate as well as an increase in
the adsorption capacity of manganese oxide due to the presence of more potential available sites
for Mn(II) uptake (Knocke et al., 1990b). In addition, at low pH values H+ ions may compete with
metal ions for the MnOx(s) adsorption sites and render a decreased removal of Mn(II) (Lee et al.,
2004). Desorption of Mn(II) from the MnOx(s) coating is more prevalent under lower pH conditions.
Likewise, similar results have been found for the effect of pH in the CR process with the addition
of free chlorine (Tiwari et al., 2007; Lee et al., 2009; Cerrato et al., 2011).
Figure 2.5. Effect of pH on Mn(II) uptake capacity of media: manganese oxide coating = 3 mg Mn/g
media , Mn(II)0 = 1.0 mg/L and in the absence of free chlorine (Knocke et al., 1990b).
Although higher pH value increases the adsorption capacity of MnOx(s), it might reduce the overall
process performance in the presence of free chlorine. Hargette and Knocke (2001) revealed higher
manganese removal at pH 6.0 (99.5%) than pH 7.3 (98.5%). This is attributed to the higher amount
of solution phase particulate manganese formation under higher pH, which was hardly removed by
filtration. Consequently, around 6% and 1.5% of Mn(II) was oxidized by chlorine prior to filtration
at pH 7.3 and 6.0, respectively. In conclusion, it seems that further investigations must be conducted
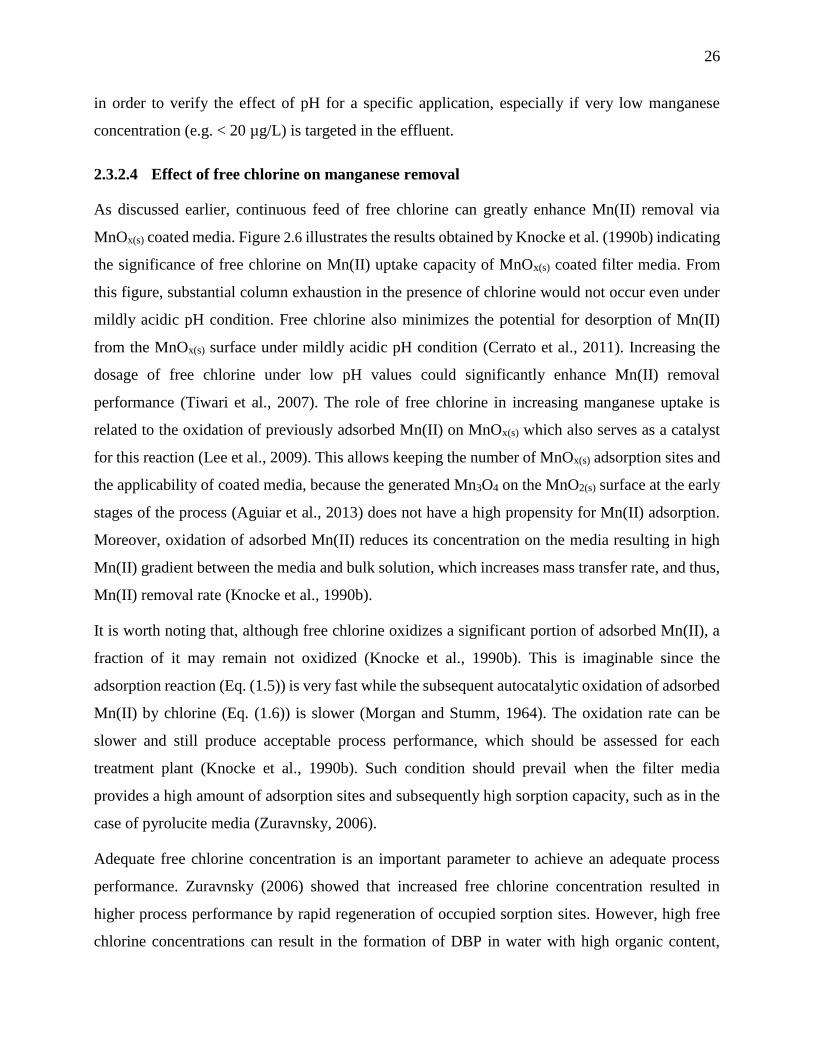
26
in order to verify the effect of pH for a specific application, especially if very low manganese
concentration (e.g. < 20 µg/L) is targeted in the effluent.
2.3.2.4 Effect of free chlorine on manganese removal
As discussed earlier, continuous feed of free chlorine can greatly enhance Mn(II) removal via
MnOx(s) coated media. Figure 2.6 illustrates the results obtained by Knocke et al. (1990b) indicating
the significance of free chlorine on Mn(II) uptake capacity of MnOx(s) coated filter media. From
this figure, substantial column exhaustion in the presence of chlorine would not occur even under
mildly acidic pH condition. Free chlorine also minimizes the potential for desorption of Mn(II)
from the MnOx(s) surface under mildly acidic pH condition (Cerrato et al., 2011). Increasing the
dosage of free chlorine under low pH values could significantly enhance Mn(II) removal
performance (Tiwari et al., 2007). The role of free chlorine in increasing manganese uptake is
related to the oxidation of previously adsorbed Mn(II) on MnOx(s) which also serves as a catalyst
for this reaction (Lee et al., 2009). This allows keeping the number of MnOx(s) adsorption sites and
the applicability of coated media, because the generated Mn3O4 on the MnO2(s) surface at the early
stages of the process (Aguiar et al., 2013) does not have a high propensity for Mn(II) adsorption.
Moreover, oxidation of adsorbed Mn(II) reduces its concentration on the media resulting in high
Mn(II) gradient between the media and bulk solution, which increases mass transfer rate, and thus,
Mn(II) removal rate (Knocke et al., 1990b).
It is worth noting that, although free chlorine oxidizes a significant portion of adsorbed Mn(II), a
fraction of it may remain not oxidized (Knocke et al., 1990b). This is imaginable since the
adsorption reaction (Eq. (1.5)) is very fast while the subsequent autocatalytic oxidation of adsorbed
Mn(II) by chlorine (Eq. (1.6)) is slower (Morgan and Stumm, 1964). The oxidation rate can be
slower and still produce acceptable process performance, which should be assessed for each
treatment plant (Knocke et al., 1990b). Such condition should prevail when the filter media
provides a high amount of adsorption sites and subsequently high sorption capacity, such as in the
case of pyrolucite media (Zuravnsky, 2006).
Adequate free chlorine concentration is an important parameter to achieve an adequate process
performance. Zuravnsky (2006) showed that increased free chlorine concentration resulted in
higher process performance by rapid regeneration of occupied sorption sites. However, high free
chlorine concentrations can result in the formation of DBP in water with high organic content,
27
which is often a concern in surface water applications. Therefore, water utilities should optimize
their treatment train design.
Figure 2.6. Effect of pre-filter chlorination on Mn (II) uptake capacity of media: manganese oxide coating
level = 18 mg Mn/g media, Mn(II)0 = 1.0 mg/L and at pH = 6-6.2 (Knocke et al., 1990b).
2.3.2.5 Effect of NOM on manganese removal
NOM can impact Fe(II) and Mn(II) removal in three ways: 1) it can exert additional oxidant
demand, 2) it can form complexes with Fe(II) and Mn(II), and 3) it can impact adsorption of Mn(II)
onto MnOx(s) coated filter media. Tobiason et al. (2008) revealed that the Mn(II) uptake capacity
of MnOx(s) decreased with increasing NOM concentration in water. This might be attributed to the
possible capability of MnOx(s) to adsorb NOM which, consequently, decreases the number of
available sorption site for Mn(II) uptake (Tobiason et al., 2008). Another possible explanation is
that a complexation reaction between Mn(II) and NOM took place and MnOx(s) surface was unable
to adsorb the complex and thus the Mn(II) removal performance decreased (Tobiason et al., 2008).
As previously stated, the main concern regarding to NOM is its role on the formation of halogenated
DBPs in CR with chlorine. One possibility to minimize the formation of these by-products is
moving the chlorine injection point from pre-filtration to post-filtration. Thus, a treatment train
containing second stage contactors whose sole purpose is Mn(II) sorption and catalytic oxidation
28
by free chlorine can be utilized, as described in a previous section (Knocke et al., 2010; Bazilio et
al., 2016).
2.3.2.6 Effect of HLR, feed Mn concentration and temperature on manganese removal
HLR impacts the process performance in two ways. On one hand, increasing the HLR increases
the mass transfer coefficient and hence the adsorption rate, which changes Mn(II) removal profile
(Merkle et al., 1997). On the other hand, high HLR results in low contact time and increases the
amount of Mn(II) loaded to the system. Zuravnsky (2006) showed that an increase in HLR (from
16 to 20 gpm/ft2) had a negative impact on Mn(II) removal (15% reduction in process
performance). This implies that increase in adsorption rate at higher HLR was not enough to
compensate the reduced contact time and higher loading rate of Mn(II). In addition, elevated HLR
results in more rapid head loss build up, and subsequently, more frequent backwashes are required.
Although Mn(II) uptake capacity increases with increasing feed concentration, Tobiason et al.
(2008) showed that breakthrough occurs earlier under higher initial Mn(II) concentrations as this
makes the IR process to be inapplicable even at Mn(II) level of 0.4 mg/L. They also revealed that
even in CR mode using pyrolucite, increasing the concentration of Mn(II) from 0.035 to 0.107
mg/L resulted in 10% reduction in the process performance. This reduction was more significant
for a MnOx(s) coated sand media than for pyrolucite.
Effect of temperature on the sorption of Mn(II) onto MnOx(s)-coated filter media has not been well
documented. Since adsorption onto MnO2(s) was expressed as an endothermic process (Ren et al.,
2011), Mn(II) uptake capacity of MnOx(s)-coated media is expected to increase under elevated
temperatures. In addition to the effect of temperature on manganese sorption, it can also affect
manganese removal in CR process with increasing solution oxidation of Mn(II) by free chlorine
under elevated temperatures (e.g., 25oC vs. 10oC). Hence, the process performance might be
reduced due to the formation of colloidal MnO2, especially, under high feed Mn(II) concentrations,
which can be hardly removed through sand filtration. As a conclusion, temperature provides both
detrimental and beneficial impacts depending on the process conditions.
In summary, the significance of chlorine, pH, and oxide coating level on Mn(II) uptake capacity is
related to their impacts on maintaining an appropriate number of MnOx(s) adsorption sites. Hence,
the amount of available adsorption sites on the media plays a key role on Mn(II) removal efficiency
within the filter. These adsorption sites can be used effectively through fluidized bed contactor
29
since adsorption is faster under fluidization state than for a fixed bed state owing to a better fluid-
solid contact.
2.3.2.7 Effect of operation mode (fixed bed vs. fluidized bed state) on manganese removal
Fixed and fluidized beds are two common continuous adsorption contactor configurations. In the
scientific literature, fixed bed contactor, in which the flow is directed downward, has been most
commonly used for iron and manganese removal. In contrast, fluidized bed contactor, in which the
fluid is forced through the filter media in upward direction at a velocity sufficiently high to fluidize
the media, has been reported to effectively remove elevated concentrations of heavy metals
(Nielsen et al., 1997) such as copper (Lee et al., 2004) and manganese (Takizawa et al., 2001) ions
within a filter containing MnOx(s) coated sand and tubular polypropylene, respectively.
In fixed bed configuration, rapid head loss buildup limited the catalytic filtration of Mn(II) to
relatively low HLRs (6-12 m/h) (Hargette and Knocke, 2001; Yang et al., 2008; Piispanen and
Sallanko, 2010). Therefore, the size of contactor should be large enough to provide the required
flow, and frequent backwash is required, which resulted in a large amount of wastewater production
and high energy expenses. More recently, Knocke et al. (2010) applied high HLR (40-50 m/h or
16-20 gpm/ft2) in a post-filtration sorptive contactor intended for surface water applications.
However, in these experiments the initial manganese concentration was very low (< 0.1 mg/L) and
the filter contained large-sized pyrolucite (2.0-2.4 mm diameter) (low specific surface area) that
allowed working at high HLR in fixed bed state. However, even in this case where very low
turbidity (< 0.1 NTU) were filtered, head loss accumulation (20 kPa) was observed due to the
blockage of column void space, requiring backwash of the column every other two months
(Subramaniam, 2010).
In fixed bed operation a portion of adsorption sites are lost due to the stationary state of the system
in which particles support themselves to stay at this condition while this is a rather negligible issue
when the bed is fluidized and nearly all adsorption sites are available (Lee et al., 2004). In addition,
a uniform particle mixing and mass transfer rate are achieved which results in a uniform product
and also higher efficiency due to better water-solid contact (Bošković-Vragolović et al., 2009).
Furthermore, a lower susceptibility to plugging is another advantage of fluidized bed over fixed
bed that allows operating continuously with a constant head loss independent of the fluid velocity.
As a consequence, it permits working at higher HLRs (> 25 m/h) compared to fixed bed (< 12 m/h)
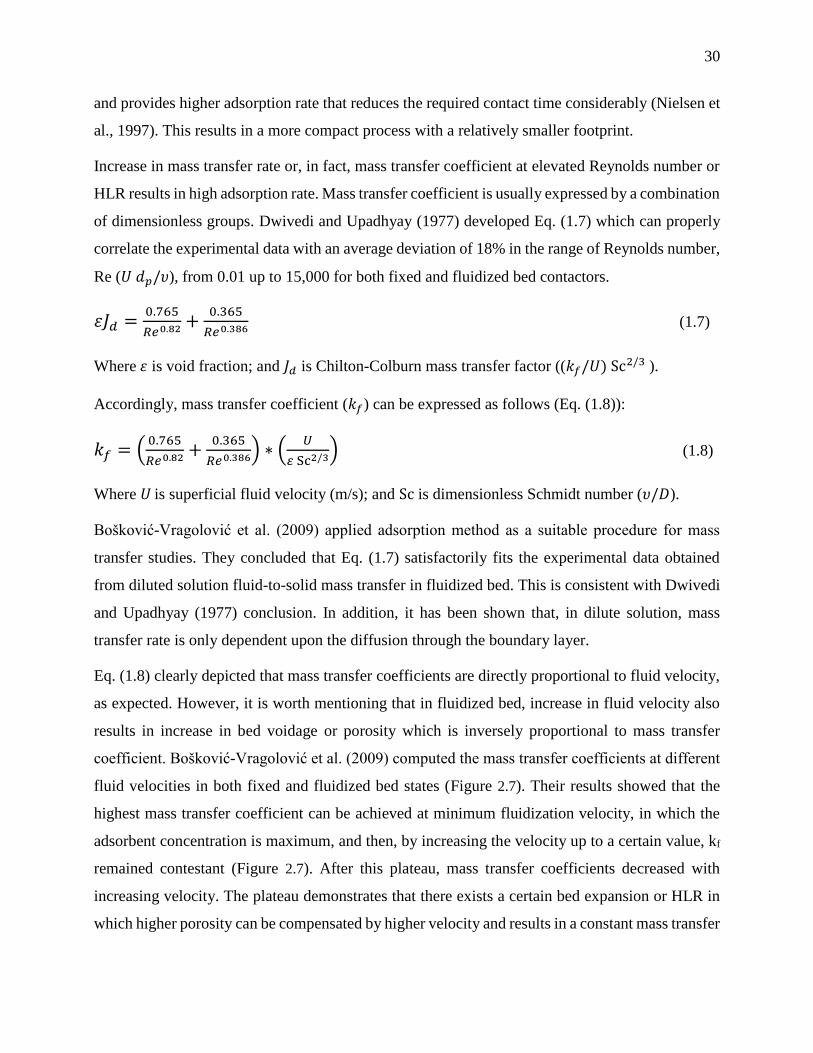
30
and provides higher adsorption rate that reduces the required contact time considerably (Nielsen et
al., 1997). This results in a more compact process with a relatively smaller footprint.
Increase in mass transfer rate or, in fact, mass transfer coefficient at elevated Reynolds number or
HLR results in high adsorption rate. Mass transfer coefficient is usually expressed by a combination
of dimensionless groups. Dwivedi and Upadhyay (1977) developed Eq. (1.7) which can properly
correlate the experimental data with an average deviation of 18% in the range of Reynolds number,
Re (𝑈 𝑑𝑝/𝜐), from 0.01 up to 15,000 for both fixed and fluidized bed contactors.
휀𝐽𝑑 =0.765
𝑅𝑒0.82+
0.365
𝑅𝑒0.386 (1.7)
Where 휀 is void fraction; and 𝐽𝑑 is Chilton-Colburn mass transfer factor ((𝑘𝑓/𝑈) Sc2/3 ).
Accordingly, mass transfer coefficient (𝑘𝑓) can be expressed as follows (Eq. (1.8)):
𝑘𝑓 = (0.765
𝑅𝑒0.82+
0.365
𝑅𝑒0.386) ∗ (𝑈
Sc2/3) (1.8)
Where 𝑈 is superficial fluid velocity (m/s); and Sc is dimensionless Schmidt number (𝜐/𝐷).
Bošković-Vragolović et al. (2009) applied adsorption method as a suitable procedure for mass
transfer studies. They concluded that Eq. (1.7) satisfactorily fits the experimental data obtained
from diluted solution fluid-to-solid mass transfer in fluidized bed. This is consistent with Dwivedi
and Upadhyay (1977) conclusion. In addition, it has been shown that, in dilute solution, mass
transfer rate is only dependent upon the diffusion through the boundary layer.
Eq. (1.8) clearly depicted that mass transfer coefficients are directly proportional to fluid velocity,
as expected. However, it is worth mentioning that in fluidized bed, increase in fluid velocity also
results in increase in bed voidage or porosity which is inversely proportional to mass transfer
coefficient. Bošković-Vragolović et al. (2009) computed the mass transfer coefficients at different
fluid velocities in both fixed and fluidized bed states (Figure 2.7). Their results showed that the
highest mass transfer coefficient can be achieved at minimum fluidization velocity, in which the
adsorbent concentration is maximum, and then, by increasing the velocity up to a certain value, kf
remained contestant (Figure 2.7). After this plateau, mass transfer coefficients decreased with
increasing velocity. The plateau demonstrates that there exists a certain bed expansion or HLR in
which higher porosity can be compensated by higher velocity and results in a constant mass transfer

31
rate. The condition allows operating at higher velocity without reducing the mass transfer
coefficient or adsorption rate.
Figure 2.7. Effect of superficial fluid velocity on mass transfer coefficient in both fixed and fluidized bed
contactors (Bošković-Vragolović et al., 2009).
As an alternative to granular media filtration, membrane technology has been proposed more
recently to remove elevated levels of iron and manganese from groundwater. This treatment option
is discussed in the next section.
2.4 Membrane filtration
Compact membrane processes, such as MF and UF, are increasingly used in water treatment
facilities as an alternative process to conventional filtration for the removal of dilute suspensions
containing fine particles and colloids based on size exclusion.
Application of UF membranes, with nominal pore size ranging from approximately 1 to 100 nm,
are attractive for drinking water treatment because of:
32
Strict solid-liquid separation that can remove particulate and colloidal materials (Choo et
al., 2005) and macromolecular solutes (Choo et al., 2007). Thus, the treated water can meet
increasing stringent regulations on drinking water production;
Effective removal and control of the small pathogens such as protozoa and bacteria, and
viruses (Montgomery Watson Harza (MWH), 2005);
Limited use of chemicals;
Small footprint and compact systems;
Low sludge production;
Easy and convenient operation which guaranties a more constant quality of treated water,
regardless of the source water quality.
In addition, low pressure membranes (LPMs), MF/UF, are more economical than their high
pressure counterparts (nanofitration, NF, and reverse osmosis, RO). However, since MF and UF
membranes are microporous, dissolved inorganic constituents like metal ions cannot be removed
without the use of pretreatment processes such as a strong oxidation.
In spite of the above mentioned advantages, application of MF/UF membranes in water treatment
plants is still limited. The major obstacle facing this process is the decrease in membrane
productivity or increase in energy consumption due to so-called membrane fouling (Gao et al.,
2011). As opposed to surface water where organic fouling is dominant, management of inorganic
fouling caused by iron/manganese is of importance for many UF/MF groundwater systems.
This section first provides background information on rejection and fouling mechanisms. Finally,
it contains a review of literatures related to the removal of iron and manganese by LPMs.
2.4.1 Membrane rejection mechanisms
The pressure difference between the feed and permeate side (TMP gradient) is the driving force to
transport water through LPMs. Particles and some dissolved compound are partially retained
dependent upon their size, shape and charge. The rejection efficiency (R) for a given compound is
expressed as follows:
𝑅 = (1 −𝐶𝑃
𝐶𝐹) × 100 (1.9)
Where CP and CF are concentrations of a component in permeate and feed water, respectively.
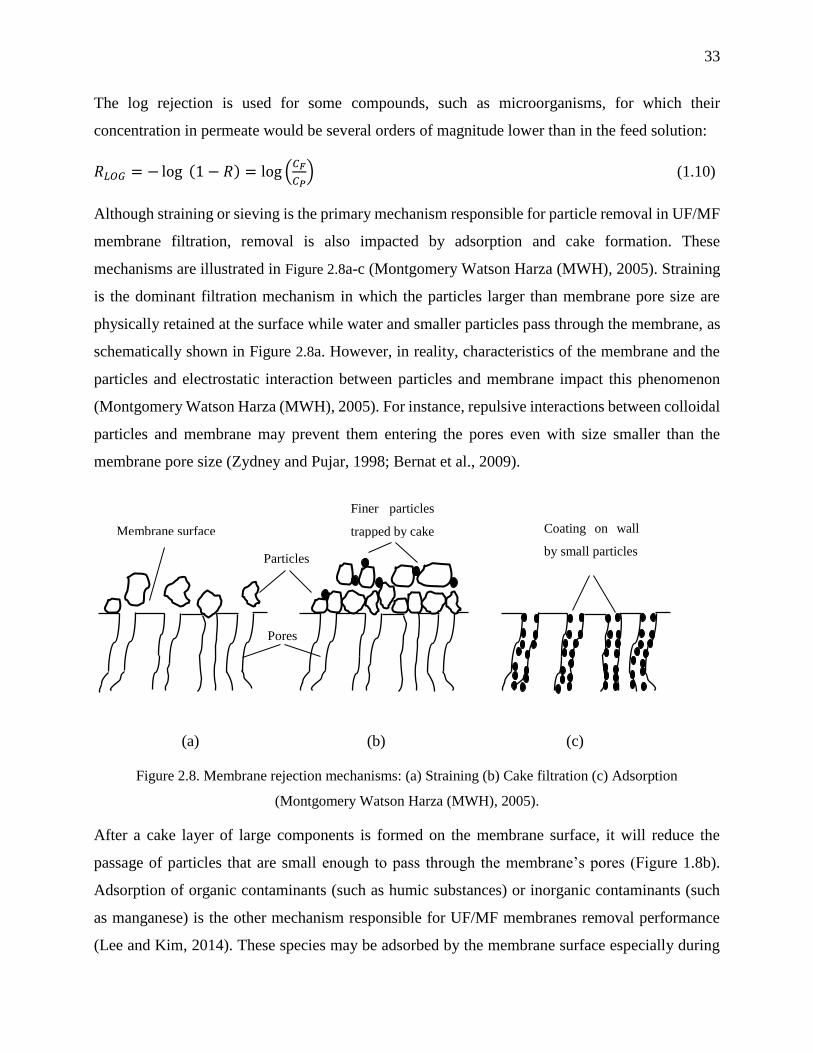
33
The log rejection is used for some compounds, such as microorganisms, for which their
concentration in permeate would be several orders of magnitude lower than in the feed solution:
𝑅𝐿𝑂𝐺 = − log (1 − 𝑅) = log (𝐶𝐹
𝐶𝑃) (1.10)
Although straining or sieving is the primary mechanism responsible for particle removal in UF/MF
membrane filtration, removal is also impacted by adsorption and cake formation. These
mechanisms are illustrated in Figure 2.8a-c (Montgomery Watson Harza (MWH), 2005). Straining
is the dominant filtration mechanism in which the particles larger than membrane pore size are
physically retained at the surface while water and smaller particles pass through the membrane, as
schematically shown in Figure 2.8a. However, in reality, characteristics of the membrane and the
particles and electrostatic interaction between particles and membrane impact this phenomenon
(Montgomery Watson Harza (MWH), 2005). For instance, repulsive interactions between colloidal
particles and membrane may prevent them entering the pores even with size smaller than the
membrane pore size (Zydney and Pujar, 1998; Bernat et al., 2009).
(a) (b) (c)
Figure 2.8. Membrane rejection mechanisms: (a) Straining (b) Cake filtration (c) Adsorption
(Montgomery Watson Harza (MWH), 2005).
After a cake layer of large components is formed on the membrane surface, it will reduce the
passage of particles that are small enough to pass through the membrane’s pores (Figure 1.8b).
Adsorption of organic contaminants (such as humic substances) or inorganic contaminants (such
as manganese) is the other mechanism responsible for UF/MF membranes removal performance
(Lee and Kim, 2014). These species may be adsorbed by the membrane surface especially during
Finer particles
trapped by cake Coating on wall
by small particles Particles
Membrane surface
Pores
34
the early stage of filtration cycle. However, since the adsorption capacity is quickly exhausted, it
is not an effective mechanism in long term operation. As the filtration cycle progress, contaminants
can be adsorbed inside the cake layer. As can be seen in Figure 1.8c, adsorbed materials may reduce
the pore size of membrane and increase the rejection of small particles (Montgomery Watson Harza
(MWH), 2005). In conclusion, the efficiency of cake filtration and adsorption mechanisms vary
during the filtration cycle.
2.4.2 Parameters impact initial membrane permeability
Flux at a given temperature, JT (m/s), which describes the filtration throughput, is defined as the
filtrate flow, Q (m3/s), per unit of membrane filtration area, A0 (m2). For porous membranes the
flux is directly proportional to the TMP, ∆𝑃0 (kPa), and inversely proportional to the absolute
viscosity of water, 𝜇 (kPa.s), as is described based on Darcy’s law:
𝐽𝑇 =𝑄
𝐴0=
∆𝑃0
𝜇∗𝑅𝑚 (1.11)
where Rm is the hydraulic resistance (m-1) of the clean membrane and is related to physical
properties of membrane, as follows (American Water Works Association, 2005):
𝑅𝑚 =8∗𝜏∗∆𝑧
𝜋∗𝑟4∗𝑃𝑝𝑜𝑟𝑒 (1.12)
where the pore density, Ppore, is the number of pores per unit of membrane area; r is the pore radius
(m); 𝜏 is the tortuosity factor; and ∆z is the pore length (m). However, for a typical membrane, Rm
is commonly calculated from laboratory experiments employing Eq. (1.11).
Obviously, from Eq. (1.11), temperature has a significant impact on flux through viscosity, which
decreases with increasing temperature. Thus, to eliminate the impact of temperature on flux,
normalized flux at a reference temperature, 20oC, has been applied using an empirical relationship
as follows (United States Environmental Protection Agency (USEPA), 2005):
𝐽20 =𝐽𝑇∗ 𝜇𝑇
𝜇20= 𝐽𝑇 ∗ [1.784 − 0.0575 ∗ 𝑇 + 0.0011 ∗ 𝑇2 − 10−5 ∗ 𝑇3] (1.13)
where J20 is the flux at 20oC; and 𝜇𝑇 and 𝜇20 are dynamic viscosity of water at temperature T and
20oC, respectively.
The change in membrane productivity is generally identified by variations in the pressure-
normalized flux or specific flux, JS, which is the flux at 20oC (J20) divided by the TMP (Eq. (1.14)).
35
The specific flux is called membrane permeability when clean water is passed through the
membrane (Montgomery Watson Harza (MWH), 2005).
𝐽𝑆 =𝐽20
∆𝑃 (1.14)
It is worth noting that, in addition to temperature, the initial membrane permeability might be also
impacted by pH, ionic strength and valency of the solute (Braghetta et al., 1997; Ito et al., 1992;
Zhao et al., 2005; Nilsson et al., 2008). This is attributed to the electro-viscous effect that occurs
due to the passage of an electrolyte solution through capillaries with charged surface, because the
surface moves the ions away from their preferred place resulting in extra required energy and thus
higher apparent viscosity (Huisman et al., 1997). Zhao et al. (2005) showed that the permeability
of 𝛼-alumina (𝛼-Al2O3) MF membrane is strongly affected by the zeta potential of the membrane
surface, which is determined by the solution pH and ionic strength. They found that low pH values
and high ionic strength led to low zeta potential or membrane surface charge and, consequently,
the permeability increased due to the decrease in electro-viscous effects. The same results were
reported for the permeability of zirconia (ZrO2) UF membrane (Faibish et al., 1998). However, in
polymeric membranes, which have slightly compressible characteristics in contrast to the rigid
nature of ceramic membranes, both the electro-viscous effects and the membrane pore size
variations account for the reported changes in membrane permeability (Zhao et al., 2011). In some
cases, compaction of membrane matrix under low pH and/or high ionic strength and, thus,
reduction of the membrane pore size has greater impact on permeability (Braghetta et al., 1997;
Zhao et al., 2011; Mänttäri et al., 2006) than the electro-viscous effects. In addition, extension of
chains in grafted polymeric membranes (e.g., polyvinylidene fluoride (PVDF) membrane grafted
with poly-acrylic acid (PAA)) under high pH and/or low salt concentration led to blockage of the
pores and reduction of membrane permeability (Kontturi et al., 1996). In summary, it is important
that the initial membrane permeability be defined using the waters under investigation without
particles rather than only ultrapure water.
2.4.3 Membrane fouling
One of the critical issues for applying LPMs technology in water treatment is the loss of membrane
permeability, flux decline or increase in TMP, due to the adsorption or deposition of rejected
species on the membrane surface or within the membrane pores. This phenomenon is termed
36
membrane fouling and characterized as reversible or irreversible. Reversible fouling can be
removed by backwashing, termed physically reversible, or chemical cleaning, termed chemically
reversible. Irreversible fouling reduces the membrane lifetime. Frequent chemical cleaning may
also lead to a shorten membrane lifetime (Li et al., 2014). Fouling, whether reversible or
irreversible, exerts additional cost for industries due to the higher energy and chemical consumption
as well as membrane replacement. Several factors impact the extent of membrane fouling such as
membrane characteristics (e.g., material, hydrophobicity, pore size and surface charge), operational
conditions (e.g., TMP, flux and flow mode) and physicochemical properties of feed water (Guo et
al., 2012).
Pressure-driven membranes has been traditionally fabricated from polymers, such as PVDF and
polyethersulfone (PES). However, recently, application of ceramic membranes, such as A12O3,
ZrO2, titania (TiO2) and silicon carbide (SiC), has been receiving growing attention due to their
inherent advantages over conventional polymeric membranes. Namely, ceramic membranes offer
superior chemical, thermal and mechanical stability allowing much more aggressive physical and
chemical cleaning approaches which can prolong membrane lifespan. In addition, the higher
integrity and reliability of ceramic membranes would reduce the repetitive testing, repair and
replacement of membrane modules leading to savings in operation cost (Pendergast and Hoek,
2011). Moreover, ceramic membranes may have a lower fouling potential because of their higher
hydrophilicity compared to polymeric membranes (Hofs et al., 2011). In order to increase the
hydrophilicity of the polymeric membranes, a blend of polyvinylpyrrolidone (PVP) and a polymer
is commonly used (Van Der Bruggen et al., 2003). Electrostatic charge at the membrane surface is
also important for fouling management. More severe fouling can be found when membrane surface
and suspensions carry opposite charges because of electro-sorption of the foulant on the membranes
(Zuo and Wang, 2013).
Membrane fouling is also impacted by the flow regime near the membrane surface. Two operating
configurations, cross-flow filtration and dead-end or direct filtration, have been developed. In
cross-flow filtration, a portion of feed water is recycled at a high velocity, typically 0.5 to 1 m/s.
This high velocity tangential flow to the membrane surface creates a shear force and turbulence
that diminishes the development of cake layer on the membrane surface. In dead-end filtration
mode, all feed water passes through the membrane. Therefore, suspensions larger than the
membrane pore size accumulate on its surface resulting in a greater permeability decline compared
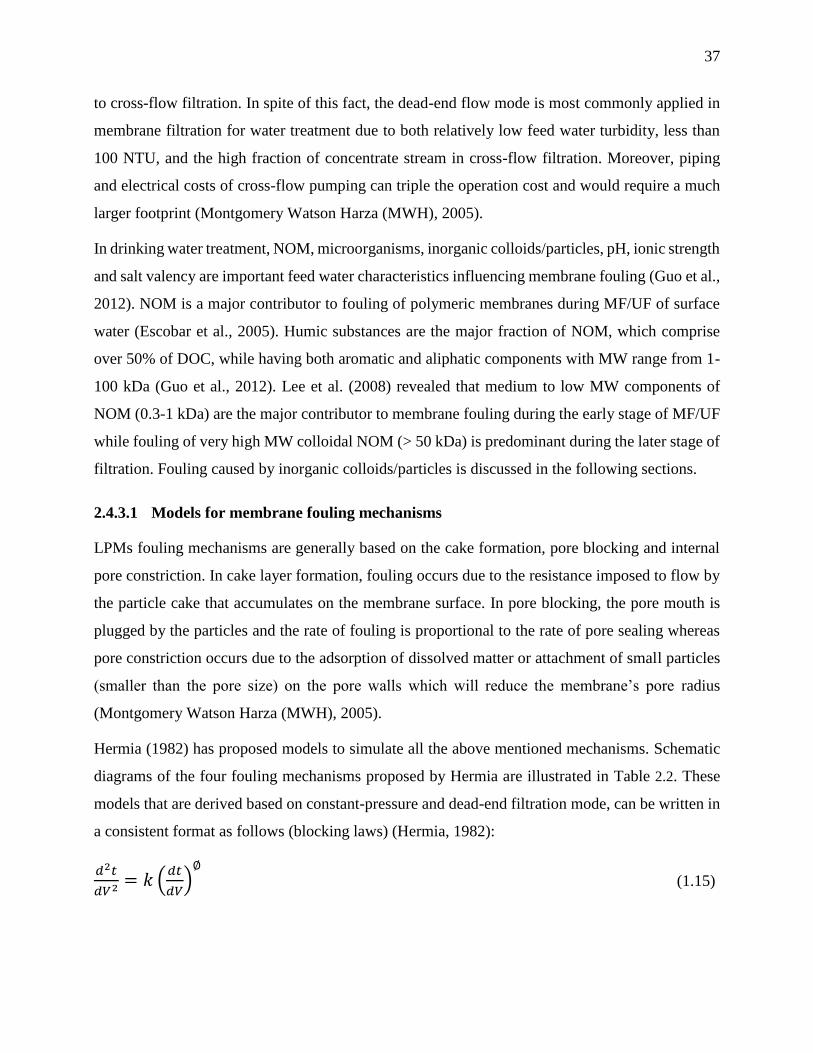
37
to cross-flow filtration. In spite of this fact, the dead-end flow mode is most commonly applied in
membrane filtration for water treatment due to both relatively low feed water turbidity, less than
100 NTU, and the high fraction of concentrate stream in cross-flow filtration. Moreover, piping
and electrical costs of cross-flow pumping can triple the operation cost and would require a much
larger footprint (Montgomery Watson Harza (MWH), 2005).
In drinking water treatment, NOM, microorganisms, inorganic colloids/particles, pH, ionic strength
and salt valency are important feed water characteristics influencing membrane fouling (Guo et al.,
2012). NOM is a major contributor to fouling of polymeric membranes during MF/UF of surface
water (Escobar et al., 2005). Humic substances are the major fraction of NOM, which comprise
over 50% of DOC, while having both aromatic and aliphatic components with MW range from 1-
100 kDa (Guo et al., 2012). Lee et al. (2008) revealed that medium to low MW components of
NOM (0.3-1 kDa) are the major contributor to membrane fouling during the early stage of MF/UF
while fouling of very high MW colloidal NOM (> 50 kDa) is predominant during the later stage of
filtration. Fouling caused by inorganic colloids/particles is discussed in the following sections.
2.4.3.1 Models for membrane fouling mechanisms
LPMs fouling mechanisms are generally based on the cake formation, pore blocking and internal
pore constriction. In cake layer formation, fouling occurs due to the resistance imposed to flow by
the particle cake that accumulates on the membrane surface. In pore blocking, the pore mouth is
plugged by the particles and the rate of fouling is proportional to the rate of pore sealing whereas
pore constriction occurs due to the adsorption of dissolved matter or attachment of small particles
(smaller than the pore size) on the pore walls which will reduce the membrane’s pore radius
(Montgomery Watson Harza (MWH), 2005).
Hermia (1982) has proposed models to simulate all the above mentioned mechanisms. Schematic
diagrams of the four fouling mechanisms proposed by Hermia are illustrated in Table 2.2. These
models that are derived based on constant-pressure and dead-end filtration mode, can be written in
a consistent format as follows (blocking laws) (Hermia, 1982):
𝑑2𝑡
𝑑𝑉2= 𝑘 (
𝑑𝑡
𝑑𝑉)
∅ (1.15)

38
where t (s) is the filtration time; and V (m3) is cumulative permeate volume; k and ∅ are two model
parameters that their values depend on the fouling mechanism.
Although the majority of studies have delineated membrane fouling during constant TMP,
membranes employed in water and wastewater treatment are commonly operated at constant flux
mode and the data obtained from constant TMP experiments could not well predict the rate and
extent of fouling in full-scale plant (Chellam and Xu, 2006). In this regard, the blocking laws model
has been revised for constant flux membrane filtration (Eq. (1.16)) (Huang et al., 2008b):
𝑑𝑃′
𝑑𝑉𝑠= 𝑘𝑣𝑃′𝑛1 (1.16)
where 𝑃′ is the TMP normalized to its initial value (∆𝑃0), Vs is the volume of permeate per unit
membrane area (m3/m2), and kv and n1 are model parameters representing blocking index and
blocking constant, respectively. The blocking law exponent for incompressible cake formation,
intermediate blocking, standard blocking and complete blocking is 0, 1, 1.5 and 2, respectively.
However, fouling of many “real world” materials such as natural colloidal matter and microbial
cells can be described by compressible cake formation. The blocking law model for compressible
cake formation is delineated in the next section.
Table 2.2. Schematic diagrams of fouling mechanisms proposed by Hermia (1982).
Mechanisms Concept Description
Cake formation
𝑑𝑝𝑎𝑟𝑡𝑖𝑐𝑙𝑒 > 𝑑𝑝𝑜𝑟𝑒
Particles are retained due to sieving and
form cake on the surface.
Intermediate blocking
𝑑𝑝𝑎𝑟𝑡𝑖𝑐𝑙𝑒 ≈ 𝑑𝑝𝑜𝑟𝑒
Particles accumulate on each other and
seal membrane pores.
Standard blocking
𝑑𝑝𝑎𝑟𝑡𝑖𝑐𝑙𝑒 < 𝑑𝑝𝑜𝑟𝑒
Particles deposit on the internal pore
walls and decreasing the pore diameter.
Complete blocking
𝑑𝑝𝑎𝑟𝑡𝑖𝑐𝑙𝑒 ≈ 𝑑𝑝𝑜𝑟𝑒
Particulates seal pores mouth and do not
accumulate on each other.
39
2.4.3.2 Fouling of inorganic colloids/particles
Particulate matter in water has been classified in the following categories (Rudolfs and Balmat,
1952 ): 1) settable solids (> 100 µm), 2) supra-colloidal solids (1-100 µm), 3) colloidal solids
(0.001-1 µm), and 4) dissolved solids (< 0.001 µm). Colloids/particles much larger than the
membrane pore size lead to cake formation that is easily removed by physical backwash while
those close to the size of membrane pores can cause pore blockage (Huang et al., 2008a). However
in both cases, cake filtration mechanism can most commonly describe the pressure increase and
membrane fouling at the later stage of filtration (Lim and Bai, 2003). Inorganic colloids in natural
waters such as clay particles are commonly larger than the membrane pore size and hence collect
on the membrane surface leading to the formation of a multilayered cake. According to the Darcy’s
law, the flow through the fouled membrane can be written as:
𝑄 =∆𝑃 𝐴0
𝜇∗(𝑅𝑐 + 𝑅𝑚) (1.15)
where Rc (m-1) is the additional resistance due to the cake formation. Moreover, in the presence of
other resistances, such as concentration polarization and internal pore fouling, they can be also
included in this equation. For an incompressible cake composed of monodisperse spherical
particles, the cake layer resistance can be computed applying Carman-Kozeny equation:
𝑅𝑐 =180 (1− )2 𝛿𝑐
3 𝑑𝑝2 (1.16)
where dp is the retained particle diameter (m); and 휀 and 𝛿𝑐 are the porosity and thickness of the
filter cake, respectively.
In dead-end filtration mode, the thickness of the cake layer as a function of time can be derived as
follows using the mass balance of particle toward the membrane surface:
𝛿𝑐(𝑡) =𝑐𝑏 𝑉
𝜌𝑝 𝐴0 (1− ) (1.17)
where bc is the bulk concentration (kg/m3); and 𝜌𝑝 is the density of deposited particles (kg/m3)
(Montgomery Watson Harza (MWH), 2005).
The cake layer resistance can be also expressed in terms of the average specific cake resistance,
aveα (m/kg), as follows:

40
𝑅𝑐 = 𝛼𝑎𝑣𝑒 𝑐𝑏 𝑉𝑠 (1.18)
Eq. (1.19) was derived from the combination of Eqs. (1.11), (1.15) and (1.18) that expresses the
increase in TMP at constant flux during incompressible cake filtration, in which the specific cake
resistance remains constant throughout the experiment.
∆𝑃 =𝑄 𝜇(𝛼 𝑐𝑏𝑉𝑠+𝑅𝑚)
𝐴0= ∆𝑃0 +
𝑄 𝜇 𝛼 𝑐𝑏
𝐴0𝑉𝑠 (1.19)
However, the filter cake of many natural materials, such as clays, microbial cells and flocculated
colloidal maters, is compressible to some degree (Chellam and Xu, 2006; Singh and Song, 2006).
Under this condition, after initial deposition of a cake layer and increase in TMP, a compact skin
layer is formed next to the membrane surface, which gradually develops during the filtration period.
Thus, the specific cake resistance gradually increases. During water and wastewater treatment, the
specific cake resistance, α (m/kg), often increases according to a power law (Chellam and Xu,
2006; Chellam et al., 1998; Sørensen and Sorensen, 1997):
𝛼 = 𝛽∆𝑃𝑛, (1.20)
where β (m/kg/kPan’) and 'n are empirical constants. β is related principally to the size and shape
of the particles, and the dimensionless parameter 'n is the cake compressibility coefficient varying
from zero for an incompressible cake to nearly 1 for a highly compressible cake. Substituting Eq.
(1.20) in Eq. (1.19) gives rise to the following equation, which was derived by Chellam and Xu
(2006):
∆𝑃 = ∆𝑃0 +𝑄 𝜇 𝑐𝑏
𝐴0𝛽 ∆𝑃𝑛,
𝑉𝑠 (1.21)
Several studies have shown that, in addition to hydrodynamic operation conditions, productivity
during colloidal MF/UF is also governed by physicochemical properties of the feed water such as
pH, ionic strength, particle size distribution, shape, surface charge, fractal dimension and degree of
aggregation (Singh and Song, 2006; Santiwong et al., 2008; Lee et al., 2003; Tiller et al. 1987). All
of these parameters can alter the cake layer structure and its compressibility due to particle-particle
and membrane-particle interactions.
Elzo et al. (1998) studied the effect of pH and ionic strength on the membrane performance during
MF of 0.5 µm SiO2 particles. They found that under high pH and/or low ionic strength, the specific
cake resistance decreased, because the strong repulsion between the negatively charged particles
41
resulted in increase in cake layer porosity. This result is consistent with Faibish et al. (1998)
findings who investigated the UF of smaller SiO2 particles (47, 110 and 310 nm). In sharp contrast,
Zhao et al. (2005) found that under high pH and low ionic strength, fouling dramatically increased
during MF of TiO2 suspensions. This was attributed to the tendency of TiO2 particles to disperse
under high charge density. However, near the zero-point of charge, suspensions tended to aggregate
giving rise to the formation of a less compact cake with low resistance and high hydraulic
permeability. The incoherence between the fouling behavior of SiO2 and TiO2 particles might be
due to the non-flocculating character of SiO2 colloids (Zhao et al., 2005). In conclusion, if the
addition of salt and/or change in pH is not enough to destabilize the colloidal suspensions and
aggregation of particles does not occur, it will reduce the thickness of electrostatic diffuse layer
which result in a dense cake layer formation.
The influence of the aggregate fractal geometry has been reported as an important factor to explain
dead-end (Santiwong et al., 2008; Lee et al., 2003; Xu et al., 2011) as well as cross flow (Zhang et
al., 2010) filtration performances. Fractal dimension is a mathematical description of irregular
geometric aggregates which gives insight into the compactness of the aggregates. The high fractal
dimensions, values approaching 3, indicate compact nearly spherical aggregates, whereas more
amorphous and less compact aggregates have low fractal dimensions, values approaching 1. Zhang
et al. (2010) investigated the effect of particle size and fractal structure on critical flux (a flux below
which a decline in flux or an increase in TMP does not occur over time) and fouling mechanisms.
They found that critical flux increase with the particle size and fractal dimension. Lee et al. (2003)
and Santiwong et al. (2008) revealed that the filter cake composed of aggregates with large size
and low fractal dimension has high permeability, which impose low resistance to flow, due to the
high inter-aggregate and intra-aggregate porosity, respectively. Previous studies on SiO2 colloids
(Singh and Song, 2006) and TiO2 nanoparticles (Chowdhury et al., 2013) demonstrated that the
fractal dimensions may be impacted by the solution chemistry. For instance, the fractal dimensions
of these aggregates slightly increase with ionic strength due to the compression of the electrostatic
double layer.
In conclusion, several parameters may play a substantial role on the fouling of MF/UF membrane.
The significance of each parameter should be assessed during filtration of each specific component.
42
2.4.4 Iron and manganese removal by LPMs
LPMs cannot be used as standalone processes for removal of dissolved inorganic constituents such
as Fe(II) and Mn(II) ions. Therefore, peroxidation is required in order to remove these elements via
MF/UF membranes. Application of MF after oxidation by KMnO4 (Côté et al., 1998) and ClO2
(Schneider et al., 2001) was assessed to remove iron and/or manganese from water. Since sufficient
retention time was allocated to oxidize Mn(II) and Fe(II) by these strong oxidants, satisfactory
removal performance was achieved. Ellis et al. (2000) showed that the size distribution of oxidized
iron and manganese ranged between 1.5 and 50 µm, and, consequently, concluded that cake
formation is the dominant fouling mechanism responsible for the observed flux decline in MF
membrane. However, oxidation of Mn(II) is limited by several parameters that were extensively
described in the previous sections. Thus, this process might not be feasible for the treatment of
drinking water containing high levels of iron and manganese. In addition, colloidal manganese
oxide was reported to be the principal membrane foulant after NOM (Kaiya et al., 1996).
Choo et al. (2005) investigated the effect of prechlorination for Mn(II) and Fe(II) removal using
UF membrane. The iron removal was very rapid and reached around 100% with only a small dosage
of chlorine. However, only 80% of manganese was removed even with a chlorine dosage of around
200% of the stoichiometric requirement. Higher chlorine dosage did not increase manganese
removal but even led to more serious membrane fouling. The severe fouling during this process
was attributed to the slow oxidation rate of manganese by chlorine which may result in the
formation of colloidal manganese that can pass through the membrane pores. These colloids may
gradually grow in the pores and result in blockage of the pores during backwashing. Surprisingly,
backwash had detrimental effect in their process; however, they did not measure the particle size
distribution to support their hypothesis. Production of colloidal particles in this process (compared
to much larger oxidized particles reported by Ellis et al. (2000)) may have been related to the low
hardness of their raw water. Unfortunately, the hardness of the raw water, which can significantly
impact the particle size, was not reported in their study.
In order to reduce the fouling caused by manganese oxides, it has been proposed to conduct a
pretreatment process ahead of membrane filtration. Teng et al. (2001) studied the effect of stirred
reactor containing manganese coated sand on the removal of Mn(II) and mitigation of MF
membrane fouling. Although this hybrid process removed 95% of manganese at a pH of 9.3,
43
frequent regeneration was required due to the rapid exhaustion of manganese coated sand in the
absence of a strong oxidant. In addition, membrane fouling was only slightly alleviated compared
to the process without manganese coated sand. This might be due to the solution oxidation of
Mn(II) at high pH of 9.3 which cannot be adsorbed by manganese coated sand resulting in the
fouling of MF membrane. Takizawa et al. (2001) found that a fluidized bed contactor containing
tubular polypropylene as a manganese-oxidizing catalyst along with chlorine can effectively
remove manganese from water while preventing MF membrane fouling associated with
manganese. However, even in the presence of catalyst, relatively high retention time (more than 30
minutes at 30oC) is required. Moreover, they showed that fixed-bed biological pretreatment can
efficiently remove manganese and reduce membrane fouling (Takizawa et al., 2001). However, in
biological processes, the removal efficacy is highly affected by the hydraulic retention time and
raw water characteristics such as dissolved oxygen, pH, temperature, microbiological quality,
NOM, and manganese and/or iron concentrations. Furthermore, it has been shown that
simultaneous removal of Fe(II) and Mn(II) in a single bioreactor is not possible, unless it is
achieved in a process with extremely high retention time. The problem is more significant when
the water contains ammonia in addition to iron and manganese. Moreover, long start-up time
(several weeks or months) is the other drawback of the biological process (Gouzinis et al., 1998),
although this issue has been somewhat alleviated by seeding new filters using backwash waters
from other existing biological filters.
Rather than oxidation of Fe(II) and Mn(II), another pretreatment was tested based on the capability
of UF membranes to retain macromolecular solutes. In this regard, an extensive study was
conducted to remove Mn(II) from groundwater by UF membranes through the addition of chelating
PAA as a pretreatment (Choo et al., 2007; Han et al., 2005; 2007). Although this process was found
to be effective for removing 80% of manganese, the removal efficiency severely depended upon
the solution pH and the dosage of chelating polymers (PAA). The highest manganese removal
efficiency (80%) only occurred at pH 9.0 with COOH/Mn molar ratio of 100, because the potential
of Mn(II) to precipitate was higher under alkaline pH and more PAA-Mn complexes were created
at high COOH/Mn ratio. The flux rapidly declined as the solution pH increased due to the
deposition of manganese precipitates on the membrane surface and further flux decline was caused
by addition of elevated amount of PAA (COOH/Mn = 100). The cost of using such a large dosage
of PAA is another drawback of this procedure that prohibits its application in practice. Although
44
regeneration of the PAA via pH adjustment (pH 3.0) and UF membrane is accessible (Han et al.,
2005), reuse of PAA gradually decreased the removal efficiency. Moreover, it has been revealed
that calcium hardness had a great impact in manganese removal. Calcium ion, unlike magnesium
that had no effect on manganese removal, reduced manganese removal performance by competing
with manganese for the formation of metal-PAA chelates. Due to the inconveniences that were
listed above, even if this procedure would be practically usable, it could not be applied even for
water with moderate level of calcium.
Desalination membranes, such as NF and RO, can also be utilized to remove Fe(II) and Mn(II)
from water (Richards et al., 2011; Al-Rashdi et al., 2013). However, the retention of manganese
was found to be pH-dependent and the rejected species may be oxidized and precipitated on the
membrane surface giving rise to membrane fouling (Richards et al., 2011). Most NF/RO
membranes are commercialized as spiraled modules in which the fouling of the spacer by
particulate matter, including oxidized iron and manganese, must be limited. Although application
of NF and RO membranes for iron and manganese removal is uncommon, removal of these species
by desalination membranes may occur in conjunction with other solutes that the membranes were
designed to eliminate (e.g. hardness). Considering the higher costs of NF/RO application, it is not
advised to use desalination membranes if Fe/Mn removal is the only treatment goal.
45
CHAPTER 3 RESEARCH OBJECTIVES, HYPOTHESES, AND
METHODOLOGY
3.1 Critical review of previous research
Health concerns related to manganese intake from water ingestion on one hand, and the potential
for aesthetic issues as well as maintenance cost for cleaning water mains on the other hand, make
it desirable to minimize iron and manganese concentrations in drinking water. Based on the
literature review, the traditional removal strategy, which involves oxidation of iron and manganese
followed by removal of oxidized particles through depth filtration, is subject to the following
limitations:
Despite Fe(II) being readily oxidized by a weak oxidant such as oxygen, the direct oxidation
of Mn(II) is difficult to achieve and therefore requires the use of a strong oxidant such as
KMnO4;
Oxidation rate of Mn(II) strongly depends on feed water temperature, pH, initial
concentration of manganese and NOM;
Among the different strong oxidants, KMnO4 and ClO2 are generally argued to be the best
options for the direct oxidation of Mn(II). However, fluctuations in Fe(II) and Mn(II)
concentrations in raw water could limit the application of KMnO4 due to the possible escape
of KMnO4 residual into treated water and pink water formation. ClO2 dosage is limited due
to the formation of chlorite and chlorate as disinfection by-products. The later must also be
produced on-site;
Efficient removal of particulate manganese through depth filtration may not be achieved
due to the tendency of manganese to form negatively charged colloids via oxidation.
Biological oxidation is an attractive treatment option but its application in groundwaters with
elevated Mn(II) and Fe(II) concentrations must be done in two sequential reactors, a process
configuration which increases capital cost. Alternatively, application of LPMs has been proposed
more recently since they can properly remove particulate and colloidal materials as well as small
pathogens and viruses (only UF) through a more compact process while providing a stable process
performance. Thus, the treated water can meet the increasingly stringent drinking water regulations.
However, membrane fouling caused by oxidized iron and manganese, especially colloidal
46
manganese oxides, limits the application of this process. Therefore, developing a pretreatment
strategy, which can reduce the fouling rate of LPMs while providing an appropriate removal
performance is of great interest. In addition, based on the results found for other inorganic particles
(e.g., SiO2 and TiO2), the potential influence of water characteristics such as pH, ionic strength and
salt valency on the extent of fouling caused by ferric hydroxide and manganese dioxide particles is
anticipated to be important since these parameters could alter the particle size, charge and fractal
dimensions as well as the membrane permeability. However, the impact of these parameters on
ferric hydroxide and manganese dioxide particles characteristics has not been investigated, to the
best of our knowledge. Furthermore, although the majority of LPMs currently in operation in the
water industry are hollow fiber polymeric membranes or tubular ceramic membranes that are
operated in a constant-flux mode, most of the publications focused on the fouling behavior of a
simple flat-sheet membrane operating in a constant-pressure mode. However, these results are not
expected to predict correctly the fundamental features of the filter cake properties as well as the
rate and extent of fouling in full-scale plants. Consequently, understanding the characteristics and
behavior of ferric hydroxide and manganese dioxide particles deposition on a tubular ceramic and
hollow fiber polymeric UF/MF membranes while operating in a constant-flux mode is of interest
for their application for iron and manganese control in drinking water.
Removal of Mn(II) through NGE process, sorption of Mn(II) onto manganese oxide coated media
followed by catalytic oxidation of adsorbed manganese by chlorine, is an effective and economical
method which attracted much attention from researchers over the past decades. Nevertheless, the
process performance is strongly affected by the maintenance of available adsorption sites, which is
governed by the manganese oxide coating level, chlorine concentration and pH. In addition to these
parameters, HLR, temperature, calcium hardness, and initial Mn(II) concentration can further
influence the process performance. However, their impacts have not been extensively documented.
Moreover, in a continuous process, MnOx(s) coated sand has been solely packed in fixed-bed
configuration comprising the following inconveniences:
The adsorption sites cannot be used effectively due to the stationary state of the system;
Susceptibility to clogging and rapid head loss buildup usually limit the process to low HLR
with relatively high retention time;
Frequent backwash is required, which results in a large amount of wastewater production;
47
Poor fluid-solid contact and low HLR would result in relatively low mass transfer rate
compared to fluidized bed, a situation which could limit the fixed bed operation to fairly
low initial Mn(II) concentrations.
Accordingly, developing a process which can efficiently remove iron and manganese, from feed
water containing high levels of these minerals, below the target limit of 0.02 mg/L and be operated
at high HLR is of great interest. Operating at very high HLR would be beneficial for utilities since
it reduces the process footprint as well as the capital cost. In this regard, this research project will
evaluate the use of a hybrid process consisting of a PFB contactor followed by a UF membrane
process.
3.2 Objectives and hypotheses
The main objective of this research project is to develop an integrated PFB-membrane hybrid
process for improved iron and manganese control in drinking water (target limit of 0.02 mg Mn/L
and 0.02 mg Fe/L in treated water).
On a more detailed level, the following specific objectives are defined:
1. Determine the characteristics (i.e., particle size distribution (PSD), ζ -potential and fractal
dimension) of ferric hydroxide and manganese dioxide colloids/particles, which are
generated during typical oxidation conditions prevailing in water of various
physicochemical characteristics (i.e., pH, ionic strength and hardness);
2. Evaluate the performance of pre-oxidation-UF membrane process with respect to iron and
manganese removal, and the extent of fouling under various water chemistry conditions;
3. Determine the fouling mechanisms and reversibility of the fouling in tubular ceramic and
hollow fiber polymeric UF membranes;
4. Investigate the potential application of a PFB contactor to remove elevated concentrations
of Mn(II) from groundwater down to below 0.02 mg/L while operating under high HLRs;
Evaluate the effects of key operational parameters such as feed manganese and
chlorine concentrations, temperature, pH, hardness (Ca2+ concentration), and HLR
(i.e., bed expansion) on PFB performance;
Assess the stability of the process over a long operational period;

48
5. Conduct a field pilot plant comparing the performances of a fixed vs. fluidized bed
contactors for iron and manganese control on a natural groundwater during a long-term
operation in order to demonstrate the feasibility of this process for small rural communities;
6. Compare the performance of a PFB-MF/UF membrane hybrid process with the
conventional pre-oxidation-MF/UF membrane process (with respect to iron and manganese
removal as well as fouling mitigation) under variable water chemistry conditions.
The objectives of this project are derived from the following research hypotheses:
1. Acidity (pH), ionic strength and hardness (Ca2+ concentration) have significant impact on
the extent and reversibility of UF membrane fouling caused by oxidized iron and
manganese species.
Originality: The influence of water chemistry conditions on the fouling of UF membranes caused
by ferric hydroxide and manganese dioxide particles was never investigated.
2. The type of membrane (hollow fiber polymeric membrane vs. tubular ceramic membrane)
has an impact on the characteristics of the cake layer and reversibility of fouling during UF
of ferric hydroxide and manganese dioxide colloids/particles.
Originality: The influence of the two common membrane types, hollow fiber polymeric and tubular
ceramic membrane, on UF fouling arising from ferric hydroxide and manganese dioxide
colloids/particles was never investigated.
3. A PFB contactor can properly remove Mn(II) from feed water with elevated Mn(II)
concentrations (typically > 1 mg/L). In the presence of adequate free chlorine residual,
manganese removal through the PFB is not affected by the pH (6 - 8), HLR (20 - 60 m/h),
and hardness (0 - 200 mg CaCO3/L) of the feed water.
Originality: The performance of a PFB contactor for Mn(II) removal was never studied.
4. The PFB contactor can be operated continuously over a long time for iron and manganese
control from natural groundwater while the head loss remains almost constant through the
column.
Originality: The long-term rate of headloss accumulation in a PFB contactor for iron and
manganese control in natural groundwater was never tested.
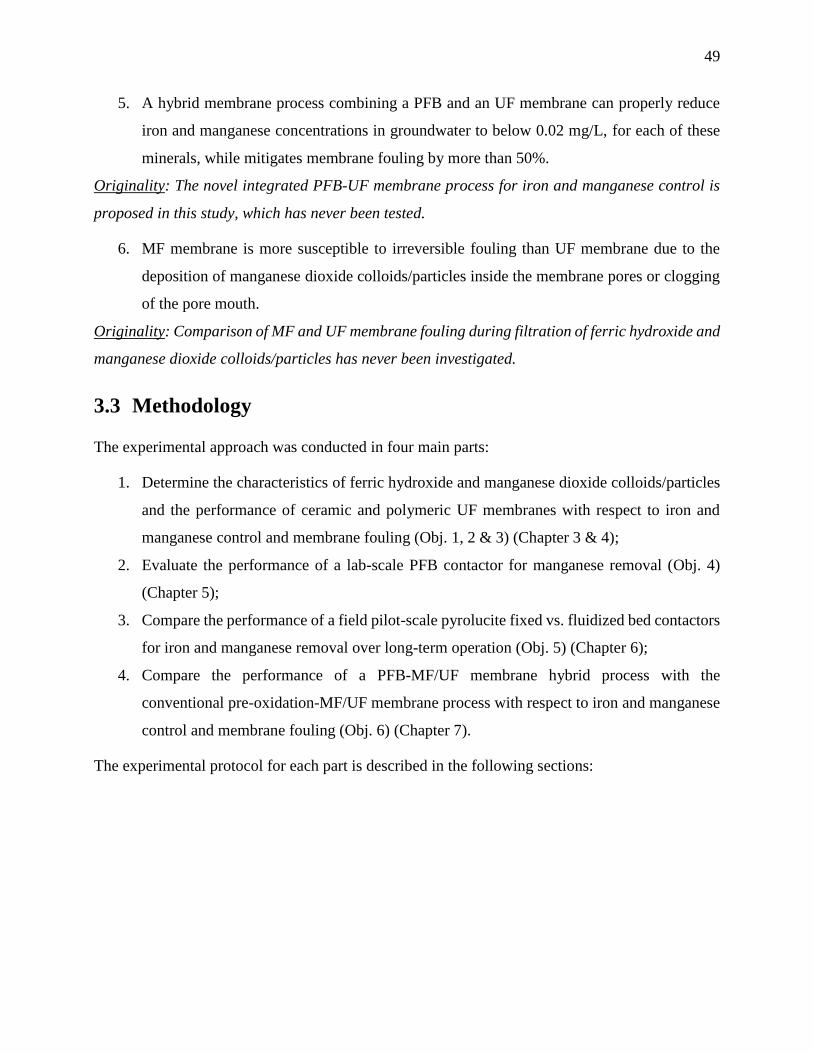
49
5. A hybrid membrane process combining a PFB and an UF membrane can properly reduce
iron and manganese concentrations in groundwater to below 0.02 mg/L, for each of these
minerals, while mitigates membrane fouling by more than 50%.
Originality: The novel integrated PFB-UF membrane process for iron and manganese control is
proposed in this study, which has never been tested.
6. MF membrane is more susceptible to irreversible fouling than UF membrane due to the
deposition of manganese dioxide colloids/particles inside the membrane pores or clogging
of the pore mouth.
Originality: Comparison of MF and UF membrane fouling during filtration of ferric hydroxide and
manganese dioxide colloids/particles has never been investigated.
3.3 Methodology
The experimental approach was conducted in four main parts:
1. Determine the characteristics of ferric hydroxide and manganese dioxide colloids/particles
and the performance of ceramic and polymeric UF membranes with respect to iron and
manganese control and membrane fouling (Obj. 1, 2 & 3) (Chapter 3 & 4);
2. Evaluate the performance of a lab-scale PFB contactor for manganese removal (Obj. 4)
(Chapter 5);
3. Compare the performance of a field pilot-scale pyrolucite fixed vs. fluidized bed contactors
for iron and manganese removal over long-term operation (Obj. 5) (Chapter 6);
4. Compare the performance of a PFB-MF/UF membrane hybrid process with the
conventional pre-oxidation-MF/UF membrane process with respect to iron and manganese
control and membrane fouling (Obj. 6) (Chapter 7).
The experimental protocol for each part is described in the following sections:
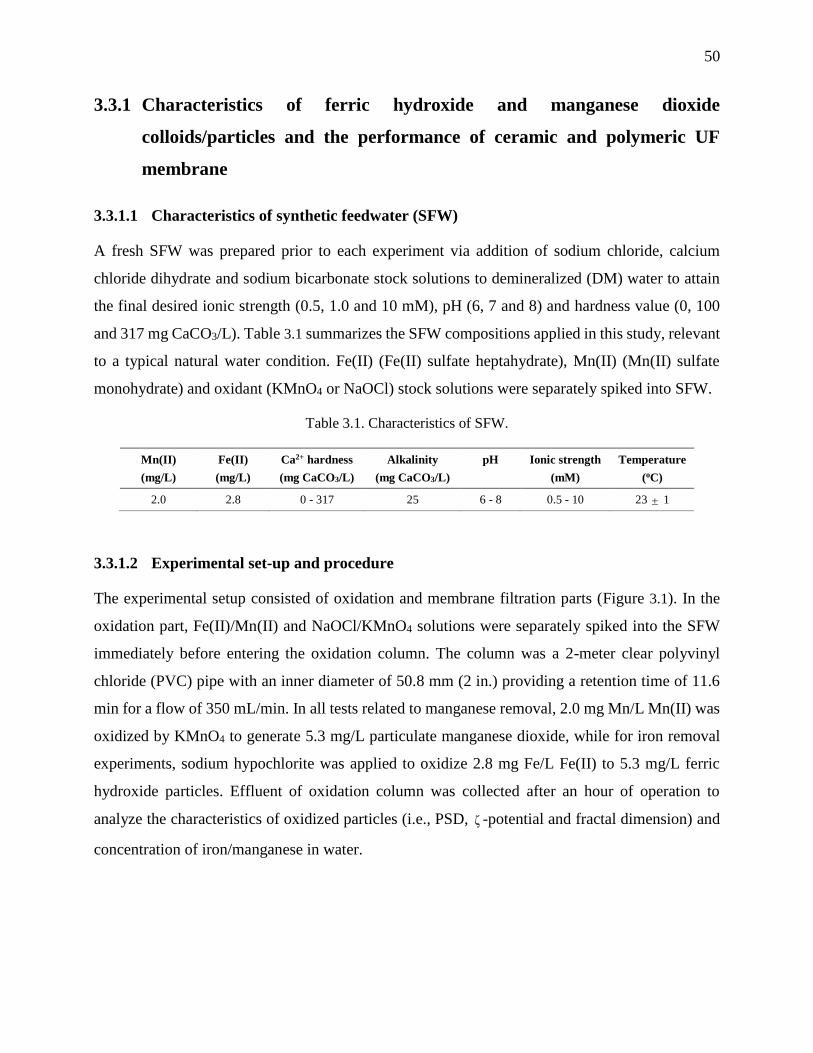
50
3.3.1 Characteristics of ferric hydroxide and manganese dioxide
colloids/particles and the performance of ceramic and polymeric UF
membrane
3.3.1.1 Characteristics of synthetic feedwater (SFW)
A fresh SFW was prepared prior to each experiment via addition of sodium chloride, calcium
chloride dihydrate and sodium bicarbonate stock solutions to demineralized (DM) water to attain
the final desired ionic strength (0.5, 1.0 and 10 mM), pH (6, 7 and 8) and hardness value (0, 100
and 317 mg CaCO3/L). Table 3.1 summarizes the SFW compositions applied in this study, relevant
to a typical natural water condition. Fe(II) (Fe(II) sulfate heptahydrate), Mn(II) (Mn(II) sulfate
monohydrate) and oxidant (KMnO4 or NaOCl) stock solutions were separately spiked into SFW.
Table 3.1. Characteristics of SFW.
Mn(II)
(mg/L)
Fe(II)
(mg/L)
Ca2+ hardness
(mg CaCO3/L)
Alkalinity
(mg CaCO3/L)
pH
Ionic strength
(mM)
Temperature
(oC)
2.0 2.8 0 - 317 25 6 - 8 0.5 - 10 23 1
3.3.1.2 Experimental set-up and procedure
The experimental setup consisted of oxidation and membrane filtration parts (Figure 3.1). In the
oxidation part, Fe(II)/Mn(II) and NaOCl/KMnO4 solutions were separately spiked into the SFW
immediately before entering the oxidation column. The column was a 2-meter clear polyvinyl
chloride (PVC) pipe with an inner diameter of 50.8 mm (2 in.) providing a retention time of 11.6
min for a flow of 350 mL/min. In all tests related to manganese removal, 2.0 mg Mn/L Mn(II) was
oxidized by KMnO4 to generate 5.3 mg/L particulate manganese dioxide, while for iron removal
experiments, sodium hypochlorite was applied to oxidize 2.8 mg Fe/L Fe(II) to 5.3 mg/L ferric
hydroxide particles. Effluent of oxidation column was collected after an hour of operation to
analyze the characteristics of oxidized particles (i.e., PSD, ζ -potential and fractal dimension) and
concentration of iron/manganese in water.
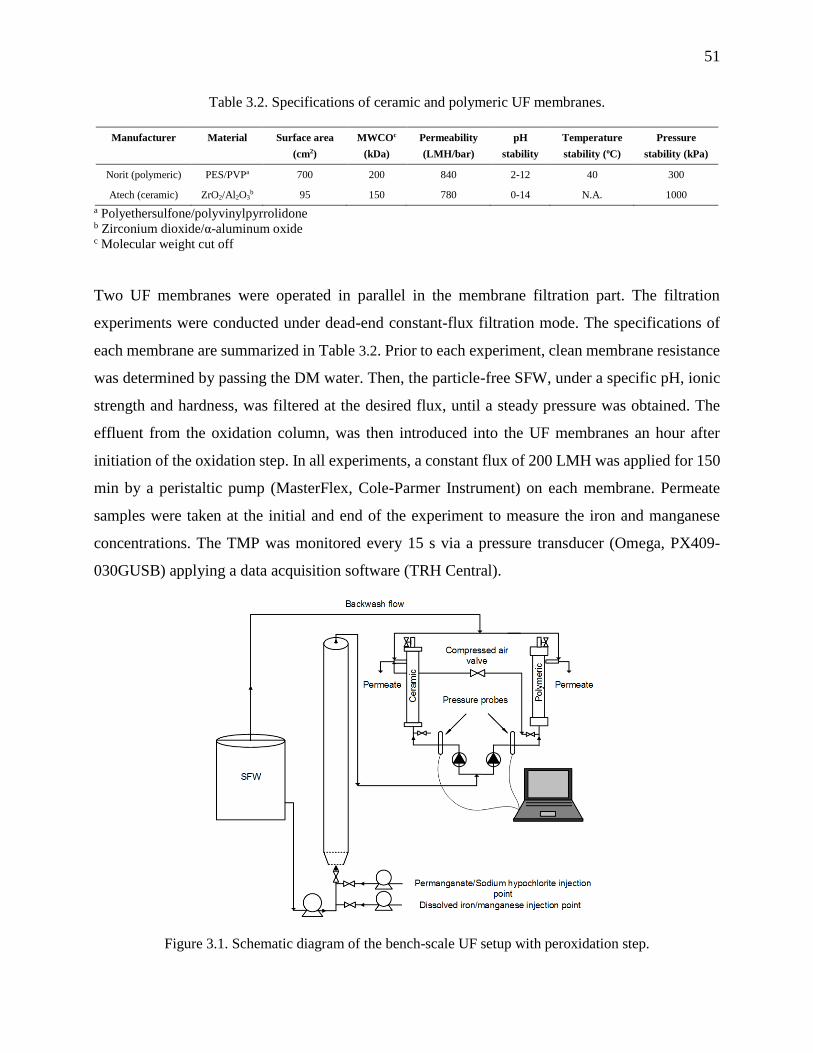
51
Table 3.2. Specifications of ceramic and polymeric UF membranes.
Manufacturer Material Surface area
(cm2)
MWCOc
(kDa)
Permeability
(LMH/bar)
pH
stability
Temperature
stability (oC)
Pressure
stability (kPa)
Norit (polymeric) PES/PVPa 700 200 840 2-12 40 300
Atech (ceramic) ZrO2/Al2O3b 95 150 780 0-14 N.A. 1000
a Polyethersulfone/polyvinylpyrrolidone b Zirconium dioxide/α-aluminum oxide c Molecular weight cut off
Two UF membranes were operated in parallel in the membrane filtration part. The filtration
experiments were conducted under dead-end constant-flux filtration mode. The specifications of
each membrane are summarized in Table 3.2. Prior to each experiment, clean membrane resistance
was determined by passing the DM water. Then, the particle-free SFW, under a specific pH, ionic
strength and hardness, was filtered at the desired flux, until a steady pressure was obtained. The
effluent from the oxidation column, was then introduced into the UF membranes an hour after
initiation of the oxidation step. In all experiments, a constant flux of 200 LMH was applied for 150
min by a peristaltic pump (MasterFlex, Cole-Parmer Instrument) on each membrane. Permeate
samples were taken at the initial and end of the experiment to measure the iron and manganese
concentrations. The TMP was monitored every 15 s via a pressure transducer (Omega, PX409-
030GUSB) applying a data acquisition software (TRH Central).
Figure 3.1. Schematic diagram of the bench-scale UF setup with peroxidation step.

52
At the end of each experiment, physical cleaning followed by a chemical cleaning were executed.
Physical cleaning consisted of backwash with particle-free SFW and air scouring. Chemical
cleaning was performed using a citric acid solution under elevated temperature. In this study, acid
cleaning was found to be sufficient to recover the permeability of the membranes. Thus, the same
membrane was used during the entire project.
3.3.1.3 Particle characterization
The size distribution of oxidized particles in membrane feed water were determined using DLS
(Zetasizer Nano-ZS, Malvern, UK), LD (Mastersizer 3000, Malvern, UK) and serial membrane
filtration techniques. DLS is well adapted to sub-micron colloids, while LD is well suited for
determining the size of larger aggregates (> 1 µm) (Bowen, 2002). In fractionation through serial
filtration technique, the iron and manganese concentrations were successively measured in filtrates
from microfilters with pore sizes of 8 µm (CAT. NO. 09845D, WhatmanTM), 3 µm (CAT. NO.
SSWP04700, Millipore Corp.), 1.2 µm (CAT. NO. RAWP04700, Millipore Corp.), 0.45 µm (LOT
NO. T41389, Pall Corp.) and 0.1 µm (LOT NO. T21020, Pall Corp.), as well as a 30 kDa (PVDF,
Sterlitech Corp.) UF membrane. The Zetasizer Nano-ZS was also employed to determine
electrophoretic mobility and ζ -potential of the particles using the Smoluchowski equation. Spatial
structure of aggregates in terms of fractal dimension was also calculated from LD data obtained
using the Malvern Mastersizer 3000. The samples were analyzed within 3 minutes of collection to
diminish the possibility of further aggregation.
3.3.2 Performance of lab pilot-scale PFB contactor for manganese removal
3.3.2.1 Characteristics of synthetic groundwater (SGW)
Prior to each experiment, a volume of 200-400 L SGW was prepared using DM water. The
alkalinity, hardness and Mn(II) concentration were adjusted using an appropriate amount of 0.5 M
sodium bicarbonate, 0.5 M calcium chloride dihydrate and 0.1 M Mn(II) sulfate monohydrate stock
solutions, respectively. Finally, the pH was adjusted by bubbling CO2 and/or N2 gas into the SGW.
The following water quality and operational conditions were measured and controlled in each
experiment: initial Mn(II) concentration (0.5 - 3.0 mg Mn/L), hardness (0 & 200 mg CaCO3/L),
temperature (9 & 23oC), pH (6.2 - 7.8) and HLR (24 - 63 m/h) (i.e., bed expansion (0 - 30%)). The
characteristics of SGW applied in this study was summarized in Table 3.3.
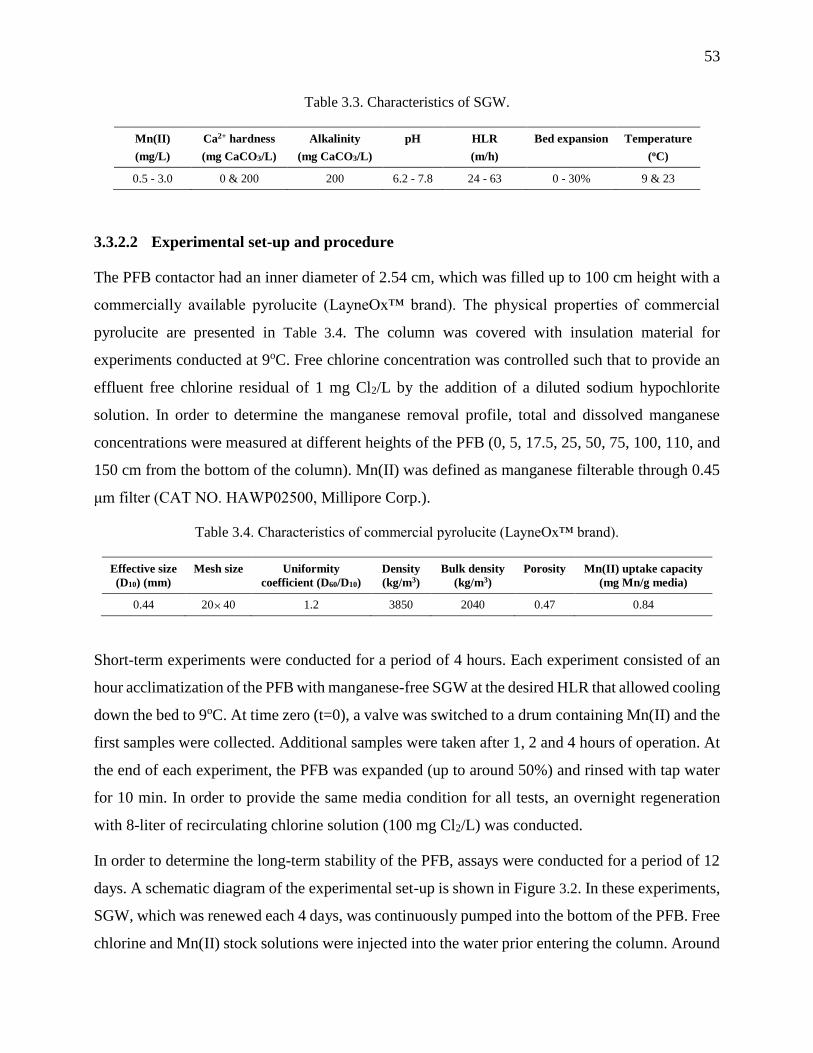
53
Table 3.3. Characteristics of SGW.
Mn(II)
(mg/L)
Ca2+ hardness
(mg CaCO3/L)
Alkalinity
(mg CaCO3/L)
pH
HLR
(m/h)
Bed expansion
Temperature
(oC)
0.5 - 3.0 0 & 200 200 6.2 - 7.8 24 - 63 0 - 30% 9 & 23
3.3.2.2 Experimental set-up and procedure
The PFB contactor had an inner diameter of 2.54 cm, which was filled up to 100 cm height with a
commercially available pyrolucite (LayneOx™ brand). The physical properties of commercial
pyrolucite are presented in Table 3.4. The column was covered with insulation material for
experiments conducted at 9oC. Free chlorine concentration was controlled such that to provide an
effluent free chlorine residual of 1 mg Cl2/L by the addition of a diluted sodium hypochlorite
solution. In order to determine the manganese removal profile, total and dissolved manganese
concentrations were measured at different heights of the PFB (0, 5, 17.5, 25, 50, 75, 100, 110, and
150 cm from the bottom of the column). Mn(II) was defined as manganese filterable through 0.45
μm filter (CAT NO. HAWP02500, Millipore Corp.).
Table 3.4. Characteristics of commercial pyrolucite (LayneOx™ brand).
Effective size
(D10) (mm)
Mesh size Uniformity
coefficient (D60/D10)
Density
(kg/m3)
Bulk density
(kg/m3)
Porosity Mn(II) uptake capacity
(mg Mn/g media)
0.44 2040 1.2 3850 2040 0.47 0.84
Short-term experiments were conducted for a period of 4 hours. Each experiment consisted of an
hour acclimatization of the PFB with manganese-free SGW at the desired HLR that allowed cooling
down the bed to 9oC. At time zero (t=0), a valve was switched to a drum containing Mn(II) and the
first samples were collected. Additional samples were taken after 1, 2 and 4 hours of operation. At
the end of each experiment, the PFB was expanded (up to around 50%) and rinsed with tap water
for 10 min. In order to provide the same media condition for all tests, an overnight regeneration
with 8-liter of recirculating chlorine solution (100 mg Cl2/L) was conducted.
In order to determine the long-term stability of the PFB, assays were conducted for a period of 12
days. A schematic diagram of the experimental set-up is shown in Figure 3.2. In these experiments,
SGW, which was renewed each 4 days, was continuously pumped into the bottom of the PFB. Free
chlorine and Mn(II) stock solutions were injected into the water prior entering the column. Around

54
10% of the effluent water was discarded and the remainder was pumped into a granular activated
carbon filter cartridge to remove the residual free chlorine and, then, returned back to the drum.
pH, temperature, turbidity, and chlorine and manganese concentrations were controlled daily.
Figure 3.2. Schematic diagram of the long-term experimental plan.
3.3.3 Performance of pilot-scale pyrolucite fixed and fluidized bed contactors
for iron and manganese removal
3.3.3.1 Characteristics of groundwater
The source water in this study was a natural groundwater supplying the community of Sainte-
Marthe-sur-le-Lac, Quebec, Canada. However, in some experiments the feed water was enriched
with Fe(II) or Mn(II) to determine the process performance under elevated concentration of these
minerals. In this regard, Fe(II) sulfate heptahydrate or Mn(II) sulfate monohydrate stock solution
was separately spiked into the natural groundwater before entering the columns. The feed water
characteristics were regularly examined and summarized in Table 3.5.
Table 3.5. Characteristics of the groundwater tested in this study.
Iron
(mg/L)
Manganese
(mg/L)
Hardness
(mg CaCO3/L)
Alkalinity
(mg CaCO3/L)
pH O2
(mg/L)
DOC & TOC
(mg C/L)
SUVA
(L/mg/m)
Temperature
(oC)
0.01-0.18 0.09-0.35 200 170 7.0-7.2 1.9-2.9 3.3 1.9 8-12
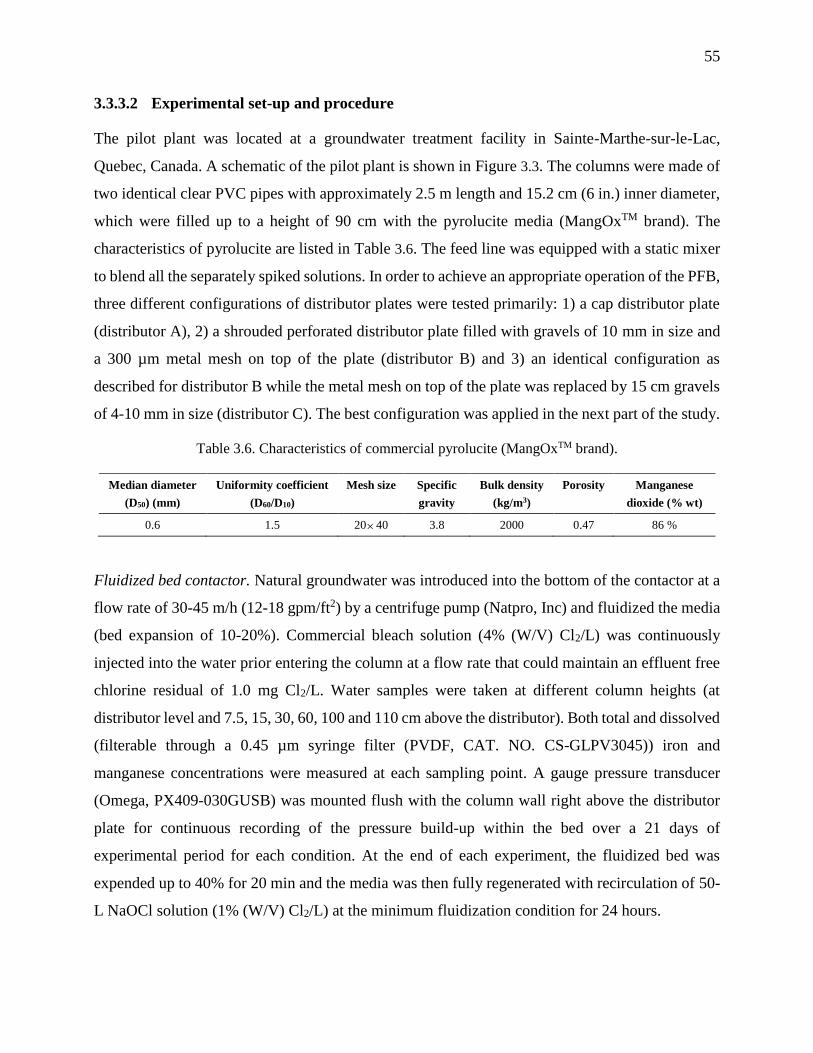
55
3.3.3.2 Experimental set-up and procedure
The pilot plant was located at a groundwater treatment facility in Sainte-Marthe-sur-le-Lac,
Quebec, Canada. A schematic of the pilot plant is shown in Figure 3.3. The columns were made of
two identical clear PVC pipes with approximately 2.5 m length and 15.2 cm (6 in.) inner diameter,
which were filled up to a height of 90 cm with the pyrolucite media (MangOxTM brand). The
characteristics of pyrolucite are listed in Table 3.6. The feed line was equipped with a static mixer
to blend all the separately spiked solutions. In order to achieve an appropriate operation of the PFB,
three different configurations of distributor plates were tested primarily: 1) a cap distributor plate
(distributor A), 2) a shrouded perforated distributor plate filled with gravels of 10 mm in size and
a 300 µm metal mesh on top of the plate (distributor B) and 3) an identical configuration as
described for distributor B while the metal mesh on top of the plate was replaced by 15 cm gravels
of 4-10 mm in size (distributor C). The best configuration was applied in the next part of the study.
Table 3.6. Characteristics of commercial pyrolucite (MangOxTM brand).
Median diameter
(D50) (mm)
Uniformity coefficient
(D60/D10)
Mesh size Specific
gravity
Bulk density
(kg/m3)
Porosity Manganese
dioxide (% wt)
0.6 1.5 2040 3.8 2000 0.47 86 %
Fluidized bed contactor. Natural groundwater was introduced into the bottom of the contactor at a
flow rate of 30-45 m/h (12-18 gpm/ft2) by a centrifuge pump (Natpro, Inc) and fluidized the media
(bed expansion of 10-20%). Commercial bleach solution (4% (W/V) Cl2/L) was continuously
injected into the water prior entering the column at a flow rate that could maintain an effluent free
chlorine residual of 1.0 mg Cl2/L. Water samples were taken at different column heights (at
distributor level and 7.5, 15, 30, 60, 100 and 110 cm above the distributor). Both total and dissolved
(filterable through a 0.45 µm syringe filter (PVDF, CAT. NO. CS-GLPV3045)) iron and
manganese concentrations were measured at each sampling point. A gauge pressure transducer
(Omega, PX409-030GUSB) was mounted flush with the column wall right above the distributor
plate for continuous recording of the pressure build-up within the bed over a 21 days of
experimental period for each condition. At the end of each experiment, the fluidized bed was
expended up to 40% for 20 min and the media was then fully regenerated with recirculation of 50-
L NaOCl solution (1% (W/V) Cl2/L) at the minimum fluidization condition for 24 hours.

56
Ch
lori
ne
So
luti
on
for
Re
ge
ne
rati
on
Ground water
Fe/Mn Injection
PointChlorine
Injection Point
P
P
Ground water
P
Fe/Mn
Injection Point
Chlorine
Injection Point
Ch
lori
ne
So
luti
on
for
Re
ge
ne
rati
on
Figure 3.3. Schematic of pilot plant experimental set-ups. Left: Fixed bed. Right: Fluidized bed.
Fixed bed contactor. The fixed bed was identically operated to the fluidized bed. The differences
could be listed as: (i) groundwater was fed to the top of the column with a gear pump (Natpro, Inc)
providing a constant flow under all pressures over the 21 days of experimental cycle; (ii) the fixed
bed was operated at HLR of 20 m/h; (iii) a pressure transducer (Omega, PX409-030GUSB) was
installed on top of the contactor for continuous monitoring of the bed pressure drop, (iv) water
samples were collected at 0, 6, 30, 60, and 90 cm from the top of the bed, (v) the fixed bed was
backwashed when the upstream bed pressure raised to more than 0.5 bar. The backwashing step
was executed for 20 min at 40% bed expansion using natural groundwater. In both columns,
turbidity, pH, and free chlorine concentrations in the influent and effluent were also measured.
Fixed bed Fluidized bed
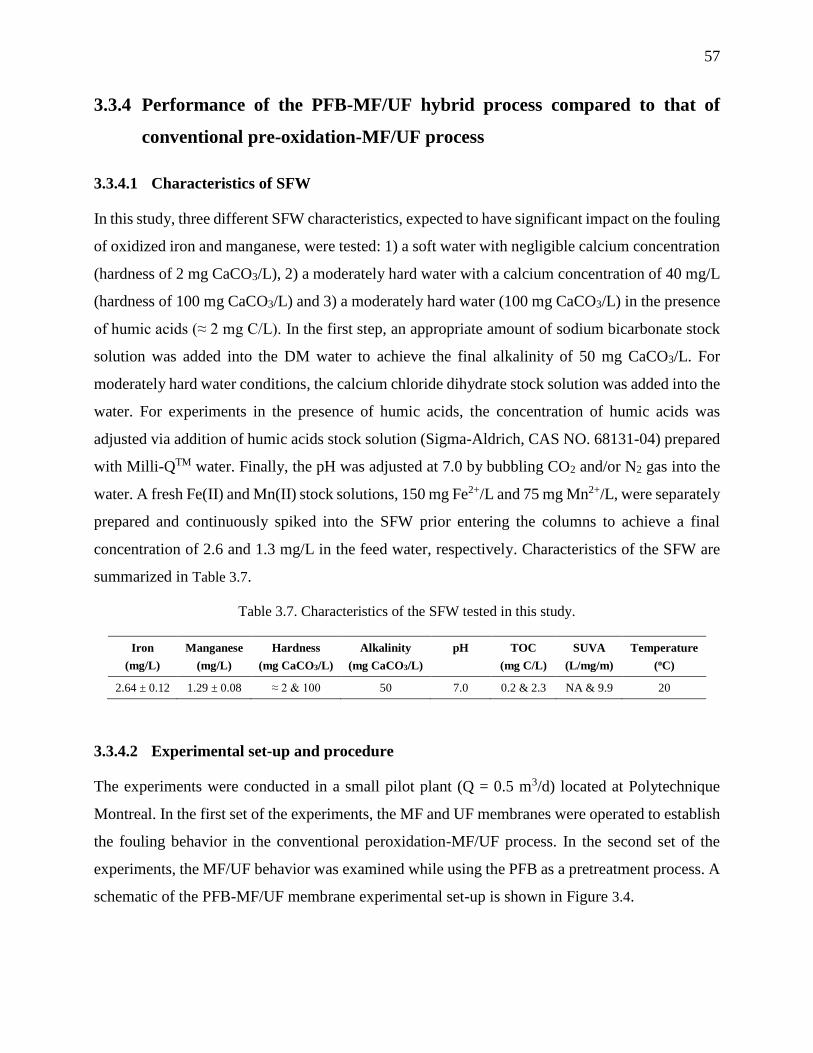
57
3.3.4 Performance of the PFB-MF/UF hybrid process compared to that of
conventional pre-oxidation-MF/UF process
3.3.4.1 Characteristics of SFW
In this study, three different SFW characteristics, expected to have significant impact on the fouling
of oxidized iron and manganese, were tested: 1) a soft water with negligible calcium concentration
(hardness of 2 mg CaCO3/L), 2) a moderately hard water with a calcium concentration of 40 mg/L
(hardness of 100 mg CaCO3/L) and 3) a moderately hard water (100 mg CaCO3/L) in the presence
of humic acids (≈ 2 mg C/L). In the first step, an appropriate amount of sodium bicarbonate stock
solution was added into the DM water to achieve the final alkalinity of 50 mg CaCO3/L. For
moderately hard water conditions, the calcium chloride dihydrate stock solution was added into the
water. For experiments in the presence of humic acids, the concentration of humic acids was
adjusted via addition of humic acids stock solution (Sigma-Aldrich, CAS NO. 68131-04) prepared
with Milli-QTM water. Finally, the pH was adjusted at 7.0 by bubbling CO2 and/or N2 gas into the
water. A fresh Fe(II) and Mn(II) stock solutions, 150 mg Fe2+/L and 75 mg Mn2+/L, were separately
prepared and continuously spiked into the SFW prior entering the columns to achieve a final
concentration of 2.6 and 1.3 mg/L in the feed water, respectively. Characteristics of the SFW are
summarized in Table 3.7.
Table 3.7. Characteristics of the SFW tested in this study.
Iron
(mg/L)
Manganese
(mg/L)
Hardness
(mg CaCO3/L)
Alkalinity
(mg CaCO3/L)
pH TOC
(mg C/L)
SUVA
(L/mg/m)
Temperature
(oC)
2.64 ± 0.12 1.29 ± 0.08 ≈ 2 & 100 50 7.0 0.2 & 2.3 NA & 9.9 20
3.3.4.2 Experimental set-up and procedure
The experiments were conducted in a small pilot plant (Q = 0.5 m3/d) located at Polytechnique
Montreal. In the first set of the experiments, the MF and UF membranes were operated to establish
the fouling behavior in the conventional peroxidation-MF/UF process. In the second set of the
experiments, the MF/UF behavior was examined while using the PFB as a pretreatment process. A
schematic of the PFB-MF/UF membrane experimental set-up is shown in Figure 3.4.
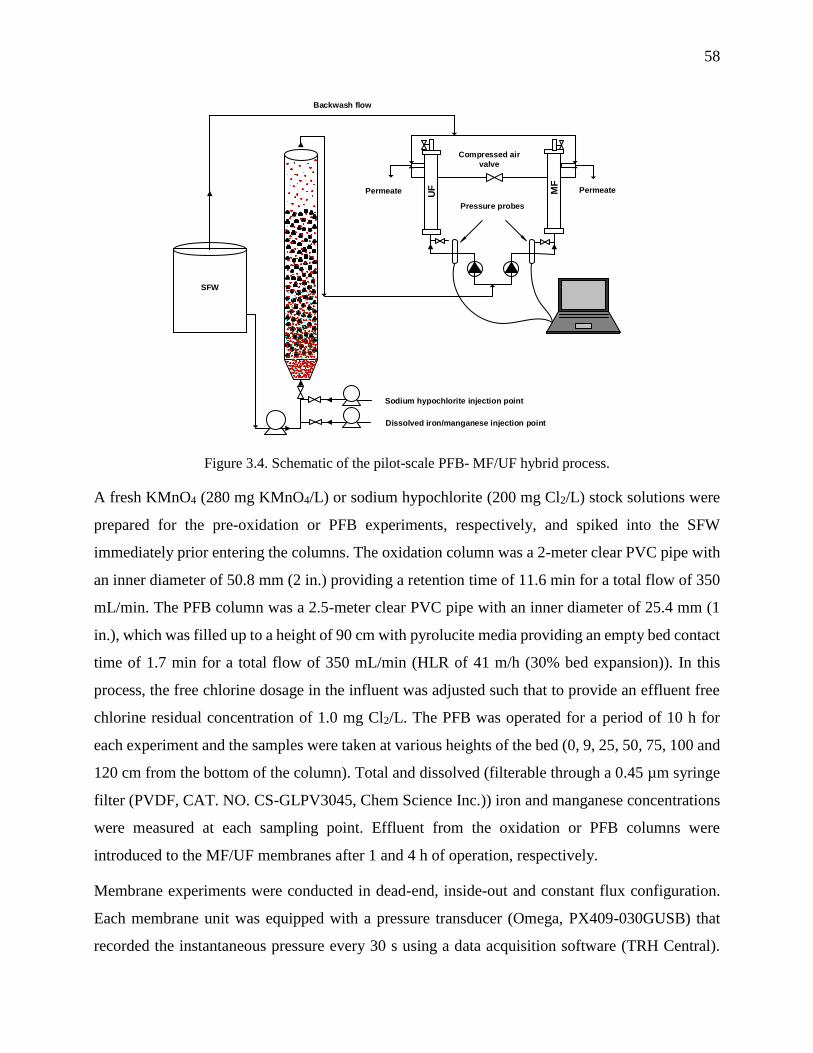
58
SFW
Backwash flow
Sodium hypochlorite injection point
Dissolved iron/manganese injection point
Permeate Permeate
Compressed air
valve
MF
Pressure probes
UF
Figure 3.4. Schematic of the pilot-scale PFB- MF/UF hybrid process.
A fresh KMnO4 (280 mg KMnO4/L) or sodium hypochlorite (200 mg Cl2/L) stock solutions were
prepared for the pre-oxidation or PFB experiments, respectively, and spiked into the SFW
immediately prior entering the columns. The oxidation column was a 2-meter clear PVC pipe with
an inner diameter of 50.8 mm (2 in.) providing a retention time of 11.6 min for a total flow of 350
mL/min. The PFB column was a 2.5-meter clear PVC pipe with an inner diameter of 25.4 mm (1
in.), which was filled up to a height of 90 cm with pyrolucite media providing an empty bed contact
time of 1.7 min for a total flow of 350 mL/min (HLR of 41 m/h (30% bed expansion)). In this
process, the free chlorine dosage in the influent was adjusted such that to provide an effluent free
chlorine residual concentration of 1.0 mg Cl2/L. The PFB was operated for a period of 10 h for
each experiment and the samples were taken at various heights of the bed (0, 9, 25, 50, 75, 100 and
120 cm from the bottom of the column). Total and dissolved (filterable through a 0.45 µm syringe
filter (PVDF, CAT. NO. CS-GLPV3045, Chem Science Inc.)) iron and manganese concentrations
were measured at each sampling point. Effluent from the oxidation or PFB columns were
introduced to the MF/UF membranes after 1 and 4 h of operation, respectively.
Membrane experiments were conducted in dead-end, inside-out and constant flux configuration.
Each membrane unit was equipped with a pressure transducer (Omega, PX409-030GUSB) that
recorded the instantaneous pressure every 30 s using a data acquisition software (TRH Central).
59
Each MF/UF experiment successively consisted of: 1) filtration with DM water at the desired flux
(150 or 300 LMH for the peroxidation-MF/UF process and 300 LMH for the PFB-MF/UF hybrid
process), 2) filtration with particle-free SFW at the same flux, 3) filtration with the effluent of the
columns for 6 h or until the TMP across the UF membrane increased to more than 170 kPa (25 psi),
4) physical cleaning (backwashing with particle-free SFW and air scouring), 5) determining the
permeability of the particle-free SFW, 6) chemical cleaning (using oxalic acid and/or sodium
hypochlorite solution), 7) rinsing with DM water, and 8) determining the clean water permeability
of the membranes a day after the cleaning cycles. The same MF/UF membranes were used for all
the experiments. Samples of membrane feed water and permeate were taken to measure the
concentrations of iron, manganese, DOC and TOC.
3.3.4.3 Characterization of membrane fouling
Previous studies revealed that in many municipal and industrial solid-liquid separation via
membrane filtration, the pressure increase profile in constant flux filtration mode can be described
by the power-law compressible cake formation model (Sørensen and Sorensen, 1997; Chellam et
al., 1998). Therefore, the constant flux blocking law model for compressible cake filtration (Eq.
(1.21)) (Chellam and Xu, 2006) was applied in this study to describe the pressure increase behavior
and the compressibility of the cake layer. The compressibility parameters, β and n’, in this equation
were estimated via fitting the experimental pressure data to Eq. (1.21) using a curve-fitting tool in
Matlab (R2015a) with the smallest sum of squared residuals.
In addition, the resistance-in-series model (Eq. (2.1)) was also applied to provide further
quantitative insight about the reversibility of the fouling and the effectiveness of cleaning methods.
𝐽 =∆𝑃
𝜇 𝑅𝑡 =
∆𝑃
𝜇 (𝑅𝑚+ 𝑅𝑝𝑟+𝑅𝑐𝑟+𝑅𝑖𝑓) (2.1)
where Rt is the total resistance (m-1); Rpr is the physically reversible resistance (m-1); Rcr is the
chemically reversible resistance (m-1); and Rif is the chemically irreversible fouling (m-1).
These parameters were determined by:
Rm: measuring the particle-free SFW permeability of the membranes at the beginning of the
experiment;

60
Rpr: the difference between the TMP of particle-free SFW after the physical cleaning step and the
TMP at the end of filtration experiment;
Rcr: the difference between the stabilized TMP before and after the chemical cleaning step;
Rif: the difference between Rt and the sum of Rm, Rpr, and Rcr.

61
CHAPTER 4 ARTICLE 1 : SIZE AND ZETA POTENTIAL OF
OXIDIZED IRON AND MANGANESE IN WATER TREATMENT:
INFLUENCE OF PH, IONIC STRENGTH AND HARDNESS
This chapter presents an article published in the Journal of Environmental Engineering, 142 (2016).
The particle size distribution and ζ -potentials of ferric hydroxide and manganese dioxide, which
were generated during typical oxidation conditions prevailing in waters of various physicochemical
conditions (i.e., pH, ionic strength and hardness), were investigated in this study.
Size and Zeta Potential of Oxidized Iron and Manganese in Water Treatment: Influence of
pH, Ionic Strength and Hardness
Seyedeh Laleh Dashtban Kenari* and Benoit Barbeau
Polytechnique Montreal, Department of Civil, Geological and Mining Engineering, NSERC-
Industrial Chair on Drinking Water, Environment, C.P. 6079, Succursale Centre-Ville, Montreal,
QC, H3C 3A7, Canada.
* Corresponding author: Tel: +1 514 340-4711 #2983; Fax: 514-340-5918;
E-mail: [email protected]
62
ABSTRACT
Iron and manganese are commonly found in natural waters, particularly in groundwater. Due to the
importance of particle size distribution (PSD) on the performance of removal processes, this
research focuses on understanding the PSD and ζ -potentials of oxidized iron/manganese in water,
as a function of pH, ionic strength and hardness. After rapid oxidation of dissolved iron/manganese,
laser diffraction (LD), dynamic light scattering (DLS) and fractionation through serial membrane
filtration techniques were used to define the PSD. For manganese dioxide, the ζ -potential was
found to decrease as the pH decreased and as the ionic strength and hardness increased, resulting
in a higher aggregate size. The aggregation rate of manganese dioxide strongly increased with
hardness. On the other hand, ferric hydroxide PSD was not significantly altered by ionic strength
or hardness at pH values relevant to typical natural waters. A combination of several techniques
was found to be essential for providing a complete picture of the PSD. DLS and LD techniques
were generally well adapted for nano-scale and micron-scale particles, respectively. The serial
membrane filtration technique was suggested for water practitioners working toward the selection
of an appropriate process for iron/manganese control in drinking waters.
KEYWORDS: Water treatment; Ferric hydroxide; Manganese dioxide; ζ -potential; Particle size
distribution; Laser diffraction; Dynamic light scattering
4.1 Introduction
Iron and manganese naturally occur in both surface and ground waters as a result of weathering
and leaching of metal-bearing minerals. Industrial wastewater has also been cited as a cause of
water contamination by these minerals (United States Environmental Protection Agency (USEPA),
2004). Due to the more reducing redox conditions, groundwater commonly contains higher levels
of dissolved iron (Fe(II)) and manganese (Mn(II)) than surface waters. The presence of iron and
manganese in water mainly causes aesthetic and operating problems, including pipeline clogs,
water discoloration, a metallic taste, odors, increased turbidity and the staining of laundry and
plumbing fixtures, which may result in customer complains (World Health Organization (WHO),
2008). Furthermore, manganese has been claimed to be neurotoxic (Wasserman et al., 2006; Tuschl
63
et al., 2013). For these reasons, effective iron and manganese control is an important objective of
drinking water treatment.
Among several methods that have been employed to control Fe(II) and Mn(II) in drinking water,
one of the most common strategies is the chemical oxidation of dissolved species to particulate
forms, ferric hydroxide and manganese dioxide, using an oxidant, followed by the removal of
particles through depth media filtration. This is especially true in North America, where free
chlorine is normally used to meet regulations on primary and secondary disinfection. Although
Fe(II) is rapidly oxidized by free chlorine (Knocke et al., 1990), direct oxidation of Mn(II) by free
chlorine is often unpractical because of the slow oxidation rate (Griffin, 1960; Knocke et al., 1990).
Alternatively, potassium permanganate (KMnO4), a powerful oxidizing agent, has been typically
used for Mn(II) oxidation (Knocke et al., 1991; Phatai et al., 2010).
After Fe(II) and Mn(II) have been converted to solid forms via oxidation, the oxidized particles
must be removed using a solid-liquid separation technique. Although a 0.45 µm filter is commonly
being used in the laboratory to differentiate dissolved and particulate metals (American Public
Health Association (APHA), American Water Works Association (AWWA) et al. 2005), the
presence of very fine oxidized manganese was demonstrated in many research papers. The use of
a 0.2 µm filter has been suggested by some authors (Reckhow et al., 1991; Sallanko et al., 2005),
while 100 kilodalton (kDa) (Sallanko et al., 2005) or 30 kDa ultrafiltration (Carlson et al., 1997;
Carlson and Knocke, 1999; Gregory and Carlson, 2001; Sallanko et al., 2005) was set as a limit for
soluble, non-oxidized, manganese by others. In addition, iron and manganese colloidal oxides are
commonly found on water purification membranes as foulants (Choo et al., 2005), even in reverse
osmosis (RO) operations, where pre-treatment steps, such as manganese greensand or
oxidation/filtration, have been applied to control iron and manganese levels in RO feed waters
(Ning, 2009). Incomplete removal of colloidal iron and manganese particles in the pre-treatment
steps may cause severe fouling problems for RO/NF plants.
Previous studies on inorganic minerals, namely bentonite and kaolinite (Vane et al., 1997), silica
(Faibish et al., 1998), silicon carbide (Ramachandra Rao et al., 1999), titanium dioxide (Zhao et
al., 2005) and aluminum salt (Duan et al., 2014), have illustrated the influence of pH, ionic strength
and salt valency on the charge and size characteristics of these particles. Consequently, we
hypothesize that the observed differences between the scientific literatures regarding the
64
fractionation of iron and manganese species are likely affected by the role of water chemistry on
the surface charge and size of these particles. However, the importance of these parameters in water
treatment systems has not been well documented.
Determining the particle size distribution (PSD) of oxidized iron and manganese is a key
characteristic for developing an effective process to control these minerals. The objectives of this
study are to (1) determine the ζ -potential and size distribution of ferric hydroxide and manganese
dioxide, which are generated during typical oxidation conditions prevailing in waters of various
physicochemical conditions, such as pH, ionic strength and hardness, and (2) to recommend a
method to assess the PSD of iron and manganese oxides following the comparison of three
techniques: laser diffraction (LD), dynamic light scattering (DLS) and fractionation through serial
membrane filtration.
4.2 Materials and methods
4.2.1 Materials
All powdered chemicals were reagent grade (> 99% pure). NaCl, CaCl2.2H2O, NaHCO3,
FeSO4.7H2O and MnSO4.H2O were supplied by Fisher Scientific (Fair Lawn, NJ).
Omni Trace® nitric acid (HNO3, 67-70%) and KMnO4 were purchased from EMD chemicals Inc.
(Gibbstown, NJ). The concentration of KMnO4 stock solution was adjusted to 130 mg/L. The
commercial sodium hypochlorite (NaOCl, 8% (W/V) available chlorine) bleach solution was
diluted to produce a stock solution (120 mg Cl2/L). Ultrapure water (Milli-QTM) was used to prepare
all stock solutions.
4.2.2 Synthetic water preparation
Synthetic waters were prepared at three ionic strengths (0.5, 1.0 and 10 mM), pHs (6, 7 and 8) and
hardness values (0, 100 and 317 mg CaCO3/L), which are relevant to typical natural water (river
water and potable groundwater) conditions. All tests were conducted at C°1±23 . Synthetic waters
were prepared via addition of the following stock solutions to demineralized (DM) water. In all
experiments, the alkalinity of synthetic water was first adjusted to 25 mg/L as CaCO3, by addition
of an appropriate amount of 0.5 M NaHCO3 stock solution. Stock solutions of NaCl (0.5 M) and
65
CaCl2.2H2O (0.5 M) were then used to regulate the salinity and hardness of the synthetic water.
The pH of the synthetic water was finally adjusted by bubbling CO2 and/or N2 gas into the water.
Stock solutions containing 100 mg/L of Fe(II) or Mn(II) were prepared using FeSO4.7H2O or
MnSO4.H2O, respectively. These stock solutions served as sources of iron and manganese for the
oxidation experiments (described later). To avoid oxidation of Fe(II) in the stock solution, ultrapure
water was acidified to a pH of 3, and N2 gas was then bubbled into the solution for 15 min prior to
the addition of FeSO4.7H2O. This step was not needed for manganese, as preliminary tests
confirmed that stable Mn(II) stock solution could be prepared by dissolution of MnSO4.H2O in
ultrapure water.
4.2.3 Experimental procedure
A 2-meter clear PVC pipe with a diameter of 50.8 mm (2 in.) was employed as a contactor column
for oxidation of Fe(II)/Mn(II). The synthetic water was pumped into the column at a flow rate of
350 mL/min through a 1.27 mm (0.5 in.) inlet tube placed at the bottom of the column. Thus, the
column provided an oxidation contact time of 11.6 min. FeSO4 or MnSO4 stock solutions and
oxidation reagents were separately fed to the inlet tube after the synthetic water injection point.
The last injection point was for the oxidants (KMnO4 or Cl2). To mix the reagents with the influent
water, two small wire mesh screens (315 µm) were placed in the inlet tube, one after the oxidant
injection point, and the other just prior to entering the column. The reason for conducting these
experiments at the pilot- rather than the bench-scale was that UF membrane fouling was also
studied. However, the UF results are beyond the scope of the current paper.
In all tests related to oxidized manganese characteristics, KMnO4 was applied to oxidize 2.0 mg/L
Mn(II) to 5.3 mg/L manganese dioxide (according to the stoichiometric reaction: 3Mn2+ + 2MnO4-
+ 2H2O ⟹ 5MnO2(s) + 4H+) (Sommerfeld, 1999). However, in the case of Fe(II) oxidation,
chlorination was used, as it is the most practical and cost effective method. NaOCl was injected to
oxidize 2.8 mg/L Fe(II) to 5.3 mg/L ferric hydroxide (according to the stoichiometric reaction:
2Fe2+ + OCl- + 5H2O ⟹ 2Fe(OH)3(s) + Cl- + 4H+) (Sommerfeld, 1999). After the oxidation step,
the size distributions of particulate ferric hydroxide and manganese dioxide were analyzed for the
various pH, ionic strength and hardness conditions. The samples were collected after the contact
column reached a stable operating condition (one hour of operation). In total, seven conditions were
tested for each metal while those with different pH and ionic strength were duplicated.
66
4.2.4 Particle size measurement techniques
Among different techniques for the particle size measurement, DLS and LD have become popular,
as they rapidly measure the entire particle size distribution (Bowen, 2002). In addition to these
methods, serial membrane filtration technique is the simplest option for general evaluation of
particle size in suspensions although it is unable to provide detailed information about the PSD.
Because the use of a single method is not recommended to characterize and identify the PSD
(Bowen, 2002), oxidized iron and manganese were measured by applying these three analytical
techniques. All samples were analyzed within 3 minutes of sample collection to reduce the
possibility of further particle aggregation.
4.2.4.1 Light scattering
Two types of light scattering particle size analyzers: LD, also termed static light scattering, and
DLS, also termed photon correlation spectroscopy, were used to measure the PSD of oxidized iron
and manganese in water. In both techniques, a signal generated from the ensemble of particles in
suspension is measured, and the scattered light intensities are interpreted using light scattering
theory to determine a PSD that caused the observed scattering. Applying both techniques is
necessary to cover a larger range of particle sizes. For both measurements, the real and imaginary
parts of the refractive index for manganese dioxide were set to 2.4 (Malvern Instruments Ltd.,
1997) and 0.01 (Gillespie Lindberg, 1992), respectively, while these values were defined to be
approximately 2.2 (Malvern Instruments Ltd., 1997) and 0.07 (Sherman and Waite, 1985) for ferric
hydroxide particles. In this study, both number size distribution and volume size distribution results
are used for comparison. Volume distribution is proportional to the third power of the particle
diameter (d3), while the number distribution is proportional to d (Xu, 2000).
These methods have certain limitations which should be taken into account (Bowen, 2002;
Dieckmann et al., 2009). To generate an accurate size distribution, the LD method must be applied
to samples with relatively low concentration of particles in order to minimize the multiple scattering
(CPS Instruments Europe). Accordingly, in LD experiments, the oxidized water samples were
diluted with the equivalent synthetic water without Fe(II)/Mn(II), achieving a laser obscuration of
1 to 2%. The samples were then analyzed with a Mastersizer 3000 (Malvern Instruments Ltd., UK)
which allows size determination from 0.01 µm to 3500 µm. However, a better accuracy is expected
67
for larger particles compared to submicron ones (Bowen, 2002). Ten consecutive measurements
were performed to ensure the repeatability of the particle size over the course of an analysis.
The DLS experiments were conducted on a Zetasizer Nano-ZS (Malvern, UK). It was equipped
with a He-Ne laser, which operated at a 633 nm wavelength, and a digital correlator. Although PSD
from 0.4 nm to 10 µm can be measured with this equipment, it is better suited to analyze a narrow
PSD ranging from approximately 1 to 500 nm (Bowen, 2002; Dieckmann et al., 2009). The samples
were directly injected into the appropriate cell and measurements were executed at a fixed
scattering angle of 173o. Three consecutive measurements were conducted to ensure repeatability.
4.2.4.2 Fractionation through serial membrane filtration
For this test, the concentrations of iron and manganese were successively measured in filtrates from
microfilters with pore sizes of 8 µm (CAT. NO. 09845D, WhatmanTM), 3 µm (CAT. NO.
SSWP04700, Millipore Corp.), 1.2 µm (CAT. NO. RAWP04700, Millipore Corp.), 0.45 µm (LOT
NO. T41389, Pall Corp., USA) and 0.1 µm (LOT NO. T21020, Pall Corp., USA), as well as a 30
kDa (PVDF, Sterlitech Corp., USA) ultrafiltration membrane. The samples were vacuum filtered
through microfiltration membranes, while a 50 mL pressurized cell (Amicon 8200 device) was
employed for the ultrafiltration membrane. The ultrafilter cell was pressurized to approximately
240 kPa (35 psi) using nitrogen gas. Prior to each experiment, the 30 kDa membrane was soaked
overnight in ultrapure water. Then, 50 ml of ultrapure water was used to rinse the filter. The
microfiltration membranes were rinsed by filtering 500 ml of ultrapure water before use.
The concentrations of iron and manganese were measured in filtrates by inductively coupled
plasma-optical emission spectrometry (ICP-OES, model iCAP 6000), following heat and acid
digestion with 0.5% HNO3 (Omni Trace® grade, pH < 2) at 80 ˚C for 48 h. The pH analysis was
performed with an UltraBasic pH meter (model UB-5 from Denver Instrument).
4.2.5 Zeta potential analysis
The Zetasizer Nano-ZS (Malvern, UK) was also employed to measure the ζ -potential of the
particles using phase analysis light scattering. In this method, the ζ -potential is calculated from the
measured electrophoretic mobility of the particle in a well-defined electrolyte using the
Smoluchowski equation. All measurements were performed in triplicate. The results were averaged
and the standard deviation is reported.
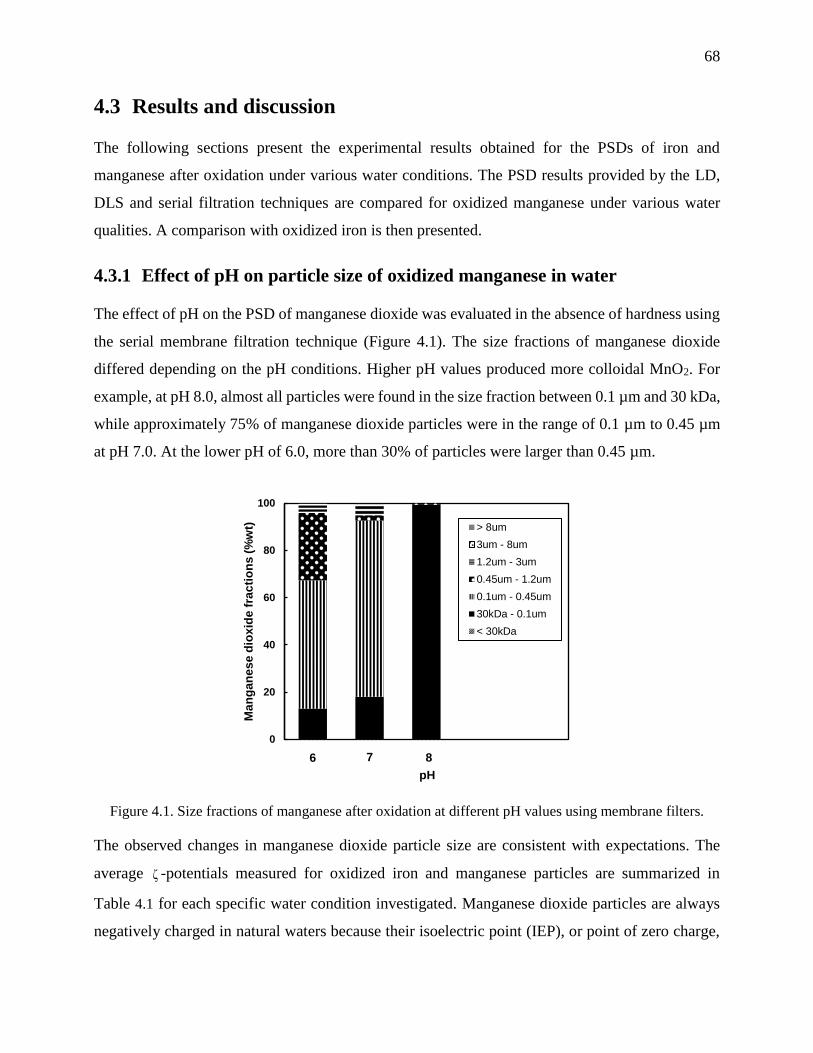
68
4.3 Results and discussion
The following sections present the experimental results obtained for the PSDs of iron and
manganese after oxidation under various water conditions. The PSD results provided by the LD,
DLS and serial filtration techniques are compared for oxidized manganese under various water
qualities. A comparison with oxidized iron is then presented.
4.3.1 Effect of pH on particle size of oxidized manganese in water
The effect of pH on the PSD of manganese dioxide was evaluated in the absence of hardness using
the serial membrane filtration technique (Figure 4.1). The size fractions of manganese dioxide
differed depending on the pH conditions. Higher pH values produced more colloidal MnO2. For
example, at pH 8.0, almost all particles were found in the size fraction between 0.1 µm and 30 kDa,
while approximately 75% of manganese dioxide particles were in the range of 0.1 µm to 0.45 µm
at pH 7.0. At the lower pH of 6.0, more than 30% of particles were larger than 0.45 µm.
Figure 4.1. Size fractions of manganese after oxidation at different pH values using membrane filters.
The observed changes in manganese dioxide particle size are consistent with expectations. The
average ζ -potentials measured for oxidized iron and manganese particles are summarized in
Table 4.1 for each specific water condition investigated. Manganese dioxide particles are always
negatively charged in natural waters because their isoelectric point (IEP), or point of zero charge,
0
20
40
60
80
100
Ma
ng
an
es
e d
iox
ide
fra
cti
on
s (
%w
t)
pH
> 8um
3um - 8um
1.2um - 3um
0.45um - 1.2um
0.1um - 0.45um
30kDa - 0.1um
< 30kDa
6 7 8
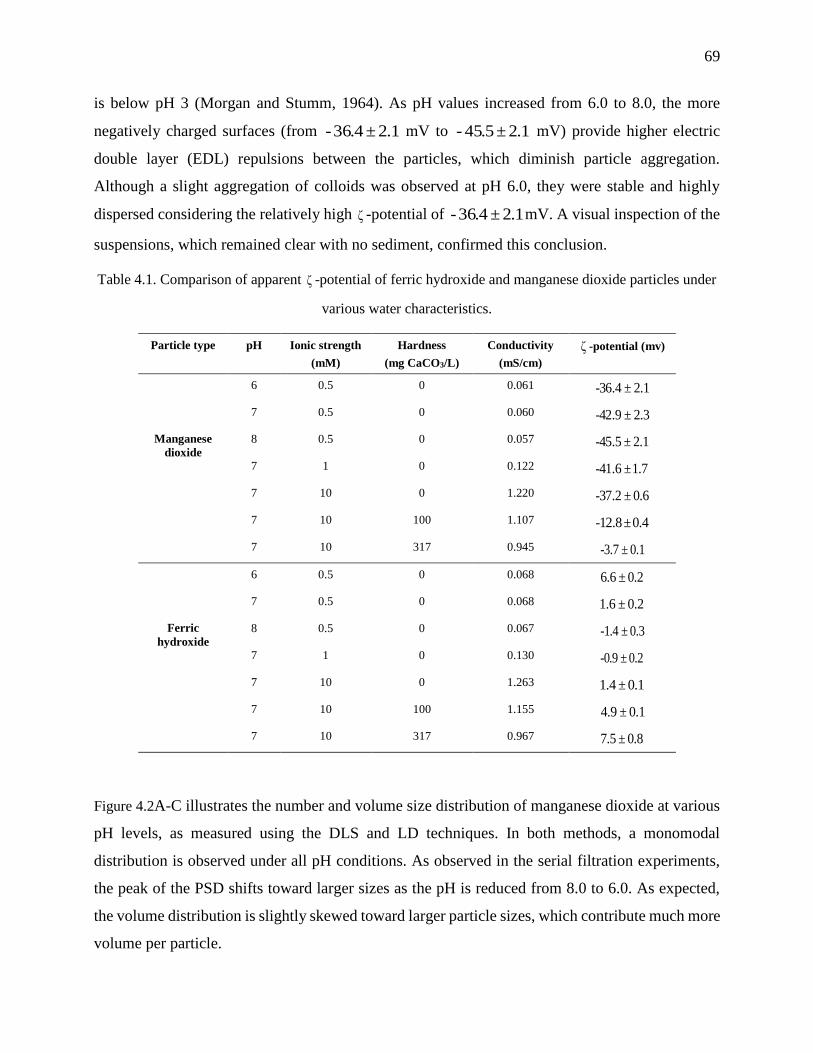
69
is below pH 3 (Morgan and Stumm, 1964). As pH values increased from 6.0 to 8.0, the more
negatively charged surfaces (from 1.2±4.36- mV to 1.2±5.45- mV) provide higher electric
double layer (EDL) repulsions between the particles, which diminish particle aggregation.
Although a slight aggregation of colloids was observed at pH 6.0, they were stable and highly
dispersed considering the relatively high ζ -potential of 1.2±4.36- mV. A visual inspection of the
suspensions, which remained clear with no sediment, confirmed this conclusion.
Table 4.1. Comparison of apparent ζ -potential of ferric hydroxide and manganese dioxide particles under
various water characteristics.
Particle type pH Ionic strength
(mM)
Hardness
(mg CaCO3/L)
Conductivity
(mS/cm)
ζ -potential (mv)
Manganese
dioxide
6 0.5 0 0.061 1.2±4.36-
7 0.5 0 0.060 3.2±9.42-
8 0.5 0 0.057 1.2±5.45-
7 1 0 0.122 7.1±6.41-
7 10 0 1.220 6.0±2.37-
7 10 100 1.107 4.0±8.12-
7 10 317 0.945 1.0±7.3-
Ferric
hydroxide
6 0.5 0 0.068 2.0±6.6
7 0.5 0 0.068 2.0±6.1
8 0.5 0 0.067 3.0±-1.4
7 1 0 0.130 2.0±-0.9
7 10 0 1.263 1.0±4.1
7 10 100 1.155 1.0±9.4
7 10 317 0.967 8.0±5.7
Figure 4.2A-C illustrates the number and volume size distribution of manganese dioxide at various
pH levels, as measured using the DLS and LD techniques. In both methods, a monomodal
distribution is observed under all pH conditions. As observed in the serial filtration experiments,
the peak of the PSD shifts toward larger sizes as the pH is reduced from 8.0 to 6.0. As expected,
the volume distribution is slightly skewed toward larger particle sizes, which contribute much more
volume per particle.
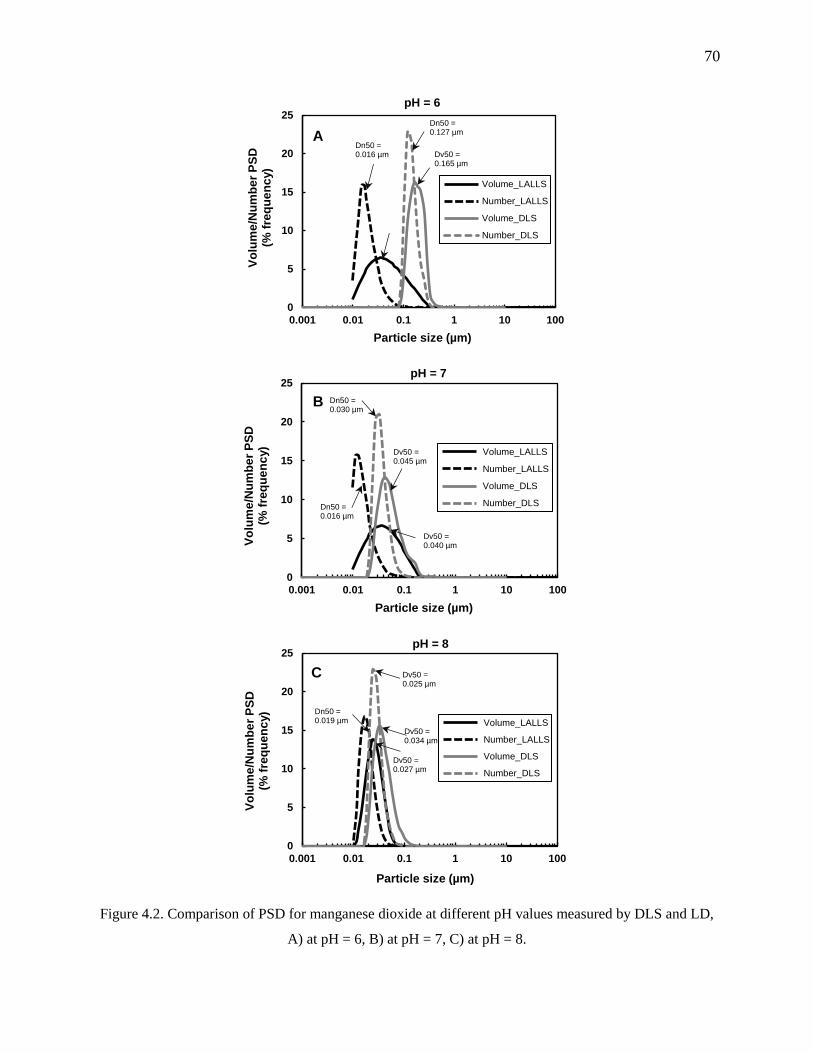
70
Figure 4.2. Comparison of PSD for manganese dioxide at different pH values measured by DLS and LD,
A) at pH = 6, B) at pH = 7, C) at pH = 8.
0
5
10
15
20
25
0.001 0.01 0.1 1 10 100
Vo
lum
e/N
um
be
r P
SD
(%
fre
qu
en
cy)
Particle size (µm)
pH = 6
Volume_LALLS
Number_LALLS
Volume_DLS
Number_DLS
ADn50 =0.016 µm
Dn50 =0.127 µm
Dv50 =0.165 µm
0
5
10
15
20
25
0.001 0.01 0.1 1 10 100
Vo
lum
e/N
um
be
r P
SD
(%
fre
qu
en
cy)
Particle size (µm)
pH = 7
Volume_LALLS
Number_LALLS
Volume_DLS
Number_DLS
B
Dn50 = 0.016 µm
Dn50 = 0.030 µm
Dv50 = 0.045 µm
Dv50 = 0.040 µm
0
5
10
15
20
25
0.001 0.01 0.1 1 10 100
Vo
lum
e/N
um
be
r P
SD
(%
fre
qu
en
cy)
Particle size (µm)
pH = 8
Volume_LALLS
Number_LALLS
Volume_DLS
Number_DLS
C
Dn50 = 0.019 µm
Dv50 = 0.027 µm
Dv50 = 0.034 µm
Dv50 = 0.025 µm
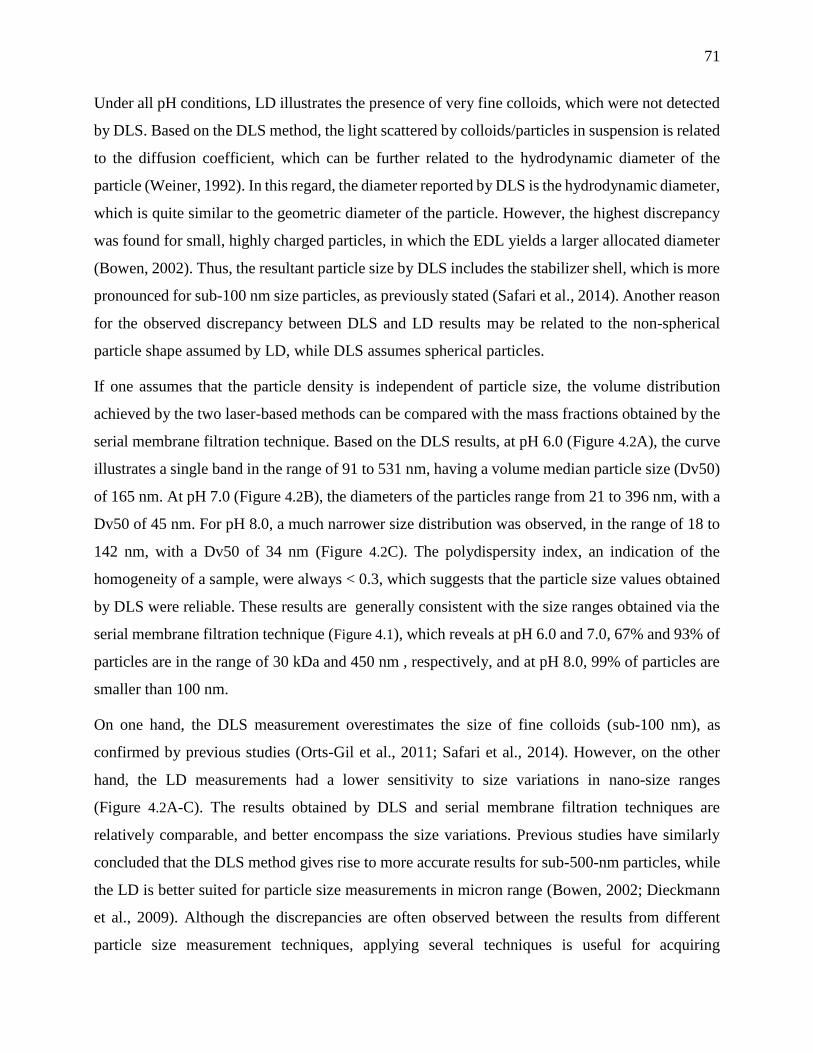
71
Under all pH conditions, LD illustrates the presence of very fine colloids, which were not detected
by DLS. Based on the DLS method, the light scattered by colloids/particles in suspension is related
to the diffusion coefficient, which can be further related to the hydrodynamic diameter of the
particle (Weiner, 1992). In this regard, the diameter reported by DLS is the hydrodynamic diameter,
which is quite similar to the geometric diameter of the particle. However, the highest discrepancy
was found for small, highly charged particles, in which the EDL yields a larger allocated diameter
(Bowen, 2002). Thus, the resultant particle size by DLS includes the stabilizer shell, which is more
pronounced for sub-100 nm size particles, as previously stated (Safari et al., 2014). Another reason
for the observed discrepancy between DLS and LD results may be related to the non-spherical
particle shape assumed by LD, while DLS assumes spherical particles.
If one assumes that the particle density is independent of particle size, the volume distribution
achieved by the two laser-based methods can be compared with the mass fractions obtained by the
serial membrane filtration technique. Based on the DLS results, at pH 6.0 (Figure 4.2A), the curve
illustrates a single band in the range of 91 to 531 nm, having a volume median particle size (Dv50)
of 165 nm. At pH 7.0 (Figure 4.2B), the diameters of the particles range from 21 to 396 nm, with a
Dv50 of 45 nm. For pH 8.0, a much narrower size distribution was observed, in the range of 18 to
142 nm, with a Dv50 of 34 nm (Figure 4.2C). The polydispersity index, an indication of the
homogeneity of a sample, were always < 0.3, which suggests that the particle size values obtained
by DLS were reliable. These results are generally consistent with the size ranges obtained via the
serial membrane filtration technique (Figure 4.1), which reveals at pH 6.0 and 7.0, 67% and 93% of
particles are in the range of 30 kDa and 450 nm , respectively, and at pH 8.0, 99% of particles are
smaller than 100 nm.
On one hand, the DLS measurement overestimates the size of fine colloids (sub-100 nm), as
confirmed by previous studies (Orts-Gil et al., 2011; Safari et al., 2014). However, on the other
hand, the LD measurements had a lower sensitivity to size variations in nano-size ranges
(Figure 4.2A-C). The results obtained by DLS and serial membrane filtration techniques are
relatively comparable, and better encompass the size variations. Previous studies have similarly
concluded that the DLS method gives rise to more accurate results for sub-500-nm particles, while
the LD is better suited for particle size measurements in micron range (Bowen, 2002; Dieckmann
et al., 2009). Although the discrepancies are often observed between the results from different
particle size measurement techniques, applying several techniques is useful for acquiring
72
information regarding the particle size distribution, as limitations were consistently encountered
with each method. Previous studies by Bowen (2002) and Dieckmann et al. (2009) also support
this conclusion.
4.3.2 Effect of ionic strength on particle size of oxidized manganese in water
The influence of ionic strength (or salinity) on the colloidal manganese dioxide stability was
investigated after oxidation of Mn(II) by KMnO4. In these experiments, the ionic strength of water
was adjusted using variable amounts of a 0.5 M NaCl stock solution. According to the serial
filtration analysis (Figure 4.3), upon increasing the ionic strength by 20-fold, larger particles were
observed. This indicates the occurrence of some aggregation, as a result of the reduction in the
electrostatic forces stabilizing the colloidal particles. However, these aggregates are still in the
nano-size range, and even at an ionic strength of 10 mM, more than 10% of manganese dioxide
was smaller than 0.45 µm. The ζ -potential of manganese dioxide particles was measured as a
function of ionic strength (Table 4.1). As indicated in Table 4.1, the ζ -potential becomes less
negative, from 3.2±9.42- to 6.0±2.37- , as the ionic strength increases from 0.5 mM to 10 mM,
implying a partial screening of the negative charges by the cationic species, i.e., Na+. However,
these changes were not very pronounced in the presence of monovalent salt (NaCl) at
concentrations typically occurring in natural waters.
Figure 4.3. Size fractions of manganese after oxidation at different ionic strength using membrane filters.
0
20
40
60
80
100
Ma
ng
an
es
e d
iox
ide
fra
cti
on
s (
%w
t)
Ionic strength (mM)
> 8um
3um - 8um
1.2um - 3um
0.45um - 1.2um
0.1um - 0.45um
30kDa - 0.1um
< 30kDa
0.5 1 10
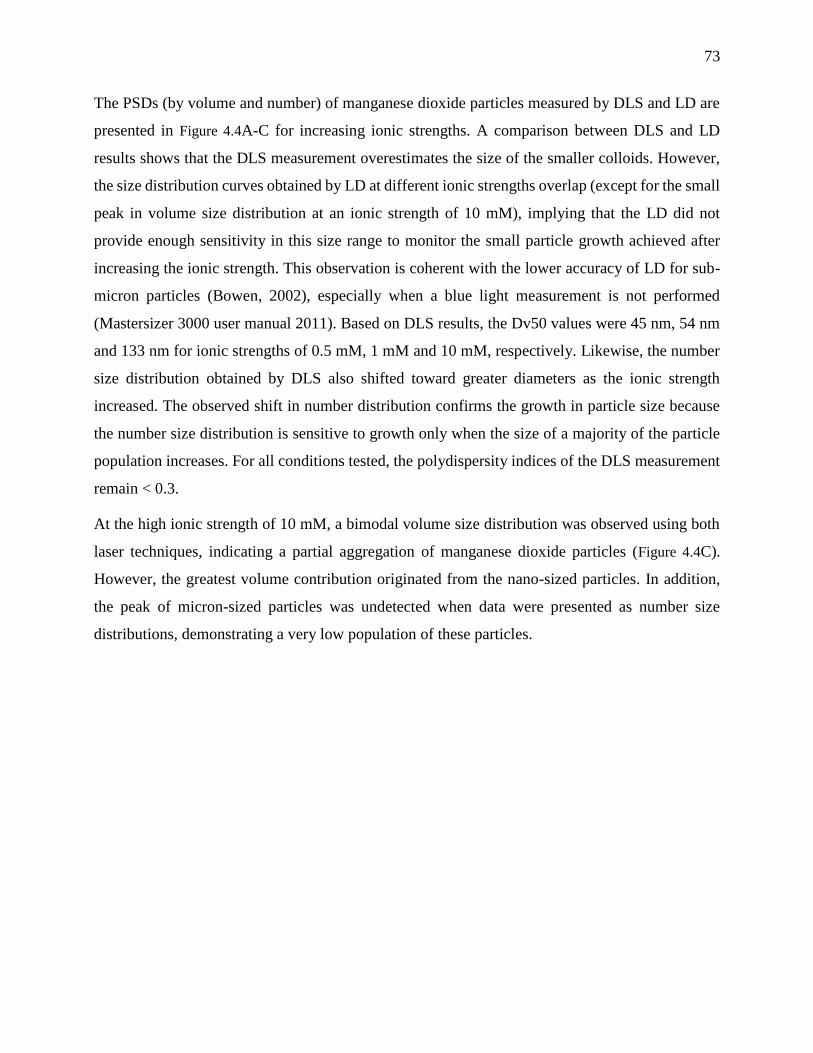
73
The PSDs (by volume and number) of manganese dioxide particles measured by DLS and LD are
presented in Figure 4.4A-C for increasing ionic strengths. A comparison between DLS and LD
results shows that the DLS measurement overestimates the size of the smaller colloids. However,
the size distribution curves obtained by LD at different ionic strengths overlap (except for the small
peak in volume size distribution at an ionic strength of 10 mM), implying that the LD did not
provide enough sensitivity in this size range to monitor the small particle growth achieved after
increasing the ionic strength. This observation is coherent with the lower accuracy of LD for sub-
micron particles (Bowen, 2002), especially when a blue light measurement is not performed
(Mastersizer 3000 user manual 2011). Based on DLS results, the Dv50 values were 45 nm, 54 nm
and 133 nm for ionic strengths of 0.5 mM, 1 mM and 10 mM, respectively. Likewise, the number
size distribution obtained by DLS also shifted toward greater diameters as the ionic strength
increased. The observed shift in number distribution confirms the growth in particle size because
the number size distribution is sensitive to growth only when the size of a majority of the particle
population increases. For all conditions tested, the polydispersity indices of the DLS measurement
remain < 0.3.
At the high ionic strength of 10 mM, a bimodal volume size distribution was observed using both
laser techniques, indicating a partial aggregation of manganese dioxide particles (Figure 4.4C).
However, the greatest volume contribution originated from the nano-sized particles. In addition,
the peak of micron-sized particles was undetected when data were presented as number size
distributions, demonstrating a very low population of these particles.
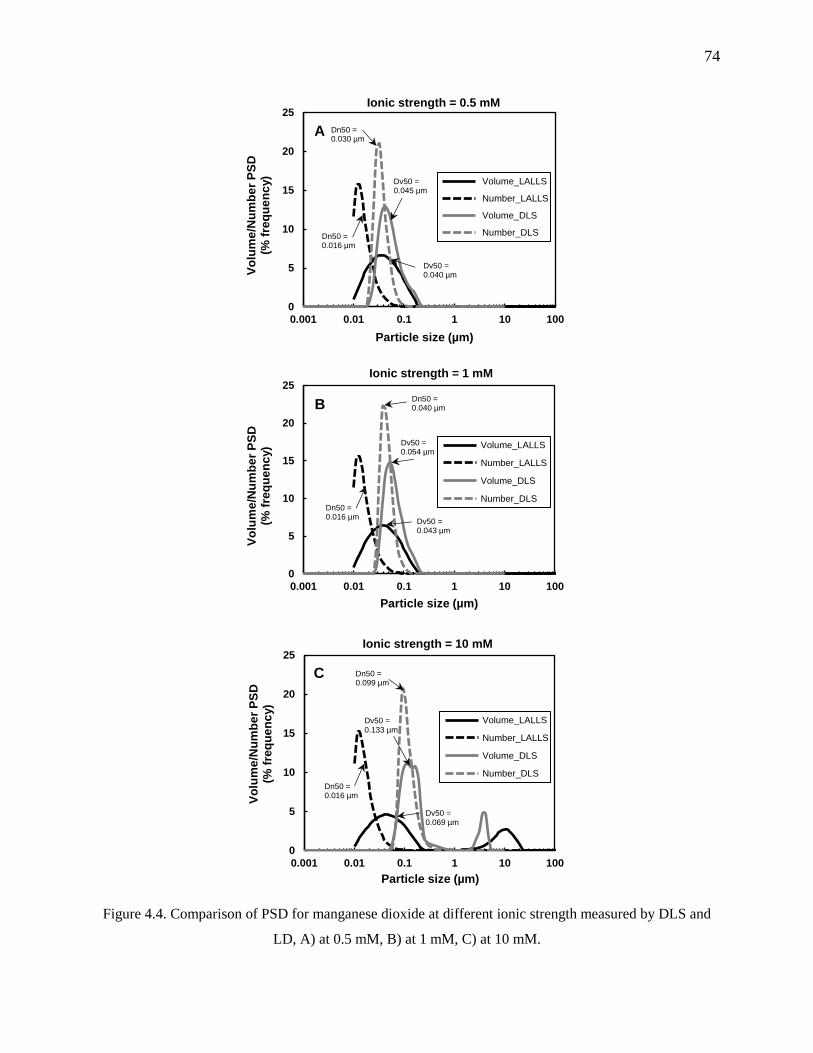
74
Figure 4.4. Comparison of PSD for manganese dioxide at different ionic strength measured by DLS and
LD, A) at 0.5 mM, B) at 1 mM, C) at 10 mM.
0
5
10
15
20
25
0.001 0.01 0.1 1 10 100
Vo
lum
e/N
um
be
r P
SD
(%
fre
qu
en
cy)
Particle size (µm)
Ionic strength = 0.5 mM
Volume_LALLS
Number_LALLS
Volume_DLS
Number_DLS
A
Dn50 = 0.016 µm
Dn50 = 0.030 µm
Dv50 = 0.045 µm
Dv50 = 0.040 µm
0
5
10
15
20
25
0.001 0.01 0.1 1 10 100
Vo
lum
e/N
um
be
r P
SD
(%
fre
qu
en
cy)
Particle size (µm)
Ionic strength = 1 mM
Volume_LALLS
Number_LALLS
Volume_DLS
Number_DLS
B
Dn50 = 0.016 µm
Dv50 = 0.043 µm
Dn50 = 0.040 µm
Dv50 = 0.054 µm
0
5
10
15
20
25
0.001 0.01 0.1 1 10 100
Vo
lum
e/N
um
be
r P
SD
(%
fre
qu
en
cy)
Particle size (µm)
Ionic strength = 10 mM
Volume_LALLS
Number_LALLS
Volume_DLS
Number_DLS
C
Dn50 = 0.016 µm
Dn50 = 0.099 µm
Dv50 = 0.133 µm
Dv50 = 0.069 µm
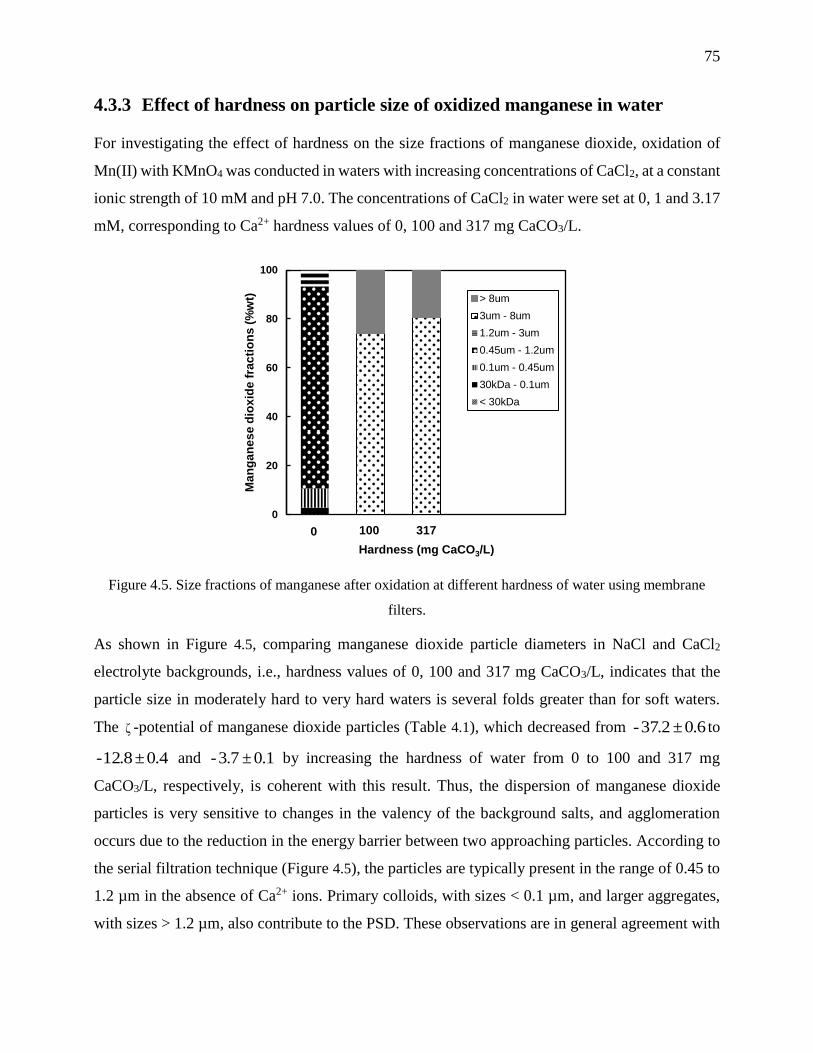
75
4.3.3 Effect of hardness on particle size of oxidized manganese in water
For investigating the effect of hardness on the size fractions of manganese dioxide, oxidation of
Mn(II) with KMnO4 was conducted in waters with increasing concentrations of CaCl2, at a constant
ionic strength of 10 mM and pH 7.0. The concentrations of CaCl2 in water were set at 0, 1 and 3.17
mM, corresponding to Ca2+ hardness values of 0, 100 and 317 mg CaCO3/L.
Figure 4.5. Size fractions of manganese after oxidation at different hardness of water using membrane
filters.
As shown in Figure 4.5, comparing manganese dioxide particle diameters in NaCl and CaCl2
electrolyte backgrounds, i.e., hardness values of 0, 100 and 317 mg CaCO3/L, indicates that the
particle size in moderately hard to very hard waters is several folds greater than for soft waters.
The ζ -potential of manganese dioxide particles (Table 4.1), which decreased from 6.0±2.37- to
4.0±8.12- and 1.0±7.3- by increasing the hardness of water from 0 to 100 and 317 mg
CaCO3/L, respectively, is coherent with this result. Thus, the dispersion of manganese dioxide
particles is very sensitive to changes in the valency of the background salts, and agglomeration
occurs due to the reduction in the energy barrier between two approaching particles. According to
the serial filtration technique (Figure 4.5), the particles are typically present in the range of 0.45 to
1.2 µm in the absence of Ca2+ ions. Primary colloids, with sizes < 0.1 µm, and larger aggregates,
with sizes > 1.2 µm, also contribute to the PSD. These observations are in general agreement with
0
20
40
60
80
100
Ma
ng
an
es
e d
iox
ide
fra
cti
on
s (
%w
t)
Hardness (mg CaCO3/L)
> 8um
3um - 8um
1.2um - 3um
0.45um - 1.2um
0.1um - 0.45um
30kDa - 0.1um
< 30kDa
0 100 317
76
the bimodal volume size distribution obtained by LD (Figure 4.6) in the absence of hardness,
indicating an incomplete aggregation of the smaller colloids. However, the number size distribution
suggests that the population of micron-sized aggregates is not significant. For the two higher
hardness conditions, a monomodal distribution with a very large Dv50 shift, to several tens of
microns, was measured which illustrates the agglomeration’s growth with increased hardness.
Based on LD results, the peaks of volume size distribution were found at diameters where nearly
no particles were characterized by the number size distribution. The ranges obtained by the number
size distribution (0.87 to 27.4 µm at a hardness value of 100, and 1.13 to 40.1 µm at a hardness
value of 317 mg CaCO3/L) are in good agreement with the serial filtration method as it reveals that
the majority of particles were actually in the 3 to 8 µm diameter range. Thus, although the volume
PSD is often used to characterize powders, the number-based PSD is less sensitive to analytical
imprecision as it is proportional to d rather than d3.
Figure 4.6. Comparison of PSD for manganese dioxide at different hardness (mg CaCO3/L) of water
measured by LD.
The DLS did not allow for measurement of the PSD at hardness values of 100 and 317 mg
CaCO3/L. This was due to the presence of large aggregates, with high polydispersity indices (>
0.8), and interference from sedimentation. As larger particles have a slower Brownian diffusion
rate, a longer analysis time is needed, which may give rise to sedimentation. In addition, it is
important to have a sufficient concentration of large particles to remain above the baseline. This is
0
2
4
6
8
10
12
14
16
18
20
0.001 0.01 0.1 1 10 100 1000
Vo
lum
e/N
um
be
r P
SD
(%
fre
qu
en
cy)
Particle size (µm)
Volume_hardness = 0 Volume_hardness = 100 Volume_hardness = 317
Number_hardness = 0 Number_hardness = 100 Number_hardness = 317
Dn50 = 0.016 µm
Dv50 = 0.069 µm
Dn50 = 1.5 µm
Dn50 = 1.9 µm
Dv50 = 17.2 µm
Dv50 = 21.9 µm

77
typically difficult to achieve for particles larger than 500 nm, as particle-particle interactions at
higher concentrations can have drastic effects on the analysis (Weiner, 1992). Nevertheless, this
result confirms extensive aggregation of manganese dioxide colloids in hard waters, as observed
with the other two methods.
4.3.4 Effect of pH, ionic strength and hardness on particle size of oxidized iron
in water
In natural waters, iron commonly co-occurs with manganese. However, to better understand the
characteristics of oxidized iron particles, Fe(II) was separately oxidized by sodium hypochlorite in
synthetic waters having the same characteristics (pH, ionic strength and hardness) as previously
mentioned. An Eh-pH stability diagram indicates that the dominant thermodynamically stable
species are ferric hydroxides under a pH range of 6.0 to 8.0 and in the presence of an oxidant
(Trudinger and Swaine, 1979).
Figure 4.7. Size fractions of iron in water after oxidation with sodium hypochlorite at different pH, ionic
strength and hardness.
Unlike manganese dioxide, the results obtained for ferric hydroxide particles using the serial
filtration technique and based on various water characteristics do not significantly differ from one
another. Likewise, no significant variation in the turbidity of the oxidized samples was observed
(results not shown). As shown in Figure 4.7, all ferric hydroxide particles are on the micron scale,
Total< 8µm
< 3µm
< 1.2µm
< 0.45µm
< 0.1µm
< 30kDa
0.0
1.0
2.0
3.0
4.0
5.0
6.0
7.0
Fe
rric
hyd
rox
ide
co
nc
en
tra
tio
ns
(m
g/L
)
78
and more than 80% (wt) are in the size range between 3 and 8 µm. These results are in general
agreement with the nearly zero ζ -potential achieved for different water quality conditions,
implying the rapid aggregation of ferric hydroxide particles. In Table 4.1, the IEP for ferric
hydroxide was found to be between a pH of 7 and 8, a result coherent with previous reports,
indicating pHs of 7.5-8.2 (Genz et al., 2004) and 7.5 (Kosmulski, 2009).
LD can potentially provide more informative results than the serial filtration technique regarding
the ferric hydroxide PSD. Figure 4.8 compares the number and volume size distribution results
obtained for various water characteristics (pH, ionic strength and hardness). Independent of the pH
(Figure 4.8A) or ionic strength (Figure 4.8B) applied in this study, the PSDs were nearly identical.
This result is consistent with observations for iron oxyhydroxide (Gilbert et al., 2007) and titanium
dioxide (French et al., 2009) nanoparticles. In contrast, increasing the Ca2+ concentration
(Figure 4.8C) led to a shift in the number size distribution toward larger particle diameters,
indicating a higher aggregation rate. The ζ -potential for ferric hydroxide at pH 7 increased from
1.0±4.1 to 1.0±9.4 and 8.0±5.7 mV by increasing the Ca2+ concentration from 0 to 1 and 3.17
mM, respectively. Therefore, the higher aggregate growth rate is not due to a charge neutralization
mechanism. The bridging of Ca2+ cations between ferric hydroxide particles is most likely
responsible for this phenomenon (Elimelech et al., 1995)
Increasing the Ca2+ hardness from 0 to 100 and 317 mg CaCO3/L led to a significant shift in the
volume size distributions. At a hardness value of 317 mg CaCO3/L (Figure 4.8C), the entire volume
size distribution is characterized by diameters larger than 240 µm, with a Dv50 of 1000 µm.
However, results obtained via serial filtration reveal that the majority of particle diameters actually
ranged between 3 and 8 mμ (80%), which is in good agreement with the number size distribution
obtained by LD (82%). Therefore, the use of the number PSD is recommended while using LD for
characterizing agglomerating systems such as flocculation.

79
Figure 4.8. Comparison of PSD for ferric hydroxide at different water characteristics measured by LD, A)
Effect of pH, B) Effect of ionic strength (mM), C) Effect of hardness (mg CaCO3/L).
0
5
10
15
20
25
0.01 0.1 1 10 100 1000 10000
Vo
lum
e/N
um
be
r P
SD
(%
fre
qu
en
cy)
Particle size (µm)
Volume_pH = 6 Volume_pH = 7 Volume_pH = 8
Number_pH = 6 Number_pH = 7 Number_pH = 8
A
Dn50 = 2.1 µm
Dn50 = 2.2 µm
Dn50 = 2.4 µm
Dv50 = 14.7 µm
Dv50 = 14.1 µm
Dv50 = 12.8 µm
0
5
10
15
20
25
0.01 0.1 1 10 100 1000 10000
Vo
lum
e/N
um
be
r P
SD
(%
fre
qu
en
cy)
Particle size (µm)
Volume_0.5 mM Volume_1 mM Volume_10 mM
Number_0.5 mM Number_1 mM Number_10 mM
B
Dv50 = 14.5 µm
Dn50 = 2.2 µm
Dv50 = 14.1 µm
Dv50 = 14.7 µm
Dn50 = 2.4 µm
Dn50 = 3.6 µm
0
5
10
15
20
25
0.01 0.1 1 10 100 1000 10000
Vo
lum
e/N
um
be
r P
SD
(%
fre
qu
en
cy)
Particle size (µm)
Volume_0 mg CaCO3/L Volume_100 mg CaCO3/L Volume_317 mg CaCO3/L
Number_0 mg CaCO3/L Number_100 mg CaCO3/L Number_317 mg CaCO3/L
C
Dn50 = 3.7 µm
Dv50 = 14.7 µm
Dn50 = 3.6 µm Dv50 =
690 µm
Dv50 = 1000 µm
Dn50 = 5.8 µm
80
4.4 Conclusions
The present contribution comprises two parts: first, the effects of pH, salinity and hardness on the
stability and size fractions of oxidized iron and manganese in water treatment systems were
analyzed; second, the size results obtained using LD versus DLS, as well as fractionation through
a series of membrane filters were compared.
The pH, ionic strength and salt valency (i.e., Ca2+ vs. Na+) affect the ζ -potential, and
consequently, the size of manganese dioxide in water. Destabilization of colloidal manganese
dioxide is mainly induced by charge neutralization. Under conditions relevant to water
treatment, the sensitivity of the ferric hydroxide surface charge and particle size to pH and ionic
strength is negligible.
Among the studied parameters, the concentration of Ca2+ (hardness of water) strongly governs
the destabilization of colloidal manganese dioxide, as micron-sized aggregates were formed in
hard waters. Thus, the oxidative removal of manganese from groundwater with elevated Ca2+
should be easier than surface waters with low hardness values. In addition, the results imply
that the addition of lime, rather than caustic soda, should be used for pH adjustment in systems
practicing pH increases prior to coagulation followed by oxidation prior to filtration.
The oxidative removal of manganese is more problematic than iron due to the formation of
colloidal manganese as small as several tens of nanometers, especially in the case of soft waters
with low salinity and high pH.
For stabilized inorganic colloids, such as manganese dioxide in the absence of divalent cations,
DLS detects nanoparticles, including the shell, which creates uncertainties regarding the onset
of the PSD. This technique also suffers from the effect of polydispersity and the presence of
aggregates. However, it is well adapted to sub-micron particles with narrow size ranges.
Since it offers lower sensitivity and accuracy in the sub-micron ranges, the LD method is
generally more suitable to characterize micron-sized particles. However, in agglomerating
systems, the results must be interpreted with great care, and comparison with other methods is
advised.
Serial filtration technique is recommended as a simple option for general evaluation of particle
size because (i) the availability of both laser based technique is not that common in the water
industry and (ii) this method proved to be adequate to characterize the PSD.

81
Acknowledgments
The financial support of RESE’EAU-WATERNET, a NSERC collaborative strategic network
(Grant No. 364635-07), is greatly appreciated. We also thank the CREDEAU laboratories at École
Polytechnique de Montréal for providing the facilities to conduct the study.

82
CHAPTER 5 ARTICLE 2 : UNDERSTANDING ULTRAFILTRATION
FOULING OF CERAMIC AND POLYMERIC MEMBRANES CAUSED
BY OXIDIZED IRON AND MANGANESE IN WATER TREATMENT
This chapter presents an article published in the Journal of Membrane Science, 516 (2016). In this
work, removal of iron and manganese and the associated fouling during the peroxidation-UF
membrane process were investigated. The performance of ceramic versus polymeric UF membrane
were subsequently compared applying constant flux blocking law model. In addition, the
resistance-in-series model was adopted to quantitatively analyze the effectiveness of cleaning
processes and reversibility of fouling.
Understanding Ultrafiltration Fouling of Ceramic and Polymeric Membranes Caused by
Oxidized Iron and Manganese in Water Treatment
Seyedeh Laleh Dashtban Kenari* and Benoit Barbeau
Polytechnique Montreal, Department of Civil, Geological and Mining Engineering, NSERC-
Industrial Chair on Drinking Water, Environment, C.P. 6079, Succursale Centre-Ville, Montreal,
QC, H3C 3A7, Canada.
* Corresponding author: Tel: +1 514 340-4711 #2983; Fax: 514-340-5918;
E-mail: [email protected]
83
ABSTRACT
Ultrafiltration (UF) with ceramic membrane has attracted growing attention in drinking water
treatment. In this regard, a ceramic and a polymeric UF membrane process with in-line pre-
oxidation has been applied for iron and manganese control in water. The effect of water chemistry
including pH, ionic strength and hardness on the characteristics of oxidized iron and manganese
aggregates, and subsequent UF fouling behavior were evaluated. The fouling of constant flux dead-
end UF membranes was assessed using blocking law and resistance-in-series model analyses.
Results suggest that the water chemistry did not have a notable impact on the overall iron and
manganese removal efficiencies but did contribute to the extent of fouling caused by manganese
dioxide aggregates. The resistance of the cake layer and its compressibility could be explained by
the manganese dioxide aggregate properties, such as size, ζ -potential and fractal dimension, which
were controlled by the water chemistry. However, the cake formed by ferric hydroxide aggregates
induced very low and comparable resistance to the membranes under all conditions, in line with
the similar aggregate properties. The fouling behavior of ceramic membrane was generally similar
to that of polymeric one, however, the reversibility of the fouling differed from one another.
Overall, this work provides further insight on the fouling of ferric hydroxide and manganese
dioxide in water treatment.
KEYWORDS: Water treatment; Iron/manganese control; Constant flux dead-end ultrafiltration;
Ceramic/polymeric membrane; Fouling resistance.
5.1 Introduction
Iron and manganese commonly occur in groundwater and some sources of surface water from
weathering of metal-bearing minerals and rocks, leaching from soils rich in organic matter,
contamination by industrial effluents and thermal stratification in lakes. Among different water
sources, groundwater frequently contains high levels of dissolved iron and manganese arising from
more reduced redox conditions. The presence of these metals in finished water creates aesthetic
issues, such as colored water formation, increased turbidity, metallic taste, odor, and staining of
laundry and plumbing fixture (World Health Organization (WHO), 2008). In this regard, the United
States Environmental Protection Agency (United States Environmental Protection Agency

84
(USEPA), 2004) and Guidelines for Canadian Drinking Water Quality (Health Canada, 2010) have
recommended an aesthetic objective limit of 0.3 and 0.05 mg/L for the concentrations of iron and
manganese in drinking water, respectively. However, iron and manganese concentrations as low as
0.05 (World Health Organization (WHO), 2003) and 0.02 mg/L (Sly et al., 1990), respectively,
may still cause aesthetic problems. In addition, manganese control in drinking water is receiving
an increased attention due to its potential neurotoxicity (Wasserman et al., 2006; Tuschl et al.,
2013). Manganese intake from water ingestion has been associated with intellectual impairment in
children, even at low concentrations (<0.25 mg/L) (Bouchard et al., 2011). Thus, it is crucial to
effectively control the concentration of manganese in drinking water.
A common treatment strategy for iron and manganese control in drinking water includes oxidation
of dissolved iron and manganese followed by separation of oxidized particles from water.
Traditional processes to remove particulate and colloidal matter from water are coagulation,
flocculation, sedimentation and granular media filtration, which have drawbacks of operating in
successive steps heterogeneous reactions that require significant contact time and, therefore,
process footprint. Furthermore, oxidized manganese is not always effectively removed by such
treatment technologies (Carlson et al., 1997) due to its propensity to form negatively charged
colloids (Morgan and Stumm, 1964; Dashtban Kenari and Barbeau, 2016a). Alternatively, compact
membrane processes, such as microfiltration (MF) and ultrafiltration (UF), are increasingly used in
water treatment facilities for filtration of dilute suspensions containing fine particles and colloids
based on size exclusion (Crittenden et al., 2012). Management of membrane fouling is an important
limitation of this technology. As opposed to surface water systems where organic fouling is
dominant, management of inorganic fouling caused by iron/manganese is of importance for many
UF/MF groundwater systems.
Several factors impact membrane fouling including membrane types and material properties,
operating conditions, process configuration, cleaning strategies and feed solution characteristics
(Crittenden et al., 2012; Lee and Kim, 2014). In recent years, application of ceramic membranes
has been receiving growing attention due to their inherent advantages over conventional polymeric
membranes. Namely, ceramic membranes offer superior chemical, thermal and mechanical
stability allowing much more aggressive physical and chemical cleaning approaches which can
prolong their life expectancy. In addition, the higher integrity and reliability of ceramic membranes
would reduce the repetitive testing, repair and replacement of membrane modules leading to
85
savings in operation cost (Pendergast and Hoek, 2011). In spite of the high potential of ceramic
membrane application for iron/manganese removal, their fundamental fouling behavior caused by
ferric hydroxide and manganese dioxide particles has not yet been documented.
Regarding feed water characteristics, it is expected that membrane performance during filtration of
metal oxide colloids and particles will be considerably impacted by pH, ionic strength and salt
valency as these parameters are known to have an impact on particle-particle and particle-
membrane interactions (Lee et al., 2003; Santiwong et al., 2008). Moreover, changes in pH, ionic
strength and salt valency may alter water permeability of MF/UF membranes, even though salt
rejection is negligible in these systems (Huisman and Dutre, 1997; Faibish et al., 1998; Zhao et al.,
2005; Manttari et al., 2006). Consequently, understanding the behavior and characteristics of ferric
hydroxide and manganese dioxide particles deposition on UF/MF membranes is of interest for their
application for iron and manganese control in drinking water.
This study aimed to investigate the removal of iron/manganese oxides and the associated fouling
during the operation of pre-oxidized dead-end UF ceramic or polymeric membranes.
Characteristics (such as size, ζ -potential and fractal dimension) of ferric hydroxide and manganese
dioxide aggregates achieved under various water chemistry conditions, were assessed against the
fouling behaviors that they produced on UF membranes. The performance of ceramic versus
polymeric UF membrane with respect to the extent of fouling and iron/manganese removal were
then compared. Constant flux blocking law model was applied to determine the specific resistance
and the compressibility of the filter cake. Finally, the resistance-in-series model was applied to
quantitatively analyze the advantage of ceramic membrane with respect to the cleaning processes
effectiveness and reversibility of fouling.
5.2 Materials and methods
5.2.1 UF membranes
Although the majority of membranes that have been using in industries are hollow fiber polymeric
membranes and tubular ceramic membranes, most of the publications focused on the fouling
behavior of a simple disc-type membrane. These results could not well predict the rate and extent
of fouling in full-scale plant (Carroll and Booker, 2000). In this study, two types of UF membranes,
which are relevant for industrial applications, were selected. A hollow fiber polymeric membrane,

86
UFC M5, composed of a blend of polyvinylpyrrolidone and polyethersulfone with a nominal
molecular weight cut off (MWCO) of 200 kDa was used (Norit X-Flow, Enschede, The
Netherlands). The membrane contains 93 fibers with an inner diameter of 0.8 mm, a length of 300
mm and an effective filtration area of 700 cm2. This membrane is resistant to temperature up to
40oC and pressure up to 300 kPa and its tolerance to pH ranges from 2 to 12. A single-channel
tubular ceramic UF membrane with an outer diameter of 10 mm, an inner diameter of 6 mm, a
length of 500 mm and a filtration area of 95 cm2 was purchased from Atech Innovations GmbH
(Gladbeck, Germany). This asymmetric membrane is made of zirconium dioxide and a support of
α -aluminum oxide with open pores which provides maximum permeability and high mechanical
stability. According to the manufacturer, the nominal MWCO of the membrane is 150 kDa. The
membrane is resistant to a pressure up to 1 MP, and pH of 0-14. The initial permeability of the
ceramic and the polymeric membranes were measured as 780 and 840 LMH/bar, respectively,
using demineralized (DM) water at pH 6 and 20oC. The specifications of the ceramic and polymeric
membranes are summarized in Table 5.1.
The pore size of the membranes was estimated from the Stokes-Einstein equation (Kawakatsu et
al., 1993). Accordingly, the pore size of 150-kDa ceramic membrane and 200-kDa polymeric
membrane are approximately 17 nm and 19 nm, respectively.
Table 5.1. Specifications of ceramic and polymeric membranes utilized in this study.
Manufacturer Material Surface area
(cm2)
MWCOc
(kDa)
Permeability
(LMH/bar) at 20oC
pH
stabilityd
Temp.
Stabilityd (oC)
Pressure
Stabilityd (kPa)
Norit (polymeric) PES/PVPa 700 200 840 2-12 40 300
Atech (ceramic) ZrO2/Al2O3b 95 150 780 0-14 N.A. 1000
a Polyethersulfone/polyvinylpyrrolidone b Zirconium dioxide/ α -aluminum oxide c Molecular weight cut off
d Reported by manufacturer
N.A.: Not available
5.2.2 Preparation of synthetic feedwater (SFW)
A fresh SFW was prepared prior to each experiment via addition of appropriate amount of sodium
chloride, calcium chloride dihydrate and sodium bicarbonate stock solutions to demineralized
(DM) water to achieve the final desired ionic strengths (0.5, 1.0 and 10 mM), pHs (6, 7 and 8) and
hardness values (0, 100 and 317 mg CaCO3/L). The pH of the SFW was then adjusted by bubbling
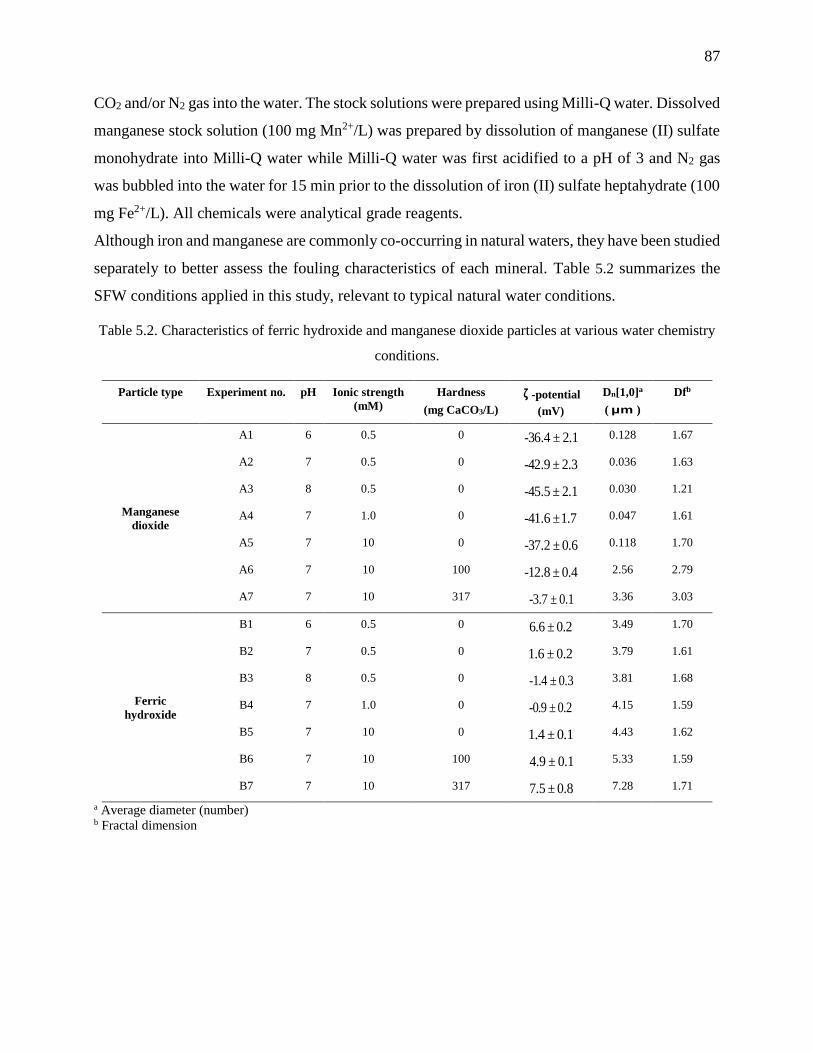
87
CO2 and/or N2 gas into the water. The stock solutions were prepared using Milli-Q water. Dissolved
manganese stock solution (100 mg Mn2+/L) was prepared by dissolution of manganese (II) sulfate
monohydrate into Milli-Q water while Milli-Q water was first acidified to a pH of 3 and N2 gas
was bubbled into the water for 15 min prior to the dissolution of iron (II) sulfate heptahydrate (100
mg Fe2+/L). All chemicals were analytical grade reagents.
Although iron and manganese are commonly co-occurring in natural waters, they have been studied
separately to better assess the fouling characteristics of each mineral. Table 5.2 summarizes the
SFW conditions applied in this study, relevant to typical natural water conditions.
Table 5.2. Characteristics of ferric hydroxide and manganese dioxide particles at various water chemistry
conditions.
Particle type Experiment no. pH Ionic strength
(mM)
Hardness
(mg CaCO3/L)
ζ -potential
(mV)
Dn[1,0]a
( mμ )
Dfb
Manganese
dioxide
A1 6 0.5 0 1.2±4.36- 0.128 1.67
A2 7 0.5 0 3.2±9.42- 0.036 1.63
A3 8 0.5 0 1.2±5.45- 0.030 1.21
A4 7 1.0 0 7.1±6.41- 0.047 1.61
A5 7 10 0 6.0±2.37- 0.118 1.70
A6 7 10 100 4.0±8.12- 2.56 2.79
A7 7 10 317 1.0±7.3- 3.36 3.03
Ferric
hydroxide
B1 6 0.5 0 2.0±6.6 3.49 1.70
B2 7 0.5 0 2.0±6.1 3.79 1.61
B3 8 0.5 0 3.0±-1.4 3.81 1.68
B4 7 1.0 0 2.0±-0.9 4.15 1.59
B5 7 10 0 1.0±4.1 4.43 1.62
B6 7 10 100 1.0±9.4 5.33 1.59
B7 7 10 317 8.0±5.7 7.28 1.71
a Average diameter (number) b Fractal dimension
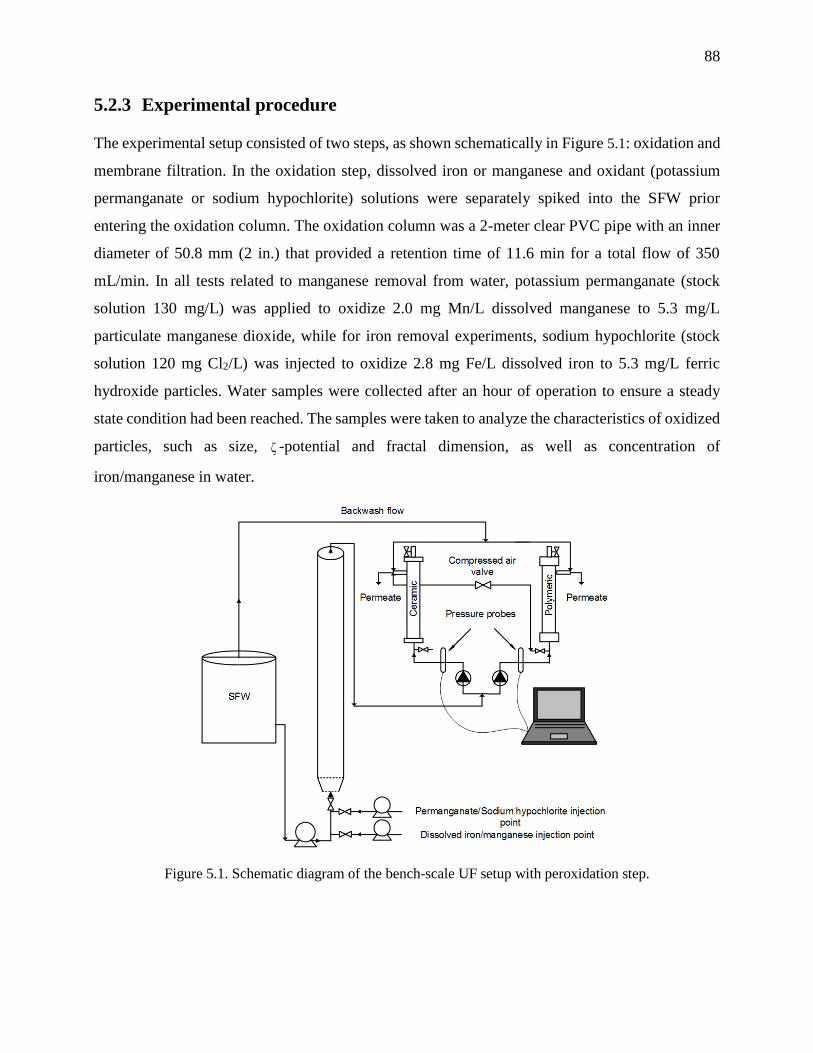
88
5.2.3 Experimental procedure
The experimental setup consisted of two steps, as shown schematically in Figure 5.1: oxidation and
membrane filtration. In the oxidation step, dissolved iron or manganese and oxidant (potassium
permanganate or sodium hypochlorite) solutions were separately spiked into the SFW prior
entering the oxidation column. The oxidation column was a 2-meter clear PVC pipe with an inner
diameter of 50.8 mm (2 in.) that provided a retention time of 11.6 min for a total flow of 350
mL/min. In all tests related to manganese removal from water, potassium permanganate (stock
solution 130 mg/L) was applied to oxidize 2.0 mg Mn/L dissolved manganese to 5.3 mg/L
particulate manganese dioxide, while for iron removal experiments, sodium hypochlorite (stock
solution 120 mg Cl2/L) was injected to oxidize 2.8 mg Fe/L dissolved iron to 5.3 mg/L ferric
hydroxide particles. Water samples were collected after an hour of operation to ensure a steady
state condition had been reached. The samples were taken to analyze the characteristics of oxidized
particles, such as size, ζ -potential and fractal dimension, as well as concentration of
iron/manganese in water.
Figure 5.1. Schematic diagram of the bench-scale UF setup with peroxidation step.
89
The membrane filtration part consisted of two UF membranes operated in parallel. The experiments
were conducted under dead-end constant-flux filtration mode, similar to that of most water and
waste-water treatment plants. The flow direction was inside-out for both membranes.
Preliminary tests with DM water revealed that the intrinsic resistance of both membranes was
independent of applied pressure over the range employed in this study. However, the permeability
results indicated that the intrinsic membrane resistance and subsequently the initial permeability of
both membranes were a function of water characteristics, i.e. pH, ionic strength and salt valency,
as indicated in previous studies (Huisman and Dutre, 1997; Faibish et al., 1998; Zhao et al., 2005;
Manttari et al., 2006). Prior to the filtration experiment, the clean membrane resistance was
determined by filtering DM water. Then, the particle-free SFW, under the specific pH, ionic
strength and hardness, was passed through the membranes, at the desired flux, until a steady
pressure was obtained. The feed suspension, i.e. the effluent from the oxidation column, was then
introduced into the UF membranes an hour after initiation of oxidation. In all fouling experiments,
a constant (and high) flux of 200 LMH was maintained for 150 min by a peristaltic pump
(MasterFlex, Cole-Parmer Instrument) on each membrane. Permeate samples were taken at the
initial and end of filtration experiment to measure the concentration of iron and manganese in water.
The TMP was continuously recorded every 15 s via a pressure transducer (Omega, PX409-
030GUSB) using a data acquisition software (TRH Central). At the end of each experiment,
physical cleaning followed by a chemical cleaning were carried out. All filtration experiments were
duplicated and performed at 23 1oC.
5.2.4 Membrane cleaning procedures
Before starting the experiments, virgin membranes were first cleaned with citric acid solution (2
wt% for the ceramic membrane and 1 wt% for the polymeric one) at a flux of 100 LMH for 30 min.
Then, the membranes were rinsed with DM water and cleaned again with sodium hypochlorite
solution (500 mg Cl2/L for the ceramic membrane and 200 mg Cl2/L for the polymeric one) at the
same flux of 100 LMH for another 30 min. After these cleaning steps, the membranes were rinsed
thoroughly with DM water, and the clean water permeability of the membranes was calculated by
measuring the TMP at increasing water fluxes.
Physical cleaning was performed at the end of each filtration experiment. Backwashing was first
conducted for both membranes using particle-free SFW for 3 min at a flux of 400 LMH (twice the

90
operating flux). After this step, the physical cleaning of the ceramic membrane was further
enhanced by backwashing with air scouring for 5 s at 400 kPa, while forward flushing with air was
limited to 200 kPa for polymeric membrane to maintain its integrity, as suggested by the supplier.
Chemical cleaning was performed as follow: for the ceramic membrane, 1.0 L of 2 wt% citric acid
at 50oC was recirculated for 30 min, while the polymeric one was cleaned by recirculating 1.0 L of
1 wt% citric acid at 30oC for 30 min. The pH of citric acid solutions were adjusted to 1 and 2 using
0.1 N HCl for the ceramic and polymeric membranes, respectively. In this investigation, acid
cleaning was always found to be sufficient to recover the clean water permeability of the
membranes.
5.2.5 Particle characterization
The size distribution of ferric hydroxide and manganese dioxide particles and/or aggregates in
membrane feed water were determined using dynamic light scattering (Zetasizer Nano-ZS,
Malvern, UK) or static light scattering (Mastersizer 3000, Malvern, UK) techniques. Dynamic light
scattering is better suited for sub-micron colloids, while static light scattering instrument is well
adapted to determine the size of larger aggregates (> 1 µm). Due to the higher sensitivity of
membrane filtration process to smaller particles, number-based size distribution was used to
interpret the results. The average aggregate size was calculated as the mean of this size distribution
(D[1,0]). Ten consecutive measurements were taken to ensure the repeatability of the analysis.
The Zetasizer Nano-ZS was also employed to determine electrophoretic mobility and ζ -potential
of the particles and/or aggregates in water using the Smoluchowski equation. Triplicate
measurements were performed for each sample.
Spatial structure of aggregates in terms of fractal dimension, Df , was also estimated in this study.
For Euclidean objects, the fractal dimension is 1 for a straight line, 2 for a sheet and 3 for a solid
sphere, while fractal aggregates show non-Euclidean dimensionality and take non-integer values
of fractal dimension. The high fractal dimensions, values approaching 3, indicate compact nearly
spherical aggregates, whereas more amorphous and less compact aggregates have low fractal
dimensions, values approaching 1 (Jefferson and Jarvis, 2006).
The fractal dimensions of aggregates were calculated from static light scattering data obtained
using the Malvern Mastersizer 3000. In this apparatus, a stirred sampling unit is used to introduce
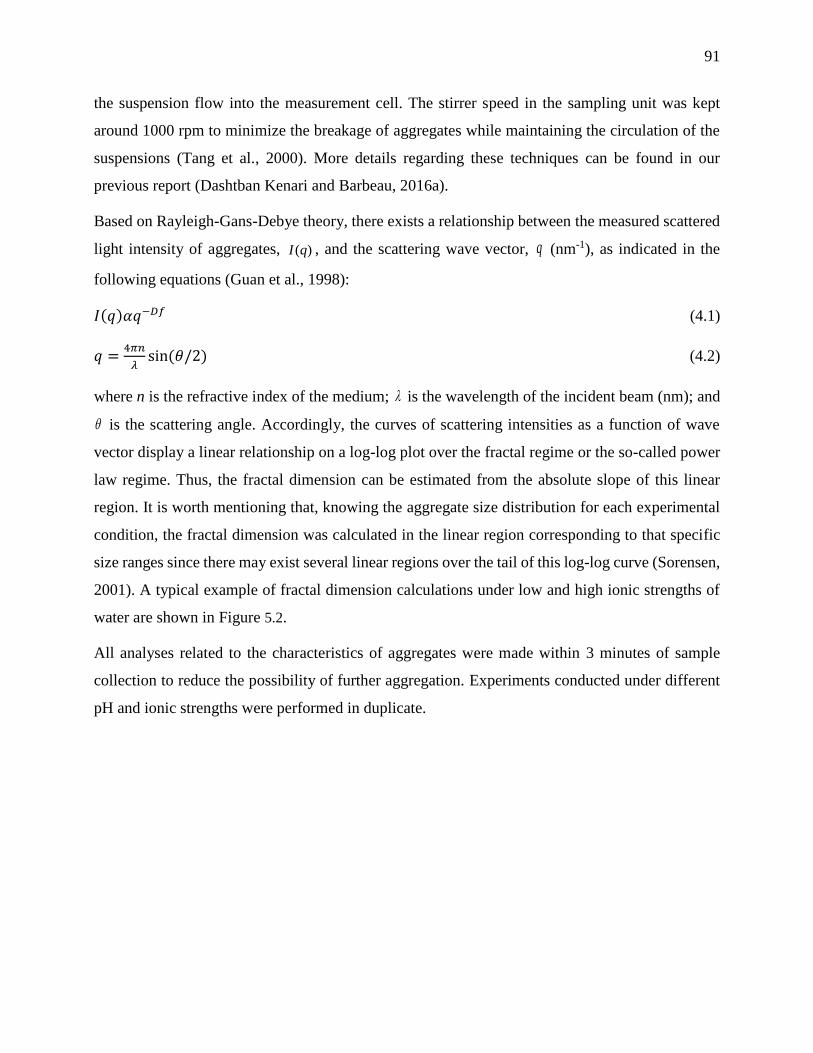
91
the suspension flow into the measurement cell. The stirrer speed in the sampling unit was kept
around 1000 rpm to minimize the breakage of aggregates while maintaining the circulation of the
suspensions (Tang et al., 2000). More details regarding these techniques can be found in our
previous report (Dashtban Kenari and Barbeau, 2016a).
Based on Rayleigh-Gans-Debye theory, there exists a relationship between the measured scattered
light intensity of aggregates, )(qI , and the scattering wave vector, q (nm-1), as indicated in the
following equations (Guan et al., 1998):
𝐼(𝑞)𝛼𝑞−𝐷𝑓 (4.1)
𝑞 =4𝜋𝑛
𝜆sin(𝜃/2) (4.2)
where n is the refractive index of the medium; is the wavelength of the incident beam (nm); and
is the scattering angle. Accordingly, the curves of scattering intensities as a function of wave
vector display a linear relationship on a log-log plot over the fractal regime or the so-called power
law regime. Thus, the fractal dimension can be estimated from the absolute slope of this linear
region. It is worth mentioning that, knowing the aggregate size distribution for each experimental
condition, the fractal dimension was calculated in the linear region corresponding to that specific
size ranges since there may exist several linear regions over the tail of this log-log curve (Sorensen,
2001). A typical example of fractal dimension calculations under low and high ionic strengths of
water are shown in Figure 5.2.
All analyses related to the characteristics of aggregates were made within 3 minutes of sample
collection to reduce the possibility of further aggregation. Experiments conducted under different
pH and ionic strengths were performed in duplicate.
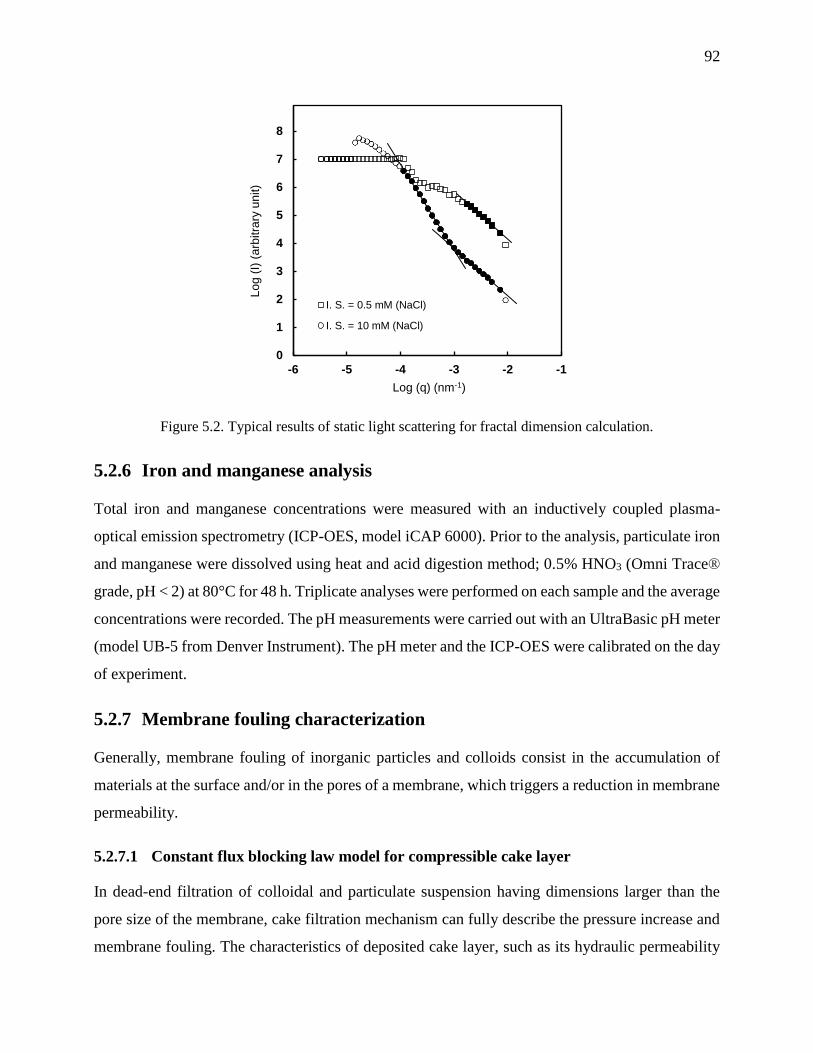
92
Figure 5.2. Typical results of static light scattering for fractal dimension calculation.
5.2.6 Iron and manganese analysis
Total iron and manganese concentrations were measured with an inductively coupled plasma-
optical emission spectrometry (ICP-OES, model iCAP 6000). Prior to the analysis, particulate iron
and manganese were dissolved using heat and acid digestion method; 0.5% HNO3 (Omni Trace®
grade, pH < 2) at 80°C for 48 h. Triplicate analyses were performed on each sample and the average
concentrations were recorded. The pH measurements were carried out with an UltraBasic pH meter
(model UB-5 from Denver Instrument). The pH meter and the ICP-OES were calibrated on the day
of experiment.
5.2.7 Membrane fouling characterization
Generally, membrane fouling of inorganic particles and colloids consist in the accumulation of
materials at the surface and/or in the pores of a membrane, which triggers a reduction in membrane
permeability.
5.2.7.1 Constant flux blocking law model for compressible cake layer
In dead-end filtration of colloidal and particulate suspension having dimensions larger than the
pore size of the membrane, cake filtration mechanism can fully describe the pressure increase and
membrane fouling. The characteristics of deposited cake layer, such as its hydraulic permeability
0
1
2
3
4
5
6
7
8
-6 -5 -4 -3 -2 -1
Lo
g (
I) (
arb
itra
ry u
nit)
Log (q) (nm-1)
I. S. = 0.5 mM (NaCl)
I. S. = 10 mM (NaCl)

93
and compressibility, are mainly dependent on the type of foulant and water chemistry condition
(Shirazi et al., 2010). According to the Darcy’s law, the flow through the clean and fouled
membrane, Q (m3/s), can be written as:
𝑄 =Δ𝑃0𝐴0
𝜇𝑅𝑚 (4.3)
𝑄 =Δ𝑃𝐴0
𝜇(𝑅𝑐+𝑅𝑚) (4.4)
where 0P and P are initial and final transmembrane pressures (kPa), respectively;
0A is the
membrane surface area (m2); mR is the intrinsic membrane resistance (m-1);
cR is the cake layer
resistance (m-1); and is the viscosity of the fluid (kPa.s). The cake layer resistance can be
expressed in terms of the average specific cake resistance, aveα (m/kg), as follows:
𝑅𝑐 = 𝛼𝑎𝑣𝑒𝑐𝑏𝑉𝑠 (4.5)
where bc is the bulk concentration (kg/m3); and
SV is the volume of permeate per unit membrane
area (m3/m2). Eq. (4.6) was derived from the combination of Eqs. (4.3), (4.4) and (4.5) that
expresses the increase in TMP at constant flux during incompressible cake filtration, in which the
specific cake resistance remains constant throughout the experiment.
∆𝑃 =𝑄𝜇(𝛼𝑐𝑏𝑉𝑠+𝑅𝑚)
𝐴0= ∆𝑃0 +
𝑄𝜇𝛼𝑐𝑏
𝐴0𝑉𝑠 (4.6)
However, the filter cake of many natural materials, such as clays, microbial cells and flocculated
colloidal maters, is compressible to some degree (Chellam and Xu, 2006; Singh and Song, 2006).
During water and waste water treatment, the specific cake resistance, (m/kg), often increases
according to a power law (Chellam and Xu, 2006; Sorensen and Sorensen, 1997; Chellam et al.,
1998):
𝛼 = 𝛽∆𝑃𝑛′ (4.7)
where (m/kg/kPan’) and n' are empirical constants. is related principally to the size and shape
of the particles, and the dimensionless parameter n' is the cake compressibility coefficient varying
from zero for an incompressible cake to nearly 1 for a highly compressible cake. Substituting Eq.
(4.7) in Eq. (4.6) gives rise to the following equation (Huisman and Dutre, 1997):
∆𝑃 = ∆𝑃0 +𝑄𝜇𝑐𝑏
𝐴0𝛽∆𝑃𝑛′
𝑉𝑠 (4.8)
94
In order to determine the compressibility parameters, experimental pressure data were directly
fitted to Eq. (4.8) using a curve-fitting tool in Matlab (R2015a) with a trust region method resulting
in the smallest sum of squared residuals.
5.2.7.2 Resistance-in-series model for quantifying membrane fouling
The reversibility of fouling was quantified by the resistance-in-series model (Eq. (4.9)), as follows:
𝐽 =∆𝑃
𝜇𝑅𝑡=
∆𝑃
𝜇(𝑅𝑚+𝑅𝑝𝑟+𝑅𝑐𝑟+𝑅𝑖𝑓) (4.9)
where J is the flux (m/s); Rt is the total resistance (m-1); Rpr is the physically reversible resistance
(the portion of fouling that can be recovered by backwash and air scouring) (m-1); Rcr is the
chemically reversible resistance (m-1); and Rif is the chemically irreversible fouling (m-1).
Rm was calculated before each experiment by measuring the particle-free SFW permeability of the
membranes. Rpr was obtained after physical cleaning step by measuring the stabilized TMP of
particle free SFW at the operating flux and temperature. The difference between this TMP and the
TMP at the end of filtration was used for Rpr determination. Rcr was calculated from the difference
between the stabilized TMP before and after the chemical cleaning step. The Rif was back-
calculated from the difference between Rt and the sum of Rm, Rpr, and Rcr.
5.3 Results and discussion
This section presents iron and manganese removal performance and UF fouling under different
water chemistry relevant of typical natural water conditions.
5.3.1 Iron and manganese removal performance in oxidation and UF hybrid
process
Analysis of the initial and final filtration samples showed that the rejection of iron and manganese
under different water chemistry conditions using both ceramic and polymeric UF membranes were
higher than 99.5%. The concentration of these minerals were reduced below the target value of
0.02 mg/L in the filtrate. The complete iron and manganese removal achieved through the filtration
of oxidized suspensions indicates that: (1) iron and manganese were completely oxidized by
sodium hypochlorite and potassium permanganate, respectively, during the retention time provided
95
by the column, (2) there were negligible colloidal iron and manganese of size less than the nominal
pore size of the membranes, as confirmed by particle size analysis presented in Table 5.2.
5.3.2 Characterization of manganese dioxide fouling in UF membranes
In the following sections, the effects of pH, ionic strength and hardness on the fouling behavior of
ceramic and polymeric membranes with manganese dioxide suspension are evaluated.
5.3.2.1 Effect of pH
Figure 5.3 illustrates the impact of pH (for ionic strength = 0.5 mM) on fouling of ceramic
(Figure 5.3a) and polymeric (Figure 5.3b) membranes. For both types of membranes, normalized
TMP (P/P0) showed a slight non-linear, concave upward increase as a function of cumulative
permeate volume. Figure 5.3 also indicates that the pressure profiles are well described by the
constant flux power law compressible cake model (Eq. (4.8)) (solid lines in Figure 5.3), further
confirming the dominant role of cake formation. For both types of membranes, increasing pH from
6.0 to 7.0 induced a significant increase of fouling. On the other hand, a further increase of pH from
7.0 to 8.0 reduced the rate of fouling back to its original rate observed at pH 6.0. To facilitate the
comparison of the experimental results, the average values of specific cake resistance under
different conditions were also calculated (Table 5.3), via Eq. (4.5) using experimentalcR ,
SV and
bc values, and the same trend was observed. These results can be explained by the changes in the
hydraulic properties of the cake layer formed by manganese dioxide of different size, ζ -potential
and fractal dimension (Table 5.2). Although substantial aggregation did not occur under these
conditions due to the high repulsive forces between the manganese dioxide particles ( ζ -potential
values ranged from 1.2±4.36- to 1.2±5.45- mV), the size distribution results revealed a partial
aggregation of particles even at pH 8.0, in which colloids of around 100 nm were also found
(Dashtban Kenari and Barbeau, 2016a). The lowest cake resistance was observed at pH 6.0 due to
the formation of much larger manganese dioxide aggregates (average size of 128 nm) compared to
that of formed at pH 7.0 (average size of 36 nm) and 8.0 (average size of 30 nm). Cake porosity is
higher when it is composed of larger particles and/or aggregates (Lee et al., 2003; Xu et al., 2011).
However, although the size of colloidal manganese dioxide was slightly smaller at pH 8.0 compared
to pH 7.0, the average specific cake resistance was much lower at pH 8.0. At pH 8.0, the larger
thickness of the electrostatic double layer (higher negative surface charge) increases the distance
96
between the deposits resulting in production of cake with higher permeability and lower fouling
resistance (Faibish et al., 1998; Singh and Song, 2006). This is mainly important for colloids
smaller than 100 nm (Faibish et al., 1998; Bowen and Jenner, 1995). The modification of cake
characteristics is also revealed by the measurements of the fractal structure of the aggregates. While
pH 6.0 and 7.0 produced similar fractal numbers (1.67 and 1.63, respectively), the fractal dimension
at pH 8.0 was very low (1.21) indicative of the formation of less compact aggregates. This fractal
dimension was much lower than expected according to the reaction limited regime for charged
aggregates (Df ≈ 2.2) (Jefferson and Jarvis, 2006). González et al. (2004) indicated that a very low
fractal dimension of 1.2 can be found for very small clusters with long-range repulsion forces. This
is likely due to the very slow aggregation rate of highly negative charged particles.
In addition to cake resistance, the compressibility of the filter cake is another important parameter
to consider for the design of a membrane filtration process. Filter cake compressibility is generally
a function of particle size, shape and fractal dimension, surface charge and degree of aggregation
(Lee et al., 2003; Singh and Song, 2006; Tiller and Yeh, 1987). The compressibility parameters of
the cake formed from manganese dioxide under different water chemistry conditions, obtained via
non-linear optimization of pressure data using Eq. (4.8), are presented in Table 5.3. Moderate and
similar compressibility coefficients (ranged from 0.27 to 0.31) were found for manganese dioxide
colloids under different pH conditions and very low salt concentration (ionic strength of 0.5 mM)
most likely due to the repulsive electrostatic double layer interactions between the negatively
charged colloidal manganese dioxide ( ζ -potential varied from 1.2±4.36- to 1.2±5.45- as the
pH increased from 6.0 to 8.0). The slight increase in cake compressibility at the lower pH of 6.0 is
coherent with the larger aggregate sizes measured for this condition. Thus, these results shows that
the compressibility of colloidal manganese dioxide is not only influenced by the thickness of the
electric double layer but also, to a lower extent, by the size of aggregates.
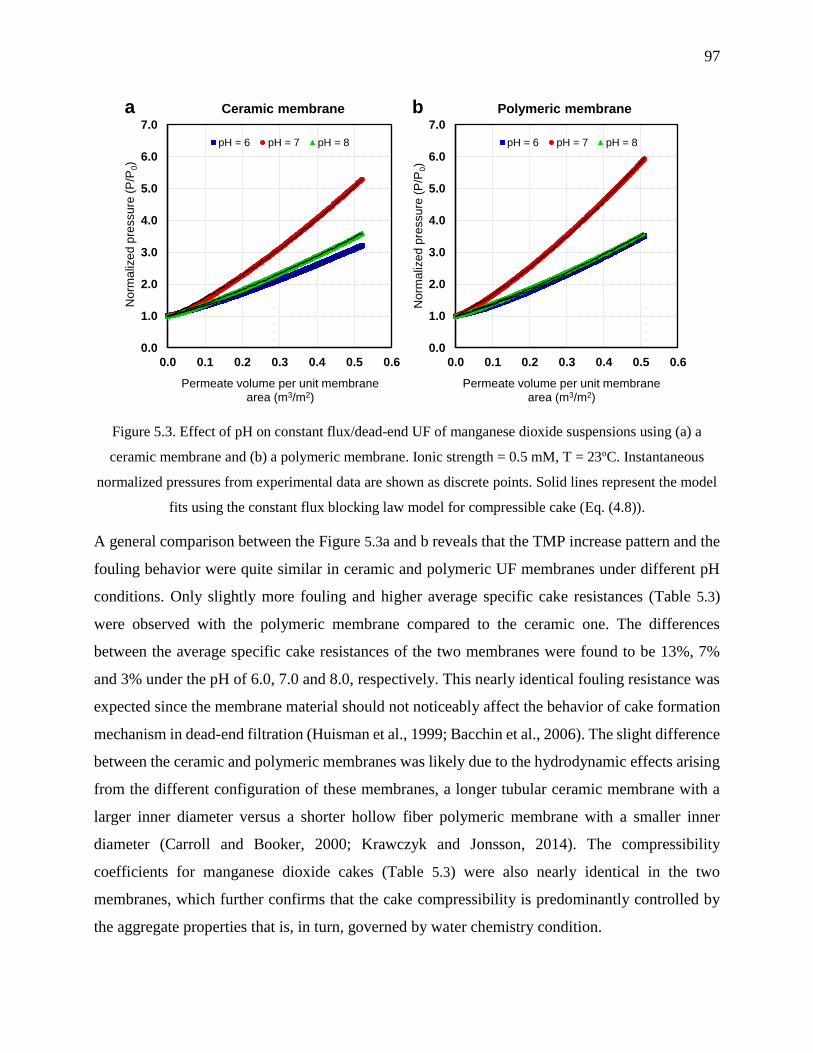
97
Figure 5.3. Effect of pH on constant flux/dead-end UF of manganese dioxide suspensions using (a) a
ceramic membrane and (b) a polymeric membrane. Ionic strength = 0.5 mM, T = 23oC. Instantaneous
normalized pressures from experimental data are shown as discrete points. Solid lines represent the model
fits using the constant flux blocking law model for compressible cake (Eq. (4.8)).
A general comparison between the Figure 5.3a and b reveals that the TMP increase pattern and the
fouling behavior were quite similar in ceramic and polymeric UF membranes under different pH
conditions. Only slightly more fouling and higher average specific cake resistances (Table 5.3)
were observed with the polymeric membrane compared to the ceramic one. The differences
between the average specific cake resistances of the two membranes were found to be 13%, 7%
and 3% under the pH of 6.0, 7.0 and 8.0, respectively. This nearly identical fouling resistance was
expected since the membrane material should not noticeably affect the behavior of cake formation
mechanism in dead-end filtration (Huisman et al., 1999; Bacchin et al., 2006). The slight difference
between the ceramic and polymeric membranes was likely due to the hydrodynamic effects arising
from the different configuration of these membranes, a longer tubular ceramic membrane with a
larger inner diameter versus a shorter hollow fiber polymeric membrane with a smaller inner
diameter (Carroll and Booker, 2000; Krawczyk and Jonsson, 2014). The compressibility
coefficients for manganese dioxide cakes (Table 5.3) were also nearly identical in the two
membranes, which further confirms that the cake compressibility is predominantly controlled by
the aggregate properties that is, in turn, governed by water chemistry condition.
0.0
1.0
2.0
3.0
4.0
5.0
6.0
7.0
0.0 0.1 0.2 0.3 0.4 0.5 0.6
No
rma
lize
d p
ressu
re (
P/P
0)
Permeate volume per unit membrane area (m3/m2)
a Ceramic membrane
pH = 6 pH = 7 pH = 8
0.0
1.0
2.0
3.0
4.0
5.0
6.0
7.0
0.0 0.1 0.2 0.3 0.4 0.5 0.6
No
rma
lize
d p
ressu
re (
P/P
0)
Permeate volume per unit membrane area (m3/m2)
b Polymeric membrane
pH = 6 pH = 7 pH = 8
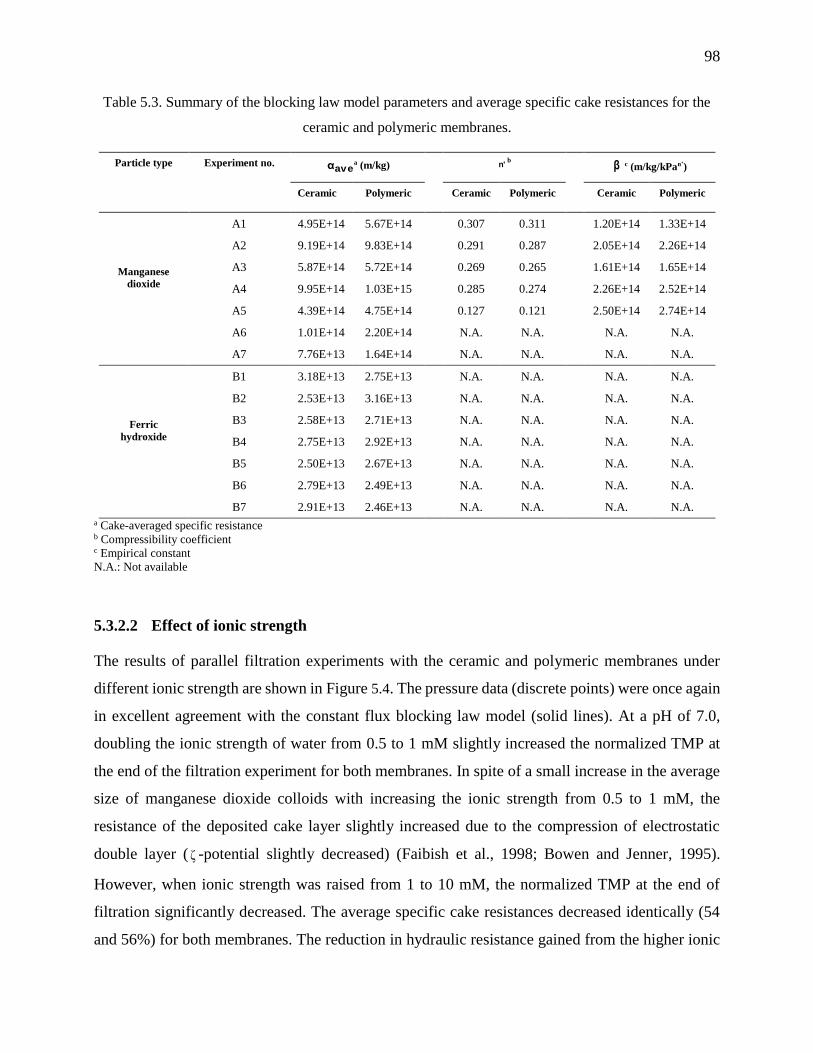
98
Table 5.3. Summary of the blocking law model parameters and average specific cake resistances for the
ceramic and polymeric membranes.
Particle type Experiment no. aveα a (m/kg) 'n
b β c (m/kg/kPan’)
Ceramic Polymeric Ceramic Polymeric Ceramic Polymeric
Manganese
dioxide
A1 4.95E+14 5.67E+14 0.307 0.311 1.20E+14 1.33E+14
A2 9.19E+14 9.83E+14 0.291 0.287 2.05E+14 2.26E+14
A3 5.87E+14 5.72E+14 0.269 0.265 1.61E+14 1.65E+14
A4 9.95E+14 1.03E+15 0.285 0.274 2.26E+14 2.52E+14
A5 4.39E+14 4.75E+14 0.127 0.121 2.50E+14 2.74E+14
A6 1.01E+14 2.20E+14 N.A. N.A. N.A. N.A.
A7 7.76E+13 1.64E+14 N.A. N.A. N.A. N.A.
Ferric
hydroxide
B1 3.18E+13 2.75E+13 N.A. N.A. N.A. N.A.
B2 2.53E+13 3.16E+13 N.A. N.A. N.A. N.A.
B3 2.58E+13 2.71E+13 N.A. N.A. N.A. N.A.
B4 2.75E+13 2.92E+13 N.A. N.A. N.A. N.A.
B5 2.50E+13 2.67E+13 N.A. N.A. N.A. N.A.
B6 2.79E+13 2.49E+13 N.A. N.A. N.A. N.A.
B7 2.91E+13 2.46E+13 N.A. N.A. N.A. N.A.
a Cake-averaged specific resistance b Compressibility coefficient c Empirical constant
N.A.: Not available
5.3.2.2 Effect of ionic strength
The results of parallel filtration experiments with the ceramic and polymeric membranes under
different ionic strength are shown in Figure 5.4. The pressure data (discrete points) were once again
in excellent agreement with the constant flux blocking law model (solid lines). At a pH of 7.0,
doubling the ionic strength of water from 0.5 to 1 mM slightly increased the normalized TMP at
the end of the filtration experiment for both membranes. In spite of a small increase in the average
size of manganese dioxide colloids with increasing the ionic strength from 0.5 to 1 mM, the
resistance of the deposited cake layer slightly increased due to the compression of electrostatic
double layer ( ζ -potential slightly decreased) (Faibish et al., 1998; Bowen and Jenner, 1995).
However, when ionic strength was raised from 1 to 10 mM, the normalized TMP at the end of
filtration significantly decreased. The average specific cake resistances decreased identically (54
and 56%) for both membranes. The reduction in hydraulic resistance gained from the higher ionic
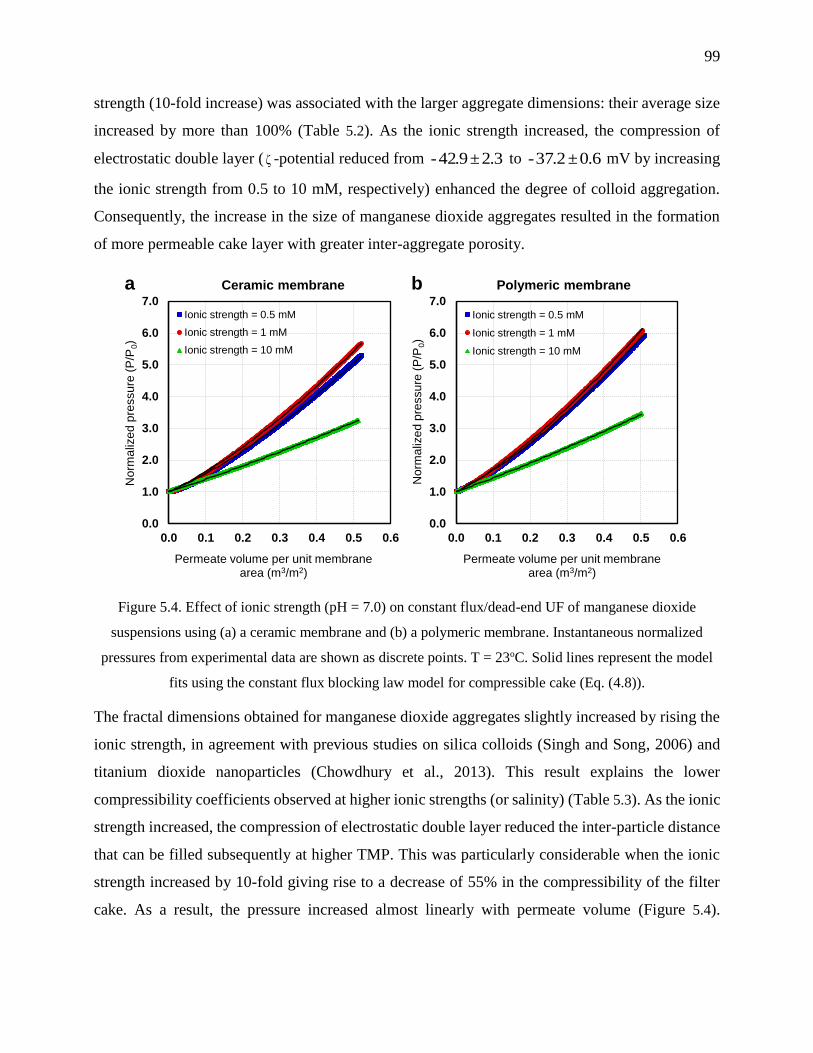
99
strength (10-fold increase) was associated with the larger aggregate dimensions: their average size
increased by more than 100% (Table 5.2). As the ionic strength increased, the compression of
electrostatic double layer ( ζ -potential reduced from 3.2±9.42- to 6.0±2.37- mV by increasing
the ionic strength from 0.5 to 10 mM, respectively) enhanced the degree of colloid aggregation.
Consequently, the increase in the size of manganese dioxide aggregates resulted in the formation
of more permeable cake layer with greater inter-aggregate porosity.
Figure 5.4. Effect of ionic strength (pH = 7.0) on constant flux/dead-end UF of manganese dioxide
suspensions using (a) a ceramic membrane and (b) a polymeric membrane. Instantaneous normalized
pressures from experimental data are shown as discrete points. T = 23oC. Solid lines represent the model
fits using the constant flux blocking law model for compressible cake (Eq. (4.8)).
The fractal dimensions obtained for manganese dioxide aggregates slightly increased by rising the
ionic strength, in agreement with previous studies on silica colloids (Singh and Song, 2006) and
titanium dioxide nanoparticles (Chowdhury et al., 2013). This result explains the lower
compressibility coefficients observed at higher ionic strengths (or salinity) (Table 5.3). As the ionic
strength increased, the compression of electrostatic double layer reduced the inter-particle distance
that can be filled subsequently at higher TMP. This was particularly considerable when the ionic
strength increased by 10-fold giving rise to a decrease of 55% in the compressibility of the filter
cake. As a result, the pressure increased almost linearly with permeate volume (Figure 5.4).
0.0
1.0
2.0
3.0
4.0
5.0
6.0
7.0
0.0 0.1 0.2 0.3 0.4 0.5 0.6
Norm
aliz
ed
pre
ssu
re (
P/P
0)
Permeate volume per unit membrane area (m3/m2)
a Ceramic membrane
Ionic strength = 0.5 mM
Ionic strength = 1 mM
Ionic strength = 10 mM
0.0
1.0
2.0
3.0
4.0
5.0
6.0
7.0
0.0 0.1 0.2 0.3 0.4 0.5 0.6
Norm
aliz
ed
pre
ssu
re (
P/P
0)
Permeate volume per unit membrane area (m3/m2)
b Polymeric membrane
Ionic strength = 0.5 mM
Ionic strength = 1 mM
Ionic strength = 10 mM
100
Therefore, the compressibility of the cake formed by colloidal manganese dioxide is substantially
associated with ionic strength.
5.3.2.3 Effect of hardness
The fouling behavior of colloidal manganese dioxide has also been studied at constant ionic
strength (10 mM) but increasing hardness conditions (0, 100 and 317 mg CaCO3/L). As shown in
Figure 5.5, the presence of calcium ions (Ca2+) notably alleviated the fouling of both membranes.
As more calcium was spiked (hardness increased from 100 to 317 mgCaCO3/L), increment of
normalized TMP further declined but to a much lesser extent. According to the ζ -potential values,
at high hardness conditions most of the surface charges of colloids were neutralized, thus, the
electrostatic double layer was almost completely suppressed resulting in aggregation of
destabilized colloids. As a consequence the mean size of aggregates increased from 0.118 µm to
more than 2 µm giving rise to a more permeable cake layer. In addition, when the double layer
repulsion is neutralized, a settling aggregate becomes stagnant as soon as it reaches an already
deposited aggregate on the top layer of the cake which hinders its movement into a neighboring
void space resulting in a porous cake of higher permeability.
In these experiments the pressure data were not fitted to the blocking law model for compressible
cake (Eq. (4.8)) since the TMP did not increase high enough over the course of filtration to estimate
a reliable value of cake compressibility coefficient (longer filtration time would have been
required). However, Figure 5.5 clearly implies the compressibility of the cake formed under
hardness of 100 and 317 mg CaCO3/L because a very slow gradual increase of the pressure in the
early stage of filtration was followed by a more rapid growth of the pressure at later times. A similar
trend has been observed for both membranes even though the extent of fouling was a slightly higher
for polymeric membrane than the ceramic one.
Interestingly, although the size of aggregates increased with the hardness of water, the fractal
dimension of aggregates also increased. The fractal dimension approached 3 for the aggregates
generated at the hardness of 317 mgCaCO3/L implying the formation of compact, nearly spherical
aggregates. This could be related to the adsorption of calcium ions onto negatively charged
manganese dioxide particles which can result in a tight adhesion of the calcium saturated particles
(Pantina and Furst, 2006). In other word, the particles act as hard spheres that can pack firmly into
aggregates. These results also reveal that the filter cakes formed of large aggregates have high
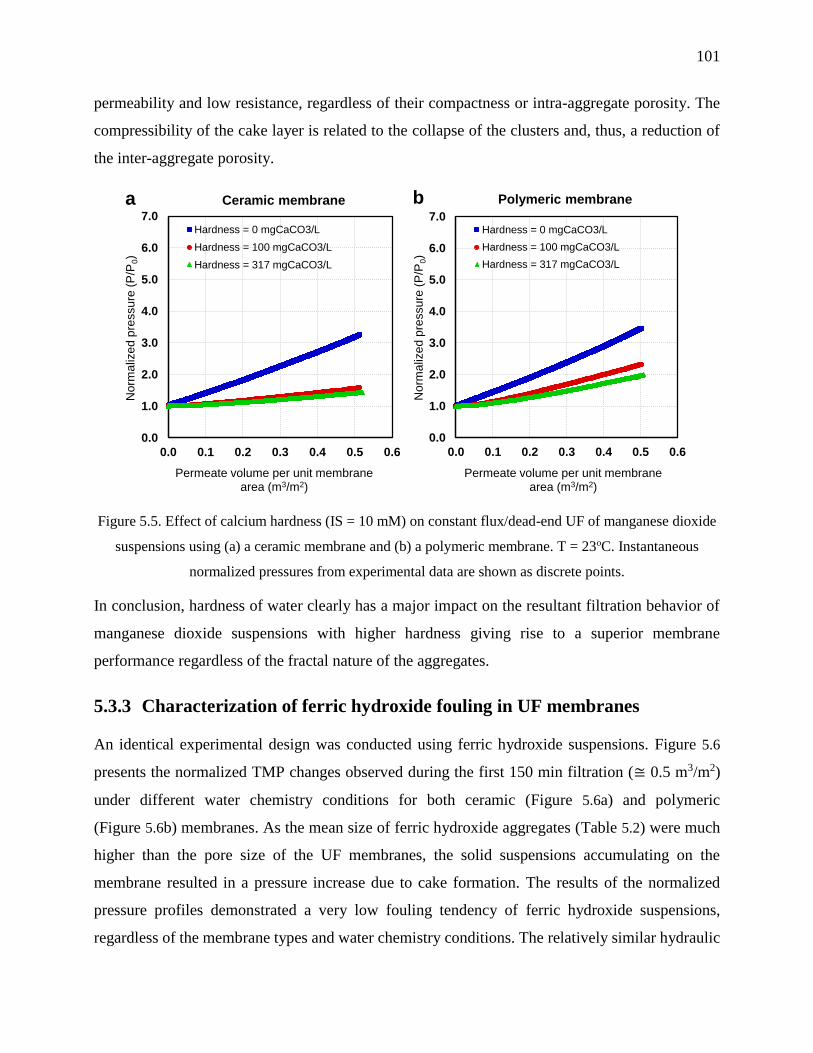
101
permeability and low resistance, regardless of their compactness or intra-aggregate porosity. The
compressibility of the cake layer is related to the collapse of the clusters and, thus, a reduction of
the inter-aggregate porosity.
Figure 5.5. Effect of calcium hardness (IS = 10 mM) on constant flux/dead-end UF of manganese dioxide
suspensions using (a) a ceramic membrane and (b) a polymeric membrane. T = 23oC. Instantaneous
normalized pressures from experimental data are shown as discrete points.
In conclusion, hardness of water clearly has a major impact on the resultant filtration behavior of
manganese dioxide suspensions with higher hardness giving rise to a superior membrane
performance regardless of the fractal nature of the aggregates.
5.3.3 Characterization of ferric hydroxide fouling in UF membranes
An identical experimental design was conducted using ferric hydroxide suspensions. Figure 5.6
presents the normalized TMP changes observed during the first 150 min filtration (≅ 0.5 m3/m2)
under different water chemistry conditions for both ceramic (Figure 5.6a) and polymeric
(Figure 5.6b) membranes. As the mean size of ferric hydroxide aggregates (Table 5.2) were much
higher than the pore size of the UF membranes, the solid suspensions accumulating on the
membrane resulted in a pressure increase due to cake formation. The results of the normalized
pressure profiles demonstrated a very low fouling tendency of ferric hydroxide suspensions,
regardless of the membrane types and water chemistry conditions. The relatively similar hydraulic
0.0
1.0
2.0
3.0
4.0
5.0
6.0
7.0
0.0 0.1 0.2 0.3 0.4 0.5 0.6
Norm
aliz
ed
pre
ssu
re (
P/P
0)
Permeate volume per unit membrane area (m3/m2)
a Ceramic membrane
Hardness = 0 mgCaCO3/L
Hardness = 100 mgCaCO3/L
Hardness = 317 mgCaCO3/L
0.0
1.0
2.0
3.0
4.0
5.0
6.0
7.0
0.0 0.1 0.2 0.3 0.4 0.5 0.6
Norm
aliz
ed
pre
ssu
re (
P/P
0)
Permeate volume per unit membrane area (m3/m2)
b Polymeric membrane
Hardness = 0 mgCaCO3/L
Hardness = 100 mgCaCO3/L
Hardness = 317 mgCaCO3/L
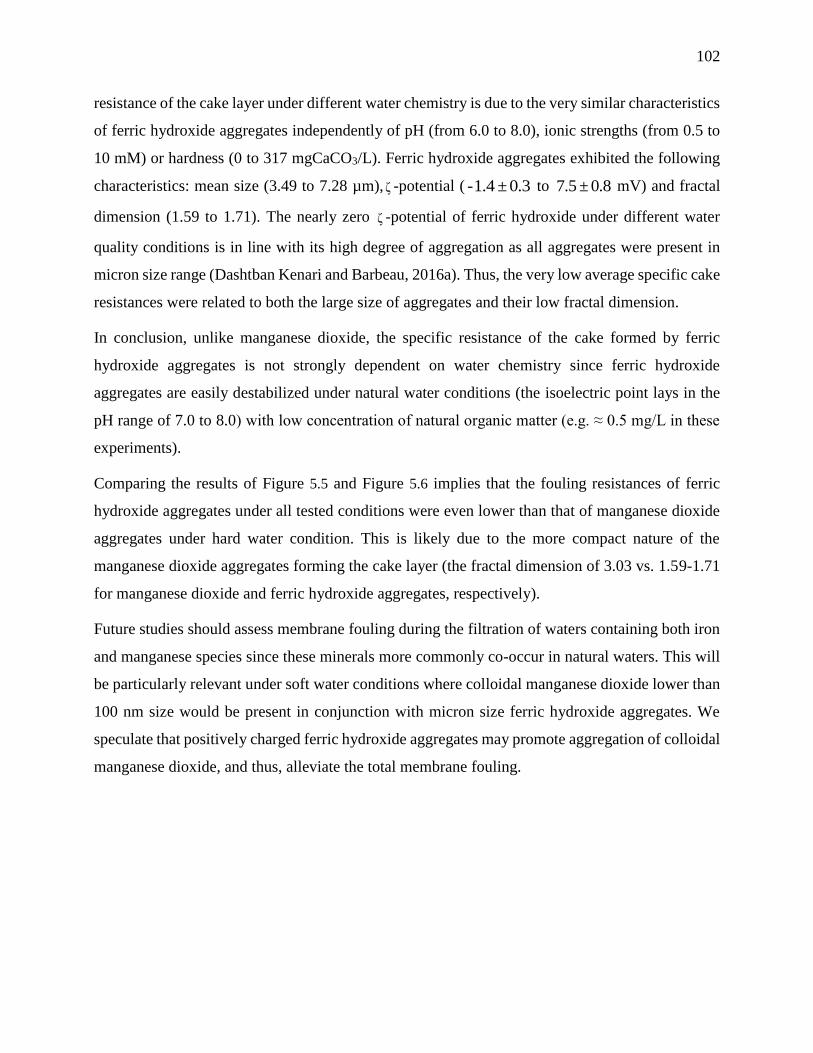
102
resistance of the cake layer under different water chemistry is due to the very similar characteristics
of ferric hydroxide aggregates independently of pH (from 6.0 to 8.0), ionic strengths (from 0.5 to
10 mM) or hardness (0 to 317 mgCaCO3/L). Ferric hydroxide aggregates exhibited the following
characteristics: mean size (3.49 to 7.28 µm), ζ -potential ( 3.0±4.1- to 8.0±5.7 mV) and fractal
dimension (1.59 to 1.71). The nearly zero ζ -potential of ferric hydroxide under different water
quality conditions is in line with its high degree of aggregation as all aggregates were present in
micron size range (Dashtban Kenari and Barbeau, 2016a). Thus, the very low average specific cake
resistances were related to both the large size of aggregates and their low fractal dimension.
In conclusion, unlike manganese dioxide, the specific resistance of the cake formed by ferric
hydroxide aggregates is not strongly dependent on water chemistry since ferric hydroxide
aggregates are easily destabilized under natural water conditions (the isoelectric point lays in the
pH range of 7.0 to 8.0) with low concentration of natural organic matter (e.g. ≈ 0.5 mg/L in these
experiments).
Comparing the results of Figure 5.5 and Figure 5.6 implies that the fouling resistances of ferric
hydroxide aggregates under all tested conditions were even lower than that of manganese dioxide
aggregates under hard water condition. This is likely due to the more compact nature of the
manganese dioxide aggregates forming the cake layer (the fractal dimension of 3.03 vs. 1.59-1.71
for manganese dioxide and ferric hydroxide aggregates, respectively).
Future studies should assess membrane fouling during the filtration of waters containing both iron
and manganese species since these minerals more commonly co-occur in natural waters. This will
be particularly relevant under soft water conditions where colloidal manganese dioxide lower than
100 nm size would be present in conjunction with micron size ferric hydroxide aggregates. We
speculate that positively charged ferric hydroxide aggregates may promote aggregation of colloidal
manganese dioxide, and thus, alleviate the total membrane fouling.

103
Figure 5.6. Constant flux/dead-end UF of ferric hydroxide suspensions under different pH, ionic strength
and harness conditions using a ceramic membrane (a1 & a2) and a polymeric membrane (b1 & b2).
Instantaneous normalized pressures from experimental data are shown as wisker-boxes points. Figures a1
and b1 use an identical Y-axis scale than the equivalent Mn figures (Figure 5.3, Figure 5.4, and Figure 5.5)
while Figures a2 and b2 present a blow-up Y-axis scale.
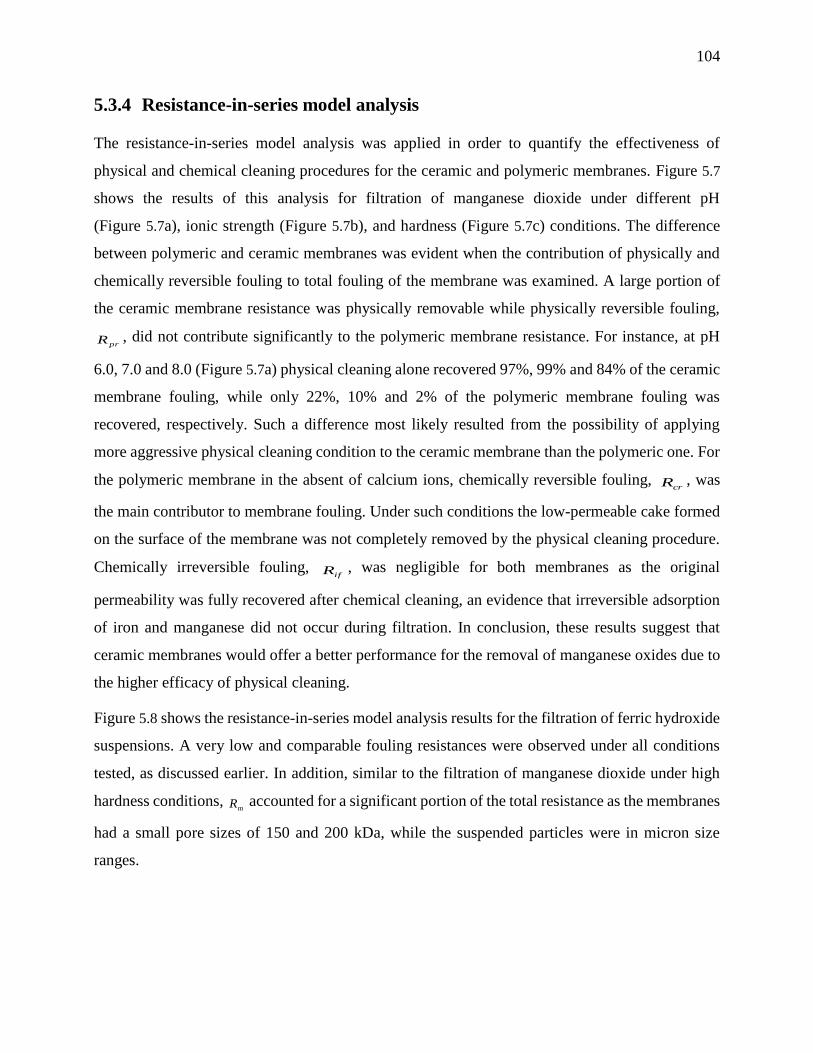
104
5.3.4 Resistance-in-series model analysis
The resistance-in-series model analysis was applied in order to quantify the effectiveness of
physical and chemical cleaning procedures for the ceramic and polymeric membranes. Figure 5.7
shows the results of this analysis for filtration of manganese dioxide under different pH
(Figure 5.7a), ionic strength (Figure 5.7b), and hardness (Figure 5.7c) conditions. The difference
between polymeric and ceramic membranes was evident when the contribution of physically and
chemically reversible fouling to total fouling of the membrane was examined. A large portion of
the ceramic membrane resistance was physically removable while physically reversible fouling,
prR , did not contribute significantly to the polymeric membrane resistance. For instance, at pH
6.0, 7.0 and 8.0 (Figure 5.7a) physical cleaning alone recovered 97%, 99% and 84% of the ceramic
membrane fouling, while only 22%, 10% and 2% of the polymeric membrane fouling was
recovered, respectively. Such a difference most likely resulted from the possibility of applying
more aggressive physical cleaning condition to the ceramic membrane than the polymeric one. For
the polymeric membrane in the absent of calcium ions, chemically reversible fouling, crR , was
the main contributor to membrane fouling. Under such conditions the low-permeable cake formed
on the surface of the membrane was not completely removed by the physical cleaning procedure.
Chemically irreversible fouling, ifR , was negligible for both membranes as the original
permeability was fully recovered after chemical cleaning, an evidence that irreversible adsorption
of iron and manganese did not occur during filtration. In conclusion, these results suggest that
ceramic membranes would offer a better performance for the removal of manganese oxides due to
the higher efficacy of physical cleaning.
Figure 5.8 shows the resistance-in-series model analysis results for the filtration of ferric hydroxide
suspensions. A very low and comparable fouling resistances were observed under all conditions
tested, as discussed earlier. In addition, similar to the filtration of manganese dioxide under high
hardness conditions, mR accounted for a significant portion of the total resistance as the membranes
had a small pore sizes of 150 and 200 kDa, while the suspended particles were in micron size
ranges.

105
Figure 5.7. Resistance-in-series model analysis for the constant flux/dead-end UF of manganese dioxide
suspension under different (a) pH, (b) ionic strength, and (c) hardness conditions by the ceramic and
polymeric membranes. T = 23oC.
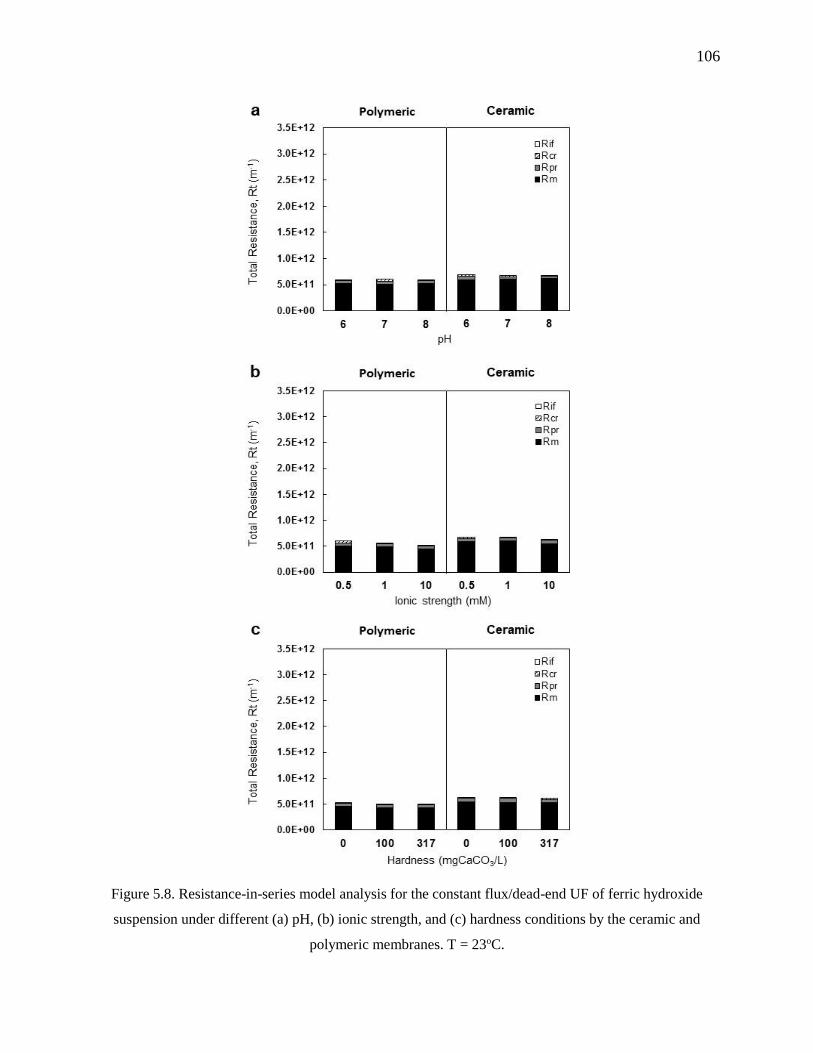
106
Figure 5.8. Resistance-in-series model analysis for the constant flux/dead-end UF of ferric hydroxide
suspension under different (a) pH, (b) ionic strength, and (c) hardness conditions by the ceramic and
polymeric membranes. T = 23oC.

107
5.4 Conclusions
The present study investigated the performance of the sequential process of oxidation and dead-
end UF for the control of iron and manganese in drinking water.
UF in conjunction with pre-oxidation properly controlled the concentration of iron and
manganese in water below the target value of 0.02 mg/L under all tested conditions.
The influence of water chemistry, such as pH, ionic strength and hardness, on the
characteristics of ferric hydroxide and manganese dioxide aggregates plays a major role
on the fouling of UF membranes.
Cake formation was the most significant contributor to fouling. The specific resistance of
the deposited cake layer and its compressibility is mainly governed by the size, ζ -
potential, and fractal dimension of the resultant aggregates rather than the type of
membrane material and its configuration.
Manganese dioxide aggregates are prone to severely foul UF membranes under soft water
condition while ferric hydroxide aggregates only caused minimal fouling resistance to the
membrane irrespective to the water chemistry condition.
For manganese dioxide smaller than 100 nm, the hydraulic resistance of the cake layer
and, in turn, the extent of fouling is mainly governed by the thickness of electrostatic
double layer surrounding the colloids rather than the size of colloids.
The oxidation of manganese followed by UF process can only be recommended for
groundwater containing high level of hardness.
Membrane filtration results consistently demonstrated that the ceramic tubular membrane
and the polymeric hollow fiber membrane, utilized herein, are almost similarly fouled
under identical water chemistry. However, physical cleaning was considerably more
effective for the ceramic membrane compared to the polymeric one.
Future work should consider the influence of natural organic matter on UF fouling of iron and
manganese suspensions as well as consider the cake characteristics produced by a mixture of both
metals, a common case observed in natural waters.

108
Acknowledgement
This work was support by RES’EAU-WATERNET, a NSERC collaborative strategic network
(Grant No. 364635-07). The authors wish to thank the CREDEAU laboratories at Polytechnique
Montréal for providing the facilities to conduct this work. We also wish to thank Mireille Blais for
her help with installation of experimental set-up.
109
CHAPTER 6 ARTICLE 3 : PYROLUCITE FLUIDIZED BED
REACTOR (PFBR): A ROBUST AND COMPACT PROCESS FOR
REMOVING MANGANESE FROM GROUNDWATER
This chapter presents an article published in Water Research, 49 (2014). It reports the potential
application of a pyrolucite fluidized bed reactor to remove elevated concentration of manganese
from groundwater down to below 20 µg/L while operating under high hydraulic loading rates. The
effects of key operational parameters on the performance of pyrolucite fluidized bed reactor and
the long-term stability of process were evaluated.
Pyrolucite Fluidized-Bed Reactor (PFBR): A Robust and Compact Process for Removing
Manganese from Groundwater
Seyedeh Laleh Dashtban Kenari* and Benoit Barbeau
Polytechnique Montreal, Department of Civil, Geological and Mining Engineering, NSERC-
Industrial Chair on Drinking Water, Environment, C.P. 6079, Succursale Centre-Ville, Montreal,
QC, H3C 3A7, Canada.
* Corresponding author: Tel: +1 514 340-4711 #2983; Fax: 514-340-5918;
E-mail: [email protected]
110
ABSTRACT
The purpose of this paper is to introduce a pyrolucite fluidized-bed reactor (PFBR) as a potential
drinking water process to treat groundwater containing high levels of dissolved manganese (Mn(II))
(0.5-3 mg/L) and reduce its concentration to < 0.02 mg/L in treated water. A pilot-scale study was
conducted under dynamic conditions using synthetic groundwater (SGW), to elucidate the effect
of operational conditions and groundwater composition on manganese (Mn) removal achieved by
the PFBR. Results demonstrated almost complete Mn removal (close to 100%) in less than 1 min
under all tested operational conditions (influent Mn concentration of 0.5 – 3 mg/L, calcium (Ca2+)
hardness of 0 – 200 mg CaCO3/L, pH of 6.2 – 7.8, temperature of 9 & 23oC and high hydraulic
loading rate (HLR) of 24 – 63 m/h (i.e., bed expansion of 0 – 30%)). Improved Mn removal profile
was achieved at higher water temperature. Also, the results showed that adsorption of Mn(II) onto
pyrolucite and subsequent slower surface oxidation of sorbed Mn(II) was the only mechanism
responsible for Mn removal while direct oxidation of Mn(II) by free chlorine did not occur even at
high concentrations of Mn(II) and free chlorine and elevated temperatures. Higher average mass
transfer coefficient and consequently adsorption rate was achieved at elevated HLR. Increasing
effluent free chlorine residuals from 1.0 to 2.0-2.6 mgCl2/L allowed increasing the operation time
needed for media regeneration from 6 days to > 12 days. Turbidity was maintained around 0.2 NTU
during the entire test periods indicating good capture of MnOx colloids within the PFBR.
KEYWORDS: Drinking Water; Groundwater; Treatment; Manganese; Pyrolucite; Fluidized-Bed
Reactor.
6.1 Introduction
Groundwater often contains significant levels of soluble manganese (Mn(II)) due to the favourable
redox condition prevailing in many aquifers. In Canada, approximately 26% of the population,
mostly living in small rural communities, relies on groundwater as a drinking water resource.
Presence of Mn in finished water may cause organoleptic and operational problems including
discoloration of water, unpleasant metallic taste and odour, increased turbidity and biofouling of
pipelines as well as staining of laundry and plumbing fixtures (World Health Organization (WHO),
2008). Thus, the United States Environmental Protection Agency (USEPA), (2004) has

111
recommended a secondary maximum contaminant level (SMCL) (or guideline in the case of Health
Canada) of 0.05 mg/L for Mn in drinking waters. However, a concentration as low as 0.02 mg/L
may still result in adverse aesthetic impacts (Sly et al., 1990). In addition, although Mn is
considered an essential trace mineral for human beings, a chronic exposure to low levels Mn intake
from water (< 250 µg/L) has been associated with significant intellectual impairments in children
(Bouchard et al., 2011).
As opposed to Europe where biological Mn removal is widespread, a traditional treatment strategy
to control Mn level in North America involves oxidation of Mn(II) to an insoluble species (Mn(IV))
using a strong oxidant (KMnO4 or less commonly ClO2 or O3) followed by rapid sand filtration
(Knocke et al., 1990b). However, oxidation of Mn(II) by strong oxidants is highly dependent upon
the pH, temperature, initial dissolved Mn concentration and reaction time (Van Benschoten et al.,
1992). In addition, application of ClO2 has been limited to waters with very low oxidant demand
due to the production of undesired inorganic species, i.e. chlorite and chlorate (Gopal et al., 2007).
The use of ozonation or KMnO4 always brings the risk of permanganate escaping in treated water
and resulting in pink water formation (Gregory and Carlson, 2003). Furthermore, it is difficult to
effectively remove Mn oxides (MnOx(s)) through depth filtration (Carlson et al., 1997) due to its
tendency to form negatively charged colloids (Morgan and stumm, 1964).
Due to the propensity of MnOx(s) oxides to adsorb Mn(II) (Griffin, 1960; Morgan and Stumm,
1964), another process, termed Natural Greensand Effect (NGE), was introduced to control Mn(II).
Removal of Mn(II) is achieved through sorption of Mn(II) onto MnOx(s) surface followed by
catalytic oxidation of adsorbed Mn(II) by free chlorine. It is an effective and economical method
that gained widespread usage over the past decades. Nevertheless, the process performance is
strongly impacted by the maintenance of available adsorption sites, which is governed by the
MnOx(s) coating level, chlorine concentration and pH (Knocke et al., 1990a). In addition to these
parameters, hydraulic loading rate (HLR), temperature, calcium (Ca2+) hardness, and initial Mn(II)
concentration can also influence the process performance.
MnOx(s)-coated sand, such as Mn greensand, has been essentially used in packed bed contactors at
a relatively low HLR to remove low feed water Mn(II) concentrations (mostly < 0.5 mg/L)
(Hargette and Knocke, 2001; Yang et al., 2008; Buamah et al., 2009; Piispanena and Sallanko,
2010). For higher Mn concentrations, rapid head loss buildup leading to frequent backwashing is
112
an important limitation of a packed bed configuration. This constraint has recently been addressed
with the development of post-filtration adsorption contactors (Zuravnsky, 2006) which use a larger
media (2.0-6.4 mm) than conventional greensand (0.3-0.4 mm). HLR as high as 32 - 50 m/h (16-
20 gpm/ft2) were successfully tested. However, this process is targeting application on
conventionally treated surface waters exhibiting low Mn concentrations (< 0.1 mg/L).
In order to use adsorptive contactors on groundwaters having high Mn concentrations, we are
putting forth the hypothesis that a pyrolucite (a natural Mn media consisting of 70 to 80% Mn
dioxide (MnO2) by weight) fluidized bed configuration will be advantageous over the packed bed
contactor. Efficient removal of copper ions in FBR containing MnOx(s) coated sand has been
reported (Lee et al., 2004). It was anticipated that the combination of pyrolucite and FBR could
potentially offer a robust process which is less sensitive to water quality for enhanced Mn removal.
Firstly, pyrolucite has a very high density (around 4,000 kg/m3), which translates into the
possibility to operate at very high HLR, and high specific adsorption sites. Secondly, the intrinsic
turbulence found in fluidized beds provides more efficient utilization of the adsorption sites and
better performance compared to fixed-bed contactors (USEPA, 2000). Finally, this configuration
will offer the possibility to use a fine granular media (0.4 mm), a condition which is favorable for
adsorption due to the increased surface area since it solves the issue of head loss accumulation.
The primary goal of the current research effort is to investigate the potential use of a pyrolucite
FBR (PFBR) to remove high concentrations of Mn(II) from groundwater down to below 20 µg/L
while operating at high HLR. The specific objectives of this paper are, first, to evaluate the effects
of key operational parameters such as feed Mn concentration, temperature, pH, hardness (Ca2+
concentration), and HLR (i.e., bed expansion) on PFBR performance and, secondly, to assess the
stability of the PFBR with respect to Mn removal over a long period of operation.
6.2 Material and Methods
The following sections detail the experimental procedures as well as the operational and analytical
methods used to evaluate the performance of a small pilot-scale PFBR with respect to Mn removal.
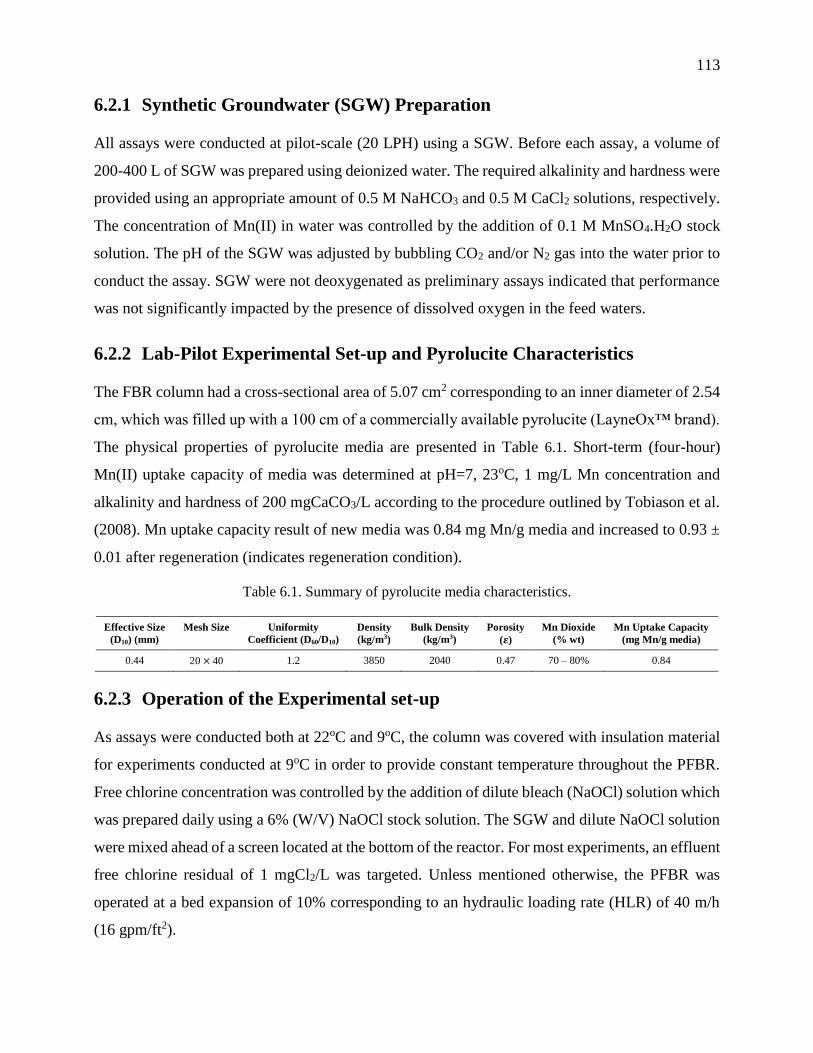
113
6.2.1 Synthetic Groundwater (SGW) Preparation
All assays were conducted at pilot-scale (20 LPH) using a SGW. Before each assay, a volume of
200-400 L of SGW was prepared using deionized water. The required alkalinity and hardness were
provided using an appropriate amount of 0.5 M NaHCO3 and 0.5 M CaCl2 solutions, respectively.
The concentration of Mn(II) in water was controlled by the addition of 0.1 M MnSO4.H2O stock
solution. The pH of the SGW was adjusted by bubbling CO2 and/or N2 gas into the water prior to
conduct the assay. SGW were not deoxygenated as preliminary assays indicated that performance
was not significantly impacted by the presence of dissolved oxygen in the feed waters.
6.2.2 Lab-Pilot Experimental Set-up and Pyrolucite Characteristics
The FBR column had a cross-sectional area of 5.07 cm2 corresponding to an inner diameter of 2.54
cm, which was filled up with a 100 cm of a commercially available pyrolucite (LayneOx™ brand).
The physical properties of pyrolucite media are presented in Table 6.1. Short-term (four-hour)
Mn(II) uptake capacity of media was determined at pH=7, 23oC, 1 mg/L Mn concentration and
alkalinity and hardness of 200 mgCaCO3/L according to the procedure outlined by Tobiason et al.
(2008). Mn uptake capacity result of new media was 0.84 mg Mn/g media and increased to 0.93 ±
0.01 after regeneration (indicates regeneration condition).
Table 6.1. Summary of pyrolucite media characteristics.
Effective Size
(D10) (mm)
Mesh Size Uniformity
Coefficient (D60/D10)
Density
(kg/m3)
Bulk Density
(kg/m3)
Porosity
(𝜺)
Mn Dioxide
(% wt)
Mn Uptake Capacity
(mg Mn/g media)
0.44 20 × 40 1.2 3850 2040 0.47 70 – 80% 0.84
6.2.3 Operation of the Experimental set-up
As assays were conducted both at 22oC and 9oC, the column was covered with insulation material
for experiments conducted at 9oC in order to provide constant temperature throughout the PFBR.
Free chlorine concentration was controlled by the addition of dilute bleach (NaOCl) solution which
was prepared daily using a 6% (W/V) NaOCl stock solution. The SGW and dilute NaOCl solution
were mixed ahead of a screen located at the bottom of the reactor. For most experiments, an effluent
free chlorine residual of 1 mgCl2/L was targeted. Unless mentioned otherwise, the PFBR was
operated at a bed expansion of 10% corresponding to an hydraulic loading rate (HLR) of 40 m/h
(16 gpm/ft2).

114
In order to determine the Mn removal profile within the PFBR, total and dissolved Mn
concentrations were measured at different heights of the PFBR (0, 5, 17.5, 25, 50, 75, 100, 110,
and 150 cm from the bottom of the column). Dissolved Mn was defined here as Mn filterable
through 0.45 μm Millipore filter (CAT NO. HAWP02500). The PFBR was operated for periods of
4 hours (short term assays) or 12 days (long term assays). Samples were collected at increasing
operation time. At each sampling time, turbidity and free chlorine concentration in the influent and
effluent water were analyzed. Additionally, in each experiment, alkalinity, pH and temperature of
influent and effluent waters were measured.
Each experimental trial first consisted in acclimatizing the PFBR for an hour with Mn-free SGW
at the desired HLR. This step also allowed cooling down the PFBR to 9oC. At time zero, the valve
was switched to the drum containing the desired level of Mn. Then, the first samples were collected
at time zero (t = 0h) from each sampling port along the PFBR column. Additional water samples
were collected at 1, 2 and 4 hours after initiation of the experiment (t = 0h). At the end of each
experiment, the PFBR was expanded (up to around 50%) and the media was rinsed with tap water
for around 10 min. In order to provide the same media condition for all tests, an overnight
regeneration of the media with 8-liter of recirculating chlorine solution (100 mg Cl2/L) was
conducted.
6.2.4 Experimental Matrix
The experimental plan was developed to test the water quality and operational variables expected
to explain PFBR performance. Accordingly, four water quality characteristics and one operational
parameters were measured and controlled in each experimental condition: the influent dissolved
Mn concentration (0.5 – 3 mg Mn/L), Ca2+ hardness (0 – 200 mg CaCO3/L), pH (6.2 – 7.8),
temperature (9 – 23oC), and HLR (24 – 63 m/h) (i.e., bed expansion (0 – 30%)). The reference
groundwater characteristics was chosen as pH=7, 9oC, HLR of 40 m/h, alkalinity and hardness of
200 mgCaCO3/L and Mn concentration of 1 mg/L. The experimental matrix was realized by
changing one test variable at a time.
6.2.5 PFBR Stability Experiments
In order to determine the long-term performance of the PFBR for Mn removal, assays were
conducted for a period of up to 12 days. A schematic diagram of the experimental set-up used to
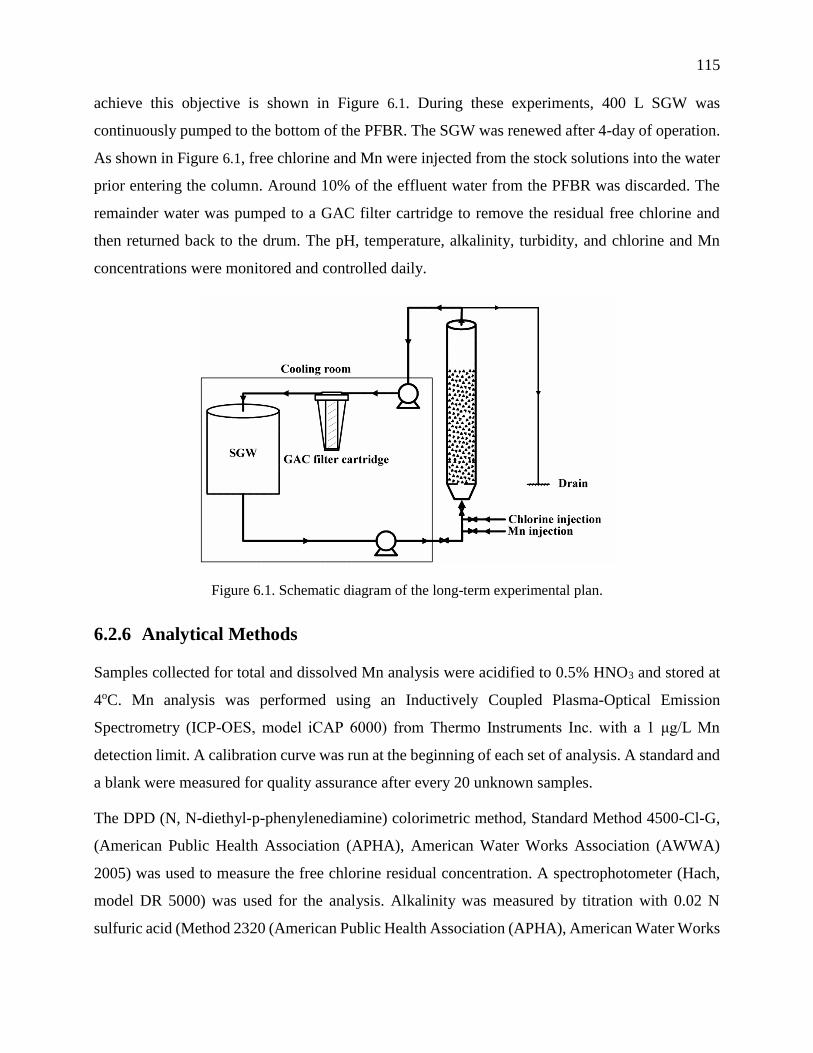
115
achieve this objective is shown in Figure 6.1. During these experiments, 400 L SGW was
continuously pumped to the bottom of the PFBR. The SGW was renewed after 4-day of operation.
As shown in Figure 6.1, free chlorine and Mn were injected from the stock solutions into the water
prior entering the column. Around 10% of the effluent water from the PFBR was discarded. The
remainder water was pumped to a GAC filter cartridge to remove the residual free chlorine and
then returned back to the drum. The pH, temperature, alkalinity, turbidity, and chlorine and Mn
concentrations were monitored and controlled daily.
Figure 6.1. Schematic diagram of the long-term experimental plan.
6.2.6 Analytical Methods
Samples collected for total and dissolved Mn analysis were acidified to 0.5% HNO3 and stored at
4oC. Mn analysis was performed using an Inductively Coupled Plasma-Optical Emission
Spectrometry (ICP-OES, model iCAP 6000) from Thermo Instruments Inc. with a 1 μg/L Mn
detection limit. A calibration curve was run at the beginning of each set of analysis. A standard and
a blank were measured for quality assurance after every 20 unknown samples.
The DPD (N, N-diethyl-p-phenylenediamine) colorimetric method, Standard Method 4500-Cl-G,
(American Public Health Association (APHA), American Water Works Association (AWWA)
2005) was used to measure the free chlorine residual concentration. A spectrophotometer (Hach,
model DR 5000) was used for the analysis. Alkalinity was measured by titration with 0.02 N
sulfuric acid (Method 2320 (American Public Health Association (APHA), American Water Works
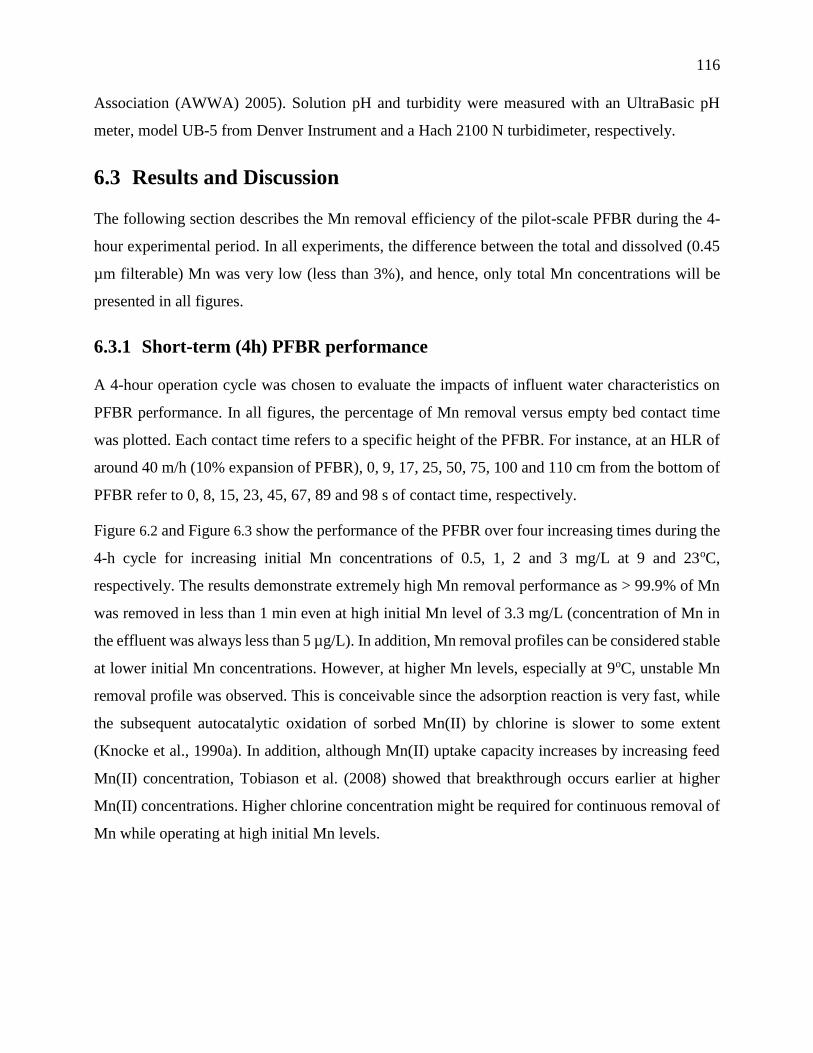
116
Association (AWWA) 2005). Solution pH and turbidity were measured with an UltraBasic pH
meter, model UB-5 from Denver Instrument and a Hach 2100 N turbidimeter, respectively.
6.3 Results and Discussion
The following section describes the Mn removal efficiency of the pilot-scale PFBR during the 4-
hour experimental period. In all experiments, the difference between the total and dissolved (0.45
µm filterable) Mn was very low (less than 3%), and hence, only total Mn concentrations will be
presented in all figures.
6.3.1 Short-term (4h) PFBR performance
A 4-hour operation cycle was chosen to evaluate the impacts of influent water characteristics on
PFBR performance. In all figures, the percentage of Mn removal versus empty bed contact time
was plotted. Each contact time refers to a specific height of the PFBR. For instance, at an HLR of
around 40 m/h (10% expansion of PFBR), 0, 9, 17, 25, 50, 75, 100 and 110 cm from the bottom of
PFBR refer to 0, 8, 15, 23, 45, 67, 89 and 98 s of contact time, respectively.
Figure 6.2 and Figure 6.3 show the performance of the PFBR over four increasing times during the
4-h cycle for increasing initial Mn concentrations of 0.5, 1, 2 and 3 mg/L at 9 and 23oC,
respectively. The results demonstrate extremely high Mn removal performance as > 99.9% of Mn
was removed in less than 1 min even at high initial Mn level of 3.3 mg/L (concentration of Mn in
the effluent was always less than 5 µg/L). In addition, Mn removal profiles can be considered stable
at lower initial Mn concentrations. However, at higher Mn levels, especially at 9oC, unstable Mn
removal profile was observed. This is conceivable since the adsorption reaction is very fast, while
the subsequent autocatalytic oxidation of sorbed Mn(II) by chlorine is slower to some extent
(Knocke et al., 1990a). In addition, although Mn(II) uptake capacity increases by increasing feed
Mn(II) concentration, Tobiason et al. (2008) showed that breakthrough occurs earlier at higher
Mn(II) concentrations. Higher chlorine concentration might be required for continuous removal of
Mn while operating at high initial Mn levels.
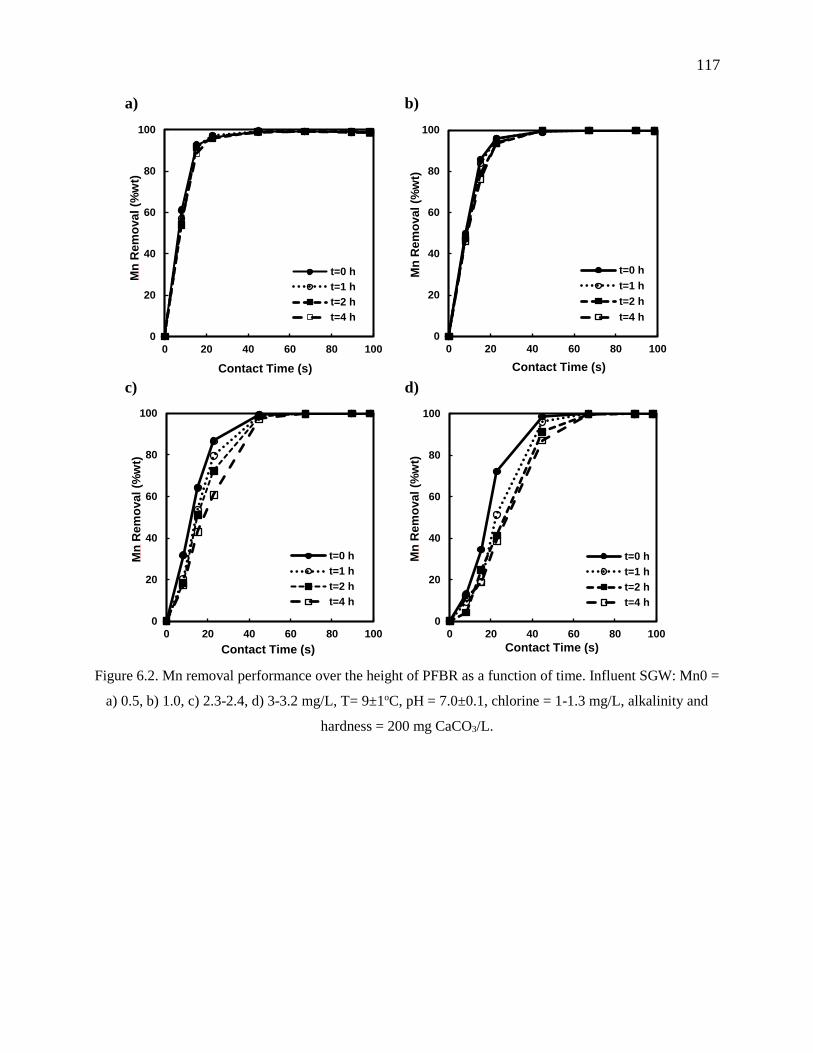
117
a) b)
c) d)
Figure 6.2. Mn removal performance over the height of PFBR as a function of time. Influent SGW: Mn0 =
a) 0.5, b) 1.0, c) 2.3-2.4, d) 3-3.2 mg/L, T= 9±1oC, pH = 7.0±0.1, chlorine = 1-1.3 mg/L, alkalinity and
hardness = 200 mg CaCO3/L.
0
20
40
60
80
100
0 20 40 60 80 100
Mn
Re
mo
va
l (%
wt)
Contact Time (s)
t=0 h
t=1 h
t=2 h
t=4 h
0
20
40
60
80
100
0 20 40 60 80 100
Mn
Re
mo
va
l (%
wt)
Contact Time (s)
t=0 h
t=1 h
t=2 h
t=4 h
0
20
40
60
80
100
0 20 40 60 80 100
Mn
Rem
ova
l (%
wt)
Contact Time (s)
t=0 h
t=1 h
t=2 h
t=4 h
0
20
40
60
80
100
0 20 40 60 80 100
Mn
Rem
ova
l (%
wt)
Contact Time (s)
t=0 h
t=1 h
t=2 h
t=4 h
118
a) b)
c) d)
Figure 6.3. Mn removal performance over the height of PFBR as a function of time. Influent SGW: Mn0 =
a) 0.5, b) 1.0-1.1, c) 2.3-2.4, d) 3.2-3.3 mg/L, T= 23±1oC, pH = 7.0±0.1, chlorine = 1.2-1.4 mg/L,
alkalinity and hardness = 200 mg CaCO3/L.
Since adsorption onto MnO2(s) is an endothermic process (Ren et al., 2011), Mn(II) uptake capacity
of pyrolucite media is expected to increase at elevated temperatures. In addition to its effect on
Mn(II) sorption, temperature can also negatively affect Mn removal in continuous regeneration
process by increasing solution oxidation of Mn(II) by free chlorine at elevated temperatures (23oC
versus 9oC). Under such scenario, the process performance would be expected to decline due to the
formation of colloidal MnOx, especially at higher feed Mn(II) concentrations for which condition
it might be difficult to capture colloidal MnOx within the PFBR. However, as can be seen in
0
20
40
60
80
100
0 20 40 60 80 100
Mn
Re
mo
va
l (%
wt)
Contact Time (s)
t=0 h
t=1 h
t=2 h
t = 4 h
0
20
40
60
80
100
0 20 40 60 80 100
Mn
Re
mo
va
l (%
wt)
Contact Time (s)
t=0 h
t=1 h
t=2 h
t=4 h
0
20
40
60
80
100
0 20 40 60 80 100
Mn
Rem
ova
l (%
wt)
Contact Time (s)
t=0 h
t=1 h
t=2 h
t=4 h
0
20
40
60
80
100
0 20 40 60 80 100
Mn
Rem
ova
l (%
wt)
Contact Time (s)
t=0 h
t=1 h
t=2 h
t=4 h
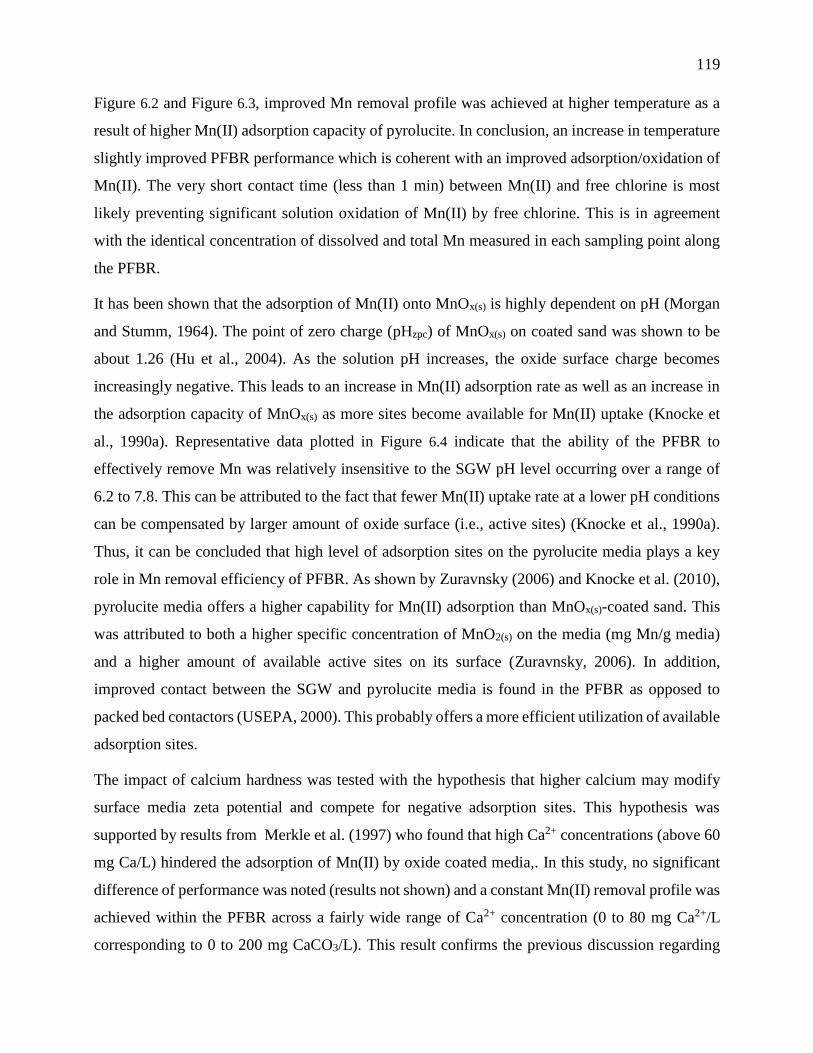
119
Figure 6.2 and Figure 6.3, improved Mn removal profile was achieved at higher temperature as a
result of higher Mn(II) adsorption capacity of pyrolucite. In conclusion, an increase in temperature
slightly improved PFBR performance which is coherent with an improved adsorption/oxidation of
Mn(II). The very short contact time (less than 1 min) between Mn(II) and free chlorine is most
likely preventing significant solution oxidation of Mn(II) by free chlorine. This is in agreement
with the identical concentration of dissolved and total Mn measured in each sampling point along
the PFBR.
It has been shown that the adsorption of Mn(II) onto MnOx(s) is highly dependent on pH (Morgan
and Stumm, 1964). The point of zero charge (pHzpc) of MnOx(s) on coated sand was shown to be
about 1.26 (Hu et al., 2004). As the solution pH increases, the oxide surface charge becomes
increasingly negative. This leads to an increase in Mn(II) adsorption rate as well as an increase in
the adsorption capacity of MnOx(s) as more sites become available for Mn(II) uptake (Knocke et
al., 1990a). Representative data plotted in Figure 6.4 indicate that the ability of the PFBR to
effectively remove Mn was relatively insensitive to the SGW pH level occurring over a range of
6.2 to 7.8. This can be attributed to the fact that fewer Mn(II) uptake rate at a lower pH conditions
can be compensated by larger amount of oxide surface (i.e., active sites) (Knocke et al., 1990a).
Thus, it can be concluded that high level of adsorption sites on the pyrolucite media plays a key
role in Mn removal efficiency of PFBR. As shown by Zuravnsky (2006) and Knocke et al. (2010),
pyrolucite media offers a higher capability for Mn(II) adsorption than MnOx(s)-coated sand. This
was attributed to both a higher specific concentration of MnO2(s) on the media (mg Mn/g media)
and a higher amount of available active sites on its surface (Zuravnsky, 2006). In addition,
improved contact between the SGW and pyrolucite media is found in the PFBR as opposed to
packed bed contactors (USEPA, 2000). This probably offers a more efficient utilization of available
adsorption sites.
The impact of calcium hardness was tested with the hypothesis that higher calcium may modify
surface media zeta potential and compete for negative adsorption sites. This hypothesis was
supported by results from Merkle et al. (1997) who found that high Ca2+ concentrations (above 60
mg Ca/L) hindered the adsorption of Mn(II) by oxide coated media,. In this study, no significant
difference of performance was noted (results not shown) and a constant Mn(II) removal profile was
achieved within the PFBR across a fairly wide range of Ca2+ concentration (0 to 80 mg Ca2+/L
corresponding to 0 to 200 mg CaCO3/L). This result confirms the previous discussion regarding
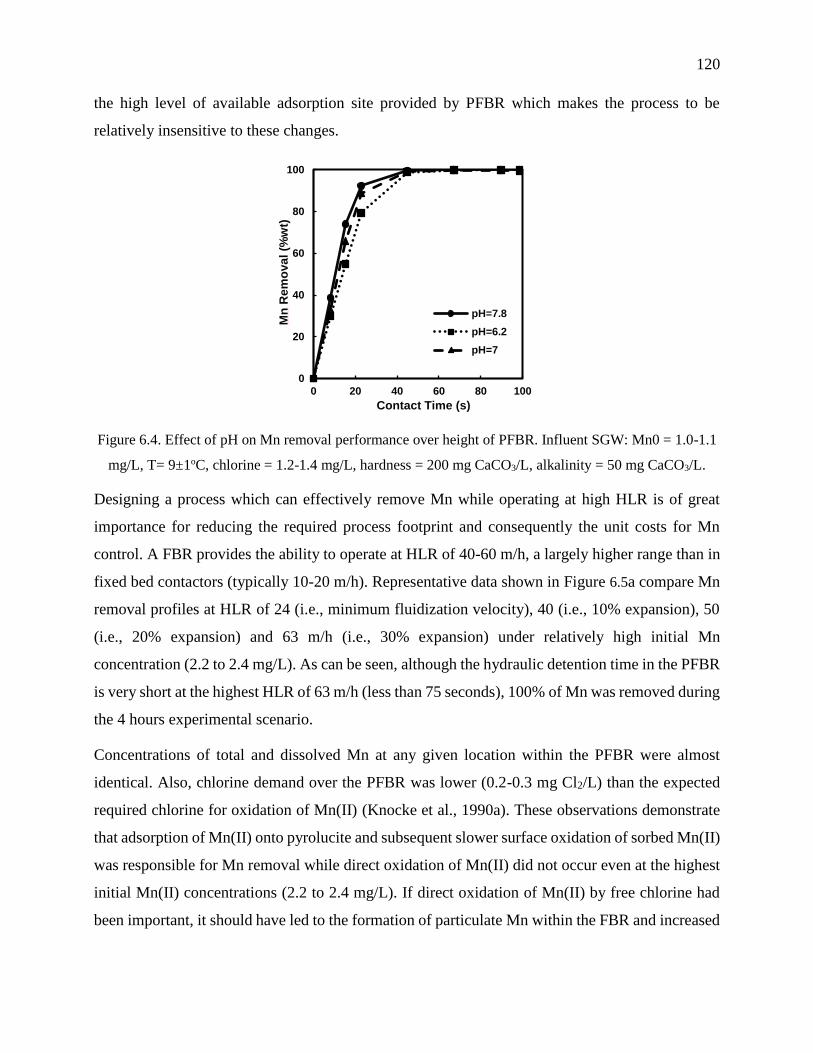
120
the high level of available adsorption site provided by PFBR which makes the process to be
relatively insensitive to these changes.
Figure 6.4. Effect of pH on Mn removal performance over height of PFBR. Influent SGW: Mn0 = 1.0-1.1
mg/L, T= 9±1oC, chlorine = 1.2-1.4 mg/L, hardness = 200 mg CaCO3/L, alkalinity = 50 mg CaCO3/L.
Designing a process which can effectively remove Mn while operating at high HLR is of great
importance for reducing the required process footprint and consequently the unit costs for Mn
control. A FBR provides the ability to operate at HLR of 40-60 m/h, a largely higher range than in
fixed bed contactors (typically 10-20 m/h). Representative data shown in Figure 6.5a compare Mn
removal profiles at HLR of 24 (i.e., minimum fluidization velocity), 40 (i.e., 10% expansion), 50
(i.e., 20% expansion) and 63 m/h (i.e., 30% expansion) under relatively high initial Mn
concentration (2.2 to 2.4 mg/L). As can be seen, although the hydraulic detention time in the PFBR
is very short at the highest HLR of 63 m/h (less than 75 seconds), 100% of Mn was removed during
the 4 hours experimental scenario.
Concentrations of total and dissolved Mn at any given location within the PFBR were almost
identical. Also, chlorine demand over the PFBR was lower (0.2-0.3 mg Cl2/L) than the expected
required chlorine for oxidation of Mn(II) (Knocke et al., 1990a). These observations demonstrate
that adsorption of Mn(II) onto pyrolucite and subsequent slower surface oxidation of sorbed Mn(II)
was responsible for Mn removal while direct oxidation of Mn(II) did not occur even at the highest
initial Mn(II) concentrations (2.2 to 2.4 mg/L). If direct oxidation of Mn(II) by free chlorine had
been important, it should have led to the formation of particulate Mn within the FBR and increased
0
20
40
60
80
100
0 20 40 60 80 100
Mn
Re
mo
va
l (%
wt)
Contact Time (s)
pH=7.8
pH=6.2
pH=7
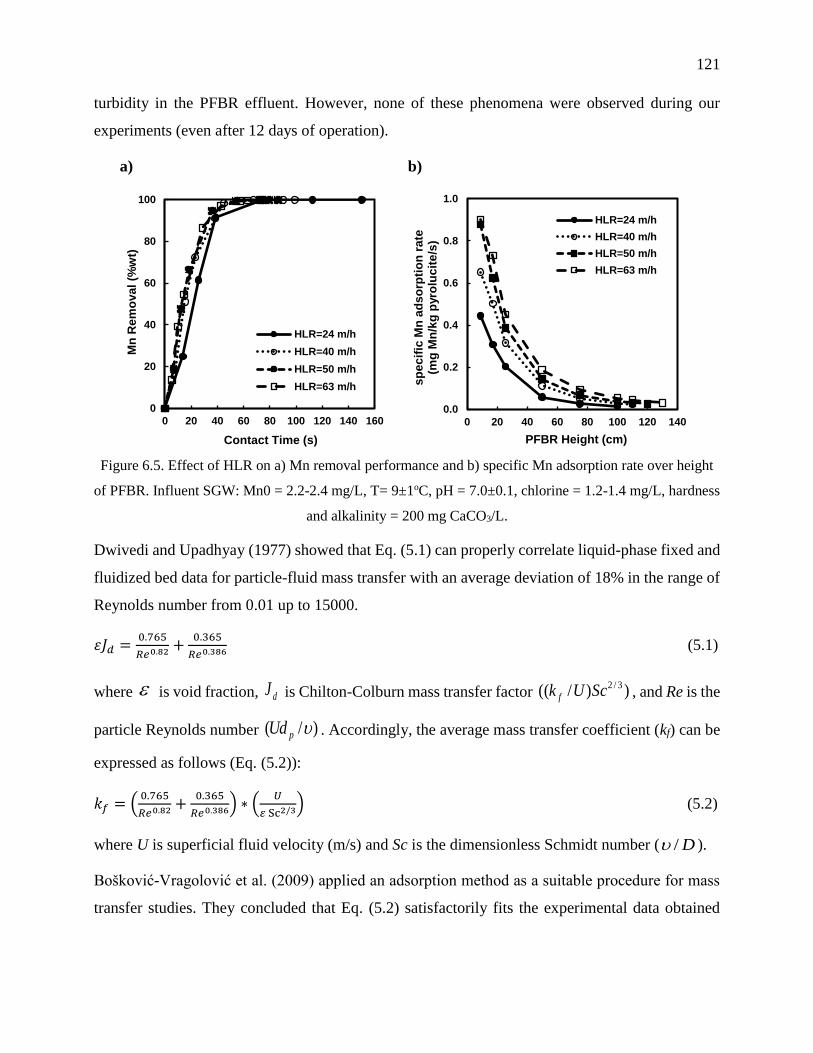
121
turbidity in the PFBR effluent. However, none of these phenomena were observed during our
experiments (even after 12 days of operation).
a) b)
Figure 6.5. Effect of HLR on a) Mn removal performance and b) specific Mn adsorption rate over height
of PFBR. Influent SGW: Mn0 = 2.2-2.4 mg/L, T= 9±1oC, pH = 7.0±0.1, chlorine = 1.2-1.4 mg/L, hardness
and alkalinity = 200 mg CaCO3/L.
Dwivedi and Upadhyay (1977) showed that Eq. (5.1) can properly correlate liquid-phase fixed and
fluidized bed data for particle-fluid mass transfer with an average deviation of 18% in the range of
Reynolds number from 0.01 up to 15000.
휀𝐽𝑑 =0.765
𝑅𝑒0.82 +0.365
𝑅𝑒0.386 (5.1)
where is void fraction, dJ is Chilton-Colburn mass transfer factor ))/(( 3/2ScUk f , and Re is the
particle Reynolds number )/( pUd . Accordingly, the average mass transfer coefficient (kf) can be
expressed as follows (Eq. (5.2)):
𝑘𝑓 = (0.765
𝑅𝑒0.82 +0.365
𝑅𝑒0.386) ∗ (𝑈
Sc2/3) (5.2)
where U is superficial fluid velocity (m/s) and Sc is the dimensionless Schmidt number ( D/ ).
Bošković-Vragolović et al. (2009) applied an adsorption method as a suitable procedure for mass
transfer studies. They concluded that Eq. (5.2) satisfactorily fits the experimental data obtained
0
20
40
60
80
100
0 20 40 60 80 100 120 140 160
Mn
Re
mo
va
l (%
wt)
Contact Time (s)
HLR=24 m/h
HLR=40 m/h
HLR=50 m/h
HLR=63 m/h
0.0
0.2
0.4
0.6
0.8
1.0
0 20 40 60 80 100 120 140s
pe
cif
ic M
n a
ds
orp
tio
n r
ate
(mg
Mn
/kg
pyro
luc
ite
/s)
PFBR Height (cm)
HLR=24 m/h
HLR=40 m/h
HLR=50 m/h
HLR=63 m/h

122
from diluted solution fluid-to-solid mass transfer in their FBR. This is consistent with Dwivedi and
Upadhyay (1977) conclusion.
Eq. (5.2) depicts that kf is proportional to fluid velocity. However, it is worth mentioning that an
increase in FBR fluid velocity also results in an increase in bed voidage (or porosity) which is
inversely proportional to kf. Bošković-Vragolović et al. (2009) computed kf values at different fluid
velocities in both fixed-bed and FBR. Their results showed that the highest kf can be achieved at
minimum fluidization velocity, in which the adsorbent concentration is maximum ( ε is minimum).
From their results, it seems that after minimum fluidization velocity higher HLR cannot
compensate the resulting increase in voidage and hence the kf decrease.
Surprisingly, the result obtained in this study, as depicted in Figure 6.5b, shows that specific Mn
adsorption rate, over the height of PFBR, is higher at elevated HLR. Consistently, the calculated kf
at different HLR (Table 6.2) using Eq. (5.2) reveals that kf slightly increases at higher HLR (14%
for the highest HLR). Such difference with Bošković-Vragolović et al. (2009) data is probably due
to the high specific gravity of the pyrolucite media relative to the glass particles used by these
authors. A high specific gravity prevents excessive expansion of the PFBR at high HLR. For
example, Table 6.2 indicates that an increased HLR from 24 to 63 m/h represents a 2.6-fold
increase. Meanwhile, bed porosity is only increased by 25%. Consequently, the increased HLR can
compensate the detrimental effect on kf of working with a higher porosity. These results show that,
unlike the packed-bed pyrolucite contactor (Zuravnsky, 2006; Tobiason et al., 2008), Mn removal
performance in PFBR not only does not reduce at elevated HLR but also a slight increase can be
achieved (Figure 6.5a and b).
Table 6.2. The average mass transfer coefficient at different HLR.
HLR (m/h) Re 𝜺 kf×105 (m/s)
24 2.17 0.47 9.58
40 3.62 0.52 10.47
50 4.53 0.56 10.58
63 5.71 0.59 10.93
123
6.3.2 Long-Term Stability of the PFBR
Additional experiments were performed over a period of 12 days to determine the stability of the
PFBR with respect to Mn removal. These assays were duplicated using two different effluent free
chlorine residuals. The presence of sufficient free chlorine residual is critical for both the
maintenance of available sorption sites and to increase the mass transfer gradient between the
interface of the media and the bulk water (Knocke et al., 1990a). Figure 6.6 shows Mn concentration
in the PFBR inlet and outlet during the 12-day experiments, while free chlorine residuals were kept
at 1.0 (Figure 6.6a) and 2.0-2.6 mgCl2/L (Figure 6.6b) in treated water, respectively. For
experiments conducted using a free chlorine residual of 1.0 mgCl2/L in the effluent, the process
failed to adequately remove Mn (i.e. < 20 µg/L in the effluent) after 6 days of operation
(Figure 6.6a). However, increasing the effluent concentration to 2.0-2.6 mgCl2/L led to Mn
concentration steadily reduced to below the limit value of 20 µg/L in the effluent (almost 100%
removal performance) (Figure 6.6b) for the entire test period. As shown in Figure 6.6a and b,
chlorine demand over the PFBR was increased at higher influent chlorine concentration (from <
0.2 mgCl2/L to 0.2-0.9 mgCl2/L). This confirms the higher stability of the PFBR at effluent free
chlorine of 2.0-2.6 mg/L as most of the occupied sites were continuously regenerated (the
theoretical chlorine demand to oxidize Mn(II) to Mn(IV) is 1.0-1.3 mgCl2/L for this influent Mn(II)
concentration, however, the oxidation state of Mn on the surface of media may vary between
Mn(III) to Mn(IV) (Cerrato et al., 2011)). For some systems, such free chlorine residual might be
too high to be considered applicable and depends on the required needs with respect to primary and
secondary disinfection. Nevertheless, regenerating the media after 6 days of operation appears a
realistic operational constraint for a small groundwater system operator. Finally, these operational
cycles were achieved for a relatively high influent Mn concentration of 0.8-1.3 mg/L. It is expected
that lowering influent Mn condition will lead to longer duration before regeneration. Similarly, a
deeper PFBR might also be an option to extend the duration of operation before regeneration.
Finally, it is important to point out that over this time period (12 days), the turbidity in the PFBR
effluent was constantly at 0.2 NTU which implies that no post-filtration would be needed after the
PFBR. Additional assays are scheduled to be conducted using an industrial pilot under natural
groundwater conditions to address the longer-term fate of the Mn removed within the PFBR.

124
a) b)
Figure 6.6. Stability of the PFBR for Mn control at effluent free chlorine concentrations of a) 1.0 mg/L b)
2.0-2.6 mg/L. Mn0 = 0.8-1.3 mg/L, T= 10±2oC, pH = 7.0±0.1, HLR ≈ 40 m/h (10% expansion), alkalinity
= 150-200 mg CaCO3/L and hardness = 200 mg CaCO3/L.
6.4 Conclusions
The potential application of a PFBR for Mn removal from groundwater containing high level of
Mn(II) was evaluated under various synthetic groundwater (SGW) composition and operational
conditions. The following conclusions were drawn from this research study:
High performance of a PFBR with respect to dissolved Mn removal was demonstrated
under different operating conditions and SGW composition. Close to 100% Mn removal
was achieved within a short contact time (< 1 min).
Low influent pH values (down to 6.2) and high Ca2+ concentrations (up to 80 mg/L or 200
mg CaCO3/L) did not have significant detrimental effect on Mn removal throughout the
PFBR.
Providing sufficient contact time was found to be a key design parameter in this process
rather than the SGW composition.
High specific gravity of pyrolucite allowed the process to be operated at high HLR without
any concern of reduction in adsorption rate.
Maintenance of an appropriate effluent free residual chlorine in the effluent of PFBR plays
a major role in the long-term stability of this process.
0.0
0.2
0.4
0.6
0.8
1.0
0.001
0.01
0.1
1
10
Ch
lori
ne
de
ma
nd
(m
g C
l 2/L
)
Mn
co
nc
en
tra
tio
n (
mg
/L)
Time (days)
Inlet Mn
Outlet Mn
Mn limit
Chlorine demand
0.0
0.2
0.4
0.6
0.8
1.0
0.001
0.01
0.1
1
10
Ch
lori
ne
de
ma
nd
(m
g C
l 2/L
)
Mn
co
nc
en
tra
tio
n (
mg
/L)
Time (days)
Inlet Mn
Outlet Mn
Mn limit
Chlorine demand
125
Future assays should evaluate the impact of natural organic matter as well as test if dissolved iron
can be removed simultaneously with Mn in the PFBR.
Acknowledgements
The authors wish to acknowledge the financial support of RESE’EAU-WATERNET, a NSERC
collaborative strategic network dedicated to finding innovative drinking water treatment solutions
for small rural communities. We also wish to thank Mireille Blais, Noam Geismar and Marcellin
Fotsing for providing help with the operation of the pilot and some chemical analyses. Finally, we
thank the CREDEAU laboratories at École Polytechnique de Montréal for providing access to its
facilities in order to conduct the study.
126
CHAPTER 7 ARTICLE 4 : COMPARISON OF PYROLUCITE FIXED
AND FLUIDIZED BEDS FOR IRON AND MANGANESE CONTROL IN
GROUNDWATER: A PILOT-SCALE STUDY
This chapter presents a manuscript submitted to the Journal of Environmental Chemical
Engineering. It reports the results obtained from an extensive experimental campaign aimed at
investigating the performances of pilot-scale pyrolucite fixed and fluidized bed contactors for iron
and manganese control in groundwater under different conditions.
Comparison of Pyrolucite Fixed and Fluidized Beds for Iron and Manganese Control in
Groundwater: A Pilot-Scale Study
Seyedeh Laleh Dashtban Kenaria*, Jaber Shabanianb, and Benoit Barbeaua
a Polytechnique Montreal, Department of Civil, Geological and Mining Engineering, NSERC-
Industrial Chair on Drinking Water, Environment, C.P. 6079, Succursale Centre-Ville, Montreal,
QC, H3C 3A7, Canada.
b Polytechnique Montreal, Department of Chemical Engineering, C.P. 6079, Succursale Centre-
Ville, Montreal, Quebec, H3C 3A7, Canada.
* Corresponding author: Tel: +1 514 340-4711 #2983; Fax: 514-340-5918;
E-mail: [email protected]
127
ABSTRACT
Iron and manganese removal is a common water treatment goal in groundwater systems. Pilot-scale
pyrolucite fixed and fluidized bed contactors were tested in parallel to examine the iron and
manganese removal from a natural groundwater which was supplemented with iron/manganese in
order to challenge both processes. The design of the distributor plate located at the bottom of the
pyrolucite fluidized bed (PFB) had crucial impact on the release of particulate manganese from the
filter media. Using an optimal distributor plate, the PFB contactor provided effective manganese
removal (< 0.02 mg/L) at very high hydraulic loading rate (45 m/h). The fixed bed was also
effective at 20 m/h. Under elevated iron concentration (0.18 ± 0.02 mg/L), the pyrolucite fixed bed
alone provided almost complete iron and manganese removal while requiring frequent backwash
of the filter bed (3 d). However, under such condition, the PFB failed to properly control the iron
and manganese concentrations below the target limit of 0.02 mg/L as manganese and iron were
found to be carried over in the effluent. Further study should address the potential implementation
of a cost-effective post-filtration process, downstream of the PFB, which would finalize the iron
and manganese removal from the PFB effluent.
KEYWORDS: Iron/manganese removal; fixed bed; fluidized bed; groundwater; pyrolucite.
7.1 Introduction
Nearly 30% of Canadian and 44% of the US population, mostly living in small rural communities,
relies on groundwater as a source of drinking water. Groundwater commonly contains high levels
of dissolved iron and manganese due to the presence of reduced redox conditions. Although the
presence of iron and manganese in drinking water is principally regarded as an aesthetic and
operating issues, recent studies have disclosed that manganese intake from water ingestion, even at
low levels, may lead to intellectual impairment in children (Bouchard et al., 2011) and other
neurological disorders (Wasserman et al., 2006; Tuschl et al., 2013). The United States
Environmental Protection Agency (USEPA 2004) and Guidelines for Canadian Drinking Water
Quality (Health Canada, 2014) recommended an aesthetic drinking water objective of 0.3 and 0.05
mg/L for iron and manganese, respectively. However, the concentrations of iron and manganese as
low as 0.05 mg/L (World Health Organization, 2003) and 0.02 mg/L (Sly et al., 1990) may still
128
result in discoloration of water. As a consequence, Health Canada (2016) has recently proposed an
aesthetic objective limit of 0.02 mg/L and a health-based value of 0.1 mg/L for total manganese in
drinking water. The implementation of these guidelines (still pending at the time of preparing this
article) is expected to reinforce the importance of proper operation and design of manganese
removal processes.
The oxidation and filtration method that is conventionally utilized in North America for iron and
manganese control in groundwater has some constraints, which can be listed as follows: (i) multiple
hours of contact time is required for substantial oxidation of manganese by free chlorine even at
pH 8.0 (Knocke et al., 1990b; Allard et al., 2013); (ii) oxidation of manganese by stronger oxidants
than chlorine, such as potassium permanganate and ozone, depends on the pH, temperature, initial
dissolved manganese concentration, and contact time (Knocke et al., 1990b; Van Benschoten et al.,
1992); (iii) application of these strong oxidants always rises the risk of pink water formation,
especially in water sources with high concentration of natural organic matter (NOM) (Gregory and
Carlson, 2003); (iv) manganese oxides can be difficult to capture by granular media filtration
(Carlson et al., 1997) owing to the formation of stabilized colloids with a high negative charge
(Dashtban Kenari and Barbeau, 2016a); and (v) colloidal manganese is prone to severely foul
microfiltration (MF) or ultrafiltration (UF) membranes (Dashtban Kenari and Barbeau, 2016b).
Natural greensand effect (NGE) process has proved to be a reliable technique for successful
manganese control (Knocke et al., 1990a; Knocke et al., 2010; Dashtban Kenari and Barbeau,
2014). In this process, manganese removal is based on the adsorption of dissolved ion onto the
MnOx(s) surface followed by catalytic oxidation of the adsorbed manganese. Thus, the performance
of this process is substantially affected by the maintenance of available sorption sites, which is
governed by the MnOx(s) coating level, pH, and the concentration of oxidant. The dual functions of
filter media in NGE process allow two modes of operation: intermittent regeneration (IR) and
continuous regeneration (CR) (Knocke et al., 1990a). In IR operation mode, the filter media adsorbs
dissolved manganese until available sorption sites are exhausted and breakthrough take place. The
filter media is then regenerated by potassium permanganate or free chlorine to restore its adsorption
capacity. In CR mode, free chlorine is continuously injected into water prior entering the filtration
column and the exhausted adsorption sites are continuously regenerated in order to keep them
active. However, since the adsorption rate is much faster than the oxidation rate of adsorbed
manganese by free chlorine (Knocke et al., 1990a), all the adsorption sites may not be fully
129
regenerated and exhaustion might occur after a long operation unless sufficient chlorine residual is
maintained throughout the column (Dashtban Kenari and Barbeau, 2014).
Catalytic filtration of manganese has been particularly implemented in fixed bed contactors
containing MnOx(s)-coated sand, such as manganese greensand, at relatively low hydraulic loading
rates (HLRs) (6-12 m/h) (Hargette and Knocke, 2001; Yang et al., 2008; Piispanen and Sallanko,
2010). The conventional fixed bed contactors for adsorption of manganese have several
disadvantages, such as a relatively high hydraulic retention time, high energy expenses due to rapid
head loss build-up, and a large amount of wastewater production during backwash. Alternatively,
pyrolucite fluidized bed (PFB) adsorptive contactors could offer a number of promising benefits in
comparison with the fixed bed contactors containing MnOx(s)-coated sand such as: (i) pyrolucite
media, which is a natural manganese sand consisting of more than 80% manganese dioxide, offers
high available adsorption sites; (ii) high specific gravity of pyrolucite (around 4.0) allows operating
the fluidized bed at very high HLRs without any concerns about the particle entrainment from the
bed; (iii) the adsorption sites can be efficiently exploited in fluidized state due to the better fluid-
solid contact which offers a higher adsorption rate; and (iv) the fluidized bed contactor permits the
application of pyrolucite media with high specific surface area (all granules are smaller than 0.8
mm in size) that is favorable for adsorption kinetic while simultaneously eliminates the head loss
accumulation problem that is common for the fixed bed contactors. In an earlier study by our group
(Dashtban Kenari and Barbeau, 2014), we demonstrated that high levels of dissolved manganese
in synthetic groundwater could be successfully controlled by a PFB contactor. However, the long-
term stability of the process was not explored using natural groundwater. In addition, it is unknown
if the PFB contactor performance for manganese removal is impacted by the presence of iron in
water. Finally, it is unclear if a proper treatment performance of a PFB contactor can be achieved
for iron removal or not while, unlike manganese, dissolved iron is readily oxidized by free chlorine
(Knocke et al., 1990b).
This study aimed at shedding light on the performance of a pilot-scale PFB contactor for dissolved
iron and manganese removals during long-term operation of a pilot system fed by a natural
groundwater. In parallel, a pilot-scale fixed bed contactor was operated as a control. Both
contactors were operated under variable iron and manganese concentrations and HLRs. This study
also addresses the operational challenges that can be encountered for pyrolucite fixed and fluidized
bed contactors.
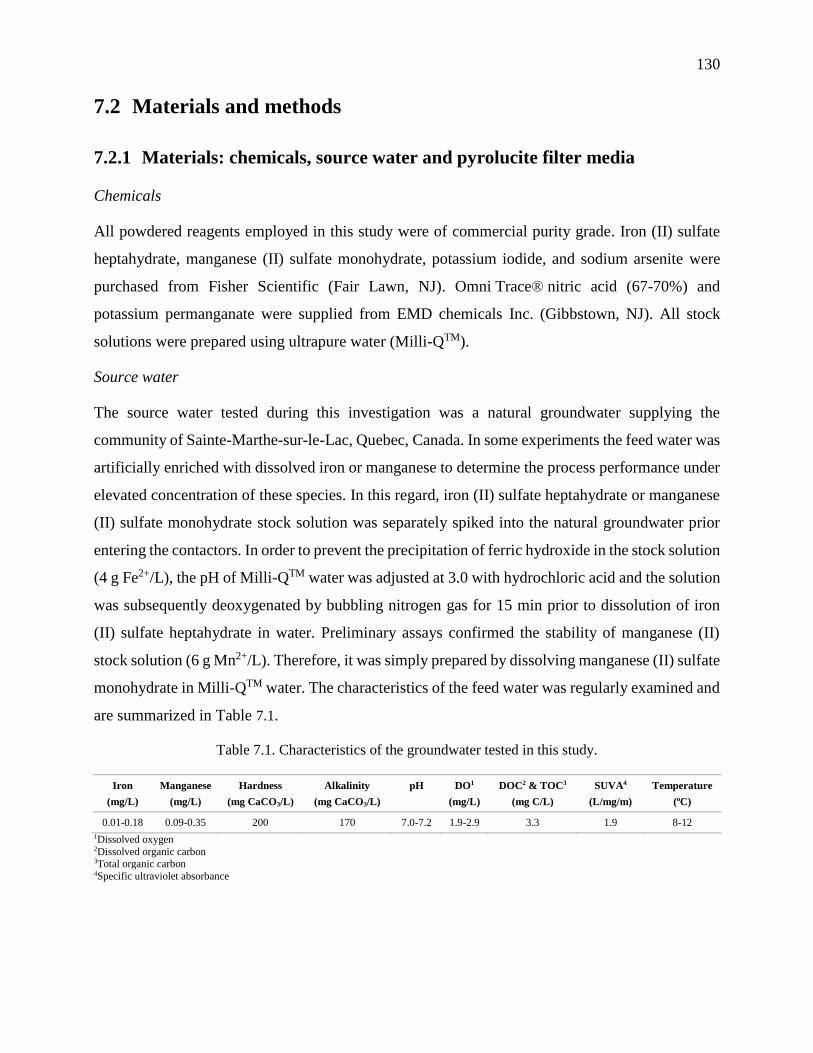
130
7.2 Materials and methods
7.2.1 Materials: chemicals, source water and pyrolucite filter media
Chemicals
All powdered reagents employed in this study were of commercial purity grade. Iron (II) sulfate
heptahydrate, manganese (II) sulfate monohydrate, potassium iodide, and sodium arsenite were
purchased from Fisher Scientific (Fair Lawn, NJ). Omni Trace® nitric acid (67-70%) and
potassium permanganate were supplied from EMD chemicals Inc. (Gibbstown, NJ). All stock
solutions were prepared using ultrapure water (Milli-QTM).
Source water
The source water tested during this investigation was a natural groundwater supplying the
community of Sainte-Marthe-sur-le-Lac, Quebec, Canada. In some experiments the feed water was
artificially enriched with dissolved iron or manganese to determine the process performance under
elevated concentration of these species. In this regard, iron (II) sulfate heptahydrate or manganese
(II) sulfate monohydrate stock solution was separately spiked into the natural groundwater prior
entering the contactors. In order to prevent the precipitation of ferric hydroxide in the stock solution
(4 g Fe2+/L), the pH of Milli-QTM water was adjusted at 3.0 with hydrochloric acid and the solution
was subsequently deoxygenated by bubbling nitrogen gas for 15 min prior to dissolution of iron
(II) sulfate heptahydrate in water. Preliminary assays confirmed the stability of manganese (II)
stock solution (6 g Mn2+/L). Therefore, it was simply prepared by dissolving manganese (II) sulfate
monohydrate in Milli-QTM water. The characteristics of the feed water was regularly examined and
are summarized in Table 7.1.
Table 7.1. Characteristics of the groundwater tested in this study.
Iron
(mg/L)
Manganese
(mg/L)
Hardness
(mg CaCO3/L)
Alkalinity
(mg CaCO3/L)
pH DO1
(mg/L)
DOC2 & TOC3
(mg C/L)
SUVA4
(L/mg/m)
Temperature
(oC)
0.01-0.18 0.09-0.35 200 170 7.0-7.2 1.9-2.9 3.3 1.9 8-12
1Dissolved oxygen 2Dissolved organic carbon 3Total organic carbon 4Specific ultraviolet absorbance

131
Pyrolucite filter media
Commercially available pyrolucite (MangOxTM brand, high purity: 86% manganese dioxide by wt)
was utilized as a filter media in both types of contactor. The physical characteristics of pyrolucite
are presented in Table 7.2. The virgin pyrolucite was conditioned with potassium permanganate
prior to its use in the pilot plant.
Table 7.2. Characteristics of commercial pyrolucite.
Median diameter
(D50) (mm)
Uniformity coefficient
(D60/D10)
Mesh size Specific gravity Bulk density
(kg/m3)
Porosity Manganese dioxide
(% wt)
0.6 1.5 20 * 40 3.8 2000 0.47 86 %
7.2.2 Pilot plant configuration
The pilot plant was located at a groundwater treatment facility in Sainte-Marthe-Sur-le-Lac,
Quebec, Canada. The configuration of the pilot plant with fixed and fluidized bed contactors is
shown in Figure 7.1. The columns were made of two identical transparent clear polyvinyl chloride
(PVC) pipes with approximately 2.5 m length and 15.2 cm (6 in.) inner diameter. Both columns
were filled up to an initial fixed bed height of 90 cm with the commercially available pyrolucite.
The feed line was equipped with a static mixer to blend all the individually spiked solutions with
the natural groundwater. The volumetric flow rate was adjusted with a rotameter.
In order to achieve an appropriate operation of the PFB contactor, we first examined different
configurations of influent distributor plate. Designing a proper distributor was shown to be critical
to the successful operation of the PFB contactor. The best configuration identified during these
preliminary tests was then used for the rest of the study. Configurations of these plates are briefly
described as follows and are presented in Figure 7.2:
i) Distributor A: A cap distributor plate containing two caps each having forty slits of 0.2
mm width and 25 mm long. The plate was made from PVC.
ii) Distributor B: A shrouded perforated distributor plate made from PVC with a total
thickness of 5 cm. The bottom layer of the plate, which was responsible for creating
enough pressure drop to evenly distribute liquid across the bed cross-section, was 1.2
cm thick and consisted of seven holes of 4 mm in diameter. Six of these holes were
evenly arranged in a circular path of 10 cm diameter while the last one was located at
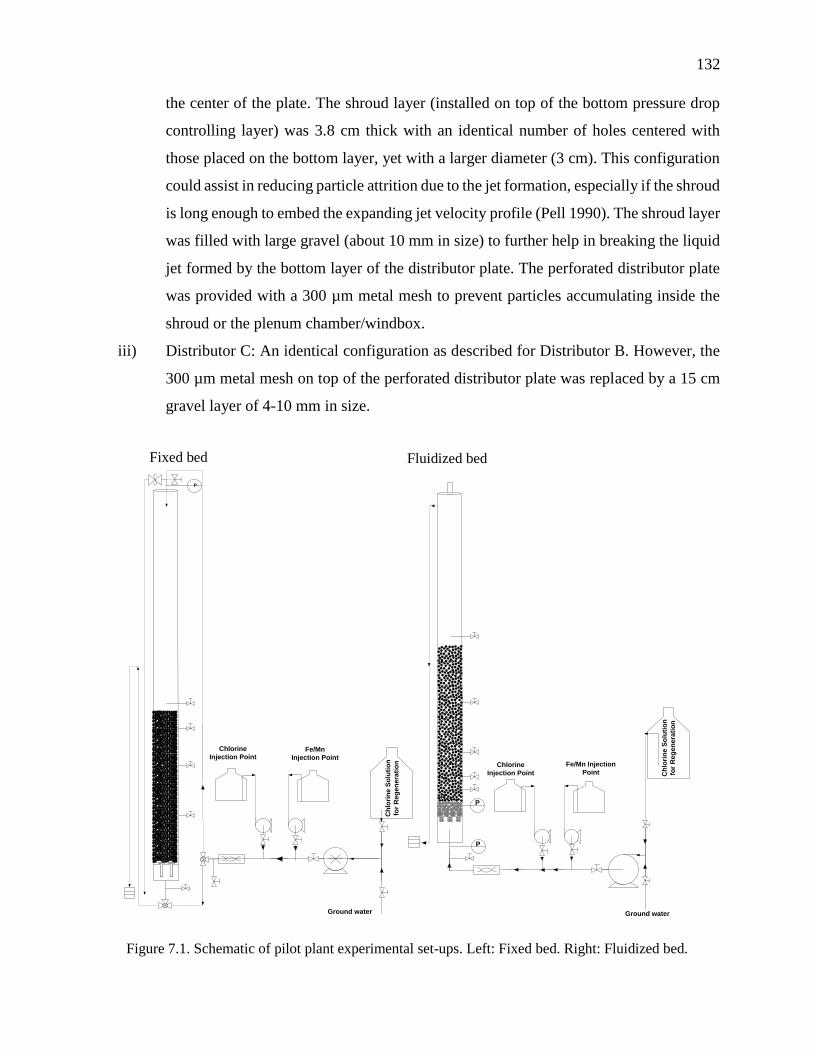
132
the center of the plate. The shroud layer (installed on top of the bottom pressure drop
controlling layer) was 3.8 cm thick with an identical number of holes centered with
those placed on the bottom layer, yet with a larger diameter (3 cm). This configuration
could assist in reducing particle attrition due to the jet formation, especially if the shroud
is long enough to embed the expanding jet velocity profile (Pell 1990). The shroud layer
was filled with large gravel (about 10 mm in size) to further help in breaking the liquid
jet formed by the bottom layer of the distributor plate. The perforated distributor plate
was provided with a 300 µm metal mesh to prevent particles accumulating inside the
shroud or the plenum chamber/windbox.
iii) Distributor C: An identical configuration as described for Distributor B. However, the
300 µm metal mesh on top of the perforated distributor plate was replaced by a 15 cm
gravel layer of 4-10 mm in size.
Ch
lori
ne
So
luti
on
for
Re
ge
ne
rati
on
Ground water
Fe/Mn Injection
PointChlorine
Injection Point
P
P
Ground water
P
Fe/Mn
Injection Point
Chlorine
Injection Point
Ch
lori
ne
So
luti
on
for
Re
ge
ne
rati
on
Figure 7.1. Schematic of pilot plant experimental set-ups. Left: Fixed bed. Right: Fluidized bed.
Fixed bed Fluidized bed

133
Distributor A Distributor B Distributor C
Figure 7.2. Schematic drawing of various distributors for fluidized bed contactor.
7.2.3 Pilot plant operation
Fluidized bed contactor
Natural groundwater was introduced into the bottom of the column at a flow rate of 30-45 m/h (12-
18 gpm/ft2) using a centrifuge pump (Natpro, Inc.) which fluidized the pyrolucite media to a bed
expansion of 10-20%. Commercial bleach solution (4% (W/V) Cl2/L) was continuously injected
into the water prior entering the column. The flow of this solution was accurately adjusted to
maintain an effluent free chlorine residual of 1.0 mg Cl2/L. In order to determine iron and
manganese removal profile along the fluidized bed, water samples were taken at different heights
of the column (at distributor level and 7.5, 15, 30, 60, 100 and 110 cm above the distributor). Both
dissolved and total iron and manganese concentrations were measured at each sampling point.
Dissolved species were defined as iron and manganese filterable through a 0.45 µm syringe filter
134
(PVDF, CAT. NO. CS-GLPV3045). A gauge pressure transducer (Omega, PX409-030GUSB) was
mounted flush with the wall of the fluidized bed and right above the distributor plate for continuous
monitoring of the pressure build-up within the bed over a total 21 days of experimental period for
each condition explored in this research. The first samples that were collected after one hour of
initiation of the experiment are ascribed to the time zero (t = 0). At the end of each experiment, i.e.,
after 21 days of operation, the fluidized bed was expended up to 40% for 20 min to remove the
loosely-attached particles to the pyrolucite media. In order to maintain an identical condition for
all experiments while preserving the same pyrolucite media in the bed, the media was then fully
regenerated with recirculation of 50-L sodium hypochlorite solution (1% (W/V) Cl2/L) at the
minimum fluidization condition for 24 hours.
Fixed bed contactor
The fixed bed was similarly operated to the fluidized bed. The differences in operation could be
listed as: (i) groundwater was fed to the top of the pressurized column with the help of a gear pump
(Natpro, Inc.), which provided a constant flow under all pressures over the 21 days of experimental
cycle; (ii) the fixed bed was operated at a HLR of 20 m/h; (iii) a pressure transducer (Omega,
PX409-030GUSB) was installed on the top of the column for continuous monitoring of the fixed
bed pressure drop, (iv) water samples were collected at various depths of 0, 6, 30, 60, and 90 cm
from the top of the bed, (v) the fixed bed was backwashed for 20 min at 40% bed expansion using
raw water when the upstream bed pressure reached more than 0.5 bar.
In both columns, turbidity, pH, and free chlorine concentrations in the influent and effluent waters
were also measured. Peristaltic pumps (MasterFlex, Cole-Parmer) were used to dose
iron/manganese and sodium hypochlorite stock solutions into the inlet line. Both contactors were
operated for a period of 21 days under each experimental condition.
7.2.4 Analytical methods
Iron and manganese concentrations were analyzed with an inductively coupled plasma-optical
emission spectrometry (ICP-OES, model iCAP 6000) from Thermo Instruments Inc. Water
samples were acidified to 0.5% nitric acid (pH < 2) after the sample collection. Before the analysis,
the samples were further digested by incubation in a water bath at 80 °C for 48 hours to completely
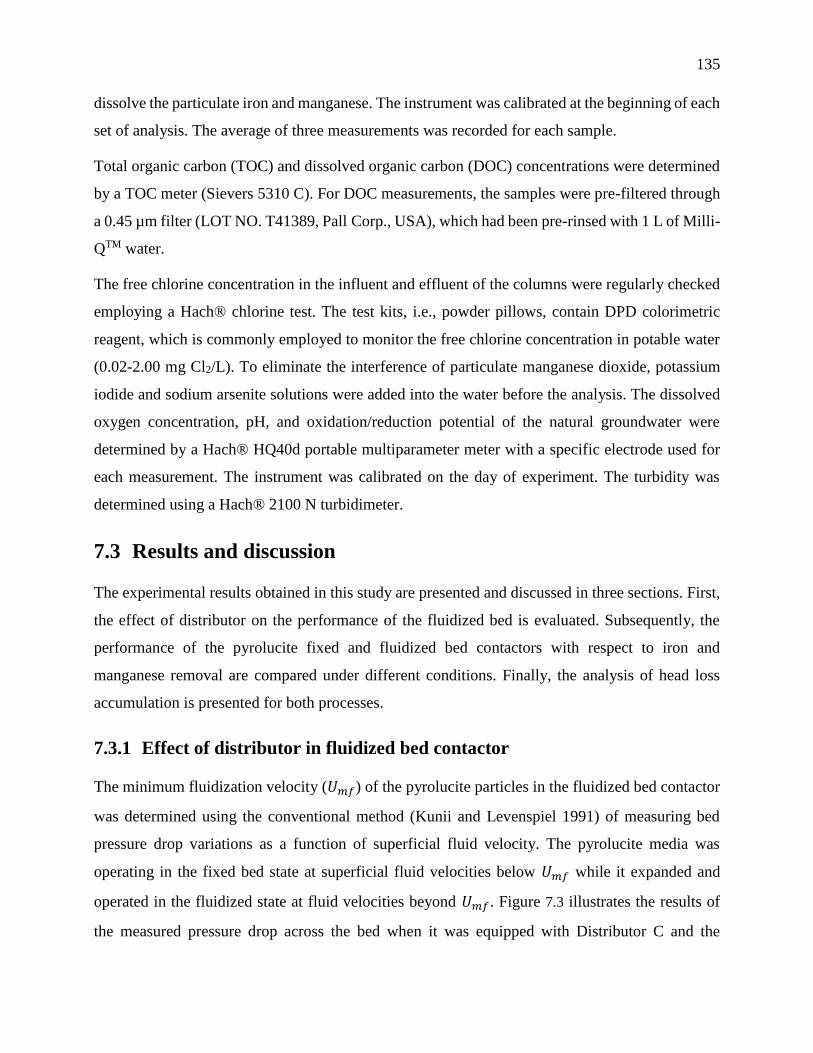
135
dissolve the particulate iron and manganese. The instrument was calibrated at the beginning of each
set of analysis. The average of three measurements was recorded for each sample.
Total organic carbon (TOC) and dissolved organic carbon (DOC) concentrations were determined
by a TOC meter (Sievers 5310 C). For DOC measurements, the samples were pre-filtered through
a 0.45 µm filter (LOT NO. T41389, Pall Corp., USA), which had been pre-rinsed with 1 L of Milli-
QTM water.
The free chlorine concentration in the influent and effluent of the columns were regularly checked
employing a Hach® chlorine test. The test kits, i.e., powder pillows, contain DPD colorimetric
reagent, which is commonly employed to monitor the free chlorine concentration in potable water
(0.02-2.00 mg Cl2/L). To eliminate the interference of particulate manganese dioxide, potassium
iodide and sodium arsenite solutions were added into the water before the analysis. The dissolved
oxygen concentration, pH, and oxidation/reduction potential of the natural groundwater were
determined by a Hach® HQ40d portable multiparameter meter with a specific electrode used for
each measurement. The instrument was calibrated on the day of experiment. The turbidity was
determined using a Hach® 2100 N turbidimeter.
7.3 Results and discussion
The experimental results obtained in this study are presented and discussed in three sections. First,
the effect of distributor on the performance of the fluidized bed is evaluated. Subsequently, the
performance of the pyrolucite fixed and fluidized bed contactors with respect to iron and
manganese removal are compared under different conditions. Finally, the analysis of head loss
accumulation is presented for both processes.
7.3.1 Effect of distributor in fluidized bed contactor
The minimum fluidization velocity (𝑈𝑚𝑓) of the pyrolucite particles in the fluidized bed contactor
was determined using the conventional method (Kunii and Levenspiel 1991) of measuring bed
pressure drop variations as a function of superficial fluid velocity. The pyrolucite media was
operating in the fixed bed state at superficial fluid velocities below 𝑈𝑚𝑓 while it expanded and
operated in the fluidized state at fluid velocities beyond 𝑈𝑚𝑓. Figure 7.3 illustrates the results of
the measured pressure drop across the bed when it was equipped with Distributor C and the
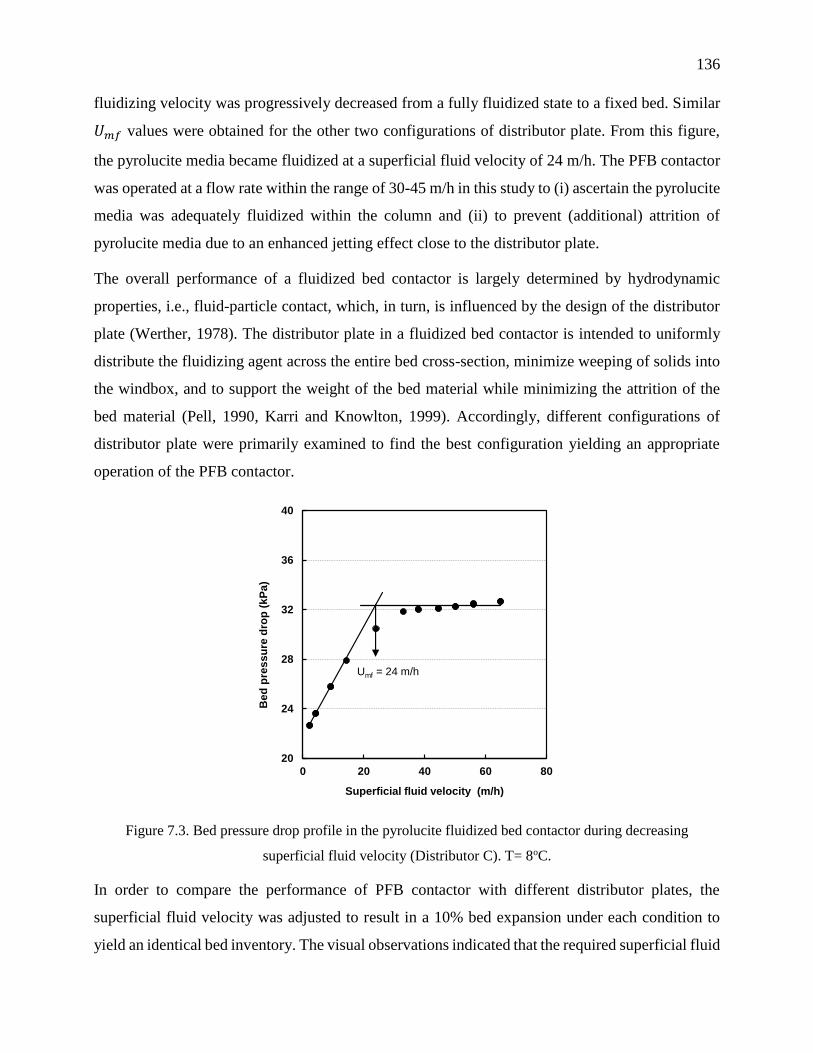
136
fluidizing velocity was progressively decreased from a fully fluidized state to a fixed bed. Similar
𝑈𝑚𝑓 values were obtained for the other two configurations of distributor plate. From this figure,
the pyrolucite media became fluidized at a superficial fluid velocity of 24 m/h. The PFB contactor
was operated at a flow rate within the range of 30-45 m/h in this study to (i) ascertain the pyrolucite
media was adequately fluidized within the column and (ii) to prevent (additional) attrition of
pyrolucite media due to an enhanced jetting effect close to the distributor plate.
The overall performance of a fluidized bed contactor is largely determined by hydrodynamic
properties, i.e., fluid-particle contact, which, in turn, is influenced by the design of the distributor
plate (Werther, 1978). The distributor plate in a fluidized bed contactor is intended to uniformly
distribute the fluidizing agent across the entire bed cross-section, minimize weeping of solids into
the windbox, and to support the weight of the bed material while minimizing the attrition of the
bed material (Pell, 1990, Karri and Knowlton, 1999). Accordingly, different configurations of
distributor plate were primarily examined to find the best configuration yielding an appropriate
operation of the PFB contactor.
Figure 7.3. Bed pressure drop profile in the pyrolucite fluidized bed contactor during decreasing
superficial fluid velocity (Distributor C). T= 8oC.
In order to compare the performance of PFB contactor with different distributor plates, the
superficial fluid velocity was adjusted to result in a 10% bed expansion under each condition to
yield an identical bed inventory. The visual observations indicated that the required superficial fluid
20
24
28
32
36
40
0 20 40 60 80
Be
d p
res
su
re d
rop
(k
Pa
)
Superficial fluid velocity (m/h)
Umf = 24 m/h
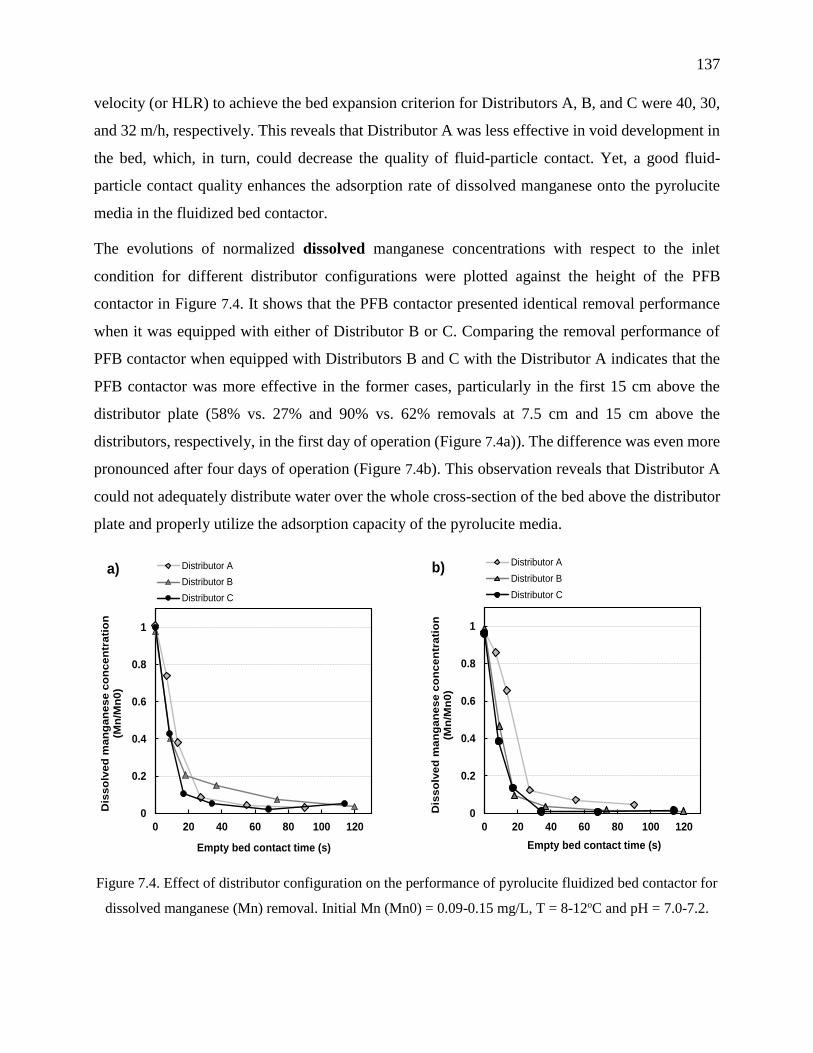
137
velocity (or HLR) to achieve the bed expansion criterion for Distributors A, B, and C were 40, 30,
and 32 m/h, respectively. This reveals that Distributor A was less effective in void development in
the bed, which, in turn, could decrease the quality of fluid-particle contact. Yet, a good fluid-
particle contact quality enhances the adsorption rate of dissolved manganese onto the pyrolucite
media in the fluidized bed contactor.
The evolutions of normalized dissolved manganese concentrations with respect to the inlet
condition for different distributor configurations were plotted against the height of the PFB
contactor in Figure 7.4. It shows that the PFB contactor presented identical removal performance
when it was equipped with either of Distributor B or C. Comparing the removal performance of
PFB contactor when equipped with Distributors B and C with the Distributor A indicates that the
PFB contactor was more effective in the former cases, particularly in the first 15 cm above the
distributor plate (58% vs. 27% and 90% vs. 62% removals at 7.5 cm and 15 cm above the
distributors, respectively, in the first day of operation (Figure 7.4a)). The difference was even more
pronounced after four days of operation (Figure 7.4b). This observation reveals that Distributor A
could not adequately distribute water over the whole cross-section of the bed above the distributor
plate and properly utilize the adsorption capacity of the pyrolucite media.
Figure 7.4. Effect of distributor configuration on the performance of pyrolucite fluidized bed contactor for
dissolved manganese (Mn) removal. Initial Mn (Mn0) = 0.09-0.15 mg/L, T = 8-12oC and pH = 7.0-7.2.
0
0.2
0.4
0.6
0.8
1
0 20 40 60 80 100 120
Dis
so
lve
d m
an
ga
ne
se
co
nc
en
tra
tio
n
(Mn
/Mn
0)
Empty bed contact time (s)
Distributor A
Distributor B
Distributor C
a)
0
0.2
0.4
0.6
0.8
1
0 20 40 60 80 100 120
Dis
so
lve
d m
an
ga
ne
se
co
nc
en
tra
tio
n
(Mn
/Mn
0)
Empty bed contact time (s)
Distributor A
Distributor B
Distributor C
b)
138
Figure 7.5 illustrates the evolutions of normalized particulate manganese concentrations with
respect to the inlet condition along the axis of the PFB contactor for different distributor
configurations. It shows that a considerable amount of particulate manganese was released,
particularly in the jetting zone above the distributor plate, when employing Distributor A. In this
case, the turbidity of the effluent water progressively increased from 0.5 NTU to around 30 NTU
after 12 days of operation. Distributor B, however, resulted in the release of a lower amount of
particulate manganese while the best performance was achieved by using Distributor C. These
observations can be explained by the reduction in the jetting effect caused by the distributor plate,
which can greatly contribute in separation of loosely bounded manganese on the surface of
pyrolucite media in the contactor. This argument is supported by the presence of significantly more
particulate manganese in the fluidizing liquid as the treatment process proceeded when employing
Distributors A and B. The loosely bounded manganese originates from dissolved manganese that
adsorbed on the surface of pyrolucite media and subsequently oxidized during the process.
According to the observations made in this part of the study, Distributor C was adopted in the PFB
contactor for the next part of the study.
Figure 7.5. Effect of distributor configuration on the release of particulate manganese (Mn) along the
height of pyrolucite fluidized bed contactor. Initial Mn (Mn0) = 0.09-0.15 mg/L, T = 8-12oC and pH = 7.0-
7.2.
t = 0 t = 4 d t = 7 d t = 12 d
0.0
0.5
1.0
1.5
2.0
2.5
3.0
0 20 40 60 80 100 120
Pa
rtic
ula
te m
an
ga
ne
se
co
nc
en
tra
tio
n
(Mn
/Mn
0)
Distributor A
0 20 40 60 80 100 120
Empty bed contact time (s)
Distributor B
0 20 40 60 80 100 120
Distributor C

139
7.3.2 Iron and manganese removal performance in pilot plant
7.3.2.1 Experiments with un-spiked natural groundwater
The supplied groundwater naturally contained 00.001.0 mg Fe/L and 01.009.0 mg Mn/L
which were both present in dissolved form. Since the concentration of iron in the raw water was
very low, the removal of iron under this water condition will not be presented. Figure 7.6 shows
the evolution of soluble and total manganese concentrations along the axis of the fixed and fluidized
bed contactors (expressed as empty bed contact time). The reported concentrations are normalized
with respect to the total manganese concentration in the influent. The PFB contactor was effective
in removing manganese, even at a very high HLR of 45 m/h, with almost 100% efficiency for the
influent dissolved manganese removal across the column (Figure 7.6a1 and b1). Although the PFB
contactor led to a slightly lower total manganese removal, i.e., 85-95% (referred to Figure 7.6 a2
and b2), than the dissolved one, the concentration of total manganese in the effluent water was
always below the target limit of 0.02 mg/L. One may postulate that this lower efficiency was only
the result from the presence of particulate manganese in the influent water. However, Figure 7.6
indicates that no significant particulate manganese (< 8%) was present in the influent water. More
than 92% of the initial manganese was dissolved. The abrasive forces resulting from the intensified
particle-particle collisions in the fluidized bed released loosely bonded manganese into the
fluidizing liquid, which was also responsible for the lower total manganese removal efficiencies.
Figure 7.6a2 and b2 support this argument since the PFB contactor was slightly less effective for
total manganese removal at a higher HLR. Higher momentum transfer from the fluidizing fluid to
the particles and, hence, more attrition effect, are expected at a higher HLR. However, in general,
the ability of the PFB contactor to effectively remove manganese was insensitive to the HLR values
(or hydraulic detention times). This result is consistent with our previous finding during the short-
term (4 h) operation of the PFB contactor (Dashtban Kenari and Barbeau, 2014).
The results presented in Figure 7.6c1 and c2 indicate that the total and dissolved manganese removal
efficiencies of the pyrolucite fixed bed contactor was about 100% while the effluent manganese
concentration was always lower than 0.005 mg/L. The higher performance of the fixed bed
compared to the fluidized bed contactor for the total manganese removal can be explained by the
stationary state of the fixed bed, which can better retain all particulates that are formed within the

140
column. However, the concentration of total manganese in the effluent water was satisfactory (<
0.02 mg Mn/L) for both processes.
Scrutinizing Figure 7.6 further reveals that the dissolved and total manganese profiles were stable
under all operating conditions because the concentration curves obtained during 5 sampling
campaigns over 21 days of experiment overlapped on each other. This result also confirms that the
free chlorine residual concentration of 1 mg Cl2/L maintained in the effluent was adequate for
continuous regeneration of the pyrolucite adsorption sites under natural groundwater condition
tested here.
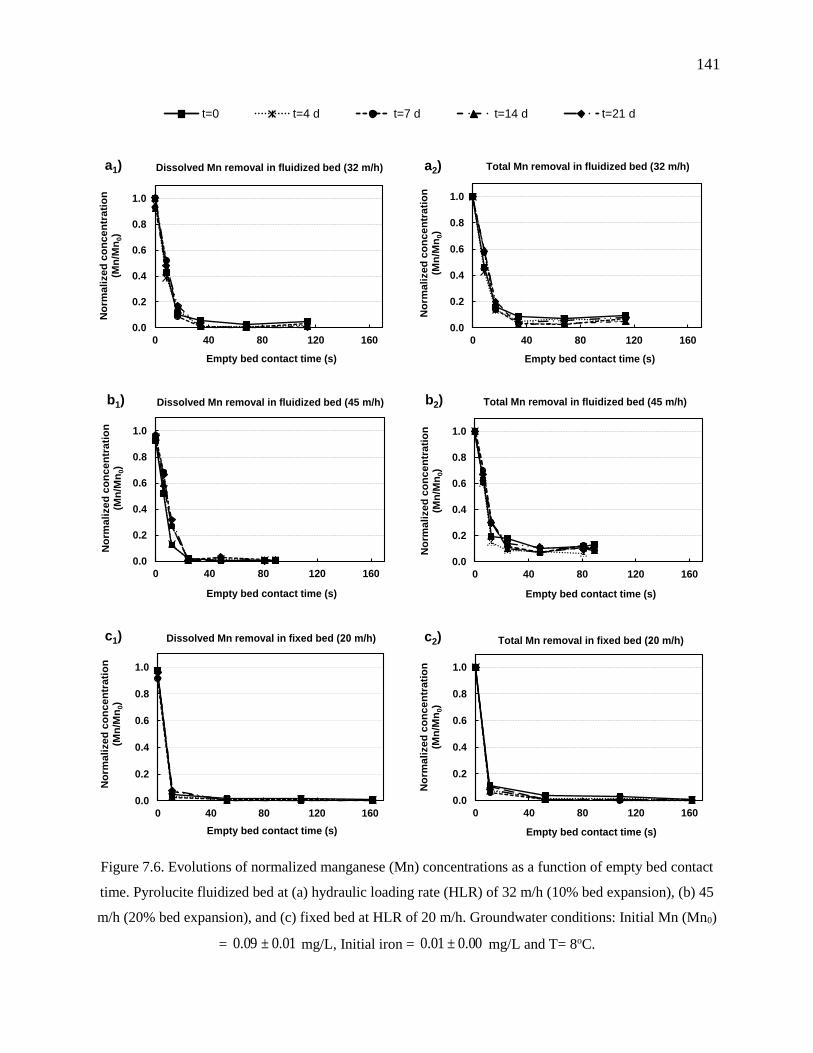
141
Figure 7.6. Evolutions of normalized manganese (Mn) concentrations as a function of empty bed contact
time. Pyrolucite fluidized bed at (a) hydraulic loading rate (HLR) of 32 m/h (10% bed expansion), (b) 45
m/h (20% bed expansion), and (c) fixed bed at HLR of 20 m/h. Groundwater conditions: Initial Mn (Mn0)
= 01.0±09.0 mg/L, Initial iron = 00.0±01.0 mg/L and T= 8oC.
t=0 t=4 d t=7 d t=14 d t=21 d
0.0
0.2
0.4
0.6
0.8
1.0
0 40 80 120 160
No
rma
lize
d c
on
ce
ntr
ati
on
(M
n/M
n0)
Empty bed contact time (s)
Dissolved Mn removal in fluidized bed (32 m/h)
0.0
0.2
0.4
0.6
0.8
1.0
0 40 80 120 160
No
rma
lize
d c
on
ce
ntr
ati
on
(M
n/M
n0)
Empty bed contact time (s)
Total Mn removal in fluidized bed (32 m/h)a2)
0.0
0.2
0.4
0.6
0.8
1.0
0 40 80 120 160
No
rma
lize
d c
on
ce
ntr
ati
on
(M
n/M
n0)
Empty bed contact time (s)
Dissolved Mn removal in fluidized bed (45 m/h)b1)
0.0
0.2
0.4
0.6
0.8
1.0
0 40 80 120 160
No
rma
lize
d c
on
ce
ntr
ati
on
(M
n/M
n0)
Empty bed contact time (s)
Total Mn removal in fluidized bed (45 m/h)b2)
0.0
0.2
0.4
0.6
0.8
1.0
0 40 80 120 160
No
rma
lize
d c
on
ce
ntr
ati
on
(M
n/M
n0)
Empty bed contact time (s)
Dissolved Mn removal in fixed bed ( m/h)c1)
0.0
0.2
0.4
0.6
0.8
1.0
0 40 80 120 160
No
rma
lize
d c
on
ce
ntr
ati
on
(M
n/M
n0)
Empty bed contact time (s)
Total Mn removal in fixed bed ( m/h)c2)
a1)
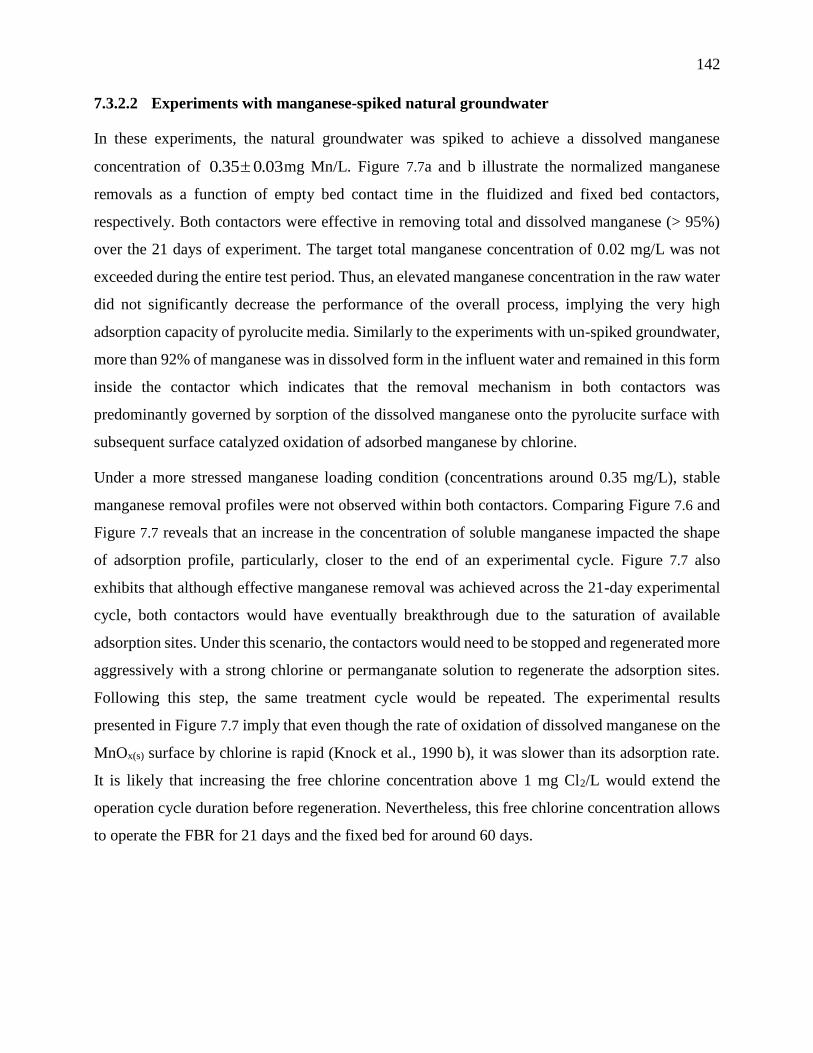
142
7.3.2.2 Experiments with manganese-spiked natural groundwater
In these experiments, the natural groundwater was spiked to achieve a dissolved manganese
concentration of 03.035.0 mg Mn/L. Figure 7.7a and b illustrate the normalized manganese
removals as a function of empty bed contact time in the fluidized and fixed bed contactors,
respectively. Both contactors were effective in removing total and dissolved manganese (> 95%)
over the 21 days of experiment. The target total manganese concentration of 0.02 mg/L was not
exceeded during the entire test period. Thus, an elevated manganese concentration in the raw water
did not significantly decrease the performance of the overall process, implying the very high
adsorption capacity of pyrolucite media. Similarly to the experiments with un-spiked groundwater,
more than 92% of manganese was in dissolved form in the influent water and remained in this form
inside the contactor which indicates that the removal mechanism in both contactors was
predominantly governed by sorption of the dissolved manganese onto the pyrolucite surface with
subsequent surface catalyzed oxidation of adsorbed manganese by chlorine.
Under a more stressed manganese loading condition (concentrations around 0.35 mg/L), stable
manganese removal profiles were not observed within both contactors. Comparing Figure 7.6 and
Figure 7.7 reveals that an increase in the concentration of soluble manganese impacted the shape
of adsorption profile, particularly, closer to the end of an experimental cycle. Figure 7.7 also
exhibits that although effective manganese removal was achieved across the 21-day experimental
cycle, both contactors would have eventually breakthrough due to the saturation of available
adsorption sites. Under this scenario, the contactors would need to be stopped and regenerated more
aggressively with a strong chlorine or permanganate solution to regenerate the adsorption sites.
Following this step, the same treatment cycle would be repeated. The experimental results
presented in Figure 7.7 imply that even though the rate of oxidation of dissolved manganese on the
MnOx(s) surface by chlorine is rapid (Knock et al., 1990 b), it was slower than its adsorption rate.
It is likely that increasing the free chlorine concentration above 1 mg Cl2/L would extend the
operation cycle duration before regeneration. Nevertheless, this free chlorine concentration allows
to operate the FBR for 21 days and the fixed bed for around 60 days.
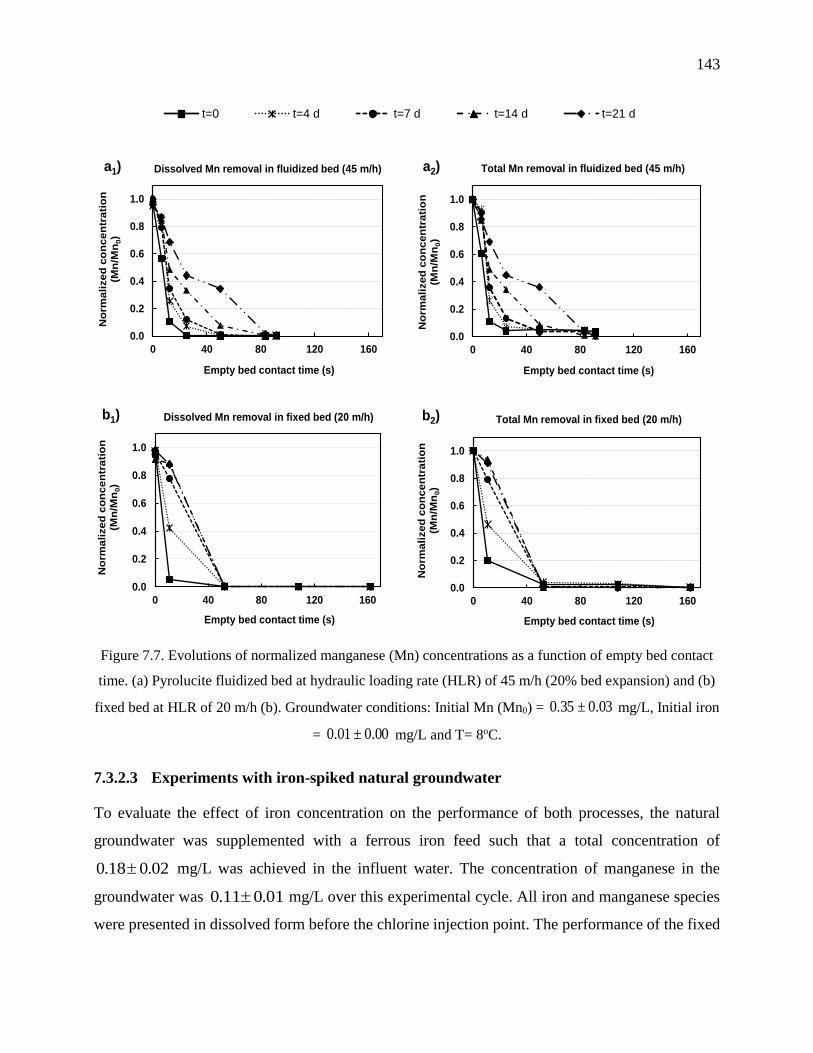
143
Figure 7.7. Evolutions of normalized manganese (Mn) concentrations as a function of empty bed contact
time. (a) Pyrolucite fluidized bed at hydraulic loading rate (HLR) of 45 m/h (20% bed expansion) and (b)
fixed bed at HLR of 20 m/h (b). Groundwater conditions: Initial Mn (Mn0) = 03.0±35.0 mg/L, Initial iron
= 00.0±01.0 mg/L and T= 8oC.
7.3.2.3 Experiments with iron-spiked natural groundwater
To evaluate the effect of iron concentration on the performance of both processes, the natural
groundwater was supplemented with a ferrous iron feed such that a total concentration of
02.018.0 mg/L was achieved in the influent water. The concentration of manganese in the
groundwater was 01.011.0 mg/L over this experimental cycle. All iron and manganese species
were presented in dissolved form before the chlorine injection point. The performance of the fixed
t=0 t=4 d t=7 d t=14 d t=21 d
0.0
0.2
0.4
0.6
0.8
1.0
0 40 80 120 160
No
rma
lize
d c
on
ce
ntr
ati
on
(M
n/M
n0)
Empty bed contact time (s)
Dissolved Mn removal in fluidized bed (45 m/h)a1)
0.0
0.2
0.4
0.6
0.8
1.0
0 40 80 120 160
No
rma
lize
d c
on
ce
ntr
ati
on
(M
n/M
n0)
Empty bed contact time (s)
Total Mn removal in fluidized bed (45 m/h)a2)
0.0
0.2
0.4
0.6
0.8
1.0
0 40 80 120 160
No
rma
lize
d c
on
ce
ntr
ati
on
(M
n/M
n0)
Empty bed contact time (s)
Dissolved Mn removal in fixed bed ( m/h)b1)
0.0
0.2
0.4
0.6
0.8
1.0
0 40 80 120 160
No
rma
lize
d c
on
ce
ntr
ati
on
(M
n/M
n0)
Empty bed contact time (s)
Total Mn removal in fixed bed ( m/h)b2)

144
and fluidized bed contactors to remove manganese and iron are plotted in Figure 7.8 and Figure 7.9,
respectively. Results demonstrate that more than 90% of dissolved iron and manganese were
removed steadily over 21 days while using the PFB contactor. However, the PFB contactor
performance for the removal of total iron and manganese varied from 50-80% and 60-80%,
respectively. The effluent concentrations fluctuated between 0.04-0.08 mg/L for iron and 0.02-0.04
mg/L for manganese. Thus, an elevated iron concentration led to a significant decrease in
manganese removal. In addition, comparing Figure 7.8a1 and Figure 7.6a1 shows that as the
adsorption of manganese progressed in the presence of a higher iron concentration, the adsorption
capacity of pyrolucite media for manganese diminished. Although preliminary results, using a
synthetic feed water prepared with demineralized water had shown an almost instantaneous
oxidation of dissolved iron by free chlorine, results in natural waters revealed that a complete
oxidation of iron did not occur over the 90 s of detention time in the PFB contactor. This was
principally a result from a higher DOC content of the natural groundwater (3.3 mg C/L) in
comparison with the synthetic water (< 0.2 mg/L). The formation of NOM-iron complexes can
slow down the kinetic of iron oxidation with chlorine (Reckhow et al., 1991). As a result, the
dissolved iron may have competed with dissolved manganese for the pyrolucite adsorption sites
(Hu et al., 2004). In addition, as the ferric hydroxide coating develops on the media grains, the
previously available adsorption sites become inaccessible under this layer. In broad agreement with
these results, previous studies demonstrated that the availability of adsorption sites on the exterior
surface of MnOx (s)-coated media is a crucial parameter for the removal of dissolved manganese
from water (Merkle et al., 1997; Knocke et al., 2010).
Comparing Figure 7.9a1 and a2 reveals that the mechanism of iron removal in the PFB contactor
was partially governed by adsorption of dissolved species onto the pyrolucite media. Nonetheless,
the partial solution oxidation of dissolved iron by free chlorine was not negligible. Previous
experiments under a very low iron concentration (0.01 ± 0.00 mg/L) indicated that, unlike iron,
solution oxidation of dissolved manganese by free chlorine is not significant. Thus, the presence of
20-40% particulate manganese observed in treated water during this experiment was presumably
related to the presence of manganese adsorbed onto the ferric hydroxide precipitates and carryover
from the PFB contactor. This hypothesis is supported by the fact that ferric hydrous oxides can
serve as sorption media for dissolved iron (Sharma et al., 1999) and manganese (Buamah et al.,
145
2008). Therefore, the sole application of a PFB contactor is not recommend for groundwater
treatment applications where elevated iron concentrations are present in the influent.
Figure 7.8. Evolutions of normalized manganese (Mn) concentrations as a function of empty bed contact
time. (a) Pyrolucite fluidized bed at hydraulic loading rate (HLR) of 45 m/h (20% bed expansion) and (b)
fixed bed at HLR of 20 m/h. Groundwater conditions: Initial Mn (Mn0) = 01.0±11.0 mg/L, Initial iron =
02.0±18.0 mg/L and T= 9oC.
The performance of the fixed bed contactor for iron and manganese removal is shown in Figure 7.8b
and Figure 7.9b, respectively. The concentrations of iron and manganese species in the treated water
(< 0.005 mg/L) were well below the target limit of 0.02 mg/L. However, similar to the PFB
contactor, a steady state removal performance was not experienced in the fixed bed contactor and
the adsorption capacity of the pyrolucite media decreased as the filtration process approached the
t=0 t=4 d t=7 d t=14 d t=21 d
0.0
0.2
0.4
0.6
0.8
1.0
0 40 80 120 160
No
rma
lize
d c
on
ce
ntr
ati
on
(M
n/M
n0)
Empty bed contact time (s)
Dissolved Mn removal in fluidized bed (45 m/h)a1)
0.0
0.2
0.4
0.6
0.8
1.0
0 40 80 120 160N
orm
ali
ze
d c
on
ce
ntr
ati
on
(M
n/M
n0)
Empty bed contact time (s)
Total Mn removal in fluidized bed (45 m/h)a2)
0.0
0.2
0.4
0.6
0.8
1.0
0 40 80 120 160
No
rma
lize
d c
on
ce
ntr
ati
on
(M
n/M
n0)
Empty bed contact time (s)
Dissolved Mn removal in fixed bed ( m/h)b1)
0.0
0.2
0.4
0.6
0.8
1.0
0 40 80 120 160
No
rma
lize
d c
on
ce
ntr
ati
on
(M
n/M
n0)
Empty bed contact time (s)
Total Mn removal in fixed bed ( m/h)b2)

146
end of a filtration cycle. This is likely due to the deposition and build-up of ferric hydroxide on the
pyrolucite media, which covered some available adsorption sites, over the course of a filtration
cycle. Unlike the PFB contactor, 60-90% of the iron was oxidized by chlorine before reaching the
filter media due to the approximate 5 min detention time available in the column above the
pyrolucite media. Thus, the mechanism of iron removal in the fixed bed contactor mainly
comprised of an initial formation of ferric hydroxide in the water phase and its subsequent capture
by the filter media.
Figure 7.9. Evolutions of normalized iron (Fe) concentrations as a function of empty bed contact time. (a)
Pyrolucite fluidized bed at hydraulic loading rate (HLR) of 45 m/h (20% bed expansion) and (b) fixed bed
at HLR of 20 m/h. Groundwater conditions: Initial Fe (Fe0) = 02.0±18.0 mg/L and T= 9oC.
t=0 t=4 d t=7 d t=14 d t=21 d
0.0
0.2
0.4
0.6
0.8
1.0
0 40 80 120 160
No
rma
lize
d c
on
ce
ntr
ati
on
(F
e/F
e0)
Empty bed contact time (s)
Dissolved Fe removal in fluidized bed (45 m/h)a1)
0.0
0.2
0.4
0.6
0.8
1.0
0 40 80 120 160
No
rma
lize
d c
on
ce
ntr
ati
on
(F
e/F
e0)
Empty bed contact time (s)
Total Fe removal in fluidized bed (45 m/h)a2)
0.0
0.2
0.4
0.6
0.8
1.0
0 40 80 120 160
No
rma
lize
d c
on
ce
ntr
ati
on
(F
e/F
e0)
Empty bed contact time (s)
Dissolved Fe removal in fixed bed ( m/h)b1)
0.0
0.2
0.4
0.6
0.8
1.0
0 40 80 120 160
No
rma
lize
d c
on
ce
ntr
ati
on
(F
e/F
e0)
Empty bed contact time (s)
Total Fe removal in fixed bed ( m/h)b2)
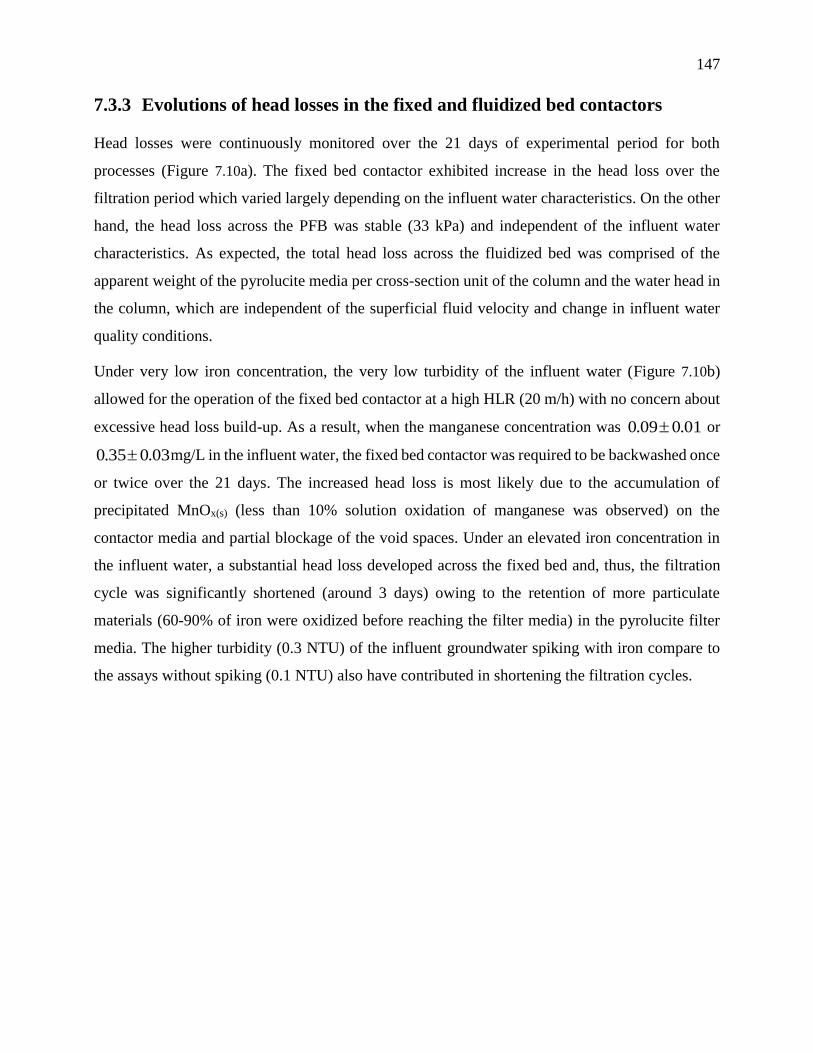
147
7.3.3 Evolutions of head losses in the fixed and fluidized bed contactors
Head losses were continuously monitored over the 21 days of experimental period for both
processes (Figure 7.10a). The fixed bed contactor exhibited increase in the head loss over the
filtration period which varied largely depending on the influent water characteristics. On the other
hand, the head loss across the PFB was stable (33 kPa) and independent of the influent water
characteristics. As expected, the total head loss across the fluidized bed was comprised of the
apparent weight of the pyrolucite media per cross-section unit of the column and the water head in
the column, which are independent of the superficial fluid velocity and change in influent water
quality conditions.
Under very low iron concentration, the very low turbidity of the influent water (Figure 7.10b)
allowed for the operation of the fixed bed contactor at a high HLR (20 m/h) with no concern about
excessive head loss build-up. As a result, when the manganese concentration was 01.009.0 or
03.035.0 mg/L in the influent water, the fixed bed contactor was required to be backwashed once
or twice over the 21 days. The increased head loss is most likely due to the accumulation of
precipitated MnOx(s) (less than 10% solution oxidation of manganese was observed) on the
contactor media and partial blockage of the void spaces. Under an elevated iron concentration in
the influent water, a substantial head loss developed across the fixed bed and, thus, the filtration
cycle was significantly shortened (around 3 days) owing to the retention of more particulate
materials (60-90% of iron were oxidized before reaching the filter media) in the pyrolucite filter
media. The higher turbidity (0.3 NTU) of the influent groundwater spiking with iron compare to
the assays without spiking (0.1 NTU) also have contributed in shortening the filtration cycles.
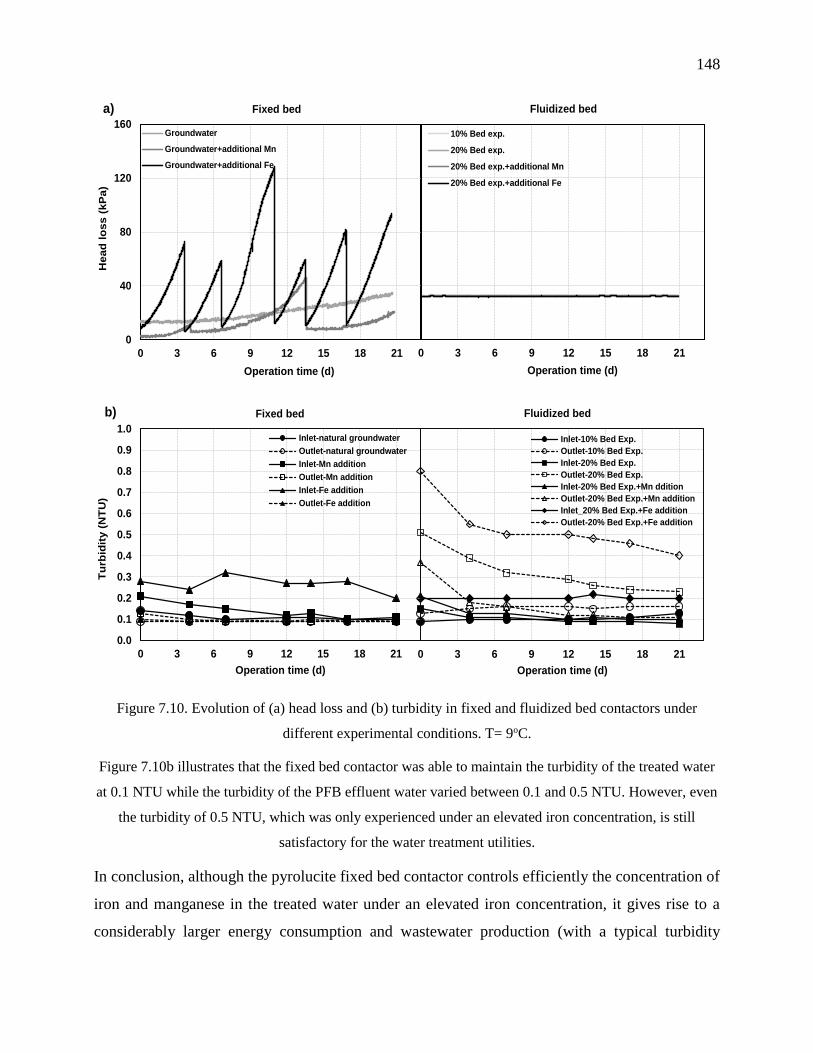
148
Figure 7.10. Evolution of (a) head loss and (b) turbidity in fixed and fluidized bed contactors under
different experimental conditions. T= 9oC.
Figure 7.10b illustrates that the fixed bed contactor was able to maintain the turbidity of the treated water
at 0.1 NTU while the turbidity of the PFB effluent water varied between 0.1 and 0.5 NTU. However, even
the turbidity of 0.5 NTU, which was only experienced under an elevated iron concentration, is still
satisfactory for the water treatment utilities.
In conclusion, although the pyrolucite fixed bed contactor controls efficiently the concentration of
iron and manganese in the treated water under an elevated iron concentration, it gives rise to a
considerably larger energy consumption and wastewater production (with a typical turbidity
0 3 6 9 12 15 18 21
Operation time (d)
Fluidized bed
10% Bed exp.
20% Bed exp.
20% Bed exp.+additional Mn
20% Bed exp.+additional Fe
0
40
80
120
160
0 3 6 9 12 15 18 21
Head
lo
ss (
kP
a)
Operation time (d)
Fixed bed
Groundwater
Groundwater+additional Mn
Groundwater+additional Fe
a)
0 3 6 9 12 15 18 21
Operation time (d)
Fluidized bed
Inlet-10% Bed Exp.
Outlet-10% Bed Exp.
Inlet-20% Bed Exp.
Outlet-20% Bed Exp.
Inlet-20% Bed Exp.+Mn ddition
Outlet-20% Bed Exp.+Mn addition
Inlet_20% Bed Exp.+Fe addition
Outlet-20% Bed Exp.+Fe addition
0.0
0.1
0.2
0.3
0.4
0.5
0.6
0.7
0.8
0.9
1.0
0 3 6 9 12 15 18 21
Tu
rbid
ity (
NT
U)
Operation time (d)
Fixed bed
Inlet-natural groundwater
Outlet-natural groundwater
Inlet-Mn addition
Outlet-Mn addition
Inlet-Fe addition
Outlet-Fe addition
b)
149
between 40 NTU and 70 NTU measured during this assay). On the other hand, the PFB only needs
to be backwashed prior to a regeneration. No regeneration was needed during the 21 days period
investigated. Combining a PFB contactor with a downstream process with the capability of
operating at very high loading rate would however be required under influent conditions with
elevated iron concentrations. In addition, despite the fact that both contactors were highly efficient
to remove manganese under very low iron concentrations, the PFB offers the important advantage
of operating at high HLR values allowing for the use of smaller contactor footprints and, thus, a
decreases in capital costs. As stated earlier, the PFB also greatly reduces the production of
wastewaters which is an important design constraint due to the manganese discharge limits imposed
in many regulations. On a final note, the adsorbed manganese accumulating on the PFB media is
expected to increase the pyrolucite media size over time. However, this phenomenon is expected
to be marginal as an influent manganese concentration (0.1 mg/L) that would be removed entirely
in a 45 m/h PFB would only increase by 3% the mass content of manganese dioxide in the reactor
after one year of operation. This would represent a theoretical increase in media size of 7 µm.
7.4 Conclusions
The main purpose of this research was to assess the long-term fate of iron and manganese in a PFB
contactor supplied by natural groundwater. Accordingly, the results of a pilot-scale experiments
under different operating conditions with varying iron and manganese concentrations were
described here. The following conclusions were derived from this research study:
Selection of an appropriate distributor plate for the PFB contactor was crucial for an
efficient process performance. Among different configurations of distributor plate that were
tested, a shrouded perforated distributor plate with 15 cm of gravel on top of it proved to
be optimal.
The PFB contactor has a strong adsorption capacity for dissolved iron and manganese.
However, the adsorption capacity and long-term stability of the process were influenced by
the initial concentration of these species.
The PFB contactor proved effective at promoting a high degree of total manganese removal
under a wide range of influent manganese concentrations as long as iron levels were low.
It also minimized wastewater production while providing a high treatment performance and
a small footprint. Consequently, this process is recommended for water treatment facilities
150
with manganese treatment objectives and negligible iron in the influent water. Under
elevated iron concentrations in the influent water, a downstream process after the PFB
contactor is required to achieve acceptable iron and manganese removal.
The pyrolucite fixed bed contactor demonstrated its ability to effectively control iron and
manganese under all conditions tested. However, fairly rapid head loss build-up was
observed across the pyrolucite fixed bed media operated at 20 m/h under elevated iron
concentrations (3 days filtration cycle).
The concentration of iron in the groundwater mainly controlled the head loss build-up rate
through the fixed bed. On the other hand, the head loss in the PFB contactor remained
relatively constant, regardless of the influent water quality.
In both fixed and fluidized bed contactors, manganese was principally removed by the
sorption uptake of dissolved manganese onto the pyrolucite media followed by the catalytic
oxidation of the adsorbed species on the surface of pyrolucite particles. A similar
mechanism could be inferred for a part of iron removal in the PFB contactor while the role
of pyrolucite fixed bed in the iron removal was mainly via the capture of particulate and/or
colloidal ferric hydroxide that formed following solution oxidation of soluble iron by
chlorine.
Future studies should focus on the development of a high rate post-filtration technique that is stable
and cost effective for the removal of the residual particles from the effluent of the PFB contactor
for waters containing both iron and manganese species.
Acknowledgments
This work has been financially supported by RES’EAU-WATERNET, a NSERC (Natural Sciences
and Engineering Research Council of Canada) collaborative strategic network (Grant No. 364635-
07), and the NSERC Discovery Grant Program (RGPIN-2015-04920). The authors wish to thank
the Sainte-Marthe-sur-le-Lac water treatment plant personnel and Mireille Blais, Yves Fontaine,
and Valentin Pfeiffer from Polytechnique Montréal for their assistance during this study.
151
CHAPTER 8 ARTICLE 5 : INTEGRATED PYROLUCITE FLUIDIZED
BED-MEMBRANE HYBRIDE PROCESS FOR IMPROVED IRON AND
MANGANESE CONTROL IN DRINKING WATER
This chapter presents the article published in Water Research, 113 (2017). In this chapter an
integrated pyrolucite fluidized bed-membrane hybrid process was proposed for iron and manganese
control in drinking water. Consequently, the performance of the hybrid process with respect to
treated water quality and membrane fouling under variable water chemistry conditions was
investigated.
Integrated Pyrolucite Fluidized Bed-Membrane Hybrid Process for Improved Iron and
Manganese Control in Drinking Water
Seyedeh Laleh Dashtban Kenari* and Benoit Barbeau
Polytechnique Montreal, Department of Civil, Geological and Mining Engineering, NSERC-
Industrial Chair on Drinking Water, Environment, C.P. 6079, Succursale Centre-Ville, Montreal,
QC, H3C 3A7, Canada.
* Corresponding author: Tel: +1 514 340-4711 #2983; Fax: 514-340-5918
E-mail: [email protected]
152
ABSTRACT
Newly developed ceramic membrane technologies offer numerous advantages over the
conventional polymeric membranes. This work proposes a new configuration, an integrated
pyrolucite fluidized bed (PFB)-ceramic MF/UF hybrid process, for improved iron and manganese
control in drinking water. A pilot-scale study was undertaken to evaluate the performance of this
process with respect to iron and manganese control as well as membrane fouling. In addition, the
fouling of commercially available ceramic membranes in conventional pre-oxidation-MF/UF
process was compared with the hybrid process configuration. In this regard, a series of experiments
were conducted under different influent water quality and operating conditions. Fouling
mechanisms and reversibility were analyzed using blocking law and resistance-in-series models.
The results evidenced that the flux rate and the concentration of calcium and humic acids in the
feed water have a substantial impact on the filtration behavior of both membranes. The model for
constant flux compressible cake formation well described the rise in transmembrane pressure. The
compressibility of the filter cake substantially increased in the presence of 2 mg/L humic acids.
The presence of calcium ions caused significant aggregation of manganese dioxide and humic acid
which severely impacted the extent of membrane fouling. The PFB pretreatment properly alleviated
membrane fouling by removing more than 75% and 95% of iron and manganese, respectively.
KEYWORDS: Iron/manganese removal; Ultrafiltration/Microfiltration; Ceramic membrane;
Fouling; Pyrolucite fluidized bed, Cake compressibility.
8.1 Introduction
Iron and manganese naturally co-occur in both surface and ground waters mainly as a result of
weathering and leaching of metal-bearing minerals and rocks. Among different water sources,
groundwater more commonly contains significant levels of iron and manganese. The United States
Environmental Protection Agency (USEPA) (2004) and the Canadian Drinking Water Quality
Guidelines (Health Canada, 2014) established an aesthetic objective limit of 0.3 and 0.05 mg/L for
the concentrations of iron and manganese in drinking water, respectively, due to adverse aesthetic
issues. However, concentrations of iron and manganese above 0.05 (World Health Organization,
2003) and 0.02 mg/L (Sly et al., 1990), respectively, may still give rise to aesthetic problems.
153
Consequently, Health Canada (2016) has recently proposed an aesthetic objective limit of 0.02
mg/L for total manganese in drinking water. The impact of manganese in drinking water is
receiving more attention due to its potential neurotoxicity. Several epidemiological studies suggest
that exposure to manganese in drinking water is associated with neurological effects in children
including intellectual impairment and poor neurobehavioral function (e.g., memory, hyperactivity
and attention) (Bouchard et al., 2011; Oulhote et al., 2014), even for fairly low concentrations of
manganese in treated water. Health Canada (2016) recently proposed a health-based maximum
acceptable concentration of 0.1 mg/L using animal studies showing neurotoxic effects of
manganese in rats. Consequently, it is expected that effective manganese control will become an
important goal for drinking water utilities following the introduction of a health-based regulation.
A traditional treatment strategy includes oxidation of dissolved iron and manganese to particulate
forms, ferric hydroxide and manganese dioxide, using a strong oxidant, such as potassium
permanganate, chlorine dioxide or ozone, followed by depth filtration (Knocke et al., 1990b).
Unlike iron, which can be readily oxidized by a weak oxidant, such as oxygen, oxidation of
manganese by strong oxidants is dependent upon the pH, temperature, initial dissolved manganese
concentration and contact time (Knocke et al., 1990b). In addition, since oxidized manganese forms
colloidal species under low ionic strength conditions (Morgan and Stumm, 1964; Dashtban Kenari
and Barbeau, 2016a), it is not effectively removed by sand filtration. Alternatively, application of
low-pressure membranes, microfiltration (MF) and ultrafiltration (UF), is becoming more attractive
in drinking water production. However, membrane fouling by manganese dioxide, which leads to
a severe decrease in permeability during filtration (Choo et al., 2005; Dashtban Kenari and
Barbeau, 2016b), is the major obstacle to widespread application of membranes for this application.
Thus, developing a compact pretreatment process, which can properly alleviate the fouling of the
membrane, is of great interest.
Generally, membrane fouling mechanisms can be described by pore blocking and/or cake layer
formation models, depending, amongst other factors, on the ratio of the particle size to the pore
size of the membrane. Pore blocking mainly occurs when the size of particles is comparable to or
smaller than the pore size of the membrane while cake formation is the predominant fouling
mechanism during the filtration of particles with much larger diameter than the membrane pore
size (Shirazi et al., 2010; Muthukumaran and Baskaran, 2014). Thus, the membrane pore size may
not only affect the treated water quality but also the fouling behavior and, in turn, the economic
154
viability of treatment plant. In addition, membrane material, water characteristics and operating
conditions are other major factors influencing membrane filtration performance. Newly developed
tubular ceramic membranes offer superior chemical resistance, physical integrity and thermal
stability compared with the conventional hollow fiber polymeric membranes. Likewise, our earlier
study revealed that tubular ceramic membrane requires less frequent chemical cleaning compared
with the hollow fiber polymeric membrane due to the possibility to implement more aggressive
physical cleaning (Dashtban Kenari and Barbeau, 2016b).
Considering the propensity of manganese dioxide to adsorb dissolved metal ions (Morgan and
Stumm, 1964), a process, termed Natural Greensand Effect, is often used to remove dissolved
manganese from water (Knocke et al., 1990a) through sorption of dissolved manganese onto
manganese dioxide coated sand followed by auto-catalytic oxidation of the adsorbed species.
Manganese dioxide coated sand has been primarily employed in packed bed contactors at relatively
low hydraulic loading rates (HLRs) (6-12 m/h) (Hargette and Knocke, 2001; Yang et al., 2008;
Piispanena and Sallanko, 2010). The possibility of using higher HLRs (up to 49 m/h) have been
demonstrated for the removal of traces of manganese (0.09 mg/L) from surface waters using post-
contactors with large size (2.0-2.4 mm) pyrolucite (a natural manganese dioxide ore) media
(Knocke et al., 2010; Bierlein et al., 2015). In addition, Dashtban Kenari and Barbeau (2014)
studied the performance of pyrolucite fluidized bed (PFB) for manganese removal under different
water quality conditions. This process revealed a promising performance for manganese removal
(influent concentration = 2.2-2.4 mg Mn/L) at much higher HLRs (up to 60 m/h) than the packed
bed configuration (typically 10-20 m/h). An increased HLR reduces the process footprint and
therefore capital costs. However, the fate of iron removal in this process has not been investigated.
In order to come up with a novel process, which can properly reduce the concentration of iron and
manganese to below 0.020 mg/L and overcome the problems encountered in the abovementioned
processes, it is proposed to use a PFB as a pretreatment for MF/UF membranes. Consequently, the
principal objective of this study was to investigate the performance of a PFB-MF/UF membrane
hybrid process with respect to treated water quality and membrane fouling under variable water
chemistry conditions. We also compared the performance of this hybrid process with a reference
treatment process excluding the presence of the PFB pretreatment (i.e. pre-oxidation and membrane
filtration). Considering the significance of operating conditions on fouling, this study also dealt
with the effect of flux rate and membrane pore size (MF vs. UF) on the fouling behavior of oxidized
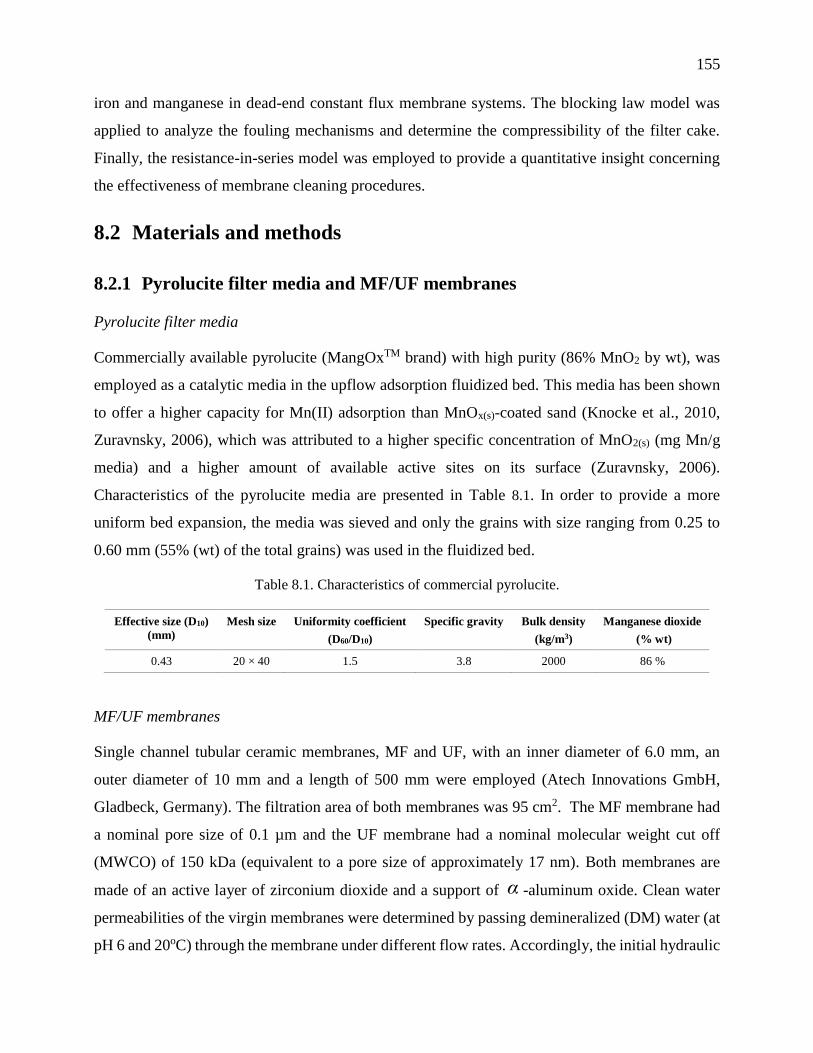
155
iron and manganese in dead-end constant flux membrane systems. The blocking law model was
applied to analyze the fouling mechanisms and determine the compressibility of the filter cake.
Finally, the resistance-in-series model was employed to provide a quantitative insight concerning
the effectiveness of membrane cleaning procedures.
8.2 Materials and methods
8.2.1 Pyrolucite filter media and MF/UF membranes
Pyrolucite filter media
Commercially available pyrolucite (MangOxTM brand) with high purity (86% MnO2 by wt), was
employed as a catalytic media in the upflow adsorption fluidized bed. This media has been shown
to offer a higher capacity for Mn(II) adsorption than MnOx(s)-coated sand (Knocke et al., 2010,
Zuravnsky, 2006), which was attributed to a higher specific concentration of MnO2(s) (mg Mn/g
media) and a higher amount of available active sites on its surface (Zuravnsky, 2006).
Characteristics of the pyrolucite media are presented in Table 8.1. In order to provide a more
uniform bed expansion, the media was sieved and only the grains with size ranging from 0.25 to
0.60 mm (55% (wt) of the total grains) was used in the fluidized bed.
Table 8.1. Characteristics of commercial pyrolucite.
Effective size (D10)
(mm)
Mesh size Uniformity coefficient
(D60/D10)
Specific gravity Bulk density
(kg/m3)
Manganese dioxide
(% wt)
0.43 20 × 40 1.5 3.8 2000 86 %
MF/UF membranes
Single channel tubular ceramic membranes, MF and UF, with an inner diameter of 6.0 mm, an
outer diameter of 10 mm and a length of 500 mm were employed (Atech Innovations GmbH,
Gladbeck, Germany). The filtration area of both membranes was 95 cm2. The MF membrane had
a nominal pore size of 0.1 µm and the UF membrane had a nominal molecular weight cut off
(MWCO) of 150 kDa (equivalent to a pore size of approximately 17 nm). Both membranes are
made of an active layer of zirconium dioxide and a support of α -aluminum oxide. Clean water
permeabilities of the virgin membranes were determined by passing demineralized (DM) water (at
pH 6 and 20oC) through the membrane under different flow rates. Accordingly, the initial hydraulic
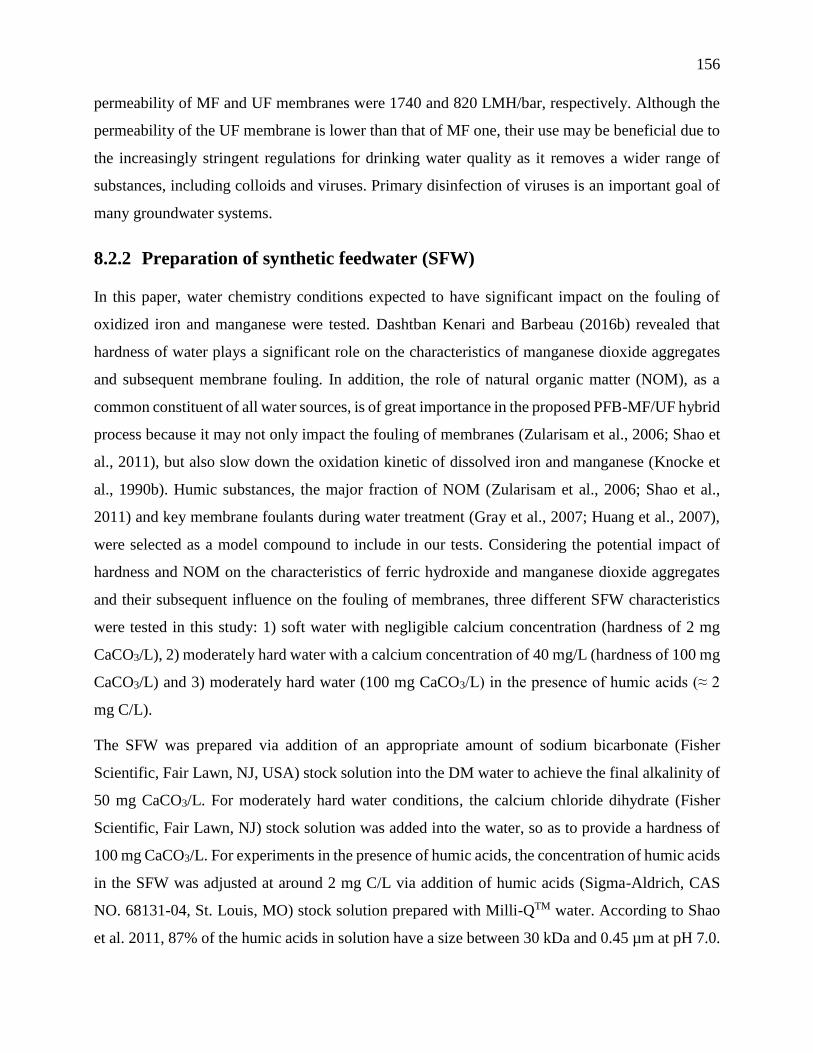
156
permeability of MF and UF membranes were 1740 and 820 LMH/bar, respectively. Although the
permeability of the UF membrane is lower than that of MF one, their use may be beneficial due to
the increasingly stringent regulations for drinking water quality as it removes a wider range of
substances, including colloids and viruses. Primary disinfection of viruses is an important goal of
many groundwater systems.
8.2.2 Preparation of synthetic feedwater (SFW)
In this paper, water chemistry conditions expected to have significant impact on the fouling of
oxidized iron and manganese were tested. Dashtban Kenari and Barbeau (2016b) revealed that
hardness of water plays a significant role on the characteristics of manganese dioxide aggregates
and subsequent membrane fouling. In addition, the role of natural organic matter (NOM), as a
common constituent of all water sources, is of great importance in the proposed PFB-MF/UF hybrid
process because it may not only impact the fouling of membranes (Zularisam et al., 2006; Shao et
al., 2011), but also slow down the oxidation kinetic of dissolved iron and manganese (Knocke et
al., 1990b). Humic substances, the major fraction of NOM (Zularisam et al., 2006; Shao et al.,
2011) and key membrane foulants during water treatment (Gray et al., 2007; Huang et al., 2007),
were selected as a model compound to include in our tests. Considering the potential impact of
hardness and NOM on the characteristics of ferric hydroxide and manganese dioxide aggregates
and their subsequent influence on the fouling of membranes, three different SFW characteristics
were tested in this study: 1) soft water with negligible calcium concentration (hardness of 2 mg
CaCO3/L), 2) moderately hard water with a calcium concentration of 40 mg/L (hardness of 100 mg
CaCO3/L) and 3) moderately hard water (100 mg CaCO3/L) in the presence of humic acids (≈ 2
mg C/L).
The SFW was prepared via addition of an appropriate amount of sodium bicarbonate (Fisher
Scientific, Fair Lawn, NJ, USA) stock solution into the DM water to achieve the final alkalinity of
50 mg CaCO3/L. For moderately hard water conditions, the calcium chloride dihydrate (Fisher
Scientific, Fair Lawn, NJ) stock solution was added into the water, so as to provide a hardness of
100 mg CaCO3/L. For experiments in the presence of humic acids, the concentration of humic acids
in the SFW was adjusted at around 2 mg C/L via addition of humic acids (Sigma-Aldrich, CAS
NO. 68131-04, St. Louis, MO) stock solution prepared with Milli-QTM water. According to Shao
et al. 2011, 87% of the humic acids in solution have a size between 30 kDa and 0.45 µm at pH 7.0.

157
The solution was then vacuum filtered through a 30 µm filter (CAT. NO. NY3004700, Millipore
Corp.) to remove ash particles. The filtered solution was stored in cooling room at 4oC for up to 4
weeks. In the final step, the pH of SFW was adjusted at 7.0 by bubbling CO2 and/or N2 gas into the
water.
A fresh iron (II) and manganese (II) stock solutions, 150 mg Fe2+/L and 75 mg Mn2+/L, were
separately prepared and their concentration in the SFW were respectively set at 2.6 and 1.3 mg/L
for all experiments (i.e., very challenging conditions). Manganese (II) stock solution was simply
prepared by dissolving manganese (II) sulfate monohydrate (Fisher Scientific, Fair Lawn, NJ) in
Milli-QTM water while prior to the dissolution of iron (II) sulfate heptahydrate (Fisher Scientific,
Fair Lawn, NJ), Milli-QTM water was acidified to a pH of 3, and N2 gas was bubbled for 15 min to
avoid oxidation of iron (II) in the stock solution. Characteristics of the SFW tested in this study are
summarized in Table 8.2.
Table 8.2. Characteristics of the synthetic water tested in this study.
Iron
(mg/L)
Manganese
(mg/L)
Hardness
(mg CaCO3/L)
Alkalinity
(mg CaCO3/L)
pH TOC
(mg C/L)
SUVA
(L/mg/m)
Temperature
(oC)
2.64 ± 0.12 1.29 ± 0.08 2 or 100 50 7.0 0.2 or 2.3 NA or 9.9 20
8.2.3 Experimental procedure
The experiments were carried out in a small pilot plant (Q = 0.5 m3/d) located at Polytechnique
Montreal. In the first set of experiments, the MF and UF membranes were employed to establish
the fouling behavior in a conventional configuration involving pre-oxidation followed by
membrane filtration. In the second set, the filtration behavior was examined while using the PFB
as a pretreatment process. A simple schematic of the PFB-MF/UF membrane experimental setup
is illustrated in Figure 8.1.
A fresh potassium permanganate (EMD chemicals Inc., Gibbstown, NJ) or sodium hypochlorite
(commercial bleach, 8% (W/V) available chlorine) stock solutions (280 mg KMnO4/L and 200 mg
Cl2/L, respectively) were prepared prior the experiment for the pre-oxidation or PFB experiments,
respectively. Iron (II) and manganese (II) as well as oxidants were separately spiked into the SFW
immediately prior entering the columns. Mixing was achieved by injecting the solutions ahead of
screens located at the inlet line and bottom of the columns. The oxidation column was a 2-meter
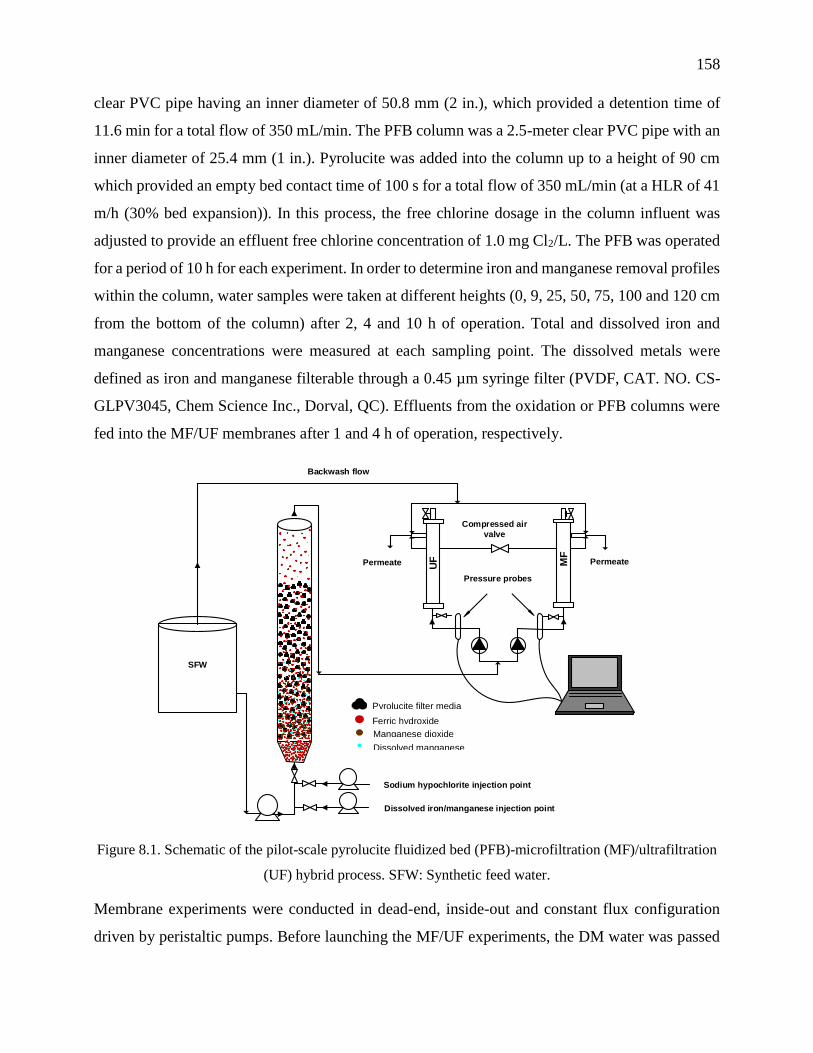
158
clear PVC pipe having an inner diameter of 50.8 mm (2 in.), which provided a detention time of
11.6 min for a total flow of 350 mL/min. The PFB column was a 2.5-meter clear PVC pipe with an
inner diameter of 25.4 mm (1 in.). Pyrolucite was added into the column up to a height of 90 cm
which provided an empty bed contact time of 100 s for a total flow of 350 mL/min (at a HLR of 41
m/h (30% bed expansion)). In this process, the free chlorine dosage in the column influent was
adjusted to provide an effluent free chlorine concentration of 1.0 mg Cl2/L. The PFB was operated
for a period of 10 h for each experiment. In order to determine iron and manganese removal profiles
within the column, water samples were taken at different heights (0, 9, 25, 50, 75, 100 and 120 cm
from the bottom of the column) after 2, 4 and 10 h of operation. Total and dissolved iron and
manganese concentrations were measured at each sampling point. The dissolved metals were
defined as iron and manganese filterable through a 0.45 µm syringe filter (PVDF, CAT. NO. CS-
GLPV3045, Chem Science Inc., Dorval, QC). Effluents from the oxidation or PFB columns were
fed into the MF/UF membranes after 1 and 4 h of operation, respectively.
SFW
Backwash flow
Sodium hypochlorite injection point
Dissolved iron/manganese injection point
Permeate Permeate
Compressed air
valve
MF
Pressure probes
UF
Figure 8.1. Schematic of the pilot-scale pyrolucite fluidized bed (PFB)-microfiltration (MF)/ultrafiltration
(UF) hybrid process. SFW: Synthetic feed water.
Membrane experiments were conducted in dead-end, inside-out and constant flux configuration
driven by peristaltic pumps. Before launching the MF/UF experiments, the DM water was passed
Pyrolucite filter media
Ferric hydroxide
Manganese dioxide
Dissolved manganese
159
through the membranes at the desired flux until a steady transmembrane pressure (TMP) had been
reached. Afterwards, the particle-free SFW with the desired characteristics was filtered at the same
flux and the initial permeability of the membrane was determined. Then, the particle-free SFW was
replaced by the outlet of the column. The experiments related to the pre-oxidation-MF/UF process
were conducted at different flux rates of 150 and 300 LMH while the filtration behavior was only
assessed at a flux of 300 LMH for the PFB-MF/UF hybrid process. Fluxes were regularly checked
during the experiment by measuring the permeate flow rate and were found to vary by less than
1.5%. Each membrane unit was equipped with a pressure transducer (Omega, PX409-030GUSB).
The instantaneous pressure data was collected every 30 s using a data acquisition software (TRH
Central, Santa Ana, CA). Samples of membrane feed water and permeate were taken to measure
the concentrations of iron and manganese as well as DOC and TOC for the tests including humic
acids. The membrane runs were stopped after 6 h of operation or after the TMP across the UF
membrane increased to more than about 170 kPa (25 psi). All experiments were carried out at 20oC.
The same MF/UF membrane was utilized for all the experiments. Following the filtration, the
membranes were first physically and then chemically cleaned so that the initial permeability of the
membranes was completely recovered. The physical cleaning procedure first consisted in
backwashing with particle-free SFW for 3 min at twice the operating flux; then the cleaning step
was enhanced by backwashing with air scouring for 5 s at 400 kPa; and finally, the membranes
were again backwashed with particle-free SFW for 3 min to completely remove the detached
particles. The chemical cleaning was conducted by recirculating 1.0 L of 2% (W/W) oxalic acid
(Fisher Scientific, Fair Lawn, NJ) at 50oC and pH 1-2 for 30 min. For the experiments containing
humic acids, an alkaline/oxidizing cleaning step was also carried out after the acid cleaning step by
recirculating 1.0 L of 500 mg Cl2/L sodium hypochlorite solution at 50oC and pH 11-12 for 30 min.
After these cleaning steps, the membranes were thoroughly rinsed with DM water. The clean water
permeabilities of the membranes were checked with DM water a day after the cleaning cycles. In
addition, the permeability of particle-free SFW was also calculated after each cleaning step to
determine the physically and chemically reversible fouling of the membranes (Dashtban Kenari
and Barbeau, 2016b).
160
8.2.4 Analytical methods
Serial filtration was applied to determine the size distribution of iron and manganese suspensions
in the membrane feed water. Accordingly, a series of disc type MF and UF membranes with
nominal pore sizes of 30 µm (CAT. NO. NY3004700, Millipore Corp.), 8 µm (CAT. NO.
SCWP04700, Millipore Corp.), 3 µm (CAT. NO. SSWP04700, Millipore Corp.), 1.2 µm (CAT.
NO. RAWP04700, Millipore Corp.), 0.8 µm (CAT. NO. AAWP04700, Millipore Corp.), 0.45 µm
(LOT NO. T41389, Pall Corp.), 0.22 µm (CAT. NO. GSWP04700, Millipore Corp.) and 0.1 µm
(LOT NO. T21020, Pall Corp.), and MWCO of 30 kDa (PVDF, Sterlitech Corp.) were used. Prior
each experiment, the MF membranes were first flushed with approximately 500 mL of Milli-QTM
water and the 30 kDa UF membrane was immersed in Milli-QTM water for 24 h. The membrane
feed solution was vacuum filtered successively through the MF membranes. The filtrate was then
passed through the 30 kDa membrane using a 50 mL Amicon 8200 cell which was pressurized to
approximately 240 kPa (35 psi) with nitrogen gas.
Iron and manganese concentrations were measured by inductively coupled plasma-optical emission
spectrometry (ICP-OES, model iCAP 6000), following heat and acid digestion with 0.5% HNO3
(Omni Trace®, EMD chemicals Inc., Gibbstown, NJ ) (pH < 2) at 80 ˚C for 48 h. The average of
triplicate analysis of each sample is reported. The pH measurements were carried out using a Hach
(HQ40d) portable pH meter.
DOC and TOC concentrations were analyzed using a TOC meter (Sievers 5310 C, GE Water). For
DOC measurements, the samples were pre-filtered through the 0.45 µm filter which was previously
rinsed with 1 L of Milli-QTM water. UV254 absorbance was measured on 0.45 µm pre-filtered
samples using a Hach spectrophotometer (DR 5000) with a 1 cm path length quartz cell.
8.2.5 Characterization of membrane fouling
8.2.5.1 Constant flux blocking law model
In several municipal and industrial solid-liquid separations by membranes, the pressure increase
profile in constant flux filtration mode can be described by the power-law compressible cake
formation model (Sorensen and Sorensen, 1997; Chellam et al., 1998). A previous study (Dashtban
Kenari and Barbeau, 2016b) highlighted the importance to account for cake compressibility while
modeling cake fouling caused by manganese and ferric oxides. In this regard, the constant flux
161
blocking law model for compressible cake filtration (Eq. (7.1)) (Chellam and Xu, 2006; Dashtban
Kenari and Barbeau, 2016b) was applied to describe the pressure increase behavior and the
compressibility of the filter cake.
∆𝑃 = ∆𝑃0 +𝑄𝜇𝑐𝑏
𝐴0𝛽∆𝑃𝑛′
𝑉𝑠 (7.1)
where 0PΔ and PΔ are initial and final TMP (kPa), respectively;
0A is the Surface area of the
clean membrane (m2); Q is the flow through the membrane (m3/s); is the viscosity of the fluid
(kPa.s); cb is the bulk concentration (kg/m3); (m/kg/kPan’) and n′ are empirical constants ( n′
is the cake compressibility coefficient (0 ≤′≤ n 1)); and SV is the volume of permeate per unit
membrane area (m3/m2).
The compressibility parameters were determined by fitting the experimental pressure data to Eq.
(7.1) using a curve-fitting tool in Matlab (R2015a) with a trust region method resulting in the
smallest sum of squared residuals.
1.1.1. Resistance-in-series model
The resistance-in-series model (Eq. (7.2)) was applied to quantify the contribution of irreversible
fouling and effectiveness of different cleaning procedures.
𝐽 =∆𝑃
𝜇𝑅𝑡=
∆𝑃
𝜇(𝑅𝑚+𝑅𝑝𝑟+𝑅𝑐𝑟+𝑅𝑖𝑓) (7.2)
where J is the flux through the membrane (m/s); Rt is the total resistance (m-1); Rm is the intrinsic
membrane resistance (m-1), Rpr is the physically reversible resistance (m-1); Rcr is the chemically
reversible resistance (m-1); and Rif is the chemically irreversible fouling (m-1).
Rm was determined prior each experiment by measuring the particle-free SFW permeability of the
membranes. Rpr was obtained via the difference between the TMP of particle-free SFW after the
physical cleaning step and the TMP at the end of filtration. Rcr was calculated from the difference
between the stabilized TMP before and after the chemical cleaning step. Rif was back-calculated
from the difference between Rt and the sum of Rm, Rpr, and Rcr.
In addition, to facilitate the comparison of the experimental results, the foulants (ferric hydroxide,
manganese dioxide and humic acids) resistance, Rf, under different conditions were illustrated as a
function of SV . The Rf was defined as the difference between the Rt and the Rm, as follows:
162
𝑅𝑓 = 𝑅𝑓 − 𝑅𝑚 =∆𝑃−∆𝑃0
𝜇𝐽 (7.3)
8.3 Results and discussion
This section first presents iron and manganese removal performances in pre-oxidation-MF/UF and
PFB-MF/UF processes. The fouling behavior of MF and UF membranes is then illustrated under
different water chemistry conditions. Finally, the results of the resistance-in-series model analysis
are presented.
8.3.1 Iron and manganese removal performance
Figure 8.2 illustrates the concentration of iron and manganese as a function of empty bed contact
time which refers to a specific height of the bed. From this figure, stable removal profiles were
observed over the 10-h operation for both iron and manganese under soft water (Figure 8.2a),
moderately hard water (hardness=100 mg CaCO3/L) (Figure 8.2b) and moderately hard water
including 2 mg/L humic acids (Figure 8.2c). Accordingly, 76%-89% iron and 95%-97% manganese
removal were achieved through the PFB in around 100 s contact time, regardless of the influent
water quality. The lower removal of iron is explained by mechanistic differences. Due to the very
slow oxidation rate of manganese by chlorine, nearly all manganese remained dissolved throughout
the PFB. Thus, manganese removal involved a very fast adsorption of dissolved manganese onto
the pyrolucite media and subsequent autocatalytic oxidation of adsorbed manganese by chlorine.
Unlike manganese, iron is oxidized almost instantaneously to particulate ferric oxides which
removal is dependent on the attachment of particulate ferric hydroxide onto the pyrolucite media.
Due to the shear exerted on the pyroluctite media in the fluidized bed (30% bed expansion), it is
only partly effective in retaining the particulate species. Therefore, lower rejection was observed
for iron than for manganese. It is worth mentioning that although a PFB alone can remove almost
all dissolved manganese from water in the absence of iron (Dashtban Kenari and Barbeau, 2014),
its performance to remove manganese declines in the presence of iron. This is likely due to the
carryover of oxidized manganese species with the particulate ferric hydroxide. These results
indicate the need to provide a downstream process which can properly reduce the concentration of
these species below the target value of 0.020 mg/L.

163
Figure 8.2. Iron (Fe) and manganese (Mn) concentrations for increasing empty bed contact times inside
the pyrolucite fluidized bed (PFB). Assays conducted under various water quality conditions: a) hardness
≈ 0 mg CaCO3/L, b) hardness = 100 mg CaCO3/L and c) hardness = 100 mg CaCO3/L + Humic acids.
Alkalinity = 50 mg CaCO3/L, T = 20oC, pH = 7.0 and hydraulic loading rate (HLR) = 41 m/h.
0.01
0.10
1.00
10.00
0 20 40 60 80 100 120Fe
/Mn
co
nc
en
tra
tio
ns
(m
g/L
)
Empty bed contact time (s)
Hardness ≈ mg CaCO3/L
Fe_t = 2 h Fe_t = 4 h Fe_t = 10 h
Mn_ t = 2 h Mn_t = 4 h Mn_ t = 10 h
0.01
0.10
1.00
10.00
0 20 40 60 80 100 120Fe
/Mn
co
nc
en
tra
tio
ns
(m
g/L
)
Empty bed contact time (s)
Hardness = 100 mg CaCO3/L b)
0.02 mg/L target level
0.01
0.10
1.00
10.00
0 20 40 60 80 100 120Fe
/Mn
co
nc
en
tra
tio
ns
(m
g/L
)
Empty bed contact time (s)
Hardness = 100 mg CaCO3/L + Humic acids c)
0.02 mg/L target level
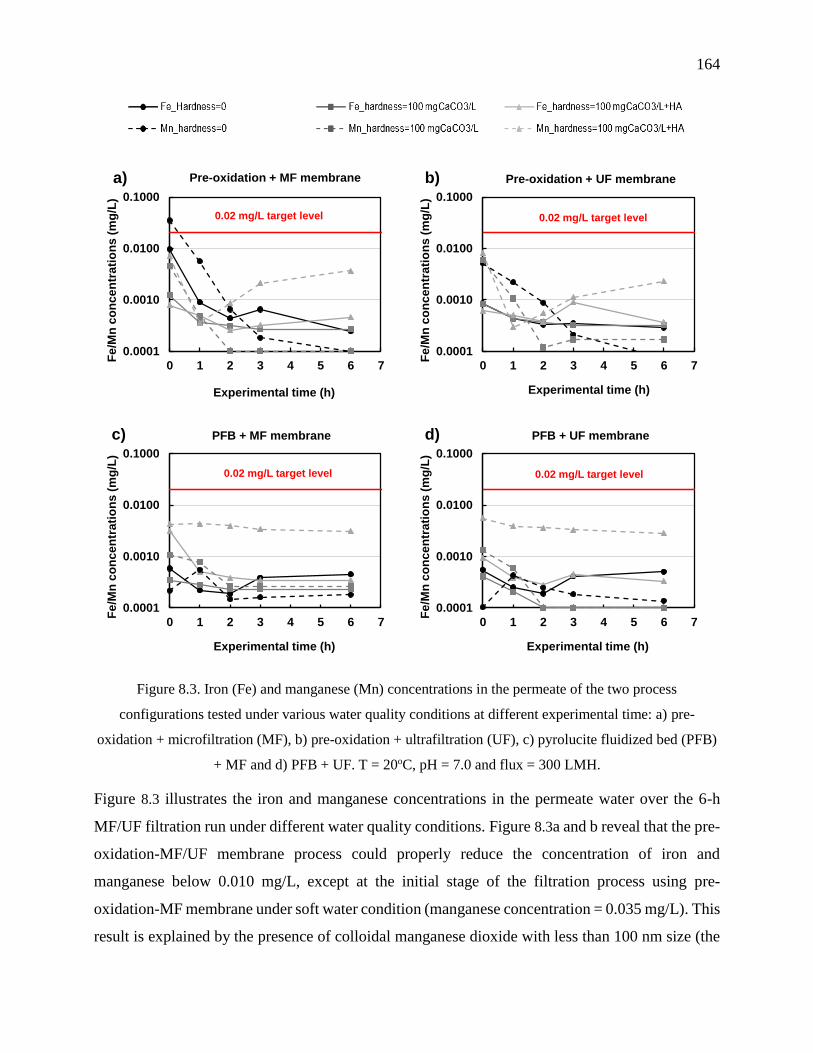
164
Figure 8.3. Iron (Fe) and manganese (Mn) concentrations in the permeate of the two process
configurations tested under various water quality conditions at different experimental time: a) pre-
oxidation + microfiltration (MF), b) pre-oxidation + ultrafiltration (UF), c) pyrolucite fluidized bed (PFB)
+ MF and d) PFB + UF. T = 20oC, pH = 7.0 and flux = 300 LMH.
Figure 8.3 illustrates the iron and manganese concentrations in the permeate water over the 6-h
MF/UF filtration run under different water quality conditions. Figure 8.3a and b reveal that the pre-
oxidation-MF/UF membrane process could properly reduce the concentration of iron and
manganese below 0.010 mg/L, except at the initial stage of the filtration process using pre-
oxidation-MF membrane under soft water condition (manganese concentration = 0.035 mg/L). This
result is explained by the presence of colloidal manganese dioxide with less than 100 nm size (the
0.0001
0.0010
0.0100
0.1000
0 1 2 3 4 5 6 7
Fe
/Mn
co
nc
en
tra
tio
ns
(m
g/L
)
Experimental time (h)
Pre-oxidation + MF membrane
0.02 mg/L target level
a)
0.0001
0.0010
0.0100
0.1000
0 1 2 3 4 5 6 7
Fe
/Mn
co
nc
en
tra
tio
ns
(m
g/L
)
Experimental time (h)
Pre-oxidation + UF membraneb)
0.02 mg/L target level
0.0001
0.0010
0.0100
0.1000
0 1 2 3 4 5 6 7
Fe
/Mn
co
nc
en
tra
tio
ns
(m
g/L
)
Experimental time (h)
PFB + MF membranec)
0.02 mg/L target level
0.0001
0.0010
0.0100
0.1000
0 1 2 3 4 5 6 7
Fe
/Mn
co
nc
en
tra
tio
ns
(m
g/L
)
Experimental time (h)
PFB + UF membraned)
0.02 mg/L target level
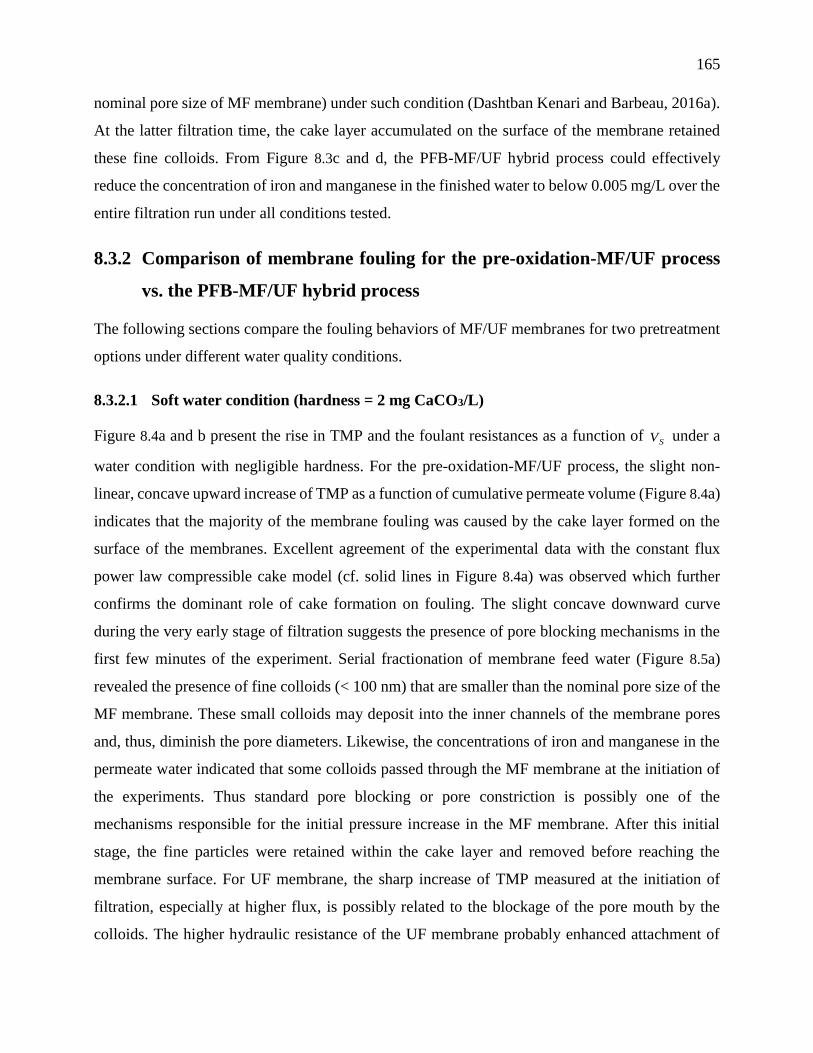
165
nominal pore size of MF membrane) under such condition (Dashtban Kenari and Barbeau, 2016a).
At the latter filtration time, the cake layer accumulated on the surface of the membrane retained
these fine colloids. From Figure 8.3c and d, the PFB-MF/UF hybrid process could effectively
reduce the concentration of iron and manganese in the finished water to below 0.005 mg/L over the
entire filtration run under all conditions tested.
8.3.2 Comparison of membrane fouling for the pre-oxidation-MF/UF process
vs. the PFB-MF/UF hybrid process
The following sections compare the fouling behaviors of MF/UF membranes for two pretreatment
options under different water quality conditions.
8.3.2.1 Soft water condition (hardness = 2 mg CaCO3/L)
Figure 8.4a and b present the rise in TMP and the foulant resistances as a function of SV under a
water condition with negligible hardness. For the pre-oxidation-MF/UF process, the slight non-
linear, concave upward increase of TMP as a function of cumulative permeate volume (Figure 8.4a)
indicates that the majority of the membrane fouling was caused by the cake layer formed on the
surface of the membranes. Excellent agreement of the experimental data with the constant flux
power law compressible cake model (cf. solid lines in Figure 8.4a) was observed which further
confirms the dominant role of cake formation on fouling. The slight concave downward curve
during the very early stage of filtration suggests the presence of pore blocking mechanisms in the
first few minutes of the experiment. Serial fractionation of membrane feed water (Figure 8.5a)
revealed the presence of fine colloids (< 100 nm) that are smaller than the nominal pore size of the
MF membrane. These small colloids may deposit into the inner channels of the membrane pores
and, thus, diminish the pore diameters. Likewise, the concentrations of iron and manganese in the
permeate water indicated that some colloids passed through the MF membrane at the initiation of
the experiments. Thus standard pore blocking or pore constriction is possibly one of the
mechanisms responsible for the initial pressure increase in the MF membrane. After this initial
stage, the fine particles were retained within the cake layer and removed before reaching the
membrane surface. For UF membrane, the sharp increase of TMP measured at the initiation of
filtration, especially at higher flux, is possibly related to the blockage of the pore mouth by the
colloids. The higher hydraulic resistance of the UF membrane probably enhanced attachment of

166
colloids on the membrane surface and blockage of the pore mouth. Consequently, fouling
mechanisms included the initial pore blockage for the first few minutes, and the subsequent
formation of a cake layer on the membrane surface. However, the contribution of pore blocking to
the overall fouling of the membrane was negligible.
Figure 8.4. Comparison of membrane fouling for the pre-oxidation-microfiltration (MF)/ultrafiltration
(UF) process and the pyrolucite fluidized bed (PFB)-MF/UF hybrid process under soft water condition
(hardness ≈ 0 mg CaCO3/L): (a) instantaneous transmembrane pressure (TMP) from experimental data and
the model fits using the constant flux blocking model for compressible cake (solid lines) (Eq. (1)) and (b)
foulant resistance. T = 20oC and pH = 7.0.
In pre-oxidation-MF/UF process, the steep TMP increase over the entire filtration cycle was
consistent with the fact that more than 75% of aggregates were in submicron range in the membrane
feed water (Figure 8.5a). The presence of colloids led to the formation of a more compact and less
porous cake layer (Lee et al., 2003). Fitting the experimental data to the Eq. (7.1) permitted to
determine the compressibility of the cake layer. Table 8.3 summarizes the compressibility
coefficients of the deposited cake layer under different experimental conditions. The results
Preoxidation_MF_150 LMH Preoxidation_MF_300 LMH
Preoxidation_UF_150 LMH Preoxidation_UF_300 LMH
PFB_MF_300 LMH PFB_UF_300 LMH
0
30
60
90
120
150
180
0.0 0.4 0.8 1.2 1.6 2.0
TM
P(k
Pa
)
Permeate volume per unit membrane area (m3/m2)
a)
0.0E+00
4.0E+11
8.0E+11
1.2E+12
1.6E+12
2.0E+12
0.0 0.4 0.8 1.2 1.6 2.0
Fo
ula
nt
res
ista
nc
e, R
f(m
-1)
Permeate volume per unit membrane area (m3/m2)
b)
0
30
60
0.00 0.03 0.06
MF_150
LMH UF_150
LMH

167
demonstrated that the mixture of ferric hydroxide and manganese dioxide aggregates in soft water
was only slightly compressible ( n′ < 0.25 (Tiller et al., 1987)) and the compressibility coefficients
were approximately comparable, regardless of the operating condition or membrane type. The
mixture of large and small aggregates can result in the formation of a dense cake layer (Madaeni,
2001) which hardly compresses further in the process since small colloids already occupy the void
between the large rigid metal oxide aggregates.
Table 8.3. Compressibility coefficients ( 'n ) for the deposited cake layer in pre-oxidation-microfiltration
(MF)/ultrafiltration (UF) process.
Experimental conditions Flux
(LMH)
'n
MF UF
Hardness ≈ 0 mg CaCO3/L 150 0.173 0.246
300 0.163 0.157
Hardness ≈ 100 mg CaCO3/L 150 0.347 0.283
300 0.342 0.353
Hardness ≈ 100 mg CaCO3/L +
humic acids
150 0.593 0.614
300 0.520 0.607
As can be seen from Figure 8.4b, at the lower flux of 150 LMH, the Rf of the MF membrane was
virtually identical to that of the UF membrane indicating the similar fouling mechanisms and
properties of the cake layer. When the flux was increased to 300 LMH, the Rf of the MF and UF
membrane increased by 3% and 21%, respectively. This increase in the Rf of the UF membrane
was attributed to the higher compaction of the cake layer achieved at higher TMP.
Comparing membrane fouling for the pre-oxidation-MF/UF process vs. the PFB-MF/UF hybrid
process revealed that the use of a PFB prior the membrane modules substantially reduced the extent
of membrane fouling, an effect caused by the removal of iron and manganese within the PFB.
Particularly, it removed more than 95% of manganese, which has been evidenced to induce severe
fouling to the membranes (Dashtban Kenari and Barbeau, 2016b), and 85% of iron. Furthermore,
from Figure 8.5a, all the oxidized aggregates in the effluent of the PFB were larger than 3 µm
resulting in cake layer formation which exerted minimal fouling to the membranes. Consequently,
the Rf of the MF and UF membrane decreased by 95% and 98%, respectively. The negligible
fouling of the MF/UF membrane in the downstream of PFB after 6 h of operation at a high flux
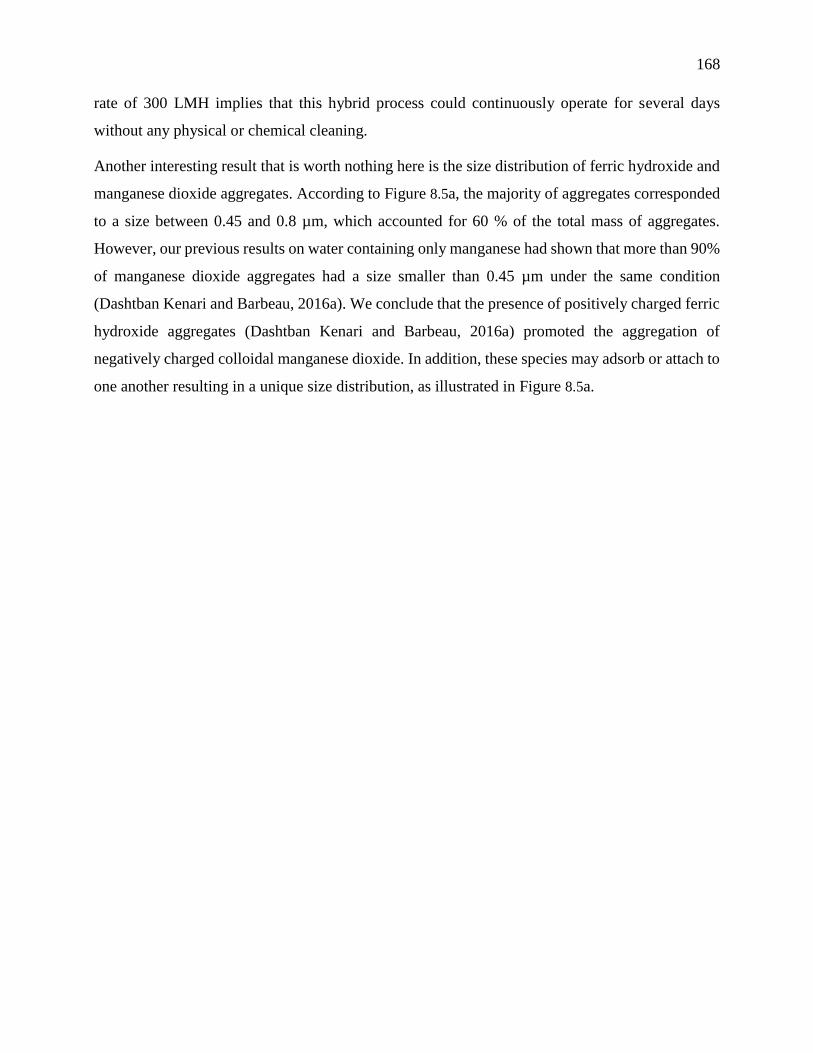
168
rate of 300 LMH implies that this hybrid process could continuously operate for several days
without any physical or chemical cleaning.
Another interesting result that is worth nothing here is the size distribution of ferric hydroxide and
manganese dioxide aggregates. According to Figure 8.5a, the majority of aggregates corresponded
to a size between 0.45 and 0.8 µm, which accounted for 60 % of the total mass of aggregates.
However, our previous results on water containing only manganese had shown that more than 90%
of manganese dioxide aggregates had a size smaller than 0.45 µm under the same condition
(Dashtban Kenari and Barbeau, 2016a). We conclude that the presence of positively charged ferric
hydroxide aggregates (Dashtban Kenari and Barbeau, 2016a) promoted the aggregation of
negatively charged colloidal manganese dioxide. In addition, these species may adsorb or attach to
one another resulting in a unique size distribution, as illustrated in Figure 8.5a.
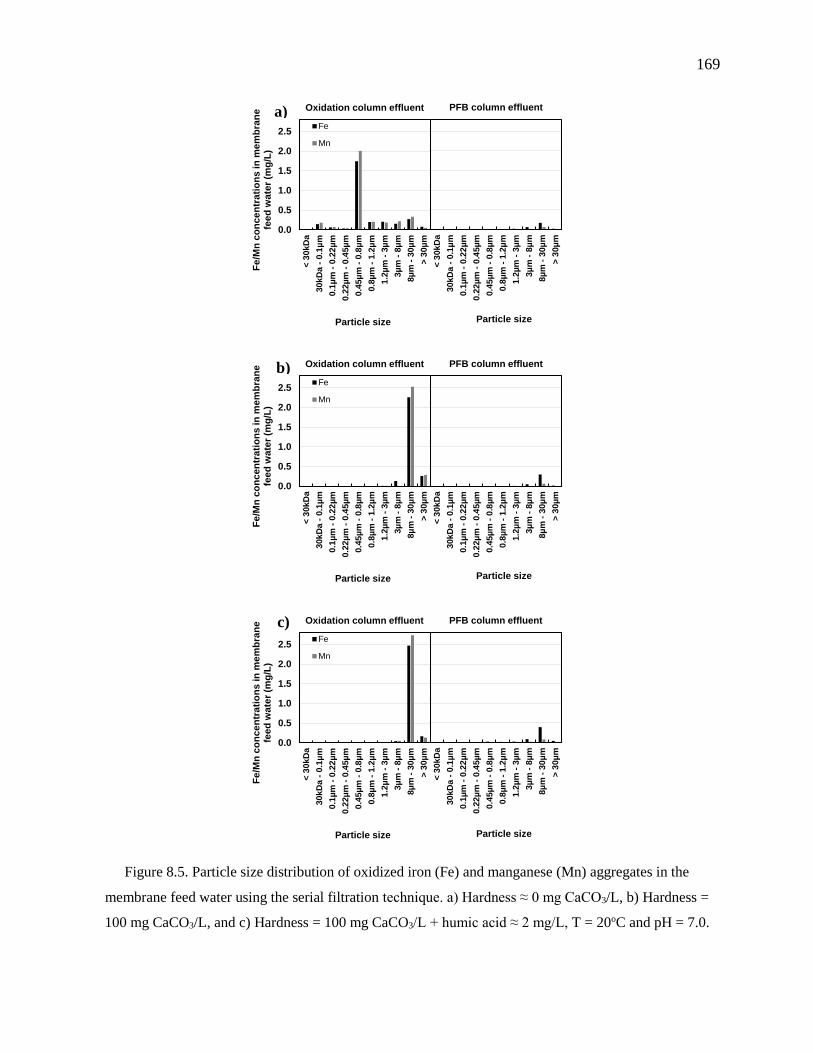
169
Figure 8.5. Particle size distribution of oxidized iron (Fe) and manganese (Mn) aggregates in the
membrane feed water using the serial filtration technique. a) Hardness ≈ 0 mg CaCO3/L, b) Hardness =
100 mg CaCO3/L, and c) Hardness = 100 mg CaCO3/L + humic acid ≈ 2 mg/L, T = 20oC and pH = 7.0.
0.0
0.5
1.0
1.5
2.0
2.5
< 3
0kD
a
30kD
a -
0.1
µm
0.1
µm
- 0
.22
µm
0.2
2µ
m -
0.4
5µ
m
0.4
5µ
m -
0.8
µm
0.8
µm
- 1
.2µ
m
1.2
µm
- 3
µm
3µ
m -
8µ
m
8µ
m -
30µ
m
> 3
0µ
m
Fe
/Mn
co
nc
en
tra
tio
ns
in
me
mb
ran
e
fee
d w
ate
r (m
g/L
)
Particle size
Oxidation column effluent
Fe
Mn
< 3
0kD
a
30kD
a -
0.1
µm
0.1
µm
- 0
.22
µm
0.2
2µ
m -
0.4
5µ
m
0.4
5µ
m -
0.8
µm
0.8
µm
- 1
.2µ
m
1.2
µm
- 3
µm
3µ
m -
8µ
m
8µ
m -
30µ
m
> 3
0µ
m
Particle size
PFB column effluent
b)
a)
c)

170
8.3.2.2 Moderately hard water condition (hardness = 100 mg CaCO3/L)
Figure 8.6 illustrates the rise in TMP and the foulant resistance in MF and UF of water containing
iron and manganese under moderately hard water condition. Comparing Figure 8.6 and Figure 8.4
reveals that increasing hardness from 0 to 100 mg CaCO3/L had a significant impact on fouling of
both MF and UF membranes in the pre-oxidation-MF/UF configuration. The reduction in
membrane fouling under higher hardness condition was associated with the much larger aggregates
size. High calcium concentration increases aggregation of colloidal particles via charge
neutralization, electrostatic double layer compression and bridging phenomenon (Zhang et al.,
2009). As shown in Figure 8.5b, about 87% of iron and manganese species (by mass) had a size
ranging from 8 to 30 µm which is significantly larger than the pore size of the membranes.
Figure 8.6a also illustrates the fitting of the experimental data to the compressible cake formation
model (solid lines). The excellent agreement of the model with the experimental data confirms that
cake filtration dominated the fouling process during these experiments. As presented in Table 8.3,
the deposited filter cake under this condition was moderately compressible, i.e. approximately
twice higher than the cake formed under soft water condition. This is mainly related to the much
larger aggregate size with nearly neutral surface charge (Dashtban Kenari and Barbeau, 2016a),
which increases the void space between the aggregates. This void space can be eventually occupied
by the forthcoming aggregates resulting in compression of the filter cake.
At the lower flux of 150 LMH, the TMP build-up in MF membrane showed a similar trend as for
the UF membrane over the entire filtration cycle such that the foulant resistance curves once again
overlapped (Figure 8.6b). Under this condition, relatively low fouling was observed for both
membranes. Rising the flux to 300 LMH increased the drag force, and thus resulted in the formation
of more compact cakes with greater resistances. As a consequence, higher foulant resistance was
observed under this condition especially for the UF membrane.
Although, the extent of fouling in pre-oxidation-MF/UF process was substantially lowered under
moderately hard compared to soft water condition, the fouling was still high at the elevated flux of
300 LMH and required frequent cleaning. The pretreatment with PFB properly mitigated the
membrane fouling and enhanced the performance of both membranes. Thus, the use of PFB
pretreatment is of benefit, even under hard water condition, as it removed a large portion of iron
and manganese species and reduced total suspended solids concentration.
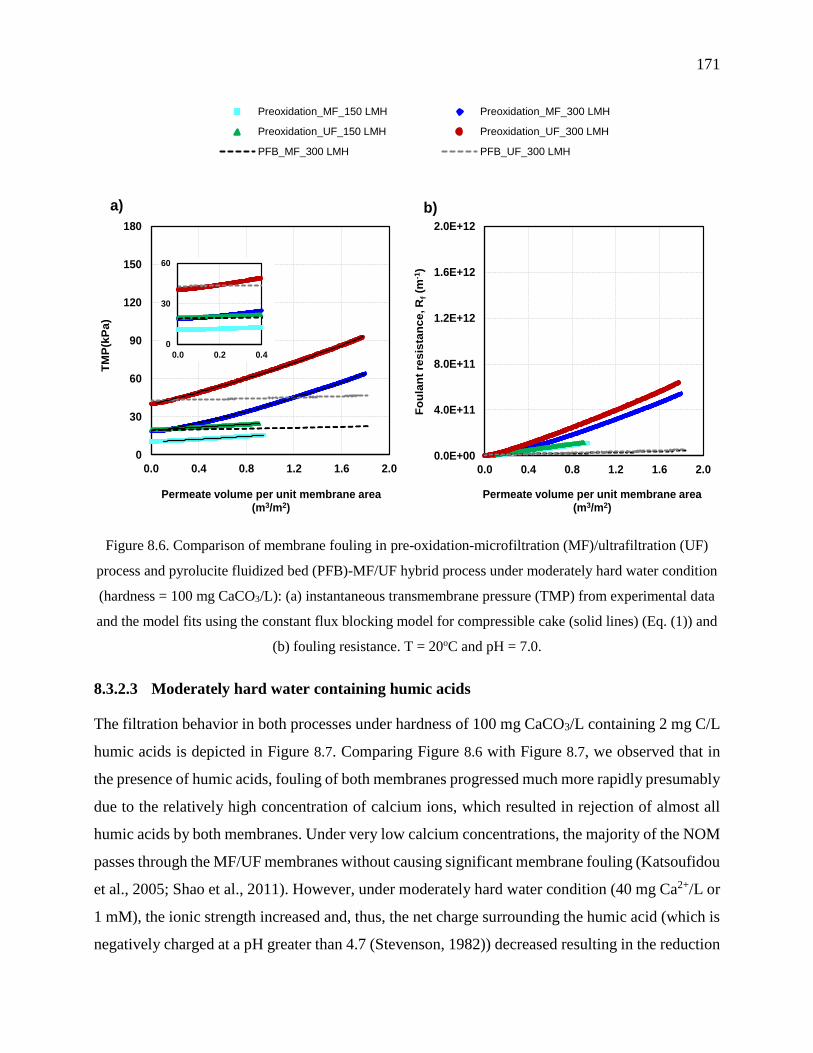
171
Figure 8.6. Comparison of membrane fouling in pre-oxidation-microfiltration (MF)/ultrafiltration (UF)
process and pyrolucite fluidized bed (PFB)-MF/UF hybrid process under moderately hard water condition
(hardness = 100 mg CaCO3/L): (a) instantaneous transmembrane pressure (TMP) from experimental data
and the model fits using the constant flux blocking model for compressible cake (solid lines) (Eq. (1)) and
(b) fouling resistance. T = 20oC and pH = 7.0.
8.3.2.3 Moderately hard water containing humic acids
The filtration behavior in both processes under hardness of 100 mg CaCO3/L containing 2 mg C/L
humic acids is depicted in Figure 8.7. Comparing Figure 8.6 with Figure 8.7, we observed that in
the presence of humic acids, fouling of both membranes progressed much more rapidly presumably
due to the relatively high concentration of calcium ions, which resulted in rejection of almost all
humic acids by both membranes. Under very low calcium concentrations, the majority of the NOM
passes through the MF/UF membranes without causing significant membrane fouling (Katsoufidou
et al., 2005; Shao et al., 2011). However, under moderately hard water condition (40 mg Ca2+/L or
1 mM), the ionic strength increased and, thus, the net charge surrounding the humic acid (which is
negatively charged at a pH greater than 4.7 (Stevenson, 1982)) decreased resulting in the reduction
Preoxidation_MF_150 LMH Preoxidation_MF_300 LMH
Preoxidation_UF_150 LMH Preoxidation_UF_300 LMH
PFB_MF_300 LMH PFB_UF_300 LMH
0
30
60
90
120
150
180
0.0 0.4 0.8 1.2 1.6 2.0
TM
P(k
Pa
)
Permeate volume per unit membrane area (m3/m2)
a)
0.0E+00
4.0E+11
8.0E+11
1.2E+12
1.6E+12
2.0E+12
0.0 0.4 0.8 1.2 1.6 2.0
Fo
ula
nt
res
ista
nc
e, R
f(m
-1)
Permeate volume per unit membrane area (m3/m2)
b)
0
30
60
0.0 0.2 0.4
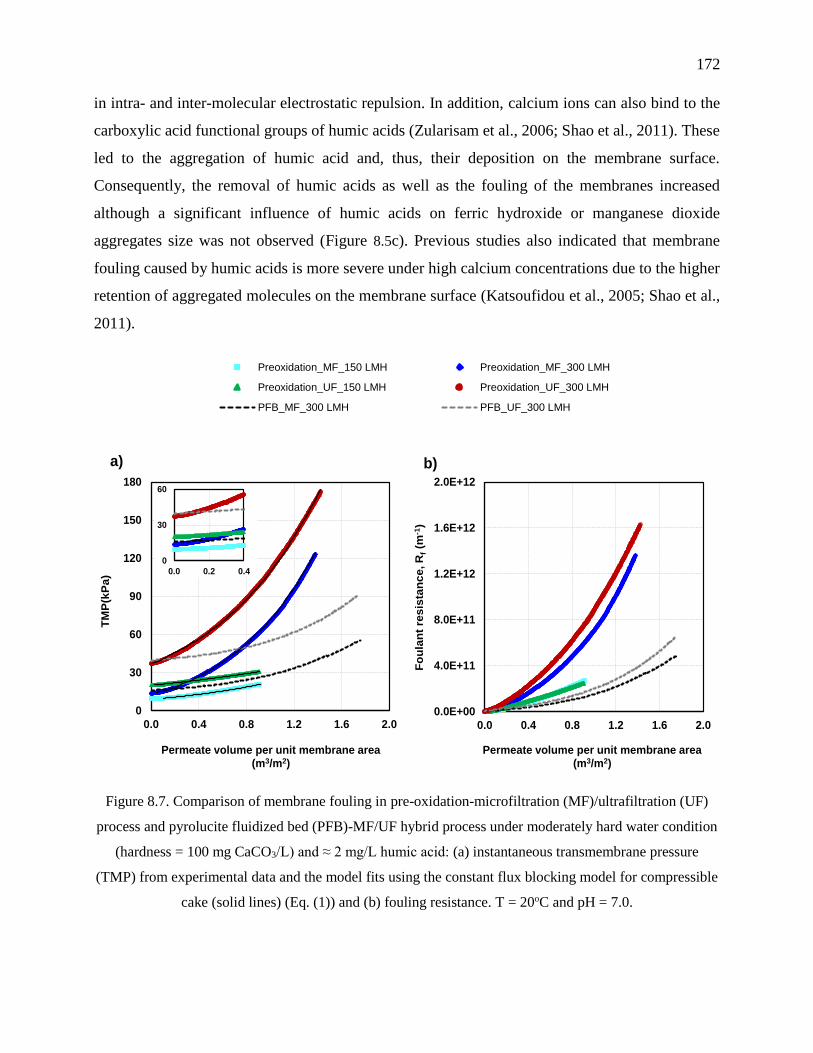
172
in intra- and inter-molecular electrostatic repulsion. In addition, calcium ions can also bind to the
carboxylic acid functional groups of humic acids (Zularisam et al., 2006; Shao et al., 2011). These
led to the aggregation of humic acid and, thus, their deposition on the membrane surface.
Consequently, the removal of humic acids as well as the fouling of the membranes increased
although a significant influence of humic acids on ferric hydroxide or manganese dioxide
aggregates size was not observed (Figure 8.5c). Previous studies also indicated that membrane
fouling caused by humic acids is more severe under high calcium concentrations due to the higher
retention of aggregated molecules on the membrane surface (Katsoufidou et al., 2005; Shao et al.,
2011).
Figure 8.7. Comparison of membrane fouling in pre-oxidation-microfiltration (MF)/ultrafiltration (UF)
process and pyrolucite fluidized bed (PFB)-MF/UF hybrid process under moderately hard water condition
(hardness = 100 mg CaCO3/L) and ≈ 2 mg/L humic acid: (a) instantaneous transmembrane pressure
(TMP) from experimental data and the model fits using the constant flux blocking model for compressible
cake (solid lines) (Eq. (1)) and (b) fouling resistance. T = 20oC and pH = 7.0.
Preoxidation_MF_150 LMH Preoxidation_MF_300 LMH
Preoxidation_UF_150 LMH Preoxidation_UF_300 LMH
PFB_MF_300 LMH PFB_UF_300 LMH
0
30
60
90
120
150
180
0.0 0.4 0.8 1.2 1.6 2.0
TM
P(k
Pa
)
Permeate volume per unit membrane area (m3/m2)
a)
0.0E+00
4.0E+11
8.0E+11
1.2E+12
1.6E+12
2.0E+12
0.0 0.4 0.8 1.2 1.6 2.0
Fo
ula
nt
res
ista
nc
e, R
f(m
-1)
Permeate volume per unit membrane area (m3/m2)
b)
0
30
60
0.0 0.2 0.4

173
Figure 8.7 illustrates a concave-upward behavior of TMP versus volume filtered. Under all
conditions, the TMP gradually increased at shorter times while the fouling exacerbated at longer
time scales. The increased fouling rates at longer time scales are due to the compressibility of the
cake layer, which resulted in a greater increase in the hydraulic resistance. Figure 8.7a also shows
the fitting of the experimental TMP to the model for compressible cake formation (solid lines). As
observed, the model correctly predicts the fouling behavior at the later stages of filtration. The data
at the initiation of the experiment was excluded from the model fitting due to the retardation in the
development of the filter cake, especially at the lower flux. In addition, the filter cake may exhibit
a retardation effect during the compression as the compressibility coefficient progressively
increased until an equilibrium has been reached (Hwang and Hsueh, 2003). This especially occurs
during the initial stages of filtration of soft aggregates. From Table 8.3, fairly high and comparable
compressibility coefficients (0.52-0.61) were attained in the pre-oxidation-MF/UF process under
all conditions tested. Thus, the compressibility coefficients for oxidized suspensions containing
organic compounds were much higher than those for the oxidized iron and manganese species
alone, presumably due to break-up and/or deformation of soft organic aggregates (Vela et al., 2008)
which bound particles one to another and concurrently filled some of the spaces between them.
At the higher flux, the increased drag force gave rise to the formation of more compact cakes with
greater resistances. For example, fR after 0.9 m3/m2 increased from 2.44E+11 to 7.37E+11 as flux
augmented from 150 to 300 LMH for UF membrane. At the lower flux of 150 LMH, the foulant
resistance was almost independent of membrane type (Figure 8.7b). As the flux increased to 300
LMH, the difference between the required TMP for UF and MF membrane increased giving rise to
a more significant difference between the fouling of these membranes. As a consequence, a more
compact cake layer with greater resistance was formed on the UF membrane.
As depicted in Figure 8.7, using PFB as a pretreatment step resulted in a dramatic reduction in
membrane fouling. As a result, the fouling of MF and UF membrane after a SV of 1.3 m3/m2
decreased by 78% and 76%, respectively. However, the fouling of both membranes are much
higher than in the previous conditions (Figure 8.4 and Figure 8.6) while the concentrations of
oxidized iron and manganese in the membrane feed water did not change significantly. Thus, humic
acids (and their interaction with manganese/iron) were the main contributor to the fouling of
membranes under this condition. The fouling was initially similar for both MF and UF membranes,
174
but as the filtration progressed, the fouling of UF membrane became much larger than that of the
MF membrane due to the higher compaction of foulant under higher TMP.
8.3.3 Resistance-in-series model analysis
The “resistance-in-series” analysis was applied to provide further quantitative insight into the
reversibility of ceramic MF/UF membrane fouling. Figure 8.8 presents the results of this analysis
in pre-oxidation-MF/UF process and PFB-MF/UF hybrid process under very low hardness value
(Figure 8.8a), hardness of 100 mg CaCO3/L (Figure 8.8b), and hardness of 100 mg CaCO3/L with
2 mg/L humic acids (Figure 8.8c). Chemically irreversible fouling was negligible under all
conditions implying that adsorption of foulants within the membrane pores did not take place.
In pre-oxidation-MF/UF configuration, Rcr largely contributed to the total fouling of the
membranes under soft water condition (Figure 8.8a). For instance, at the flux of 300 LMH, Rcr
accounted for 34% and 50% of the MF and UF membranes fouling, respectively. Deposition of
colloids and pore blocking at the early stage of filtration as well as the formation of a cohesive and
compact cake layer was the likely cause of the physically irreversible fouling. Correspondingly,
frequent acid cleaning would be essential for the successful operation of this process. On the other
hand, the PFB-MF/UF hybrid process could be continuously operated for several days without
requiring substantial cleaning.
Under moderately hard water conditions (Figure 8.8b and c), the majority of fouling was physically
reversible, further confirming the dominant role of cake formation mechanism and rejection of
contaminants by size exclusion. At the flux of 150 LMH, the intrinsic membrane resistance was
the main contributor to the total resistance of the membranes. However, at the flux of 300 LMH,
both membranes were severely fouled in the presence of humic acids. Although the fouling was
physically reversible, the extent of the fouling would be expected to impact the economic viability
of the pre-oxidation-MF/UF process. Comparison between Figure 8.8b and c reveals that the humic
acids were the main contributor to fouling under hard water conditions. Since the PFB cannot
remove humic acids from water, almost all humic aggregates (> 90% DOC removal) were
accumulated on the membrane surface resulting in higher resistance than in the absence of humic
acids, which was quantitatively comparable to the foulant resistance (Rf/Vs) for the pre-oxidation-
MF/UF process operated at the flux of 150 LMH. It is likely that the more compressed humic acids

175
Figure 8.8. Resistance-in-series analysis for the constant flux/dead-end microfiltration (MF)/ultrafiltration
(UF) of ferric hydroxide and manganese dioxide suspensions under (a) hardness ≈ 0 mg CaCO3/L, (b)
hardness = 100 mg CaCO3/L, and (c) hardness = 100 mg CaCO3/L + 2 mg/L humic acids. T = 20oC.
176
cake developed at the higher flux of 300 LMH compensated for the lower concentrations of
oxidized iron and manganese measured in the PFB-MF/UF effluent.
8.4 Conclusions
The main goal of this study was to develop a more robust process for iron and manganese control
in drinking water. The performance of a PFB pretreatment for mitigating MF/UF membrane fouling
was investigated. The following conclusions can be drawn:
Both pre-oxidation-MF/UF and PFB-MF/UF hybrid processes reduced the concentration of
iron and manganese in finished water to below the target limit of 0.020 mg/L (except at the
initial stage of the pre-oxidation-MF process under soft water condition).
Severe fouling of both membranes were observed in pre-oxidation-MF/UF process under
all conditions tested, especially under soft water or in the presence of humic acids at high
flux.
In pre-oxidation-MF/UF process under soft water condition, the fouling behavior was
governed by initial pore blockage followed by cake filtration during the later stage.
However, the initial pore blocking step was negligible compared to the total fouling of the
membranes. Under moderately hard water conditions, cake formation was the predominant
fouling mechanism during the entire filtration period. The dominant role of cake formation
was confirmed by the excellent fit of the experimental data to the blocking law model for
compressible cake.
The PFB pretreatment properly alleviated the membrane fouling by removing more than
75% and 95% of iron and manganese, respectively. The PFB-MF/UF hybrid process, in the
absence of humic acids, could be continuously operated for several days without any
chemical/physical cleaning.
With the pre-oxidation-MF/UF process under soft water condition, chemically reversible
resistance largely contributed to the total resistance of the membranes. Under all other
conditions, fouling was physically reversible.
As the filtration flux increased, the fouling became more severe for the UF than the MF
membrane due to the higher operation pressure of the former which led to higher
compaction of the deposited cake layer on the membrane surface.
177
Acknowledgments
This study was supported by RES’EAU-WATERNET, a NSERC (Natural Sciences and
Engineering Research Council of Canada) collaborative strategic network (Grant No. 364635-07),
and the NSERC Discovery Grant Program (RGPIN-2015-04920). We would also like to
acknowledge the CREDEAU laboratories at Polytechnique Montréal for providing the facilities
needed to conduct the research.
178
CHAPTER 9 GENERAL DISCUSSION
This chapter highlights the main findings of this research project. The general objective was to
develop a robust and compact process for iron and manganese control, which can consistently
guaranty the desired target limit in treated water (0.02 mg Mn/L and 0.02 mg Fe/L). To achieve
this goal, we investigated: 1) the characteristics of oxidized iron and manganese in water treatment;
2) the fouling of UF membranes caused by oxidized iron and manganese; 3) the application of PFB
for manganese removal; 4) a pilot-scale demonstration of fixed vs. fluidized pyrolucite beds for
iron and manganese control; and 5) the performance of a PFB-MF/UF hybrid process for improved
iron and manganese control. The main findings of each part is discussed in sections 8.1 to 8.5.
9.1 Characteristics of oxidized iron and manganese in water
treatment
Following oxidation of Fe(II)/Mn(II), LD, DLS and fractionation through serial membrane
filtration techniques were used to define the PSD of oxidized species. The results indicated that the
pH of water has a significant impact on the size of manganese dioxide colloids/particles. Increasing
the pH from 6.0 to 8.0 substantially reduced the size of manganese dioxide while almost all colloids
were found in the size fraction between 0.1 µm and 30 kDa. This result was in line with the
measured ζ -potential of these colloids. Since the point of zero charge of manganese dioxide is
below pH 3.0 (Morgan and Stumm, 1964), it is always negatively charged in natural waters. When
pH increased from 6.0 to 8.0, the more negatively charged surface ( ζ -potential of 1.2±4.36- mV
to 1.2±5.45- mV) provides higher EDL repulsion between the colloids, therefore reducing the
aggregation of colloids. A monomodal PSD is observed under all pH conditions using the DLS and
LD measurement techniques with a shift toward larger sizes as the pH is reduced from 8.0 to 6.0.
In these experiments, LD always demonstrated the presence of very fine colloids, which were not
detected by DLS, because the latter measures the hydrodynamic diameter, which is larger than the
geometric diameter for small highly charged colloids. This difference is particularly considerable
for sub-100 nm size colloids, as previously stated by Safari et al. (2014). In these experiments, the
DLS results were fairly similar to the results obtained via the serial membrane filtration technique.
This result is consistent with the previous findings, which suggest that the DLS method provides
179
more accurate results for sub-500 nm particles, while the LD is best suited for micron size particles
(Bowen, 2002; Dieckmann et al., 2009).
The fractal dimensions of aggregates were also calculated from LD data. While manganese dioxide
aggregates have quite similar fractal dimensions (1.67 and 1.63, respectively) at pH 6.0 and 7.0,
the fractal dimension at pH 8.0 was very low (1.21), which is indicative of very small clusters with
long-range repulsion forces (González et al., 2004).
Increasing the ionic strength from 0.5 to 10 mM (pH = 7 and hardness ≈ 0) resulted in significant
increase in the size of manganese dioxide, indicating partial aggregation of colloids due to the
reduction in the electrostatic forces (the ζ -potential changed from 3.2±9.42- to 6.0±2.37- ).
However, these aggregates are still mainly present in the sub-micron range. A comparison between
DLS and LD results reveals that the DLS measurement overestimates the size of fine colloids.
However, the LD method did not provide enough sensitivity in the sub-micron range to show the
small particle size growth achieved by increasing the ionic strength. This explains why the number
size distribution obtained by DLS shifted toward greater diameters indicating the growth in particle
size (the number size distribution is sensitive to growth only when the size of a majority of the
particles increases). This result is in agreement with the lower accuracy of the LD method for sub-
micron particles (Bowen, 2002). The fractal dimensions of manganese dioxide aggregates slightly
increased by increasing the ionic strength, consistent with previous studies on silica colloids (Singh
and Song, 2006) and titanium dioxide nanoparticles (Chowdhury et al., 2013).
At a constant ionic strength (10 mM and pH = 7), the size of manganese dioxide aggregates was
dramatically influenced by calcium ion. Under soft water conditions, the particles were typically
present in the range of 0.45 to 1.2 µm while under moderately hard water and very had water
conditions, all particles were larger than 3 µm (according to the serial filtration technique).
Accordingly, the ζ -potential of manganese dioxide decreased from 6.0±2.37- to 4.0±8.12- and
1.0±7.3- by increasing the hardness of water from 0 to 100 and 317 mg CaCO3/L, respectively.
Thus, aggregation occurred due to the charge neutralization and compaction of EDL. Under hard
water condition where significant aggregation occurred, the number size distribution measured
with the LD method was in good agreement with the serial filtration technique while the volume
PSD overestimated the size of aggregates as it is proportional to d3. The DLS did not allow for
measurement of the PSD under hard water condition due to the presence of large aggregates, with

180
high polydispersity indices (> 0.8), and interference from sedimentation. The fractal dimensions of
manganese dioxide aggregates increased with the hardness of water due to the adsorption of
calcium ions onto negatively charged colloids/particles, which can result in a tight adhesion of the
calcium saturated aggregates (Pantina and Furst, 2006). As a result, the fractal dimension
approached 3 for the aggregates generated at the hardness of 317 mg CaCO3/L indicating the
formation of compact, nearly spherical aggregates.
Unlike manganese dioxide, characteristics of ferric hydroxide aggregates did not significantly
differ under different water chemistry conditions tested. All particles were on the micron scale, and
more than 80% (by wt) were in the size range between 3 and 8 µm (according to the serial filtration
technique). Likewise, the nearly zero ζ -potential of particles under different conditions implies the
rapid aggregation of ferric hydroxide particles. The number size distributions obtained by LD was
in good agreement with serial filtration results while the volume size distribution overestimated the
size of aggregates. Thus, the number PSD is suggested while using LD for characterizing
agglomerating systems such as flocculation. The fractal dimensions of these aggregates under all
conditions were between 1.59 and 1.71, implying the high intra-aggregate porosity of these
suspensions.
In conclusion, for sub-micron aggregates the DLS is in good agreement with serial filtration
technique while for micron size aggregates, the LD and serial filtration techniques are coherent.
9.2 Fouling of UF membranes caused by oxidized iron and
manganese
Iron and manganese removal efficiencies through the pre-oxidation and UF process were more than
99.5% under different water chemistry conditions using both ceramic and polymeric membranes
(concentration of each mineral was < 0.02 mg/L in the filtrate). These results imply that Fe(II) and
Mn(II) were completely oxidized by KMnO4 during the retention time provided by the column and
all particles/colloids were larger than the nominal pore size of the membranes.
A constant flux power law compressible cake model adequately described the pressure profiles
under all conditions, indicating the dominant role of cake formation. Accounting for cake
compression was important to adequately model the results. During UF of manganese dioxide
aggregates, increasing pH from 6.0 to 7.0 (ionic strength = 0.5 mM and hardness ≈ 0) caused a

181
significant increase in membrane fouling while further increase of pH from 7.0 to 8.0 reduced the
rate of fouling, as the fouling at pH 6.0 and 8.0 were nearly identical. Even though substantial
aggregation was not found under these conditions due to the high repulsive forces between the
colloids, the PSD evidenced some partial aggregation of colloids even at pH 8.0. The lowest cake
resistance at pH 6.0 was attributed to the formation of much larger manganese dioxide aggregates
compared to that of formed at pH 7.0 and 8.0. However, although the size of colloids was slightly
smaller at pH 8.0 than pH 7.0, the average specific cake resistance was much lower at pH 8.0,
because at this pH, the larger thickness of the EDL increased the distance between the deposits
giving rise to the formation of a cake layer with higher permeability and lower resistance (Faibish
et al., 1998; Singh and Song, 2006). The low resistance of the cake layer at pH 8.0 can also be
related to the very low fractal dimension of the aggregates (1.21) which indicates the high intra-
aggregate porosity of the deposited cake layer. Moderate and fairly comparable compressibility
coefficients (0.27 to 0.31) were found for colloidal manganese oxides under different pH condition,
most probably due to the repulsive EDL interactions between the negatively charged colloids. The
slightly higher compressibility coefficient at pH 6.0 is in line with the larger aggregate size
measured under this condition.
Increasing the ionic strength of water from 0.5 to 1 mM (pH = 7 and hardness ≈ 0) slightly increased
the normalized TMP and the average specific resistance of the cake layer formed by manganese
dioxide aggregates due to the slight compression of the EDL (Faibish et al., 1998; Bowen and
Jenner, 1995). However, when ionic strength was raised from 1 to 10 mM, the normalized TMP
and the average specific cake resistance diminished. The reduction in hydraulic resistance was
associated with the larger aggregate dimensions (average size increased by more than 100%).
Increasing the ionic strength by 10-fold compressed the EDL and enhanced the aggregation of
colloids. Consequently, larger manganese dioxide aggregates formed more permeable cake layer
with greater inter-aggregate porosity. The compressibility of the cake layer was reduced by
increasing the ionic strength because the EDL compression diminished the inter-particle distance
which could then be filled subsequently at higher TMP.
Hardness of water significantly controlled the fouling caused by manganese dioxide aggregates.
Under a constant ionic strength (10 mM), increasing the hardness from nearly 0 to 100 mg CaCO3/L
notably alleviated the fouling of UF membranes. An additional increase in hardness, from 100 to
317 mg CaCO3/L, further declined the normalized TMP rate, but to a much lesser extent. Under

182
hard water conditions, most of the surface charges of colloids were neutralized (according to ζ -
potential), thus, the EDL was almost completely suppressed giving rise to aggregation of
destabilized colloids. As a result, the mean size of aggregates increased from 0.118 µm to more
than 2 µm resulting in the formation of a more permeable cake layer. This cake layer was highly
compressible since we noted that a very slow increase of the pressure in the early stage of the
filtration was followed by a more rapid growth at the later time. Due to the very high fractal
dimensions of aggregates (close to 3) under hard water condition, the compressibility of the cake
layer is related to the collapse of the clusters and, consequently, to the reduction of the inter-
aggregate porosity.
The TMP increase pattern and the fouling were quite similar in ceramic and polymeric UF
membranes under different conditions tested. The slightly higher fouling of polymeric membrane
was likely caused by the hydrodynamic effects arising from the different configuration of these
membranes (a longer tubular ceramic membrane with a larger inner diameter vs. a shorter hollow
fiber polymeric membrane with a smaller inner diameter) (Carroll and Booker, 2000; Krawczyk
and Jonsson, 2014). The compressibility coefficients of the cake layer were also comparable in
both membranes, confirming the fact that the cake compressibility is predominantly controlled by
the aggregate properties, not the type of the membrane. In general, the compressibility of
manganese dioxide aggregates is mainly influenced by the ionic strength of water, the thickness of
the EDL and the size of aggregates. The difference between polymeric and ceramic membranes
was evident when the contribution of physically and chemically reversible fouling was determined.
For ceramic membranes, almost all fouling resistance was physically removable while chemically
reversible fouling mainly contributed to the fouling of polymeric membranes, especially in soft
water condition. In the absent of calcium ion, the low-permeable cake formed on the surface of the
membrane was not completely removed by the physical cleaning procedure applied for polymeric
membrane. These results suggest that ceramic membranes would be a better choice for the removal
of manganese oxides due to the possibility to implement of more aggressive physical cleaning.
During UF of ferric hydroxide aggregates, a very low fouling rate, regardless of water chemistry
conditions, was observed. The relatively similar hydraulic resistance of the cake layer under
different condition is in line with the similar characteristics of the ferric hydroxide aggregates,
independent of pH (from 6.0 to 8.0), ionic strengths (from 0.5 to 10 mM) or hardness (0 to 317 mg
CaCO3/L). Since the mean size of these aggregates (3 to 7 µm) were much higher than the

183
membranes pore size (150 or 200 kDa), the aggregates accumulated on the membrane surface
resulting in a cake formation with very low average specific resistances. Chemically irreversible
fouling was negligible for both membranes under all conditions, an evidence that irreversible
adsorption of iron and manganese did not occur during filtration. It is expected that this type of
fouling would only be discernable after long-term operation.
In conclusion, unlike manganese dioxide aggregates, the specific resistance of the cake formed by
ferric hydroxide aggregates is not substantially dependent on the pH, ionic strength or hardness of
water because ferric hydroxide aggregates are easily destabilized under natural water conditions
(the point of zero charge lays in the pH range of 7.0 to 8.0). The fouling resistance of ferric
hydroxide aggregates were even lower than that of manganese dioxide aggregates under hard water
condition. This might be due to the less compact nature of the ferric hydroxide aggregates, forming
a cake with high inter- and intra-aggregate porosity (the fractal dimension of 1.59-1.71 vs. 3.03 for
ferric hydroxide and manganese dioxide aggregates, respectively). In addition, the intrinsic
membrane resistance was the main contributor to the total resistance of both polymeric and ceramic
membranes while filtering iron oxides as the former had pore sizes in the range of 150 and 200
kDa, while the suspended particles were in the micron size range.
9.3 Application of PFB for manganese removal
Short-term (4 h) performance of PFB contactor for Mn(II) removal was evaluated under different
conditions. The results demonstrate almost complete manganese removal (concentration of
manganese in treated water was always less than 5 µg/L) in less than 1 min under all conditions
tested. The removal profiles were stable under low initial Mn(II) concentrations (< 1.0 mg/L).
However, under elevated Mn(II) concentrations (what values), an unstable Mn removal profile was
observed, especially at 9oC. This is conceivable due to a faster adsorption reaction than the
subsequent autocatalytic oxidation of adsorbed Mn(II) by chlorine (Knocke et al., 1990a).
Moreover, although Mn(II) uptake capacity increases with feed Mn(II) concentration, breakthrough
occurs earlier under higher Mn(II) concentrations (Tobiason et al., 2008). Improved Mn(II)
removal profile under elevated temperature (23oC vs. 9oC) is related to a higher Mn(II) adsorption
capacity of pyrolucite under such condition since the adsorption onto MnO2(s) is an endothermic
process (Ren et al., 2011). In addition, the oxidation rate of adsorbed Mn(II) increased with
temperature, resulting in a faster recovery of the adsorption sites. However, the solution phase
184
oxidation of Mn(II) by free chlorine did not occur due to the very short contact time (less than 1
min) within the PFB. Although the adsorption capacity of MnOx(s) reduces as pH declines (Knocke
et al., 1990a), changing the pH from 7.8 to 6.2 did not have a notable impact on manganese removal
profile throughout the PFB. This can be attributed to the inherent advantage of PFB, which provides
a larger amount of active sites for Mn(II) uptake. Zuravnsky (2006) and Knocke et al. (2010) also
demonstrated that pyrolucite media offers a higher Mn(II) uptake capability than MnOx(s)-coated
sand. In addition, improved solid-liquid contact between water and pyrolucite media in the
fluidized bed contactor, as opposed to a fixed bed contactor, offers a more effective utilization of
available sorption sites. The same result was achieved under different water hardness (0 vs. 200
mg CaCO3/L). Although the presence of high amount of calcium ion was expected to deteriorate
the Mn(II) removal profile (Merkle et al., 1997), quite similar removal profiles were observed at
hardness of 0 and 200 mg CaCO3/L. The identical total and dissolved manganese concentration at
each sampling point demonstrates that the solution oxidation of manganese within the PFB did not
occur. Chlorine demand within the PFB was lower (0.2-0.3 mg Cl2/L) than the expected chlorine
required for oxidation of Mn(II). Since SGW was prepared with DM water, chlorine was only
consumed to oxidize the adsorbed Mn(II). Thus, manganese removal mechanism within the PFB
includes adsorption of Mn(II) onto pyrolucite and subsequent slower surface oxidation of adsorbed
Mn(II) by free chlorine.
Developing a process which can provide efficient manganese removal while operating at high HLR
is of great interest owing to the reduction in the process footprint and capital costs. The PFB
contactor can be operated at HLR of 40-60 m/h, a much higher range than the fixed bed contactors
(typically 10-20 m/h). Although hydraulic retention time within the PFB contactor was very short
at the HLR of 63 m/h (less than 75 seconds), 100% Mn(II) removal efficiency was achieved during
the 4 hr experimental cycles (initial Mn(II) = 2.2 to 2.4 mg/L). The Mn(II) removal profiles
overlapped under HLR of 24 to 63 m/h, indicating the consistent removal performance under
different HLR. On the other hand, the specific Mn(II) adsorption rate (mg Mn(II)/kg pyrolucite/s),
over the height of PFB, is higher at elevated HLR. Likewise, determining the average mass transfer
coefficient as an indication of adsorption rate (Bošković-Vragolović et al., 2009) revealed that mass
transfer coefficient slightly increased at higher HLR. This is a very important finding which shows
that, unlike the results obtained by Bošković-Vragolović et al. (2009), a PFB can be operated at
very high HLRs without reduction in mass transfer coefficient as well as adsorption rate. This
185
discrepancy is likely related to the very high specific gravity of the pyrolucite media relative to the
glass particles used by these authors. The high specific gravity prevents excessive expansion of the
PFB at high HLR, thus, the increased HLR can compensate the detrimental effect of increased
porosity on mass transfer coefficients. In addition, unlike the pyrolucite fixed bed (Zuravnsky,
2006; Tobiason et al., 2008), Mn(II) removal performance through the PFB slightly increased with
HLR.
Long-term (12 d) stability experiments showed that the process operated with a free chlorine
residual of 1.0 mg Cl2/L in the effluent failed to adequately remove manganese (i.e., < 20 µg/L in
the effluent) after 6 days of operation (feed Mn(II) = 0.8-1.3 mg/L). However, increasing the
effluent free chlorine residual to 2.0-2.6 mg Cl2/L led to a stable removal performance of almost
100% for the entire test period. Chlorine consumption within the PFB was increased under higher
chlorine concentration (from < 0.2 mg Cl2/L to 0.2-0.9 mg Cl2/L), implying the higher stability of
the PFB under such condition as most of the occupied sites were continuously regenerated. For
some utilities, such free chlorine residual might be too high to be considered applicable depending
on the required dosage to fulfil primary and secondary disinfection. Nonetheless, further
regeneration of pyrolucite after 6 days of operation appears a realistic operational constraint for a
small groundwater system operator. On the other hand, these operational cycles were achieved for
a relatively high influent manganese concentration (0.8-1.3 mg/L). Operational cycles would be
much longer under lower influent manganese condition. Likewise, a deeper PFB could also extend
the duration of operation prior to regeneration. Finally, it is important to mention that the turbidity
of the PFB effluent was constantly at 0.2 NTU over the entire test period, implying that post-
filtration would not be needed after the PFB (as long as no iron is present in the feed water).
9.4 Pilot-scale study on fixed vs. fluidized pyrolucite beds for iron and
manganese control
In this study, a pilot-scale pyrolucite fixed and fluidized bed contactors were operated in parallel
on the Ste-Marthe-sur-le-Lac groundwater (DOC = 3.3 mg C/L, alkalinity = 170 mg CaCO3/L,
hardness = 200 mg CaCO3/L, temperature = 8-12oC). Three models of distributors plate (located at
the bottom of the FBR) were tested. The required HLR to achieve 10% bed expansion for
Distributors A, B, and C were 40, 30, and 32 m/h, respectively, implying that the Distributor A was
186
less effective in void development in the bed, thus, could decrease the quality of fluid-particle
contact. Yet, a good fluid-particle contact quality enhances the adsorption rate in the fluidized bed
contactor. Likewise, the results revealed that the PFB contactors equipped with Distributors B and
C were more efficient than Distributor A for Mn(II) removal, particularly in the first 15 cm above
the distributor plate. The differences became more pronounced as the experiment progressed.
Therefore, Distributor A could not well distribute water over the whole cross-section of the bed
above the distributor plate and appropriately utilize the adsorption capacity of the media. Measuring
the particulate manganese concentration through the height of PFB shows that a significant amount
of manganese was released in the jet zone above the distributor plate, when using Distributor A
and B. The best performance was obtained using Distributor C, because the reduction in the jet
effect caused by this distributor eliminated separation of loosely bounded manganese from the
surface of the pyrolucite media. Thus, PFB contactor was equipped with distributor C for further
experiments. Any full-scale implementation of the FBR should pay close attention to the design of
the distributor plates.
For the experiments under very low feed iron concentration ( 00.0±01.0 mg Fe/L), the PFB
efficiently removed manganese (manganese concentration in the effluent water was always < 0.02
mg/L), even at a very high HLR of 45 m/h, over the entire 21 days experimental cycle (feed
manganese = 01.0±09.0 mg Mn/L). Although almost 100% of Mn(II) was removed, 5-15%
particulate manganese was observed in the effluent, especially at the higher HLR of 45 m/h, due to
the presence of particulate manganese in the feed water as well as the abrasive forces resulting from
the intensified particle-particle collisions in the fluidized bed. However, the concentration of total
manganese in the effluent water was always below the target limit of 0.02 mg/L. In parallel, the
pyrolucite fixed bed contactor efficiently removed manganese (≈ 100% removal performance)
under the same feed water condition but a lower HLR (20 m/h). The concentration of manganese
in the effluent was always lower than 0.005 mg/L due to the stationary state of the fixed bed, which
can better retain all particulates formed within the column. Dissolved and total manganese profiles
were stable over 21 days of experiment for both fixed and fluidized beds, implying that the free
chlorine residual concentration of 1 mg Cl2/L in the effluent was adequate for continuous
regeneration of the adsorption sites. Under higher feed manganese concentration ( 03.0±35.0 mg
Mn/L), both contactors were effective in removing manganese (> 95%) over the 21 days of
experiment (effluent manganese concentration < 0.02 mg/L) implying the very high adsorption
187
capacity of pyrolucite media. More than 92% of manganese was in dissolved form in the feed water
and remained dissolved inside the contactors indicating that the removal mechanism was
predominantly governed by sorption of Mn(II) onto the pyrolucite surface with subsequent surface
catalyzed oxidation of adsorbed manganese by chlorine. Under this condition, stable manganese
removal profiles were not observed within the contactors implying that they would have eventually
breakthrough owing to the saturation of the available adsorption sites. Increasing the free chlorine
concentration above 1 mg Cl2/L would likely extend the operation cycle duration before further
regeneration.
Under elevated feed iron concentration ( 02.0±18.0 mg/L), more than 90% of Fe(II) and Mn(II) were
removed over 21 days using the PFB contactor (initial Mn(II) concentration = 01.0±11.0 mg/L).
However, the PFB contactor performance for total iron and manganese removal varied from 50-
80% and 60-80%, respectively. Thus, an elevated iron concentration caused a significant decrease
in manganese removal. Unlike instantaneous oxidation of Fe(II) by free chlorine in SGW, complete
oxidation of Fe(II) did not occur in natural groundwater over the 90 s retention time available in
the PFB contactor. This is most likely related to the higher DOC content of the natural groundwater
(3.3 mg C/L) than the SGW (< 0.2 mg/L). Consequently, Fe(II) may have competed with Mn(II)
for the adsorption sites (Hu et al., 2004). In addition, as the ferric hydroxide coating developed on
the media grains, the previously available sorption sites became inaccessible under this layer. Iron
removal in the PFB contactor was governed by two mechanisms: 1) adsorption of Fe(II) onto the
pyrolucite media and 2) solution oxidation of Fe(II) and subsequent attachment of oxidized
particles on the media grains. The presence of 20-40% particulate manganese in treated water was
presumably related to the adsorption of Mn(II) onto the ferric hydroxide particles and carryover
from the PFB contactor. This hypothesis is supported by the fact that ferric hydrous oxides can
serve as adsorbent for Mn(II) (Buamah et al., 2008). In conclusion, the application of a PFB
contactor as a standalone process is not recommend for groundwater treatment with elevated iron
concentrations. In fixed bed contactor, the concentrations of iron and manganese in the treated
water (< 0.005 mg/L) were well below 0.02 mg/L. However, a steady state removal performance
was not experienced due to the deposition and build-up of ferric hydroxide on the pyrolucite media,
which covered some available adsorption sites. Unlike the PFB contactor, 60-90% of Fe(II) was
oxidized by chlorine prior reaching the filter media due to the 5 min retention time available in the
column above the media. Thus, the iron removal mechanism in the fixed bed contactor mainly

188
comprised of water phase oxidation of Fe(II) and subsequent capture of oxidized particles by the
filter media.
The pressure drop across the PFB was constant and stable (33 kPa) over the 21 d experimental
cycle, regardless of water quality. It can be estimated from the apparent weight of the pyrolucite
media per cross-section unit of the column and the water head in the column. Under very low iron
concentration ( 00.0±01.0 mg Fe/L), the very low turbidity of the influent water (≈ 0.1 NTU)
allowed for the operation of the fixed bed contactor at a high HLR (20 m/h) while only one and
two backwashes were required over the 21 days for the feed manganese concentration of 01.0±09.0
or 03.0±35.0 mg/L, respectively. The accumulation of oxidized manganese (less than 10% solution
oxidation of manganese was observed) and partial blockage of the void spaces were presumably
responsible for the increased head loss under these conditions. Under an elevated feed iron
concentration ( 02.0±18.0 mg/L), a substantial head loss accumulated across the bed, thus, the
filtration cycle was significantly shortened (around 3 days) due to the retention of more particulate
materials (60-90% of iron was oxidized before reaching the filter media (turbidity = 0.3 NTU)
within the filter. In summary, even though the pyrolucite fixed bed contactor effectively controls
the concentration of iron and manganese under an elevated iron concentration, it consumes more
energy and produces more wastewater. On the other hand, combining a PFB contactor with a
downstream process with the capability of operating at very high loading rate while providing other
treatment goals (such as disinfection with UF) would be a great option. In addition, although both
contactors were highly effective for manganese control under very low iron concentrations, the
PFB offers the advantage of operating at high HLR, which reduces the contactor footprint, capital
cost as well as wastewater production.
On a final note, the accumulation of adsorbed manganese on the PFB media is expected to increase
the size of pyrolucite over time. However, complete manganese removal from this natural
groundwater with around 0.1 mg Mn/L in a 45 m/h PFB would only increase the mass content of
manganese dioxide in the contactor by 3% after one year of operation. This represent a theoretical
increase in media size of 7 µm.

189
9.5 Performance of a PFB-MF/UF hybrid process for improved iron
and manganese control
Stable iron and manganese removal profiles were observed over the 10-h operation of PFB under
different conditions (soft water, moderately hard water and moderately hard water including humic
acids). As a result, 76%-89% iron and 95%-97% manganese removal were achieved in around 100
s of contact time, irrespective of water quality. The difference in iron and manganese removal
performance can be explained by mechanistic differences. Manganese removal involves a very fast
adsorption of Mn(II) onto the pyrolucite and subsequent catalytic oxidation of adsorbed manganese
by chlorine. However, iron removal involved instantaneous oxidation of Fe(II) by free chlorine
followed by partial attachment of particulates onto the pyrolucite. The observed lower rejection for
iron is related to the shear exerted on the pyroluctite in the fluidized bed (30% bed expansion),
which reduced the attachment of particulate species. These findings further indicate the need to
apply a downstream process which can properly reduce the concentration of these species below
0.020 mg/L. Application of MF/UF process downstream of a PFB effectively reduced the iron and
manganese concentrations in treated water to below 0.005 mg/L under all conditions tested. In
comparison, pre-oxidation-MF/UF process could also reduce the iron and manganese
concentrations below 0.010 mg/L, except at the initial stage of the filtration using MF membrane
under soft water condition (manganese concentration = 0.035 mg/L). This is related to the presence
of colloidal manganese dioxide with less than 100 nm in size (nominal pore size of MF membrane).
As filtration proceeded, the cake layer accumulated on the membrane retained these fine colloids.
Under soft water condition (hardness = 2 mg CaCO3/L), the fouling in the pre-oxidation-MF/UF
process can be explained by an initial pore blocking mechanism (in the first few minutes of the
filtration) followed by cake formation in the later filtration times. However, the contribution of
pore blocking to total fouling was negligible. Excellent agreement of the experimental data, after
the first few minutes of filtration, with the constant flux power law compressible cake model further
confirmed the dominant role of cake formation. Serial fractionation of the membrane feed water
revealed the presence of fine colloids (< 100 nm), which may deposit into the inner channels of the
membrane pores or block the pore mouth at the initial stage of filtration. At later time scales, these
colloids were retained within the cake layer before reaching the membrane surface. The severe
fouling of the membranes under this condition, was consistent with the presence of more than 75%
190
submicron aggregates in the feed water. Deposition of these colloids led to the formation of a more
compact and less porous cake layer. The results revealed that the mixture of oxidized iron and
manganese in soft water condition was only slightly compressible ( n′ < 0.25 (Tiller et al., 1987)),
because the blend of large and small aggregates forms a dense cake layer (Madaeni, 2001), which
hardly compresses as the process proceeds since small colloids already occupies the void space
between large aggregates. Interestingly, the presence of positively charged ferric hydroxide
aggregates promoted the aggregation of negatively charged colloidal manganese dioxide under soft
water condition. Moreover, these species may adsorb or attach to one another resulting in a unique
size distribution. Increasing hardness from 2 to 100 mg CaCO3/L significantly reduced the fouling
of both MF and UF membranes in this process due to the generation of much larger aggregates
(about 87% (wt) of aggregates had a size ranging from 8 to 30 µm). Under such condition, the
power law compressible cake formation model well described the TMP increase behavior over the
entire filtration cycle confirming the dominant role of cake filtration. The deposited cake layer
under this condition was moderately compressible ( n′ = 0.28-0.35) mainly due to the generation
of large aggregates and high void spaces between the deposited aggregates which can be eventually
occupied by the forthcoming aggregates. In the presence of 2 mg C/L humic acids, fouling of the
membranes progressed more rapidly presumably due to the rejection of almost all humic acids by
both membranes for the relatively high hardness of 100 mg CaCO3/L. Under such condition, the
reduction in the net charge surrounding the humic acids as well as binding of the carboxylic acid
functional groups of humic acids by calcium ions (Zularisam et al., 2006; Shao et al., 2011) led to
the aggregation of humic acids and, thus, their deposition on the membrane surface. Constant flux
compressible cake formation model correctly predicted the concave-upward behavior of TMP
under this condition. Fairly high compressibility coefficients (0.52-0.61) were obtained under this
condition, presumably due to break-up and/or deformation of soft organic aggregates (Vela et al.,
2008).
Under all water quality conditions and flux of 150 LMH, the fouling resistance of the MF
membrane was identical to that of the UF one indicating similar fouling mechanisms and cake layer
properties. Rising the flux to 300 LMH increased the drag force and resulted in the formation of
more compact cakes with greater resistances. When the flux was increased to 300 LMH, the fouling
resistance of UF membrane was higher than of the MF membrane, which can be attributed to the
formation of more compact cake layer at the higher operational TMP found in the tested UF

191
membranes. Under elevated flux, the difference between the required TMP for UF and MF
membrane increased resulting in a substantial difference between the fouling of these membranes.
The compressibility coefficients under all water quality conditions were approximately
comparable, irrespective of the operating condition or membrane type.
Comparing the fouling of the pre-oxidation-MF/UF process vs. the PFB-MF/UF hybrid process
revealed that the application of a PFB prior MF/UF membrane substantially reduced the extent of
membrane fouling (more than 90%) in the absence of humic substances, because more than 95%
of manganese and 75% of iron were removed inside the PFB. In addition, all the oxidized
aggregates in the effluent of the PFB were larger than 3 µm resulting in cake layer formation which
exerted minimal fouling on the membranes. The negligible fouling of the PFB-MF/UF hybrid
process after 6 h of operation at a high flux of 300 LMH implies that the hybrid process could
continuously operate for several days without any physical or chemical cleaning. Under elevated
humic acids concentration, although the application of a PFB as a pretreatment process significantly
reduced the membrane fouling (78%), the fouling was much higher than in the absence of humic
acids because the PFB does not have significant impact on the removal of organic matter.
According to the resistance-in-series model, adsorption of foulants within the membrane pores did
not take place under all conditions and the chemically irreversible fouling was negligible. In the
pre-oxidation-MF/UF configuration under soft water condition, chemically reversible fouling
largely contributed to the fouling of the membranes, especially UF, confirming pore blocking at
the early stage of filtration as well as the formation of a cohesive and compact cake layer. Under
moderately hard water conditions, the majority of fouling was physically reversible, confirming
the dominant role of cake formation. However, the extent of fouling would be expected to impact
the economic viability of the pre-oxidation-MF/UF process. In contrast, the PFB-MF/UF hybrid
process could be continuously operated for several days without any cleaning, unless in the
presence of humic substances. Humic acids were the main contributor to fouling under hard water
conditions.
As a conclusion, the PFB-MF/UF was found to be an effective option to treat groundwater supplies
with elevated iron and manganese concentrations. Considering the higher costs of UF/MF
membranes compared to pressure filters, it is anticipated that this treatment option would be
especially of interest for water utilities requiring to perform parasite removal (i.e. groundwater

192
under the direct influence) which requirement could be addressed by the use of low pressure
membranes. In all cases, the design engineer should consider selecting a very high operating flux
in order to benefit (from an economic standpoint) to the maximum of the fouling reduction offered
by the use of the FBR.
193
CHAPTER 10 CONCLUSION AND RECOMMENDATIONS
The main purpose of this research project was to develop a robust process for iron and manganese
control in drinking water. In order to better elucidate the potential applicability of the proposed
process, its performance was compared with the most common treatment processes (greensand
filtration as well as oxidation and membrane filtration) which has been for this purpose. The
following conclusions were derived from different parts of this research:
Characteristics of ferric hydroxide and manganese dioxide aggregates under different
water chemistry conditions and UF membrane fouling during filtration of these
suspensions:
Characteristics of manganese dioxide aggregates (size, ζ -potential and fractal dimension)
and, subsequently, UF membrane fouling caused by these aggregates are significantly
influenced by pH, ionic strength and salt valency (i.e., Ca2+ vs. Na+) of water. Unlike
manganese dioxide, the sensitivity of the ferric hydroxide characteristics to pH, ionic
strength and hardness is negligible under conditions relevant to water treatment.
The pre-oxidation-UF process properly controlled iron and manganese concentrations
below the target value of 0.02 mg/L under all tested conditions. However, removal of
manganese dioxide from water is more problematic than ferric hydroxide due to the
formation of colloids as small as several tens of nanometers, especially under soft water
condition with low salinity and high pH. Under such conditions, colloidal manganese
dioxide is prone to severely foul UF membranes. In contrast, ferric hydroxide aggregates
caused similar and low fouling to the membrane irrespective of the water chemistry
conditions tested.
Among the studied parameters, water hardness strongly controls the destabilization of
colloidal manganese dioxide, as micron-sized aggregates were generated under hard water
conditions. The deposited cake layer under this condition had high inter-aggregate porosity
and low fouling resistance. These results also imply that the addition of lime, rather than
caustic soda, is a more favorable option for pH adjustment followed by oxidation prior to
filtration.
Fouling mechanism can be described by a power law compressible cake formation model,
indicating the dominant role of cake filtration as a fouling mechanism. The specific

194
resistance of the cake layer and its compressibility is mainly governed by the characteristics
of aggregates rather than the type of membrane material (ceramic vs. polymeric) and its
configuration (tubular vs. hollow fiber). For colloids smaller than 100 nm, the hydraulic
resistance of the cake layer is mainly governed by the thickness of the EDL rather than the
size of colloids.
Under identical condition, the ceramic tubular membrane and the polymeric hollow fiber
membrane tested were almost similarly fouled. The main difference is related to the
reversibility of fouling as physical cleaning was considerably more effective for the ceramic
membrane than the polymeric one due to the potential implementation of more aggressive
physical cleaning.
For stabilized inorganic colloids, DLS detects nanoparticles including the shell resulting in
uncertainties regarding the onset of the PSD. This technique also suffers from the
polydispersity and the presence of large aggregates. However, it is well adapted to measure
sub-micron particles with narrow size ranges. In contrast, the LD method is generally more
suitable for micron-sized aggregates but offers low sensitivity and accuracy for particles in
the sub-micron ranges. However, in agglomerating systems, such as flocculation, the results
must be interpreted with great care, and comparison with other methods is suggested.
Serial filtration technique is recommended as a simple option for general evaluation of
manganese dioxide and ferric hydroxide aggregates, because (i) the availability of DLS and
LD techniques is not that common in the water industry and (ii) this method proved to be
sufficient for PSD characterization.
The potential application of a PFB contactor for manganese removal from groundwater
containing high level of Mn(II):
Almost complete Mn(II) removal (≈ 100%) was achieved in less than 1 min under different
operating conditions and SGW composition.
The manganese removal mechanism consists of rapid adsorption of Mn(II) onto pyrolucite
media followed by slower autocatalytic oxidation of adsorbed Mn(II) in the presence of free
chlorine.
Mn(II) removal profiles within the PFB contactor was consistent irrespective to the pH (6.2-
7.8) and hardness (0-200 mg CaCO3/L) of the feed water.

195
High specific gravity of pyrolucite allowed the process to be operated at high HLR (e.g., 63
m/h) without any concern regarding a reduction of the adsorption rate.
Maintenance of an adequate free chlorine residual in the effluent of PFB plays a key role in
the long-term stability of this process.
The performance of pilot-scale pyrolucite fixed and fluidized beds for iron and manganese
control in natural groundwater:
Efficient performance of a pilot-scale PFB contactor is strongly controlled by the type of
distributor plate. Among different configurations of distributor plates tested herein, a
shrouded perforated distributor plate with a 15 cm layer of gravel (4-10 mm) on top proved
to be optimal.
Although the PFB contactor has a strong adsorption capacity for Fe(II) and Mn(II), the
long-term stability of the process was influenced by the initial concentration of these
species.
The PFB contactor proved effective for manganese removal under a wide range of feed
manganese concentrations as long as iron levels were very low. It also minimized
wastewater production (only produced during regeneration) while providing a high
treatment performance and a small footprint. As a result, this process is suggested for water
treatment utilities targeting only manganese removal with negligible iron in the influent
water. Under elevated iron concentrations, a downstream process after the PFB contactor is
needed to achieve the desired removal performance (concentration < 0.02 mg/L for both
metals).
The pyrolucite fixed bed contactor successfully removed iron and manganese under all
conditions tested. However, fairly rapid head loss build-up was observed across the column
operated at 20 m/h under elevated iron concentrations (3 days filtration cycle). Actually,
the iron concentration in groundwater mainly controlled the head loss build-up rate through
the fixed bed. In contrast, the head loss through the PFB contactor remained constant,
irrespective to the influent water quality.
In both contactors (fixed vs fluidized), manganese was essentially removed by the
adsorption of Mn(II) onto the pyrolucite media followed by the autocatalytic oxidation of
the adsorbed Mn(II) on the surface of the media. A similar mechanism could be deduced
196
for the removal of a large portion of iron in the PFB contactor while iron was mainly
removed via solution oxidation of Fe(II) by chlorine followed by the capture of particulate
and/or colloidal ferric hydroxide by pyrolucite fixed bed.
The performance of a PFB pretreatment for mitigating MF/UF membrane fouling:
The comparison between the pre-oxidation-MF/UF and PFB-MF/UF hybrid processes
revealed that both processes could reduce the concentration of iron and manganese in
treated water to below the target limit of 0.020 mg/L (except at the initial stage of the pre-
oxidation-MF process under soft water condition).
In pre-oxidation-MF/UF process, severe fouling of both membranes were observed under
all conditions tested, especially under soft water or in the presence of humic acids at high
flux. Under soft water condition, the mechanism of membrane fouling can be described as
initial pore blocking followed by cake filtration during the later stage while the contribution
of initial pore blocking to the overall fouling of the membranes was negligible. Under
moderately hard water conditions, cake filtration was the predominant fouling mechanism
during the entire filtration run. The dominant role of cake formation was inferred from the
excellent fit of the experimental data to the constant flux blocking law model for
compressible cake formation.
The application of PFB as a pretreatment process gave rise to significant fouling mitigation
by removing more than 75% and 95% of iron and manganese, respectively. In the absence
of humic acids, the PFB-MF/UF hybrid process could be continuously operated for several
days (more than a week) without any cleaning.
Under all conditions tested, fouling was physically reversible except for the pre-oxidation-
MF/UF process operated under soft water condition, during which chemically reversible
resistance largely contributed to the total resistance of both membranes.
Under high filtration flux, the fouling was more severe for the UF than the MF membrane
due to the higher operation pressure of the former leading to higher compaction of the cake
layer on the membrane surface.
197
This work also sparked new ideas for future research. It would be interesting to:
Evaluate the PFB performance for removal of other heavy metals that are frequently present
in groundwater such as chromium(III), arsenic(III) and arsenic(V) ions in conjunction with
iron and manganese.
Develop a phenomenological model that can predict the Mn(II) removal profile within the
PFB via NGE process or the regeneration interval for practical applications.
Evaluate the long-term performance (one year) of the PFB-MF/UF hybrid process in a pilot-
scale study using natural groundwater.
198
BIBLIOGRAPHY
Aguiar, A.O., Duarte, R.A. and Ladeira, A.C.Q. (2013). The application of MnO2 in the removal
of manganese from acid mine water. Water, Air, & Soil Pollution, 224(9), 1690.
Allard, S., Fouche, L., Dick, J., Heitz, A. and von Gunten, U. (2013). Oxidation of manganese(II)
during chlorination: Role of bromide. Environmental Science & Technology, 47(15), 8716-
8723.
Al-Rashdi, B.A.M., Johnson, D.J. and Hilal, N. (2013). Removal of heavy metal ions by
nanofiltration. Desalination, 315, 2-17.
American Public Health Association (APHA), American Water Works Association (AWWA).
(2005). Standard methods for the examination of water and wastewater (21th Ed.).
Washington, DC, USA: American Public Health Association.
American Water Works Association (AWWA). (2005). M53-Microfiltration and ultrafiltration
membranes for drinking water. Manual of water supply practices (1th Ed.). Denver, CO,
USA: American Water Works Association.
Azizi, A., Morina, M., Hajdini, S. and Latifi, L. (2013). Oxidation and removal of iron and
manganese in water treatment plant in Velekince, Gjilan, Kosovo. Journal of International
Environmental Application and Science, 8(2), 166-170.
Bacchin, P., Aimar, P. and Field R.W. (2006). Critical and sustainable fluxes: theory, experiments
and applications. Journal of Membrane Science, 281(1-2), 42-69.
Barbeau, B., Carrière, A. and Bouchard, M.F. (2011). Spatial and temporal variations of manganese
concentrations in drinking water. Journal of Environmental Science and Health, Part A,
46(6), 608-616.
Barlokova, D. and Ilavsky, J. (2009). Iron and manganese removal from small water resources.
Proceedings of the International Symposium on Water Management and Hydraulic
Engineering, Ohrid, Macedonia, 1-5 September.
Bazilio, A.A., Kaminski, G.S., Larsen, Y., Xuyen, M. and Tobiason, J.E. (2016). Full-scale
implementation of second-stage contactors for manganese removal. Journal of the
American Water Works Association, 108(12), E606-E614.
199
Bernat, X., Pihlajamäki, A., Fortuny, A., Bengoa, C., Stüber, F., Fabregat, A., Nyström, M. and
Font, J. (2009). Non-enhanced ultrafiltration of iron(III) with commercial ceramic
membranes. Journal of Membrane Science, 334(1-2), 129-137.
Bierlein, K.A., Knocke, W.R., Tobiason, J.E., Subramaniam, A., Pham, M. and Little, J.C. (2015).
Modeling manganese removal in a pilot-scale postfiltration contactor. Journal of the
American Water Works Association, 107(2), E109-E119.
Bošković-Vragolović, N., Garić-Grulović, R., Grbavčić, Ž. and Pjanović, R. (2009). Mass transfer
and fluid flow visualization in packed and fluidized beds by the adsorption method. Russian
Journal of Physical Chemistry A, 83(9), 1550-1553.
Bouchard, M.F., Sauvé, S., Barbeau, B., Legrand, M., Brodeur, M.E., Bouffard, T., Limoges, E.,
Bellinger, D.C. and Mergler, D. (2011). Intellectual impairment in school-age chlidren
exposed to manganese from drinking water. Environmental Health Perspectives, 119(1),
138-143.
Bowen, P. (2002). Particle size distribution measurement from millimeters to nanometers and from
rods to platelets. Journal of Dispersion Science and Technology, 23(5), 631-662.
Braghetta, A., DiGiano, F.A. and Ball, W.P. (1997). Nanofiltration of natural organic matter: pH
and ionic strength effects. Journal of Environmental Engineering, 123(7), 628-641.
Bruins, J.H., Petrusevski, B., Slokar, Y.M., Huysman, K., Joris, K., Kruithof, J.C. and Kennedy,
M.D. (2015a). Biological and physico-chemical formation of Birnessite during the ripening
of manganese removal filters. Water Research, 69, 154-161.
Bruins, J.H., Petrusevski, B., Slokar, Y.M., Kruithof, J.C. and Kennedy, M.D. (2015b). Manganese
removal from groundwater: Characterization of filter media coating. Desalination and
Water Treatment, 55(7), 1851-1863.
Buamah, R., Petrusevski, B., de Ridder, D., van de Wetering, T.S.C.M. and Shippers, J.C. (2009).
Manganese removal in groundwater treatment: practice, problems and probable solutions.
Water Science & Technology: Water Supply, 9(1), 89-98.
Buamah, R., Petrusevski, B. and Schirppers, J.C. (2008). Adsorptive removal of manganese(II)
from the aqueous phase using iron oxide coated sand. Journal of Water Supply: Research
and Technology-AQUA, 57(1), 1-11.
200
California Department of Public Health (CDPH). (2010). Drinking water notification levels and
response levels: An overview (pp. 14).
Camel, V. and Bermond, A. (1998). The use of ozone and associated oxidation processes in
drinking water treatment. Water Research, 32(11), 3208-3222.
Carlson, K.H. and Knocke, W.R. (1999). Modeling manganese oxidation with KMnO4 for drinking
water treatment. Journal of Environmental Engineering, 125(10), 892-896.
Carlson, K.H., Knocke, W.R. and Gertig, K.R. (1997). Optimizing treatment through Fe and Mn
fractionation. Journal of the American Water Works Association, 89(4), 162-171.
Carroll, T. and Booker, N.A. (2000). Axial features in the fouling of hollow-fibre membranes.
Journal of Membrane Science, 168(1-2), 203-212.
Casale, R.J., LeChevallier, M.W. and Pontius, F.W. (2002). Manganese control and related issues.
American Water Works Association Research Foundation, Denver, CO, USA (pp. 214).
Cavanagh, J.E., Weinberg, H.S., Gold, A., Sangaiah, R., Marbury, D., Glaze, W.H., Collette, T.W.,
Richardson, S.D. and Thruston, A.D. (1992). Ozonation byproducts: Identification of
bromohydrins from the ozonation of natural waters with enhanced bromide levels.
Environmental Science & Technology, 26(8), 1658-1662.
Cerrato, J.M., Hochella, M.F., Knocke, W.R., Dietrich, A.M. and Cromer, T.F. (2010). Use of XPS
to Identify the Oxidation State of Mn in Solid Surfaces of Filtration Media Oxide Samples
from Drinking Water Treatment Plants. Environmental Science & Technology, 44(15),
5881-5886.
Cerrato, J.M., Knocke, W.R., Hochella, M.F., Dietrich, A.M., Jones, A. and Cromer, T.F. (2011).
Application of XPS and solution chemistry analyses to investigate soluble manganese
removal by MnOx(s)-coated media. Environmental Science & Technology, 45(23), 10068-
10074.
Chang, Y.-Y., Song, K.-H., Yu, M.-R. and Yang, J.-K. (2012). Removal of arsenic from aqueous
solution by iron-coated sand and manganese-coated sand having different mineral types.
Water Science and Technology, 65(4), 683-688.
201
Chellam, S., Jacangelo, J.G. and Bonacquisti, T.P. (1998). Modeling and experimental verification
of pilot-scale hollow fiber, direct flow microfiltration with periodic backwashing.
Environmental Science & Technology, 32(1), 75-81.
Chellam, S. and Xu, W. (2006). Blocking laws analysis of dead-end constant flux microfiltration
of compressible cakes. Journal of Colloid and Interface Science, 301(1), 248-257.
Choo, K.H., Han, S.C., Choi, S.J., Jung, J.H., Chang, D., Ahn, J.H. and Benjamin, M.M. (2007).
Use of chelating polymers to enhance manganese removal in ultrafiltration for drinking
water treatment. Journal of Industrial and Engineering Chemistry, 13(2), 163-169.
Choo, K.-H., Lee, H. and Choi, S.-J. (2005). Iron and manganese removal and membrane fouling
during UF in conjunction with prechlorination for drinking water treatment. Journal of
Membrane Science, 267(1-2), 18-26.
Chowdhury, I., Walker, S.L. and Mylon, S.E. (2013). Aggregate morphology of nano-TiO2: Role
of primary particle size, solution chemistry, and organic matter. Environmental Science:
Processes Impacts, 15, 275-282.
Coffey, B., Gallagher, D. and Knocke, W. (1993). Modeling soluble manganese removal by oxide-
coated filter media. Journal of Environmental Engineering, 119(4), 679-694.
Côté, P., Mourato, D., Güngerich, C., Russell, J. and Houghton, E. (1998). Immersed membrane
filtration for the production of drinking water: case studies. Desalination, 117(1-3), 181-
188.
CPS Instruments Europe. (2015). Comparison of particle sizing methods.
<http://www.cpsinstruments.eu/pdf/Compare%20Sizing%20Methods.pdf> (Aug. 13,
2015).
Crittenden, J.C., Trussell, R.R., Hand, D.W., Howe, K.J. and Tchobanoglous G. (2012). MWH's
water treatment: principles and design (3ed Ed.). Hoboken, NJ, USA: John Wiley & Sons,
Inc.
Dashtban Kenari, S.L. and Barbeau, B. (2014). Pyrolucite fluidized-bed reactor (PFBR): A robust
and compact process for removing manganese from groundwater. Water Research, 49(1),
475-483.
202
Dashtban Kenari, S.L. and Barbeau, B. (2016a). Size and zeta potential of oxidized iron and
manganese in water treatment: Influence of pH, ionic strength, and hardness. Journal of
Environmental Engineering, 04016010.
Dashtban Kenari, S.L. and Barbeau, B. (2016b). Understanding ultrafiltration fouling of ceramic
and polymeric membranes caused by oxidized iron and manganese in water treatment.
Journal of Membrane Science, 516, 1-12.
Dieckmann, Y., Colfen, H., Hofmann, H., and Petri-Fink, A. (2009). Particle size distribution
measurements of manganese-doped ZnS nanoparticles. Analytical Chemistry, 81(10),
3889-3895.
Dion, L.-A., Bouchard, M.F., Sauvé, S., Barbeau, B., Tucholka, A., Major, P., Gilbert, G., Mergler,
D. and Saint-Amour, D. (2016). MRI pallidal signal in children exposed to manganese in
drinking water. NeuroToxicology, 53, 124-131.
Duan, J., Wang, J., Guo, T. and Gregory, J. (2014). Zeta potentials and sizes of aluminum salt
precipitates – Effect ofanions and organics and implications for coagulation mechanisms.
Journal of Water Process Engineering, 4, 224-232.
Dwivedi, P.N. and Upadhyay, S.N. (1977). Particle-fluid mass transfer in fixed and fluidized beds.
Industrial & Engineering Chemistry Process Design and Development, 16(2), 157-165.
El Araby, R., Hawash, S. and El Diwani, G. (2009). Treatment of iron and manganese in simulated
groundwater via ozone technology. Desalination, 249(3), 1345-1349.
Eley, M. and Nicholson, K. (1993). Chemistry and adsorption-desorption properties of manganese
oxides deposited in Forehill Water Treatment Plant, Grampian, Scotland. Environmental
Geochemistry and Health, 15(2), 85-91.
Elimelech, M., Gregory, J., Jia, X., and Williams, R. (1995). Particle Deposition and Aggregation:
Measurement, Modeling, and Simulation. Woburn, MA, USA: Butterworth-Heinemann.
Ellis, D., Bouchard, C. and Lantagne, G. (2000). Removal of iron and manganese from groundwater
by oxidation and microfiltration. Desalination, 130(3), 255-264.
203
Elzo, D., Huisman, I., Middelink, E. and Gekas, V. (1998). Charge effects on inorganic membrane
performance in a cross-flow microfiltration process. Colloids and Surfaces A:
Physicochemical and Engineering Aspects, 138(2–3), 145-159.
Escobar, I.C., Hoek, E.M., Gabelich, C.J. and DiGiano, F.A. (2005). Committee report: recent
advances and research needs in membranes fouling. Journal of the American Water Works
Association, 97(8), 79-89.
Faibish, R.S., Elimelech, M. and Cohen, Y.K. (1998). Effect of interparticle electrostatic double
layer interactions on permeate flux decline in crossflow membrane filtration of colloidal
suspensions: an experimental investigation. Journal of Colloid and Interface Science,
204(1), 77-86.
Ficek, K.J. and Boll, J.E. (1980). Potassium permanganate: an alternative to prechlorination. Aqua
32(7), 153-156.
French, R.A., Jacobson, A.R., Kim, B., Isley, S.L., Lee Penn, R. and Baveye, P.C. (2009). Influence
of ionic strength, pH, and cation valence on aggregation kinetics of titanium dioxide
nanoparticles. Environmental Science & Technology, 43(5), 1354-1359.
Gao, W., Liang, H., Ma, J., Han, M., Chen, Z.-L., Han, Z.-S. and Li, G.-B. (2011). Membrane
fouling control in ultrafiltration technology for drinking water production: A review.
Desalination, 272(1-3), 1-8.
Genz, A., Kornmuller, A. and Jekel, M. (2004). Advanced phosphorus removal from membrane
filtrates by adsorption on activated aluminum oxide and granulated ferric hydroxide. Water
Research, 38(16), 3523-3530.
Gilbert, B., Lu, G. and Kim, C.S. (2007). Stable cluster formation in aqueous suspensions of iron
oxyhydroxide nanoparticles. Journal of Colloid and Interface Science, 313(1), 152-159.
Gillespie, J.B. and Lindberg, J.D. (1992). Ultraviolet and visible imaginary refractive index of
strongly absorbing atmospheric particulate matter. Applied Optics, 31(12), 2112-2115.
González, A.E., Martinez-López, F., Moncho-Jordá, A. and Hidalgo-Álvarez, R. (2004).
Simulations of colloidal aggregation with short- and medium-range interactions. Physica
A: Statistical Mechanics and its Applications, 333(15), 257-268.

204
Gopal, K., Tripathy, S.S., Bersillon, J.L. and Dubey, S.P. (2007). Chlorination byproducts, their
toxicodynamics and removal from drinking water. Journal of Hazardous Materials, 140(1-
2), 1-6.
Gouzinis, A., Kosmidis, N., Vayenas, D.V. and Lyberatos, G. (1998). Removal of Mn and
simultaneous removal of NH3, Fe and Mn from potable water using a trickling filter. Water
Research, 32(8), 2442-2450.
Gray, S.R., Ritchie, C.B., Tran, T. and Bolto, B.A. (2007). Effect of NOM characteristics and
membrane type on microfiltration performance. Water Research, 41(17), 3833-3841.
Griffin, A.E. (1960). Significance and removal of manganese in water supplies. Journal of the
American Water Works Association, 52(10), 1326-1334.
Gregory, D. and Carlson, K. (2003). Effect of soluble Mn concentration on oxidation kinetics.
Journal of the American Water Works Association, 95(1), 98-108.
Gregory, D. and Carlson, K.H. (2001). Ozonation of dissolved manganese in the presence of natural
organic matter. Ozone: Science & Engineering, 23(2), 149-159.
Guan, J., Waite, T.D. and Amal R. (1998). Rapid structure characterization of bacterial aggregates.
Environmental Science & Technology, 32(23), 3735-3742.
Guo, W., Ngo, H.-H. and Li, J. (2012). A mini-review on membrane fouling. Bioresource
Technology, 122, 27-34.
Han, S.C., Choo, K.H., Choi, S.J. and Benjamin, M.M. (2007). Modeling manganese removal in
chelating polymer-assisted membrane separation systems for water treatment. Journal of
Membrane Science, 290(1-2), 55-61.
Han, S.C., Choo, K.H., Choi, S.J. and Benjamin, M.M. (2005). Removal of manganese from water
using combined chelation-membrane separation systems. Water Science and Technology,
51(6-7), 349-355.
Hargette, A.C. and Knocke, W.R. (2001). Assessment of fate of manganese in oxide-coated
filtration systems. Journal of Environmental Engineering-Asce, 127(12), 1132-1138.
He, X., Yang, H. and He, Y. (2010). Treatment of mine water high in Fe and Mn by modified
manganese sand. Mining Science and Technology (China), 20(4), 571-575.
205
Health Canada. (2010). Guidelines for Canadian Drinking Water Quality-Summary Table.
http://www.dieppe.ca/en/hoteldeville/resources/Canadiandrinkingwaterguidelines.pdf,
(Dec. 23, 2015).
Health Canada. (2014). Guidelines for Canadian drinking water quality-Summary table.
http://www.hc-sc.gc.ca/ewh-semt/alt_formats/pdf/pubs/water-eau/sum_guide-
res_recom/sum_guide-res_recom_2014-10_eng.pdf (Jan. 07, 2017).
Health Canada. (2016). Manganese in drinking water. Federal-Provincial-Territorial Committee on
Drinking Water, Ottawa, ON, Canada (pp. 116).
Healy, T.W., Herring, A.P. and Fuerstenau, D.W. (1966). The effect of crystal structure on the
surface properties of a series of manganese dioxides. Journal of Colloid and Interface
Science, 21(4), 435-444.
Hermia, J. (1982). Constant pressure blocking filtration laws - Application to power-law non-
Newtonian fluids. Transactions of the Institute of Chemical Engineering, 60(3), 183-187.
Hofs, B., Ogier, J., Vries, D., Beerendonk, E.F. and Cornelissen, E.R. (2011). Comparison of
ceramic and polymeric membrane permeability and fouling using surface water. Separation
and Purification Technology, 79(3), 365-374.
Hu, P.-Y., Hsieh, Y.-H., Chen, J.-C. and Chang, C.-Y. (2004). Adsorption of divalent manganese
ion on manganese-coated sand. Journal of Water Supply: Research and Technology-
AQUA, 53(3), 151-158.
Huang, H., Lee, N., Young, T., Gary, A., Lozier, J.C. and Jacangelo, J.G. (2007). Natural organic
matter fouling of low-pressure, hollow fiber membranes: effects of NOM source and
hydrodynamic conditions. Water Research, 41 (17), 3823-3832.
Huang, H., Spinette, R. and O’Melia, C.R. (2008a). Direct-flow microfiltration of aquasols: I.
Impacts of particle stabilities and size. Journal of Membrane Science, 314(1–2), 90-100.
Huang, H., Young, T.A. and Jacangelo, J.G. (2008b). Unified membrane fouling index for low
pressure membrane filtration of natural waters: principles and methodology. Environmental
Science & Technology, 42(3), 714-720.

206
Huisman, I.H., Dutre, B., Persson, K.M. and Tragardh, G. (1997). Water permeability in
ultrafiltration and microfiltration-Viscous and electroviscous effects. Desalination, 113(1),
95-103.
Huisman, I.H., Vellenga, E., Tragardh, G. and Tragardh, C. (1999). The influence of the membrane
zeta potential on the critical flux for crossflow microfiltration of particle suspensions.
Journal of Membrane Science, 156(1), 153-158.
Hwang, K.J. and Hsueh, C.L. (2003). Dynamic analysis of cake properties in microfiltration of soft
colloids. Journal of Membrane Science, 214(2), 259-273.
Islam, A.A., Goodwill, J.E., Bouchard, R., Tobiason , J.E. and Knocke, W.R. (2010).
Characterization of filter media MnOx(s) Surfaces and Mn removal capabilit. Journal of the
American Water Works Association, 102(9), 71-83.
Ito, Y., Inaba, M., Chung, D.J. and Imanishi, Y. (1992). Control of water permeation by pH and
ionic strength through a porous membrane having poly(carboxylic acid) surface-grafted.
Macromolecules, 25(26), 7313-7316.
Jefferson, B. and Jarvis, P.R. (2006). Practical application of fractal dimension. In: G. Newcombe
and D. Dixon (Eds.), Interface Science in Drinking Water Treatment, Theory and
Applications (pp. 45-61). Amsterdam, The Netherlands: Elsevier Ltd.
Jacobsen, F., Holcman, J. and Sehested, K. (1998). Oxidation of manganese(II) by ozone and
reduction of manganese(III) by hydrogen peroxide in acidic solution. International Journal
of Chemical Kinetics, 30(3), 207-214.
Kaiya, Y., Itoh, Y., Fujita, K. and Takizawa, S. (1996). Study on fouling materials in the membrane
treatment process for potable water. Desalination, 106(1-3), 71-77.
Kallay, N. and Zalac, S. (2002). Stability of nanodispersions: a model for kinetics of aggregation
of nanoparticles. Journal of Colloid Interface Science, 253(1), 70-76.
Karri, R. and Knowlton, T.M. (1999). Gas distributor and plenum design in fluidized beds. In: W.C.
Yang (Ed.), Fluidization, Solids Handling and Processing: Industrial Applications (pp.
209-235). New Jersey, USA: Noyes.
207
Katsoufidou, K., Yiantsios, S.G. and Karabelas, A.J. (2005). A study of ultrafiltration membrane
fouling by humic acids and flux recovery by backwashing: experiments and modeling.
Journal of Membrane Science, 266(1-2), 40-50.
Kawakatsu, T., Nakao, S. and Kimura, S. (1993). Effects of size and compressibility of suspended
particles and surface pore size of membrane on flux in crossflow filtration. Journal of
Membrane Science, 81(1-2), 173-190.
Kaya, N., Karadurmus, E. and Alicilar, A. (2005). Catalytic air oxidation of manganese in synthetic
waters. Central European Journal of Chemistry, 3(3), 511-519.
Knocke, W.R., Occiano, S. and Hungate, R. (1990a). Removal of soluble manganese from water
by oxide-coated filter media. American Water Works Association Research Foundation
(AWWARF), Denver, CO, USA.
Knocke, W.R., Van Benschoten, J.E., Kearney, M., Soborski, A. and Foundation, A.R. (1990b).
Alternative oxidants for the removal of soluble iron and manganese. American Water
Works Association Research Foundation (AWWARF), Denver, CO, USA.
Knocke, W.R., Van Benschoten, J.E., Kearney, M.J., Soborski, A.W. and Reckhow, D.A. (1991).
Kinetics of manganese and iron oxidation by potassium-permanganate and chlorine
dioxide. Journal of the American Water Works Association, 83(6), 80-87.
Knocke, W.R., Zuravnsky, L., Little, J.C. and Tobiason , J.E. (2010). Adsorptive contactors for
removal of soluble manganese during drinking water treatment. Journal of the American
Water Works Association, 102(8), 64-75.
Kontturi, K., Mafe, S., Manzanares, J.A., Svarfvar, B.L. and Viinikka, P. (1996). Modeling of the
salt and ph effects on the permeability of grafted porous membranes. Macromolecules,
29(17), 5740-5746.
Kosmulski, M. (2009). Compilation of PZC and IEP of sparingly soluble metal oxides and
hydroxides. Advanced in Colloid and Interface Science, 152(1-2), 14-25.
Krawczyk, H. and Jonsson, A.S. (2014). The influence of feed flow channel diameter on frictional
pressure drop, membrane performance and process cost in full-scale tubular ceramic
membranes. Chemical Engineering Research and Design, 92(1), 174-180.
208
Kunii, D. and Levenspiel, O. (1991). Fluidization Engineering. Boston, MA, USA: Butterworth-
Heinemann.
Lee, E.K., Chen, V. and Fane, A.G. (2008). Natural organic matter (NOM) fouling in low pressure
membrane filtration - effect of membranes and operation modes. Desalination, 218(1-3),
257-270.
Lee, S.A., Fane, A.G., Amal, R. and Waite, T.D. (2003). The effect of floc size and structure on
specific cake resistance and compressibility in dead-end microfiltration. Separation Science
and Technology, 38(4), 869-887.
Lee, S.-J. and Kim, J.-H. (2014). Differential natural organic matter fouling of ceramic versus
polymeric ultrafiltration membranes. Water Research, 48(1), 43-51.
Lee, S.M., Tiwari, D., Choi, K.M., Yang, J.K., Chang, Y.Y. and Lee, H.D. (2009). Removal of
Mn(ii) from aqueous solutions using manganese-coated sand samples. Journal of Chemical
and Engineering Data, 54(6), 1823-1828.
Lee, C.I., Yang, W.F. and Hsieh, C.I. (2004). Removal of copper (II) by manganese-coated sand in
a liquid fluidized-bed reactor. Journal of Hazardous Materials, 114(1-3), 45-51.
Li, L., Wray, H.E., Andrews, R.C. and Bérubé, P.R. (2014). Ultrafiltration fouling: Impact of
backwash frequency and air sparging. Separation Science and Technology, 49(18), 2814-
2823.
Lim, A.L. and Bai, R. (2003). Membrane fouling and cleaning in microfiltration of activated sludge
wastewater. Journal of Membrane Science, 216(1–2), 279-290.
Logager, T., Holcman, J., Sehested, K. and Pedersenf, T. (1992). Oxidation of ferrous Ions by
ozone in acidic solutions. Inorganic Chemistry, 31(17), 3523-3529.
Madaeni, S.S. (2001). The effect of large particles on microfiltration of small particles. Journal of
Porous Materials, 8(2), 143-148.
Malvern Instruments Ltd. (1997). Sample dispersion and refractive index guide.
<http://www.atomikateknik.com/pdf/Sample%20Dispersion%20&%20RI%20Guide.pdf>
(Apr. 12, 2015).

209
Manttari, M., Pihlajamaki, A. and Nystrom, M. (2006). Effect of pH on hydrophilicity and charge
and their effect on the filtration efficiency of NF membranes at different pH. Journal of
Membrane Science, 280(1-2), 311-320.
Mastersizer 3000 user manual. (2011). Worcestershire, UK: Malvern Instruments Ltd.
Minnesota Department of Health (MDH). (2012). Health based guidance for groundwater.
Manganese. Minnesota Department of Health.
Merkle, P.B., Knocke, W., Gallagher, D., Junta-Rosso, J. and Solberg, T. (1996). Characterizing
filter media mineral coatings. Journal of the American Water Works Association, 88(12),
62-73.
Merkle, P.B., Knocke, W.R., Gallagher, D.L. and Little, J.C. (1997). Dynamic model for soluble
Mn2+ removal by oxide-coated filter media. Journal of Environmental Engineering-Asce,
123(7), 650-658.
Ministère du développement durable de l’environnement et lutte contre les changements
climatiques (MDDELCC). (2016). Règlement sur la qualité de l'eau potable. Loi sur la
qualité de l'environnement.
Montgomery Watson Harza (MWH). (2005). Water treatment: principles and design (2ed Ed.).
Hoboken, NJ, USA: John Wiley and Sons, Inc.
Morgan, J.J. and Stumm, W. (1964). Colloid-chemical properties of manganese dioxide. Journal
of Colloid Science, 19(4), 347-359.
Morgan, J.J. and Stumm, W. (1965). The role of multivalent metal oxides in limnological
transformations as exemplified by iron and manganese. In: O. Jaag (Ed.), Proceedings
Second Water Pollusion Reasearch Conference (pp. 103-131). New York, NY, USA:
Pergamon Press, Inc.
Muthukumaran, S. and Baskaran, K. (2014). Comparison of the performance of ceramic
microfiltration and ultrafiltration membranes in the reclamation and reuse of secondary
wastewater. Desalination and Water Treatment, 52(4-6), 670-677.

210
Nielsen, P.B., Christensen, T.C. and Vendrup, M. (1997). Continuous removal of heavy metals
from FGD wastewater in a fluidised bed without sludge generation. Water Science and
Technology, 36(2-3), 391-397.
Nilsson, M., Trägårdh, G. and Östergren, K. (2008). The influence of pH, salt and temperature on
nanofiltration performance. Journal of Membrane Science, 312(1-2), 97-106.
Ning, R.Y. (2009). Colloidal Iron and Manganese in Water Affecting RO Operation. Desalination
and Water Treatment, 12(1-3), 162-168.
Orts-Gil, G., Natte, K., Drescher, D., Bresch, H., Mantion, A., Kneipp, J. and Osterle, W. (2011).
Characterisation of silica nanoparticles prior to in vitro studies: From primary particles to
agglomerates. Journal of Nanoparticle Research, 13(4), 1593-1604.
Oulhote, Y., Mergler, D., Barbeau, B., Bellinger, D., Bouffard, T., Brodeur, M.E., Saint-Amour,
D., Legrand, M., Sauvé, S. and Bouchard, M. (2014). Neurobehavioral function in school-
age children exposed to manganese in drinking water. International Journal of
Epidemiology, 122(12), 1343-1350.
Pantina, J.P. and Furst, E.M. (2006). Colloidal aggregate micromechanics in the presence of
divalent ions. Langmuir, 22(12), 5282-5288.
Pell, M. (1990). Gas Fluidization. Amsterdam, The Netherlands: Elsevier Ltd.
Pendergast, M.M. and Hoek, E.M.V. (2011). A review of water treatment membrane
nanotechnologies. Energy & Environmental Science, 4, 1946-1971.
Phatai, P., Wittayakun, J., Grisdanurak, N., Chen, W.H., Wan, M.W. and Kan, C.C. (2010).
Removal of manganese ions from synthetic groundwater by oxidation using KMnO4 and
the characterization of produced MnO2 particles. Water Science and Technology, 62(8),
1719-1726.
Piispanen, J.K. and Sallanko, J.T. (2010). Mn(II) removal from groundwater with manganese
oxide-coated filter media. Journal of Environmental Science and Health, Part A:
Toxic/Hazardous Substances and Environmental Engineering, 45(13), 1732-1740.
Post, J.E. (1999). Manganese oxide minerals: Crystal structures and economic and environmental
significance. Proceedings of the National Academy of Sciences, 96(7), 3447-3454.
211
Potgieter, J.H., Mccrindle, R.I., Sihlali, Z., Schwarzer, R. and Basson, N. (2005). Removal of iron
and manganese from water with a high organic carbon loading. Part I- The effect of various
coagulants. Water Air and Soil Pollution, 162(1-4), 49-59.
Prasad, T.D. and Danso-Amoako, E. (2014). Influence of chemical and biological parameters on
iron and manganese accumulation in water distribution networks. Procedia Engineering,
70, 1353-1361.
Ramachandra Rao, R., Roopa, H.N. and Kannan, T.S. (1999). Effect of pH on the dispersability of
silicon carbide powders in aqueous media. Ceramic International, 25(3), 223-230.
Reckhow, D.A., Knocke, W.R., Kearney, M.J. and Parks, C.A. (1991). Oxidation of iron and
manganese by ozone. Ozone: Science and Engineering, 13(6), 675-695
Reisz, E., Leitzke, A., Jarocki, A., Irmscher, R. and von Sonntag, C. (2008). Permanganate
formation in the reactions of ozone with Mn(II): A mechanistic study. Journal of Water
Supply: Research and Technology-AQUA, 57(6), 451-464.
Ren, Y.X., Yan, N., Wen, Q., Fan, Z., Wei, T., Zhang, M. and Ma, J. (2011). Graphene/δ-MnO2
composite as adsorbent for the removal of nickel ions from wastewater. Chemical
Engineering Journal, 175, 1-7.
Richards, L.A., Richards, B.S. and Schäfer, A.I. (2011). Renewable energy powered membrane
technology: Salt and inorganic contaminant removal by nanofiltration/reverse osmosis.
Journal of Membrane Science, 369(1-2), 188-195.
Roccaro, P., Barone, C., Mancini, G. and Vagliasindi, F.G.A. (2007). Removal of manganese from
water supplies intended for human consumption: a case study. Desalination, 210(1-3), 205-
214.
Rudolfs, W. and Balmat, J.L. (1952 ). Colloids in sewage: I. separation of sewage colloids with the
aid of the electron microscope. Water Environment Federation, 24(3), 247-256.
Safari, S., Sheikhi, A., and van de Ven, T.G.M. (2014). Electroacoustic characterization of
conventional and electrosterically stabilized nanocrystalline celluloses. Journal of Colloid
Interface Science, 432(15), 151-157.

212
Sallanko, J., Lakso, E. and Lehmikangas, M. (2005). The effect of ozonation on the size fractions
of manganese. Ozone: Science and Engineering, 27(2), 147-152.
Santiwong, S.R., Guan, J. and Waite, T.D. (2008). Effect of ionic strength and pH on hydraulic
properties and structure of accumulating solid assemblages during microfiltration of
montmorillonite suspensions. Journal of Colloid and Interface Science, 317(1), 214-227.
Schneider, C., Johns, P. and Huehmer, R.P. (2001). Removal of manganese by microfiltration in a
water treatment plant. Proceedings of the 2001 Membrane Technology Conference, San
Antonio, Texas, USA: AWWA & IWA.
Shao, J., Hou, J. and Song, H. (2011). Comparison of humic acid rejection and flux decline during
filtration with negatively charged and uncharged ultrafiltration membranes. Water
Research, 45(2), 473-482.
Sharma, S.K., Greetham, M.R. and Schippers, J.C. (1999). Adsorption of iron(ii) onto filter media.
Journal of Water Supply: Research and Technology-AQUA, 48(3), 84-91.
Sherman, D. M. and Waite, T. D. (1985). Electronic spectra of Fe3+ oxides and oxide hydroxides
in the near IR to near UV. American Mineralogist, 70(11-12), 1262-1269.
Shirazi, S. Lin, C.J. and Chen D. (2010). Inorganic fouling of pressure-driven membrane processes-
A critical review. Desalination, 250(1), 236-248.
Singh, G. and Song, L. (2006). Cake compressibility of silica colloids in membrane filtration
processes. Industrial & Engineering Chemistry Research, 45(22), 7633-7638.
Sly, L.I., Hodgkinson, M.C. and Arunpairojana, V. (1990). Deposition of manganese in a drinking
water distribution system. Applied and Environmental Microbiology, 56(3), 628-639.
Sommerfeld, E.O. (1999). Iron and manganese removal handbook. Denver, CO, USA: American
Water Works Association.
Sorensen, C.M. (2001). Light scattering by fractal aggregates: A review. Aerosol Science and
Technology, 35(2), 648-687.
Sorensen, B.L. and Sorensen, P.B. (1997). Applying cake filtration theory on membrane filtration
data. Water Research, 31(3), 665-670.

213
Subramaniam, A. (2010). A pilot-scale evaluation of soluble manganese removal using pyrolucite
media in a high-rate adsorptive contactor. Virginia Polytechnic Institute and State
University, Blacksburg, VA.
Sung, B.W., Chu, K.H., Yun, S.L., Ahn, J.Y., Lee, J.H., Yoo, S.S., Lee, J.W. and Ko, K.B. (2015).
Removal of iron and manganese ions from abandoned neutral or alkaline mine drainage via
ozone oxidation and micro-sand filtration: a pilot-scale operation. Desalination and Water
Treatment, 53(9), 2354-2362.
Takizawa, S., Fu, L., Pradhan, N., Ike, T., Ohtaki, M. and Ohgaki, S. (2001). Pretreatment processes
for membrane filtration of raw water containing manganese. Water Science and
Technology: Water Supply, 1(5-6), 341-348.
Tang, S., Preece, J.M., McFarlane, C.M. and Zhang, Z. (2000). Fractal morphology and breakage
of DLCA and RLCA aggregates. Journal of Colloid and Interface Science, 221(1), 114-123.
Teng, Z., Huang, J.Y., Fujita, K. and Takizawa, S. (2001). Manganese removal by hollow fiber
micro-filter. Membrane separation for drinking water. Desalination, 139(1-3), 411-418.
Theis, T.L. and Singer, P.C. (1974). Complexation of iron(II) by organic matter and its effect on
iron(II) oxygenation. Environmental Science & Technology, 8(6), 569-573.
Tiller, F.M., Yeh, C.S. and Leu, W.F. (1987). Compressibility of paniculate structures in relation
to thickening, filtration, and expression-A review. Separation Science and Technology,
22(2-3), 1037-1063.
Tiwari, D., Yu, M.R., Kim, M.N., Lee, S.M., Kwon, O.H., Choi, K.M., Lim, G.J. and Yang, J.K.
(2007). Potential application of manganese coated sand in the removal of Mn(II) from
aqueous solutions. Water Science and Technology, 56(7), 153-160.
Trudinger, P.A. (1979). Biogeochemical cycling of mineral forming elements. Amsterdam, The
Netherlands: Elsevier Ltd.
Tobiason, J.E., Bazilio, A., Goodwill, J., Mai, X. and Nguyen, C. (2016). Manganese Removal
from Drinking Water Sources. Current Pollution Reports, 2(3), 168-177.

214
Tobiason, J.E., Islam, A.A., Knocke, W.R., Goodwill, J., Hargette, P., Bouchard, R. and Zuravnsky,
L. (2008). Characterization and performance of filter media for manganese control. Denver,
CO, USA: American Water Works Association Research Foundation.
Tuschl, K., Mills, P.B. and Clayton, P.T. (2013). Manganese and the brain. International Review
of Neurobiology, 110, 277-312.
United States Environmental Protection Agency (USEPA). (2000). Control of Gaseous Emissions
(3ed Ed.). Air Pollution Training Institute (APTI) (pp. 341).
United States Environmental Protection Agency (USEPA). (2004). Drinking water health advisory
for manganese. Office of Water (4304T). Health and Ecological Criteria Division,
Washington, DC, USA (pp. 55).
United States Environmental Protection Agency (USEPA). (2005). Membrane filtration guidance
manual. Office of Water (4601), Washington, DC, USA (pp. 332).
Van benschoten, J.E., Wei, L. and Knocke, W.R. (1992) Kinetic modeling of manganese(ii)
oxidation by chlorine dioxide and potassium-permanganate. Environmental Science &
Technology 26(7), 1327-1333.
Van Der Bruggen, B., Vandecasteele, C., Van Gestel, T., Doyen, W. and Leysen, R. (2003). A
review of pressure-driven membrane processes in wastewater treatment and drinking water
production. Environmental Progress, 22(1), 46-56.
van Wendel de Joode, B., Barbeau, B., Bouchard, M.F., Mora, A.M., Skytt, Å., Córdoba, L.,
Quesada, R., Lundh, T., Lindh, C.H. and Mergler, D. (2016). Manganese concentrations in
drinking water from villages near banana plantations with aerial mancozeb spraying in
Costa Rica: Results from the Infants' Environmental Health Study (ISA). Environmental
Pollution, 215, 247-257.
Vane, L. M., and Zang, G. M. (1997). Effect of aqueous phase properties on clay particle zeta
potential and electro-osmotic permeability: implications for electrokinetic soil remediation
processes. Journal of Hazardous Materials, 55(1-3), 1-22.
Vela, M.C.V., Blanco, S.A., García, J.L. and Rodríguez, E.B. (2008). Analysis of membrane pore
blocking models applied to the ultrafiltration of PEG. Separation and Purification
Technology, 62(3), 491-500.

215
Vercellotti, J.M. (1988). Kinetics of iron removal using potassium permanganate and ozone. Ohio
University, Athens, OH.
Wasserman, G.A., Liu, X.H., Parvez, F., Ahsan, H., Levy, D., Factor-Litvak, P., Kline, J., van
Geen, A., Slavkovich, V., Lolacono, N.J., Cheng, Z.Q., Zheng, Y. and Graziano, J.H.
(2006). Water manganese exposure and children's intellectual function in Araihazar,
Bangladesh. Environmental Health Perspectives, 114(1), 124-129.
Weiner, B. (1992). Twenty seven years of QELS: a review of the advantages and disadvantages of
particle sizing with QELS. In: N.G. Stanley-Wood and R.W. Lines (Eds.), Particle Size
Analysis (pp. 173-185). Cambridge, UK: Royal Society of Chemistry.
Werther, J. (1978). Effect of gas distributor on the hydrodynamics of gas fluidized beds. German
Chemical Engineering 1, 166-173.
Wong, J.M. (1984). Chlorination-filtration for iron and manganese removal. Journal of the
American Water Resources Association, 76(1), 76-79.
World Health Organization (WHO). (2008). Guidelines for drinking water-quality. Third Edition
incorporating the First and Second addenda Edition. Recommendations. Geneva,
Switzerland (pp. 668).
World Health Organization (WHO). (2003). Iron in drinking water. Geneva, Switzerland (pp. 9).
Xu, R. (2000). Particle Characterization: Light Scattering Methods. Dordrecht, The Netherlands:
Kluwer Academic Publishers.
Xu, W., Gao, B., Mao, R. and Yue, Q. (2011). Influence of floc size and structure on membrane
fouling in coagulation–ultrafiltration hybrid process-The role of Al13 species. Journal of
Hazardous Materials, 193, 249-256.
Yang, K., Xue, Y., He, J. and Yange, X. (2008). Case study: reducing manganese (Mn++) level in
surface water with natural manganese-coated sand in sinopec Shanghai ltd. Journal of Water
Supply: Research and Technology-AQUA, 57(3), 185-194.
Zhang, Y., Chen, Y.S., Westerhoff, P. and Crittenden, J. (2009). Impact of natural organic matter
and divalent cations on the stability of aqueous nanoparticles. Water Research, 43(17),
4249-4257.
216
Zhang, Y.P., Fane, A.G. and Law, A.W.K. (2010). Critical flux and particle deposition of fractal
flocs during crossflow microfiltration. Journal of Membrane Science, 353(1-2), 28-35.
Zhao, C., Nie, S., Tang, M. and Sun, S. (2011). Polymeric pH-sensitive membranes-A review.
Progress in Polymer Science, 36(11), 1499-1520.
Zhao, Y., Xing, W., Xu, N. and Wong, F.S. (2005). Effects of inorganic salt on ceramic membrane
microfiltration of titanium dioxide suspension. Journal of Membrane Science, 254(1-2), 81-
88.
Zhao, Y., Zhang, Y., Xing, W. and Xu, N. (2005). Influences of pH and ionic strength on ceramic
microfiltration of TiO2 suspensions. Desalination, 177(1-3), 59-68.
Zogo, D., Bawa, L.M., Soclo, H.H. and Atchekpe, D. (2011). Influence of pre-oxidation with
potassium permanganate on the efficiency of iron and manganese removal from surface
water. Journal of Environmental Chemistry and Ecotoxicology, 3(1), 1-8.
Zularisam, A.W., Ismail, A.F. and Salim, R. (2006). Behaviours of natural organic matter in
membrane filtration for surface water treatment-A review. Desalination, 194(1-3), 211-
231.
Zuo, G. and Wang, R. (2013). Novel membrane surface modification to enhance anti-oil fouling
property for membrane distillation application. Journal of Membrane Science 447, 26-35.
Zuravnsky, L. (2006). Development of soluble manganese sorptive contactors for enhancing
potable water treatment practices. Virginia Polytechnic Institute and State University,
Blacksburg, VA.
Zydney, A.L. and Pujar, N.S. (1998). Protein transport through porous membranes-effects of
colloidal interactions. Colloids and Surfaces a-Physicochemical and Engineering Aspects,
138(2-3), 133-143.