impact of age of the company on performance of initial
TRANSCRIPT

Impact of age of the company on Performance of Initial Public
Offering (IPOs) in India
Dr. Srinivasa Rao Dokku
Assistant Professor,
Department of Business Administration, P.V.P. Siddhartha Institute of Technology,
Kanuru, Vijayawada Andhra Pradesh, India, 520 007.
Email: [email protected].
Dr. Rajesh C. Jampala
Professor& Head,
Department of Commerce and Business Administration,
P.B. Siddhartha College of Arts & Science, Vijayawada
Andhra Pradesh, India, 520 010., Email: [email protected].
Dr. P. Adi Lakshmi
Professor & Head,
Department of Business Administration, P.V.P. Siddhartha Institute of Technology,
Kanuru, Vijayawada, Andhra Pradesh, India, 520 007.
Email: [email protected].
Abstract:
Age could actually help firms become more efficient. Over time, firms discover what they are
good at and learn how to do things better. They specialize and find ways to standardize,
coordinate, and speed up their production processes, as well as to reduce costs and improve
quality. The previous findings of various researchers suggest that, there is significant relation
between age of the firm and aftermarket performance. This paper focuses on the evaluation of
price performance of IPOs up to a period of 36 months including the listing day. In this paper the
main emphasis is on the study of age of the company on after market performance of the selected
IPOs in short-run and as well as long-run. The paper presents fresh evidence on IPO
performance, i.e., short-run underpricing and long-run underperformance for 146 Indian IPOs
issued during the period 2007-2008.
Key words: Age, Returns, IPOs, Short-run, and Long-run
1. Introduction:
The age of the company could actually help firms become more efficient. Over time, firms
discover what they are good at and learn how to do things better They specialize and find ways
to standardize, coordinate, and speed up their production processes, as well as to reduce costs
and improve quality (Ericson and Pakes, 1995). Age of the firm defined in terms of years, is
Parishodh Journal
Volume IX, Issue I, January/2020
ISSN NO:2347-6648
Page No:946
one of the most popular proxies on company characteristics. High rank investment banks
generally choose companies with a longer operational history. Age of the IPO firm signals the
level of maturity of the company. In this study, age has been measured by the difference between
the date of incorporation and the date at which the company goes public.
A Shokand (2013), edited volume on “Long term performance of Indian IPOs” analyzed the
impact of firm age and its performance in stock market. Firm age at the time of IPO was
computed from the date of incorporation to the date of IPO, varied from less than one year to
over 98 years. Age of the firm is also one of the most important factors which affect the
performance of IPOs in long-term period. It is generally believed that there is a strong
relationship between the age and the long-run performance of IPOs. IPOs of companies, having
the age more than 50 years but less than or equal to 60 years were showing highest returns up to
the end of three months as compared to all other groups. These results were found to be
statistically significant at five percent level. Thereafter, IPOs having the age group above 60
years were indicating the maximum returns up to the end of the third year as compared to other
groups and the results were also found to be statistically significant at five percent level. The
study also highlighted the fact that returns of the group having age less than 10 years and age
group having age more than 10 years but less than or equal to 20 years were also showing
positive returns and most of their results were statistically significant at one percent level.
The age of the company is supposed to have an impact on the level of the underpricing after
initial public offering. First of all, companies of recent origin present a bigger uncertainty ex-ante
when compared to the established companies. It is due to the fact that the young companies may
be less followed by financial analysists because they may not have enough published historical
financial data. Second, the availability of the information about companies operating for several
years, contributes to reduce the asymmetry of information during the listing period
(Hensler(1997)). This uncertainty, as for the future prospects of the company, will be translated
by an increase of the underpricing(Bilson (2003)).
Ritter finds a positive monotone relationship between firm age and IPO aftermarket
performance, with the oldest category of firms (over 20 years) showing positive abnormal
Parishodh Journal
Volume IX, Issue I, January/2020
ISSN NO:2347-6648
Page No:947
returns. David T. Clark (2002) also finds common stock initial public offerings- In the
aggregate; the data shows a statistically significant correlation between firm age-at-IPO and post-
IPO excess returns. However, when the firms were disaggregated into technology and non-
technology panels, the data suggested that the relationship between age and returns is different
between the two categories. Among technology enterprises, very young firms outperformed
older firms, though the difference in return between the two age groups did not rise to a high
level of statistical significance. Their study also offers the alternative idea that the market may
have underestimated the unusually strong prospects of this group of young technology IPOs
relative to older technology firms. Non-technology firms, on the other hand, exhibited a positive
monotone correlation between firm age and excess holding period returns. A regression
confirmed this positive relationship, established at a high degree of statistical significance. The
average age of a firm going public during the 1990s was the lowest the market has witnessed
since the economic reforms in India. With a mean time from incorporation to public offering of
roughly ten years, the average 1990’s IPO was about one-third as old as a typical mid-20th
century IPO. According to Jovanovic and Roussea study in an efficient market, the aftermarket
price of an IPO will almost immediately reflect the growth potential of the firm, based on all
available information. Average risk-adjusted returns going forward should match the market,
regardless of the age-at-IPO of a firm.
This study examines the relationship between the age of firm at the time of IPO and long-run
aftermarket performance. In effect, the study will test the efficiency of the market with regard to
the IPO’s during the 2007 and 2008 period by measuring three-year holding period excess stock
returns relative to firm age-at-IPO.
2. Methodology and Sample
The study is an evaluation work on the impact of age of the firm on performance of IPOs in
India. In the early periods of financial reforms, especially since 1991 there were hardly any
restrictions on companies to go public and fixing premium. However, companies are expected to
provide justification in fixing premium on all their public issues. The sample consists of 146
Parishodh Journal
Volume IX, Issue I, January/2020
ISSN NO:2347-6648
Page No:948
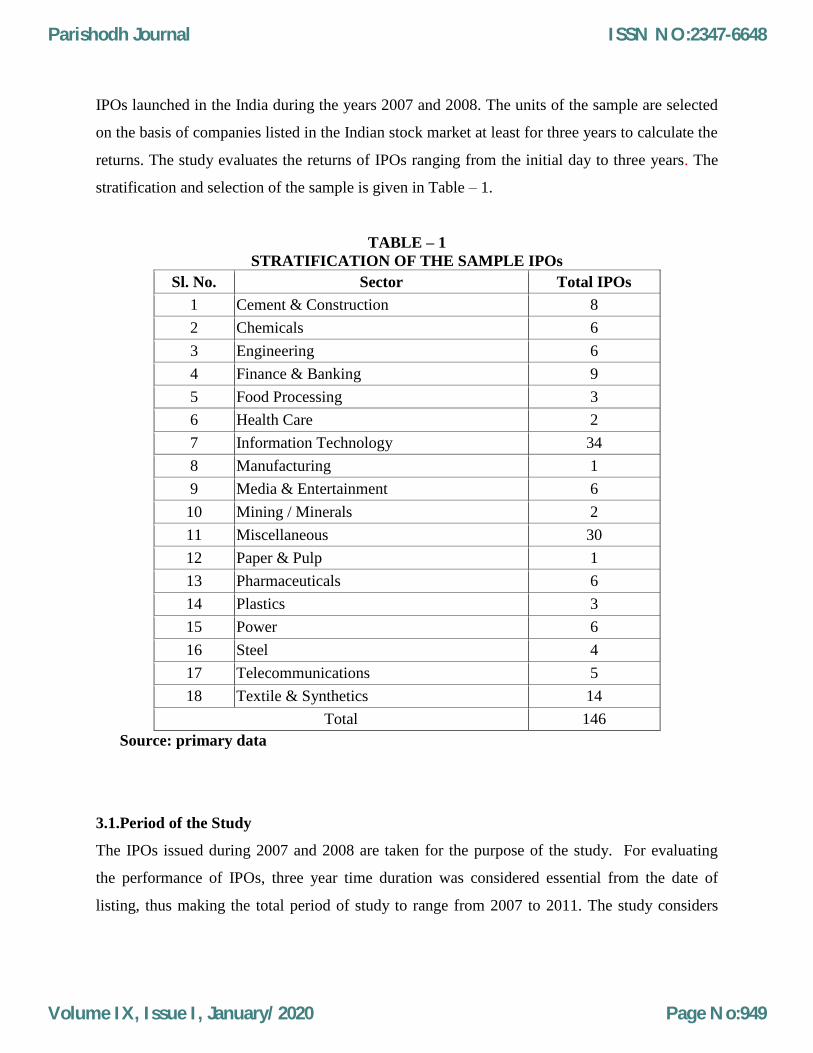
IPOs launched in the India during the years 2007 and 2008. The units of the sample are selected
on the basis of companies listed in the Indian stock market at least for three years to calculate the
returns. The study evaluates the returns of IPOs ranging from the initial day to three years. The
stratification and selection of the sample is given in Table – 1.
TABLE – 1
STRATIFICATION OF THE SAMPLE IPOs
Sl. No. Sector Total IPOs
1 Cement & Construction 8
2 Chemicals 6
3 Engineering 6
4 Finance & Banking 9
5 Food Processing 3
6 Health Care 2
7 Information Technology 34
8 Manufacturing 1
9 Media & Entertainment 6
10 Mining / Minerals 2
11 Miscellaneous 30
12 Paper & Pulp 1
13 Pharmaceuticals 6
14 Plastics 3
15 Power 6
16 Steel 4
17 Telecommunications 5
18 Textile & Synthetics 14
Total 146
Source: primary data
3.1.Period of the Study
The IPOs issued during 2007 and 2008 are taken for the purpose of the study. For evaluating
the performance of IPOs, three year time duration was considered essential from the date of
listing, thus making the total period of study to range from 2007 to 2011. The study considers
Parishodh Journal
Volume IX, Issue I, January/2020
ISSN NO:2347-6648
Page No:949
age of the company at the time of listing and returns at initial day, one month, one year, two
years and three year. The study identifies short-run as well as long-run performance.
3.2.Sources of Data
The sample used in this study consists of all Indian IPOs issued by firms which went public from
January 2007 to December, 2008. The prospectuses issued by firms were considered to collect
data prior to the listing which includes the offer price, issue details, dates of public issue, issue
amount, age of the firm, and financial information from balance sheets and income statements.
Moreover, the SEBI Fact book, an annual publication issued by the SEBI to disseminate
information to investors, is used to collect information on the main market indicators as well as
information pertaining to public issues. In addition, regular price histories were collected for
each sample firm through the period 2007-2013. The stock quotations were collected primarily
from moneycontrol.com, bseindia.com, yahoofinance.com and other relevant company websites
for analysis purpose.
Data analysis and interpretation
4. Descriptive Statistics of the sample companies
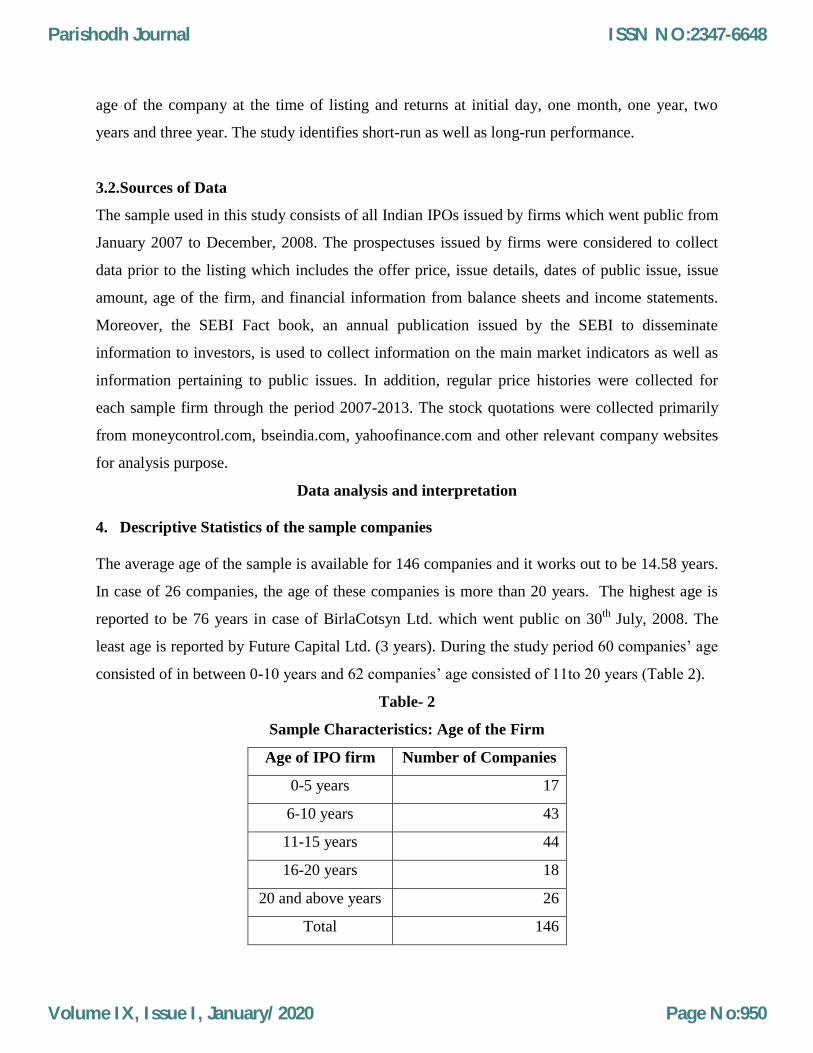
The average age of the sample is available for 146 companies and it works out to be 14.58 years.
In case of 26 companies, the age of these companies is more than 20 years. The highest age is
reported to be 76 years in case of BirlaCotsyn Ltd. which went public on 30th
July, 2008. The
least age is reported by Future Capital Ltd. (3 years). During the study period 60 companies’ age
consisted of in between 0-10 years and 62 companies’ age consisted of 11to 20 years (Table 2).
Table- 2
Sample Characteristics: Age of the Firm
Age of IPO firm Number of Companies
0-5 years 17
6-10 years 43
11-15 years 44
16-20 years 18
20 and above years 26
Total 146
Parishodh Journal
Volume IX, Issue I, January/2020
ISSN NO:2347-6648
Page No:950
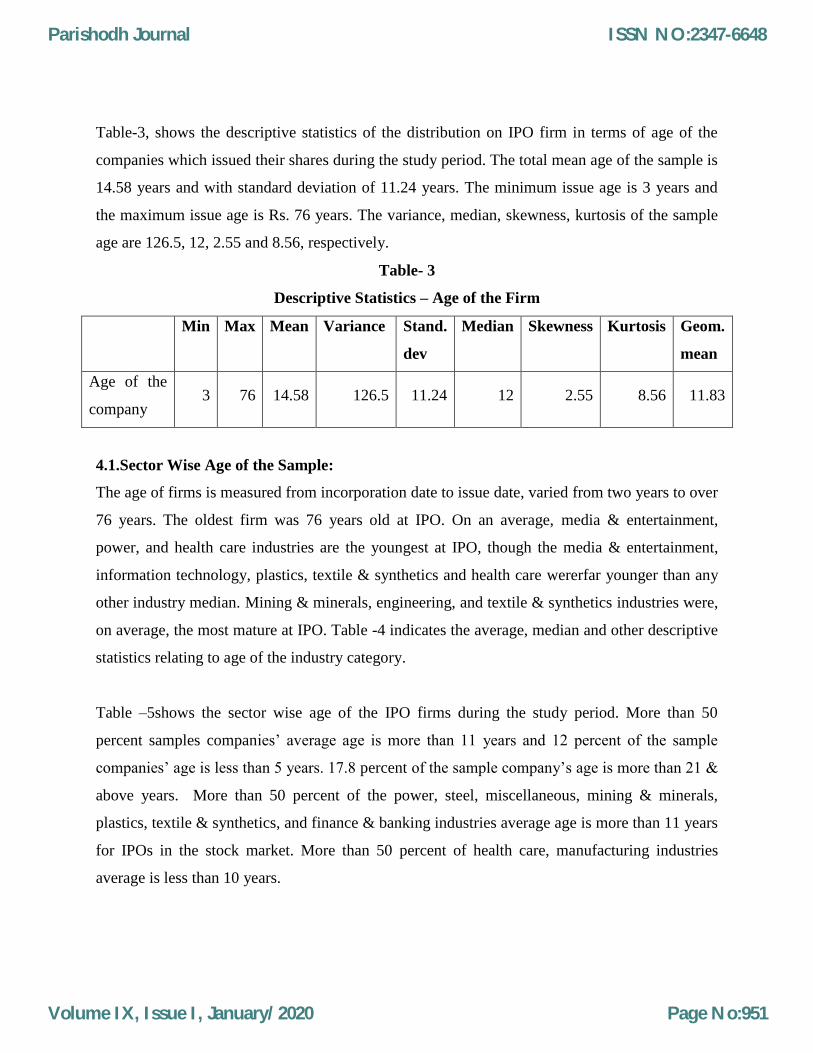
Table-3, shows the descriptive statistics of the distribution on IPO firm in terms of age of the
companies which issued their shares during the study period. The total mean age of the sample is
14.58 years and with standard deviation of 11.24 years. The minimum issue age is 3 years and
the maximum issue age is Rs. 76 years. The variance, median, skewness, kurtosis of the sample
age are 126.5, 12, 2.55 and 8.56, respectively.
Table- 3
Descriptive Statistics – Age of the Firm
Min Max Mean Variance Stand.
dev
Median Skewness Kurtosis Geom.
mean
Age of the
company 3 76 14.58 126.5 11.24 12 2.55 8.56 11.83
4.1.Sector Wise Age of the Sample:
The age of firms is measured from incorporation date to issue date, varied from two years to over
76 years. The oldest firm was 76 years old at IPO. On an average, media & entertainment,
power, and health care industries are the youngest at IPO, though the media & entertainment,
information technology, plastics, textile & synthetics and health care wererfar younger than any
other industry median. Mining & minerals, engineering, and textile & synthetics industries were,
on average, the most mature at IPO. Table -4 indicates the average, median and other descriptive
statistics relating to age of the industry category.
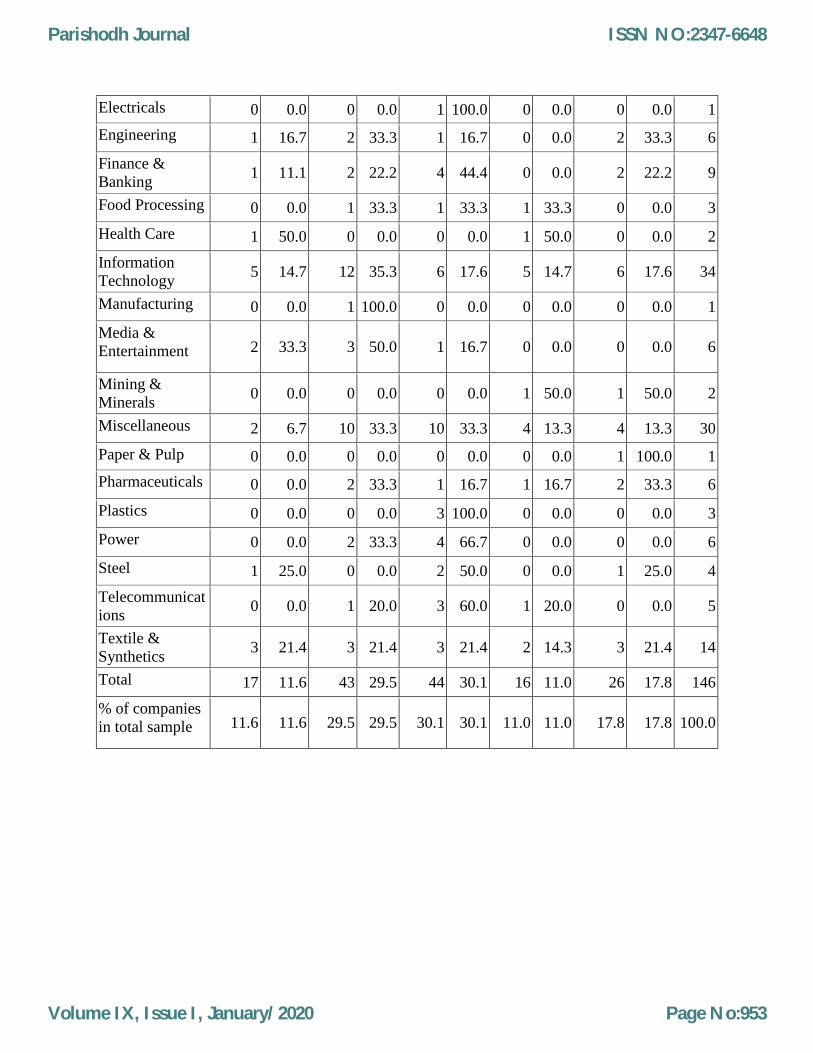
Table –5shows the sector wise age of the IPO firms during the study period. More than 50
percent samples companies’ average age is more than 11 years and 12 percent of the sample
companies’ age is less than 5 years. 17.8 percent of the sample company’s age is more than 21 &
above years. More than 50 percent of the power, steel, miscellaneous, mining & minerals,
plastics, textile & synthetics, and finance & banking industries average age is more than 11 years
for IPOs in the stock market. More than 50 percent of health care, manufacturing industries
average is less than 10 years.
Parishodh Journal
Volume IX, Issue I, January/2020
ISSN NO:2347-6648
Page No:951

Table- 4
Age Data by Industry (in Years)
Industry Total Min Max Mean Variance Stand.
dev Median Skewness Kurtosis
Geom.
mean
Cement &
Construction 8 8 23 12.75 38.5 6.20 10.5 1.21 -.28 11.66
Chemicals 5 5 19 20.8 318.2 7.9 12 1.20 1.00 15.42
Electricals 1 5 - - - - - - - -
Engineering 6 5 30 15.16 112.59 4.33 10.5 0.8 -1.67 12.32
Finance & Banking 9 2 39 14.11 119.11 3.63 12 1.69 3.27 10.84
Food Processing 3 7 18 12.33 30.33 5.50 12 0.271 -2.33 11.17
Health Care 2 4 18 11 98 9.89 11 0 -2.75 8.48
Information
Technology 34 4 57 15.11 159.25 12.61 10.5 1.91 3.46 11.72
Manufacturing 1 8 - - - - - - - -
Media &
Entertainment 6 6 13 7.33 10.66 3.26 6.5 1.15 1.10 6.79
Mining & Minerals 2 20 21 20.5 0.5 0.70 20.5 0 -2.75 20.49
Miscellaneous 30 4 31 13.46 50.53 7.10 12 1.34 1.52 11.92
Paper & Pulp 1 28 - - - - - - - -
Pharmaceuticals 6 7 30 17.33 85.46 9.24 15.5 0.39 -1.79 15.22
Plastics 3 11 13 11.66 1.33 1.15 11 1.73 -2.33 11.62
Power 6 6 13 10.33 9.06 3.01 12 -.94 -1.56 9.90
Steel 4 5 23 12.75 56.25 7.5 11.5 0.95 1.93 11.09
Telecommunications 5 9 19 13.4 13.3 3.64 13 0.75 1.62 13.01
Textile & Synthetics 14 4 76 19.78 474.48 21.78 11 1.97 3.41 12.98
Total 146 2 76 14.58 126.5 11.24 12 2.55 8.56 11.83
Table-5
Sector Wise Age of the Sample
Industry 2-5
years
% in
total
6-10
years
% in
total
11-15
years
% in
total
16-20
years
% in
total
21 &
above
years
% in
total Total
Cement &
Construction 0 0.0 4 50.0 2 25.0 0 0.0 2 25.0 8
Chemicals 1 20.0 0 0.0 2 40.0 0 0.0 2 40.0 5
Parishodh Journal
Volume IX, Issue I, January/2020
ISSN NO:2347-6648
Page No:952
Electricals 0 0.0 0 0.0 1 100.0 0 0.0 0 0.0 1
Engineering 1 16.7 2 33.3 1 16.7 0 0.0 2 33.3 6
Finance &
Banking 1 11.1 2 22.2 4 44.4 0 0.0 2 22.2 9
Food Processing 0 0.0 1 33.3 1 33.3 1 33.3 0 0.0 3
Health Care 1 50.0 0 0.0 0 0.0 1 50.0 0 0.0 2
Information
Technology 5 14.7 12 35.3 6 17.6 5 14.7 6 17.6 34
Manufacturing 0 0.0 1 100.0 0 0.0 0 0.0 0 0.0 1
Media &
Entertainment 2 33.3 3 50.0 1 16.7 0 0.0 0 0.0 6
Mining &
Minerals 0 0.0 0 0.0 0 0.0 1 50.0 1 50.0 2
Miscellaneous 2 6.7 10 33.3 10 33.3 4 13.3 4 13.3 30
Paper & Pulp 0 0.0 0 0.0 0 0.0 0 0.0 1 100.0 1
Pharmaceuticals 0 0.0 2 33.3 1 16.7 1 16.7 2 33.3 6
Plastics 0 0.0 0 0.0 3 100.0 0 0.0 0 0.0 3
Power 0 0.0 2 33.3 4 66.7 0 0.0 0 0.0 6
Steel 1 25.0 0 0.0 2 50.0 0 0.0 1 25.0 4
Telecommunicat
ions 0 0.0 1 20.0 3 60.0 1 20.0 0 0.0 5
Textile &
Synthetics 3 21.4 3 21.4 3 21.4 2 14.3 3 21.4 14
Total 17 11.6 43 29.5 44 30.1 16 11.0 26 17.8 146
% of companies
in total sample 11.6 11.6 29.5 29.5 30.1 30.1 11.0 11.0 17.8 17.8 100.0
Parishodh Journal
Volume IX, Issue I, January/2020
ISSN NO:2347-6648
Page No:953
Volume IX, Issue I, January/2020 Page No:922
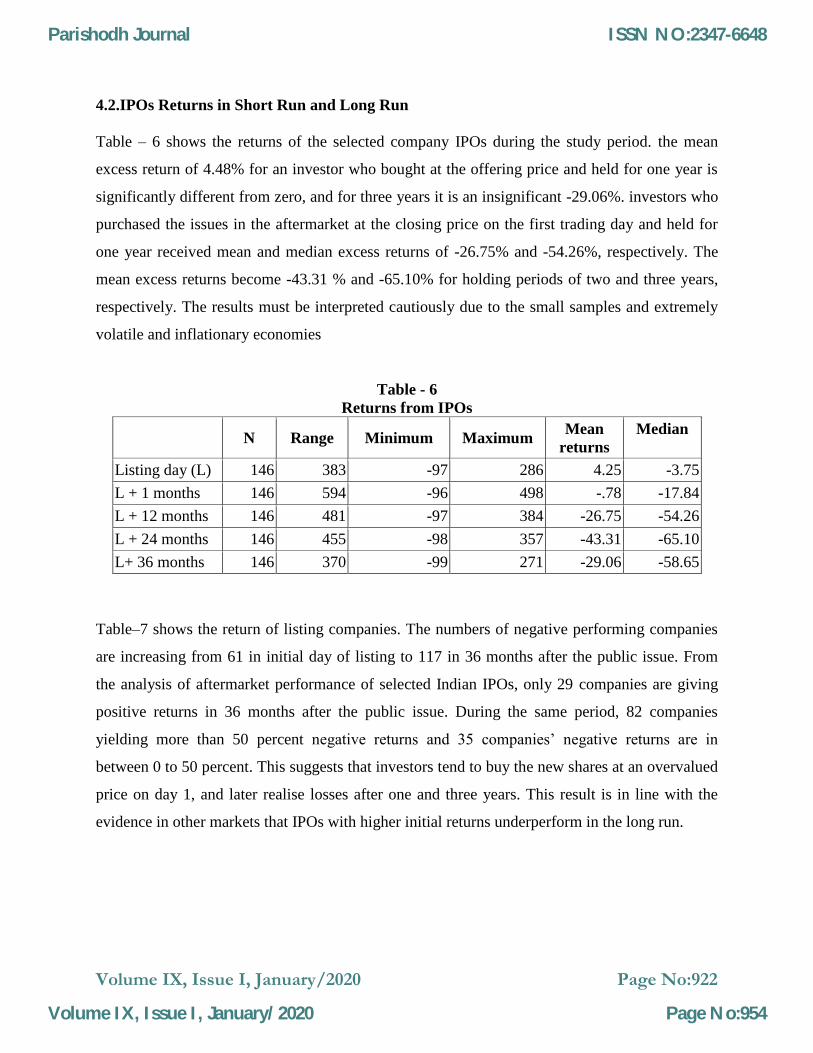
4.2.IPOs Returns in Short Run and Long Run
Table – 6 shows the returns of the selected company IPOs during the study period. the mean
excess return of 4.48% for an investor who bought at the offering price and held for one year is
significantly different from zero, and for three years it is an insignificant -29.06%. investors who
purchased the issues in the aftermarket at the closing price on the first trading day and held for
one year received mean and median excess returns of -26.75% and -54.26%, respectively. The
mean excess returns become -43.31 % and -65.10% for holding periods of two and three years,
respectively. The results must be interpreted cautiously due to the small samples and extremely
volatile and inflationary economies
Table - 6
Returns from IPOs
N Range Minimum Maximum Mean
returns
Median
Listing day (L) 146 383 -97 286 4.25 -3.75
L + 1 months 146 594 -96 498 -.78 -17.84
L + 12 months 146 481 -97 384 -26.75 -54.26
L + 24 months 146 455 -98 357 -43.31 -65.10
L+ 36 months 146 370 -99 271 -29.06 -58.65
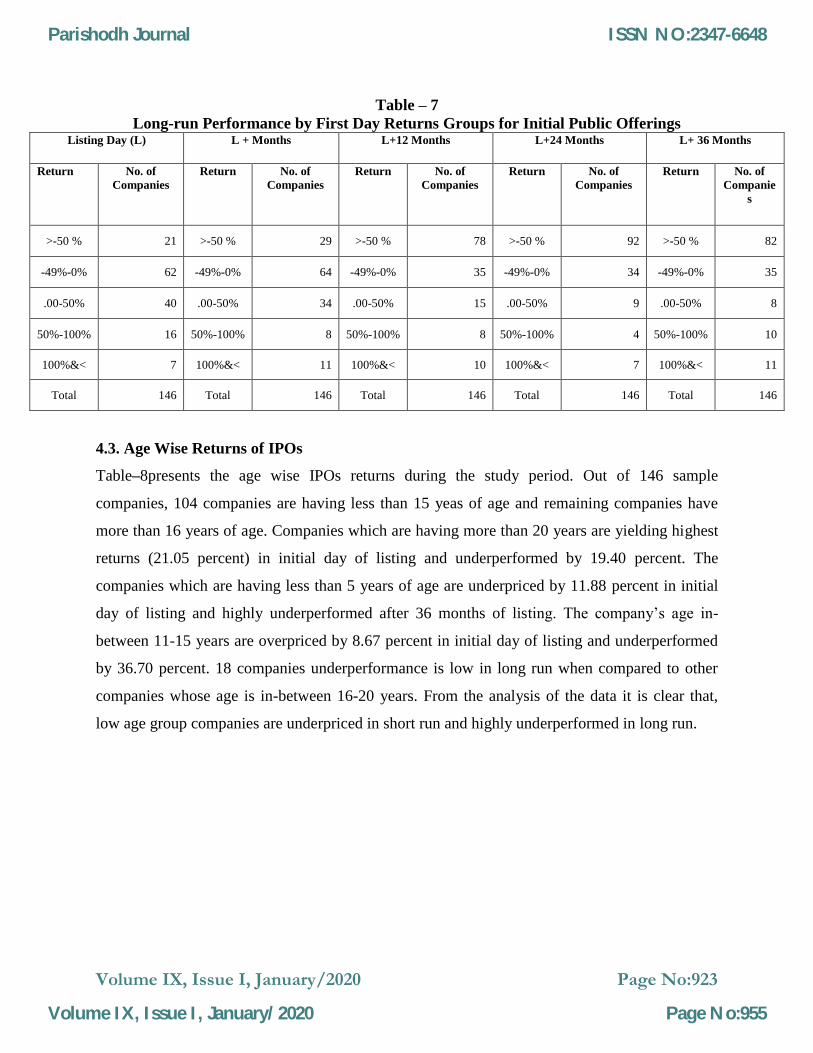
Table–7 shows the return of listing companies. The numbers of negative performing companies
are increasing from 61 in initial day of listing to 117 in 36 months after the public issue. From
the analysis of aftermarket performance of selected Indian IPOs, only 29 companies are giving
positive returns in 36 months after the public issue. During the same period, 82 companies
yielding more than 50 percent negative returns and 35 companies’ negative returns are in
between 0 to 50 percent. This suggests that investors tend to buy the new shares at an overvalued
price on day 1, and later realise losses after one and three years. This result is in line with the
evidence in other markets that IPOs with higher initial returns underperform in the long run.
Parishodh Journal
Volume IX, Issue I, January/2020
ISSN NO:2347-6648
Page No:954
Volume IX, Issue I, January/2020 Page No:923
Table – 7
Long-run Performance by First Day Returns Groups for Initial Public Offerings Listing Day (L) L + Months L+12 Months L+24 Months L+ 36 Months
Return No. of
Companies
Return No. of
Companies
Return No. of
Companies
Return No. of
Companies
Return No. of
Companie
s
>-50 % 21 >-50 % 29 >-50 % 78 >-50 % 92 >-50 % 82
-49%-0% 62 -49%-0% 64 -49%-0% 35 -49%-0% 34 -49%-0% 35
.00-50% 40 .00-50% 34 .00-50% 15 .00-50% 9 .00-50% 8
50%-100% 16 50%-100% 8 50%-100% 8 50%-100% 4 50%-100% 10
100%&< 7 100%&< 11 100%&< 10 100%&< 7 100%&< 11
Total 146 Total 146 Total 146 Total 146 Total 146
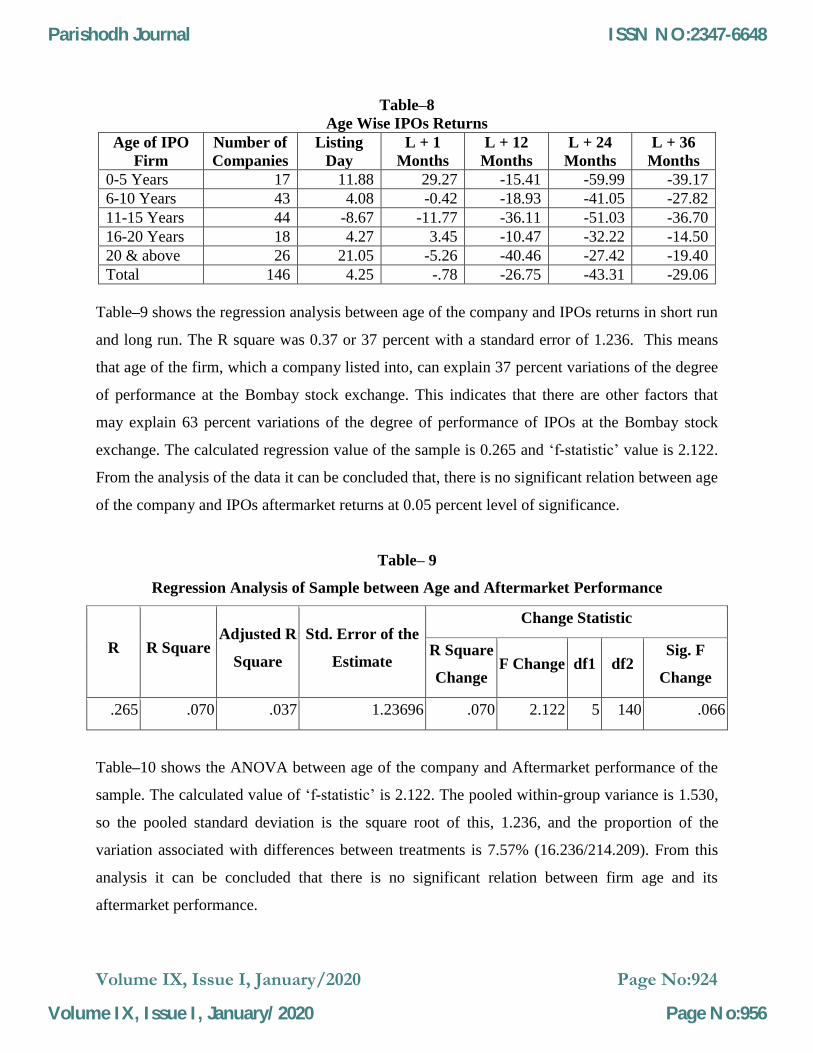
4.3. Age Wise Returns of IPOs
Table–8presents the age wise IPOs returns during the study period. Out of 146 sample
companies, 104 companies are having less than 15 yeas of age and remaining companies have
more than 16 years of age. Companies which are having more than 20 years are yielding highest
returns (21.05 percent) in initial day of listing and underperformed by 19.40 percent. The
companies which are having less than 5 years of age are underpriced by 11.88 percent in initial
day of listing and highly underperformed after 36 months of listing. The company’s age in-
between 11-15 years are overpriced by 8.67 percent in initial day of listing and underperformed
by 36.70 percent. 18 companies underperformance is low in long run when compared to other
companies whose age is in-between 16-20 years. From the analysis of the data it is clear that,
low age group companies are underpriced in short run and highly underperformed in long run.
Parishodh Journal
Volume IX, Issue I, January/2020
ISSN NO:2347-6648
Page No:955
Volume IX, Issue I, January/2020 Page No:924
Table–8
Age Wise IPOs Returns
Age of IPO
Firm
Number of
Companies
Listing
Day
L + 1
Months
L + 12
Months
L + 24
Months
L + 36
Months
0-5 Years 17 11.88 29.27 -15.41 -59.99 -39.17
6-10 Years 43 4.08 -0.42 -18.93 -41.05 -27.82
11-15 Years 44 -8.67 -11.77 -36.11 -51.03 -36.70
16-20 Years 18 4.27 3.45 -10.47 -32.22 -14.50
20 & above 26 21.05 -5.26 -40.46 -27.42 -19.40
Total 146 4.25 -.78 -26.75 -43.31 -29.06
Table–9 shows the regression analysis between age of the company and IPOs returns in short run
and long run. The R square was 0.37 or 37 percent with a standard error of 1.236. This means
that age of the firm, which a company listed into, can explain 37 percent variations of the degree
of performance at the Bombay stock exchange. This indicates that there are other factors that
may explain 63 percent variations of the degree of performance of IPOs at the Bombay stock
exchange. The calculated regression value of the sample is 0.265 and ‘f-statistic’ value is 2.122.
From the analysis of the data it can be concluded that, there is no significant relation between age
of the company and IPOs aftermarket returns at 0.05 percent level of significance.
Table– 9
Regression Analysis of Sample between Age and Aftermarket Performance
R R Square Adjusted R
Square
Std. Error of the
Estimate
Change Statistic
R Square
Change F Change df1 df2
Sig. F
Change
.265 .070 .037 1.23696 .070 2.122 5 140 .066
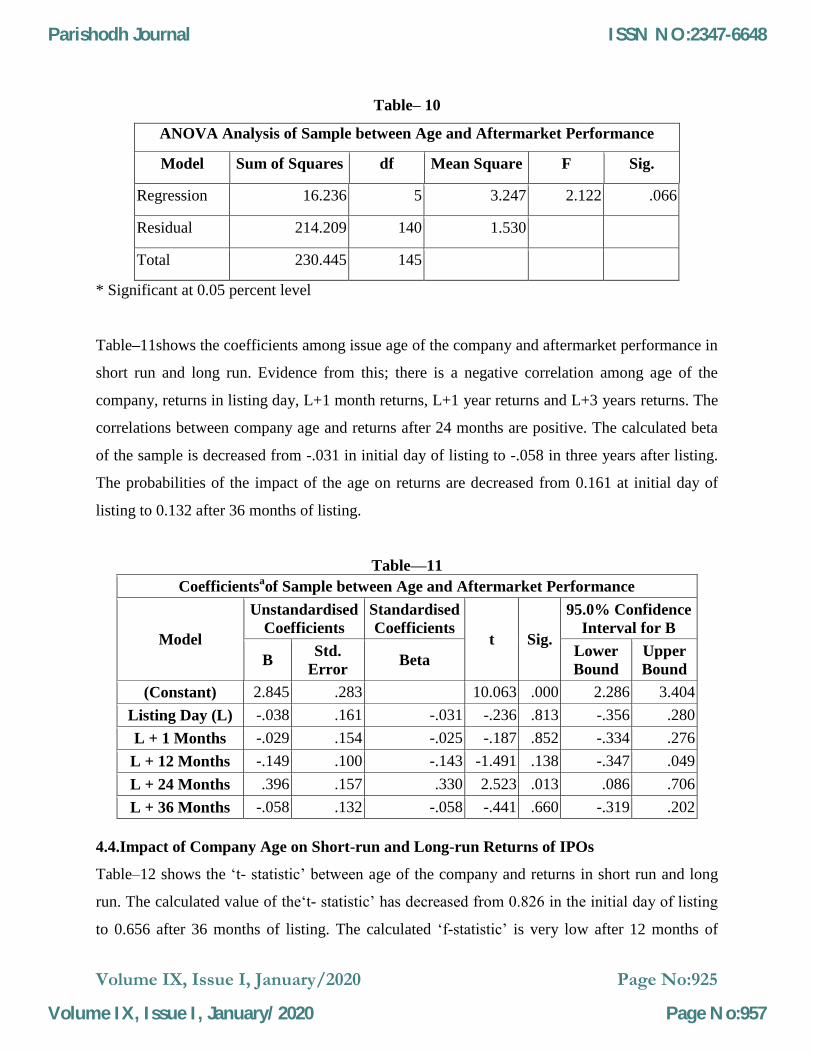
Table–10 shows the ANOVA between age of the company and Aftermarket performance of the
sample. The calculated value of ‘f-statistic’ is 2.122. The pooled within-group variance is 1.530,
so the pooled standard deviation is the square root of this, 1.236, and the proportion of the
variation associated with differences between treatments is 7.57% (16.236/214.209). From this
analysis it can be concluded that there is no significant relation between firm age and its
aftermarket performance.
Parishodh Journal
Volume IX, Issue I, January/2020
ISSN NO:2347-6648
Page No:956
Volume IX, Issue I, January/2020 Page No:925
Table– 10
ANOVA Analysis of Sample between Age and Aftermarket Performance
Model Sum of Squares df Mean Square F Sig.
Regression 16.236 5 3.247 2.122 .066
Residual 214.209 140 1.530
Total 230.445 145
* Significant at 0.05 percent level
Table–11shows the coefficients among issue age of the company and aftermarket performance in
short run and long run. Evidence from this; there is a negative correlation among age of the
company, returns in listing day, L+1 month returns, L+1 year returns and L+3 years returns. The
correlations between company age and returns after 24 months are positive. The calculated beta
of the sample is decreased from -.031 in initial day of listing to -.058 in three years after listing.
The probabilities of the impact of the age on returns are decreased from 0.161 at initial day of
listing to 0.132 after 36 months of listing.
Table—11
Coefficientsaof Sample between Age and Aftermarket Performance
Model
Unstandardised
Coefficients
Standardised
Coefficients t Sig.
95.0% Confidence
Interval for B
B Std.
Error Beta
Lower
Bound
Upper
Bound
(Constant) 2.845 .283 10.063 .000 2.286 3.404
Listing Day (L) -.038 .161 -.031 -.236 .813 -.356 .280
L + 1 Months -.029 .154 -.025 -.187 .852 -.334 .276
L + 12 Months -.149 .100 -.143 -1.491 .138 -.347 .049
L + 24 Months .396 .157 .330 2.523 .013 .086 .706
L + 36 Months -.058 .132 -.058 -.441 .660 -.319 .202
4.4.Impact of Company Age on Short-run and Long-run Returns of IPOs
Table–12 shows the ‘t- statistic’ between age of the company and returns in short run and long
run. The calculated value of the‘t- statistic’ has decreased from 0.826 in the initial day of listing
to 0.656 after 36 months of listing. The calculated ‘f-statistic’ is very low after 12 months of
Parishodh Journal
Volume IX, Issue I, January/2020
ISSN NO:2347-6648
Page No:957

Volume IX, Issue I, January/2020 Page No:926
listing and high after 24 months of listing. From the analysis of the data it can be concluded that
there is no significant relation between age of the company and aftermarket returns of the sample
in short run as well as long run at 0.05 percent level of significance.
Table –12
Company Age and Returns in Short Run and Long Run
ANOVA
Sum of
Squares df
Mean
Square F Sig.
Listing Day (L)
Between Groups 3.531 4 .883 .836 .505
Within Groups 148.962 141 1.056
Total 152.493 145
L + 1 Months
Between Groups 1.672 4 .418 .342 .849
Within Groups 172.355 141 1.222
Total 174.027 145
L + 12 Months
Between Groups 1.628 4 .407 .271 .896
Within Groups 211.393 141 1.499
Total 213.021 145
L + 24 Months
Between Groups 8.379 4 2.095 1.948 .106
Within Groups 151.649 141 1.076
Total 160.027 145
L + 36 Months
Between Groups 4.127 4 1.032 .656 .624
Within Groups 221.853 141 1.573
Total 225.979 145
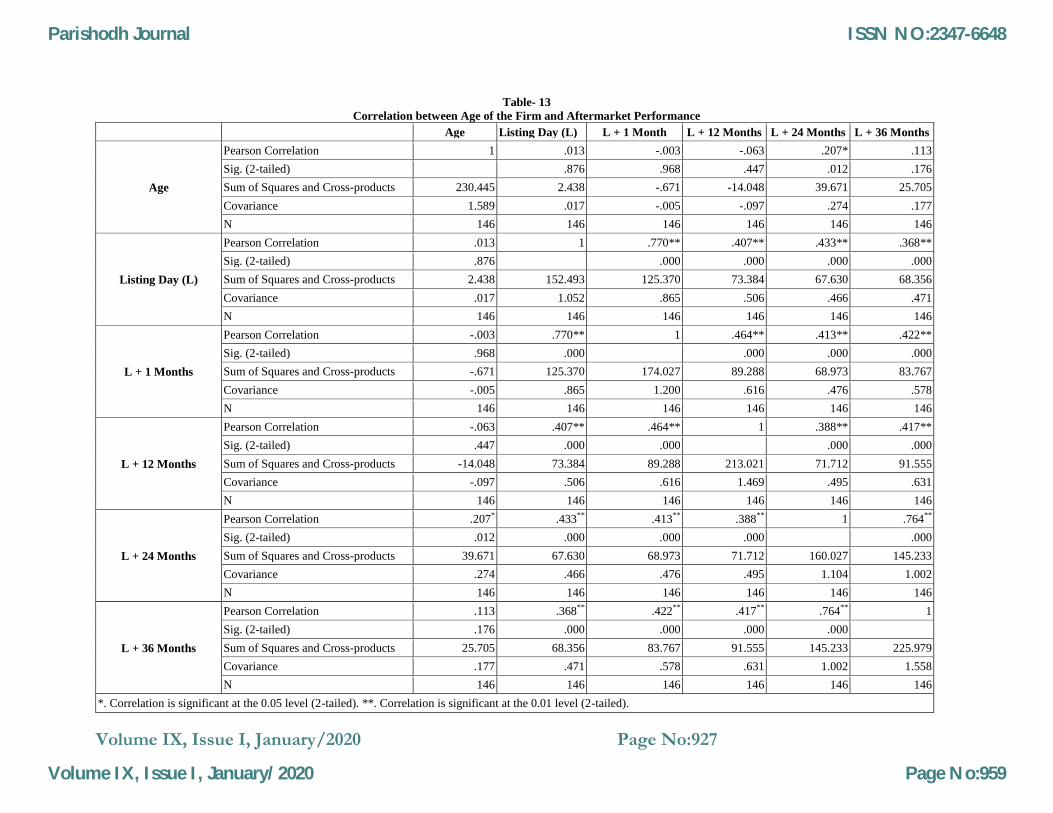
4.5.Correlation between Age of the Firms and Market performance
Table–13 shows the correlation between sample IPOs aftermarket returns and market age of the
company. The correlation is increased from 0.013 in initial day of listing to 0.113 after 36
months of listing. The IPOs returns are negatively correlated with age of the company at 1st
month & 12 months after returns. Age of the company and returns of the IPOs are positively
correlated in initial day of listing and long run (after 24 months of listing). The table-6.29 also
shows that there is a high correlation between listing day returns and one month aftermarket
returns. From the analysis of the data, the results are statistically insignificant correlation
between firm age-at-IPO and returns in short run and long run.
Parishodh Journal
Volume IX, Issue I, January/2020
ISSN NO:2347-6648
Page No:958
Volume IX, Issue I, January/2020 Page No:927
Table- 13
Correlation between Age of the Firm and Aftermarket Performance
Age Listing Day (L) L + 1 Month L + 12 Months L + 24 Months L + 36 Months
Age
Pearson Correlation 1 .013 -.003 -.063 .207* .113
Sig. (2-tailed) .876 .968 .447 .012 .176
Sum of Squares and Cross-products 230.445 2.438 -.671 -14.048 39.671 25.705
Covariance 1.589 .017 -.005 -.097 .274 .177
N 146 146 146 146 146 146
Listing Day (L)
Pearson Correlation .013 1 .770** .407** .433** .368**
Sig. (2-tailed) .876 .000 .000 .000 .000
Sum of Squares and Cross-products 2.438 152.493 125.370 73.384 67.630 68.356
Covariance .017 1.052 .865 .506 .466 .471
N 146 146 146 146 146 146
L + 1 Months
Pearson Correlation -.003 .770** 1 .464** .413** .422**
Sig. (2-tailed) .968 .000 .000 .000 .000
Sum of Squares and Cross-products -.671 125.370 174.027 89.288 68.973 83.767
Covariance -.005 .865 1.200 .616 .476 .578
N 146 146 146 146 146 146
L + 12 Months
Pearson Correlation -.063 .407** .464** 1 .388** .417**
Sig. (2-tailed) .447 .000 .000 .000 .000
Sum of Squares and Cross-products -14.048 73.384 89.288 213.021 71.712 91.555
Covariance -.097 .506 .616 1.469 .495 .631
N 146 146 146 146 146 146
L + 24 Months
Pearson Correlation .207* .433** .413** .388** 1 .764**
Sig. (2-tailed) .012 .000 .000 .000 .000
Sum of Squares and Cross-products 39.671 67.630 68.973 71.712 160.027 145.233
Covariance .274 .466 .476 .495 1.104 1.002
N 146 146 146 146 146 146
L + 36 Months
Pearson Correlation .113 .368** .422** .417** .764** 1
Sig. (2-tailed) .176 .000 .000 .000 .000
Sum of Squares and Cross-products 25.705 68.356 83.767 91.555 145.233 225.979
Covariance .177 .471 .578 .631 1.002 1.558
N 146 146 146 146 146 146
*. Correlation is significant at the 0.05 level (2-tailed). **. Correlation is significant at the 0.01 level (2-tailed).
Parishodh Journal
Volume IX, Issue I, January/2020
ISSN NO:2347-6648
Page No:959

Volume IX, Issue I, January/2020 Page No:928
5. Conclusion:
This article examines earned returns and allocation details of more than146 new offerings (Initial
Public Offering, IPO) from companies that wentpublic in India during the period 2007 to 2008.
This study finds that theaverage underpricing of equity IPOs decreased significantly from 4.25
per cent in initial day of listing to -29.06 per cent after three years of listing. The study also finds
the correlation between age of the company and returns varies from .013 initial day of listing to
.113 after 36 months of listing. The calculated value of ‘f-statistic’varies from .505 in initial day
of listing to .624 after 36 months of listing. From the analysis of data it can be concluded that
there is no significant relation between IPOs returns and age of the company during the period at
0.05 percent level of significance. The study concluded that ‘The age of the firm has significant
impact on short-run and long-run performance of the IPOs’ in the study period.
6. References:
1. A Shokand (2013), “long term performance of Indian IPOs” http:// shodhganga. inflibnet.
ac. in / bitstream.
2. BilsonJournal of Finance, “Age on Aftermarket Stock Performance Vol. 32. No. 4.1977,
pp1151-1168.
3. Block, Stanley and Majorie Stanley. "The Financial Characteristics and Price
Movement Patterns of Companies Approaching the Unseasoned Securities Market in the
late 1972s", Financial Management, Vol.9, No.4, 1989, pp.30-36.
4. Business Line “SEBI eases minimum public issue size to 10 pc” Business Line, December
23, 2000
5. Claudio Loderer and UrsWaelchli “Firm age and performance”, Journal of Financial
Economics September 27, 2009, Vol.87, Page No. 329-356.
6. David T. Clark “A Study of the Relationship Between Firm Age-at-IPO and Aftermarket
Stock Performance” The Leonard N. Stern School of Business, NBER Working Paper Series,
2010.
7. Dr. Rajesh C. Jamapala, Dr. P. Adi Lakshmi and Mr. D. SrinivasaRao (2013) “A Study on
Performance of Initial Public Offerings (IPOs) in India during 2007-2011”, Management
Today, Vol. 2, No.3, July, 2012, Page 12-26.
8. Ericson, R., Pakes, A., (1995), “Markov-perfect industry dynamics: A framework for
empirical work”. Review of Economic Studies, Volume. 62, page No. 53-82.
9. Finn, Frank J. and Ron Higham. "The Performance of Unseasoned New Equity Issues-
cum-Stock Exchange Listings in Australia", Journal of Banking and Finance, 1988, Vol.11,
No.3, pp.333-352.
10. Hensler “impact of fundamental on IPOs” Correlated trading and returns. Journal of Finance
63, 885–920
11. Ibbotson, R., (1975), « Price performance of commun stock new issues », Journal of
Financial Economics, Vol. 2, pp. 235-272.
Parishodh Journal
Volume IX, Issue I, January/2020
ISSN NO:2347-6648
Page No:960
Volume IX, Issue I, January/2020 Page No:929
12. Jovanovic, Boyan& Peter L. Rousseau. 2001. “Why Wait? A Century of Life Before IPO.”
NBER Working Paper Series.
13. Manu Kaushik , “All fall down” Business Today, June 26, 2011.
14. Mario Levis. "The Long-Run Performance of Initial Public Offerings: The UK Experience
1980-1988", Financial Management, Vol. 22, No. 1, 1993, pp 28-41.
15. Reilly, Frank K. "New Issues Revisited,” Financial Management, Vol. 6, No. 4, 1977,
pp28-42.
16. ReenaAggarwal, Ricardo Leal, Leonardo Hernandez (2011), “The Aftermarket Performance
of Initial Public Offerings in Latin America” Financial Management, Vol. 22, No. 1 (Spring,
1993), pp. 42-53.
17. Ritter, J.R. "The Choice between Firm Commitment and Best Efforts Contracts,”
Unpublished Working Paper, University of Michigan, Ann Arbor, 1991.
18. Rock, K. "Why New Issues are underpriced?" Journal of Financial Economics, Vol. 15, Nos.
1/2, January/February 1986, pp 187-212.
19. SeshadevSahoo and PrabinaRajib (2010), “After Market Pricing Performance of Initial
Public Offerings (IPOs): Indian IPO Market 2002-2006” VIKALPA, Volume 35, No. 4,
October – December 2010.
Parishodh Journal
Volume IX, Issue I, January/2020
ISSN NO:2347-6648
Page No:961