groupe de recherche en Économie et développement...
TRANSCRIPT

i
Groupe de Recherche en Économie et Développement International
Cahier de recherche / Working Paper 07-22
Productivity and innovation: an overview of the issues
Petr Hanel

ii
Productivity and innovation: an overview of the issues
Petr Hanel
Université de Sherbrooke, Centre de recherche sur la science et la technologie (CIRST) and GREDI
Acknowledgements This is the text of a report commissioned by Statistics Canada. The opinions expressed in this report are those of the author and do not represent the views of Statistics Canada. I benefited from discussions and comments from Pierre Therrien, Industry Canada and Frances Anderson, Statistics Canada. My assistants, Jean-Michel Goulet and Samir Jouini, provided much appreciated help. I am alone responsible for the opinions, omissions and remaining errors.
iii
Key words: Innovation, R&D, productivity, econometric modelling, Canada. JEL categories: Invention and innovation (031); Productivity (D24); Industries studies: manufacturing (L6); Measurement of economic growth: aggregate productivity (O47);
Econometric modeling (C51); Microeconomic data (C81)
Abstract To introduce the subject, the paper compares the Canadian performance on principal indicators of productivity and innovation with the U.S. and other countries. Follows an overview of principal sources of economic welfare, economic growth and increasing productivity with a special attention given to the relationship between productivity growth and innovation. Before addressing the relationship between innovation and productivity, the paper introduces the concepts and their operational measures or indicators, the sources of innovation and their effects as well as financing and public policies in support of innovation. In the section on the link between innovation and productivity the paper surveys the representative empirical studies of this relationship on industry and enterprise level, including the evidence on private and social returns on investment in R&D and innovation in Canada and abroad. Follows a description of the current econometric modelling of micro-data on innovation and its effect on firm performance. These innovation surveys-based micro econometric studies are inspired by the four-stage CDM model that predicts (1) the probability that a firm innovates, (2) the resources it invests in the activity, (3) the commercial results of innovation and (4) the effect of innovation on firms’ performance indicators such as sales per employee, labour productivity and its growth etc. This model provides the standardized methodology for an ongoing international research project analyzing the data from innovation surveys of majority of OECD countries.
Résumé Pour introduire le sujet, la performance du Canada en matière de la productivité et de l’innovation est examinée dans le contexte international. Suit une revue des principales sources la croissance du bien-être économique et de la productivité avec une attention spéciale consacrée à la relation entre la productivité et l’innovation. Avant d’aborder la relation entre l’innovation et la productivité, on introduit les concepts et leurs mesures et indicateurs, les sources d’innovation et leurs effets ainsi que leur financement et les politiques publiques à l’appui de la R7D et innovation. La revue des études empiriques de la relation entre l’innovation et la croissance de la productivité examine les analyses au niveau des industries et au niveau des entreprises, inclusivement les études sur le rendement privé et social des investissements en R-D et innovation. Les études les plus récentes mettent en relief la modélisation micro-économétrique utilisant les données sur les entreprises disponibles dans les enquêtes sur l’innovation. Ces études s’inspirent du modèle CDM à quatre paliers qui (1) prédit la probabilité qu’une entreprise innove, (2) les ressources que les entreprises innovantes investissent à cette fin, (3) les résultats commerciaux de l’innovation et (4) leur effet sur les indicateurs de performance tels que les ventes et la valeur ajoutés par employé et leur croissance. Cette approche est à la base d’une méthodologie standardisée utilisée dans un projet de recherche international mené par des chercheurs d’une vingtaine des pays sous l’égide de l’OCDE.
iv
Contents 1. Introduction ........................................................................................................................1 2. How is Canada doing on the productivity and innovation front?..................................2 2.1 Canada’s recent productivity performance in international comparison ...................2
2.1.1 Sectoral sources of multifactor productivity growth in the business sector ...5 2.2 Canada’s innovation performance in international comparison..............................7 3. Sources of economic growth, increasing productivity and innovation: Concepts and data .................................................................................................................................10 3.1 Economic growth and productivity ..............................................................................11 3.2 Innovation......................................................................................................................14
3.2.1 Operational definition of technological innovation, its measure and data.....14 3.2.2 Types of innovation............................................................................................15 3.2.3 Novelty of innovation .........................................................................................16 3.2.4 Sources of innovation ........................................................................................16 3.2.5 Cost of innovation ..............................................................................................17 3.2.6 Public support to financing innovation ............................................................17 3.2.7 Effects of innovation ..........................................................................................18
4. The link between Innovation and productivity ..............................................................20 4.1 The relationship between R&D economic growth and productivity.........................20
4.1.1 Return to investment in R&D and innovation...................................................21 4.2 Foreign control and productivity.................................................................................21 4.3 R&D and productivity ...................................................................................................22
4.3.1 Results of empirical studies on macro and industry level................................22 4.3.2 Micro-economic evidence on innovation and its economic outcomes .........23 4.3.3 Joint international research project on the link between innovation and firm performance...................................................................................................................25
5. Conclusion .....................................................................................................................26 References ............................................................................................................................27

1
1. Introduction The Canadian standard of living and the quality of life in general, are determined by the productivity of its labour force. Improving labour productivity is often incorrectly associated with the idea that it is “working more for less pay”, while the opposite is true. Improving productivity is necessary not only to ensure rising wages and personal consumption but also the viability and quality of public services which Canadians regard as the defining characteristics of their quality of life. Canada’s lacklustre productivity performance hase not escaped the attention of businessmen, politicians and economists. Businessmen are well aware of the close link between productivity, competitiveness and innovation. The Standing Committee on Industry of the House of Commons conducted a series of hearings and produced a well informed document on the subject (Wheland, 2000). The need to increase productivity, competitiveness and enhance innovation has been often mentioned in federal and provincial budgets and other political documents. In spite of generous programs of public support, or perhaps because of them, the Canadian business sector still lags behind its foreign competitors in various aspects of innovation activity and the capacity to commercialize new technologies and turn them into productivity gains. The lack of innovation ‘culture’ seems to persist. Economists of various schools of thought seem to be surprisingly in agreement about most, if not all, elements of an agenda that would help to improve Canadian productivity. In his “Economist’s manifesto for curing ailing Canadian productivity” Drummond (2006) enumerates and discusses a series of obstacles to productivity growth and measures needed for their removal. He denounces the popular misconception that economists seems unable to dispel such as the notion that increase in productivity is at the expense of employment, while in fact strong growth of productivity is associated not only with high wages but also with low unemployment, as demonstrated in the U.S. which leads in productivity growth and low unemployment. Faster productivity growth is also the best guarantor for future availability and improvement of public services such as the health care and education, and environmental initiatives, the top priorities of Canadians. As this overview will show, many analysts have recognised the important link between the weak productivity performance and the sluggish innovation and diffusion of new technologies in the Canadian business sector. Most of the earlier empirical research examined the relationship between R&D and productivity growth on the aggregate or on the industry level. The recent innovation surveys conducted by national statistical agencies abroad and by Statistics Canada here now provide a wealth of firm and even establishment information on the incidence of innovation, their sources and their effects on productivity. The data is well suited for more advanced analysis of the complex relationships between the characteristics of firms, their competitive, institutional and policy environment, their innovation performance and how the latter translates into improved business performance and productivity gains. The paper has several interrelated objectives addressed in three sections. The first, developed in the next section, is to compare the recent Canadian productivity and innovation

2
performances with that of its main foreign competitors and examine the principal causes of the productivity gap that separate Canada from the best performers. In order to better understand the complex links between productivity, innovation and their diffusion, these concepts, their operational definitions and measurements are presented in the third section of the paper. Follows an overview of empirical studies that examine the characteristics of innovating firms, their activities and strategies, the role of public policies and the nature of links between innovation, their diffusion and firms’ performance. The section ends with a description of a model that integrates the hitherto distinctive strands of analysis in a three stage model for the analysis of national innovation surveys. This model constitutes the methodological basis of a joint international research initiative under the auspices of the OECD. The main objective of the project in which Canada also participates is to analyse in an internationally comparable way the multiple relationships spanning the decision to innovate up the effects of innovation to on firm’s productivity and other performance indicators. Brief conclusions end the paper .
2. How is Canada doing on the productivity and innovation front? Increasing productivity is not an end in its own right. We are interested in productivity because the most common indicator of economic welfare, the Gross Domestic Product per capita is closely associated with labour productivity. Slower growth of productivity relative to Canada’s foreign competitors means slower growth of economic welfare and decline of Canada’s international competitiveness. As other industrialized countries, in the long run, Canada can not compete on price; it has to compete on quality and product niche (see Porter and Martin, 2001, Mayhew and Neely, 2006). Improved quality of existing and introduction of new products and services and new market niches are results of innovation that in the long run translates in increased productivity and economic welfare.
2.1 Canada’s recent productivity performance in international comparison The Gross domestic product per capita has been falling in Canada behind that of the United States from the early 80s to mid 90s. It briefly improved in the late 90s. The improvement was, however, mainly result of increased economic activity rather than of productivity growth (Sharpe, 2002). Since 2000 labour productivity and the multifactor (total factor productivity)1 have been again growing slower in Canada than in the US and also slower than in the rest of the OECD. To put Canada’s productivity performance in an international context it is first compared to productivity level and growth in the United States, Canada’s most important trade partner and competitor. International comparisons of productivity are routinely done by expressing the productivity level or rate of growth of a country relative to that of the United States. Until 1 Total and multifactor productivity are different names for the same measure. Multifactor, or total factor productivity, measures the efficiency with which inputs are used in production. It is a broader measure of productive efficiency than labour productivity since it takes into consideration all input categories.
3
recently, Statistics Canada’s measurement of Labour and multifactor productivity was at odds with methods used by the U.S. resulting in significant biases in comparison of productivity levels and growth between the two countries. A revision of Statistics Canada productivity measurement methods in the early 2000s reduced the methodological differences that rendered problematic comparison of Canadian productivity levels and growth with that of the U.S. and other industrialized countries.2 Over the 1994-2000 period, the Gross Domestic Product per capita in Canada averaged about 83% of GDP per capita in the United States. This suggests an average output gap of about 17% U.S. GDP per capita, i.e. about 8 500 $ (Canadian) per person in 2004 (Institute for Competitiveness and Prosperity, 2006). The lower number of hours worked per job and the lower ratios of jobs to population in Canada accounted for about two thirds of this GDP per capita gap. The lower Canadian labour productivity was responsible for the remaining third, i.e. about 6 % of the U.S. labour productivity level (Baldwin, Maynard and Wong, 2005a). However, the estimate of the labour productivity gap and the related output gap is contingent on the set of underlying assumptions. Depending on the assumptions used, the relative Canada-US labour productivity of the business sector could be between 79% and 99% in 1999 (Baldwin et al. 2005b). Instead of relying on point estimates, the authors suggest to consider these estimates with a large confidence interval. It is, therefore, less risky to focus on international comparisons of growth pattern rather than levels of productivity. Our purpose is to underline the defining trends emerging from recent studies that examined different aspects of Canada’s recent productivity performance. After years of slow productivity growth until the mid nineties, Canada, following the U.S., experienced a revival of labour productivity growth during the 1995-2000 period.
2 However, not all difficulties have been resolved. Ideally, a measure of productivity expresses the ratio of the physical quantity of output to physical quantities of resources used to its production. Such ratios are sometimes used to compare labour productivity within a single industry or, better, in production of identical or very similar products or commodities using comparable technologies and production equipment (steel, newsprint, some standard textile products or automobiles). The advantage of comparisons in terms of physical units is that it avoids the difficult issue of valuating outputs and inputs in different national currencies that arises as soon as the comparison concerns a diversified industry, sector or the whole economy. In that case it is unavoidable to use monetary values of outputs and inputs.
Since the price levels of outputs and inputs vary from one country to another, a meaningful comparison of productivity levels across national borders requires the analyst to evaluate Canadian outputs and inputs at U.S. prices (or the other way around). As the market exchange rate fluctuates widely and is often severely misaligned relative to a theoretical “equilibrium” exchange rate, international comparisons of productivity and levels of standard of living are expressed in various variants of the purchasing power parity (PPP). Thus the international comparisons of GDP per capita, of labour and total factor productivity are, in addition to other methodological problems, crucially dependent on the PPP exchange rate chosen. The official PPP exchange rates are derived for comparing expenditures. Their use for productivity comparisons requires assumptions regarding pricing of exports and imports. Other measurement issues involved are cross-border differences in measurement of inputs (for example, the measures of labour input differ between Canada, the US and other countries) and quality adjustments of certain products and equipments such as computers etc. All these conceptual and measurement problems make international comparisons of standards of living and even more of productivity difficult and subject to significant errors.
4
Labour productivity may change owing to: (1) a change in capital intensity (capital per worker) (2) a change in labour quality (usually measured as a change in the composition of
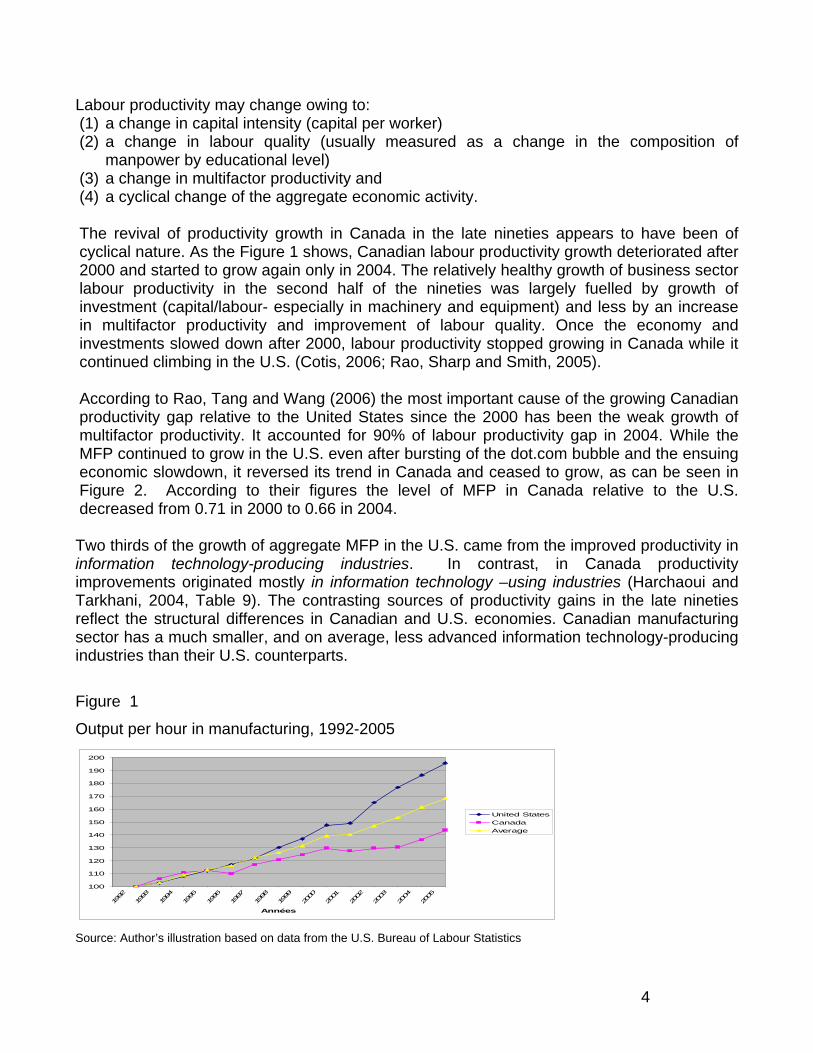
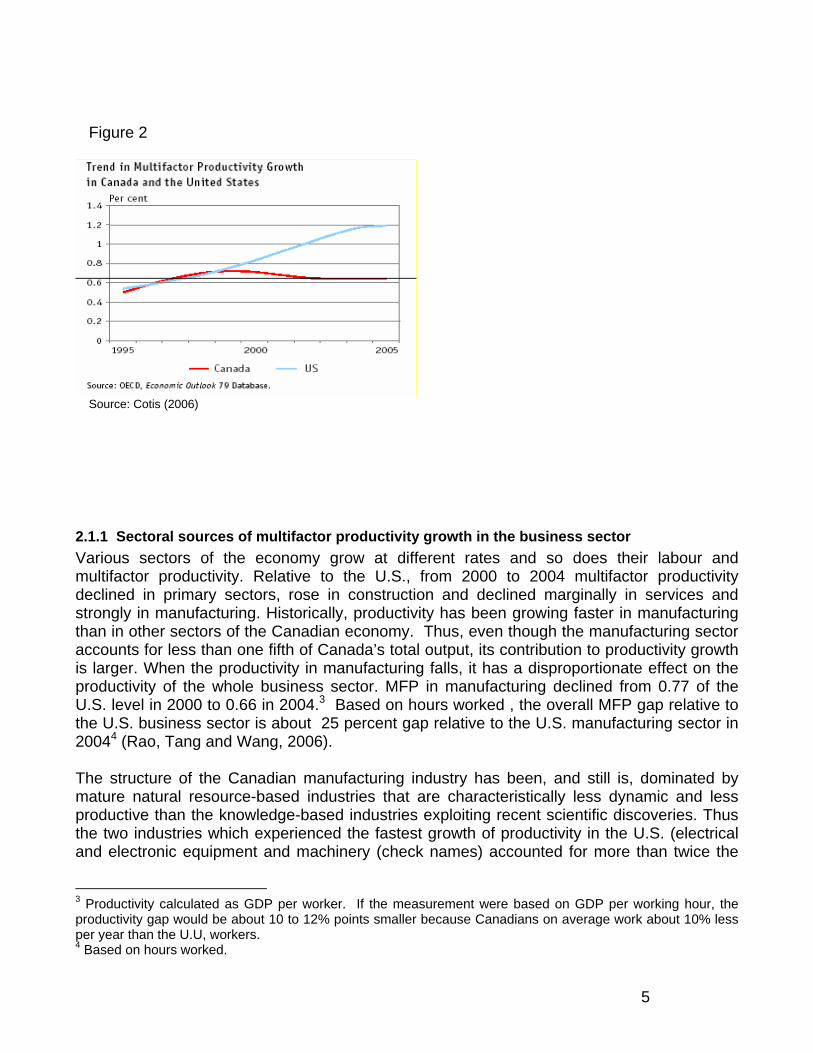
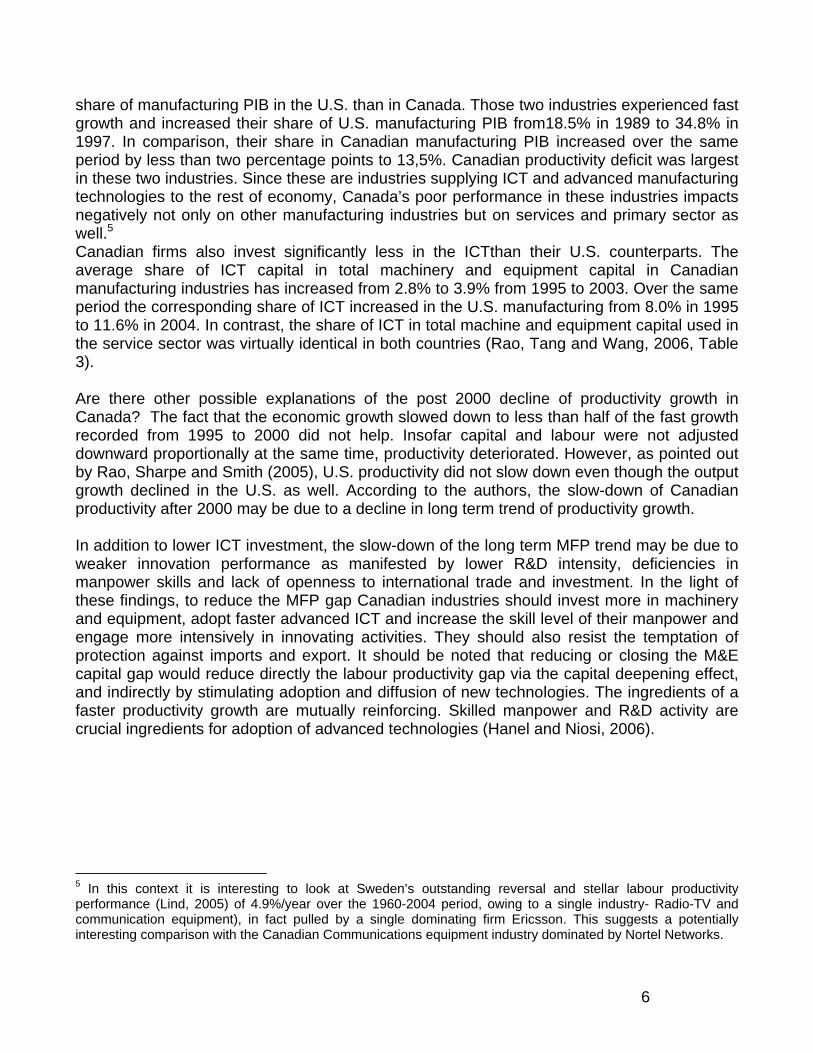
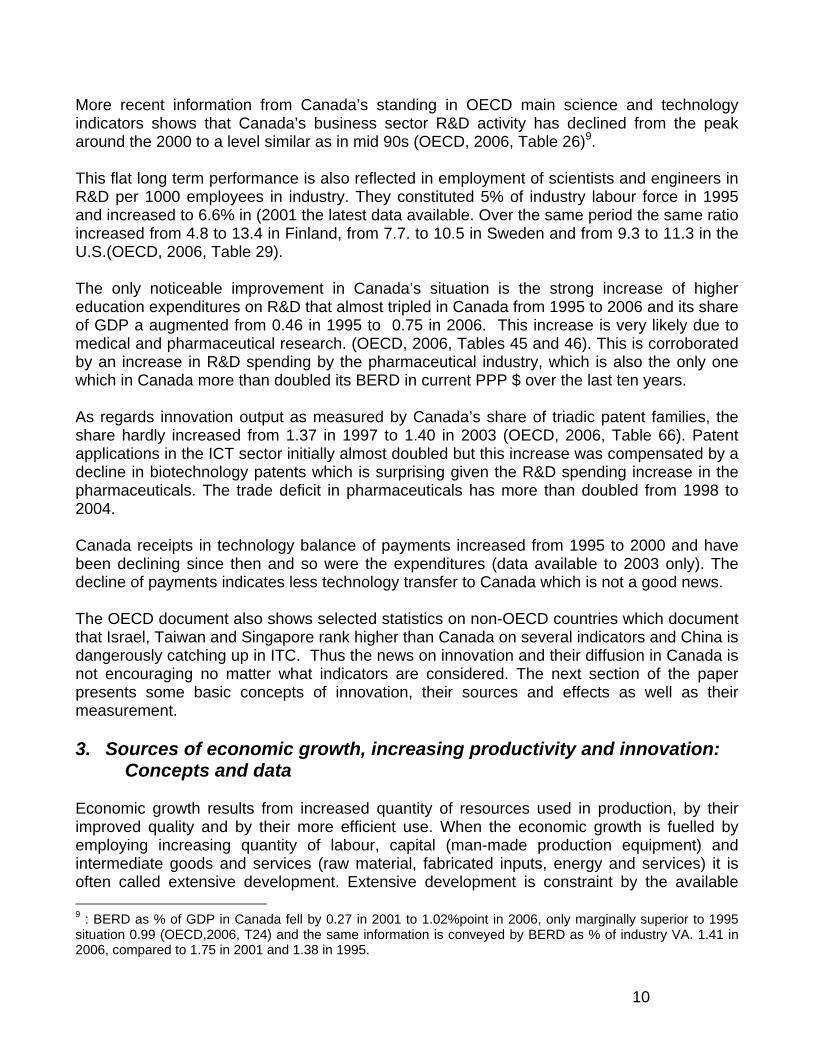
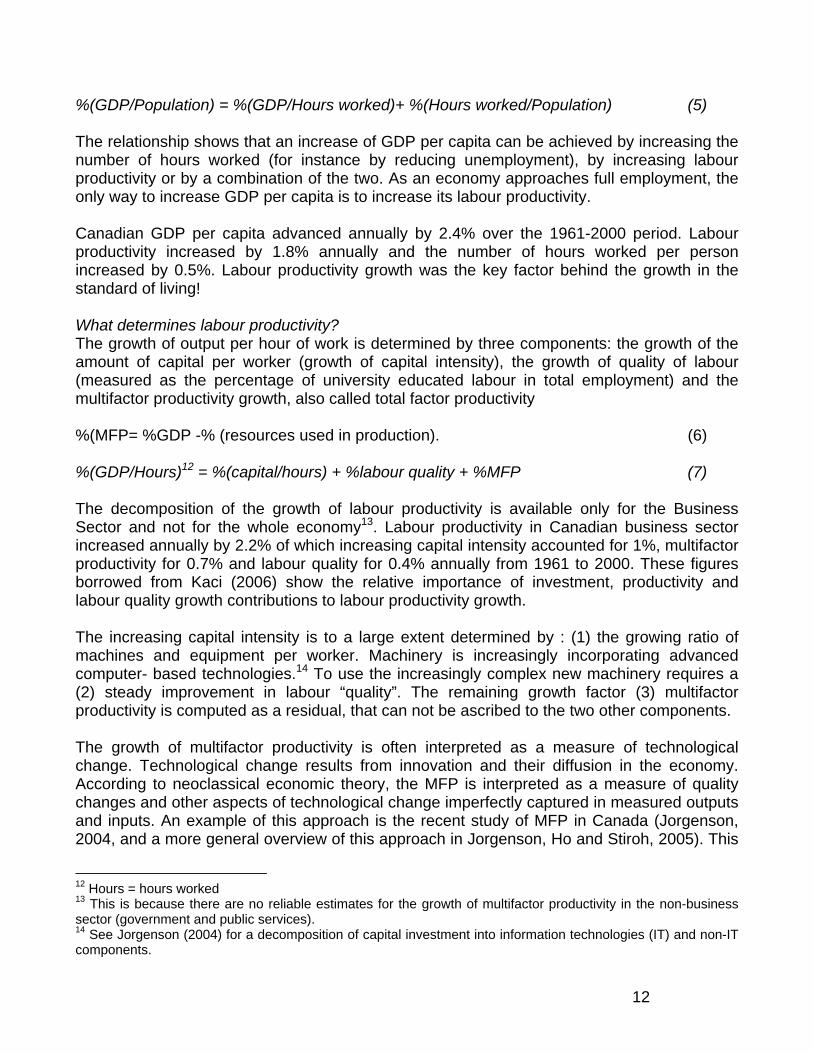
manpower by educational level) (3) a change in multifactor productivity and (4) a cyclical change of the aggregate economic activity. The revival of productivity growth in Canada in the late nineties appears to have been of cyclical nature. As the Figure 1 shows, Canadian labour productivity growth deteriorated after 2000 and started to grow again only in 2004. The relatively healthy growth of business sector labour productivity in the second half of the nineties was largely fuelled by growth of investment (capital/labour- especially in machinery and equipment) and less by an increase in multifactor productivity and improvement of labour quality. Once the economy and investments slowed down after 2000, labour productivity stopped growing in Canada while it continued climbing in the U.S. (Cotis, 2006; Rao, Sharp and Smith, 2005). According to Rao, Tang and Wang (2006) the most important cause of the growing Canadian productivity gap relative to the United States since the 2000 has been the weak growth of multifactor productivity. It accounted for 90% of labour productivity gap in 2004. While the MFP continued to grow in the U.S. even after bursting of the dot.com bubble and the ensuing economic slowdown, it reversed its trend in Canada and ceased to grow, as can be seen in Figure 2. According to their figures the level of MFP in Canada relative to the U.S. decreased from 0.71 in 2000 to 0.66 in 2004. Two thirds of the growth of aggregate MFP in the U.S. came from the improved productivity in information technology-producing industries. In contrast, in Canada productivity improvements originated mostly in information technology –using industries (Harchaoui and Tarkhani, 2004, Table 9). The contrasting sources of productivity gains in the late nineties reflect the structural differences in Canadian and U.S. economies. Canadian manufacturing sector has a much smaller, and on average, less advanced information technology-producing industries than their U.S. counterparts.
Figure 1
Output per hour in manufacturing, 1992-2005
100
110
120
130
140
150
160
170
180
190
200
1992
1993
1994
1995
1996
1997
1998
1999
2000
2001
2002
2003
2004
2005
Années
United StatesCanadaAverage
Source: Author’s illustration based on data from the U.S. Bureau of Labour Statistics
5
Figure 2
Source: Cotis (2006)
2.1.1 Sectoral sources of multifactor productivity growth in the business sector Various sectors of the economy grow at different rates and so does their labour and multifactor productivity. Relative to the U.S., from 2000 to 2004 multifactor productivity declined in primary sectors, rose in construction and declined marginally in services and strongly in manufacturing. Historically, productivity has been growing faster in manufacturing than in other sectors of the Canadian economy. Thus, even though the manufacturing sector accounts for less than one fifth of Canada’s total output, its contribution to productivity growth is larger. When the productivity in manufacturing falls, it has a disproportionate effect on the productivity of the whole business sector. MFP in manufacturing declined from 0.77 of the U.S. level in 2000 to 0.66 in 2004.3 Based on hours worked , the overall MFP gap relative to the U.S. business sector is about 25 percent gap relative to the U.S. manufacturing sector in 20044 (Rao, Tang and Wang, 2006). The structure of the Canadian manufacturing industry has been, and still is, dominated by mature natural resource-based industries that are characteristically less dynamic and less productive than the knowledge-based industries exploiting recent scientific discoveries. Thus the two industries which experienced the fastest growth of productivity in the U.S. (electrical and electronic equipment and machinery (check names) accounted for more than twice the
3 Productivity calculated as GDP per worker. If the measurement were based on GDP per working hour, the productivity gap would be about 10 to 12% points smaller because Canadians on average work about 10% less per year than the U.U, workers. 4 Based on hours worked.
6
share of manufacturing PIB in the U.S. than in Canada. Those two industries experienced fast growth and increased their share of U.S. manufacturing PIB from18.5% in 1989 to 34.8% in 1997. In comparison, their share in Canadian manufacturing PIB increased over the same period by less than two percentage points to 13,5%. Canadian productivity deficit was largest in these two industries. Since these are industries supplying ICT and advanced manufacturing technologies to the rest of economy, Canada’s poor performance in these industries impacts negatively not only on other manufacturing industries but on services and primary sector as well.5 Canadian firms also invest significantly less in the ICTthan their U.S. counterparts. The average share of ICT capital in total machinery and equipment capital in Canadian manufacturing industries has increased from 2.8% to 3.9% from 1995 to 2003. Over the same period the corresponding share of ICT increased in the U.S. manufacturing from 8.0% in 1995 to 11.6% in 2004. In contrast, the share of ICT in total machine and equipment capital used in the service sector was virtually identical in both countries (Rao, Tang and Wang, 2006, Table 3). Are there other possible explanations of the post 2000 decline of productivity growth in Canada? The fact that the economic growth slowed down to less than half of the fast growth recorded from 1995 to 2000 did not help. Insofar capital and labour were not adjusted downward proportionally at the same time, productivity deteriorated. However, as pointed out by Rao, Sharpe and Smith (2005), U.S. productivity did not slow down even though the output growth declined in the U.S. as well. According to the authors, the slow-down of Canadian productivity after 2000 may be due to a decline in long term trend of productivity growth. In addition to lower ICT investment, the slow-down of the long term MFP trend may be due to weaker innovation performance as manifested by lower R&D intensity, deficiencies in manpower skills and lack of openness to international trade and investment. In the light of these findings, to reduce the MFP gap Canadian industries should invest more in machinery and equipment, adopt faster advanced ICT and increase the skill level of their manpower and engage more intensively in innovating activities. They should also resist the temptation of protection against imports and export. It should be noted that reducing or closing the M&E capital gap would reduce directly the labour productivity gap via the capital deepening effect, and indirectly by stimulating adoption and diffusion of new technologies. The ingredients of a faster productivity growth are mutually reinforcing. Skilled manpower and R&D activity are crucial ingredients for adoption of advanced technologies (Hanel and Niosi, 2006).
5 In this context it is interesting to look at Sweden’s outstanding reversal and stellar labour productivity performance (Lind, 2005) of 4.9%/year over the 1960-2004 period, owing to a single industry- Radio-TV and communication equipment), in fact pulled by a single dominating firm Ericsson. This suggests a potentially interesting comparison with the Canadian Communications equipment industry dominated by Nortel Networks.
7
2.2 Canada’s innovation performance in international comparison The first apparent plausible cause of a decline of the long term TFP trend is Canada’s weak innovation performance. By most standards, indicators of Canada’s innovation activities compare poorly not only with those of the U.S., but also with those of many other OECD countries. The most frequently used indicator is the R&D expenditures relative to GDP, or a related measure, the number of Scientists and Engineers employed in R&D activities as share of total employment.6 Bernstein (2000) examined evolution of the Canadian - U.S. labour productivity and R&D Investment as a percentage of GDP in total economy and in the manufacturing sector over 1963-1996. At the beginning of the period Canada’s R&D/GDP has been less than half of the U.S. level in the total economy, and less than one quarter of the U.S. level in manufacturing. Owing to the faster growth of R&D in Canada the gap narrowed substantially, but it is still important. The recent slower growth and even occasional decline of R&D/GDP in the U.S. helps to improve the Canada-U.S. comparison statistics but it also means that when R&D and innovation slows down or declines in the U.S. as it had from the mid eighties to the mid nineties, the flow of R&D spillovers from the U.S. to Canada may slow down as well and contribute less to productivity growth in Canada. The Canada/U.S. R&D to GDP ratio (0.55) for the total business sector has not changed from 1995 to 2003 and it actually improved from 0.48 to 0.59 in manufacturing (Rao, Tang, Wang, 2006). But a simple comparison of R&D intensity is far from telling the whole story. Innovation is a complex activity and R&D is only one, albeit the most important, input. A more comprehensive index of National Innovation Capacity based on a series of indicators has been introduced by Porter and S. Stern (1999). It is one several indicators used in the Global Competitiveness Report (Cornelius, 2003). With respect to innovation and technology role in competitiveness the report distinguishes between two groups of countries. The technologically advanced countries belong to Core technology innovators group and all other countries are Non-core innovators. Canada belongs to core innovators where it ranked ninth in 2002, the same rank it held in 1995, compared to the 7th place it would have held according to the 1995 criterion7 in 1980. It is noteworthy and symptomatic of changes in the global economy that in 2001 the group of 24 core innovating countries comprises six countries that would not been included in 1980, two small European countries Island (18th) and Ireland (21th) and four east Asian ‘tigers’ Taiwan (3rd), Korea (12th), Singapore (14th) Hong Kong (21th). Another fact worth noting is that half of the countries ranking higher than Canada on the innovation index are small countries (Finland, Switzerland, Sweden and Taiwan). Thus the satisfaction of Canada’s improved ranking relative to some of the G7 countries must be seen in the light of some non-G7 countries leaping forward. Five other countries are behind Canada by less than a point and have a good chance to move ahead. 6 The use of these two alternate measures of R&D intensity as indicators of innovation performance share the problem of measuring only a fraction of resources used in the innovation process (see Baldwin &Hanel, 2003 for distribution of innovation costs) and not the outcome of innovation process. 7 The number of US utility patents granted per million population in 2001.

8
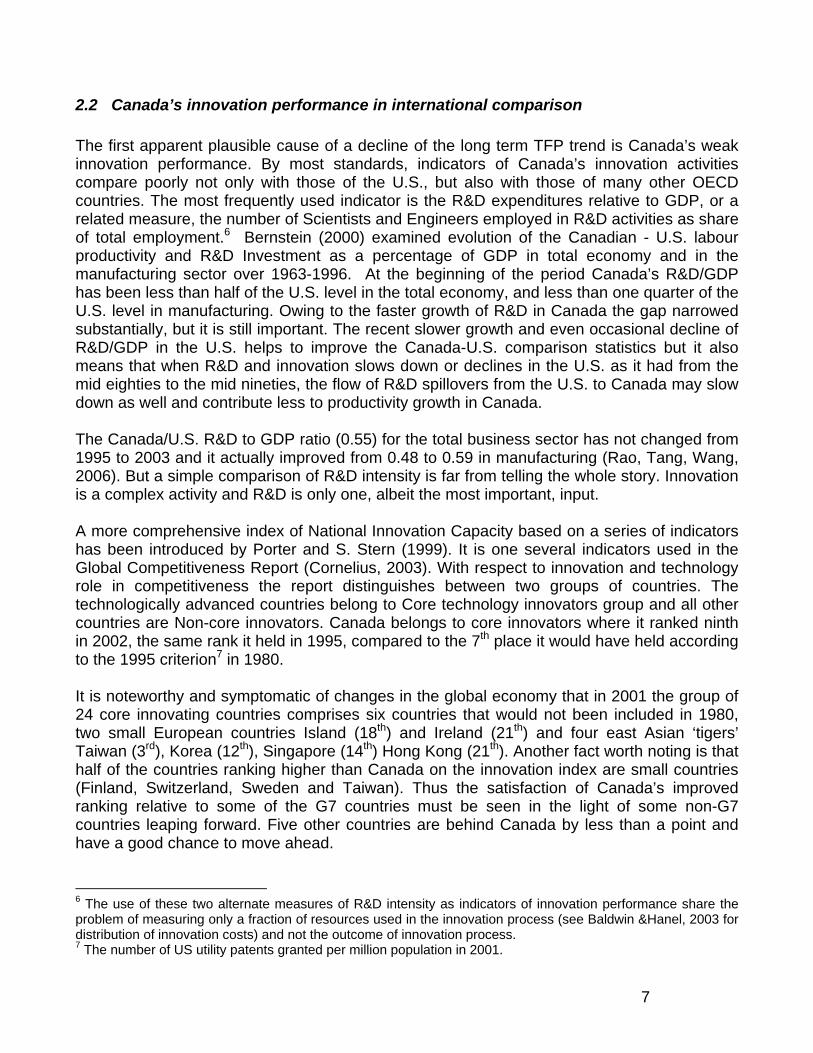
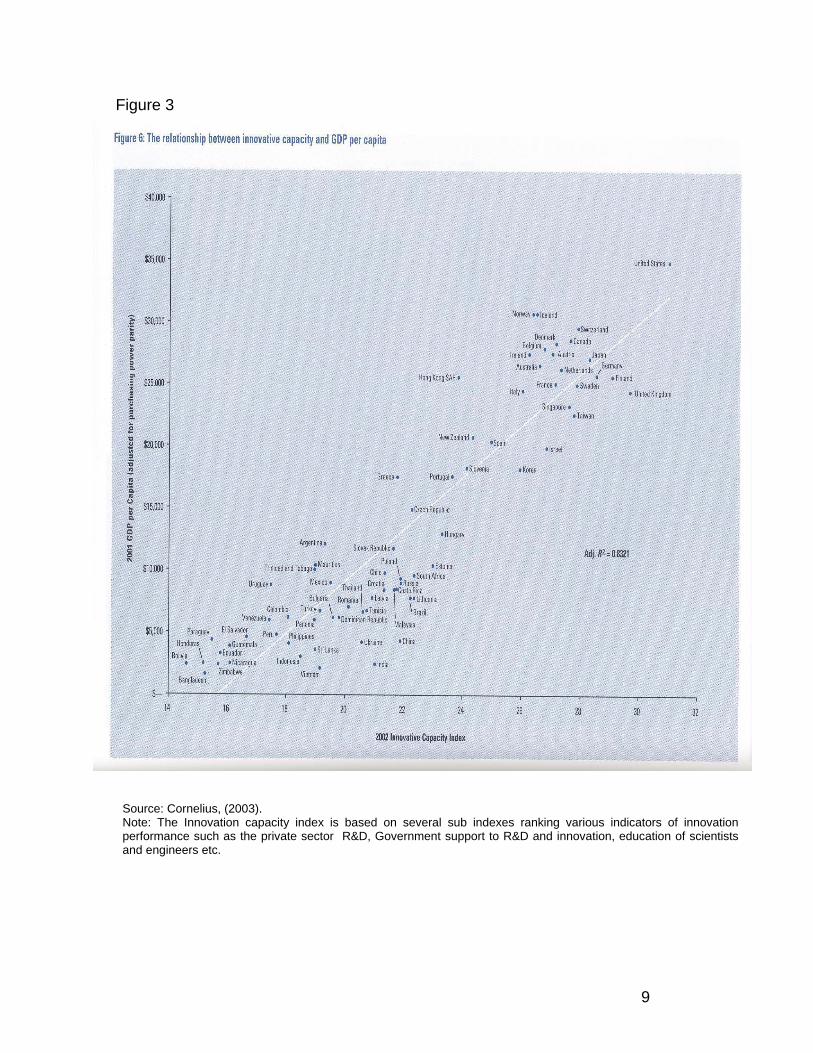
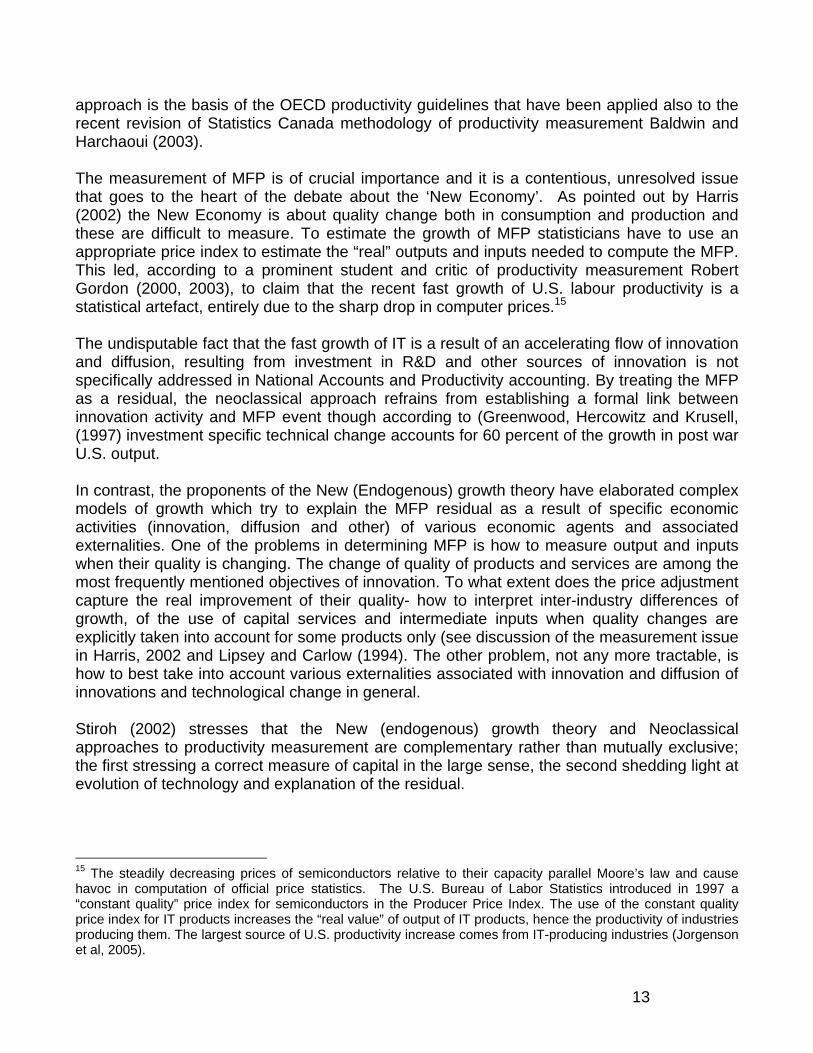
More important than the overall ranking is the disturbing message sent by innovation sub-indexes, used in the calculation of the Innovation Capacity index. Owing to a very generous public support of R&D (tax credits, grants and other instruments) Canada ranks 3rd on innovation policy sub-index. However, this generosity does not seem to be working with the business sector that ranks 18th on ‘Company innovation orientation’. Another two aspects that pull the overall innovation ranking down is the ‘Cluster innovation environment’ index on which Canada ranks (13th) and ‘Scientific and Engineering manpower situation’ (12th). The theoretical framework behind the Global Competitiveness Index is the endogenous growth model which postulates that growth is fuelled by knowledge creation and knowledge spillovers. Leading countries are considered to have reached the Innovation-Driven stage, defined as the ability to produce innovative products and services at the global technology frontier using the most advanced methods that becomes the dominant source of competitive advantage (Cornelius, 2003, p. 28). The relationship between the innovative capacity index and GDP per capita evaluated at the purchasing power parity estimated by a linear regression shows a close correlation (R2= 0.83) between the two variables for the 80 countries included in the analysis (see Figure 3).8
8 A closer look at the core innovator group with the highest value of the technology capacity index shows that had the regression been estimated only for the Core innovators without the U.S., it would have been less convincing. This suggests that some of the important determinants of the level of GDP per capita in high income countries are missing from the analysis.
9
Figure 3
Source: Cornelius, (2003). Note: The Innovation capacity index is based on several sub indexes ranking various indicators of innovation performance such as the private sector R&D, Government support to R&D and innovation, education of scientists and engineers etc.
10
More recent information from Canada’s standing in OECD main science and technology indicators shows that Canada’s business sector R&D activity has declined from the peak around the 2000 to a level similar as in mid 90s (OECD, 2006, Table 26)9. This flat long term performance is also reflected in employment of scientists and engineers in R&D per 1000 employees in industry. They constituted 5% of industry labour force in 1995 and increased to 6.6% in (2001 the latest data available. Over the same period the same ratio increased from 4.8 to 13.4 in Finland, from 7.7. to 10.5 in Sweden and from 9.3 to 11.3 in the U.S.(OECD, 2006, Table 29). The only noticeable improvement in Canada’s situation is the strong increase of higher education expenditures on R&D that almost tripled in Canada from 1995 to 2006 and its share of GDP a augmented from 0.46 in 1995 to 0.75 in 2006. This increase is very likely due to medical and pharmaceutical research. (OECD, 2006, Tables 45 and 46). This is corroborated by an increase in R&D spending by the pharmaceutical industry, which is also the only one which in Canada more than doubled its BERD in current PPP $ over the last ten years. As regards innovation output as measured by Canada’s share of triadic patent families, the share hardly increased from 1.37 in 1997 to 1.40 in 2003 (OECD, 2006, Table 66). Patent applications in the ICT sector initially almost doubled but this increase was compensated by a decline in biotechnology patents which is surprising given the R&D spending increase in the pharmaceuticals. The trade deficit in pharmaceuticals has more than doubled from 1998 to 2004. Canada receipts in technology balance of payments increased from 1995 to 2000 and have been declining since then and so were the expenditures (data available to 2003 only). The decline of payments indicates less technology transfer to Canada which is not a good news. The OECD document also shows selected statistics on non-OECD countries which document that Israel, Taiwan and Singapore rank higher than Canada on several indicators and China is dangerously catching up in ITC. Thus the news on innovation and their diffusion in Canada is not encouraging no matter what indicators are considered. The next section of the paper presents some basic concepts of innovation, their sources and effects as well as their measurement. 3. Sources of economic growth, increasing productivity and innovation:
Concepts and data Economic growth results from increased quantity of resources used in production, by their improved quality and by their more efficient use. When the economic growth is fuelled by employing increasing quantity of labour, capital (man-made production equipment) and intermediate goods and services (raw material, fabricated inputs, energy and services) it is often called extensive development. Extensive development is constraint by the available 9 : BERD as % of GDP in Canada fell by 0.27 in 2001 to 1.02%point in 2006, only marginally superior to 1995 situation 0.99 (OECD,2006, T24) and the same information is conveyed by BERD as % of industry VA. 1.41 in 2006, compared to 1.75 in 2001 and 1.38 in 1995.

11
human and material resources. In contrast, intensive development is based on improved efficiency – productivity - of combining the basic production factors and inputs and on quality improvement of labour and capital. The more advanced an economy, the more its growth depends on improved productivity and quality of labour and capital.
3.1 Economic growth and productivity The basics of economic growth process can be illustrated10 by the following simplified relationships: Output is function of the quantity of resources used in production and the productivity (efficiency) of the production process
Output = resources used in production x productivity (1) Economic growth, i.e. the growth of output (measured by the aggregate value added called gross domestic product, GDP), is given by the growth of resources used in production and the growth of productivity (% denotes annual growth rate): %Output = %resources used + %change in productivity (2) This simple relationship shows that the economic growth comes from the increased quantity of resources and from their increased productivity. It is a combination of extensive and intensive development. The productivity increases when the growth of output is faster than the growth of resources used in producing it. %change in productivity= %Output - %resources used (3) The economic welfare is usually measured by real GDP per capita (real GDP is the value of GDP expressed in constant prices of a reference year to eliminate the effect of inflation). As the following relationship shows, GDP per capita is closely related to labour productivity. GDP/Population= (GDP/Hours of work) x( Hours of work/Population) (4) Thus the GDP per capita is determined by labour productivity (Real GDP/Hour of work) and by the intensity of work, i.e. the number of hours worked by the population.11 In terms of annual growth rates the relationship above (4) can be written as follows:
10 This section is based on a very good introduction to productivity by Kaci (2006). 11 On average, Americans work 10% more hours than Canadians. Thus even with identical hourly labour productivity, U.S. GDP per worker is about 10% higher than in Canada. Meaningful comparisons of labour productivity between the U.S. and Canada have to be based on the same measure of labour or, at least, adjusted for the difference in hours worked.
12
%(GDP/Population) = %(GDP/Hours worked)+ %(Hours worked/Population) (5) The relationship shows that an increase of GDP per capita can be achieved by increasing the number of hours worked (for instance by reducing unemployment), by increasing labour productivity or by a combination of the two. As an economy approaches full employment, the only way to increase GDP per capita is to increase its labour productivity. Canadian GDP per capita advanced annually by 2.4% over the 1961-2000 period. Labour productivity increased by 1.8% annually and the number of hours worked per person increased by 0.5%. Labour productivity growth was the key factor behind the growth in the standard of living! What determines labour productivity? The growth of output per hour of work is determined by three components: the growth of the amount of capital per worker (growth of capital intensity), the growth of quality of labour (measured as the percentage of university educated labour in total employment) and the multifactor productivity growth, also called total factor productivity %(MFP= %GDP -% (resources used in production). (6) %(GDP/Hours)12 = %(capital/hours) + %labour quality + %MFP (7) The decomposition of the growth of labour productivity is available only for the Business Sector and not for the whole economy13. Labour productivity in Canadian business sector increased annually by 2.2% of which increasing capital intensity accounted for 1%, multifactor productivity for 0.7% and labour quality for 0.4% annually from 1961 to 2000. These figures borrowed from Kaci (2006) show the relative importance of investment, productivity and labour quality growth contributions to labour productivity growth. The increasing capital intensity is to a large extent determined by : (1) the growing ratio of machines and equipment per worker. Machinery is increasingly incorporating advanced computer- based technologies.14 To use the increasingly complex new machinery requires a (2) steady improvement in labour “quality”. The remaining growth factor (3) multifactor productivity is computed as a residual, that can not be ascribed to the two other components. The growth of multifactor productivity is often interpreted as a measure of technological change. Technological change results from innovation and their diffusion in the economy. According to neoclassical economic theory, the MFP is interpreted as a measure of quality changes and other aspects of technological change imperfectly captured in measured outputs and inputs. An example of this approach is the recent study of MFP in Canada (Jorgenson, 2004, and a more general overview of this approach in Jorgenson, Ho and Stiroh, 2005). This
12 Hours = hours worked 13 This is because there are no reliable estimates for the growth of multifactor productivity in the non-business sector (government and public services). 14 See Jorgenson (2004) for a decomposition of capital investment into information technologies (IT) and non-IT components.
13
approach is the basis of the OECD productivity guidelines that have been applied also to the recent revision of Statistics Canada methodology of productivity measurement Baldwin and Harchaoui (2003). The measurement of MFP is of crucial importance and it is a contentious, unresolved issue that goes to the heart of the debate about the ‘New Economy’. As pointed out by Harris (2002) the New Economy is about quality change both in consumption and production and these are difficult to measure. To estimate the growth of MFP statisticians have to use an appropriate price index to estimate the “real” outputs and inputs needed to compute the MFP. This led, according to a prominent student and critic of productivity measurement Robert Gordon (2000, 2003), to claim that the recent fast growth of U.S. labour productivity is a statistical artefact, entirely due to the sharp drop in computer prices.15 The undisputable fact that the fast growth of IT is a result of an accelerating flow of innovation and diffusion, resulting from investment in R&D and other sources of innovation is not specifically addressed in National Accounts and Productivity accounting. By treating the MFP as a residual, the neoclassical approach refrains from establishing a formal link between innovation activity and MFP event though according to (Greenwood, Hercowitz and Krusell, (1997) investment specific technical change accounts for 60 percent of the growth in post war U.S. output. In contrast, the proponents of the New (Endogenous) growth theory have elaborated complex models of growth which try to explain the MFP residual as a result of specific economic activities (innovation, diffusion and other) of various economic agents and associated externalities. One of the problems in determining MFP is how to measure output and inputs when their quality is changing. The change of quality of products and services are among the most frequently mentioned objectives of innovation. To what extent does the price adjustment capture the real improvement of their quality- how to interpret inter-industry differences of growth, of the use of capital services and intermediate inputs when quality changes are explicitly taken into account for some products only (see discussion of the measurement issue in Harris, 2002 and Lipsey and Carlow (1994). The other problem, not any more tractable, is how to best take into account various externalities associated with innovation and diffusion of innovations and technological change in general. Stiroh (2002) stresses that the New (endogenous) growth theory and Neoclassical approaches to productivity measurement are complementary rather than mutually exclusive; the first stressing a correct measure of capital in the large sense, the second shedding light at evolution of technology and explanation of the residual.
15 The steadily decreasing prices of semiconductors relative to their capacity parallel Moore’s law and cause havoc in computation of official price statistics. The U.S. Bureau of Labor Statistics introduced in 1997 a “constant quality” price index for semiconductors in the Producer Price Index. The use of the constant quality price index for IT products increases the “real value” of output of IT products, hence the productivity of industries producing them. The largest source of U.S. productivity increase comes from IT-producing industries (Jorgenson et al, 2005).
14
There is no unanimity regarding the interpretation of MFP as a measure of technological change, see Lipsey and Carlow (1994). However, there is an agreement among economists that innovation and their diffusion contributes to productivity growth. Several recent studies in the collective volume by Rao and Sharpe(2002) addressed various aspects of this relationship in the Canadian context (Morck and Yeung (2002), Harris, 2002; Globerman,2002; Trajtenberg, 2002; and Rao et al, 2002).
3.2 Innovation History of technological change focused on path breaking technological innovations of individuals who opened new industries, new markets and new technologies. This led Schumpeter (1939, 1942) to formulate his theory of innovation as an isolated act of individual entrepreneur-innovator- who is the person who discovers new, commercially untried ideas and introduces them on the market, and creates new firms, industries and markets. In the process the entrepreneur-innovator enjoys temporarily a monopoly situation and profits which are, according to Schumpeter, the driving force of innovation. The post World War II era, saw the arrival of the institutionalized research and development activity and the generally accepted model of innovation became what is now called the “Linear model” In this model, as described by Kline and Rosenberg (1986), “one does research, research then leads to development, development to production and production to marketing”. The linear model neglects many crucial contributions to innovation coming from other sources than R&D. It also does not account for the many important feedbacks involved in a typical innovation process. The growing understanding of complexities characterizing the innovation process led to replacement of the linear model by the “Chain-linked model” (Kline and Rosenberg, 1986, p. 289). The chain-linked model articulates in a more realistic way the various contributions of science and other sources of existing knowledge at various stages of the innovation process. It also underlines the uncertainty involved in innovation. The Chain-linked model shows that both major innovations and incremental innovations that often accompany adoption and diffusion of original innovations are important for technological progress. The model also stresses the important contribution to innovation from various sources within the innovating firm and external sources of market information and technical expertise.
3.2.1 Operational definition of technological innovation, its measure and data Earlier surveys of innovation relied on expert opinions and/or extensive surveys of technical and trade literature to identify major innovations. They spanned long periods and focused on identifying major innovations and innovators. They provided more information on the technical characteristics of each innovation and their antecedents but less information on the innovating firms and the sources of innovation than the current generation of innovation surveys. On the other hand, their economic and technical impact over time could be assessed more objectively and with more precision.
15
It is now accepted that the development and diffusion of new technologies are central to the growth of output and productivity. After collecting internationally comparable data on R&D activities since the early sixties, OECD in collaboration with EUROSTAT launched in the early 90s a concerted effort to collect information on the whole innovation process. The guidelines for internationally comparable and compatible data collection was elaborated in the so called Oslo Manual. The first version of the OM was published in 1992 and served as a methodological guide for the first Innovation surveys of several European countries. The most recent 3rd version of the OM dates from 2005 (OECD, 2005). The operational definition of innovation underwent subtle but important modifications from the 1st to the 3rd edition of OM. The first two editions stressed the technological aspect of innovation. This narrow focus on “technological “ innovations was not well suited to organizational innovations, marketing innovations and innovations in services and some non-manufacturing sectors. The current definition is more general:
An innovation is the implementation of a new or significantly improved product (good or service), or process, a new marketing method, or a new organisational method in business practices, workplace organisation or external relations. (OECD, 2005).
The recent surveys of innovation conducted by Statistics Canada in 2003 and 2005 follow the guidelines of the 2nd edition of the Oslo Manual and were coordinated with the European Community Innovation survey CIS3. Surveys of innovation conducted by Statistics Canada ask firms whether they had introduced a significantly improved or new product or production process in last three years. The time span of three years is relatively short for innovation activity that may sometime take years before its results are implemented. The short term horizon favours minor innovations over the major ones. Since the successive innovation surveys in Canada are not necessarily administered to the same firms and they are conducted irregularly at intervals longer than three years, it is well possible that some major innovations that were not yet on the market in the period covered by say SI-1999 are not included in the next one conducted in 2005.
3.2.2 Types of innovation There are several taxonomies of innovations. The most frequent one classifies innovations into two groups: (1) new or significantly improved product (good or service) and (2) new or significantly improved production process (method) innovation. This dichotomy is often unrealistic; major product innovations may introduce a new product that is produced by a new or improved manufacturing process. These “complex” innovations are qualitatively different from the simple product or process innovation; they often feed on a larger assortment of internal and external sources of ideas and technologies. In comparison with the single product or process innovations, the economic impact of complex innovations is usually more significant as demonstrated in analysis of the Survey of Innovation and advanced technology, 1993 (Baldwin and Hanel, 2003). The more recent Surveys of innovation conducted by Statistics Canada followed the OM and used only a two-way classification. It is not clear how
16
respondents classified the “complex” innovations and the specifics of these more complex innovations can not be identified.
3.2.3 Novelty of innovation By definition, all innovations must contain a degree of novelty. Three concepts for the novelty of innovations are discussed below: new to the firm, new to the market, and new to the world. Canadian Surveys of innovation interpret the class ‘new to the market’ as new to the Canadian market, that is in my view a more meaningful criterion that the one suggested by the guidelines of the OM. According to the OM (OECD, 2005, p. 209) innovations are new to the market when the firm is the first to introduce the innovation on its market. The market is simply defined as the firm and its competitors and it can include a geographic region or product line. The geographical scope of new to the market is thus subject to the firm’s own view of its operating market and it may include both the domestic and the international market. Innovations new to Canada are in fact manifestation of international diffusion of an innovation. Those new to the firm are result of intra-Canadian diffusion of technology. The diffusion of new or improved products or production methods may represent lesser technical challenge than a world-first innovation, but it should be remembered that the economic benefits of a world-first innovation may be insignificant as long as the new product or process has not been adopted by a large majority of potential users. The technical and entrepreneurial prowess manifested by introduction of a world-first innovation is of little economic value before it is largely diffused. This consideration is often forgotten by policy makers who pay more attention to policies supporting creation of innovations than to their diffusion. 3.2.4 Sources of innovation Owing to case studies, and more recently innovations surveys, it is now well established that innovative ideas, suggestions and inspirations are rarely based on a single source. Within the firm innovative ideas come from management, R&D staff, and frequently also from sales, marketing and production personnel. Management of the firm is often the main source, especially in smaller firms without a separate R&D division. In addition to internal resources most innovating firms also use extensively ideas and suggestions from various external sources. Market partners: clients, suppliers, competitors, related firms and consultants are often at the origin of an innovation idea. To reduce the risk involved in innovation, to access complementary expertise and share the costs and risks, innovating firms increasingly collaborate with other firms, sometimes even with their competitors, with universities and public research institutions. Precious information is also obtained from services and institutions of ‘technology infrastructure’ such as publications, trade fairs and conferences, patent and regulatory information to name only the most important sources. While some of these sources supply technical information, others provide market signals that identify the potential demand –or the lack of it (more about sources of Canadian innovations in Baldwin and Hanel, 2003 and Landry and Amara in Gault, 2003). Sources of innovation vary according the type of innovation, the technological or scientific field and the novelty of innovation. In some industries new production methods and artefacts are introduced by their prospective users rather than by manufacturers, in others suppliers of
17
equipment and intermediate inputs may be at the origin of an innovation. The sources of innovation are not distributed randomly. They are, to a certain degree, predictable and determined by the nature of innovation (product, process, combination of product and process) and the functional group (manufacturers, users, suppliers and others) most likely to benefit most from the innovation (Von Hippel, 1988). Thus the functional source of innovation is conform to economist’s view that the costly and uncertain process of innovation will be undertaken as a profit maximizing response to market and technological opportunity.16
3.2.5 Cost of innovation
R&D expenditures are rarely the most costly component of the total innovation cost. Innovations often require expenditures on the acquisition of technological knowledge (patents and trade marks, licenses, consulting services, and disclosure of know-how), on development (engineering, design, prototype and/or pilot plant construction and testing), on manufacturing start-up (engineering, tooling, plant arrangement, construction, and acquisition of equipment), and on marketing start-up activities. The composition of the cost varies greatly among innovations, depending on the industry, type of innovation and its novelty. From the data available for manufacturing innovators surveyed in 1989-1991 period it appears that on average the research accounts for about one sixth of total innovation cost. Development not included in R&D is about twice as important as the combined R&D expenditures. Acquisition of technology (patents, licenses etc.) accounts for about one tenth of total innovation cost. Manufacturing start-up is even more costly, absorbing about one third of total innovation costs. Finally, the marketing effort that is required to bring innovations to consumers is about as important as the R&D components. These figures suggest that the public support for R&D expenditures addresses only a small portion of the total innovation cost and is likely to have only a small effect on introduction of innovation, especially by small and medium size companies that often innovate without a structured R&D program (Baldwin and Hanel, 2003).
3.2.6 Public support to financing innovation Financing innovation is a problem that the majority of firms resolve by using internal funds (Baldwin and Hanel, 2003). Financial constraints are more severe and frequent in mid and low tech sectors than in high-tech industries. They affect more small and medium size firms and the less rather than the more novel innovations. For a comprehensive survey of foreign studies regarding the financing of R&D see Hall (2002). Hall finds that small firms face high cost of capital that is only partly mitigated by the venture capital. Those firms that do not capture the spotlight of those VC specialists who provide financing for risky investments in innovation will more likely be constrained in their financing sources This suggests that markets emerge to solve problems in financing, but that the solutions primarily focus on the highest profile innovators (cf. Baldwin, Gellatly and Gaudreault, 2002).
16 Often an innovation is attributed to its manufacturer, even though the actual inventor and innovator was a user, supplier or an outsider.
18
Canadian public support for R&D activities, namely the federal Scientific Research and Experimental Development Investment Tax Credit (SR&ED) program complemented by various provincial initiatives is one of the most generous in the world (Warda, 2007)17. Even though the SR&ED has been adjusted to be more accessible to smaller firms, many SME firms do not apply for fiscal R&D incentives. As for the effect of SR&ED, several studies suggest that it helped to increase private business expenditures on R&D (Finance Canada, 1998; Dagenais, Mohnen Therrien, 1997). An overview of the foreign evidence by Hall and van van Reenen (2000) came to a similar conclusion. One of the difficult questions regarding the empirical studies of the effect of fiscal incentives on R&D is to determine whether they do not encourage projects that would have been undertaken even without public support. A recent study by Czarnitzki, Hanel, Rosa (2004) suggests that the SR&ED program did indeed induce additional R&D activity. However, little is known about the effect of fiscal incentives for R&D on economic outcomes of innovation activities. What if public support for R&D induced firms to undertake sub-par projects that would not be realized otherwise? A study of the SR&ED effect on performance indicators of firms claiming fiscal incentives suggest that it is not possible to reject the conclusion that government support is not associated, at least in the short term, with improved productivity and other performance indicators. The direction of the causal relationship also remains uncertain (Czarnitzki, Hanel, Rosa, 2004).
3.2.7 Effects of innovation Firms innovate to increase their productivity and profitability, which can occur via reductions in costs, improvements in sales, or a combination of both. The outcome of product innovations should be observable in increased sales and market shares, process innovations are undertaken mainly to reduce production costs but often also pursue other objectives. Therefore, innovations are launched with the expectation of increased profitability and improved productivity. But innovators also pursue other objectives such as better service to customers, more flexible production, reduced pollution, satisfy safety norms and other regulations etc. Using long series of accounting data for a limited number of innovating firms, Mansfield et al. (1977) pioneered a study that examined and documented effects of innovations on the economic performance of innovators and their competitors. The study demonstrated that most but not all innovation provide high return on investment. More importantly, it also documented that on average the society benefits from innovations substantially more than the innovating firm; social return to investment are significantly higher than the private returns. Results from innovation surveys based on responses of innovating firms show that the majority of innovating firms report fulfillment of these objectives.18 Results from the more
17 The size of tax credits surpassed R&D grants by 1983 and had reached about 18% of business enterprise intramural R&D expenditures (BERD) by 1989. The share of R&D and innovation related grants in BERD peaked at about 7% in 1982 and declined to 1.3% in 2000 (Czarnitzki, Hanel, Rosa, 2004). 18 Thus for instance about two thirds of innovating manufacturing firms reported improved profit margin , slightly higher percentage an increased in domestic market share and about 40% increased foreign market share. These quantifiable results were obtained through “qualitative changes such as : improved interaction with
19
recent Survey of innovation 1999 in manufacturing are of the similar order of magnitude. Innovators in selected service industries have also reported improved productivity, profitability and improved interaction with customers and other positive outcomes of innovation. A particularly interesting outcome of innovation is the share of new and improved products in the innovating firm’s sales. This information measures directly the actual commercialization of innovated products. A comparison with innovating firms from four European countries (Germany, France, Ireland and Spain) suggest that the incidence of innovation in manufacturing (1999) was higher in Canada but European firms reported higher share of new and improved products in sales (Mohnen and Therrien, 2003). Many innovations, especially those based on ICT, provide gains that are not explicitly and immediately reflected in existing economic output statistics: improved quality, flexibility, speed and convenience of goods and services. These qualitative improvements are likely to improve innovator’s competitiveness but they are unlikely to be reflected in accounting data. Interestingly, innovating firms operating in the low tech manufacturing industries reported increased profitability just as often as firms in the mid tech “secondary” and high tech “core” sectors. This pattern emphasizes the important economic contribution associated with the diffusion of innovation from high to low tech sectors and of the diffusion of technological change through imitation. Original innovation may not occur as frequently in the downstream sectors, but innovation is just as frequently listed as being profitable in these industries. While the above mentioned outcomes of innovation are an obvious contribution to national economy and its growth, innovation and technological change may affect negatively employment by substituting machines and equipment for labour. Innovations reduced labour costs in many firms. However, firms that reported increases in the employment of production workers owing to innovation substantially outnumbered those firms where innovation led to a decline in employment. The employment creation of non-production jobs was particularly important. Innovation also improved the working conditions in almost one-third of innovating firms and increased the demand for more skilled workers in almost two-thirds of all innovators. (Baldwin and Hanel, 2003, T6.7). Major innovations introduce, so to speak, a “new specie”, leading to the disappearance of the old ones – through the process of creative destruction described by Schumpeter. The major innovation is gradually improved and adapted to particular market conditions through a continuous accumulation of incremental innovations. As stressed by Morck and Yeung (2002), the “Schumpeterian perspective” and its emphasis on the importance of dynamic efficiency i.e. optimizing firm’s strategies by taking into account the importance of new goods and services for economic growth and future economic conditions is as relevant for Canada today as it was in Schumpeter’s time. The authors argue that contributions of management culture and practices as well as the contribution of an efficient financial system to successful innovation are not receiving the attention they deserve. The process of creative destruction characteristic of technological change invites an analogy with the theory of evolution (Nelson and Winter, 1982). Like biological species, firms evolve, customers (73%), improved quality of products (60%), extended product range 56%, reduced lead times (32%) and improved interaction with suppliers 25%) Baldwin and Hanel, 2003, Tab 6.3).
20
those that have more adaptable standard procedures – routines- to deal with competition will prosper and grow at the expense of the less successful ones (cited by Mokyr, 1990, p.275). According to Mokyr, the analogy is more between specie and a technique than between specie and a firm. Like mutations in the world of biology, innovations represent deviations from the standard technology. They are exposed to series of tests on the market place. The process of natural selection provided by the market place eliminates most of them; they do not survive infancy. The innovation process is therefore subject to major uncertainties. In contrast to the neoclassical theory which is based on the hypothesis of complex decisions being solved by perfect rationality, evolutionary theory (ET) assumes bounded rationality and stresses the importance of cumulative learning, partly by individuals, partly by organizations and partly by society.
4. The link between Innovation and productivity Until very recently, the studies of the relationship between innovation and productivity focused almost exclusively on macro and industry-level observations in industrialized countries. The macroeconomic and industry level findings are important and instructive, but they do not help much to identify the sources and obstacles to innovation, nor do they help to understand the complexity of translating innovations into market success. It can be argued that, as politics, innovation and productivity is first of all local, taking place in a firm or establishment in a particular economic, geographical and institutional context. Understanding of the importance of national and even regional systems of innovation sheds the light on the importance of non-technical factors that may help or hinder innovation activity. To understand the process of innovation and the ways it translates- or not- in productivity gains, it is necessary to observe and analyze micro-observations such as the Statistics Canada survey data available on Industrial R&D and more recently on Innovation and Adoption of Advanced Manufacturing Technology.
4.1 The relationship between R&D economic growth and productivity There is growing evidence that innovation is among the main sources of productivity growth. Most industrial countries have collected for over forty years internationally comparable data on the principal innovation input, the R&D activity in manufacturing and more recently also in services industries19. Thus, instead of modelling the relationship between productivity and innovation, most econometric studies examine the nexus between the labour or MFP growth and various measures of R&D activity. Product-related R&D activity expands existing or creates new markets and process-related R&D activity reduces production cost. Both types of R&D are often combined when the innovation is a new product requiring a new or improved production technology.
19 Even though some innovations are introduced by firms not involved in research and development, innovation surveys demonstrate that R&D is the most important, but far from the only, input in the innovation process (Baldwin and Hanel, 2003)
21
4.1.1 Return to investment in R&D and innovation When an innovation is commercially successful and its benefits accrue to the firm that invested in the R&D activity, it yields a private return to R&D investment. Given the partially free and non-rival nature of the new knowledge created by private R&D activity, it often ‘spill over ‘ to other firms and sectors over regional and national boundaries by imitation, legal and illegal, by commercial transactions and various forms of technology transfer. These spillovers of R&D-related knowledge generate benefits to other economic agents that can not be entirely appropriated by the original innovator. Hence, the social benefits of the R&D investment are usually larger than the private benefits. An open economy’s productivity growth is fuelled not only by its own R&D activity but also by diffusion and transfer of innovations and new technology from abroad. Open economies benefit from international flows of technology in at least two ways. First, by importing intermediate inputs, capital equipment and services that incorporate new technology, firms in the importing country embody new technology in their own production. In the process they acquire inputs embodying new technology and knowledge on how to use them, often at a lower cost than their full value. Second, foreign direct investment, reputedly the most efficient way of technology transfer, is another potentially important source of R&D externalities20 from abroad. Even though some benefits associated with transfer of technology via foreign trade and activities of foreign-owned firms are paid for by royalties, professional fees, etc., an important part of acquisition of new ‘knowledge’ from abroad is not a commercial transaction.
4.2 Foreign control and productivity A substantial part of the Canadian economy is owned and controlled by foreign, mostly U.S., multinationals. Foreign-controlled firms in Canada account for more than half of manufacturing industries’ sales and they are more productive than firms under the Canadian control. Their superior productivity is to a large extent due to their larger size and higher capital intensity (Globerman and Vetinsky, 1994) and more frequent innovation. Not only do foreign-owned firms transfer and adapt to Canadian market innovations from abroad, they also contribute significantly through their R&D in Canada. Foreign-controlled firms collaborate with Canadian universities and other firms in creating original innovations in Canada (Baldwin and Hanel, 2000 and 2003). Foreign-controlled plants are also more likely to adopt advanced technologies than their Canadian-owned competitors (Baldwin and Sabourin, 1997 and Baldwin, Rama and Sabourin, 1999). According to recent estimates, the productivity lead of the foreign-controlled segment of the manufacturing sector vary between 10 to 20%. In this context it is worrisome that Canada’s share of North American inbound foreign direct investment declined significantly and so did its share of global FDI that fell from 5.8% in 1990 to 3% in 2002 (Rao and Tang, 2005). Even though the exact extent of foreign-ownership’s contribution to Canadian productivity growth is still open to discussion and further investigation, few could contest that it is beneficial to Canada. Since subsidiaries of foreign controlled firms in Canada often introduce innovations for which the R&D was performed abroad, they are frequently being blamed for Canada’s low business
20 Since spillovers are an externality, for the sake of readability both terms are used interchangeably.
22
expenditures on R&D and low intensity of R&D financed and executed by private business firms. McFetridge (2006) examined this often debated issue and he concluded that foreign ownership is a side issue in this debate. The real problems, according to the author, is the large proportion of Canadian firms whose small size is below the threshold at which a firm begins to engage in R&D. Another issue worth looking into is the lower propensity to innovate of Canadian-owned firms hardly caused by the foreign subsidiaries. Policy initiatives such as attempts to force relocation of R&D by multinationals to Canada are, according to McFetridge, bound to be counterproductive.
4.3 R&D and productivity The issues involved in assessing empirically the relationship between productivity growth and R&D activity has been treated in an influential paper by (Griliches, 1979). Owing to lack of data on R&D, innovation and productivity on the firm level, most of the empirical work was until recently conducted on macroeconomic, sector and industry level.
4.3.1 Results of empirical studies on macro and industry level The research on TFP growth and R&D has been surveyed thoroughly by Griliches and Lichtenberg (1994), Mohnen (1992) to name only few. Most of the U.S studies clearly suggest a positive and strong relationship between R&D activity and growth of labour or total factor productivity. According to a large survey of empirical studies in this field by Mohnen and Mairesse (1999) net rates of return on industry’s own R&D expenditures range on average from about 10 percent to 30 percent. The R&D spillover effects within a country, both at the firm and industry levels, explain why the social rates of return on R&D are superior to private returns. Estimates of social returns vary from 20 percent to over 100 percent in various industries and countries, with an average somewhere close to 50 percent. The empirical evidence on the link between productivity growth and R&D investment in Canada is still mixed. The majority of the Canadian studies, based on 1960s and 1970s data, found no statistically significant relationship between R&D expenditure and the productivity growth of Canadian industries. A survey of more recent comprehensive research (Mohnen, 1992) shows that several studies (Postner and Wesa,1983; Bernstein, 1988, Hanel, 1988 and Mohnen, 1992) came to the conclusion that like in other countries return on R&D spillovers received from other industries Canadian industries was higher than return on industry’s own R&D investment. In more recent study Bernstein (1996) estimated that between 1961 and 1991, 8.5 percent of the average annual rate of productivity growth in manufacturing was accounted for by spillovers from the communications equipment industry. The estimated social rate of return to R&D capital in the Canadian communications equipment industry is 55 percent, more than twice as high as the private rate of return. Mohnen’s (1992) study is the first to estimate the effects of R&D abroad channelled via imports on productivity growth of the Canadian manufacturing sector. The results suggest that the rates of return on spillovers from foreign R&D were in the range of 25 percent to 40 percent. Hanel’s (2000) study documents the existence of a statistically significant link between the stock of R&D and TFP growth in twenty two Canadian manufacturing industries. The study found the private rate of return on R&D investment in the range of 10 to 25 percent
23
and slightly higher returns from 15 to 25 percent to international R&D spillovers channelled via sales of foreign-owned firms in Canada. Decomposition of R&D according to process and product development suggests that R&D focused on process innovation has larger impact on MFP and higher rates of return than product-related R&D. The study shows that own R&D contributes to TFP significantly only in R&D intensive industries and not at all in ‘low-tech’ manufacturing industries. Khanam and Au (2004) found that the gross rates of return to R&D investment over the period 1972-2000 are 0.68 for high-tech manufacturing and 0.31 for the low-tech manufacturing. The estimate of the gross rate of return on R&D investment in the total service sector is 0.22. Parallel to Porter and Stern’s (1999) approach, other researchers have been experimenting with a composite indicator of innovation to capture its multidimensional character. Their approach introduces the concept of innovativeness accounting in analogy with MFP accounting (Mairesse and Mohnen, 2002 and Mohnen, P. et al, 2006). Recognizing the multifaceted character of innovation and adoption of new technology Gu and Tang (2003) constructed a composite indicator based on: R&D/sales, patents/worker (indicators of creation of new technology), skilled labour (university graduates / total employment) and machinery and equipment investment/worker (as an indicator for adoption of new technologies). Their results show that the higher the value of the indicator of innovative capacity the faster the productivity growth. They also show that it takes on average between one to three years for innovation to have a significant effect on productivity.
4.3.2 Micro-economic evidence on innovation and its economic outcomes Like the industry studies, the first batch of firm-level studies focused on the relationship between R&D and productivity. The underlying model assumes that firm’s R&D activities add to firm’s existing stock of knowledge that is used to generate product and process innovations. This takes some time before the sales of new or improved products increase firm’s revenue and its profitability and productivity. The effect of process innovations, is first to reduce the cost through more efficient use of labour and other production inputs. This is bound to improve labour productivity through increased multifactor productivity. When the firm passes the cost reductions to the consumers, the improved price competitiveness may translate into increased sales, thus intensifying the positive effect of R&D on productivity. However, this simple vision of the innovation process and its effect on productivity may be far from reality. Reducing the complex phenomenon that is innovation to a simple linear relationship between R&D and productivity abstracts from many real life aspects of innovation. It is therefore surprising that the majority of these early studies found statistically significant positive returns on R&D investment. However, as Mairesse (1991) who surveyed these studies noted, their results are difficult to compare. The methodological differences in addition to data heterogeneity and imperfections make it quite challenging to arrive at satisfactory interpretations and conclusions. The problems were basically of two sorts. On the one hand the surveys were different in scope, coverage and data they were collecting. On the other hand, in part because of the differences of data at hand, the empirical (econometric) methodologies were rarely comparable.
24
Arrival, at the beginning of nineties, of large scale innovation surveys conducted by an increasing number of national statistical agencies according to a common methodology based on the Oslo Manual opened new possibilities for empirical research into the relationship between the sources of innovation, the innovation process and its outcomes and lastly the impact of innovations on the commercial performance of firms and their productivity. Results of innovation surveys provide data that enable researchers to statistically document the multiple sources of innovation, the variety of types of innovation and their relationship with the expected and achieved impact of innovation results on the performance of innovating firms. Some of the earlier studied based on data from innovation survey data from several countries, including from Canada, are regrouped in Kleinknecht and Mohnen (2002). The results of the first comprehensive Survey of innovation and advanced technology conducted by Statistics Canada in 1993 are analyzed from many angles in Baldwin and Hanel( 2003). The next Survey of Innovation 1999 provided further evidence on the positive evaluation of various effects of innovation the profitability, productivity and other performance indicators (Gault, 2003). The results from the Statistics Canada Survey of Innovation and Advanced Technology, 1993 show that the majority of innovating firms reported to have attained the expected objectives. Thus for instance about two thirds of innovating manufacturing firms reported improved profit margin, a slightly higher percentage an increased in domestic market share and about 40% an increased foreign market share. These quantifiable results were obtained through “qualitative” changes such as: improved interaction with customers, improved quality of products, extended product range, reduced lead times and improved interaction with suppliers (Baldwin and Hanel, 2003, Tab6.3). Even though the survey design and questionnaire of the Survey of innovation 1999 is not strictly comparable to the former 1993 survey, its results point in the same direction. Innovators in selected service industries surveyed in 2003 by Statistics Canada have also reported improved productivity, profitability and improved interaction with customers and other positive outcomes of innovation. It should be noted that the reported innovation outcomes are based on self evaluation of respondents; they were not documented by administrative or accounting data. A particularly interesting outcome of innovation is the share of new and improved products in the innovating firm’s total sales. This information measures directly the actual commercialization of innovated products. A comparison with innovating firms from four European countries (Germany, France, Ireland and Spain) suggest that the incidence of innovation in manufacturing ( 1999) was higher in Canada but European firms reported higher share of new and improved products in sales (Mohnen and Therrien, 2003). In contrast to findings of industry level studies (Hanel, 2000) which suggest that R&D does enhance productivity growth only in high tech industries, innovating firms operating in the low tech manufacturing industries report increased profitability just as often as firms in the middle- tech “secondary” and high-tech “core” sectors (Baldwin and Hanel, 2003). This pattern emphasizes the important economic contribution associated with the diffusion of innovation from high to low tech sectors and of the diffusion of technological change through imitation. Original innovation may not occur as frequently in the downstream sectors, but they are just as frequently reported as being profitable in these industries.

25
Le and Tang (2003) examined the relationship between innovation inputs and outputs in manufacturing firms in late nineties. They found that all innovation inputs are important, but each is used to produce different innovation outputs. Thus for instance, R&D is more important for product innovation, acquisition of technologies, engineering and design and tooling up and training are more important for process innovations. An important finding relates to similarity and differences between large and small firms. Once they innovate, small firms are as effective as large firms to perform well and convert innovation inputs into innovation outputs. However, they are less likely to innovate than large firms. They are more likely to engage in R&D and other innovation activities occasionally on a project to project basis rather than execute R&D and other innovation activities in a continuous and systematic manner. An intriguing finding noted already by Mairesse (1991) is that the output elasticity to R&D (and to capital intensity) estimated from times series observations are systematically lower than those estimated in cross-section regressions and in many case not significantly different from zero. As noted by Hall and Mairesse (1996) in a study that replicated earlier studies in a panel of French manufacturing firms, having a longer history of R&D expenditures helps to improve the quality of R&D elasticity estimates. Working with a panel of firms rather than with a cross-section has the advantage to evaluate to what extent a firm’s past history of R&D and innovation are predictors of future innovation (Baldwin and Gu, 2004) and whether persistent innovators tend to learn to generate more original and radical innovations as time goes by. Of course, following the same firms over time reveals more about the effect of innovations on various performance indicators.
4.3.3 Joint international research project on the link between innovation and firm performance The ‘ad hoc’ approach to exploratory analysis of data from national surveys taught us a lot about innovation sources, how firms use them, the importance of collaboration as well as about various aspects of innovation incidence and impact. One of the conclusions emerging from these studies is that once the basic characteristics of the national, regional and industry system of innovation are taken into account, innovation activity on the firm-level can be modelled as a series of relationships that link the investment in knowledge to productivity growth. Instead of treating them separately as was customary in the literature, Crepon, Duguay and Mairesse (1998) integrated these relationships in a single system of recursive equations. Their model consists of three stages. In the first is estimated the probability that a firm decides to innovate and the resources it invests for this purpose. In the second stage is estimated the ‘innovation production function, i.e. the type and originality of innovation given the firm’s resources, as well as public support allocated to innovation. In the last stage is estimated a production function that translates the contribution of conventional factors of production – labour and capital -and the new knowledge created by firm’s innovation to firm’s productivity. Since several variables are interrelated and there is a possibility of a sample selectivity bias, the estimation methods deals with these potential econometric problems.
26
The CDM model has been applied to analysis of several European CIS3 innovation survey 1998-2000 data for UK, Germany, Spain and France by Griffith, Huergo, Peters and Mairesse (2006). The results for each country show that the model captures well the relationships between the variables of the three stages. They express common features of innovation activity shared by the four countries and at the same time the effects national specificities such as the R&D policies. The CDM model has also been applied data from other countries some industrialized such as Sweden, France21 and Netherlands and emerging ones China and Chile (Hall and Mairesse, 2006). These applications of the CDM model have the advantage of analyzing in a common theoretical and empirical framework the innovation survey data that have been collected according to common guidelines provided by the Oslo Manual. Several OECD countries including Canada have decided to join their research efforts in order to reach a better understanding of the process from the decision to innovate up to the effect of innovation on productivity and other performance indicators. The unifying framework for these interrelated, but until now largely independent line of inquiries, is based on the influential model by Crepon, Duguay and Mairesse (1998). To ensure the international comparability of results, each team will use the same variables from national innovation surveys and use the same econometric methodology in estimating the model based on the original CDM approach. Based on the data collected by the near-identical survey design and questionnaire and analyzed be the means of a common econometric methodology, it is hoped that the joint project will yield internationally comparable results of interest to innovating firms, policy makers and academic researchers.
5. Conclusion The improvement of economic welfare is closely related to continuous improvements of labour productivity. Labour productivity growth depends on investment, labour quality and improvement of multifactor productivity. Innovation and diffusion of innovation and technological progress in general are among the principal sources of multifactor productivity improvement. Even though R&D activity is one of the principal sources of innovation, there many firms, especially the SMEs, that innovate without a distinctive formal R&D activity. Even though the SME innovate less frequently than the large ones, their innovation activity is not less efficient or important than that of their larger counterparts. To understand the links between innovation activities and productivity, it is necessary to take into consideration several factors in addition to R&D: the size of the firm, the technological opportunities related to the industry or sector of activity, as well as the economic and institutional environment in which the innovating firms evolve. Studies of the relationship between the indicators of R&D activity and productivity shows that investment in R&D in high-
21 This application used another French data set than the one used in Griffith, Huergo, Peters and Mairesse (2006).
27
tech industries effectively increases productivity. The relationship is less conclusive in the mid and low tech industries where firms innovate less frequently than in the high-tech sectors. It is difficult for the innovating firms to prevent imitation and therefore to appropriate fully the innovation related economic benefits. As the new knowledge generated by innovators spreads, other firms and economic agents learn and benefit from it. Thus, in addition to generate private return to investment in new knowledge and innovation, the society reaps even larger social benefits. These technological externalities (or spillovers) exist between industries and as well between countries and they contribute significantly to the productivity growth. To the extent that the private benefits from innovation are smaller than the social benefits, the private sector has a tendency to under-invest in this activity. Government support to R&D and innovation is justified insofar as it tends to reduce or eliminate the gap between private and social returns. In order to better understand the innovation process and its contribution to productivity and economic performance in general, and the effectiveness of various innovation policies, the statistical agencies of many OECD countries introduced innovation surveys that provide a rich data source for the study of the innovation process and its relationship to firm performance and productivity growth. To better understand the complexity characterizing innovation activity and its contribution to productivity performance, several OECD countries, including Canada, have launched a joint research project in view of analyzing the data from innovations surveys with a common, standardized methodology. The results of this research initiative will provide internationally comparable information on the characteristics of innovating firms, the determinants of their innovation effort as well as its outcome and their effect on firm’s productivity and other performance indicators. References John R. Baldwin, Jean-Pierre Maynard, Fanny Wong (2005a) The Output Gap Between Canada and the United States : The Role of productivity (1994-2002) Statistics Canada, Microeconomic Analysis Branch, no° 11-624-MIE Catalogue- No 009. John R. Baldwin, Jean-Pierre Maynard, Marc Tanguay, Fanny Wong and Beiling Yan (2005b) A Comparison of Canadian and U.S. Productivity Levels: An Exploration of Measurement Issues Micro-economic Analysis Division, Economic Analysis (EA) Research Paper Series Statistics Canada, Catalogue no.11F0027MIE-No. 028 Baldwin, J.R. and W. Gu (2004) Innovation, Survival and Performance of Canadian Manufacturing Plants. Research Papers Series, Statistics Canada, cat.11F0027, No022. Baldwin, J. R. and Sabourin, D. (2004): The Effet of Changing Technology Use on Plant Performance in the Canadian Manufacturing Sector. Ottawa: Statistics Canada, Economic Analysis, Research Paper No. 020, 11F0027 No.20
Baldwin, J.R. and P. Hanel (2003) Innovation and Knowledge Creation in an Open Economy; CanadianIndustry and international Implications. Cambridge University Press, Cambridge,U.K. and N.Y. 515 p.
28
Baldwin, J.R., and T.M. Harchaoui (2003), Productivity Growth in Canada – 2002, Ottawa: Statistics Canada, catalogue no°15-204. Baldwin, J.R., G. Gellatly and V. Gaudreault, (2002) Financing innovation in New Small Firms: New Evidence from Canada, Statistics Canada, Cat. No. 11F0019 No.190. Baldwin, J.R. and P. Hanel (2000) Multinationals and the Canadian Innovation Process. Statistics Canada, Micro-Economic Analysis Division, 11F0019MPE, no°151. Baldwin, J.R., E. Rama and D. Sabourin. (1999). Growth of Advanced Technology Use in Canadian Manufacturing During the 1990’s. Research Paper Series No. 107. Baldwin, J.R. and D. Sabourin, (1997) “Factors Affecting Technology Adoption: A Comparison of Canada and the United States.” Canadian Economic Observer. Catalogue no. 11-010-XPB. Ottawa : Statistics Canada. August pp. 3.1-3.17. Bernstein J.I. (2002) A tour of Innovation and Productivity: Measurement, Determinants and Policy, in Rao, P.S. et A. Sharpe (2002) Productivity Issues in Canada, Industry Canada, University of Calgary Press, Calgary. Bernstein J.I. (2000) Is the Labour Productivity gap with the United States made in Canada? Canadian Business Economics, vol. 8, (1) pp.42-50. (February). Bernstein, J.I. (1988) Cost of Production, Intra and Interindustry R&D Spillovers: Canadian Evidence, Canadian Journal of Economics 21, 324 -347. Bernstein, J.I. (1996) R&D and Productivity Growth in Canadian Communications Equipment and Manufacturing, Industry Canada working papers, No.10. Bordt, M., 2001. Determinants of science and technology skills: Overview of the study, Education Quarterly Review, vol.8:(1), 8-9. Cornelius, P.K. (2003) The Global Competitiveness Report 2002-2003. Oxford University Press, New York. Cotis, J-P. (2006) Benchmarking Canada’s Economic performance, International Productivity Monitor, No.13, (Fall) Crépon, B., Dugay, E. and J. Mairesse (1998) Research and Development, Innovation and Productivity: An Econometric Analysis at the Firm Level. Economics of Innovation and New Technology, 7(2), p. 115-158. Czarnitzki, D., Hanel, P. and J. Rosa (2004) Impact of R&D tax Credits on Innovation: An empirical Analysis based on a survey on innovation in Canadian Manufacturing. Innovation Analysis Bulletin, 7, 2:4-6., cat.88-003-XIE.
Dagenais, M., P. Mohnen and P. Therrien (1997) Do Canadian Firms Respond to Fiscal Incentives to Research and Development?, Centre interuniversitaire de recherche en analyse des organisations –CIRANO, Discussion Paper 97s-34, Montreal. Diewert E. (2002) Productivity trends and Determinants in Canada, in Rao, P.S. et A. Sharpe (2002) Productivity Issues in Canada, Industry Canada, University of Calgary Press, Calgary. Drummond, D. (2006) The Economists’ Manifesto for Curing Ailing Canadian Productivity, International productivity monitor, No.13 Finance Canada (1998) The federal system of income tax incentives for scientific research and experimental development, Department of Finance, Evaluation Report, Ottawa. Gault, F., ed. (2003) Understanding Innovation in Canadian Industry, School of Policy Studies, Queen’s University, published by McGill-Queen’s University Press.

29
Gera, S. and W., Gu (2004), The effect of Organizational Innovation and Information and Communication Technology on Firm performance, International Productivity Monitor, No.9, 37-51. Globerman, S. (2002) Linkages Between Technological Change and Productivity Growth, in Rao, P.S. et A. Sharpe (2002) Productivity Issues in Canada, Industry Canada, University of Calgary Press, Calgary, 999 p. Globerman, S., J.C. Ries and J. Vetinsky (1994) "The Economic Performance of Foreign Affiliates in Canada." Canadian Journal of Economics 27: 143-156. Gordon, R. (2003) High-Tech Innovation and Future Productivity Growth: Does Supply Create its Own Demand? in Cornelius, P.K. The Global Competitiveness Report 2002-2003, Oxford University Press, New York, Oxford Gordon, R. (2000) Does the New Economy Measure Up to the Great Inventions in the Past? Journal of Economic Perspectives, 14(4) 49-74 Greenwood, J., Z. Hercowitz, and P. Krusell, 1997, Long-Run Implications of Investment Specific Technological Change, American Economic Review 87, 342-362. Griffith, R., Huergo, E, Mairesse, J. et B. Peters (2006) Innovation and Productivity Across Four European Countries. Oxford Review of Economic Policy, vol.22, no°4. Griliches, Z. (1994) Productivity, R&D, and the Data Constraint, American Economic Review, 84, 1-23. Griliches, Z. and Lichtenberg, F. (1984) Interindustry Technology Flows and Productivity Growth: A Reexamination, Review of Economics and Statistics 66, 324-329. Griliches, Z. (1979) Issues in Assessing the Contribution of Research and Development to Productivity Growth, Bell Journal of Economics, 92-11 Gu, W. and J., Tang. (2003) The link between innovation and productivity in Canadian manufacturing industries, Industry Canada, Working papers, No.38. Hall, B.H and J. Mairesse (2006) Empirical Studies of Innovation in the Knowledge-Driven Economy. Economics of Innovation and New Technology, vol.15(4/5), p. 289-299. Hall B.H. and J.Mairesse (1996) Exploring the relationahisp between R&D and productivity in French manufacturing firms, Journal of econometrics, vol. 65, pp.263-293.
Hall, B.H. (2002), The financing of research and development, Oxford Review of Economic Policy 18(1), 35-51.
Hall, B.H. and J. van Reenen (2000), How effective are fiscal incentives for R&D? A review of the evidence, Research Policy 29, 449-469. Hanel, P. (1988) L’effet des dépenses en R&D sur la productivité du travail au Québec, L’actualité économique, 64(3) p. 396-415. Hanel, P., 2006 Skills required for Innovation: A Review of the literature, Working paper 2006-C-06 Human Resources and Social; Development/ Industry Canada and Social Sciences and Humanities Research Council, Skills Research Initiative, Ottawa.
Hanel, P. (2000) R&D, Interindustry and International Spillovers of Technology and the Total Factor Productivity Growth of Manufacturing Industries in Canada, 1974-1989. Economic Systems Research, vol.12, no°3. Hanel, P. and J. Niosi (2006) Diffusion and adoption of new technologies: A review. Report presented to Industry Canada, Ottawa. Harchaoui, T.M., F. Tarkhani et B. Khanam (2004), « Information Technology and Economic
30
Growth in the Canadian and US Private Economies », in D. Jorgenson, ed. Economic Growth in Canada andthe United States in the Information Age. Research Monograph, Ottawa : Industrie Canada.University of Calgary Press, Calgary. Harchaoui T.M., and F.Tarkhani (2004) Whatever Happened to Canada-U.S. Economic Growth and Productivity Performance in the Information Age? Micro-economic Analysis Division, Statistics Canada, Catalogue no. 11F0027MIE — No. 025 Harris, R.G. (2002) Determinants of Canadian Productivity Growth : Issues and Prospects, in in Rao, P.S. et A. Sharpe (2002) Productivity Issues in Canada, Industry Canada, University of Calgary Press, Calgary. Institute for Competitiveness and Prosperity (2006) Agenda for our Prosperity, Task Force on Competitiveness, Productivity and Economic Progress, Fifth Annual Report, University of Toronto, Rothman school, Toronto, (November) Jorgenson, D.W. ed. (2004) Economic Growth in Canada and the United States in the Information Age, Industry Canada Research Publication Series, University of Calgary Press, Calgary Jorgenson, D.W., Ho, M.S. et K.J. Stiroh (2005) Productivity-Information Technology and the American Growth Resurgence. MIT Press, Cambridge. Kaci, M. (2006) Understanding productivity: A Primer, Statistics Canada, Catalogue No. 15-206-XIE, No.002 Kleinknecht A., and P. Mohnen (2002) Innovation and firm performance, N.Y. Palgrave Kline, S.J. and N. Rosenberg (1986) An overview of innovation. in Landau R. et al. (1986) The Positive Sum Strategy. National Academy Press, Washington, D.C. Khanam, B. and E. Au, (2004), Contributions of R&D capital to Productivity Growth, Presentation at the Annual Congress of the Canadian Economic Association, Toronto, June 2004 Landry, R. and N. Amara (2003) Effects of Sources of Information on Novelty of Innovation in Canadian Manufacturing Firms. Chap. 4, p. 67-110 in Gault, F., ed. (2003) Understanding Innovation in Canadian Industry, School of Policy Studies, Queen’s University, published by McGill-Queen’s University Press. Le, C. and J., Tang, (2003) Innovation Activities and Innovation Outcomes: A Firm Level Analysis. In Gault, F. (ed.) Understanding Innovation in Canadian Industry. McGill-Queen’s University Press, Montreal & Kingston, London, Ithaca. Leung, (2004) The Effect of Adjustment Costs and Organizational Change on Productivity in Canada: Evidence from Aggregate Data.International productivity Monitor, No. 9, (Fall) Lind D.(2005) Manufacturing Productivity in Sweden: an International Perspective since 1960. International productivity Monitor, No.11, (Fall) Lipsey, R.G. and K. Carlaw, 2004, Total Factor Productivity and the Measurement of Technological Change, Canadian Journal of Economics, vol.37, (4), 1118-1150. M. Porter and S. Stern, The impact of Location on Global Innovation: Findings from the National Innovative Capacity Index, in P.K.Cornelius (2003) The Global Competititveness Report 2002-2003, Oxford University Press, N.Y. Oxford. Mairesse, J. (1991) Recherche-Développement et productivité: un panorama des études économétriques sur données d’entreprise. OCDE, STI Revue, 10-43.
31
Mairesse J. and P. Mohnen (1999) R&D et productivité : survol de la littérature, Working Paper, Université de Québec à Montréal, Département d'Economie. J. Mairesse and P.Mohnen, (2002) “Accounting for Innovation and Measuring Innovativeness: An Illustrative Framework and Application” American Economic Review, 92(2), 226-230 Mansfield, E., Rappaport, J., Romeo, A., Wagner, S. et G. Beardsley (1977) Social and Private Rates of Return from Industrial Innovations. Quarterly Journal of Economics, p. 221-40. Mayhew and Neely, 2006 Improving productivity-opening the black box, Oxford Review of Economic Policy, vol 22 (5) 445-456. McFetridge D. (2006) The Impact of Foreign Ownership on Aggregated R&D Intensity: A Critical Review of the Empirical Evidence, Industry Canada , Working paper, No. 2006-03 Mohnen, P. (1992) The Relationship between R&D and Productivity Growth in Canada and Other Major Industrialized Countries (Ottawa: Minister of Supply and Services, Canada) Mohnen and Therrien, 2003 Comparing the Innovation Performance of Manufacturing Firms in Canada and in Selected European Countries: an Econometric Analysis, in F.Gault, ed. Understanding Innovation in Canadian Industry. McGill-Queen’s University Press, Montreal & Kingston, London, Ithaca.
Mohnen, P. , J.Mairesse and M. Dagenais (2006) Innovativity: A comparison across seven European Countries, Economics of Innovation and New Technology, vol.15(4/5), p.391-413 Mokyr, J. (1990) The Lever of Riches, Technological Creativity and Economic Progress. Oxford University Press, Oxford. Morck, R. and B. Yeung (2002) The Economic Determinants of Innovation, in Rao, P.S. et A. Sharpe (2002) Productivity Issues in Canada, Industry Canada, University of Calgary Press, Calgary. Nadeau, S. and S.P. Rao (2002) The Role of Industrial Structure in Canada’s Productivity Performance, in Rao, P.S. et A. Sharpe (2002) Productivity Issues in Canada, Industry Canada, University of Calgary Press, Calgary. OECD (2006) Main science and technology indicators, Organization for Economic Cooperation and Development, Paris. OECD, (2005), Oslo Manual: Guidelines for Collecting and Interpreting Innovation Data, Organization for Economic Cooperation and Development, Paris. Porter and S. Stern (1999) New Challenge to American Prosperity: Findings from the Innovation Index, Washington (D.C.), Council on Competitiveness, 1999) Porter M. E. and R. L.Martin (2001) Canadian Competitiveness: A Decade after the Crossroads http://www.rotman.utoronto.ca/research/competitive1.htm Postner, H. and Wesa, L.,(1983), Canadian Productivity Growth: An Alternative Input-Output Analysis, Ottawa, Economic Council of Canada. Rafiquzzaman, M. (2007) Assessing Canada’s Innovation Performance: Pros and Cons of Using Patent data, Micro-economic Policy Analysis Branch, Industry Canada, Presentation (ppt) at CIRST, Montreal, January 12, 2007 S., Rao, J. Tang and W. Wang, (2006) What explains the Canada-U.S. TFP Gap? Industry Canada, Working Paper 2006-08
32
Rao, P.S. and J. Tang, 2005, Foreign Ownership and Total Factor Productivity", in Eden L. and W. Dobson, eds. Governance, Multinationals and Growth, Northampton, Edward Elgar. Rao P.S. and Sharpe, A. (2002), The importance of innovation for productivity, in Productivity Issues in Canada, The Industry Canada Research Series, University of Calgary Press, Calgary. Rao, P.S., A. Sharpe and J. Smith (2005) An analysis of the labour Productivity Slowdown in Canada since 2000, International Productivity monitor, No. 10, (Spring) Rao, P.S., Tang, J. and W. Wang (2004) Measuring the Canada –U.S. Productivity Gap : Industry Dimensions, International Productivity Monitor, No.9. (Fall 2004). Sharpe, A. (2002) Raising Canadian Living Standards, International Productivity Monitor, No. 5, (Fall, 2002). Schumpeter, J.A. (1934) The Theory of Economic Development: An Inquiry into Profits, Capital, Credit, Interest, and Business Cycle. Harvard University Press, Cambridge. Schumpeter, J.A. (1942) Capitalism, Socialism, and Democracy, second edition. Harper & Brothers, New York. Statistics Canada, 2003) Innovation in selected service industries, Statistics Canada, Compact disk. Stiroh, K.J. (2002) Investment and Productivity Growth : A Survey from the Neoclassical and New Growth Perspectives, in Rao, P.S. et A. Sharpe (2002) Productivity Issues in Canada, Industry Canada, University of Calgary Press, Calgary. Trajtenberg M. (2002) Is Canada Missing the “Technology Boat”? Evidecne from the Patent Data, in Rao, P.S. et A. Sharpe (2002) Productivity Issues in Canada, Industry Canada, University of Calgary Press, Calgary. Von Hippel, E. (1988) The Sources of Innovation. Oxford University Press, New York. Warda, J. (2007) Searching for a Balanced System of Innovation Incentive, A presentation to: The Sixth Annual Research Money Conference "Are Canada's Business R&D Incentives Working?" Ottawa, (March 8). Whelan, S. (2000) Productivity and Innovation: A competitive and Prosperous Canada, Report of the Standing Committee on Industry, House of Commons, Ottawa
XXXX