geoelectric crustal structures off the sw border of the sao … · geoelectric crustal structures...
TRANSCRIPT
Geophys. J. Int. (2005) 162, 357–370 doi: 10.1111/j.1365-246X.2005.02643.x
GJI
Geo
mag
netism
,ro
ckm
agne
tism
and
pala
eom
agne
tism
Geoelectric crustal structures off the SW border of the Sao Franciscocraton, central Brazil, as inferred from a magnetotelluric survey
Maurıcio S. Bologna, Antonio L. Padilha and Icaro VitorelloInstituto Nacional de Pesquisas Espaciais - INPE, C.P. 515, 12201-970 Sao Jose dos Campos, Brazil.E-mails: [email protected] (MSB); [email protected] (ALP); [email protected] (IV)
Accepted 2005 March 17. Received 2005 January 21; in original form 2004 June 4
S U M M A R YA magnetotelluric (MT) survey of the crust beneath sedimentary basins and thrust sheets alongthe southwestern edge of the Sao Francisco craton, central Brazil, reveals intricate electricalcharacteristics that are interpreted in the context of Proterozoic collision tectonics and hori-zontal transport of allochthonous rock units, emplacement of Cretaceous hypabyssals, lavasand diatremes of ultrapotassic–mafic composition, and occurrence of induced seismicity. Thedata exhibit strong distortions represented by 3-D induction effects and galvanic disturbancesresulting from shallow structures, frequency and site dependence of electrical strike, and in-homogeneous anisotropic layers with smoothly varying phase split, conductance and azimuthof the highly conductive direction. Geoelectrical and orthogonal phase difference directions,2-D inversion, and forward modelling characterize three distinct subhorizontal sections show-ing two anisotropic conductors within a highly resistive crust, laterally segmented into uniqueblocks. The model for the uppermost crust section has E–W geoelectric directions and a15–30 S anisotropic zone at a depth of approximately 1–2 km along the entire profile. Thisconducting layer is interpreted to represent a brine-filled fracture layer possibly controlledby the present-day state of crustal stresses, as disclosed from reservoir-triggered quakes. Themid-crust section presents a deeper conducting zone located at depths below 10 km. It is de-fined by stronger MT responses having phase split directions oscillating from WNW–ESE toE–W beneath sites in the central-western area (Parana basin and allochthonous cover units)and NNE–SSW in the northeastern region (autochthonous platform units and Sanfranciscanabasin). Anisotropy is greater than an order of magnitude in the highly conductive direction,with conductance in the range of 250–400 S. Conjecturally, the source of this anomalous fea-ture would come from interconnected grain-boundary phases and hypersaline fluids, exsolvedand precipitated from upwelling Cretaceous magma. In the central-western area, favourabletrapping of conductors was constrained along a nearly E–W direction, feasibly associatedwith relic structures inherited from Brasiliano/Pan African continental collisions. Along thenortheast, however, the coincidence with superficial NNE–SSW structural directions suggestsa localized direct causal relationship with the trend of extension related to magma emplace-ment. The lower crust has a highly resistive quasi–1-D section along the entire profile thatprevails also at uppermost mantle depths. Thus, whereas the brittle crust would have recon-ciled subhorizontal strain with fluid percolation related to uplift and magma emplacement, amechanically coupled and stronger lower crust/upper mantle would have controlled the deepmagma generation during Cretaceous distention pulses.
Key words: Alto Paranaıba igneous province, central Brazil, crustal structure, electricalanisotropy, magnetotellurics, Sao Francisco craton.
1 I N T RO D U C T I O N
Interpretations of magnetotelluric (MT) data for studies of geody-namic processes are often hindered by the poor understanding aboutthe origin and agents of conductivity in deep-Earth conditions. In
general, MT models require bulk rock masses with a much lowerconductivity than expected from the solid-state conduction of themost common silicates and carbonates. In the crust, except for theparticular cases of exotic carbon- and sulfide-rich lithologies, the ob-servation of enhanced conductivity at depth is frequently attributed
C© 2005 RAS 357
358 M. S. Bologna, A. L. Padilha and I. Vitorello
-60˚ -56˚ -52˚ -48˚ -44˚ -40˚
-28˚
-24˚
-20˚
-16˚
-12˚
Atlantic
Ocean
Sao FranciscoCraton
AmazonasCraton
ParanaBasin
1
2
3
4
5
SP
BH
DF
-80˚ -40˚
-40˚
0˚
BRAZIL
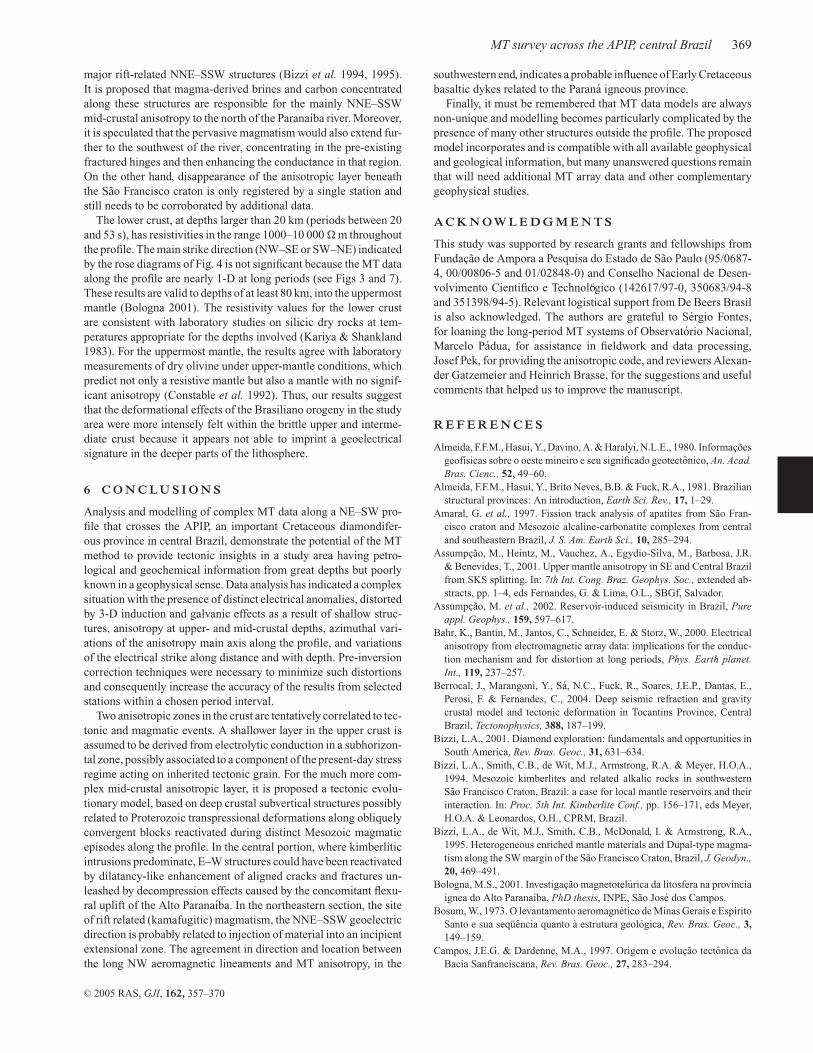
Figure 1. Schematic outline of the major geological provinces of central-southern Brazil and main alkaline-carbonatite occurrences (modified fromUlbrich & Gomes 1981): 1, Paranatinga/Poxoreo; 2, Ipora; 3, Alto Paranaıbaigneous province (APIP); 4, Serra do Mar; 5, Ponta Grossa. Locations ofsome major cities are indicated as: DF, Brasılia; BH, Belo Horizonte; SP,Sao Paulo. The square box enclosing site 3 refers to the study area.
to proportionally minute amounts of high conductors in intercon-nected grain-boundary arrangements (Wannamaker 2000). Giventhe appropriate environmental constraints (temperature, pressure,permeability, geochemistry), the commonly mentioned conductorsare saline fluid, graphite, metallic and partial melt material (Jones1992). At higher mantle temperatures, solid-state conductivity ofolivine enhanced by hydrogen diffusion is another likely candidate(Karato 1990).
To make the interpretative link from the present-day measuredconductivity to past geological environments, it becomes necessaryto elucidate the origin of the conductor and of a required intercon-nectivity, and how both were preserved or modified by processesoperating throughout the intervening geological time. This is bet-ter accomplished by confronting the electromagnetic induction datawith available geological and geophysical data from the study areain order to diminish the inherent ambiguity arising from the manyplausible causes of conductivity.
In central Brazil (Fig. 1), a complex history of multifaceted ge-ological events, marked by Proterozoic continental collisions andCretaceous mantle magmatism, characterizes the southwestern mar-gin of the Archean–Proterozoic Sao Francisco craton. The deep crustis hidden by thrust sheets, cratonic cover units and basin rocks, mak-ing it an ideal region to test the MT potential to unravel underlyingstructural and tectonic information.
Specific problems related to the tectonic evolution of this re-gion have been addressed by several studies focused on spatialand temporal field associations of geochronological, isotopic andpetrological data from cropping out metasediments and granites(see for instance Pimentel et al. 1999, for a comprehensive re-view). However, because of the blanketing effect of the superficialunits, many geodynamic issues are still controversial and others re-main unsolved. Particularly in the study area, questions reside in the
still controversial delimitation of the hidden western border of theSao Francisco Plate, the extent of lithosphere remobilization by theBrasiliano orogenies, the nature and physical state of the rocks un-derlying the thrust sheets and cratonic cover units, and the searchfor either a deep lithospheric root that could explain the occurrenceof Cretaceous kimberlites and lamproites, or traces of a root-erasingprocess linked to the upwelling mantle material accountable for themulticompositional Cretaceous volcanic complexes. Suitable deepgeophysical information, which could contribute to the solution ofsuch problems, is scarce and only regional potential-field and local-ized seismographic analyses are presently available (Bosum 1973;Sa et al. 1993; James & Assumpcao 1996; Assumpcao et al. 2001).A long-term MT programme is under way in the region to sup-plement the above techniques with a large-scale reconnaissance ofmajor conducting geostructures that could have persisted as recordsof past episodes.
We discuss here geoelectrical signatures of the crust observedalong an MT profile aligned in a NE–SW direction, from the south-ern margin of the Phanerozoic Sanfranciscana basin over the SaoFrancisco craton, across the Neoproterozoic Brasılia fold belt andinto the northeastern margin of the Parana basin, which probablyrests on a different cratonic basement (site 3 of Fig. 1, blown up inFig. 2). At most of the MT soundings, the data period ranges from0.0008 to 13 653 s, which allows the vertical imaging of geoelectricstructures from the near surface (tens of metres) to great depths intothe upper mantle (more than 150 km). The model to be presented ishowever restricted to discussion of the data in the interval limitedby periods shorter than 53 s. This interval has an inductive scaleof the same order of the regional crustal thickness, estimated fromseismic data to be approximately 40 km (Berrocal et al. 2004).
2 G E O L O G I C A L C O N T E X T
The South American platform is composed of a Precambrian centralcore bordered by active orogens to the west and northwest, and ofa Mesozoic–Cenozoic passive continental margin to the northeastand east. The core is formed by several Archean to Mesoprotero-zoic blocks amalgamated during the Neoproterozoic Brasiliano/PanAfrican orogeny in the final assembly of Gondwana (Almeida et al.1981). In central Brazil, the Sao Francisco craton, which was contin-uous with the African Congo craton prior to the opening of the SouthAtlantic, presently encompasses a substantial part of the southeast-ern Brazilian highlands. Brasiliano fold-and-thrust belts fringe allsides of the craton with strong vergence towards its interior (CamposNeto 2000).
Flanking the western margin of the Sao Francisco craton, theBrasılia belt represents the external portion of a large Neoprotero-zoic orogen in central Brazil (the Tocantins province; Fig. 1), whichdeveloped in response to the convergence between the Amazonand the Sao Francisco–Congo cratons and another continental blockpresently covered by the Phanerozoic sedimentary and volcanicrocks of the Parana basin (Pimentel et al. 2000). Proterozoic meta-morphic rock units of varied nature and age constitute most ofthe Brasılia belt, comprising passive margin sequences of the SaoFrancisco continent (Paranoa, Canastra and Vazante groups),backarc and forearc basin sequences (Araxa and Ibia groups), anda younger post-inversion platform sequence (Bambuı group) de-posited in a foreland basin of the Sao Francisco craton (Pimentelet al. 2001).
In the southern segment of the Brasılia belt, the area of thepresent study, the Brasiliano deformation involved overthrust sheets(nappes), transported eastwards at least 150 km towards the
C© 2005 RAS, GJI, 162, 357–370
MT survey across the APIP, central Brazil 359
-48˚00' -47˚30' -47˚00' -46˚30'
-19˚00'
-18˚30'
-18˚00'
-48˚00' -47˚30' -47˚00' -46˚30'
-19˚00'
-18˚30'
-18˚00'
LEGEND
1 2 3 4 5 6 7 8 9 10
11 12 1319
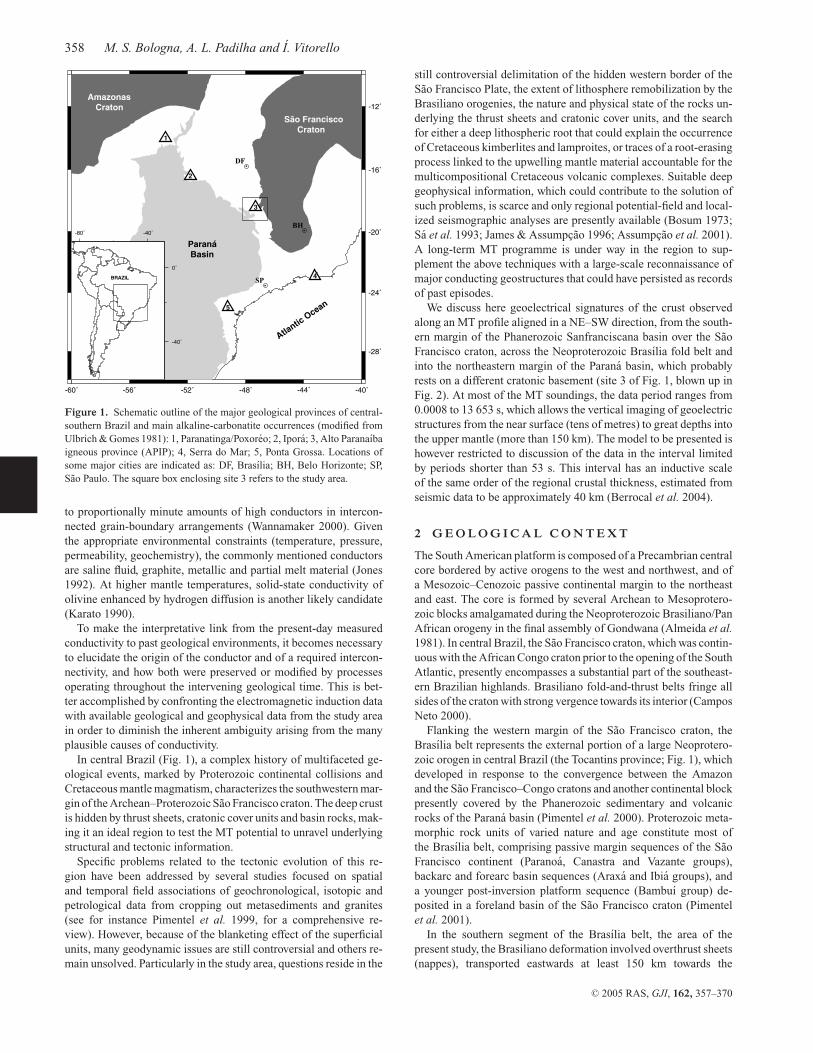
Figure 2. Generalized geological map of the study area (after Schobbenhaus et al. 1984). Main provinces are: Parana basin (represented by: 1, CretaceousBauru group; 2, Jurassic–Cretaceous Serra Geral formation); nappes of the Brasılia belt (represented by Proterozoic groups: 3, Araxa; 4, Ibia; 5, Canastra; 6,Vazante), and the sedimentary cover of the Sao Francisco craton (7, Proterozoic Bambuı group; 8, Cretaceous Areado group; 9, Cretaceous Mata da Cordagroup). Other symbols refer to: 10, Cretaceous alkaline/carbonatite complexes; 11, thrust faults; 12, rivers; 13, MT sites.
platform of the Sao Francisco craton, and subsequently stacked bythrust faults over the Bambuı pelitic and carbonatic sequence (Fucket al. 1994). From the bottom to the top, the cropping out sequenceof imbricated sheets is composed of the Canastra, Ibia and Araxagroups. This pile probably overlies the Paranoa rocks and under-lies the Parana basin. A granulitic complex, the Anapolis-Itaucu,cropping out along a NW–SE belt to the northwest of the area, wasreworked and tectonically emplaced adjacent to lower grade rocksduring the Brasiliano event (Pimentel et al. 2000). In the studyarea (Fig. 2), the Brasılia belt forms a complex structural pattern,the Araxa synform, locally characterized by foliations associatedwith the thrust sheets and long lineaments corresponding to sub-vertical lateral ramps or wrench faults originated from differentialdisplacement of the thrust wedges (Seer & Dardenne 2000). Partof the synform is located in the central-western portion of the MTprofile.
To the east and centre-north, the study area is covered by theProterozoic foreland basin sequence, predominantly pelites and car-bonates of the Bambuı and Vazante groups. Cretaceous siliciclasticrocks are found in the southwestern corner (Bauru group of theParana basin) and in the eastern portion (Mata da Corda and Areadogroups of the Sanfranciscana basin).
Extensive Cretaceous magmatism is also observed in the south-ern portion of the Tocantins province and northern Parana basin(see Fig. 1 for location). They are referred to in the literature as AltoParanaıba, Ipora and Poxoreo igneous provinces. The magmatismis possibly related to several other Cretaceous alkaline-carbonatiteprovinces that evolved contemporaneously around the Parana basin
during the opening of the South Atlantic ocean and subsequent west-ward drift of the continent (Thompson et al. 1998).
The Alto Paranaıba igneous province (APIP), crossed by the MTprofile, is composed of ultrapotassic/potassic and ultramafic/maficdiatremes, lavas and hypabyssal intrusions, mainly kimberlites andmadupitic olivine lamproites, and kamafugite carbonatite rocks(Sgarbi et al. 1998). The former rocks are believed to generallyderive from thick and cold lithosphere, whereas the latter rocks arefrom shallower depths.
The complex and voluminous magmatism occurred either in ashorter interval from 90 to 80 Ma, according to Gibson et al. (1995),or in a longer period from 120 to 85 Ma, after Bizzi et al. (1994).Diamonds have been explored in this region mostly from con-glomerates of Precambrian and Phanerozoic ages, as well as fromCenozoic to recent fanglomerates, colluvial and alluvial deposits,because most of the identified diatremes have not yielded economi-cally satisfactory results (Bizzi 2001). Large alkaline-carbonatitecomplexes occur to the northwest (Catalao I and Catalao II)and southeast (Serra Negra and Salitre) of the profile (Fig. 2).Diatremes of kimberlitic and lamproitic affiliations are concentratedin and around the central region of the profile, whereas kamafugiticassociations predominantly occur eastwards, around the limits ofthe Mata da Corda outcrops, and northwestwards, in the border ofthe Parana basin (Ipora and Poxoreo, Fig. 1).
A remarkable NW–SE continental trend crossing all the distinctterrains seems to bind the igneous occurrence and other crustalfeatures in the direction of extensive straight lineaments, mostly ge-omorphological and others defined by aeromagnetic data. This is in
C© 2005 RAS, GJI, 162, 357–370
360 M. S. Bologna, A. L. Padilha and I. Vitorello
agreement with the general tectonic grain of the Araxa synformand the Anapolis-Itaucu complex. As indicated by geological andgeophysical evidence (Hasui et al. 1975; Almeida et al. 1980), theAPIP is located in a well-defined regional topographic high, approx-imately 100 km wide and 300 km long, along this NW–SE direction.This high has separated the Parana and Sanfranciscana basins at leastsince the Palaeozoic, but was more conspicuous in the Cretaceous. Itappears to have imposed a strong control on the sharp linear edge ofthe northeastern Parana basin, as deduced from tapering isopachs,erosion of the Parana basin basalts, and provenance of siliciclastic–volcanoclastic sedimentation to both the Bauru group and Mata daCorda and Areado groups during the Cretaceous (Hasui & Haralyi1991). The strong uplift of the area seems to be contemporaneouswith the Cretaceous magmatism, as indicated by fission tracks inapatite (Amaral et al. 1997).
To the northeast of the study area, the cratonic cover units ofthe Vazante and Bambuı groups show general structural directionsaround N–S, in concordance with the basement structures of the sub-basin enclosing the Cretaceous Mata da Corda and Areado groupsin the Sanfranciscana basin. This direction also agrees with the frontof the thrust sheets and of a strong high–low gravity pair formed by ahorizontal gradient that runs, along the central part of the Tocantinsprovince, from north to south and splits into two branches, to thesoutheast and to the southwest, underneath the northern border ofthe Parana basin. It has been interpreted as a continental collisionsuture (Hasui & Haralyi 1991) and locally related to an ophioliticmelange sequence (Strieder & Nilson 1992). The gravity anomaly isroughly located 200 km west of the MT profile and continues alongthe southwest of the study area. Evidence of crustal remobilizationunderneath the study area by the Brasiliano orogeny is unknown, butit could be minimal if the Palaeoproterozoic basement, cropping outsouth and west and strongly affected by the Transamazonian orogeny(Teixeira et al. 1989), would extend northwards and eastwards underthe study area.
3 M T DATA A C Q U I S I T I O NA N D P RO C E S S I N G
The MT method uses simultaneous measurements of natural timevariations in the magnetic field components of the Earth (Hx, Hy
1
2
3
4
5
Log
ρ a (
Ω.m
)
1
2
3
4
5
Log
ρ a (
Ω.m
)
1
2
3
4
5
Log
ρ a (
Ω.m
)
1
2
3
4
5
Log
ρ a (
Ω.m
)
78
0
45
90
φ (˚
)
-3 -2 -1 0 1 2 3 4 5
Log Period (s)
0
45
90
φ (˚
)
-3 -2 -1 0 1 2 3 4 5
Log Period (s)
0
45
90
φ (˚
)
-3 -2 -1 0 1 2 3 4 5
Log Period (s)
0
45
90
φ (˚
)
-3 -2 -1 0 1 2 3 4 5
Log Period (s)
1
2
3
4
5Lo
g ρ a
(Ω
.m)
1
2
3
4
5Lo
g ρ a
(Ω
.m)
1
2
3
4
5Lo
g ρ a
(Ω
.m)
1
2
3
4
5Lo
g ρ a
(Ω
.m)
72
0
45
90
φ (˚
)
-3 -2 -1 0 1 2 3 4 5
Log Period (s)
0
45
90
φ (˚
)
-3 -2 -1 0 1 2 3 4 5
Log Period (s)
0
45
90
φ (˚
)
-3 -2 -1 0 1 2 3 4 5
Log Period (s)
0
45
90
φ (˚
)
-3 -2 -1 0 1 2 3 4 5
Log Period (s)
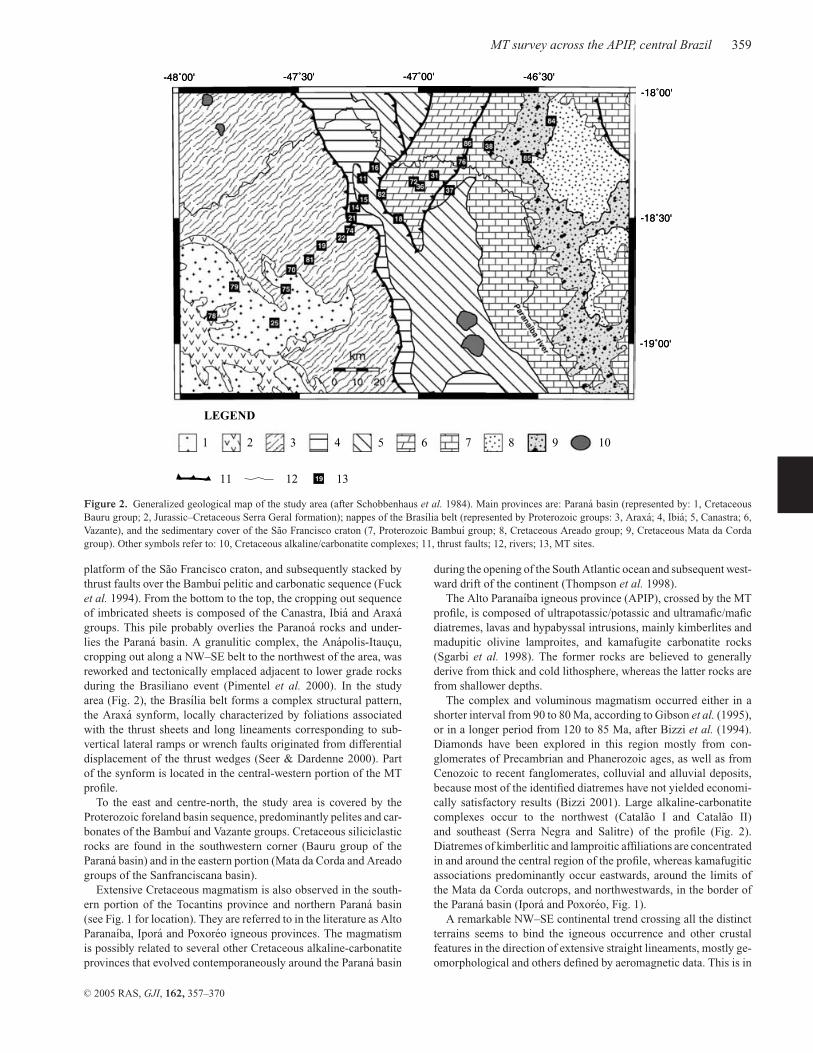
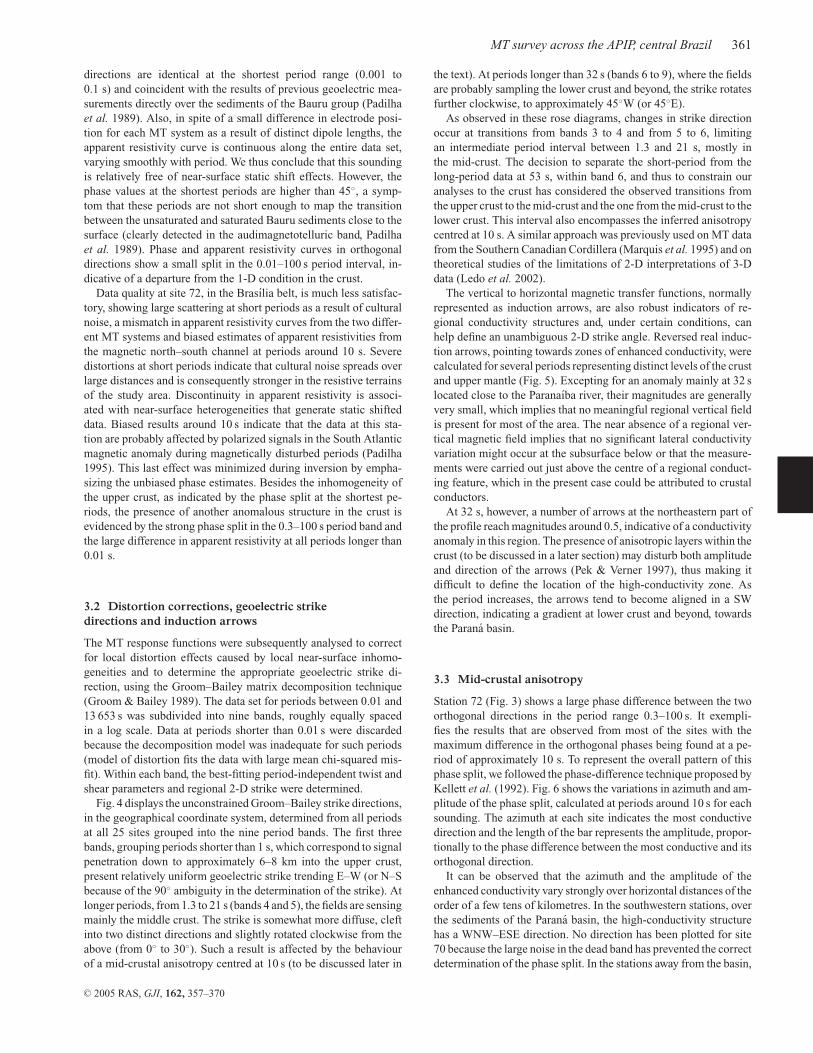
Figure 3. Unrotated MT results from soundings over the sediments of the Parana basin (site 78) and over the metasediments of the Brasılia belt (site 72).Apparent resistivities and phases from electric dipole oriented at 20NW (triangles) and 70NE (squares) directions are shown with error bars representing onestandard deviation. Open symbols are data from broad-band MT system, closed symbols are data from long-period MT system.
and Hz) and the orthogonal horizontal components of the inducedelectric field (Ex and Ey) to obtain the distribution of the electricconductivity in the interior of the Earth. In this study, the five electro-magnetic components were recorded at 25 stations along a 180-kmprofile, in a NE–SW direction, roughly perpendicular to some of themajor surface features, such as the direction of the uplifted APIP,the nappe kinetics and related features (foliation, lateral ramp andthrust faults), alignment of volcanic plugs, and aeromagnetic andgeomorphologic lineaments (see Fig. 2).
A commercial single-station wide-band MT system (MetronixGMS05) was used at every site in a coordinate system with oneof the horizontal axes aligned with the magnetic meridian (20W).The telluric field variations were measured with 100-m dipoles,in a cross-configuration, with non-polarizable cadmium—cadmiumchloride electrodes, whereas the magnetic fields were measured withinduction coils for the two horizontal and one vertical components.The period range of this equipment is of 0.0008–1024 s and record-ing time was typically of at least 24 hr. At 14 of the above sta-tions, other commercial remote-referenced long-period MT systems(Phoenix LRMT) were operated in the period range of 20 to 13 653 swith recording time up to 2 weeks under the same geomagneticcoordinate system. The horizontal telluric fields were acquiredwith lead—lead chloride electrodes in a cross-configuration with150-m lengths, while the three components of the magnetic fieldwere acquired with high-sensitivity ring-core fluxgate sensors.
3.1 Data quality
The first step in data processing involved estimation of the complex-valued MT tensor elements and geomagnetic transfer functions us-ing the technique of Egbert & Booker (1986). Fig. 3 exemplifiesour MT results at two representative sites displaying different dataquality. The combined sounding curves from wide-band and long-period MT systems are shown in unrotated coordinates for both or-thogonal directions. Site 78 is within the realms of the Parana basin.Apart from some scattering at specific short periods, associated with60-Hz transmission lines, and larger error bars at the longest periods,attributable to the limits of the recording time, the data appear tobe of excellent quality. The apparent resistivity curves from both
C© 2005 RAS, GJI, 162, 357–370
MT survey across the APIP, central Brazil 361
directions are identical at the shortest period range (0.001 to0.1 s) and coincident with the results of previous geoelectric mea-surements directly over the sediments of the Bauru group (Padilhaet al. 1989). Also, in spite of a small difference in electrode posi-tion for each MT system as a result of distinct dipole lengths, theapparent resistivity curve is continuous along the entire data set,varying smoothly with period. We thus conclude that this soundingis relatively free of near-surface static shift effects. However, thephase values at the shortest periods are higher than 45, a symp-tom that these periods are not short enough to map the transitionbetween the unsaturated and saturated Bauru sediments close to thesurface (clearly detected in the audimagnetotelluric band, Padilhaet al. 1989). Phase and apparent resistivity curves in orthogonaldirections show a small split in the 0.01–100 s period interval, in-dicative of a departure from the 1-D condition in the crust.
Data quality at site 72, in the Brasılia belt, is much less satisfac-tory, showing large scattering at short periods as a result of culturalnoise, a mismatch in apparent resistivity curves from the two differ-ent MT systems and biased estimates of apparent resistivities fromthe magnetic north–south channel at periods around 10 s. Severedistortions at short periods indicate that cultural noise spreads overlarge distances and is consequently stronger in the resistive terrainsof the study area. Discontinuity in apparent resistivity is associ-ated with near-surface heterogeneities that generate static shifteddata. Biased results around 10 s indicate that the data at this sta-tion are probably affected by polarized signals in the South Atlanticmagnetic anomaly during magnetically disturbed periods (Padilha1995). This last effect was minimized during inversion by empha-sizing the unbiased phase estimates. Besides the inhomogeneity ofthe upper crust, as indicated by the phase split at the shortest pe-riods, the presence of another anomalous structure in the crust isevidenced by the strong phase split in the 0.3–100 s period band andthe large difference in apparent resistivity at all periods longer than0.01 s.
3.2 Distortion corrections, geoelectric strikedirections and induction arrows
The MT response functions were subsequently analysed to correctfor local distortion effects caused by local near-surface inhomo-geneities and to determine the appropriate geoelectric strike di-rection, using the Groom–Bailey matrix decomposition technique(Groom & Bailey 1989). The data set for periods between 0.01 and13 653 s was subdivided into nine bands, roughly equally spacedin a log scale. Data at periods shorter than 0.01 s were discardedbecause the decomposition model was inadequate for such periods(model of distortion fits the data with large mean chi-squared mis-fit). Within each band, the best-fitting period-independent twist andshear parameters and regional 2-D strike were determined.
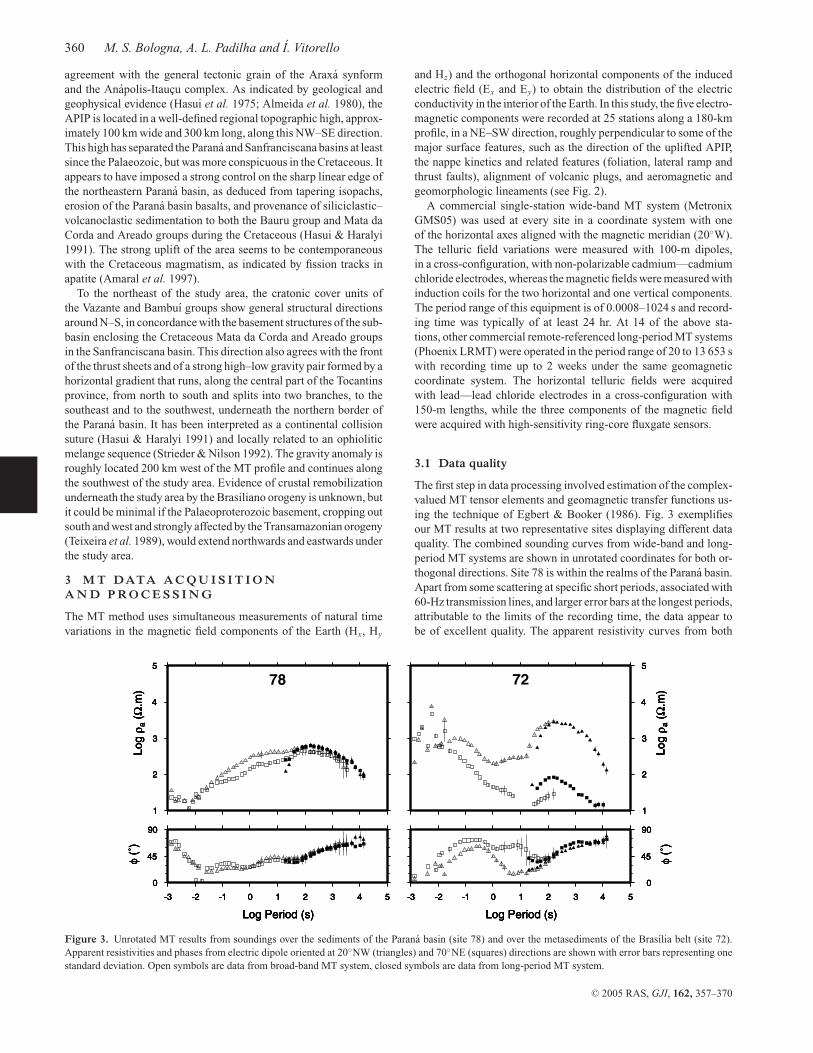
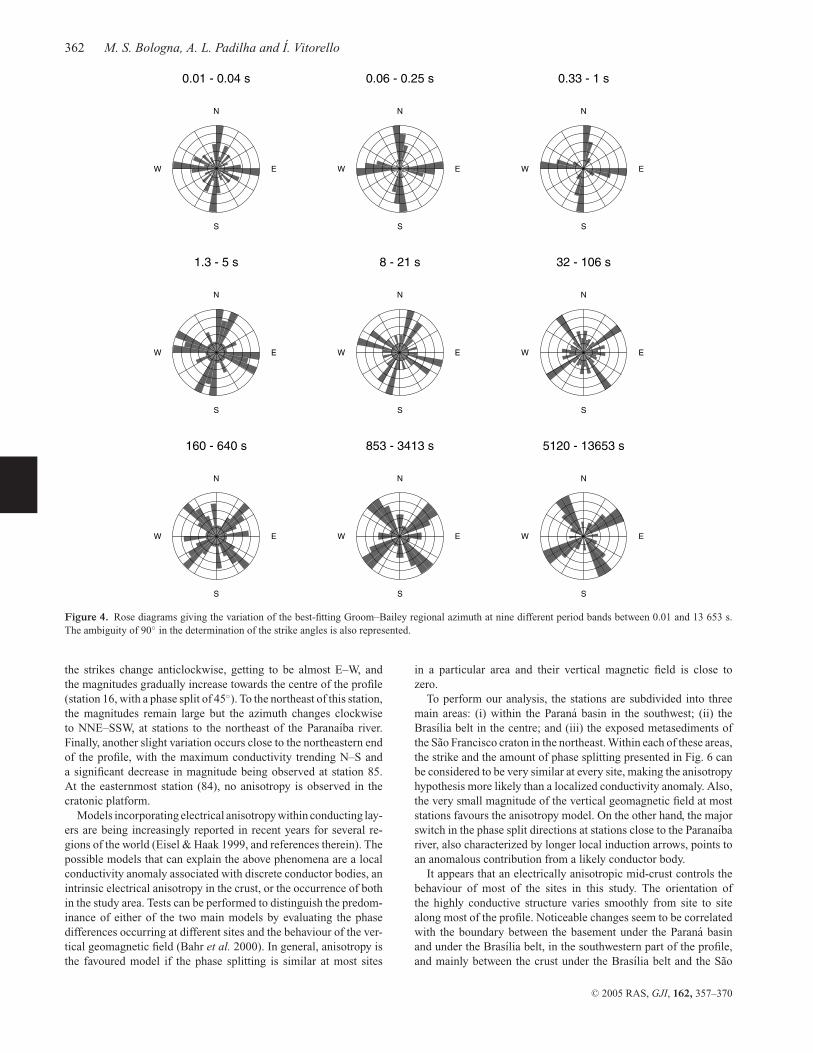
Fig. 4 displays the unconstrained Groom–Bailey strike directions,in the geographical coordinate system, determined from all periodsat all 25 sites grouped into the nine period bands. The first threebands, grouping periods shorter than 1 s, which correspond to signalpenetration down to approximately 6–8 km into the upper crust,present relatively uniform geoelectric strike trending E–W (or N–Sbecause of the 90 ambiguity in the determination of the strike). Atlonger periods, from 1.3 to 21 s (bands 4 and 5), the fields are sensingmainly the middle crust. The strike is somewhat more diffuse, cleftinto two distinct directions and slightly rotated clockwise from theabove (from 0 to 30). Such a result is affected by the behaviourof a mid-crustal anisotropy centred at 10 s (to be discussed later in
the text). At periods longer than 32 s (bands 6 to 9), where the fieldsare probably sampling the lower crust and beyond, the strike rotatesfurther clockwise, to approximately 45W (or 45E).
As observed in these rose diagrams, changes in strike directionoccur at transitions from bands 3 to 4 and from 5 to 6, limitingan intermediate period interval between 1.3 and 21 s, mostly inthe mid-crust. The decision to separate the short-period from thelong-period data at 53 s, within band 6, and thus to constrain ouranalyses to the crust has considered the observed transitions fromthe upper crust to the mid-crust and the one from the mid-crust to thelower crust. This interval also encompasses the inferred anisotropycentred at 10 s. A similar approach was previously used on MT datafrom the Southern Canadian Cordillera (Marquis et al. 1995) and ontheoretical studies of the limitations of 2-D interpretations of 3-Ddata (Ledo et al. 2002).
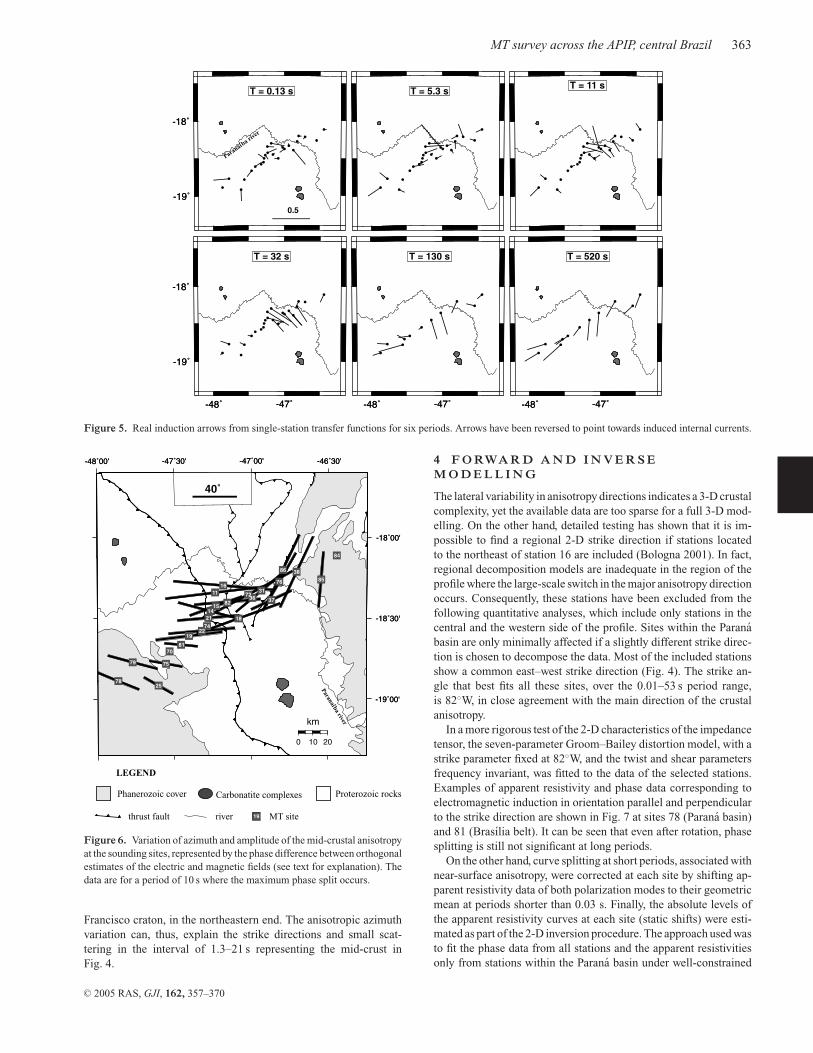
The vertical to horizontal magnetic transfer functions, normallyrepresented as induction arrows, are also robust indicators of re-gional conductivity structures and, under certain conditions, canhelp define an unambiguous 2-D strike angle. Reversed real induc-tion arrows, pointing towards zones of enhanced conductivity, werecalculated for several periods representing distinct levels of the crustand upper mantle (Fig. 5). Excepting for an anomaly mainly at 32 slocated close to the Paranaıba river, their magnitudes are generallyvery small, which implies that no meaningful regional vertical fieldis present for most of the area. The near absence of a regional ver-tical magnetic field implies that no significant lateral conductivityvariation might occur at the subsurface below or that the measure-ments were carried out just above the centre of a regional conduct-ing feature, which in the present case could be attributed to crustalconductors.
At 32 s, however, a number of arrows at the northeastern part ofthe profile reach magnitudes around 0.5, indicative of a conductivityanomaly in this region. The presence of anisotropic layers within thecrust (to be discussed in a later section) may disturb both amplitudeand direction of the arrows (Pek & Verner 1997), thus making itdifficult to define the location of the high-conductivity zone. Asthe period increases, the arrows tend to become aligned in a SWdirection, indicating a gradient at lower crust and beyond, towardsthe Parana basin.
3.3 Mid-crustal anisotropy
Station 72 (Fig. 3) shows a large phase difference between the twoorthogonal directions in the period range 0.3–100 s. It exempli-fies the results that are observed from most of the sites with themaximum difference in the orthogonal phases being found at a pe-riod of approximately 10 s. To represent the overall pattern of thisphase split, we followed the phase-difference technique proposed byKellett et al. (1992). Fig. 6 shows the variations in azimuth and am-plitude of the phase split, calculated at periods around 10 s for eachsounding. The azimuth at each site indicates the most conductivedirection and the length of the bar represents the amplitude, propor-tionally to the phase difference between the most conductive and itsorthogonal direction.
It can be observed that the azimuth and the amplitude of theenhanced conductivity vary strongly over horizontal distances of theorder of a few tens of kilometres. In the southwestern stations, overthe sediments of the Parana basin, the high-conductivity structurehas a WNW–ESE direction. No direction has been plotted for site70 because the large noise in the dead band has prevented the correctdetermination of the phase split. In the stations away from the basin,
C© 2005 RAS, GJI, 162, 357–370
362 M. S. Bologna, A. L. Padilha and I. Vitorello
0.01 - 0.04 s
S
EW
N
0.06 - 0.25 s
S
EW
N
0.33 - 1 s
S
EW
N
1.3 - 5 s
S
EW
N
8 - 21 s
S
EW
N
32 - 106 s
S
EW
N
160 - 640 s
S
EW
N
853 - 3413 s
S
EW
N
5120 - 13653 s
S
EW
N
Figure 4. Rose diagrams giving the variation of the best-fitting Groom–Bailey regional azimuth at nine different period bands between 0.01 and 13 653 s.The ambiguity of 90 in the determination of the strike angles is also represented.
the strikes change anticlockwise, getting to be almost E–W, andthe magnitudes gradually increase towards the centre of the profile(station 16, with a phase split of 45). To the northeast of this station,the magnitudes remain large but the azimuth changes clockwiseto NNE–SSW, at stations to the northeast of the Paranaıba river.Finally, another slight variation occurs close to the northeastern endof the profile, with the maximum conductivity trending N–S anda significant decrease in magnitude being observed at station 85.At the easternmost station (84), no anisotropy is observed in thecratonic platform.
Models incorporating electrical anisotropy within conducting lay-ers are being increasingly reported in recent years for several re-gions of the world (Eisel & Haak 1999, and references therein). Thepossible models that can explain the above phenomena are a localconductivity anomaly associated with discrete conductor bodies, anintrinsic electrical anisotropy in the crust, or the occurrence of bothin the study area. Tests can be performed to distinguish the predom-inance of either of the two main models by evaluating the phasedifferences occurring at different sites and the behaviour of the ver-tical geomagnetic field (Bahr et al. 2000). In general, anisotropy isthe favoured model if the phase splitting is similar at most sites
in a particular area and their vertical magnetic field is close tozero.
To perform our analysis, the stations are subdivided into threemain areas: (i) within the Parana basin in the southwest; (ii) theBrasılia belt in the centre; and (iii) the exposed metasediments ofthe Sao Francisco craton in the northeast. Within each of these areas,the strike and the amount of phase splitting presented in Fig. 6 canbe considered to be very similar at every site, making the anisotropyhypothesis more likely than a localized conductivity anomaly. Also,the very small magnitude of the vertical geomagnetic field at moststations favours the anisotropy model. On the other hand, the majorswitch in the phase split directions at stations close to the Paranaıbariver, also characterized by longer local induction arrows, points toan anomalous contribution from a likely conductor body.
It appears that an electrically anisotropic mid-crust controls thebehaviour of most of the sites in this study. The orientation ofthe highly conductive structure varies smoothly from site to sitealong most of the profile. Noticeable changes seem to be correlatedwith the boundary between the basement under the Parana basinand under the Brasılia belt, in the southwestern part of the profile,and mainly between the crust under the Brasılia belt and the Sao
C© 2005 RAS, GJI, 162, 357–370
MT survey across the APIP, central Brazil 363
-19˚
-18˚
-19˚
-18˚
Paranaiba river
T = 0.13 s T = 5.3 sT = 11 s
-48˚ -47˚
-19˚
-18˚
-48˚ -47˚
-19˚
-18˚
T = 32 s
-48˚ -47˚
-48˚ -47˚
T = 130 s
-48˚ -47˚
-48˚ -47˚
T = 520 s
0.5
Figure 5. Real induction arrows from single-station transfer functions for six periods. Arrows have been reversed to point towards induced internal currents.
-48˚00' -47˚30' -47˚00' -46˚30'
-19˚00'
-18˚30'
-18˚00'
0 10 20
km
72
74
75
76
11
14
16
18
19
21
22
24
15
2578
79
7081
82
86
85
84
3631
37
38
Paranaiba river-48˚00' -47˚30' -47˚00' -46˚30'
-19˚00'
-18˚30'
-18˚00'
40˚
LEGEND
Phanerozoic cover Carbonatite complexes Proterozoic rocks
thrust fault river MT site19
Figure 6. Variation of azimuth and amplitude of the mid-crustal anisotropyat the sounding sites, represented by the phase difference between orthogonalestimates of the electric and magnetic fields (see text for explanation). Thedata are for a period of 10 s where the maximum phase split occurs.
Francisco craton, in the northeastern end. The anisotropic azimuthvariation can, thus, explain the strike directions and small scat-tering in the interval of 1.3–21 s representing the mid-crust inFig. 4.
4 F O RWA R D A N D I N V E R S EM O D E L L I N G
The lateral variability in anisotropy directions indicates a 3-D crustalcomplexity, yet the available data are too sparse for a full 3-D mod-elling. On the other hand, detailed testing has shown that it is im-possible to find a regional 2-D strike direction if stations locatedto the northeast of station 16 are included (Bologna 2001). In fact,regional decomposition models are inadequate in the region of theprofile where the large-scale switch in the major anisotropy directionoccurs. Consequently, these stations have been excluded from thefollowing quantitative analyses, which include only stations in thecentral and the western side of the profile. Sites within the Paranabasin are only minimally affected if a slightly different strike direc-tion is chosen to decompose the data. Most of the included stationsshow a common east–west strike direction (Fig. 4). The strike an-gle that best fits all these sites, over the 0.01–53 s period range,is 82W, in close agreement with the main direction of the crustalanisotropy.
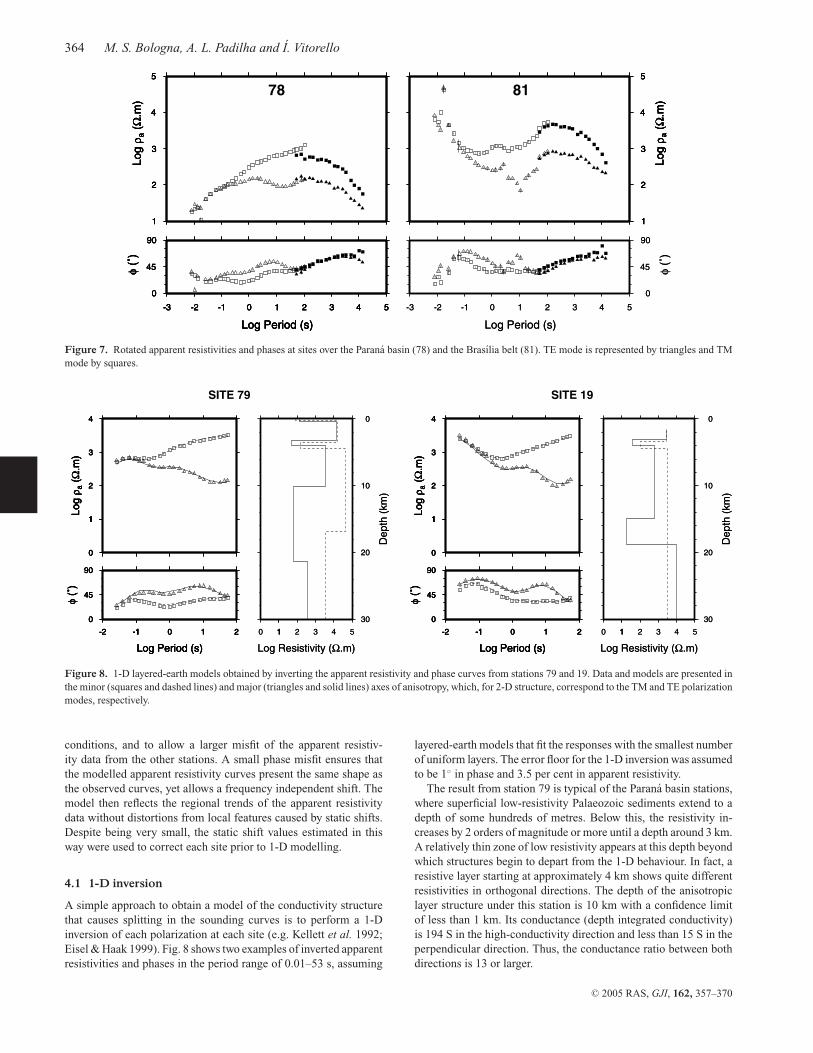
In a more rigorous test of the 2-D characteristics of the impedancetensor, the seven-parameter Groom–Bailey distortion model, with astrike parameter fixed at 82W, and the twist and shear parametersfrequency invariant, was fitted to the data of the selected stations.Examples of apparent resistivity and phase data corresponding toelectromagnetic induction in orientation parallel and perpendicularto the strike direction are shown in Fig. 7 at sites 78 (Parana basin)and 81 (Brasılia belt). It can be seen that even after rotation, phasesplitting is still not significant at long periods.
On the other hand, curve splitting at short periods, associated withnear-surface anisotropy, were corrected at each site by shifting ap-parent resistivity data of both polarization modes to their geometricmean at periods shorter than 0.03 s. Finally, the absolute levels ofthe apparent resistivity curves at each site (static shifts) were esti-mated as part of the 2-D inversion procedure. The approach used wasto fit the phase data from all stations and the apparent resistivitiesonly from stations within the Parana basin under well-constrained
C© 2005 RAS, GJI, 162, 357–370
364 M. S. Bologna, A. L. Padilha and I. Vitorello
1
2
3
4
5
Log
ρ a (
Ω.m
)
1
2
3
4
5
Log
ρ a (
Ω.m
)
1
2
3
4
5
Log
ρ a (
Ω.m
)
1
2
3
4
5
Log
ρ a (
Ω.m
)
78
0
45
90
φ (˚
)
-3 -2 -1 0 1 2 3 4 5
Log Period (s)
0
45
90
φ (˚
)
-3 -2 -1 0 1 2 3 4 5
Log Period (s)
0
45
90
φ (˚
)
-3 -2 -1 0 1 2 3 4 5
Log Period (s)
0
45
90
φ (˚
)
-3 -2 -1 0 1 2 3 4 5
Log Period (s)
1
2
3
4
5
Log
ρ a (
Ω.m
)
1
2
3
4
5
Log
ρ a (
Ω.m
)
1
2
3
4
5
Log
ρ a (
Ω.m
)
1
2
3
4
5
Log
ρ a (
Ω.m
)
81
0
45
90
φ (˚
)
-3 -2 -1 0 1 2 3 4 5
Log Period (s)
0
45
90
φ (˚
)
-3 -2 -1 0 1 2 3 4 5
Log Period (s)
Figure 7. Rotated apparent resistivities and phases at sites over the Parana basin (78) and the Brasılia belt (81). TE mode is represented by triangles and TMmode by squares.
0
11
2
3
4
Log
ρ a (
Ω.m
)
0
11
2
3
4
Log
ρ a (
Ω.m
)
0
11
2
3
4
Log
ρ a (
Ω.m
)
0
11
2
3
4
Log
ρ a (
Ω.m
)
0
45
90
φ (˚
)
-2 -1-1 0 1 2
Log Period (s)
0
45
90
φ (˚
)
-2 -1-1 0 1 2
Log Period (s)
0
45
90
φ (˚
)
-2 -1-1 0 1 2
Log Period (s)
0
45
90
φ (˚
)
-2 -1-1 0 1 2
Log Period (s)
0
10
20
30
Dep
th (
km)
0 11 2 3 4 5
Log Resistivity (Ω.m)
0
10
20
30
Dep
th (
km)
0 11 2 3 4 5
Log Resistivity (Ω.m)
SITE 79
0
11
2
3
4Lo
g ρ a
(Ω
.m)
0
11
2
3
4Lo
g ρ a
(Ω
.m)
0
11
2
3
4Lo
g ρ a
(Ω
.m)
0
11
2
3
4Lo
g ρ a
(Ω
.m)
0
45
90
φ (˚
)
-2 -1-1 0 1 2
Log Period (s)
0
45
90
φ (˚
)
-2 -1-1 0 1 2
Log Period (s)
0
45
90
φ (˚
)
-2 -1-1 0 1 2
Log Period (s)
0
45
90
φ (˚
)
-2 -1-1 0 1 2
Log Period (s)
0
10
20
30
Dep
th (
km)
0 11 2 3 4 5
Log Resistivity (Ω.m)
0
10
20
30
Dep
th (
km)
0 11 2 3 4 5
Log Resistivity (Ω.m)
SITE 19
Figure 8. 1-D layered-earth models obtained by inverting the apparent resistivity and phase curves from stations 79 and 19. Data and models are presented inthe minor (squares and dashed lines) and major (triangles and solid lines) axes of anisotropy, which, for 2-D structure, correspond to the TM and TE polarizationmodes, respectively.
conditions, and to allow a larger misfit of the apparent resistiv-ity data from the other stations. A small phase misfit ensures thatthe modelled apparent resistivity curves present the same shape asthe observed curves, yet allows a frequency independent shift. Themodel then reflects the regional trends of the apparent resistivitydata without distortions from local features caused by static shifts.Despite being very small, the static shift values estimated in thisway were used to correct each site prior to 1-D modelling.
4.1 1-D inversion
A simple approach to obtain a model of the conductivity structurethat causes splitting in the sounding curves is to perform a 1-Dinversion of each polarization at each site (e.g. Kellett et al. 1992;Eisel & Haak 1999). Fig. 8 shows two examples of inverted apparentresistivities and phases in the period range of 0.01–53 s, assuming
layered-earth models that fit the responses with the smallest numberof uniform layers. The error floor for the 1-D inversion was assumedto be 1 in phase and 3.5 per cent in apparent resistivity.
The result from station 79 is typical of the Parana basin stations,where superficial low-resistivity Palaeozoic sediments extend to adepth of some hundreds of metres. Below this, the resistivity in-creases by 2 orders of magnitude or more until a depth around 3 km.A relatively thin zone of low resistivity appears at this depth beyondwhich structures begin to depart from the 1-D behaviour. In fact, aresistive layer starting at approximately 4 km shows quite differentresistivities in orthogonal directions. The depth of the anisotropiclayer structure under this station is 10 km with a confidence limitof less than 1 km. Its conductance (depth integrated conductivity)is 194 S in the high-conductivity direction and less than 15 S in theperpendicular direction. Thus, the conductance ratio between bothdirections is 13 or larger.
C© 2005 RAS, GJI, 162, 357–370
MT survey across the APIP, central Brazil 365
Site 19 lies in a more resistive region, directly over the metased-iments of the Brasılia belt. The main difference from station 79 isthe absence of the conductive layer associated with the sedimentarypackage at the surface. Again, the structures are not 1-D below theconductive layer located at 3-km depth. The anisotropic layer is ob-served at a deeper level (around 14 km) and the conductances are215 S in the 82W direction and less than 18 S in the perpendiculardirection. The conductance ratio at this station is at least 12.
Similar calculations were performed for all stations. It was ob-served that, in most cases, the representative values of the anisotropiclayer are nearly the same, with a maximum conductance around200 S and the conductance ratio in the range of 12–13. The onlyexception was observed at stations close to the centre of the profilein Fig. 2, coincident with the occurrence of the largest amplitude ofthe phase split (Fig. 6). At station 16, for instance, the conductancealong the high-conductivity direction is 500 S and the conductanceratio of the perpendicular directions is 22. However, these quantita-tive 1-D results must be treated with caution as the data are obviouslyaffected by the varying strike in the 0.01–53 s period range (Fig. 4)and the close proximity of regional 2-D structures.
4.2 2-D inversion
To determine whether the 1-D inversions represent well the 2-Dearth, only data from the western side of the APIP profile were in-verted using 2-D algorithms. As there are no MT inversion codesavailable for anisotropic data, we used a 2-D inversion for isotropicmodels to recover the anisotropy following the procedure describedby Heise & Pous (2001). An algorithm that seeks to estimatestatic shifts and generate a smooth model simultaneously (REBOCC,Siripunvaraporn & Egbert 2000) was used, and 10 sites were chosenfor modelling based on their stability, quality and minimal scatter.At these sites, data were taken at 12 periods between 0.01 and 53s, equally spaced in logarithm scale, in both polarization modes(transverse electric (TE) and transverse magnetic (TM), with cur-rents parallel and perpendicular to the electrical strike, respectively).The induction arrows have not been interpreted together with MTresponses because their typical errors are as large as the arrowsthemselves. Also, theoretical studies have shown that the arrows areseverely affected when anisotropic structures are present (Heise &Pous 2001).
As previously explained, we preferentially fitted the phase datafrom all the selected sites and the apparent resistivity from the siteswithin the Parana basin that seemed to be little affected by staticshifts. Accordingly, error tolerances for apparent resistivity fromsites outside the basin were set at 24 per cent, whereas an error floorof 3 per cent was imposed on the apparent resistivity of sites withinthe basin and on phases from all sites.
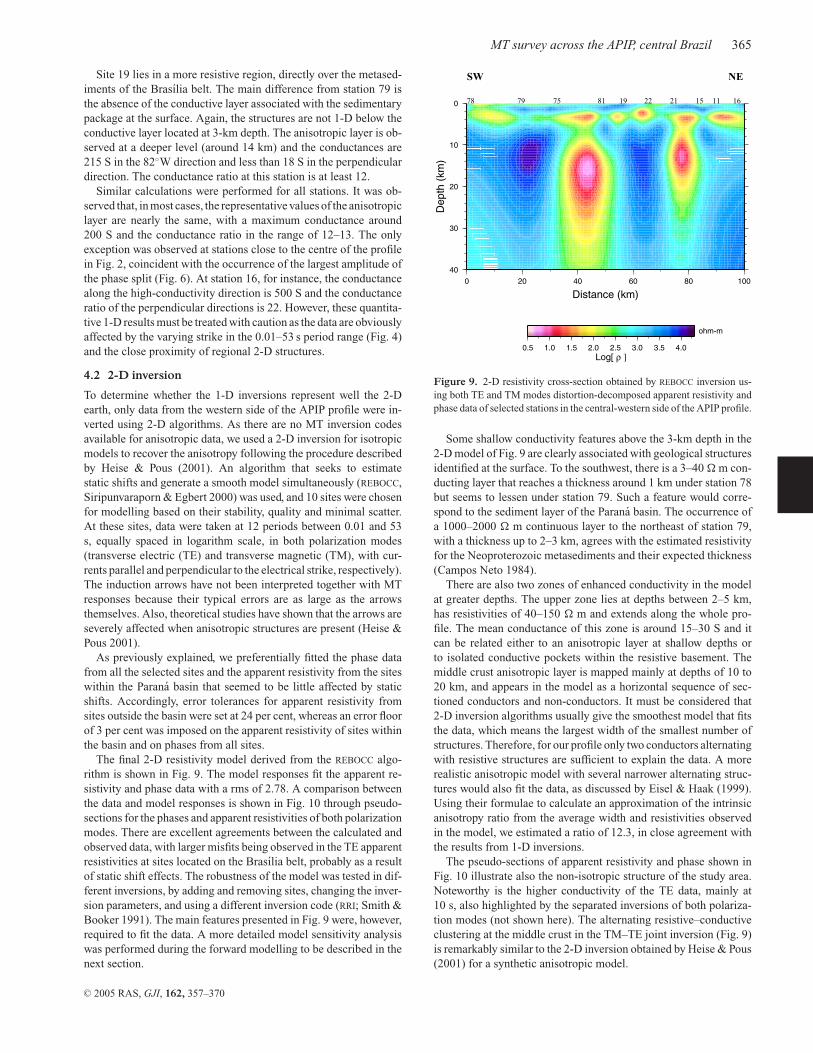
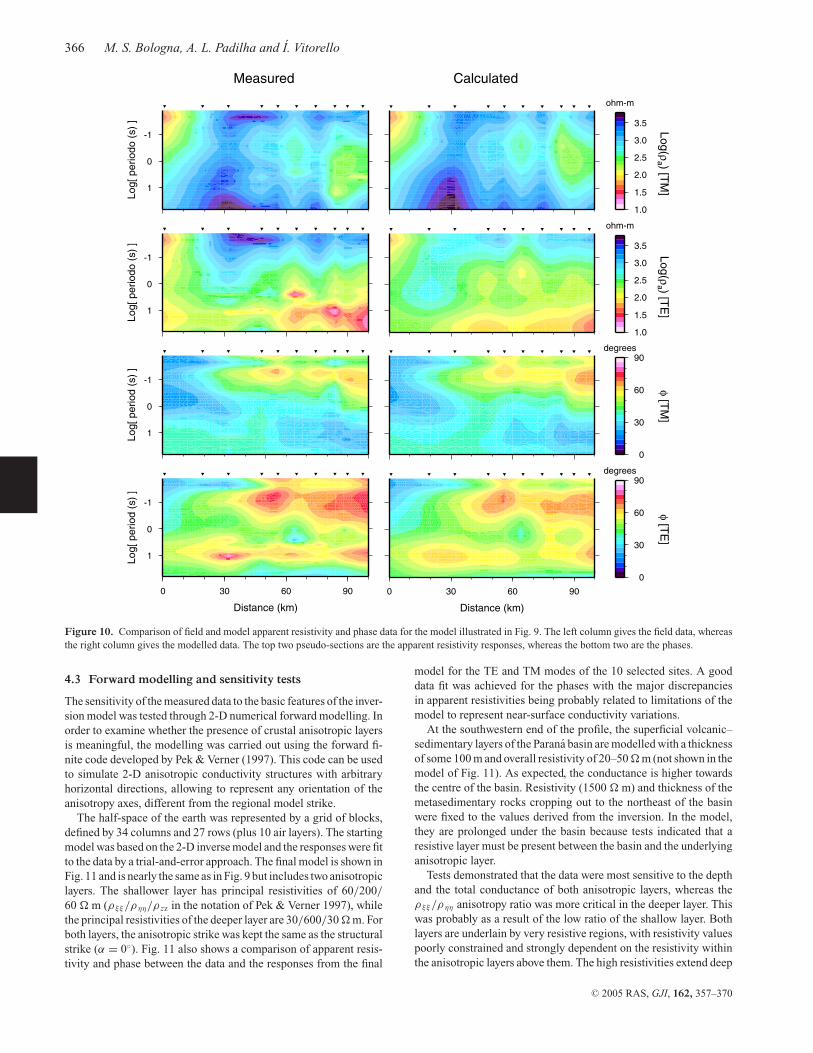
The final 2-D resistivity model derived from the REBOCC algo-rithm is shown in Fig. 9. The model responses fit the apparent re-sistivity and phase data with a rms of 2.78. A comparison betweenthe data and model responses is shown in Fig. 10 through pseudo-sections for the phases and apparent resistivities of both polarizationmodes. There are excellent agreements between the calculated andobserved data, with larger misfits being observed in the TE apparentresistivities at sites located on the Brasılia belt, probably as a resultof static shift effects. The robustness of the model was tested in dif-ferent inversions, by adding and removing sites, changing the inver-sion parameters, and using a different inversion code (RRI; Smith &Booker 1991). The main features presented in Fig. 9 were, however,required to fit the data. A more detailed model sensitivity analysiswas performed during the forward modelling to be described in thenext section.
0
10
20
30
40
Dep
th (
km)
0 20 40 60 80 100
Distance (km)
0.5 1.0 1.5 2.0 2.5 3.0 3.5 4.0
ohm-m
78 79 75 81 19 22 21 15 11 16
Log[ ρ ]
SW NE
Figure 9. 2-D resistivity cross-section obtained by REBOCC inversion us-ing both TE and TM modes distortion-decomposed apparent resistivity andphase data of selected stations in the central-western side of the APIP profile.
Some shallow conductivity features above the 3-km depth in the2-D model of Fig. 9 are clearly associated with geological structuresidentified at the surface. To the southwest, there is a 3–40 m con-ducting layer that reaches a thickness around 1 km under station 78but seems to lessen under station 79. Such a feature would corre-spond to the sediment layer of the Parana basin. The occurrence ofa 1000–2000 m continuous layer to the northeast of station 79,with a thickness up to 2–3 km, agrees with the estimated resistivityfor the Neoproterozoic metasediments and their expected thickness(Campos Neto 1984).
There are also two zones of enhanced conductivity in the modelat greater depths. The upper zone lies at depths between 2–5 km,has resistivities of 40–150 m and extends along the whole pro-file. The mean conductance of this zone is around 15–30 S and itcan be related either to an anisotropic layer at shallow depths orto isolated conductive pockets within the resistive basement. Themiddle crust anisotropic layer is mapped mainly at depths of 10 to20 km, and appears in the model as a horizontal sequence of sec-tioned conductors and non-conductors. It must be considered that2-D inversion algorithms usually give the smoothest model that fitsthe data, which means the largest width of the smallest number ofstructures. Therefore, for our profile only two conductors alternatingwith resistive structures are sufficient to explain the data. A morerealistic anisotropic model with several narrower alternating struc-tures would also fit the data, as discussed by Eisel & Haak (1999).Using their formulae to calculate an approximation of the intrinsicanisotropy ratio from the average width and resistivities observedin the model, we estimated a ratio of 12.3, in close agreement withthe results from 1-D inversions.
The pseudo-sections of apparent resistivity and phase shown inFig. 10 illustrate also the non-isotropic structure of the study area.Noteworthy is the higher conductivity of the TE data, mainly at10 s, also highlighted by the separated inversions of both polariza-tion modes (not shown here). The alternating resistive–conductiveclustering at the middle crust in the TM–TE joint inversion (Fig. 9)is remarkably similar to the 2-D inversion obtained by Heise & Pous(2001) for a synthetic anisotropic model.
C© 2005 RAS, GJI, 162, 357–370
366 M. S. Bologna, A. L. Padilha and I. Vitorello
-1
0
1Log[
per
iod
(s)
]
0 30 60 90
Distance (km)
-1
0
1Log[
per
iod
(s)
]
0 30 60 90
Distance (km)
0
30
60
90degrees
0
30
60
90degrees
-1
0
1
Log[
per
iodo
(s)
]-1
0
1
Log[
per
iodo
(s)
]
1.0
1.5
2.0
2.5
3.0
3.5
ohm-m
1.0
1.5
2.0
2.5
3.0
3.5
ohm-m
φ [TE
]φ [T
M]
Log(ρa ) [T
E]
Log(ρa ) [T
M]
Measured Calculated
Figure 10. Comparison of field and model apparent resistivity and phase data for the model illustrated in Fig. 9. The left column gives the field data, whereasthe right column gives the modelled data. The top two pseudo-sections are the apparent resistivity responses, whereas the bottom two are the phases.
4.3 Forward modelling and sensitivity tests
The sensitivity of the measured data to the basic features of the inver-sion model was tested through 2-D numerical forward modelling. Inorder to examine whether the presence of crustal anisotropic layersis meaningful, the modelling was carried out using the forward fi-nite code developed by Pek & Verner (1997). This code can be usedto simulate 2-D anisotropic conductivity structures with arbitraryhorizontal directions, allowing to represent any orientation of theanisotropy axes, different from the regional model strike.
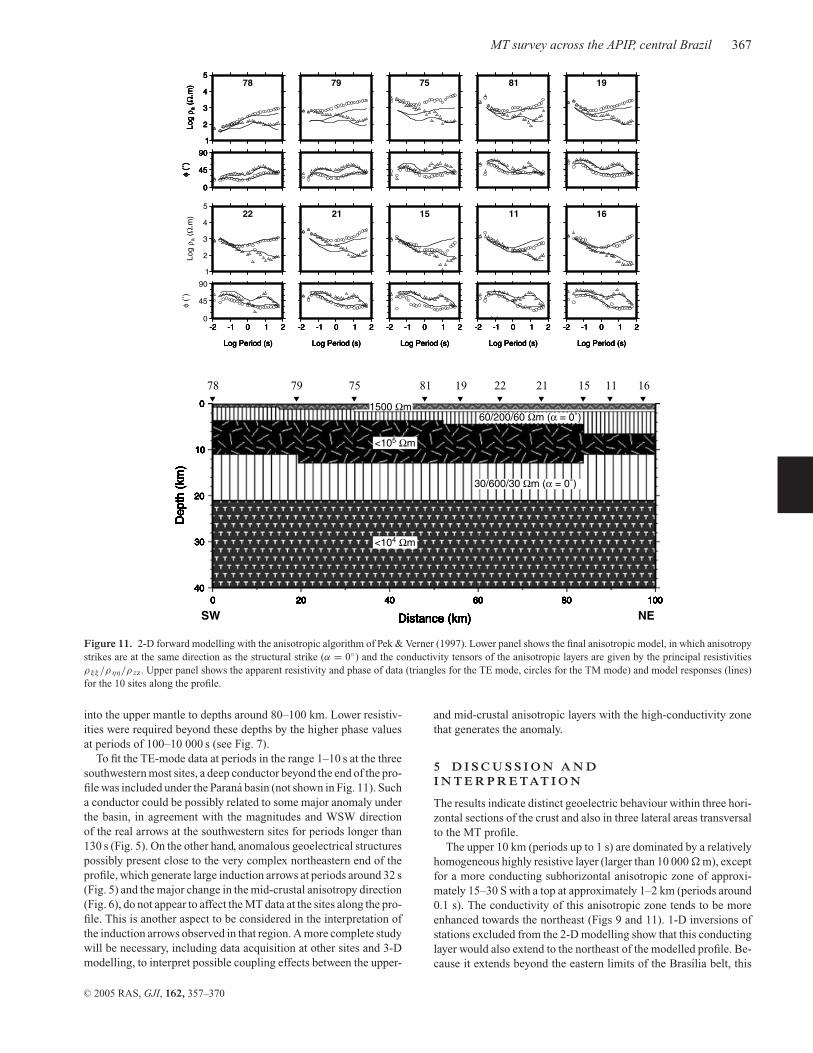
The half-space of the earth was represented by a grid of blocks,defined by 34 columns and 27 rows (plus 10 air layers). The startingmodel was based on the 2-D inverse model and the responses were fitto the data by a trial-and-error approach. The final model is shown inFig. 11 and is nearly the same as in Fig. 9 but includes two anisotropiclayers. The shallower layer has principal resistivities of 60/200/
60 m (ρξξ /ρηη/ρ zz in the notation of Pek & Verner 1997), whilethe principal resistivities of the deeper layer are 30/600/30 m. Forboth layers, the anisotropic strike was kept the same as the structuralstrike (α = 0). Fig. 11 also shows a comparison of apparent resis-tivity and phase between the data and the responses from the final
model for the TE and TM modes of the 10 selected sites. A gooddata fit was achieved for the phases with the major discrepanciesin apparent resistivities being probably related to limitations of themodel to represent near-surface conductivity variations.
At the southwestern end of the profile, the superficial volcanic–sedimentary layers of the Parana basin are modelled with a thicknessof some 100 m and overall resistivity of 20–50 m (not shown in themodel of Fig. 11). As expected, the conductance is higher towardsthe centre of the basin. Resistivity (1500 m) and thickness of themetasedimentary rocks cropping out to the northeast of the basinwere fixed to the values derived from the inversion. In the model,they are prolonged under the basin because tests indicated that aresistive layer must be present between the basin and the underlyinganisotropic layer.
Tests demonstrated that the data were most sensitive to the depthand the total conductance of both anisotropic layers, whereas theρξξ /ρηη anisotropy ratio was more critical in the deeper layer. Thiswas probably as a result of the low ratio of the shallow layer. Bothlayers are underlain by very resistive regions, with resistivity valuespoorly constrained and strongly dependent on the resistivity withinthe anisotropic layers above them. The high resistivities extend deep
C© 2005 RAS, GJI, 162, 357–370
MT survey across the APIP, central Brazil 367
0
10
20
30
40
Dep
th (
km)
0 20 40 60 80 100
Distance (km)
0
10
20
30
40
Dep
th (
km)
0 20 40 60 80 100
Distance (km)
0
10
20
30
40
Dep
th (
km)
0 20 40 60 80 100
Distance (km)
0
10
20
30
40
Dep
th (
km)
0 20 40 60 80 100
Distance (km)
0
10
20
30
40
Dep
th (
km)
0 20 40 60 80 100
Distance (km)
0
10
20
30
40
Dep
th (
km)
0 20 40 60 80 100
Distance (km)
0
10
20
30
40
Dep
th (
km)
0 20 40 60 80 100
Distance (km)
0
10
20
30
40
Dep
th (
km)
0 20 40 60 80 100
Distance (km)
0
10
20
30
40
Dep
th (
km)
0 20 40 60 80 100
Distance (km)
78 79 75 81 19 22 21 15 11 16
SW NE
30/600/30 Ωm (α = 0˚)
60/200/60 Ωm (α = 0˚)1500 Ωm
<105 Ωm
<104 Ωm
1
2
3
4
5
Log
ρ a (
Ω.m
)
1
2
3
4
5
Log
ρ a (
Ω.m
)
1
2
3
4
5
Log
ρ a (
Ω.m
)
1
2
3
4
5
Log
ρ a (
Ω.m
) 78
0
45
90
φ (˚
)0
45
90
φ (˚
)0
45
90
φ (˚
)0
45
90
φ (˚
)
79 75 81 19
1
2
3
4
5
Log
ρ a (
Ω.m
) 22
0
45
90
φ (˚
)
-2 -1 0 1 2
Log Period (s)
-2 -1 0 1 2
Log Period (s)
-2 -1 0 1 2
Log Period (s)
-2 -1 0 1 2
Log Period (s)
21
-2 -1 0 1 2
Log Period (s)
-2 -1 0 1 2
Log Period (s)
-2 -1 0 1 2
Log Period (s)
-2 -1 0 1 2
Log Period (s)
15
-2 -1 0 1 2
Log Period (s)
-2 -1 0 1 2
Log Period (s)
-2 -1 0 1 2
Log Period (s)
-2 -1 0 1 2
Log Period (s)
11
-2 -1 0 1 2
Log Period (s)
-2 -1 0 1 2
Log Period (s)
-2 -1 0 1 2
Log Period (s)
-2 -1 0 1 2
Log Period (s)
16
-2 -1 0 1 2
Log Period (s)
-2 -1 0 1 2
Log Period (s)
-2 -1 0 1 2
Log Period (s)
-2 -1 0 1 2
Log Period (s)
Figure 11. 2-D forward modelling with the anisotropic algorithm of Pek & Verner (1997). Lower panel shows the final anisotropic model, in which anisotropystrikes are at the same direction as the structural strike (α = 0) and the conductivity tensors of the anisotropic layers are given by the principal resistivitiesρξξ /ρηη/ρ zz. Upper panel shows the apparent resistivity and phase of data (triangles for the TE mode, circles for the TM mode) and model responses (lines)for the 10 sites along the profile.
into the upper mantle to depths around 80–100 km. Lower resistiv-ities were required beyond these depths by the higher phase valuesat periods of 100–10 000 s (see Fig. 7).
To fit the TE-mode data at periods in the range 1–10 s at the threesouthwestern most sites, a deep conductor beyond the end of the pro-file was included under the Parana basin (not shown in Fig. 11). Sucha conductor could be possibly related to some major anomaly underthe basin, in agreement with the magnitudes and WSW directionof the real arrows at the southwestern sites for periods longer than130 s (Fig. 5). On the other hand, anomalous geoelectrical structurespossibly present close to the very complex northeastern end of theprofile, which generate large induction arrows at periods around 32 s(Fig. 5) and the major change in the mid-crustal anisotropy direction(Fig. 6), do not appear to affect the MT data at the sites along the pro-file. This is another aspect to be considered in the interpretation ofthe induction arrows observed in that region. A more complete studywill be necessary, including data acquisition at other sites and 3-Dmodelling, to interpret possible coupling effects between the upper-
and mid-crustal anisotropic layers with the high-conductivity zonethat generates the anomaly.
5 D I S C U S S I O N A N DI N T E R P R E TAT I O N
The results indicate distinct geoelectric behaviour within three hori-zontal sections of the crust and also in three lateral areas transversalto the MT profile.
The upper 10 km (periods up to 1 s) are dominated by a relativelyhomogeneous highly resistive layer (larger than 10 000 m), exceptfor a more conducting subhorizontal anisotropic zone of approxi-mately 15–30 S with a top at approximately 1–2 km (periods around0.1 s). The conductivity of this anisotropic zone tends to be moreenhanced towards the northeast (Figs 9 and 11). 1-D inversions ofstations excluded from the 2-D modelling show that this conductinglayer would also extend to the northeast of the modelled profile. Be-cause it extends beyond the eastern limits of the Brasılia belt, this
C© 2005 RAS, GJI, 162, 357–370
368 M. S. Bologna, A. L. Padilha and I. Vitorello
conductor is not likely related to a cataclastically fractured fault zonethat would be formed at the sliding base of the transported units, alikely possibility if brine-filled pores would be preserved. Also, thebasal detachment of the nappes exposed in the region is dominatedby mylonites, which present less porosity as a result of the higherdeformation intensity. As a result of its lateral extension of morethan 100 km, and a lack of geological and geophysical evidencefor the presence of a near-surface extensive mineralized zone in theregion, it is also unlikely there is an association of this conductinglayer with metallic conduction.
A more viable alternative for the conductor is supported bygeophysical evidence. Reservoir-induced seismicity, reported byAssumpcao et al. (2002) for the general area of this study, indicates astress-related seismogenic layer within the resistive upper few kilo-metres of the crust. Particularly, seismicity occurring around tworeservoirs (Nova Ponte and Miranda) near the southernmost site ofthe MT profile defines a nearly E–W transpressional fault plane. Thisseismic evidence supports the hypothesis of electrolytic conductionthrough interconnected brines in a subhorizontal layer within thecrystalline basement and maintained by regional stress.
In terms of strike directions, there is an agreement of the results ofFig. 4 with the above mentioned seismicity and other geophysicaldata, such as MT soundings at a contiguous area (Padilha et al.1992) and gravity (Ussami 1999), indicating the predominance ofthe E–W electrical strike for the upper crust. This is slightly differentfrom the directions of the main geological structures observed at thesurface of the study area, which include a system of WNW–ESEsinistral strike-slip faults and dykes. It can then be suggested thatsuch structural features do not provide the primary control on theupper conductive layer in the APIP.
The mid-crust, from 10 to approximately 20 km depth (periods of1–20 s), is characterized by an anomalous conductive section, whichis an apparently common feature found in many studies around theworld (e.g. Jones 1992). Generically, the tops of these conductorsseem to be located at depths greater than 10 km and their conduc-tance would vary apparently as a function of several parameters (e.g.tectonic characteristics, age of structures). An implied causal rela-tionship between conducting layers and the brittle–ductile transitionas proposed by several authors (e.g. Gough 1986; Jones 1987), butcontested by Simpson (1999), is discarded for the study area basedon the unlikely presence of a warm geotherm needed for the transi-tion depth at only 10 km, considering heat-flow data (Vitorello et al.1980) and the tomography of anomalous positive seismic velocityfor the lithosphere (Feng et al. 2004). Furthermore, the proposalsgiven below are constrained by the estimated electrical strikes, thedepths of the conductors and the anisotropic orientation, associatedwith the geological evidence.
Bahr et al. (2000) have argued that the occurrence of electricalanisotropy is a more common feature rather than an exception formodels that link the presence of crustal conductors to direction-dependent crack geometries. In the present study, interconnectedbrines and carbon, in the form of graphite, are considered to be themajor source of the 250–400 S enhancement of conductivity at mid-crustal depths, in concordance with conditions documented by thecrustal deep hole in Europe (ELEKTB group 1997). Saline fluidsalone would be sufficient to explain the results, yet in a voluminousamount, whereas only a very small fraction of the conductive solidphase would be required to generate a conductance of hundreds ofSiemens. A distinction between these two hypotheses could be pos-sible if detailed seismic reflection data were available. The carbonmodel would not probably create important seismic reflectors be-cause only a very small fraction of the conductive phase would be
required to generate the anisotropy. On the contrary, a network offluid-filled, partially aligned cracks would probably generate signif-icant mid-crustal seismic reflectors.
The complex behaviour of the above conductive structure isprobably related to the major magmatic and deformational eventsrecorded in the study area and thus can provide an important markerhorizon to unravel the regional tectonic history. The main regional-scale tectonic event in this region was related to the continentalconvergence and collision in the final stages of amalgamation of thewestern Gondwana. Precise ages and circumstances of the collisionare still disputed. Metamorphic peaks around 600 Ma have beenlinked to the E–W collision between southern Sao Francisco cratonand the cratonic block beneath the Parana basin involving west-ward continental subduction (Campos Neto & Caby 2000). How-ever, geochronological studies indicate a much more complex earlyBrasiliano (ca 790 Ma) collision event in the southern part of theBrasılia belt (Pimentel et al. 1999).
Residual fluids and graphite evolved from this large-scale Pro-terozoic orogeny would be dissipated during the long time intervalsince the event (Wannamaker 2000) or loose the original connectiv-ity by brittle deformations (Mareschal et al. 1994), especially duringthe Cretaceous uplift. However, petrological studies (Ribeiro et al.2001) indicate that the widespread Mesozoic magmatism yieldedlarge amounts of CO2-H2O volatiles, a substantial portion of whichcould have remained trapped as hypersaline fluids or precipitatedas solid carbon at depths of sudden drops in pressure and temper-ature, provided the oxygen fugacity was not too high for graphite.It is envisioned that favourable percolation conditions would havebeen generated by the simultaneous decompression during the up-lift, opening cracks and fractures especially along weak subparallelplanes of relic structures. Thus, a network of graphite and/or fluid-filled cracks and fractures aligned with the tectonic grain couldhave generated the observed mid-crustal conductor, as suggested byShankland et al. (1997).
Lateral differences in the Mesozoic intrusive and extrusive mag-matism at APIP and neighbouring regions would have affected theProterozoic mid-crustal structures in different ways along the MTprofile. In the APIP itself, around the central region of the MTprofile, the magmatism is mainly kimberlitic and lamproitic. Theseare explosive types of magmatism with a relatively rapid journeyfrom the mantle to the surface, which is unlikely to form subsurfacemagma chambers. It is hypothesized that such volcanism wouldnot necessarily rearrange the mid-crustal structures and the relicE–W direction would be preserved. However, to the southwesternand northeastern termini of the profile, quite different situationsare observed. To the southwest, the Palaeozoic sediments of theParana basin were covered during the Early Cretaceous by the SerraGeral formation, enclosing an important event of continental floodbasaltic volcanism (Fig. 2). Locally in the study area, aeromagneticdata show the existence of a prominent system of NW–SE trend-ing linear anomalies crossing the southwestern end of the MT pro-file, which have been interpreted as associated with deep fracturesfilled by basic dykes probably related to the Parana basin volcanism(Bosum 1973; Hasui et al. 1975). The close parallelism betweenthe electric anisotropy and the magnetic lineaments is a strongconstraint for macro-anisotropy in this region, with the disconti-nuities provided by the dykes controlling the electric current flowat mid-crust. To the northeast, the Cretaceous volcanic and sedi-mentary sequences of the Mata da Corda and Areado groups wereaffected by large-scale synvolcanic deep normal faults (Campos &Dardenne 1997). Furthermore, there is evidence, both in the fieldand satellite imagery, for tectonic controls of the extrusives along
C© 2005 RAS, GJI, 162, 357–370
MT survey across the APIP, central Brazil 369
major rift-related NNE–SSW structures (Bizzi et al. 1994, 1995).It is proposed that magma-derived brines and carbon concentratedalong these structures are responsible for the mainly NNE–SSWmid-crustal anisotropy to the north of the Paranaıba river. Moreover,it is speculated that the pervasive magmatism would also extend fur-ther to the southwest of the river, concentrating in the pre-existingfractured hinges and then enhancing the conductance in that region.On the other hand, disappearance of the anisotropic layer beneaththe Sao Francisco craton is only registered by a single station andstill needs to be corroborated by additional data.
The lower crust, at depths larger than 20 km (periods between 20and 53 s), has resistivities in the range 1000–10 000 m throughoutthe profile. The main strike direction (NW–SE or SW–NE) indicatedby the rose diagrams of Fig. 4 is not significant because the MT dataalong the profile are nearly 1-D at long periods (see Figs 3 and 7).These results are valid to depths of at least 80 km, into the uppermostmantle (Bologna 2001). The resistivity values for the lower crustare consistent with laboratory studies on silicic dry rocks at tem-peratures appropriate for the depths involved (Kariya & Shankland1983). For the uppermost mantle, the results agree with laboratorymeasurements of dry olivine under upper-mantle conditions, whichpredict not only a resistive mantle but also a mantle with no signif-icant anisotropy (Constable et al. 1992). Thus, our results suggestthat the deformational effects of the Brasiliano orogeny in the studyarea were more intensely felt within the brittle upper and interme-diate crust because it appears not able to imprint a geoelectricalsignature in the deeper parts of the lithosphere.
6 C O N C L U S I O N S
Analysis and modelling of complex MT data along a NE–SW pro-file that crosses the APIP, an important Cretaceous diamondifer-ous province in central Brazil, demonstrate the potential of the MTmethod to provide tectonic insights in a study area having petro-logical and geochemical information from great depths but poorlyknown in a geophysical sense. Data analysis has indicated a complexsituation with the presence of distinct electrical anomalies, distortedby 3-D induction and galvanic effects as a result of shallow struc-tures, anisotropy at upper- and mid-crustal depths, azimuthal vari-ations of the anisotropy main axis along the profile, and variationsof the electrical strike along distance and with depth. Pre-inversioncorrection techniques were necessary to minimize such distortionsand consequently increase the accuracy of the results from selectedstations within a chosen period interval.
Two anisotropic zones in the crust are tentatively correlated to tec-tonic and magmatic events. A shallower layer in the upper crust isassumed to be derived from electrolytic conduction in a subhorizon-tal zone, possibly associated to a component of the present-day stressregime acting on inherited tectonic grain. For the much more com-plex mid-crustal anisotropic layer, it is proposed a tectonic evolu-tionary model, based on deep crustal subvertical structures possiblyrelated to Proterozoic transpressional deformations along obliquelyconvergent blocks reactivated during distinct Mesozoic magmaticepisodes along the profile. In the central portion, where kimberliticintrusions predominate, E–W structures could have been reactivatedby dilatancy-like enhancement of aligned cracks and fractures un-leashed by decompression effects caused by the concomitant flexu-ral uplift of the Alto Paranaıba. In the northeastern section, the siteof rift related (kamafugitic) magmatism, the NNE–SSW geoelectricdirection is probably related to injection of material into an incipientextensional zone. The agreement in direction and location betweenthe long NW aeromagnetic lineaments and MT anisotropy, in the
southwestern end, indicates a probable influence of Early Cretaceousbasaltic dykes related to the Parana igneous province.
Finally, it must be remembered that MT data models are alwaysnon-unique and modelling becomes particularly complicated by thepresence of many other structures outside the profile. The proposedmodel incorporates and is compatible with all available geophysicaland geological information, but many unanswered questions remainthat will need additional MT array data and other complementarygeophysical studies.
A C K N O W L E D G M E N T S
This study was supported by research grants and fellowships fromFundacao de Ampora a Pesquisa do Estado de Sao Paulo (95/0687-4, 00/00806-5 and 01/02848-0) and Conselho Nacional de Desen-volvimento Cientifico e Technolocgico (142617/97-0, 350683/94-8and 351398/94-5). Relevant logistical support from De Beers Brasilis also acknowledged. The authors are grateful to Sergio Fontes,for loaning the long-period MT systems of Observatorio Nacional,Marcelo Padua, for assistance in fieldwork and data processing,Josef Pek, for providing the anisotropic code, and reviewers Alexan-der Gatzemeier and Heinrich Brasse, for the suggestions and usefulcomments that helped us to improve the manuscript.
R E F E R E N C E S
Almeida, F.F.M., Hasui, Y., Davino, A. & Haralyi, N.L.E., 1980. Informacoesgeofısicas sobre o oeste mineiro e seu significado geotectonico, An. Acad.Bras. Cienc., 52, 49–60.
Almeida, F.F.M., Hasui, Y., Brito Neves, B.B. & Fuck, R.A., 1981. Brazilianstructural provinces: An introduction, Earth Sci. Rev., 17, 1–29.
Amaral, G. et al., 1997. Fission track analysis of apatites from Sao Fran-cisco craton and Mesozoic alcaline-carbonatite complexes from centraland southeastern Brazil, J. S. Am. Earth Sci., 10, 285–294.
Assumpcao, M., Heintz, M., Vauchez, A., Egydio-Silva, M., Barbosa, J.R.& Benevides, T., 2001. Upper mantle anisotropy in SE and Central Brazilfrom SKS splitting. In: 7th Int. Cong. Braz. Geophys. Soc., extended ab-stracts, pp. 1–4, eds Fernandes, G. & Lima, O.L., SBGf, Salvador.
Assumpcao, M. et al., 2002. Reservoir-induced seismicity in Brazil, Pureappl. Geophys., 159, 597–617.
Bahr, K., Bantin, M., Jantos, C., Schneider, E. & Storz, W., 2000. Electricalanisotropy from electromagnetic array data: implications for the conduc-tion mechanism and for distortion at long periods, Phys. Earth planet.Int., 119, 237–257.
Berrocal, J., Marangoni, Y., Sa, N.C., Fuck, R., Soares, J.E.P., Dantas, E.,Perosi, F. & Fernandes, C., 2004. Deep seismic refraction and gravitycrustal model and tectonic deformation in Tocantins Province, CentralBrazil, Tectonophysics, 388, 187–199.
Bizzi, L.A., 2001. Diamond exploration: fundamentals and opportunities inSouth America, Rev. Bras. Geoc., 31, 631–634.
Bizzi, L.A., Smith, C.B., de Wit, M.J., Armstrong, R.A. & Meyer, H.O.A.,1994. Mesozoic kimberlites and related alkalic rocks in southwesternSao Francisco Craton, Brazil: a case for local mantle reservoirs and theirinteraction. In: Proc. 5th Int. Kimberlite Conf., pp. 156–171, eds Meyer,H.O.A. & Leonardos, O.H., CPRM, Brazil.
Bizzi, L.A., de Wit, M.J., Smith, C.B., McDonald, I. & Armstrong, R.A.,1995. Heterogeneous enriched mantle materials and Dupal-type magma-tism along the SW margin of the Sao Francisco Craton, Brazil, J. Geodyn.,20, 469–491.
Bologna, M.S., 2001. Investigacao magnetotelurica da litosfera na provınciaıgnea do Alto Paranaıba, PhD thesis, INPE, Sao Jose dos Campos.
Bosum, W., 1973. O levantamento aeromagnetico de Minas Gerais e EspiritoSanto e sua sequencia quanto a estrutura geologica, Rev. Bras. Geoc., 3,149–159.
Campos, J.E.G. & Dardenne, M.A., 1997. Origem e evolucao tectonica daBacia Sanfranciscana, Rev. Bras. Geoc., 27, 283–294.
C© 2005 RAS, GJI, 162, 357–370
370 M. S. Bologna, A. L. Padilha and I. Vitorello
Campos Neto, M.C., 1984. Litoestratigrafia, relacoes estratigraficas eevolucao paleogeografica dos grupos Canastra e Paranoa (regiao deVazante-Lagamar, MG), Rev. Bras. Geoc., 14, 81–91.
Campos Neto, M.C., 2000. Orogenic systems from southwestern Gondwana:An approach to Brasiliano-Pan African cycle and orogenic collage insoutheastern Brazil, in Tectonic Evolution of South America, pp. 335–365, eds Cordani, U.G. et al., DNPM, Rio de Janeiro.
Campos Neto, M.C. & Caby, R., 2000. Terrane accretion and upward extru-sion of high-pressure granulites in the Neoproterozoic nappes of SoutheastBrazil: petrologic and structural constraints, Tectonics, 19, 669–687.
Constable, S.C., Shankland, T.J. & Duba, A., 1992. The electrical conduc-tivity of an isotropic olivine mantle, J. geophys. Res., 97, 3397–3404.
Egbert, G.D. & Booker, J.R., 1986. Robust estimation of geomagnetic trans-fer functions, Geophys. J. R. astr. Soc., 87, 173–194.
Eisel, M. & Haak, V., 1999. Macro-anisotropy of the electrical conductivityof the crust: a magnetotelluric study of the German Continental DeepDrilling site (KTB), Geophys. J. Int., 136, 109–122.
ELEKTB group, 1997. KTB and the electrical conductivity of the crust, J.geophys. Res., 102, 18289–18305.
Feng, M., Assumpcao, M. & Van der Lee, S., 2004. Group-velocity tomogra-phy and lithospheric S-velocity structure of the South American continent,Phys. Earth planet. Int., 147, 315–331.
Fuck, R.A., Jardim de Sa, E.F., Pimentel, M.M., Dardenne, M.A. & Soares,A.C.P., 1994. As faixas de dobramentos marginais do Craton do Sao Fran-cisco: sıntese dos conhecimentos, in O Craton do Sao Francisco, pp. 161–185, eds Dominguez, J.M.L. & Misi, A., SBG-SGM-CNPq, Salvador.
Gibson, S.A., Thompson, R.N., Leonardos, O.H., Dickin, A.P. & Mitchell,J.G., 1995. The Late Cretaceous impact of the Trindade mantle plume—Evidence from large-volume, mafic, potassic magmatism in SE Brazil, J.Petrol., 36, 189–229.
Gough, D.I., 1986. Seismic reflectors, conductivity, water and stress in thecontinental crust, Nature, 323, 143–144.
Groom, R.W. & Bailey, R.C., 1989. Decomposition of magnetotelluricimpedance tensors in the presence of local three-dimensional galvanicdistortion, J. geophys. Res., 94, 1913–1925.
Hasui, Y. & Haralyi, N.L.E., 1991. Aspectos litoestratigraficos e geofısicosdo soerguimento do Alto Paranaıba, Geociencias, 10, 57–77.
Hasui, Y., Sadowski, G.R., Suguio, K. & Fuck, G.F., 1975. The Phanerozoictectonic evolution of the western Minas Gerais state, An. Acad. Bras.Cienc., 47, 431–438.
Heise, W. & Pous, J., 2001. Effects of anisotropy on the two-dimensionalinversion procedure, Geophys. J. Int., 147, 610–621.
James, D.E. & Assumpcao, M., 1996. Tectonic implications of S-waveanisotropy beneath SE Brazil, Geophys. J. Int., 126, 1–10.
Jones, A.G., 1987. MT and reflection: an essential combination, Geophys.J.R. astr. Soc., 89, 7–18.
Jones, A.G., 1992. Electrical conductivity of the continental lower crust, inContinental Lower Crust, pp. 81–143, eds Fountain, D.M., Arculus, R.J.& Kay, R.W., Elsevier, Amsterdam.
Karato, S., 1990. The role of hydrogen in the electrical conductivity of theupper mantle, Nature, 347, 272–273.
Kariya, K.A. & Shankland, T.J., 1983. Electrical conductivity of dry lowercrustal rocks, Geophysics, 48, 52–61.
Kellett, R.L., Mareschal, M. & Kurtz, R.D., 1992. A model of lower crustalelectrical anisotropy for the Pontiac Subprovince of the Canadian Shield,Geophys. J. Int., 111, 141–150.
Ledo, J., Queralt, P., Marti, A., Jones & A.G., 2002. Two-dimensional inter-pretation of three-dimensional data: an example of limitations and reso-lution, Geophys. J. Int., 150, 127–139.
Mareschal, M., Kurtz, R.D. & Bailey, R.C., 1994. A review of electromag-netic investigations in the Kapuskasing Uplift and surrounding regions—Electrical properties of key rocks, Can. J. Earth Sci., 31, 1042–1051.
Marquis, G., Jones, A.G. & Hyndman, R.D., 1995. Coincident conductiveand reflective middle and lower crust in southern British Columbia, Geo-phys. J. Int., 120, 111–131.
Padilha, A.L., 1995. Distortions in magnetotelluric fields possibly due toULF activity at the South Atlantic magnetic anomaly region, J. Geomag.Geoelectr., 47, 1311–1323.
Padilha, A.L., Trivedi, N.B., Da Costa, J.M., Vitorello, I., Dupis, A. & Cavoit,C., 1989. Audiomagnetotelluric study in northeast region of Parana Basin,South America, Geophysics, 54, 824–831.
Padilha, A.L., Trivedi, N.B., Vitorello, I. & Da Costa, J.M., 1992. Uppercrustal structure of the Northeast Parana Basin, Brazil, determined fromintegrated magnetotelluric and gravity measurements, J. geophys. Res.,97, 3351–3365.
Pek, J. & Verner T., 1997. Finite-difference modelling of magnetotelluricfields in twodimensional anisotropic media, Geophys. J. Int., 128, 505–521.
Pimentel, M.M., Fuck, R.A. & Botelho, N.F., 1999. Granites and the geody-namic history of the neoproterozoic Brasılia Belt, Central Brasil: a review,Lithos, 46, 463–483.
Pimentel, M.M., Fuck, R.A., Jost, H., Ferreira Filho, C.F. & Araujo, S.M.,2000. The basement of the Brasılia fold belt and the Goias magmatic arc,in Tectonic Evolution of South America, pp. 195–229, eds Cordani, U.G.et al., DNPM, Rio de Janeiro.
Pimentel, M.M., Dardenne, M.A., Fuck, R.A., Viana, M.G., Junges, S.L.,Fischel, D.P., Seer, H.J. & Dantas, E.L., 2001. Nd isotopes and the prove-nance of detrital sediments of the Neoproterozoic Brasılia Belt, centralBrazil, J. S. Am. Earth Sci., 14, 571–585.
Ribeiro, C.C., Brod, J.A., Petrinovic, I.A., Gaspar, J.C. & Brod, T.C.J., 2001.Pipes de brecha e atividade magmatica explosiva no complexo alcalino-carbonatıtico de Catalao I, Goias, Rev. Bras. Geoc., 31, 414–426.
Sa, N.C., Ussami, N. & Molina, E.C., 1993. Gravity map of Brazil I. Repre-sentation of free-air and Bouguer anomalies, J. geophys. Res., 98, 2187–2197.
Schobbenhaus, C., Campos, D.A., Derze, G.R. & Asmus, H.E., 1984. Mapageologico do Brasil e da area oceanica adjacente incluindo depositosminerais, escala 1:2.500.000, DNPM, Brasılia.
Seer, H.J. & Dardenne, M.A., 2000. Tectonostratigraphic terrane analysis onNeoproterozoic times: the case study of the Araxa Synform, Minas Gerais,Brazil: implications to the final collage of the Gondwanaland, Rev. Bras.Geoc., 30, 78–81.
Sgarbi, P.B.A., Clayton, R.N., Mayeda, T.K. & Gaspar, J.C., 1998. Oxygenisotope thermometry of Brazilian potassic volcanic rocks of kamafugiticaffinities, Chem. Geol., 146, 115–126.
Shankland, T.J., Duba, A.G., Mathez, E.A. & Peach, C.L., 1997. Increase ofelectrical conductivity with pressure as an indicator of conduction througha solid phase in midcrustal rocks, J. geophys. Res., 102, 14 741–14 750.
Simpson, F., 1999. Stress and seismicity in the lower continental crust: Achallenge to simple ductility and implications for electrical conductivitymechanisms, Surv. Geophys., 20, 201–227.
Siripunvaraporn, W. & Egbert, G.D., 2000. An efficient data-subspace in-version method for 2-D magnetotelluric data, Geophysics, 65, 791–803.
Smith, J.T. & Booker, J.R., 1991. Rapid inversion of 2D magnetotelluricdata, J. geophys. Res., 96, 3905–3922.
Strieder, A.J. & Nilson, A.A., 1992. Melange ofiolıtica nos metassedimentosAraxa de Abadiania (GO) e implicacoes tectonicas regionais, Rev. Bras.Geoc., 22, 204–215.
Teixeira, W., Akimoto, H., Siga Junior, O. & Sato, K., 1989. A evolucaogeocronologica dos terrenos granıtico-gnaissico-migmatıticos ao sul daFaixa Canastra, sudoeste de Minas Gerais. In: Proc. 5th Simp. Geol. Nuc.Minas Gerais, pp. 243–247, ed Lobato, M.L., SBG, Belo Horizonte.
Thompson, R.N., Gibson, S.A., Mitchell, J.G., Dickin, A.P., Leonardos, O.K.,Brod, J.A. & Greenwood, J.C., 1998. Migrating Cretaceous-Eocene mag-matism in the Serra do Mar alkaline province, SE Brazil: Melts from thedeflected Trindade mantle plume?, J. Petrol., 39, 1493–1526.
Ulbrich, H.H.G.J. & Gomes, C.B., 1981. Alkaline rocks from continentalBrazil, Earth Sci. Rev., 17, 135–154.
Ussami, N., 1999. Estruturacao e limites da placa Sanfranciscana: Con-tribuicao gravimetrica, Livre Docencia Thesis, Universidade de Sao Paulo,Sao Paulo.
Vitorello, I., Hamza, V.M. & Pollack, H.N., 1980. Terrestrial heat flow inBrazilian highlands., J. geophys. Res., 85, 3778–3788.
Wannamaker, P.E., 2000. Comment on ‘The petrologic case for a dry lowercrust’ by B.W.D. Yardley and J.W. Valley, J. geophys. Res., 105, 6057–6064.
C© 2005 RAS, GJI, 162, 357–370