ferguson et al
TRANSCRIPT
1 IntroductionThe Barnett formula is the official basis upon which increments to public funds areallocated to the countries of the UKöNorthern Ireland, Scotland, and Walesöforthose parts of the budget that are administered locally. In the past, actual allocationshave differed markedly from the Barnett benchmarks. However, recent moves towardsdevolution, and the way that Barnett features in the funding of devolved expenditures,have significantly increased the level of interest in the formula. There is considerablecontroversy surrounding the implications for the relevant regions of the UK.
The existing literature improves our understanding of the Barnett formula butis extremely circumscribed. It focuses primarily on the equity of the spatial changesto government per capita expenditure that would accompany the strict imposition ofthe formula under various scenarios. The system-wide economic consequences of itsstrict imposition have been neglected, despite the fact that the Barnett formula drivesthe regional distribution of an important element of aggregate demand. In the presentpaper we attempt to fill this gap and in particular to focus on the effects of populationendogeneity, especially in the presence of the regular updating of the population weightsthat was introduced in 1997. We use a multisectoral regional computable generalequilibrium model to quantify the relative, real resource Barnett squeeze on the Scottisheconomy.
The impact of the Barnett formula on the Scottish economy:endogenous population and variable formula proportions
Linda Ferguson, David LearmonthFraser of Allander Institute, Department of Economics, University of Strathclyde, GlasgowG4 0GE, Scotland
Peter G McGregor} }Department of Economics, University of Strathclyde, Glasgow G4 0GE, Scotland;e-mail: [email protected]
J Kim Swales}Fraser of Allander Institute, Department of Economics, University of Strathclyde, GlasgowG4 0GE, Scotland
Karen TurnerDepartment of Economics, University of Strathclyde, Glasgow G4 0GE, ScotlandReceived 1 July 2005; in revised form 1 March 2006; published online 20 July 2007
Environment and Planning A 2007, volume 39, pages 3008 ^ 3027
Abstract. The Barnett formula is the official basis upon which increments to public funds are allocatedto the devolved regions of the UK for those parts of the budget that are administered locally. There isconsiderable controversy surrounding the implications of its strict application for the relevant regions.The existing literature focuses primarily on the equity of the spatial changes to government per capitaexpenditure that would accompany such a change. In contrast, in this paper we attempt to quantifythe system-wide economic consequencesöthe real, relative resource squeeze that accompanies thefinancial relative squeezeöon one devolved region, Scotland. The analysis uses a multisectoral regionalcomputable general equilibrium modelling approach. We highlight the importance of populationendogeneity, particularly since the population proportions used in the formula are now regularlyupdated.
DOI:10.1068/a38254
}Corresponding author.}Also at Centre for Public Policy for Regions, Universities of Glasgow and Strathclyde.
Section 2 presents an account of how the Barnett formula allocates the devolvedbudgets and the way in which the operation of the formula has changed over time.In section 3 we define the notion of a Barnett equilibrium as a distribution of publicexpenditure which, if reached, would be subsequently replicated through the action ofthe formula. In section 4 we outline the Scottish computable general equilibriummodel, AMOS, which is used to simulate Barnett equilibria under various assumptionsconcerning the specific administration of the formula and the flexibility of the regionaleconomy. In section 5 we report and explain the simulation results, which allow us toidentify the macroeconomic consequences for the Scottish economy of Barnett beingadhered to until per capita government expenditure is equalised with that of England.Section 6 is a short conclusion.
2 Devolved budgets under BarnettFor our purposes, it is sufficient to know that any increase (or decrease) to theassigned budgets of the devolved authorities should be determined by the Barnettformula. The assigned budget covers spending under headings such as health, socialwork, and education in the devolved authorities.(1) In 1999, the base year in thisstudy, 77% of the government final demand identified in the Scottish input ^ outputaccounts is funded from the assigned budget. The remainder consists of finaldemands attributable to programmes reserved to the UK government or financedby local authority expenditures.
The Barnett formula allocates a population-based share of any change in compar-able English DEL expenditure to the devolved authorities of the UK: it does notoperate on the base. The formula implies that marginal changes in expenditurescovered by the assigned budget in Scotland are determined by the difference equation:
DGS t � atDGE t , (1)
where G is the nominal level of expenditures covered by the assigned budget, thesubscripts E, S, and t stand for England, Scotland, and time period, respectively, D isthe first difference operator, and a is a parameter based upon the ratio of Scottish toEnglish population. However, the population weights used in the formulaöthat is, thepopulation numbers that determine the value of the parameter at in equation (1)öhavechanged over time.
The Barnett formula was used for the first time in 1978 in Scotland and two yearslater for Northern Ireland and Wales, and has been in continuous use ever since.(2) Thepopulation proportions used at the time of the formula's initial implementation wereestimates for 1976. Under the Barnett formula Scotland then received 10/85ths of anyincrease or decrease in comparable English programmes (HM Treasury, 2004).
, ,
(1) The assigned budget covers most of the activities of the devolved administrations, and is the partof departmental expenditure limit (DEL) that is formula driven. Neither the balance of DEL norannually managed expenditure, the other components of the total funding available to the devolvedadministrations, are formula driven. More detail on the different public spending aggregates thatapply to the devolved authorities is given in H M Treasury (2004) and Ferguson et al (2003).(2) The formula was named after the then Chief Secretary of the Treasury, Joel Barnett.The formulaic approach to allocating public expenditure between the countries of the UK goesback to Chancellor Goschen in 1888 (eg Heald and McLeod, 2002a, especially paragraph 535).He introduced a formula to allocate probate duties between countries in support of local govern-ment expenditure, based on each country's overall proportionate contribution to the Exchequer.This formula was also used as a basis for allocating some elements of public expenditure (forexample, education grants).
The impact of the Barnett formula on the Scottish economy 3009
There have been a number of subsequent changes to the Barnett allocationmechanism. First, up until 1985 the formula was applied in real terms with figuresrolling forward from one year to another with an in-built allowance for inflation.However, since 1985 expenditure changes have been allocated in nominal terms only(HM Treasury, 2004). Second, in 1992, Michael Portillo, as Chief Secretary to theTreasury, revised the formula to reflect the population figures given in the 1991 Census,thereby reducing the value of at in equation (1) from 11.76% to 10.66% (McCrone,1999). Finally in 1997 a rather more fundamental modification was introduced. ChiefSecretary to the Treasury, Alastair Darling, committed the government to regularrevision of the Barnett population weights at each Spending Review, based on thelatest population estimates for England, Scotland, and Wales, published by NationalStatistics (HM Treasury, 1997). This adjustment, which we henceforth refer to as the`Darling amendment', was to take effect from 1999.(3)
A factor central to the debate concerning the operation of the Barnett formula inScotland is that at present Scotland's per capita identifiable expenditure is higher thanthe corresponding English figure (by 18% in 1999 ^ 2000, though this rises to 25%if social security is excluded) (Heald and McLeod, 2002b, table 10.2). Under strictadherence to the Barnett formula, the marginal allocation of the assigned budgetto Scotland is lower than its average allocation. Much of the Scottish literaturesurrounding the operation of the Barnett formula therefore focuses on the fact thatwith increasing nominal public expenditure in England, the proportionate publicexpenditure advantage at present enjoyed by Scots will decline. This is the so-calledBarnett squeeze (see, for example, Bell et al, 1996; Cuthbert, 2001; Edmonds, 2001;Heald, 1996; Heald and McLeod, 2002b; Kay, 1998; McCrone, 1999; McLean andMcMillan, 2003; Midwinter, 2000; 2002; Twigger, 1998).
It is important to say that, during much of the period since 1979, bypass andadjustment of non-formula-driven expenditures have meant that actual expendituresin Scotland appear to have differed, to Scotland's advantage, from the level implied bythe strict application of the Barnett formula (Midwinter, 2002). However, the formulahas been accepted as the basis for determining the assigned budget of the Scottishparliament (and the budgets of other devolved territories), which together with the greatertransparency produced by devolution, has led to a belief that the Barnett formula will playa more central role in the actual allocation in the future (Goudie, 2002).
3 Barnett equilibriaIn this paper we focus on the impact of the operation of the Barnett formula on a singledevolved territory. We take the case of Scotland, but in principle the analysis can bereplicated for any other region. Existing work on the Barnett formula attempts to revealthe evolution of Scottish per capita expenditure (covered by the assigned budget) undera strict Barnett regime and alternative scenarios concerning the exogenous growthin nominal comparable English expenditures and exogenous population changes. It isorganised around the following relationship:
GS t
PS t
,GE t
PE t
� B� �GS 0 ;�GE 0 ; _ ; �GE t
�PE 0 ; _ ; �PE t ;�PS 0 ; _ ; �PS t � , (2)
where P is population and the other terms are as defined above for equation (1).
,
,
,
,, , , , , , ,
(3) The population proportions used in the 1998 Comprehensive Spending Review related to 1996 mid-year population estimates. These reported Scotland's population as 10.45% of the English value. For the2004 review the 2003 mid-year population estimate was used (10.20% of the English value) (HMTreasury, 2004, page 10). While the original intention was to update population estimates annually(HMTreasury, 2004, annexe A, page 38), they are now updated biennially in line with spending reviews.
3010 L Ferguson, D Learmonth, P G McGregor, J K Swales, K Turner
This extant analysis has two main weaknesses. First, it is restrictive in that it simplycharts the public finance implications of the operation of the Barnett allocationformula. We wish to focus on the impact of such changes on the real economy: thatis, to identify the real, relative macroeconomic squeeze that matches the relativefinancial squeeze. Second, existing work is also conceptually flawed if the changes indevolved public expenditure have direct demographic implications. We would expectthat adjustments in aggregate economic activity brought about by changes in govern-ment expenditure would influence migration flows, so that the spatial distribution ofpopulation becomes endogenous. We incorporate this endogeneity in our analysis.
In this paper we model the system-wide impacts on economic activity and popula-tion of the change in devolved government expenditure that would result if the Barnetformula were to be rigorously applied until relevant per capita expenditures in Scotlandare equalised with those in England. We limit our investigation to the impact on asingle region. Further, we adopt the small-region assumption, so that changes in theregion's activity, fiscal arrangements, and population do not have impacts on the restof the nation large enough for there to be perceptible feedback to the region itself.
We do not track the period by period changes in economic activity. Our mainpurpose is to explore the scale of the impacts on Scotland if per capita funding wereto be equalised with England and to identify the factors magnifying or reducing theseeffects. We therefore focus on the economic implications of achieving Barnett equi-libria. We designate a Barnet equilibrium to be a spatial allocation of devolvedexpenditure (covered by the assigned budget) which, once reached, would be repli-cated by the subsequent operation of the Barnett formula. The impacts of reachinga Barnett equilibrium are identified under a range of assumptions concerning thenature of the regional economy and the detailed operation of the Barnett allocationmechanism.(4)
Where the Barnett population weights, taken at time period 0, are fixed, then theBarnett equilibrium is very straightforward to determine. In the two-region case,in time period t the Barnett equilibrium ratio of relevant government expenditure inthe two regions, BF, where the F superscript stands for fixed population weights, isgiven as:(5)
BF � GS t
GE t
��PS 0
�PE 0
. (3)
Our concern is to quantify the impact of the adjustment in government expendi-ture required to achieve the Barnett equilibrium on the level and composition ofeconomic activity in Scotland. In order to isolate this impact, we keep all otherexogenous Scottish and rest of the UK (RUK) variables fixed. Essentially we imposethe ceteris paribus assumption. As noted above, we are also operating with a stand-alone regional model that ignores interregional feedback effects. These combined
,
,
,
,
(4) Barnett equilibria cannot be justified in terms of any public economic theory that we are awareof: there is no fundamental theoretical rationale for an equilibrium in which there is equality ofper capita government expenditures across regions. However, this does not, of course, imply thatthe equilibria are uninteresting, since the stated basis of the funding of the devolved territoriesimplies that the system moves towards such equilibria. It is of interest to explore what would happenif Barnett were strictly implemented.(5)Further, this equilibrium is stable in the sense that in periods of increasing nominal governmentexpenditure, the operation of the Barnett formula will drive the distribution towards the Barnettequilibrium, independently of the initial distribution. That is to say:
GS t
GE t
! BF, as GE t! 1 .,
,,
The impact of the Barnett formula on the Scottish economy 3011
exogeneity assumptions mean that the analysis simply concentrates on the impact ofchange in public expenditure in Scotland in a straightforward comparative staticmanner. In this case the Barnett equilibrium nominal government expenditure isgiven by:
GS ��PS 0
�PE 0
!�GE . (4)
Whilst the exogeneity assumptions imposed in equation (4) appropriately focus thesimulations, can they be justified? In particular, we know that nominal governmentexpenditure in England (and also Scotland) must rise for a Barnett equilibrium to bereached with existing population weights.Will these increases not automatically violatethe ceteris paribus assumptions that we have imposed?
The approach we adopt can be motivated in two ways. First, equation (4) could bethought of as resulting from purely nominal changes in the UK economy, with nochanges in real exogenous variables aside from Scottish public expenditure. As longas the two economies are homogeneous of degree zero in prices, so that real variablesare unaffected by equiproportionate changes in all prices, this interpretation is valid. Asecond justification for equation (4) is that it shows the proportionate deviations fromthe counterfactual that would occur in the Scottish economy if the Barnett equilibriumwere imposed in a UK economy experiencing linear expansion, that is, an economy withall real exogenous variables (both Scottish and RUK) increasing at the same rate. In thiscase, provided that the economies are linear homogeneous in the real exogenous variables,so that changes in exogenous variables generate equiproportionate adjustments in realvariables, this is a reasonable interpretation.
Up to now we have been considering the application of the Barnett formula withfixed population weights. However, as explained in the previous section, under the 1997Darling amendment, the population weights used to calculate marginal nominalchanges in assigned budgets are, if required, updated to reflect any changes in thepopulation levels. Under this formulation a necessary condition for the economy tobe in a Barnett equilibrium in time period t would be that:
BV � GS t
GE t
� PS t
PE t
, (5)
where BV represents the Barnett equilibrium ratio with variable population weights(that is, with the full updating of those weights). Equation (5) indicates that, in thiscase, Barnett equilibrium implies that covered nominal public expenditure per headwill be equalised among devolved territories.(6)
In the single-region analysis, with again all exogenous variablesöincluding Englishnominal government expenditure, prices, and populationöheld constant, equation (5)implies:
GS � bPS , (6)
where b � GE
�PE . Equation (6) captures the equilibrium operation of the Barnett
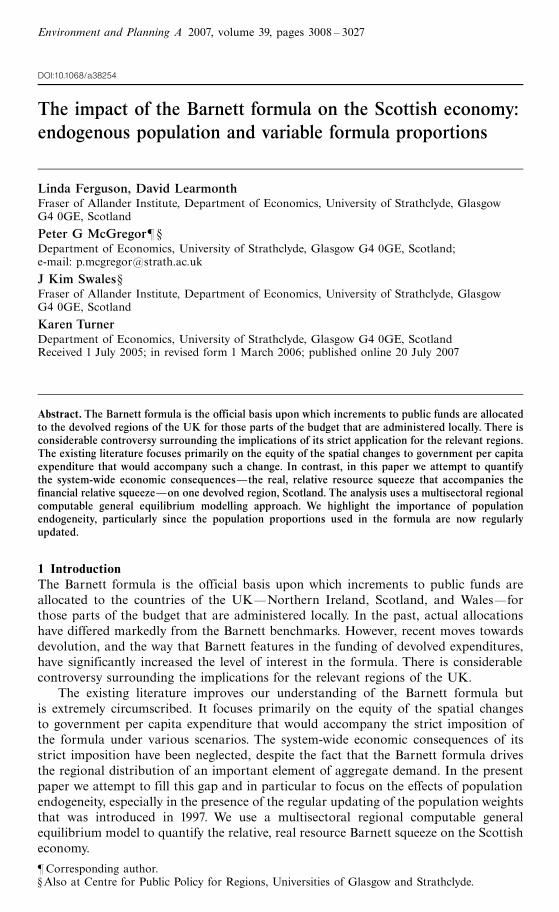
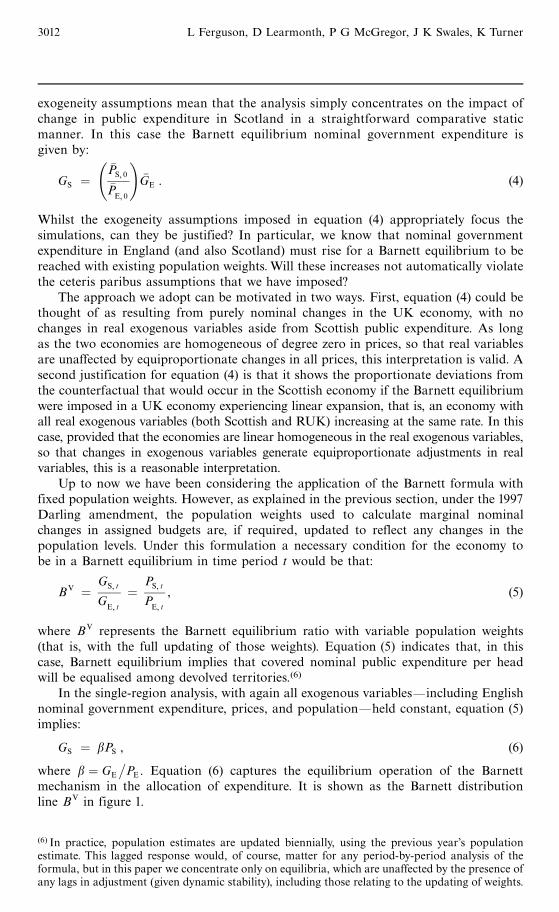
mechanism in the allocation of expenditure. It is shown as the Barnett distributionline BV in figure 1.
,
,
,
,
,
,
(6) In practice, population estimates are updated biennially, using the previous year's populationestimate. This lagged response would, of course, matter for any period-by-period analysis of theformula, but in this paper we concentrate only on equilibria, which are unaffected by the presence ofany lags in adjustment (given dynamic stability), including those relating to the updating of weights.
3012 L Ferguson, D Learmonth, P G McGregor, J K Swales, K Turner
But with population endogenous, there will be a second relationship betweenScottish population and covered nominal expenditure that operates through therequirement for zero net migration in Barnett equilibrium. That is to say, for any givenScottish nominal expenditure, there will be a corresponding equilibrium populationlevel consistent with the need to generate no desire for either net out-migration orin-migration. This can be expressed as:
PS � PS �GS � , (7)
with, again, all other exogenous variables held constant. Expression (7) identifiesthe equilibrium Scottish population level supported by a given level of nominalassigned budget with English activity, prices, and population fixed and with otherelements of Scottish final demand constant at their initial values. The specific char-acter of the relationship expressed by equation (7) will depend upon the nature of thelocal economy and this is discussed in more detail in sections 4 and 5. However, weexpect PS �0�, dPS=dGS > 0. Equation (7) is represented as the equilibrium populationline, Z, in figure 1. Simultaneously meeting the conditions represented by equations (6)and (7) generates the variable-weight Barnett equilibrium population and nominal govern-ment expenditures. This is shown in figure 1 as the intersection, E, between the lines BV
and Z.In considering the stability of the variable-weight Barnett equilibrium, figure 1
suggests that, if there are one or more equilibria, then at least one will be stable interms of the equilibrium relationships identified here. The Barnett distribution curve,BV, must cut the equilibrium population curve Z from below. If the initial governmentallocation is above GV�
S , then the equilibrium population (read from line Z ) is belowthat required to justify that level of expenditure (as indicated by BV ). Expenditure falls,but then the subsequent population adjustment is insufficient to maintain that nominalgovernment expenditure, until point E is reached. Similarly, if the initial populationis above P �S , subsequent changes in the allocation of nominal expenditures are notlarge enough to maintain this population. The variable weight Barnett equilibrium istherefore stable, subject to exogenous shocks. Section 4 next outlines the economicfeatures of the computable general equilibrium (CGE) model we employ, in section 5,to simulate the impact of Barnett equilibria.
Population
P �S
BV
Z
E
GV�S
Goverment expenditure
Figure 1. The equilibrium population and government expenditure (departmental expenditurelimit) with Barnett equilibrium (variable weights)
The impact of the Barnett formula on the Scottish economy 3013
4 The AMOS simulation modelAMOS is a CGE modelling framework that is parameterised on data from a UKregion, Scotland.(7) A very brief description is presented in this section: more detailis available in the appendix and a full listing of an earlier vintage of the AMOS modelis provided in Harrigan et al (1991). The current version of AMOS has three transactorgroups, namely households, corporations, and government;(8) twenty-five commoditiesand activities; and two exogenous external transactor groups, the rest of the UK andthe rest of the World (RUK and ROW). Throughout this paper commodity markets aretaken to be competitive. We do not explicitly model financial flows, our assumptionbeing that Scotland is a price taker in competitive UK financial markets and, underthe small open economy assumption, the interest-rate-setting decisions of the Bank ofEngland's Monetary Policy Committee are taken to be exogenous to Scotland.
Production is determined through cost minimisation with multilevel productionfunctions. These are generally of a constant elasticity of substitution (CES) form butwith Leontief and Cobb ^Douglas available as special cases. For simplicity, in thispaper all domestic intermediate transactions are Leontief. Otherwise we assume CEStechnology (notably for the production of value added from capital and labour services)with `best guess' elasticities of substitution of 0.3 (Harris, 1989).
There are four major components of final demand: consumption, investment,exports, and government expenditure. Of these, consumption varies proportionatelywith real disposable income. Exports (and imports) are generally determined via anArmington link (Armington, 1969) and are therefore relative-price sensitive with tradesubstitution elasticities of 2.0 (Gibson, 1990). Nominal government expenditure inScotland is taken to be exogenous and the policy shocks involve changes to thisvariable. Of course, when we have full updating of the Barnett formula there is adegree of endogeneity in that we link relevant government nominal expenditure tothe population level. Investment is initially set equal to depreciation although, asexplained later in this section, in the short run, capital stock is endogenous.
In section 5 we report the results of simulations under varying degrees of flexibilityfor the Scottish economy. The labour market is a potentially important source ofinflexibility. In all the simulations reported in this paper we impose a unified locallabour market characterised by perfect sectoral mobility. However, we simulate undertwo separate bargaining functions: regional bargaining and national bargaining. Underregional bargaining the regional real consumption wage is directly related to workers'bargaining power, and therefore inversely related to the regional unemployment rate(Minford et al, 1994). Even in a regional context, there is now widespread empiricalsupport for this `wage curve' formulation (Blanchflower and Oswald, 1994). Herewe take the parameters for the regional bargaining function from the economic workreported by Layard et al (1991):
wS t � aÿ 0:068uS t � 0:40wS tÿ1 , (8)
where wS and uS are the natural logarithms of the Scottish real consumption wage and
, , ,
(7) AMOS is an acronym for A Macro ^micro model of Scotland. For a general review of CGEmodelling see Greenaway et al (1993) and for an appraisal of regional CGE models consultPartridge and Rickman (1998).(8) At present, AMOS treats Scotland as a self-governing economy, in the sense that there is onlyone consolidated government sector. Central government activity is partitioned to Scotland andcombined with local government activity. This is adequate for the present paper, but a moresophisticated treatment of the public sector is part of the work plan under the ESRC Devolutionproject.
3014 L Ferguson, D Learmonth, P G McGregor, J K Swales, K Turner
the unemployment rate, respectively, t is the time subscript and a is a calibratedparameter.(9)
Under national wage bargaining, a small open region faces a nationally determinedwage. Essentially this implies that the regional labour market is characterised by anexogenously determined fixed nominal wage rate. This characterisation of the labourmarket explicitly or implicitly characterises much UK theoretical and empirical regionalanalysis (Arup Economics and Planning, 2000; Harris, 1991; Holden and Swales, 1995;Roper and O'Shea, 1991).
A second key characteristic that determines the degrees of flexibility exhibited bythe regional economy concerns population. Population is assumed to be either fixed orto be fully adjusted to the relevant changes in economic circumstances. Where popula-tion adjustment is allowed, it is driven by a relationship linking Scottish net migrationpositively (negatively) to the real wage (unemployment rate) differential with the rest ofthe UK. This variant of the Harris and Todaro (1970) approach is commonly employedin studies of US migration (eg Greenwood et al, 1991; Treyz et al, 1993). It is param-eterised here from the econometrically estimated model reported in Layard et al(1991):
m � bÿ 0:08�uS ÿ ur � � 0:06�wS ÿ wr � , (9)
where m is the net in-migration rate (as a proportion of the indigenous population);wr and ur are the natural logarithms of the RUK real consumption wage andunemployment rates; and b is a calibrated parameter.(10)
The Scottish population is initially assumed to be in equilibrium. After an exoge-nous shock, full population adjustment implies a change in the population, with theattendant implications for the unemployment rate and the real wage rate, to the pointwhere net migration falls to zero. Therefore setting m � 0 in equation (9) generates thefollowing zero-net-migration relationship between the wage and unemployment rate:
wS � wr � 1:33�uS ÿ ur � ÿb
0:06. (10)
A third source of regional flexibility concerns adjustments to the capital stock.Again we assume that in the base period the capital stock is optimally adjusted. Undersome simulations, the aggregate capital stock, and its sectoral composition, are heldfixed at the base-year values. In others, full capital adjustment is imposed, whichimplies that in each sector the actual and desired capital stock are reequated, so thatthe capital rental rate equals the risk-adjusted user cost of capital.
If we simultaneously impose the regional bargaining option in the labour marketand the migration function specified in equation (9), we have a CGE variant ofthe Layard, Nickell, and Jackman regional model (Layard et al, 1991). This is ourpreferred model set up because there exists considerable supporting evidence for it.With the model parameterised in this way, equations (8) and (10) together determinethe real wage and unemployment rate. This implies that, with unchanged valuesfor the RUK real wage and unemployment rate, population equilibrium will reinstatethe Scottish initial real wage and unemployment rate subsequent to any exogenous
(9) The calibration is made so that the model, together with the set of exogenous variables, willrecreate the base-year dataset. This calibrated parameter does not influence simulation outputs, butthe assumption of initial equilibrium is, of course, important.(10) Again, the calibrated parameter is to ensure population equilibrium (zero net migration) in thebase year.
The impact of the Barnett formula on the Scottish economy 3015
demand or supply shock apart from one to the bargaining or migration functionsthemselves (McGregor et al, 1995).
With both regional and national bargaining, imposing full capital and populationadjustments in the face of a demand disturbance produces no change in prices, the realwage, or the unemployment rate. The economy acts as a population-endogenousinput ^ output system (McGregor et al, 1996). Therefore, the equilibrium populationrelationshipöidentified in the previous section and illustrated in figure 1öbetweennominal government expenditure and the population level is in this case linear.
5 Simulating Barnett equilibriaIn the simulations reported in this paper, we are particularly interested in theneglected issues of population endogeneity, especially given the Darling amendmentrequiring the full updating of the population weights. To quantify these effects, wecarry out alternative simulations with no population change and with full populationchange, and with no and full updating of the population weights. However, we arealso concerned with the quantitative impact of regional labour-market and capital-market flexibility. We therefore undertake alternative simulations with regional andnational wage bargaining, and with no and full capital adjustment. This means thatthere are four economic and policy characteristics that vary between simulations.For each of these characteristics two options are allowed, so that we have a possiblesixteen (24) sets of simulation results.(11)
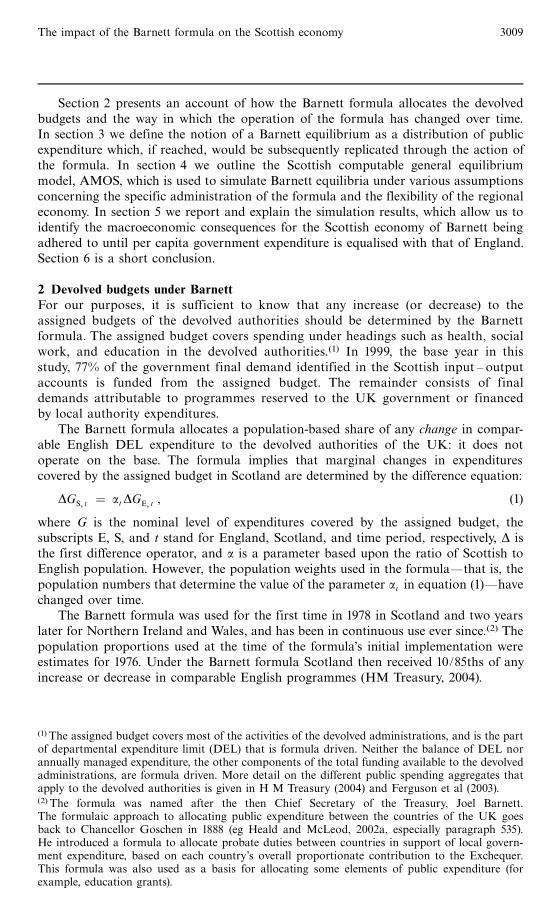
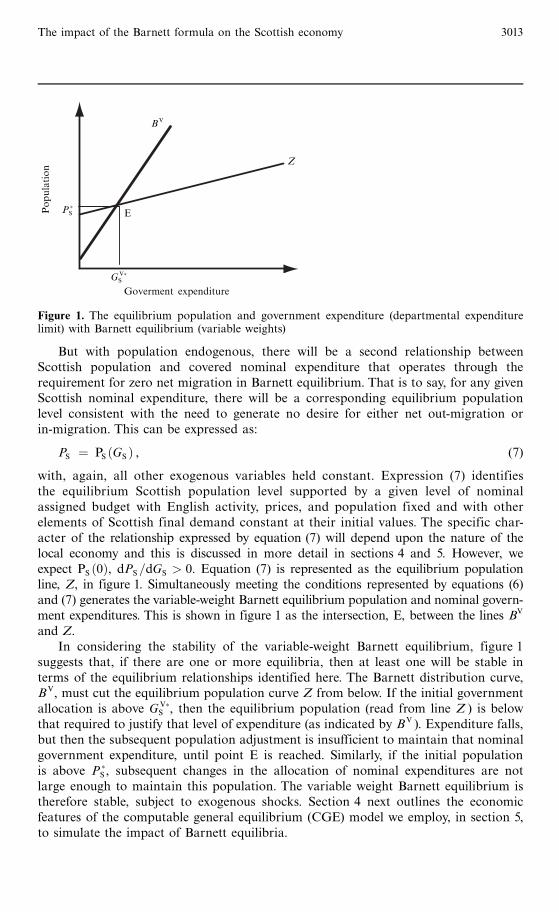
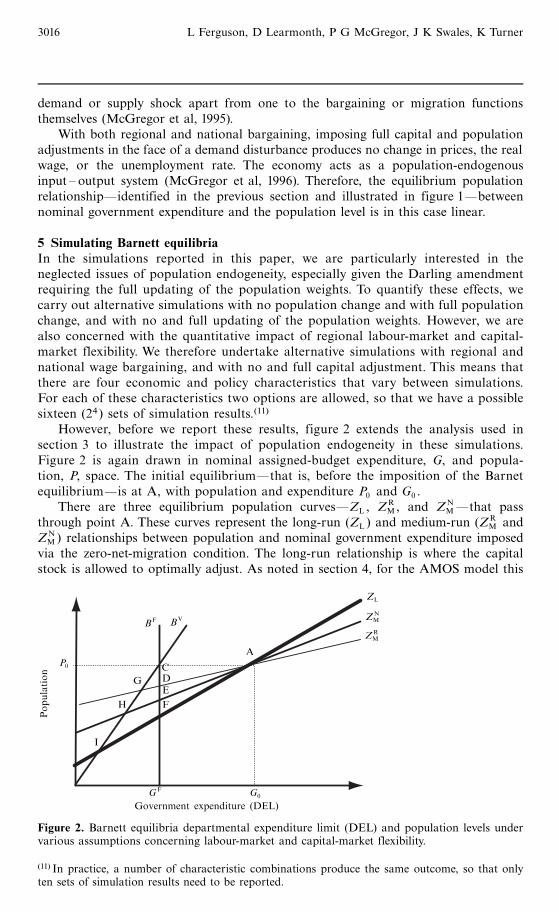
However, before we report these results, figure 2 extends the analysis used insection 3 to illustrate the impact of population endogeneity in these simulations.Figure 2 is again drawn in nominal assigned-budget expenditure, G, and popula-tion, P, space. The initial equilibriumöthat is, before the imposition of the Barnetequilibriumöis at A, with population and expenditure P0 and G0 .
There are three equilibrium population curvesöZL , ZRM, and ZN
M öthat passthrough point A. These curves represent the long-run (ZL ) and medium-run (ZR
M andZN
M ) relationships between population and nominal government expenditure imposedvia the zero-net-migration condition. The long-run relationship is where the capitalstock is allowed to optimally adjust. As noted in section 4, for the AMOS model this
Population
P0
BF BV
CDG
H
I
F
E
A
ZL
ZNM
ZRM
G0
Government expenditure (DEL)
GF
Figure 2. Barnett equilibria departmental expenditure limit (DEL) and population levels undervarious assumptions concerning labour-market and capital-market flexibility.
(11) In practice, a number of characteristic combinations produce the same outcome, so that onlyten sets of simulation results need to be reported.
3016 L Ferguson, D Learmonth, P G McGregor, J K Swales, K Turner
relationship will be linear and is invariant to the nature of the bargaining function used.In the medium run, capital is held fixed and the equilibrium population relationship willdepend on the wage-setting function imposed in the recipient region. We thereforedistinguish national and regional bargaining using the appropriate superscripts.
We expect the equilibrium population to be more sensitive to changes in govern-ment expenditure in the long run than in the medium run. The most straightforwardway to think about this is to compare the situations under regional bargaining. In boththe medium and the long run, with regional bargaining the real wage and unemploy-ment rate take their base-period values. In both these time periods, the proportionalpopulation change will therefore equal the corresponding proportional employmentchange. However, in the medium run, the fixed real wage implies a reduction in thenominal wage with the consumer price index (cpi) falling as a result of lower capitalrental rates. On the other hand, in the long run the initial nominal wage is reinstated.The improved competitiveness of the medium-run Barnett equilibrium produces alower proportionate reduction in employmentöand therefore also populationöin themedium run than in the long run.
It is difficult to rank, a priori, the sensitivity to government expenditure changes ofthe two medium-run equilibrium population curves. A relative fall in exogenousdemand with fixed capital stock generates a fall in the cpi as capital rentals fall.Therefore with regional bargaining the nominal wage will fall, even though the realconsumption wage is unchanged, whilst with national bargaining the regional nominalwage is unchanged, so that the regional real wage will rise. This differential labour-market response to the change in expenditure has implications for the slope of thecorresponding equilibrium population curves.With regional bargaining, the impositionof the zero-net-migration condition reinstates the original unemployment rate and realwage (McGregor et al, 1995). But for national bargaining, population equilibrium willrequire the regional unemployment rate to rise, to offset the increased real consump-tion wage [equation (10)]. The increased unemployment rate will mean that, for anygiven level of employment, population will be higher with national bargaining thanwith regional bargaining. However, the differential inflexibility in the regional labourmarket will imply that the medium-run employment effects of a reduction in relevantexpenditure will be greater under national bargaining than under regional bargaining.These two effects are operating in the opposite direction, as far as the impact onpopulation is concerned. In the parameterisation adopted with the AMOS model, thedifferential competitiveness effect far outweighs the differential unemployment effect.This implies that equilibrium population is more sensitive to changes in governmentexpenditure under national bargaining than regional bargaining. This is reflected in theway that the relevant curves have been drawn in figure 2.
5.1 Barnett equilibria with fixed population weightsImposing the Barnett equilibrium for Scotland implies a reduction in relevant expen-diture. Begin with the Barnett equilibrium with fixed weights. The new nominal DELexpenditure would be the initial Scottish population times the English per capitanominal DEL, b. With fixed population weights, this gives a new Scottish nominalexpenditure that is independent of subsequent changes in population. It is representedin figure 2 by the vertical line BF. If population is fixed, the equilibrium is at C.Population is at its original value P0 and the nominal expenditure falls to GF.The value of other key economic variables will depend upon the degree of flexibilityexhibited by other elements of the Scottish economy: for example, the nature of thelabour market and the degree of capital fixity.
The impact of the Barnett formula on the Scottish economy 3017
If full population adjustment is allowed, figure 2 shows three possibilities, indicatedby points D, E, and F. The most straightforward case is where the capital stock isalso allowed to fully adjust. The Barnett equilibrium is here at F and represents theinput ^ output adjustment to the reduced government expenditure (McGregor et al,1996). Output in all sectors will fall with a corresponding proportionate reduction inemployment. Because the zero-net-migration condition implies no change in the unem-ployment rate, the proportionate fall in population will equal the proportionate fall intotal employment. If the capital stocks are held fixed, the new equilibrium positiondepends on the imposed bargaining function.Where regional bargaining is adopted theequilibrium will be at point D in figure 2: under national bargaining, the equilibriumis at E. The population loss is greater for national bargaining, reflecting the moresubstantial fall in employment with national, as against regional, bargaining.
5.2 Barnett equilibria with variable (updated) population weightsIn figure 2, at point C the Scottish per capita expenditure equals the initial Englishfigure. If there is to be constant updating of the Barnett weights, the equilibria must lieon the straight line from the origin through C. This is simply a representation ofequation (6) and the slope of the line is bÿ1.
If there is no population change, the issue of updating the weights in the Barnettformula simply does not arise. However, where the equilibrium population leveldoes adjust to changes in nominal expenditure, unless the weights are amended,Barnett equilibrium expenditure per capita will continue to vary across the devolvedregions. The interaction of endogenous population with the updating of the pop-ulation weights in the Barnett formula leads to the appropriate equilibria shiftingfrom D, E, and F to G, H, and I. Points D, E, and F cannot be equilibria undervariable population weights: indeed in every instance expenditure is higher thanrequired for Barnett equilibrium. In each case, therefore, expenditure falls, inducingfalls in population and further expenditure contraction as a result of the updating.From inspection of figure 2, we expect that the population adjustment will be largerwith full capital adjustment than where capital stock is fixed. Population is moreresponsive to changes in expenditure where capital stock adjusts, generating largermultiplier effects.
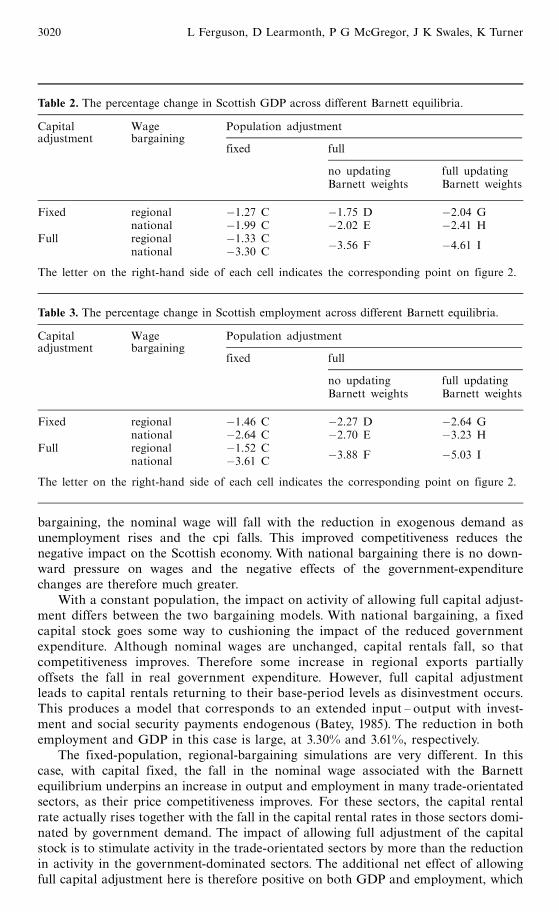
5.3 Simulation resultsIn order to attain greater precision for the population and government-expenditurechanges and to identify the impacts on other key economic variables, we perform anextensive set of simulations across different Barnett equilibria. The results for thechange in real government expenditure, GDP, and employment are given in tables 1,2, and 3. Each cell containing figures gives the result from a Barnett equilibriumsimulation with a particular set of characteristics. The degree of capital fixity andthe bargaining function used determine the row in which the result is reported. Thepopulation adjustment and the degree of updating of the Barnett population weightsdetermine the column. Therefore, for example, the 10.72% reduction in Scottish realgovernment expenditure where the capital stock is fixed and national bargaining isimposed, together with full population adjustment in the economy but no updatingof the Barnett weights, is found in the second row and second column of table 1. Ineach cell in which results are reported, we have also shownöin the top right-handcorneröthe point on figure 2 to which the result corresponds.
Table 1 gives the proportionate change in real government expenditure in Scotlandassociated with the imposition of the various Barnett equilibria. An 11.26% reductionin Scottish nominal expenditure is required to bring per capita 1999 nominal (assignedbudget) expenditure in Scotland into line with the corresponding English figure for
3018 L Ferguson, D Learmonth, P G McGregor, J K Swales, K Turner
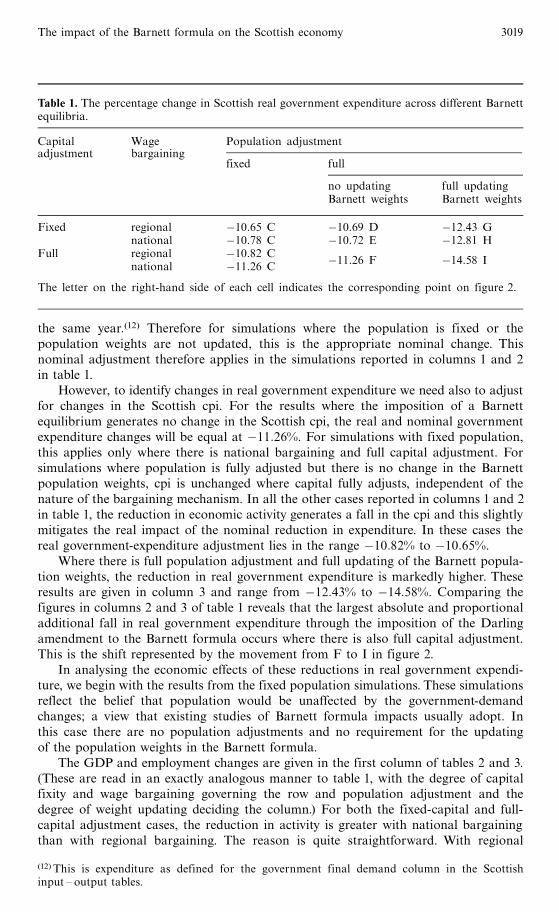
the same year.(12) Therefore for simulations where the population is fixed or thepopulation weights are not updated, this is the appropriate nominal change. Thisnominal adjustment therefore applies in the simulations reported in columns 1 and 2in table 1.
However, to identify changes in real government expenditure we need also to adjustfor changes in the Scottish cpi. For the results where the imposition of a Barnettequilibrium generates no change in the Scottish cpi, the real and nominal governmentexpenditure changes will be equal at ÿ11:26%. For simulations with fixed population,this applies only where there is national bargaining and full capital adjustment. Forsimulations where population is fully adjusted but there is no change in the Barnettpopulation weights, cpi is unchanged where capital fully adjusts, independent of thenature of the bargaining mechanism. In all the other cases reported in columns 1 and 2in table 1, the reduction in economic activity generates a fall in the cpi and this slightlymitigates the real impact of the nominal reduction in expenditure. In these cases thereal government-expenditure adjustment lies in the range ÿ10:82% to ÿ10:65%.
Where there is full population adjustment and full updating of the Barnett popula-tion weights, the reduction in real government expenditure is markedly higher. Theseresults are given in column 3 and range from ÿ12:43% to ÿ14:58%. Comparing thefigures in columns 2 and 3 of table 1 reveals that the largest absolute and proportionaladditional fall in real government expenditure through the imposition of the Darlingamendment to the Barnett formula occurs where there is also full capital adjustment.This is the shift represented by the movement from F to I in figure 2.
In analysing the economic effects of these reductions in real government expendi-ture, we begin with the results from the fixed population simulations. These simulationsreflect the belief that population would be unaffected by the government-demandchanges; a view that existing studies of Barnett formula impacts usually adopt. Inthis case there are no population adjustments and no requirement for the updatingof the population weights in the Barnett formula.
The GDP and employment changes are given in the first column of tables 2 and 3.(These are read in an exactly analogous manner to table 1, with the degree of capitalfixity and wage bargaining governing the row and population adjustment and thedegree of weight updating deciding the column.) For both the fixed-capital and full-capital adjustment cases, the reduction in activity is greater with national bargainingthan with regional bargaining. The reason is quite straightforward. With regional
(12) This is expenditure as defined for the government final demand column in the Scottishinput ^ output tables.
Table 1. The percentage change in Scottish real government expenditure across different Barnettequilibria.
Capital Wage Population adjustmentadjustment bargaining
fixed full
no updating full updatingBarnett weights Barnett weights
Fixed regional ÿ10.65 C ÿ10.69 D ÿ12.43 Gnational ÿ10.78 C ÿ10.72 E ÿ12.81 H
Full regional ÿ10.82 C ÿ11.26 F ÿ14.58 Inational ÿ11.26 C
The letter on the right-hand side of each cell indicates the corresponding point on figure 2.
The impact of the Barnett formula on the Scottish economy 3019
bargaining, the nominal wage will fall with the reduction in exogenous demand asunemployment rises and the cpi falls. This improved competitiveness reduces thenegative impact on the Scottish economy. With national bargaining there is no down-ward pressure on wages and the negative effects of the government-expenditurechanges are therefore much greater.
With a constant population, the impact on activity of allowing full capital adjust-ment differs between the two bargaining models. With national bargaining, a fixedcapital stock goes some way to cushioning the impact of the reduced governmentexpenditure. Although nominal wages are unchanged, capital rentals fall, so thatcompetitiveness improves. Therefore some increase in regional exports partiallyoffsets the fall in real government expenditure. However, full capital adjustmentleads to capital rentals returning to their base-period levels as disinvestment occurs.This produces a model that corresponds to an extended input ^ output with invest-ment and social security payments endogenous (Batey, 1985). The reduction in bothemployment and GDP in this case is large, at 3.30% and 3.61%, respectively.
The fixed-population, regional-bargaining simulations are very different. In thiscase, with capital fixed, the fall in the nominal wage associated with the Barnettequilibrium underpins an increase in output and employment in many trade-orientatedsectors, as their price competitiveness improves. For these sectors, the capital rentalrate actually rises together with the fall in the capital rental rates in those sectors domi-nated by government demand. The impact of allowing full adjustment of the capitalstock is to stimulate activity in the trade-orientated sectors by more than the reductionin activity in the government-dominated sectors. The additional net effect of allowingfull capital adjustment here is therefore positive on both GDP and employment, which
Table 2. The percentage change in Scottish GDP across different Barnett equilibria.
Capital Wage Population adjustmentadjustment bargaining
fixed full
no updating full updatingBarnett weights Barnett weights
Fixed regional ÿ1.27 C ÿ1.75 D ÿ2.04 Gnational ÿ1.99 C ÿ2.02 E ÿ2.41 H
Full regional ÿ1.33 C ÿ3.56 F ÿ4.61 Inational ÿ3.30 C
The letter on the right-hand side of each cell indicates the corresponding point on figure 2.
Table 3. The percentage change in Scottish employment across different Barnett equilibria.
Capital Wage Population adjustmentadjustment bargaining
fixed full
no updating full updatingBarnett weights Barnett weights
Fixed regional ÿ1.46 C ÿ2.27 D ÿ2.64 Gnational ÿ2.64 C ÿ2.70 E ÿ3.23 H
Full regional ÿ1.52 C ÿ3.88 F ÿ5.03 Inational ÿ3.61 C
The letter on the right-hand side of each cell indicates the corresponding point on figure 2.
3020 L Ferguson, D Learmonth, P G McGregor, J K Swales, K Turner
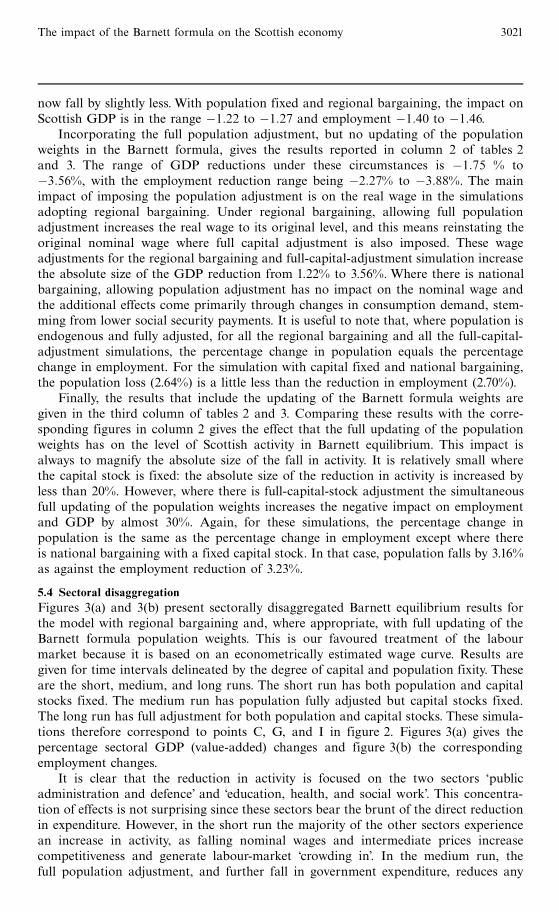
now fall by slightly less. With population fixed and regional bargaining, the impact onScottish GDP is in the range ÿ1:22 to ÿ1:27 and employment ÿ1:40 to ÿ1:46.
Incorporating the full population adjustment, but no updating of the populationweights in the Barnett formula, gives the results reported in column 2 of tables 2and 3. The range of GDP reductions under these circumstances is ÿ1:75 % toÿ3:56%, with the employment reduction range being ÿ2:27% to ÿ3:88%. The mainimpact of imposing the population adjustment is on the real wage in the simulationsadopting regional bargaining. Under regional bargaining, allowing full populationadjustment increases the real wage to its original level, and this means reinstating theoriginal nominal wage where full capital adjustment is also imposed. These wageadjustments for the regional bargaining and full-capital-adjustment simulation increasethe absolute size of the GDP reduction from 1.22% to 3.56%. Where there is nationalbargaining, allowing population adjustment has no impact on the nominal wage andthe additional effects come primarily through changes in consumption demand, stem-ming from lower social security payments. It is useful to note that, where population isendogenous and fully adjusted, for all the regional bargaining and all the full-capital-adjustment simulations, the percentage change in population equals the percentagechange in employment. For the simulation with capital fixed and national bargaining,the population loss (2.64%) is a little less than the reduction in employment (2.70%).
Finally, the results that include the updating of the Barnett formula weights aregiven in the third column of tables 2 and 3. Comparing these results with the corre-sponding figures in column 2 gives the effect that the full updating of the populationweights has on the level of Scottish activity in Barnett equilibrium. This impact isalways to magnify the absolute size of the fall in activity. It is relatively small wherethe capital stock is fixed: the absolute size of the reduction in activity is increased byless than 20%. However, where there is full-capital-stock adjustment the simultaneousfull updating of the population weights increases the negative impact on employmentand GDP by almost 30%. Again, for these simulations, the percentage change inpopulation is the same as the percentage change in employment except where thereis national bargaining with a fixed capital stock. In that case, population falls by 3.16%as against the employment reduction of 3.23%.
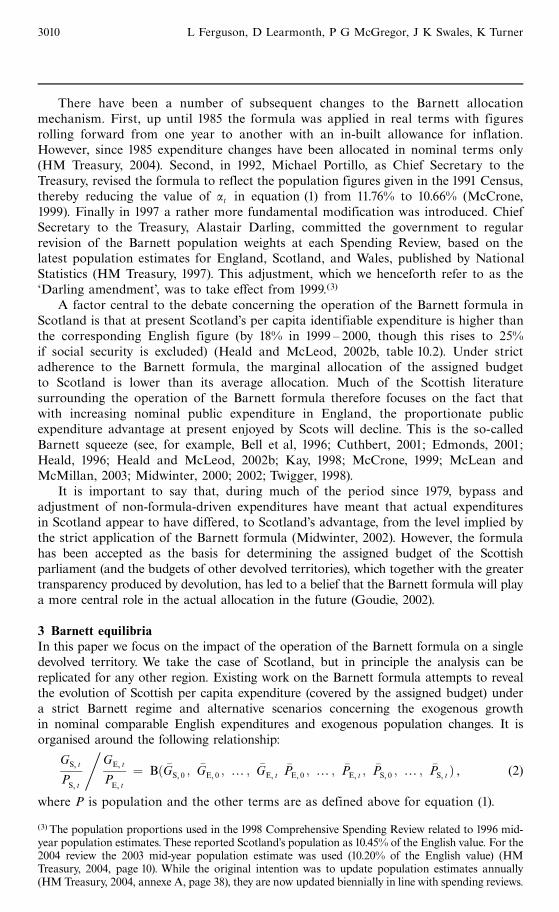
5.4 Sectoral disaggregationFigures 3(a) and 3(b) present sectorally disaggregated Barnett equilibrium results forthe model with regional bargaining and, where appropriate, with full updating of theBarnett formula population weights. This is our favoured treatment of the labourmarket because it is based on an econometrically estimated wage curve. Results aregiven for time intervals delineated by the degree of capital and population fixity. Theseare the short, medium, and long runs. The short run has both population and capitalstocks fixed. The medium run has population fully adjusted but capital stocks fixed.The long run has full adjustment for both population and capital stocks. These simula-tions therefore correspond to points C, G, and I in figure 2. Figures 3(a) gives thepercentage sectoral GDP (value-added) changes and figure 3(b) the correspondingemployment changes.
It is clear that the reduction in activity is focused on the two sectors `publicadministration and defence' and education, health, and social work'. This concentra-tion of effects is not surprising since these sectors bear the brunt of the direct reductionin expenditure. However, in the short run the majority of the other sectors experiencean increase in activity, as falling nominal wages and intermediate prices increasecompetitiveness and generate labour-market crowding in'. In the medium run, thefull population adjustment, and further fall in government expenditure, reduces any
The impact of the Barnett formula on the Scottish economy 3021
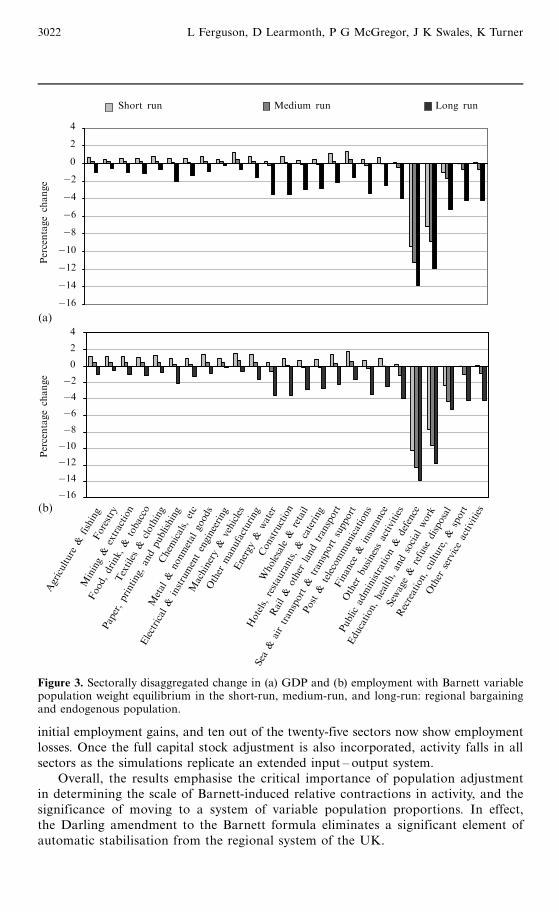
initial employment gains, and ten out of the twenty-five sectors now show employmentlosses. Once the full capital stock adjustment is also incorporated, activity falls in allsectors as the simulations replicate an extended input ^ output system.
Overall, the results emphasise the critical importance of population adjustmentin determining the scale of Barnett-induced relative contractions in activity, and thesignificance of moving to a system of variable population proportions. In effect,the Darling amendment to the Barnett formula eliminates a significant element ofautomatic stabilisation from the regional system of the UK.
4
2
0
ÿ2ÿ4ÿ6ÿ8ÿ10ÿ12ÿ14ÿ16
4
2
0
ÿ2ÿ4ÿ6ÿ8ÿ10ÿ12ÿ14ÿ16
Percentagechange
Percentagechange
Agriculture
&fishing
Forestry
Mining&
extraction
Food,
drink,
&tobacco
Textiles&
clothing
Paper,printing,andpublishing
Chemicals,etc
Metal
&nonm
etal
goods
Electrical&
instrumentengineering
Machinery
&vehicles
Other
manufacturing
Energy&
water
Construction
Wholesale&
retail
Hotels,restaurants,&
catering
Rail&
otherland
transport
Sea&
airtransport&
transportsupport
Post&
telecommunications
Finance
&insurance
Other
business
activities
Public
administration&
defence
Education,health,andsocial
work
Sewage&
refuse
disposal
Recreation,
culture,&
sport
Other
serviceactivities
(a)
(b)
Short run Medium run Long run
Figure 3. Sectorally disaggregated change in (a) GDP and (b) employment with Barnett variablepopulation weight equilibrium in the short-run, medium-run, and long-run: regional bargainingand endogenous population.
3022 L Ferguson, D Learmonth, P G McGregor, J K Swales, K Turner
6 ConclusionsThe simulation results point to a potentially sizeable contractionary impact of Barnettequilibria in Scotland and the importance of the wage-bargaining, migration, andcapital-adjustment processes in governing the likely scale of these effects. Underregional bargaining, if population is fixed, the size of the reduction in regional activityin Barnett equilibrium is relatively small. The reduction in GDP and employment isless than 1.3% and 1.5%, respectively. Moreover, as the capital stock adjusts this makeslittle difference to the change in aggregate activity. However, with endogenous popula-tion, even with no updating of the Barnett weights, the negative impact on Scottisheconomic activity is considerably increased. This is particularly true where capitaladjustment occurs. Finally, if the population weights in the Barnett formula are con-stantly updated, the real reduction in government expenditure, and the correspondingreduction in activity, is further intensified. With full capital and population adjust-ment, the Darling-amended Barnett equilibrium implies a 4.61% reduction in ScottishGDP and a 5.03% reduction in Scottish employment and population. While certainlysubstantial, these results may not be large relative to other possible disturbances to theScottish economy, such as the projected decline in Scotland's population of workingage, although variable population proportions in the Barnett formula will operate toreinforce such disturbances (Lisenkova et al, 2006).
While our analysis represents a significant generalisation of past work, thereremain four important areas for further research. First, while we concentrate here onthe implications of Barnett equilibria, we know that these are attained only after asubstantial lag, reflecting delays in updating population weights, the incrementalnature of the formula, and the typically extended nature of migration and capital-stock-adjustment processes. The adjustment process clearly merits further investigation.
Second, our assumption that the expenditure changes analysed here constitute apure demand disturbance considerably simplifies our analysis. It allows us to focuson this critical but previously neglected aspect of the formula. However, adversesupply-side impacts may well accompany the relative expenditure contractions, sothat the estimates we present cannot be regarded as providing a `worst case' scenario.There are at least two relevant aspects to this. First, the reduction in real governmentexpenditure might directly reduce productive efficiency by limiting policies aimed atimproving local development and skills. Second, if the reduction in real per capitagovernment expenditure lowers the amenity value associated with living in Scotland,this will further encourage out-migration and generate an increase in the real wageso as to satisfy the zero-net-migration requirement. These supply impacts merit furtherinvestigation.
Third, our analysis explores the impact of Barnett on economic activity in Scotlandalone. The extensive use of the small-region assumption means that interregional spill-overs and national macroeconomic constraints are ignored.We know from the existingdistribution of per capita government expenditures that adherence to Barnett impliesthat Wales will be subject to smaller, and Northern Ireland greater, contractionsin demand than Scotland. The economy of England will, however, benefit, but identi-fication of the scale of the impacts necessitates the use of an explicitly interregionalmodelling framework.
A fourth area is the investigation of a wider range of alternative schemes fordistributing public expenditures among the regions of the UK. A number of authorshave argued that the strict imposition of the Barnett formula is unsustainable(Christie, 2002; McLean and McMillan, 2003). At the simplest level, should updated`needs assessments' become available, it would, of course, be instructive to comparethe implied needs equilibria with the corresponding Barnett equilibria, but the last
The impact of the Barnett formula on the Scottish economy 3023
publicly available needs assessment relates to 1976/77 (reported in HM Treasury,1979). However, a number of variants of greater fiscal autonomy have been proposedand future research should explore the possible impact of alternative fiscal systemsin a UK context in future research. [See, for example, McGregor and Swales (2005)and McGregor et al (2003).]
The neglected system-wide effects of the Barnett formula are important in practice.Yet alternatives to Barnett are often framed essentially in terms of microeconomic `needs'.If the macroeconomic consequences of Barnett really matter, as our analysis suggests,they should feature more heavily in decisions concerning the regional distribution ofgovernment expenditures.
Acknowledgements. The authors acknowledge the support of the ESRC (grant L219252102) underthe Devolution and Constitutional Change Research Programme and, latterly, under the jointESRC/Scottish Executive's Scottish Demography Initiative. The Centre for Public Policy forRegions (CPPR) is a SHEFC-funded joint research institute of the Universities of Glasgow andStrathclyde. We are very grateful to two anonymous referees for constructive criticism that sig-nificantly improved the paper and to Alex Christie, Scottish Economic Policy Network, and CPPR,for discussions on a number of aspects of the Barnett formula.We are also indebted to participantsin seminars on related material at Aberdeen, Dundee, and St Andrews Universities; theInternational Regional Science Association Annual Conference, British and Irish Section, Brighton,August 2002; David Hume Institute, December, 2002; Southern Regional Science Association,Louisville, Kentucky, April, 2003; Fourth Israeli/British and Irish Regional Science Workshop,Edinburgh, May, 2003; the Royal Economic Society Conference, Nottingham, April, 2005; andthe North American Regional Science Conference, Las Vegas, November, 2005. Linda Ferguson isnow with the Research Department of Glasgow City Council and David Learmonth is currentlyemployed by the Bank of England. The research reported in this paper was conducted while bothwere Research Assistants at the Fraser of Allander Institute.
ReferencesArmington P, 1969, `A theory of demand for products distinguished by place of production''
IMF Staff Papers 16 157 ^ 178Arup Economics and Planning, 2000, ` Evaluation of regional selective assistance: report for DTI,
National Assembly forWales and Scottish Executive'', Arup Economics and Planning, LondonBatey P W J, 1985, ` Input ^ output models for regional demographic ^ economic analysis: some
structural comparisons'' Environment and Planning A 17 73 ^ 99Bell D, Dow S, King D, Massie N, 1996, ` Financing devolution''Hume Papers on Public Policy
(Edinburgh University Press) 4(2)Blanchflower D, Oswald A, 1994 TheWage Curve (MIT Press, Cambridge, MA)Christie A, 2002, ` The 1979 needs assessment: lessons from Australia and Canada'' Fraser of
Allander Quarterly Economic Commentary 27 (July), pp 30 ^ 35Cuthbert J, 2001, ` The effect of relative population growth on the Barnett squeeze'' Fraser of
Allander Quarterly Economic Commentary May, pp 34 ^ 37Edmonds T, 2001, ` The Barnett formula'', House of Commons Research Paper 01/108
(The Stationery Office, London)Ferguson L, Learmonth D, McGregor P G, Swales J K,Turner K, 2003, ` The impact of the Barnett
formula on the Scottish economy: a general equilibrium analysis'', Strathclyde DiscussionPapers in Economics 03-04, Department of Economics, University of Strathclyde, Glasgow
Gibson H, 1990, ` Export competitiveness and UK sales of Scottish manufacturers'', workingpaper, Scottish Enterprise, Glasgow
Goudie A, 2002, ` GERS and fiscal autonomy'' Scottish Affairs 41 56 ^ 85Greenaway D, Leyborne S J, Reed G V,Whalley J, 1993 Applied General Equilibrium Modelling:
Applications, Limitations and Future Developments (HMSO, London)Greenwood M J, Hunt G, Richman D, Treyz G, 1991, ` Migration, regional equilibrium, and the
estimation of compensating differentials''American Economic Review 81 1382 ^ 1390Harrigan F, McGregor P, Perman R, Swales K,Yin Y P, 1991, `AMOS: a macro ^micro model
of Scotland'' Economic Modelling 8 424 ^ 479Harris J R,Todaro M P, 1970, ` Migration, unemployment, and development: a two-sector analysis''
American Economic Review 60 126 ^ 142
3024 L Ferguson, D Learmonth, P G McGregor, J K Swales, K Turner
Harris R I D, 1989 The Growth and Structure of the UK Regional Economy, 1963 ^ 1985 (Avesbury,Aldershot, Hants)
Harris R I D, 1991, ` The employment creation effects of factor subsidies for Northern Irelandmanufacturing industry, 1955 ^ 1983'' Journal of Regional Science 31 49 ^ 64
Heald D A, 1996, ` Formula-controlled territorial public expenditure in the United Kingdom''Public Finances/Finances Publiques 8 23 ^ 52
Heald D A, McLeod A, 2002a, Constitutional Law, The Laws of Scotland: Stair MemorialEncyclopaedia. Public Expenditure (Butterworth, Edinburgh)
Heald D A, McLeod A, 2002b, ` Beyond Barnett: financing devolution'', in Devolution in Practice:Public Policy Differences within the UK Eds JAdams, P Robinson (IPPR, London) pp 147 ^ 175
HM Treasury, 1979 Needs Assessment StudyöReport HM Treasury, LondonHM Treasury, 1997 Principles to Govern Determination of the Block Budgets for the Scottish
Parliament and National Assembly forWales December, HM Treasury, LondonHM Treasury, 2004 Funding the Scottish Parliament, National Assembly forWales and Northern
Ireland Assembly 4th edition (The Stationery Office, London)Holden D R, Swales J K, 1995, ` The additionality, displacement and substitution effects of a
factor subsidy'' Scottish Journal of Political Economy 42 113 ^ 126Kay N, 1998, ` The Scottish Parliament and the Barnett formula'' Fraser of Allander Quarterly
Economic Commentary 24(1) 32 ^ 48Layard R, Nickell S, Jackman R,1991Unemployment: Macroeconomic Performance and the Labour
Market (Oxford University Press, Oxford)Lisenkova K,McGregor P G, Pappas N, Swales K,Turner K,Wright R, 2006, ` The macroeconomic
impact of projected population decline in Scotland: a computable general equilibrium analysis'',mimeo, Department of Economics, University of Strathclyde, Glasgow
McCrone G, 1999, ``Scotland's public finances from Goshen to Barnett'' Fraser of Allander InstituteQuarterly Economic Commentary 24(2) 30 ^ 46
McGregor P G, Swales J K, 2005, ` Economics of devolution decentralization in the UK: somequestions and answers''Regional Studies 39 477 ^ 494
McGregor P G, Swales J K,Yin Y P, 1995, ` Migration equilibria/disequilibria and the naturalrate of unemployment in a regional context'' International Journal of Manpower 16 66 ^ 72
McGregor P G, Swales J K,Yin Y P, 1996, `A long-run interpretation of regional input ^ outputanalysis'' Journal of Regional Science 36 479 ^ 501
McGregor P G, Swales J K,Yin Y P, 2003, ` The macroeconomics of Scottish fiscal autonomy:inverted Haavelemo effects in a general equilibrium analysis of the `tartan tax' '', paperpresented to the British and Irish Regional Science Association Conference, St Andrews;copy available from the author
McLean I, McMillan A, 2003, ` The distribution of public expenditure across the UK regions''Fiscal Studies 24 45 ^ 71
Midwinter A, 2000, ``Devolution and public spending: arguments and evidence'' Fraser of AllanderQuarterly Economic Commentary 25(4) 38 ^ 48
Midwinter A, 2002, ``The limits to full fiscal autonomy: a critique of the Scottish National Party'sagenda for devolution finance'' Scottish Affairs 41 121
Minford P, Stoney P, Riley J,Webb B, 1994, `An econometric model of Merseyside: validationand policy simulations''Regional Studies 28 563 ^ 575
Partridge MD, Rickman D S, 1998, ` Regional computable general equilibrium modelling: a surveyand critical appraisal'' International Regional Science Review 21 205 ^ 248
Roper S, O'Shea G,1991, ` The effects of labour subsidies in Northern Ireland1967 ^ 79: a simulationexercise'' Scottish Journal of Political Economy 38 273 ^ 292
Treyz G I, Rickman D S, Hunt G L, Greenwood M J, 1993, ` The dynamics of internal migrationin the US''Review of Economics and Statistics 75 209 ^ 214
Twigger R, 1998, ` The Barnett formula'', House of Commons Library: Economic Policy andStatistics Section, RP 98/8
The impact of the Barnett formula on the Scottish economy 3025
AppendixTable A1. A condensed version of the AMOS computable general equilibrium (CGE) model.
(1) Commodity price pi � pi �wn ; wki �
(2) Consumer price index cpi �Xi
yi pi �Xi
yUKi �pUK
i �Xi
yROWi �pROW
i
(3) Capital price index kpi �Xi
gi pi �Xi
gUKi �pUK
i �Xi
gROWi �pROW
i
(4) User cost of capital uck � uck�kpi�
(5) Nominal wage setting
wn � wn
N
L; cpi
� �Regional bargaining
National bargaining wn � �wn
(6) Labour force:Short-run L � �L
Full adjustment L � Lwn
cpi; N
� �
(7) Labour demand NDi � ND
i �Qi ; wn ; wk i�
(8) Labour-market clearingXi
NDi � N
(9) Capital demand Ki � KDi � KD
i �Qi ; wn ; wk i�
(10) Capital Rental rateShort-run w
k i� w s
k i
ÿKD
i ; �K Si
�Full adjustment w
k i� w l
k i�uck�
(11) Nominal household income Y � CnNwn �Ck
Xi
Ki wk i
(12) Commodity demand Qi � Ci � Ii � Gi � Xi
(13) Consumption demand Ci � Ci
ÿpi ; �pUK
i ; �pROWi ; Y; cpi
(14) Capital stock adjustment DKi � diKi
(15) Investment demand Ii � Iiÿpi ; �pUK
i ; �pROWi ;
Xi
bi jDKj
�(16) Government demand
No population updating Gi � Gsi
ÿ�Gn ; cpi
�Full population updating Gi � Gl
i
ÿL; cpi
�(17) Export demand Xi � Xi
ÿpi ; �pUK
i ; �pROWi ; �DUK; �DROW
�
,
,
, ,
, ,
,
,
3026 L Ferguson, D Learmonth, P G McGregor, J K Swales, K Turner
ß 2007 a Pion publication printed in Great Britain
NotationActivity ^ commoditiesi, j are activity/commodity subscripts.
TransactorsUK � United Kingdom, ROW � rest of the world
Time periodss � short run, l � full adjustment
Nominal/realVariables are generally expressed in real terms apart from where the superscript n is used.
Functionsp(.) cost functionuck(.) user cost of capital formulationwn (.), wk (.) factor price setting functionsC(.), I(.), X(.) Armington consumption, investment and export demand functions,
Homogenous of degree zero in prices and one in quantitiesKD(.), ND(.) factor demand functionsL zero net migration conditionG Barnett public sector expenditure formula
VariablesC consumptionD exogenous export demandG government demand for local goodsI investment demand for local goodsDK investment demand by activityKD, K S, K capital demand, capital supply and actual capital stockL labour forceND, N labour demand and total employmentQ commodity/activity outputX exportsY household nominal incomeb elements of capital matrixcpi, kpi consumer and capital price indicesd physical depreciationp price of commodity/activity outputuck user cost of capitalwn , wk wage, capital rentalC share of factor income retained in regiony consumption weightsg capital weights
Notes: A number of simplifications are made in this condensed version of AMOS:1. Intermediate demand is suppressed throughout [for example only primary factor demandsare noted in price determination in equation (1) and final demands in the determination ofcommodity demand in equation (10)].2. Income transfers are generally suppressed.3. Taxes are ignored.4. The participation rate is ignored.
The impact of the Barnett formula on the Scottish economy 3027

Conditions of use. This article may be downloaded from the E&P website for personal researchby members of subscribing organisations. This PDF may not be placed on any website (or otheronline distribution system) without permission of the publisher.