evaluation of the production line of the heat …...evaluation of the production line of the heat...
TRANSCRIPT
Evaluation of the production line of the heat treatment
using the queuing theory and simulation
Maria Célia de Oliveira Papa – Universidade Metodista de Piracicaba – UNIMEP
Ricardo Rozo Vaz Perez – Universidade Metodista de Piracicaba – UNIMEP
Rodrigo Ferro– Universidade Metodista de Piracicaba – UNIMEP
André Luis Helleno– Universidade Metodista de Piracicaba – UNIMEP
Abstract The main purpose of this paper is to present a case study of application of
simulation on the production line of the heat treatment. This study was developed using concepts of queuing theory and simulation. The main result showed the best distribution of products targeting the most responsive customer service.
Keywords: Lean Manufacturing; Simulation; Heat Treatment.
Introduction
Flexible manufacturing processes are key point to allow enterprises to support market demands and at the same time to fulfill customers needs. To make this possible enterprises more and more search for methodologies and tools that support continuous improvement actions.
Several tools and methodologies found in current literature and focused on this matter were conceived by Toyota by the end of World War II and have the main target to eliminate inherent wastes from the value chain production flow.
These wastes according to Ohno are: overproduction; wait; transport; processing; stocks; material handling and non conformance parts.
Reducing such wastes creates a condition to manufacture more complex mix of products in smaller volumes and a greater variety of products achieving reduction in terms of lead time to customer and non conformance parts.
Contemporary literature shows several studies that apply lean concepts and tools in a search for continuous improvement and process optimization. Among them, Silva and Rentes (2012), proposed based on simulations, a new layout configuration model which permits to develop alternatives to physical arrangements at production floor based on lean manufacturing philosophy.
Another study proposed by Álvarez et al. (2009), in which the author adopt the following lean tools : Value Stream Mapping, stock management (Kanbam), sequential collecting of goods (Milkrun). This study was based on analysis for a fuel injection assembly line. As results the authors achieved 50% stock of material reduction (raw material, work in process, and finished goods), and a manufacturing lead time reduction from 20 to 17 days.
Among lean tools distinguished the VSM since this tool permits to identify the waste sources inside a production system and identify potentials improvements actions.
According to Solding and Gullander (2009) e Singh et al. (2010), more than identify wastes, VSM tool adopts an ease symbologies capable to be understood among the different levels in a enterprise.
Another important characteristic about VSM is its capacity to give a systemic vision about the whole manufacturing process and at same time explain individual processes and their small operations.
Among these studies that apply VSM in operative problems, Vinodh et al. (2010), analyzed a crankshaft manufacturing process in a auto part company. Use of VSM permitted to evaluate and reduce intermediate stocks of goods and consequently reduce the lead time to customer. Beyond this study Seth et al. (2007), used VSM to evaluate improvement process indicators of activities with added value according to customers wishes.
Although VSM is a important tool, specially to evaluate and propose waste reduction actions, also allow us to understand the behavior of one process at a defined point in time since is possible to represent the process in a certain moment. Nevertheless is widely known that in a real world there are many variations which have influence in the process. Among them variability of the entry entities, specially in terms of volume demand variation, set up time, machine downtimes, variability create due different machine operators and others sources. Consequently the behavior of these manufacturing processes variables changes during passing time. To be possible to evaluate one manufacturing process and take decisions to improvements is mandatory that all sources of variability be considered. One tool that can represents one defined process in a most close way possible is a simulation with discreet event.
A simulation based on discreet events consists in build up a mathematic model that represents the real behavior of one system and from this model be capable to develop new scenarios in order to evaluate their behavior when its parameters are changed (PRITSKER, 1999; OLIVEIRA, 2008).
The case analyzed in this study refers to a heat treatment process in a auto part company localized in Brazil. The target is to check the necessity to buy a new heat treatment furnace to support all volume foreseen demand and check potential improvement for material flow.
According to Chiaverini (2012) heat treatment refers to a group of operations intend to change the properties of steel (or other materials), by utilizing a sequence of operations which include heating up; cooling down the part under controlled environment.
The main purpose of this paper is to present a case study of application of simulation in one production line of heat treatment.
The methodology adopted to the development of this article was simulation in one heat treatment process existing in one multinational company that supplies auto parts to auto car industry. Figure 1 shows the steps of this study development.
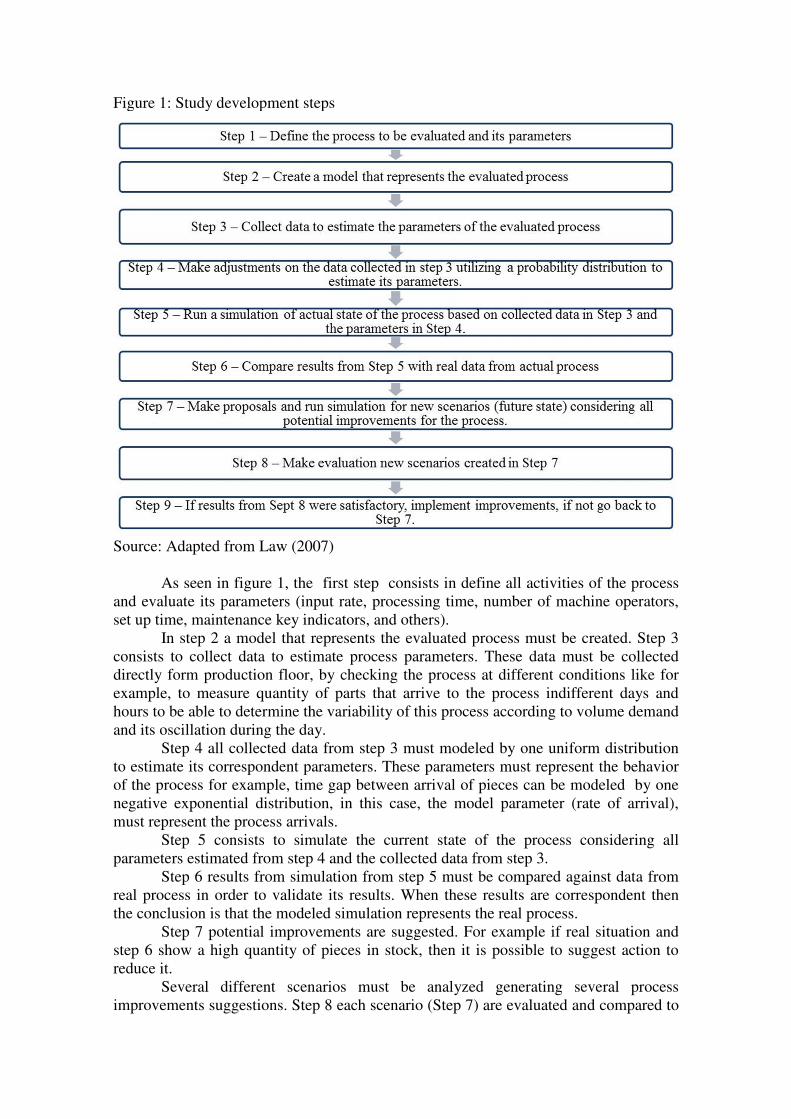
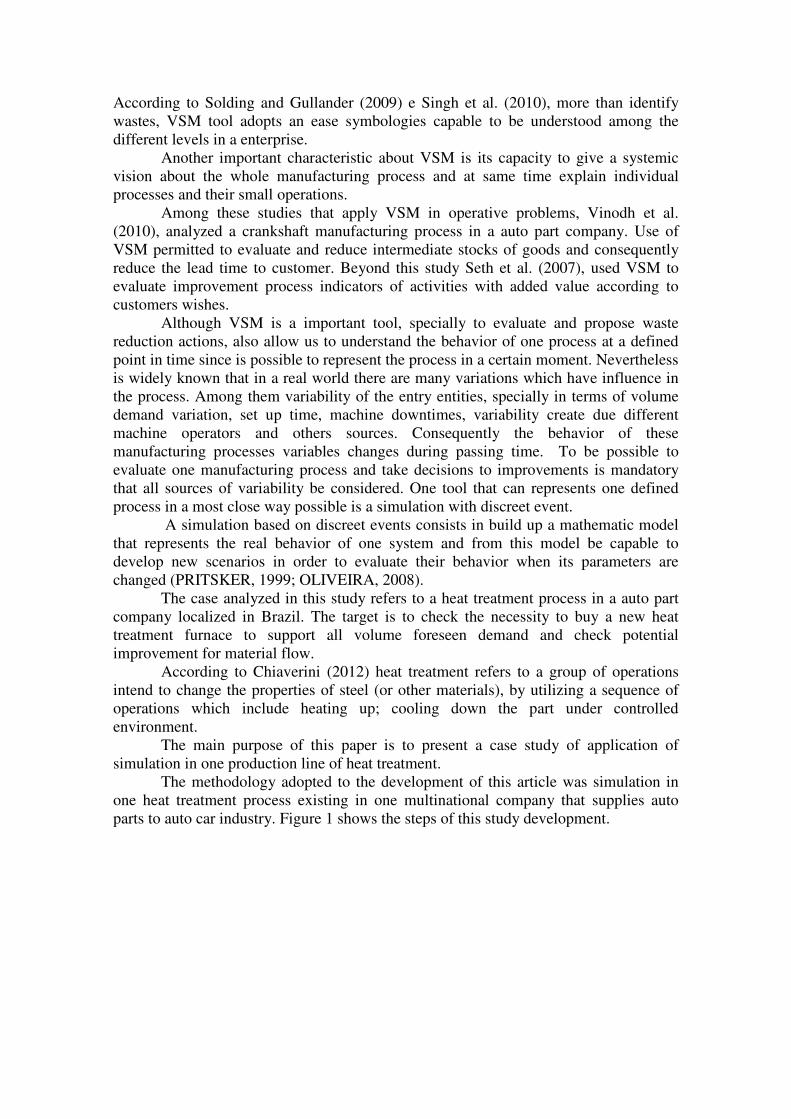
Figure 1: Study development steps
Source: Adapted from Law (2007)
As seen in figure 1, the first step consists in define all activities of the process and evaluate its parameters (input rate, processing time, number of machine operators, set up time, maintenance key indicators, and others).
In step 2 a model that represents the evaluated process must be created. Step 3 consists to collect data to estimate process parameters. These data must be collected directly form production floor, by checking the process at different conditions like for example, to measure quantity of parts that arrive to the process indifferent days and hours to be able to determine the variability of this process according to volume demand and its oscillation during the day.
Step 4 all collected data from step 3 must modeled by one uniform distribution to estimate its correspondent parameters. These parameters must represent the behavior of the process for example, time gap between arrival of pieces can be modeled by one negative exponential distribution, in this case, the model parameter (rate of arrival), must represent the process arrivals.
Step 5 consists to simulate the current state of the process considering all parameters estimated from step 4 and the collected data from step 3.
Step 6 results from simulation from step 5 must be compared against data from real process in order to validate its results. When these results are correspondent then the conclusion is that the modeled simulation represents the real process.
Step 7 potential improvements are suggested. For example if real situation and step 6 show a high quantity of pieces in stock, then it is possible to suggest action to reduce it.
Several different scenarios must be analyzed generating several process improvements suggestions. Step 8 each scenario (Step 7) are evaluated and compared to
the actual process, in such way that is possible evaluate each one of them and take decision for which scenario is the most adequate to the desired improvement. In case one of the scenarios is suitable it can be implemented, if not new scenarios must be proposed.
The development of this study was performed according to the steps in Figure 1 and is described in details in the next topic. Development and Results Discussions
The main problem that motivated the enterprise to perform this case study is to verify the viability to buy a new heat treatment furnace due a high quantity of downtime with a correspondent high time to repair one of its furnace. At present time this enterprise has 03 (three) mesh belt furnaces dedicated to through hardening here defined as furnace 1, furnace 2, furnace 3.
Heat treated parts are rings (W21;W22;W220) and rollers (W29; W131). The respective sets up time are shown in figure 2. Figure 2: Sets Up Time
Figure 2 shows the set up time for each kind of part. For example, set up time from W22 to W131 is zero, set up time between from parts W22 and W 131 to parts W21, W29 and W220 are 3 hours. The interpretation the others parts is analogue.
These set up times were considered for the simulation together with the respective cycle time that can achieve 4 minutes for a 100 kg batch size at furnace 1 and 15 minutes for a 100 kg batch size for furnaces 2 and 3. Batch size for each furnace is defined by geometry and weight of the heat treated part.
The availability percentages (%) were obtained from the average availability checked in period from January up to July 2013 they are : 95,58% (furnace 1), 79,68 (furnace 2) and 98,49 (furnace 3). Working pattern is 3 shifts, with 60 minutes for a meal. All collected data were obtained from technical visits and 30 days historical key production performance indicators.
Figure 3 shows the actual process evaluated. To perform simulations will be added to the model the parameters of input, transformation, output, collected direct at the process.
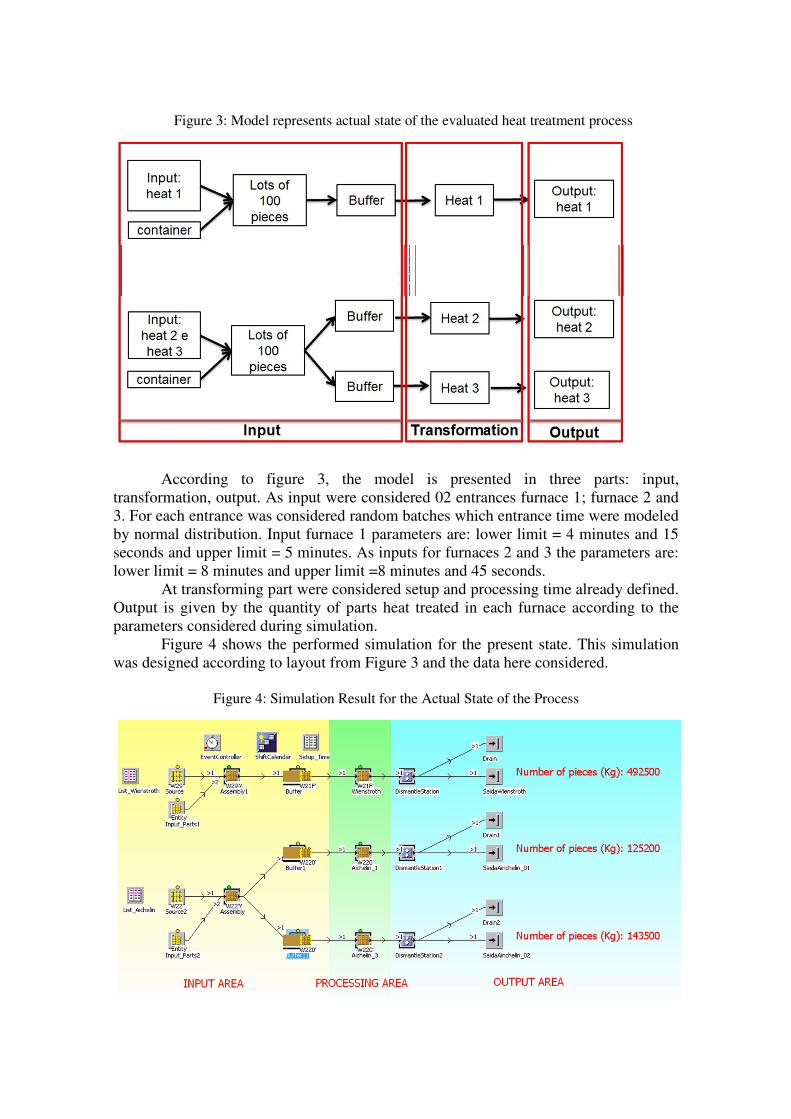
Figure 3: Model represents actual state of the evaluated heat treatment process
According to figure 3, the model is presented in three parts: input, transformation, output. As input were considered 02 entrances furnace 1; furnace 2 and 3. For each entrance was considered random batches which entrance time were modeled by normal distribution. Input furnace 1 parameters are: lower limit = 4 minutes and 15 seconds and upper limit = 5 minutes. As inputs for furnaces 2 and 3 the parameters are: lower limit = 8 minutes and upper limit =8 minutes and 45 seconds.
At transforming part were considered setup and processing time already defined. Output is given by the quantity of parts heat treated in each furnace according to the parameters considered during simulation.
Figure 4 shows the performed simulation for the present state. This simulation was designed according to layout from Figure 3 and the data here considered.
Figure 4: Simulation Result for the Actual State of the Process
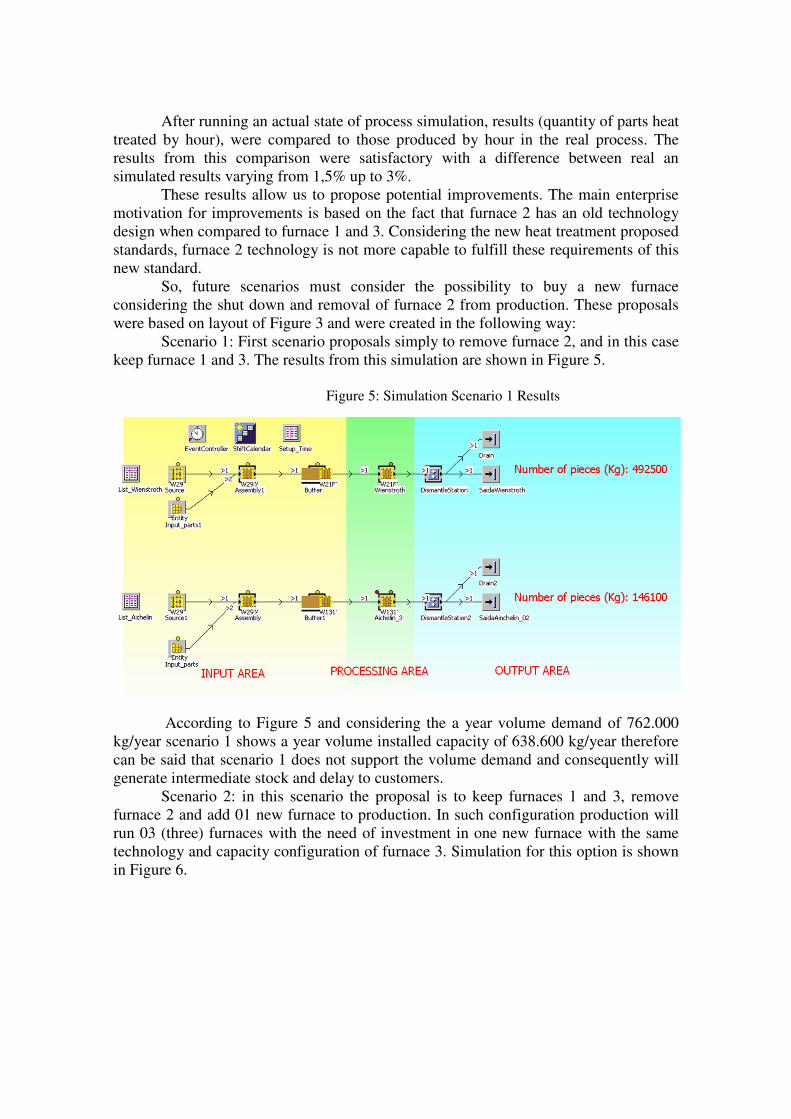
After running an actual state of process simulation, results (quantity of parts heat
treated by hour), were compared to those produced by hour in the real process. The results from this comparison were satisfactory with a difference between real an simulated results varying from 1,5% up to 3%.
These results allow us to propose potential improvements. The main enterprise motivation for improvements is based on the fact that furnace 2 has an old technology design when compared to furnace 1 and 3. Considering the new heat treatment proposed standards, furnace 2 technology is not more capable to fulfill these requirements of this new standard.
So, future scenarios must consider the possibility to buy a new furnace considering the shut down and removal of furnace 2 from production. These proposals were based on layout of Figure 3 and were created in the following way:
Scenario 1: First scenario proposals simply to remove furnace 2, and in this case keep furnace 1 and 3. The results from this simulation are shown in Figure 5.
Figure 5: Simulation Scenario 1 Results
According to Figure 5 and considering the a year volume demand of 762.000 kg/year scenario 1 shows a year volume installed capacity of 638.600 kg/year therefore can be said that scenario 1 does not support the volume demand and consequently will generate intermediate stock and delay to customers.
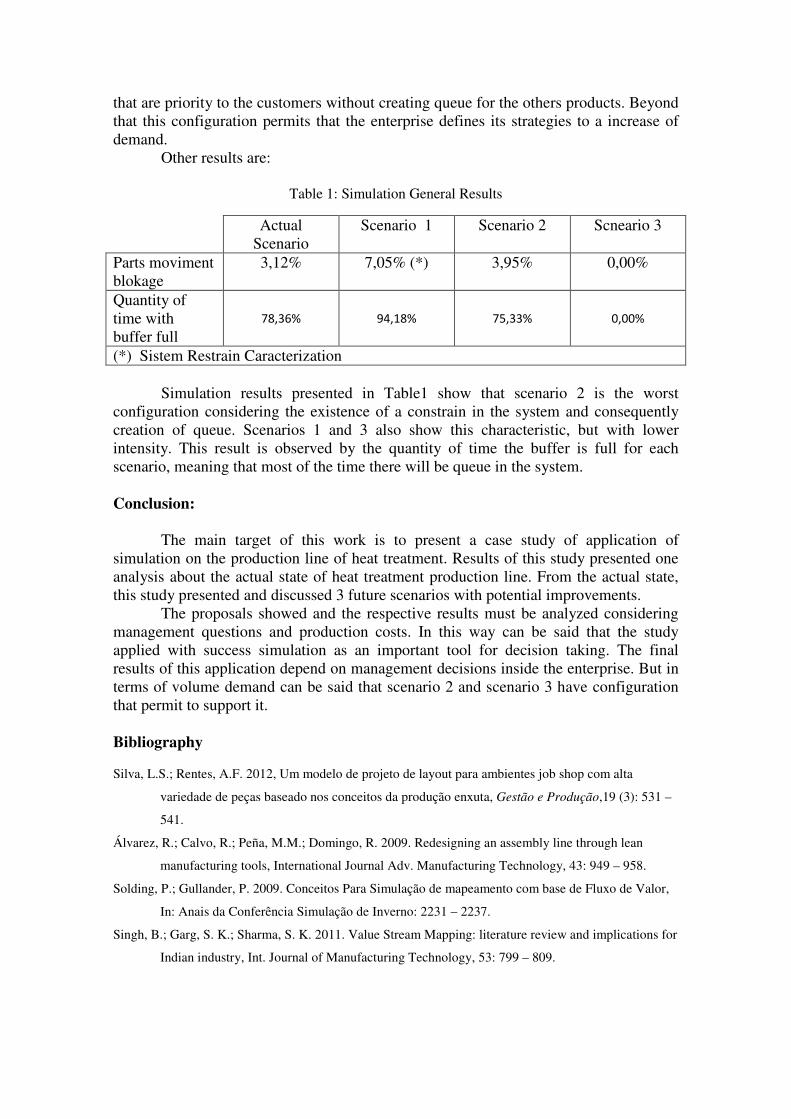
Scenario 2: in this scenario the proposal is to keep furnaces 1 and 3, remove furnace 2 and add 01 new furnace to production. In such configuration production will run 03 (three) furnaces with the need of investment in one new furnace with the same technology and capacity configuration of furnace 3. Simulation for this option is shown in Figure 6.
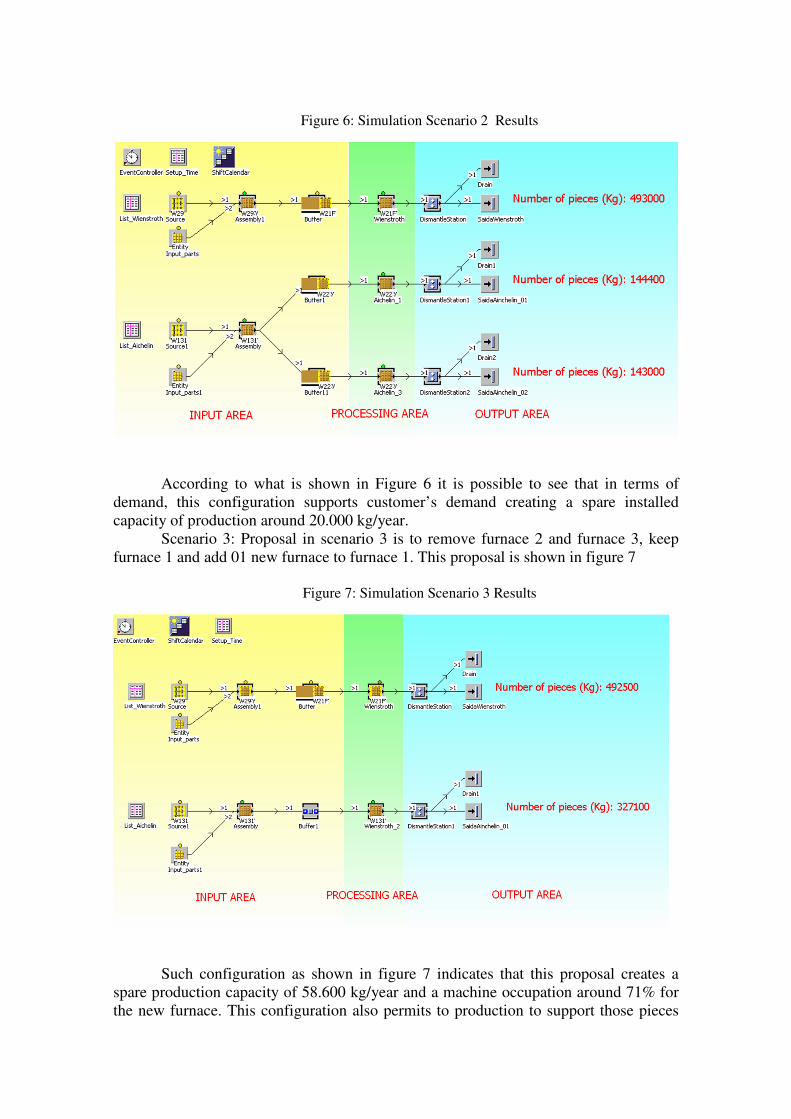
Figure 6: Simulation Scenario 2 Results
According to what is shown in Figure 6 it is possible to see that in terms of demand, this configuration supports customer’s demand creating a spare installed capacity of production around 20.000 kg/year.
Scenario 3: Proposal in scenario 3 is to remove furnace 2 and furnace 3, keep furnace 1 and add 01 new furnace to furnace 1. This proposal is shown in figure 7
Figure 7: Simulation Scenario 3 Results
Such configuration as shown in figure 7 indicates that this proposal creates a spare production capacity of 58.600 kg/year and a machine occupation around 71% for the new furnace. This configuration also permits to production to support those pieces
that are priority to the customers without creating queue for the others products. Beyond that this configuration permits that the enterprise defines its strategies to a increase of demand.
Other results are:
Table 1: Simulation General Results
Actual Scenario
Scenario 1 Scenario 2 Scneario 3
Parts moviment blokage
3,12% 7,05% (*) 3,95% 0,00%
Quantity of time with buffer full
78,36% 94,18% 75,33% 0,00%
(*) Sistem Restrain Caracterization
Simulation results presented in Table1 show that scenario 2 is the worst configuration considering the existence of a constrain in the system and consequently creation of queue. Scenarios 1 and 3 also show this characteristic, but with lower intensity. This result is observed by the quantity of time the buffer is full for each scenario, meaning that most of the time there will be queue in the system. Conclusion:
The main target of this work is to present a case study of application of
simulation on the production line of heat treatment. Results of this study presented one analysis about the actual state of heat treatment production line. From the actual state, this study presented and discussed 3 future scenarios with potential improvements.
The proposals showed and the respective results must be analyzed considering management questions and production costs. In this way can be said that the study applied with success simulation as an important tool for decision taking. The final results of this application depend on management decisions inside the enterprise. But in terms of volume demand can be said that scenario 2 and scenario 3 have configuration that permit to support it.
Bibliography
Silva, L.S.; Rentes, A.F. 2012, Um modelo de projeto de layout para ambientes job shop com alta
variedade de peças baseado nos conceitos da produção enxuta, Gestão e Produção,19 (3): 531 –
541.
Álvarez, R.; Calvo, R.; Peña, M.M.; Domingo, R. 2009. Redesigning an assembly line through lean
manufacturing tools, International Journal Adv. Manufacturing Technology, 43: 949 – 958.
Solding, P.; Gullander, P. 2009. Conceitos Para Simulação de mapeamento com base de Fluxo de Valor,
In: Anais da Conferência Simulação de Inverno: 2231 – 2237.
Singh, B.; Garg, S. K.; Sharma, S. K. 2011. Value Stream Mapping: literature review and implications for
Indian industry, Int. Journal of Manufacturing Technology, 53: 799 – 809.

Vinodt, S.; Arvind, K.R.; Somanaathan, M. 2010, Application of value stream mapping in an Indian
camshaft manufacturing organization, Journal of Manufacturing Technology Management,
21(7): 888 – 900.
Pritsker, A. A.; O’Reilly J. J. 1999. Simulation with visual SLAM and AweSim, Wiley, New York.
Oliveira, C.S. (2008), Aplicação de técnicas de simulação em projetos de manufatura enxuta. Estudos
Tecnológicos, 4 (3): 204 – 215.
Law, A.M. 2007, Simulation Modeling and Analysis, 4ª Ed, NewYork: McGraw-Hill.