evaluating multicast routing algorithms’ performance and
TRANSCRIPT
Evaluating multicast routing algorithms’ performance and execution time
DAN MANCAS
ECATERINA - IRINA MANOLE NICU ENESCU
Computer and Communication Engineering Department Faculty of Automation, Computers and Electronics
University of Craiova Decebal Bvd., No. 107, Craiova, Dolj, 200440
ROMANIA [email protected], [email protected], [email protected]
Abstract: - In this paper, an evaluation of the network routing algorithms is made. Problems that arise in routing are treated, each presented in different scenarios in order to obtain a result in comparing different topologies. The comparison analysis is pursuing obtaining a result over the performance of the network. In order to measure performance, the costs of a network and the delays are aimed. After that, the topology effect is presented. In matter of performance, topology and blocking problems are strongly related. So an analysis of the blocking probability is also presented. As conclusions, solutions for the presented scenarios and also for other important scenarios are given. In all these algorithms the time problem was not yet consider until now, so the average execution time is finally analyzed. Key-Words: - multicast, unicast, routing algorithm, evaluation, traffic, topology, cost, delay, capacity, load, execution time. 1 Introduction The majority of concerns in evaluating routing algorithms’ performance are concentrated over the cost and/or delay of a single route in a network with low traffic. In real networks, multimedia sessions are generated, routed, transmitted in the network for a certain period of time and then terminated so the fundamental measure for performance in this case is the probability that the session will get blocked (that is the probability that the routing algorithm will not have resources to accept the session). This measure cannot be deducted only from cost and delay, but also from the blocking point of view. That is why, evaluations for different existing routing algorithms in dynamic traffic conditions will be presented and compared from the blocking point of view. Another very important factor in the evaluation process is the network’s topology. Routing algorithms should be evaluated on a large number of network topologies. In the ideal case, the topologies used in evaluation should correspond to the needed networks. Because the examples space is limited, randomly generated topologies are usually used, taking care that these topologies should have the same properties as the already existing networks. As a result of this evaluation, some observations will be
presented about using the considered routing algorithms. Also, observations regarding the best manner to update the network’ traffic capacity are made. The algorithms evaluated in this paper are: 1. Existing algorithms. Can be categorized in :
• Shortest path algorithms: can be used with labels expressing either the delays or the costs of the connections. Here, we will note with SP/delay the shortest path algorithm using as labels the delays for the connections, and with SP/cost the costs of the connections.
• Minimum cost algorithms: for the evaluation, the heuristic KMB modified for oriented graphs will be used and denoted by KMB.
2. Optimal multicast routing algorithm: this one uses as parameters the relative size of costs and delays for multicast. For the evaluation, the following combinations are used: • Minimum cost, noted with optimal/cost • Minimum cost, with delay on the second
plan, will be noted with optimal/cost/delay. • Minimum delay, with the cost on the second
plan; will be noted with optimal/delay/cost.
WSEAS TRANSACTIONS on COMMUNICATIONS Dan Mancas, Ecaterina-Irina Manole, Nicu Enescu
ISSN: 1109-2742 1147 Issue 12, Volume 7, December 2008
2 Evaluation context When evaluating the algorithm, results from
other researchers where used as inputs. So, we will first present the others’ result as the
entry point in our research. After that, we will present the evaluation made in the research of this paper. 2.1 Others’ results: our entry point Many authors have treated the case of single multicast in a low traffic network. In these cases the performance measures have been the costs and the multicast delays. A comparison was made between delay based algorithms and minimum cost algorithms with the given conditions that the costs of the connection and the delay time have the same weight. The comparison was based on numerically evaluating the costs, the delays and the execution times for a single flow, on an low traffic network. For this evaluation, the NSFNet technology was used, but also randomly generated topologies for different complexity degrees [1]. The main conclusions in these cases were: 1. Generally, the algorithms that reduce the costs
have an execution time with one unit more than the delay reduction algorithms.
2. Differences for costs and delays between the evaluated algorithms are about 30-40%.
3. Results for NSFNet and the randomly generated topologies of the same dimension are the same [2].
In other studies of this problem, an algorithm was proposed for randomly generating networks that resemble with the actual ones. The main idea in the algorithm is that in the actual networks, the connections are between the nearer nodes more than between the distanced nodes. To generate these topologies, first the nodes are distributed randomly on a rectangular grid. Here, for each pair of nodes (u,v), a connection is introduced, with the probability :
⎥⎦⎤
⎢⎣⎡−
=α
βL
vudvuP ),(exp}),({ (1),
where α and β are in {0,1}, d(u,v) is the Euclidian distance between u and v, and L is the maximum distance between two nodes. β controls the degree of the grid while α controls the “short” connections density referenced to the “long” connections [3][4][5].
As a conclusion, Table 1 gathers the existing algorithms evaluated, but only heuristically. Unicast Multicast Unique flow
Shortest path algorithm
Shortest path algorithm Minimum cost algorithm
Multiple flow
Simplex n.a.
Table 1. Already existing routing algorithms 2.2 Overview of our evaluation In the context for the evaluation the following were taken into consideration:
• Traffic conditions, • Network’s parameters.
In this section both these conditions will be described. 2.2.1 Traffic conditions There is considered that all multicasts in a session are arriving and leaving in the same time.
The arrivals sessions are building a Poisson process, with λ rate, and the duration in time for the session is distributed exponentially, with a μ rate [5][6]. We presume that the sources and the destinations are distributed in a uniform manner in the network and that the set of destinations is fixed for session duration (for example, no destination is neither joining nor leaving the multicast during the session). In some cases, it is also considered the session routing problem with a single multicast in an low traffic network; this would correspond to a very small load λ/μ. There are taken into consideration the following session types:
• Single multicast sessions: Each session is composed by only one multicast, with a number of destinations randomly selected, uniformly from the interval 1 to nmax; nmax value is selected accordingly with the number of nodes in the evaluated network.
• Video conference sessions: Each session has P multicasts and corresponds to one videoconference with P participants. P is randomly selected between 2 and 4.
It is considered that all flows in a session need the same traffic capacity; the exact value depends on the evaluation’s scenario taken into consideration.
WSEAS TRANSACTIONS on COMMUNICATIONS Dan Mancas, Ecaterina-Irina Manole, Nicu Enescu
ISSN: 1109-2742 1148 Issue 12, Volume 7, December 2008
It is also presumed that the blocked sessions are lost, and the main performance measure is the network’s blocking probability. Given the traffic characteristics, it is defined the network’s capacity for a certain blocking probability, being the load (λ/μ) for which this blocking probability was achieved. 2.2.2 Network’s parameters The network model is characterized by the following parameters: Size: number of nodes (N) and connections (K) in the network Topology: the model of interconnections between the nodes and connections. All considered connections in this paper are composed of full-duplex connections. Connection’s parameters: The cost, delays and connections capacities. For this evaluation it is presumed that all the connections have the equal capacity so that all capacities can be considered equal to 1. More than that, all connections’ costs are also set to 1; so, the multicast’s cost is proportionally with its own usage of the network. For the networks topology there are used:
• Topologies extracted from existent networks • Randomly generated topologies
For the randomly generated topologies, the nodes are randomly distributed on a rectangle, and the connections’ delays are set to the Cartesian distance between the limit points of the connection. For this evaluation, there are considered the nodes placed on a rectangle on which sides the delays are of 15 ms respectively 10 ms. More than that, we are only analyzing randomly generated topologies that are closely connected. There are considered the following randomly generated topologies:
• Completely randomly generated topologies: the nodes are randomly interconnected.
• Randomly generated topologies, short connections: In the “actual” networks, connections seem to exist more between nearer nodes than between distant nodes. In the case of this topology, the connections can realize the connecting of neared nodes.
• Double connection topologies: there must be at least two flows for each pair of nodes.
The existent networks are usually double connected.
3 Evaluating the network In this section there will be presented two evaluations:
• First one, for the cost and delays • Second one, for the topology effect • After that, a particular case of algorithm and
the characteristics of its performances are presented. Results are influenced by the traffic, as it is shown later on.
3.1 Evaluating cost and delays for unique multicast In this paragraph, there will be evaluated the cost and the delays for different algorithms in a single multicast session, routed in an low traffic network. This environment was realized in the majority of formal studies in the domain. There will be presented only one scenario and the evaluation will be made in order to compare the results for cost/delay of the optimal routing multicast algorithm.
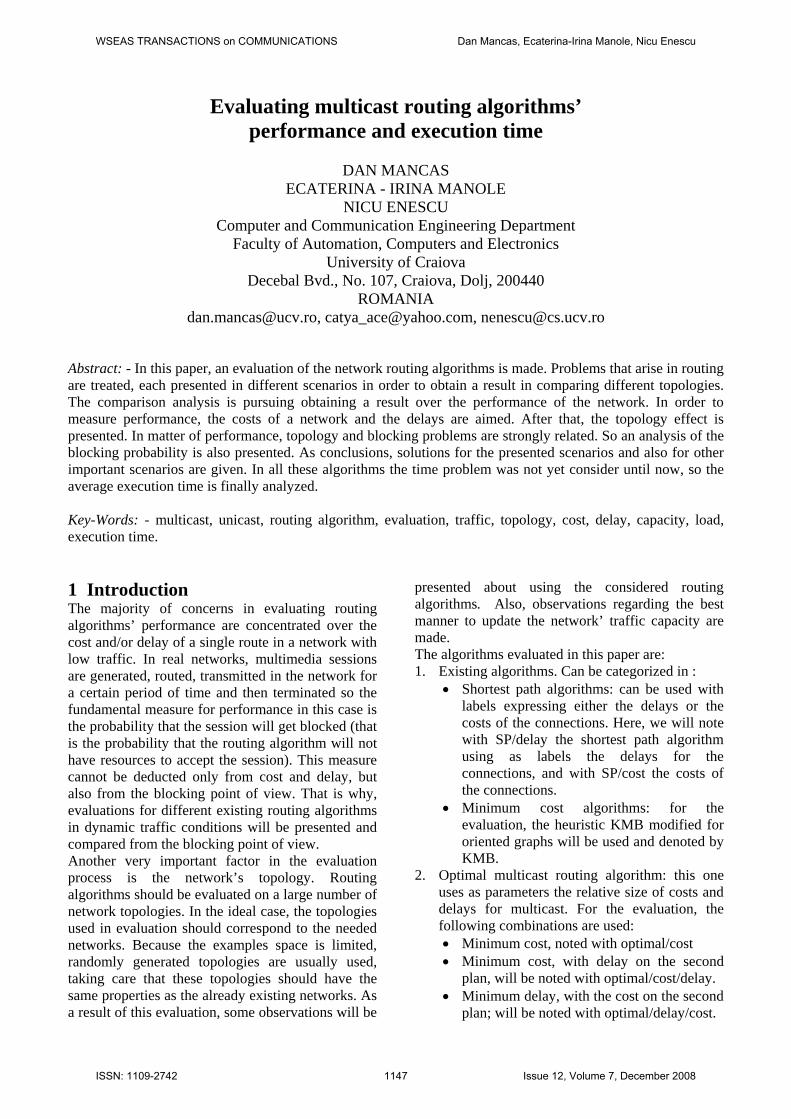
Fig. 1. The backbone used in the evaluation The network for which this evaluation was made is presented in Fig. 1 and represents a simplified version of the NSFNet backbone. The numbers associated with the connections represent the delays for propagating the signals through the connection, given in milliseconds. The connections’ costs are set to 1, which makes the multicast’s cost equal with the network’s traffic usage capacity. It will be observed, as it was expected, that the value of the cost obtained using KMB algorithm is very close to the optimal one. The costs for the paths calculated by algorithms that reduce delay are with 0.5 to 1 node bigger than the optimal, and the difference is amplified as the destinations’ number is increasing.
WSEAS TRANSACTIONS on COMMUNICATIONS Dan Mancas, Ecaterina-Irina Manole, Nicu Enescu
ISSN: 1109-2742 1149 Issue 12, Volume 7, December 2008
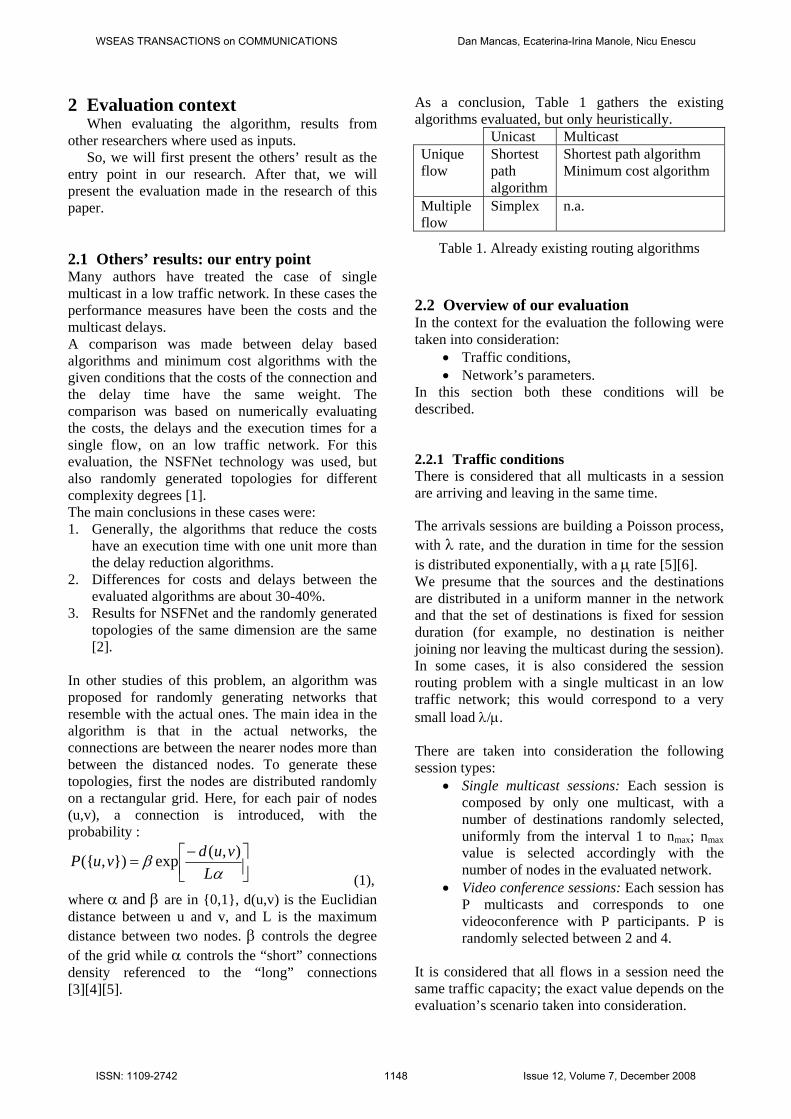
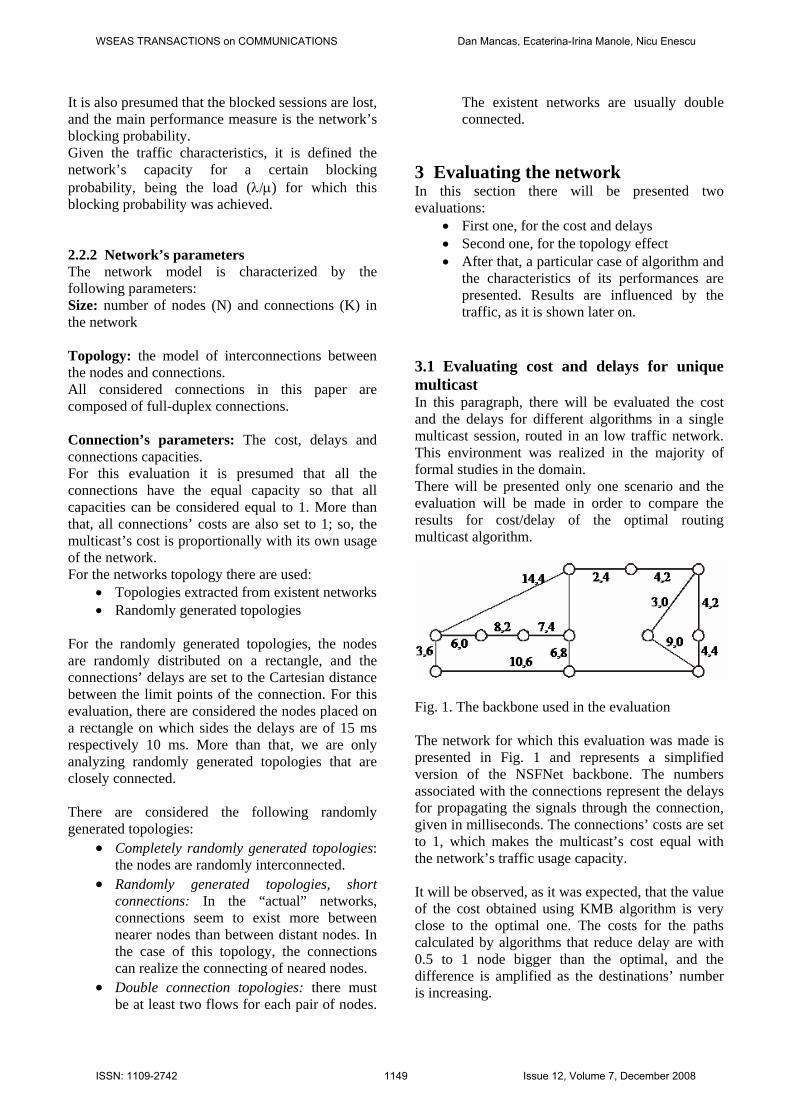
In the next figure, Fig. 2, there is represented the medium cost given in traversed nodes for a single multicast, as a function of the number of destinations, for different multicast routing algorithms. In Fig.3, it is represented the delay as a function of destinations number in the same scenario. It is observed that when there are compared more solutions, a small benefit in the cost of minimum cost appears compared to the minimum delay. For example, for a multicast with 9 destinations, the cost difference between the shortest path and the KMB algorithms is for about 1 node, for a total cost of 9 nodes, or 11%, while the delay difference is of 9 ms for a total delay of 23 ms that is a 39%.
0
2
4
6
8
10
12
2 3 4 5 6 7 8 9
destinasions' number
cost
(hop
s)
optimal/cost/delayKMBoptimal/delay/cost
SP/delay Fig. 2. Unique multicast session. The cost of the multicast flow related to the number of destinations, 100 paths / point It has to be noted the fact that the cost/delay results cannot be used directly to predict the network’s performance in a dynamic environment, where the sessions compete to obtain resources. Generally, the reduced cost is a desired property, because the paths with lower costs will use less
network resources and reduce the probability that a following session will be blocked, with the price of a bigger delay.
10
12
14
16
18
20
22
24
26
28
30
32
34
2 3 4 5 6 7 8 9
destinations' number
dela
y (m
s)
optimal/cost/delay
KMB
optimal/delay/cost
Fig. 3. Multicast flow delay as a function of destinations number, 100 paths / point In addition, it is necessary to make a numerical estimation of the routing algorithms in these environments, by determining the blocking probability of a session and the network’s capacity. 3.2 Evaluating the topology effects In this paragraph, the topology effects will be presented. One of the objectives is to evaluate the algorithms in a real network scenario. The existing networks are usually with double connection, and the connections seem to be realized more between the nearer nodes and less in the distanced ones. For example, they strive for the short connections. In order to evaluate the effect of the topology type in results, first we consider the multicast routing problem in a low traffic network.
WSEAS TRANSACTIONS on COMMUNICATIONS Dan Mancas, Ecaterina-Irina Manole, Nicu Enescu
ISSN: 1109-2742 1150 Issue 12, Volume 7, December 2008
We have the following preconditions: Network:
• Simplified backbone, as in Fig. 1. • Double connection topologies, randomly
generated • Randomly generated topologies, striving to
short connections • Completely randomly generated topologies
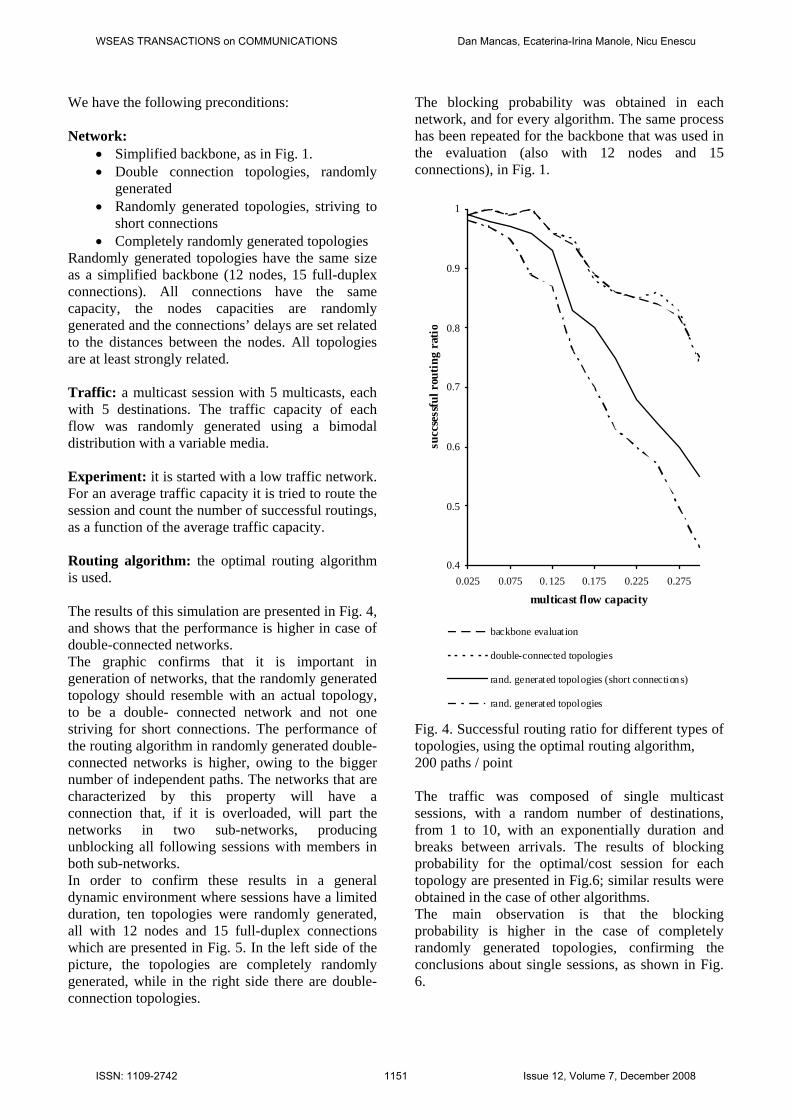
Randomly generated topologies have the same size as a simplified backbone (12 nodes, 15 full-duplex connections). All connections have the same capacity, the nodes capacities are randomly generated and the connections’ delays are set related to the distances between the nodes. All topologies are at least strongly related. Traffic: a multicast session with 5 multicasts, each with 5 destinations. The traffic capacity of each flow was randomly generated using a bimodal distribution with a variable media. Experiment: it is started with a low traffic network. For an average traffic capacity it is tried to route the session and count the number of successful routings, as a function of the average traffic capacity. Routing algorithm: the optimal routing algorithm is used. The results of this simulation are presented in Fig. 4, and shows that the performance is higher in case of double-connected networks. The graphic confirms that it is important in generation of networks, that the randomly generated topology should resemble with an actual topology, to be a double- connected network and not one striving for short connections. The performance of the routing algorithm in randomly generated double-connected networks is higher, owing to the bigger number of independent paths. The networks that are characterized by this property will have a connection that, if it is overloaded, will part the networks in two sub-networks, producing unblocking all following sessions with members in both sub-networks. In order to confirm these results in a general dynamic environment where sessions have a limited duration, ten topologies were randomly generated, all with 12 nodes and 15 full-duplex connections which are presented in Fig. 5. In the left side of the picture, the topologies are completely randomly generated, while in the right side there are double-connection topologies.
The blocking probability was obtained in each network, and for every algorithm. The same process has been repeated for the backbone that was used in the evaluation (also with 12 nodes and 15 connections), in Fig. 1.
0.4
0.5
0.6
0.7
0.8
0.9
1
0.025 0.075 0.125 0.175 0.225 0.275
multicast flow capacity
succ
sess
ful r
outi
ng r
atio
backbone evaluat ion
double-connected topologies
rand. generated topologies (short connections)
rand. generated topologies
Fig. 4. Successful routing ratio for different types of topologies, using the optimal routing algorithm, 200 paths / point The traffic was composed of single multicast sessions, with a random number of destinations, from 1 to 10, with an exponentially duration and breaks between arrivals. The results of blocking probability for the optimal/cost session for each topology are presented in Fig.6; similar results were obtained in the case of other algorithms. The main observation is that the blocking probability is higher in the case of completely randomly generated topologies, confirming the conclusions about single sessions, as shown in Fig. 6.
WSEAS TRANSACTIONS on COMMUNICATIONS Dan Mancas, Ecaterina-Irina Manole, Nicu Enescu
ISSN: 1109-2742 1151 Issue 12, Volume 7, December 2008
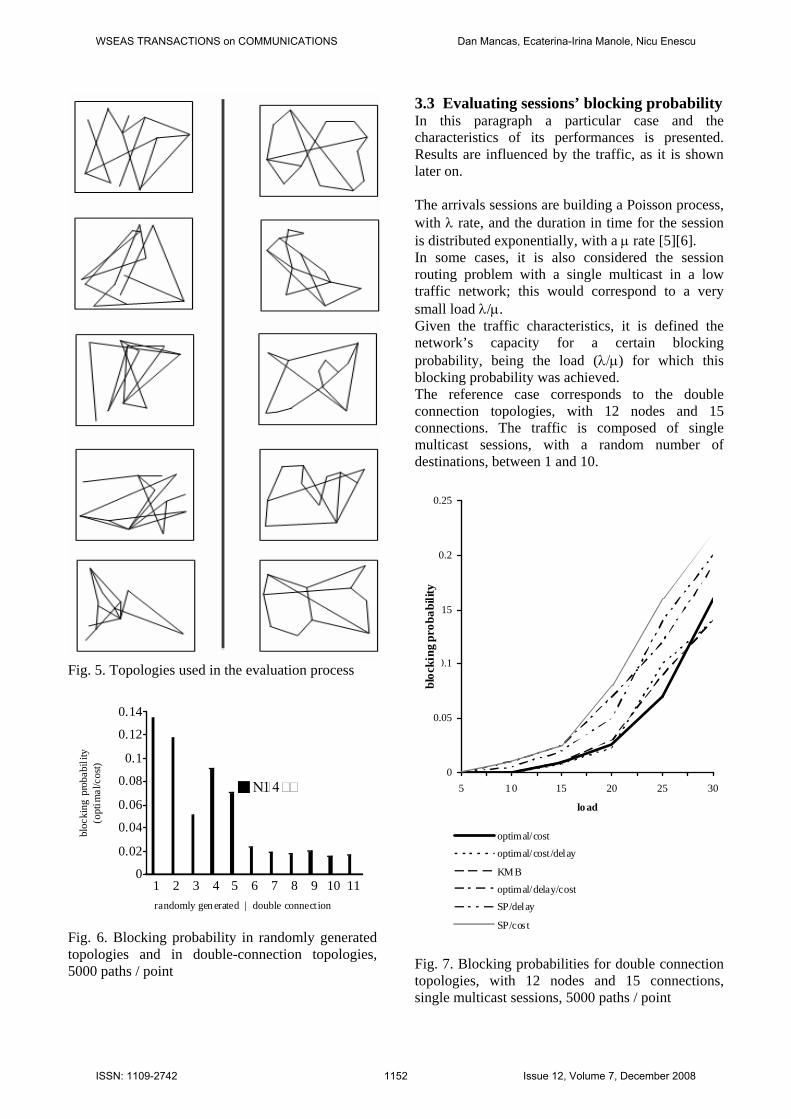
Fig. 5. Topologies used in the evaluation process
0
0.02
0.04
0.06
0.08
0.1
0.12
0.14
bloc
king
pro
babi
lity
(opt
imal
/cos
t)
1 2 3 4 5 6 7 8 9 10 11randomly gen erated | double connect ion
Ν14
Fig. 6. Blocking probability in randomly generated topologies and in double-connection topologies, 5000 paths / point
3.3 Evaluating sessions’ blocking probability In this paragraph a particular case and the characteristics of its performances is presented. Results are influenced by the traffic, as it is shown later on. The arrivals sessions are building a Poisson process, with λ rate, and the duration in time for the session is distributed exponentially, with a μ rate [5][6]. In some cases, it is also considered the session routing problem with a single multicast in a low traffic network; this would correspond to a very small load λ/μ. Given the traffic characteristics, it is defined the network’s capacity for a certain blocking probability, being the load (λ/μ) for which this blocking probability was achieved. The reference case corresponds to the double connection topologies, with 12 nodes and 15 connections. The traffic is composed of single multicast sessions, with a random number of destinations, between 1 and 10.
0
0.05
0.1
0.15
0.2
0.25
5 10 15 20 25 3
lo ad
0
bloc
king
pro
babi
lity
optimal/costoptimal/cost /delay
KMBoptimal/delay/costSP/delay
SP/cos t
Fig. 7. Blocking probabilities for double connection topologies, with 12 nodes and 15 connections, single multicast sessions, 5000 paths / point
WSEAS TRANSACTIONS on COMMUNICATIONS Dan Mancas, Ecaterina-Irina Manole, Nicu Enescu
ISSN: 1109-2742 1152 Issue 12, Volume 7, December 2008

0
0.02
0.04
0.06
0.08
0.1
0.12
0.14
0.16
0.18
0.2
5 10 15 20 25 3
load
blob
king
pro
babi
lity
0
optimal/cost
optimal/cost/delay
KMB
optimal/delay/cost
SP/delay
SP/cost
Fig. 8. Blocking probability, single multicast, 5000 paths / point The sessions are arriving according to the Poisson process and are staying in the network for an exponential period of time. Each flux needs 10% of the traffic capacity, without any restraints regarding latency. In Fig. 7 the blocking probability is shown, computed for a large number of topologies with double connection, as a function of the given load (λ/μ) for all the algorithms. In the figure it is shown, as expected, that the blocking probability for the cost algorithms (optimal/cost, optimal/cost/delay) it is smaller than the one for the delay based algorithms (optimal/delay, SP/cost, SP/delay). In the case of a 1% blocking probability, the network capacity for this traffic scenario is of approximately 17 for cost based algorithms, and 13 for delay based algorithms. In the case of a 10% blocking probability, the values are 25 and 22 respectively. The same steps are made for another randomly generated topology and the same results
are obtained, but the difference between the two algorithms is clearer. The results in this case are presented in Fig. 8. When there are more multicasts with different number of destinations in a network it is expected that the blocking probability will be bigger for the multicasts with a bigger number of destinations. In Fig. 9 the blocking probability is represented as a function of the number of destinations, with different load values for the optimal/cost algorithm. Fig. 9 shows that for small load, the blocking probability is a function dependent of the number of destinations. Even for bigger loads, the blocking probability ratio for multicasts with 10 destinations and unicasts (only one destination) is between 2 and 3. The figures for the other algorithms are similar.
0
0.02
0.04
0.06
0.08
0.1
0.12
0.14
0.16
0.18
0.2
1 2 3 4 5 6 7 8 9 10
destinations number
bloc
king
pro
babi
lity
0 28
0 28
0 28
0 28
Fig. 9. Blocking probability as a number of destinations for multicasts, optimal/cost algorithm, 10 000 paths / point
WSEAS TRANSACTIONS on COMMUNICATIONS Dan Mancas, Ecaterina-Irina Manole, Nicu Enescu
ISSN: 1109-2742 1153 Issue 12, Volume 7, December 2008
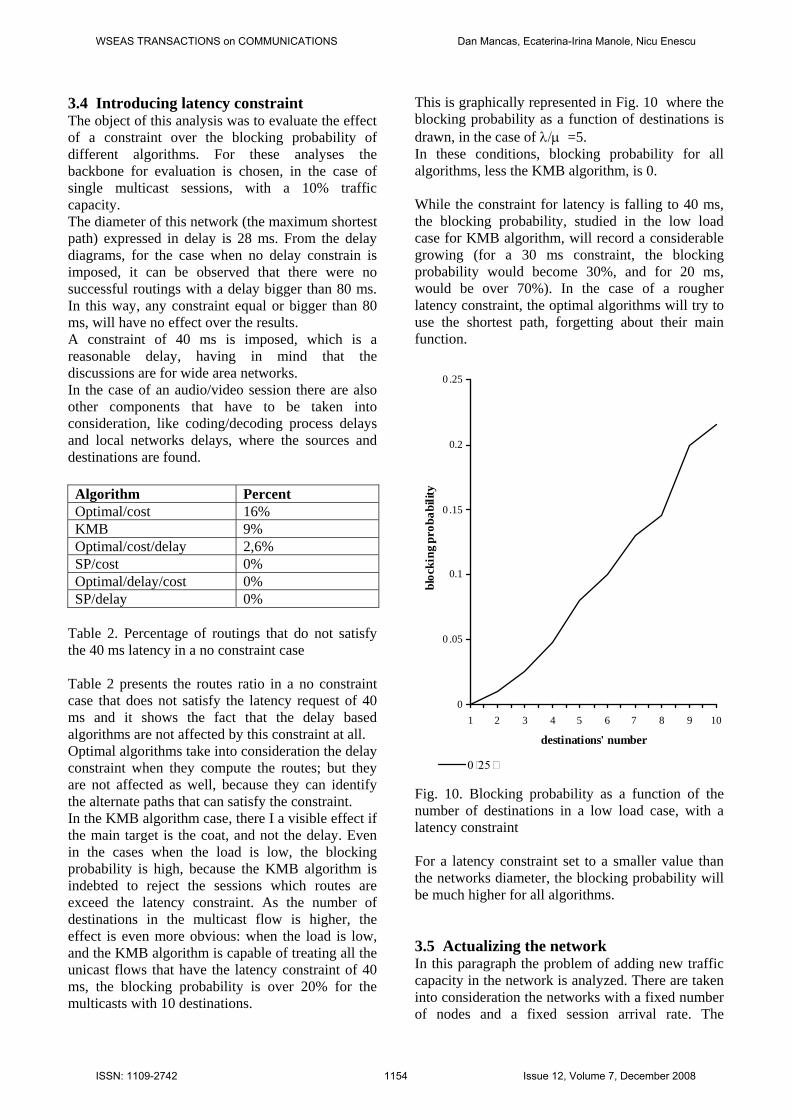
3.4 Introducing latency constraint The object of this analysis was to evaluate the effect of a constraint over the blocking probability of different algorithms. For these analyses the backbone for evaluation is chosen, in the case of single multicast sessions, with a 10% traffic capacity. The diameter of this network (the maximum shortest path) expressed in delay is 28 ms. From the delay diagrams, for the case when no delay constrain is imposed, it can be observed that there were no successful routings with a delay bigger than 80 ms. In this way, any constraint equal or bigger than 80 ms, will have no effect over the results. A constraint of 40 ms is imposed, which is a reasonable delay, having in mind that the discussions are for wide area networks. In the case of an audio/video session there are also other components that have to be taken into consideration, like coding/decoding process delays and local networks delays, where the sources and destinations are found.
Table 2. Percentage of routings that do not satisfy the 40 ms latency in a no constraint case Table 2 presents the routes ratio in a no constraint case that does not satisfy the latency request of 40 ms and it shows the fact that the delay based algorithms are not affected by this constraint at all. Optimal algorithms take into consideration the delay constraint when they compute the routes; but they are not affected as well, because they can identify the alternate paths that can satisfy the constraint. In the KMB algorithm case, there I a visible effect if the main target is the coat, and not the delay. Even in the cases when the load is low, the blocking probability is high, because the KMB algorithm is indebted to reject the sessions which routes are exceed the latency constraint. As the number of destinations in the multicast flow is higher, the effect is even more obvious: when the load is low, and the KMB algorithm is capable of treating all the unicast flows that have the latency constraint of 40 ms, the blocking probability is over 20% for the multicasts with 10 destinations.
This is graphically represented in Fig. 10 where the blocking probability as a function of destinations is drawn, in the case of λ/μ =5. In these conditions, blocking probability for all algorithms, less the KMB algorithm, is 0. While the constraint for latency is falling to 40 ms, the blocking probability, studied in the low load case for KMB algorithm, will record a considerable growing (for a 30 ms constraint, the blocking probability would become 30%, and for 20 ms, would be over 70%). In the case of a rougher latency constraint, the optimal algorithms will try to use the shortest path, forgetting about their main function.
0
0 .05
0.1
0 .15
0.2
0 .25
1 2 3 4 5 6 7 8 9 10
destinations' number
bloc
king
pro
babi
lity
0 25
Fig. 10. Blocking probability as a function of the number of destinations in a low load case, with a latency constraint For a latency constraint set to a smaller value than the networks diameter, the blocking probability will be much higher for all algorithms. 3.5 Actualizing the network In this paragraph the problem of adding new traffic capacity in the network is analyzed. There are taken into consideration the networks with a fixed number of nodes and a fixed session arrival rate. The
Algorithm Percent Optimal/cost 16% KMB 9% Optimal/cost/delay 2,6% SP/cost 0% Optimal/delay/cost 0% SP/delay 0%
WSEAS TRANSACTIONS on COMMUNICATIONS Dan Mancas, Ecaterina-Irina Manole, Nicu Enescu
ISSN: 1109-2742 1154 Issue 12, Volume 7, December 2008

capacity of the network is increased by adding new connections and the blocking probability decreasing is analyzed. Fig. 11 presents the blocking probability for double connection networks with 6 nodes, in the conditions when the full-duplex connections vary from 6 (ring topologies) to 15 (complete connection topologies). The figure shows the fact that blocking probabilities for cost based algorithms (optimal/cost, optimal/cost/delay and KMB) are smaller than the ones for delay based algorithms(SP/delay, SP/cost and optimal/delay/cost). The curve representing the relation between the blocking probability and the number of connections is concave and has two distinct regions:
• The high blocking region, where an increase of the connections’ number has as consequence an obvious linear decrease of the blocking probability;
• The low blocking region, where the network is capable of transporting almost all the traffic, and adding a new connection has a reduced effect.
0
0.05
0.1
0.15
0.2
0.25
0.3
0.35
6 7 8 9 10 11 12 13 14 15number of destinations
bloc
king
pro
babi
lity
Delay based algorithms
Cost based algorithms
Fig. 11. Networks with 6 nodes, variable number of connections for a constant session arrival rate; destinations’ number varies from 1 to 4, 15 000 paths / point
0.15
0.2
0.25
0.3
0.35
0.4
0.45
12 13 14 15 16 17 18
full-duplex connections' number
bloc
king
pro
babi
lity
0 45
Delay based algorithms
Cost based algorithms
Fig. 12. Networks with 12 nodes, a variable number of connections, session arrival rate is constant; destination number between 1 and 10 (20 000 paths / point)
0
0.1
0.2
0.3
0.4
0.5
0.6
0.7
0.8
0.9
50 75 100 125 150 175 200 225 250 275 300
full-duplex connections' number
bloc
king
pro
babi
lity
SP/delay
SP/cos t
KMB
Β=40
Fig. 13. Networks with 50 nodes, session arrival rate is constant; number of destinations is between 1 and 10 (15 000 paths / point)
WSEAS TRANSACTIONS on COMMUNICATIONS Dan Mancas, Ecaterina-Irina Manole, Nicu Enescu
ISSN: 1109-2742 1155 Issue 12, Volume 7, December 2008
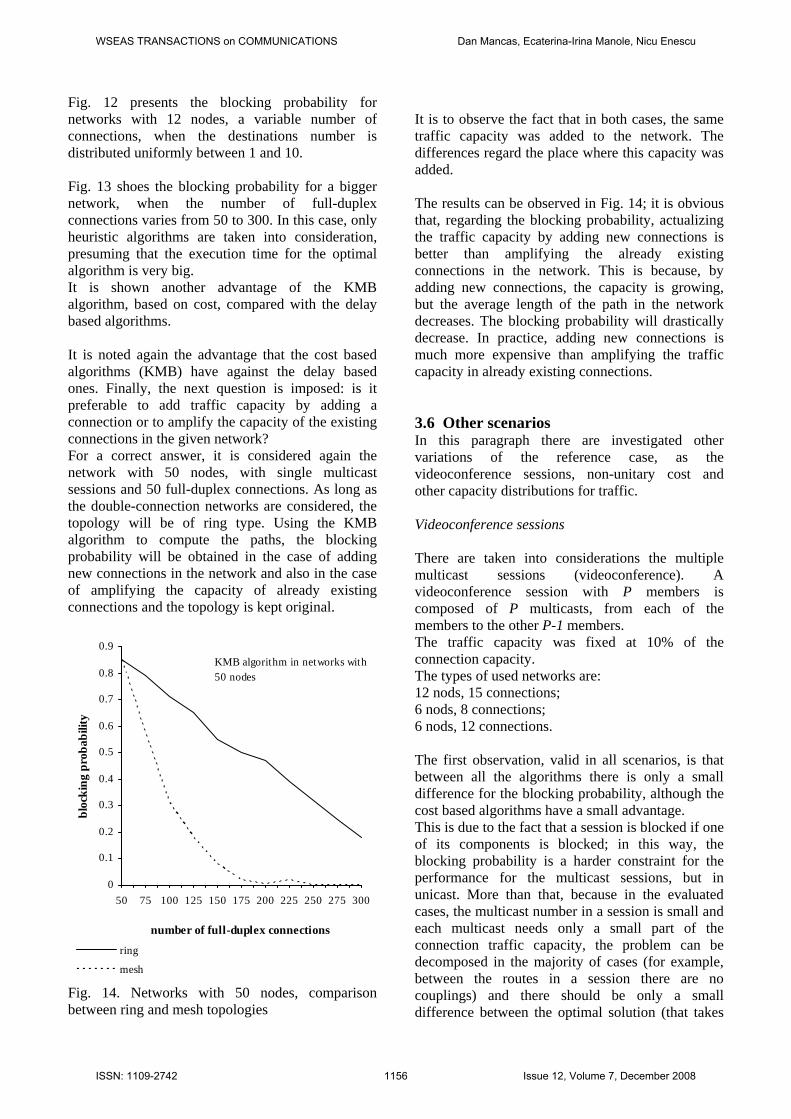
Fig. 12 presents the blocking probability for networks with 12 nodes, a variable number of connections, when the destinations number is distributed uniformly between 1 and 10. Fig. 13 shoes the blocking probability for a bigger network, when the number of full-duplex connections varies from 50 to 300. In this case, only heuristic algorithms are taken into consideration, presuming that the execution time for the optimal algorithm is very big. It is shown another advantage of the KMB algorithm, based on cost, compared with the delay based algorithms. It is noted again the advantage that the cost based algorithms (KMB) have against the delay based ones. Finally, the next question is imposed: is it preferable to add traffic capacity by adding a connection or to amplify the capacity of the existing connections in the given network? For a correct answer, it is considered again the network with 50 nodes, with single multicast sessions and 50 full-duplex connections. As long as the double-connection networks are considered, the topology will be of ring type. Using the KMB algorithm to compute the paths, the blocking probability will be obtained in the case of adding new connections in the network and also in the case of amplifying the capacity of already existing connections and the topology is kept original.
0
0.1
0.2
0.3
0.4
0.5
0.6
0.7
0.8
0.9
50 75 100 125 150 175 200 225 250 275 300
number of full-duplex connections
bloc
king
pro
babi
lity
ring
mesh
KMB algorithm in networks with 50 nodes
Fig. 14. Networks with 50 nodes, comparison between ring and mesh topologies
It is to observe the fact that in both cases, the same traffic capacity was added to the network. The differences regard the place where this capacity was added. The results can be observed in Fig. 14; it is obvious that, regarding the blocking probability, actualizing the traffic capacity by adding new connections is better than amplifying the already existing connections in the network. This is because, by adding new connections, the capacity is growing, but the average length of the path in the network decreases. The blocking probability will drastically decrease. In practice, adding new connections is much more expensive than amplifying the traffic capacity in already existing connections. 3.6 Other scenarios In this paragraph there are investigated other variations of the reference case, as the videoconference sessions, non-unitary cost and other capacity distributions for traffic. Videoconference sessions There are taken into considerations the multiple multicast sessions (videoconference). A videoconference session with P members is composed of P multicasts, from each of the members to the other P-1 members. The traffic capacity was fixed at 10% of the connection capacity. The types of used networks are: 12 nods, 15 connections; 6 nods, 8 connections; 6 nods, 12 connections. The first observation, valid in all scenarios, is that between all the algorithms there is only a small difference for the blocking probability, although the cost based algorithms have a small advantage. This is due to the fact that a session is blocked if one of its components is blocked; in this way, the blocking probability is a harder constraint for the performance for the multicast sessions, but in unicast. More than that, because in the evaluated cases, the multicast number in a session is small and each multicast needs only a small part of the connection traffic capacity, the problem can be decomposed in the majority of cases (for example, between the routes in a session there are no couplings) and there should be only a small difference between the optimal solution (that takes
WSEAS TRANSACTIONS on COMMUNICATIONS Dan Mancas, Ecaterina-Irina Manole, Nicu Enescu
ISSN: 1109-2742 1156 Issue 12, Volume 7, December 2008
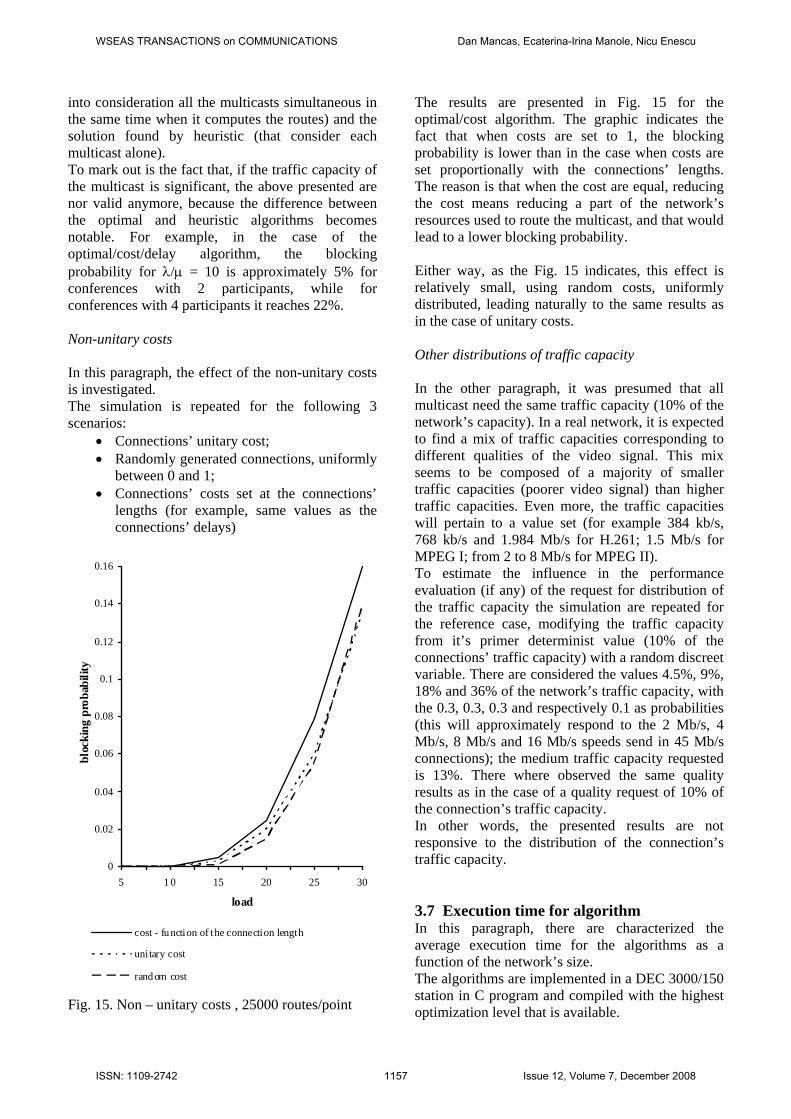
into consideration all the multicasts simultaneous in the same time when it computes the routes) and the solution found by heuristic (that consider each multicast alone). To mark out is the fact that, if the traffic capacity of the multicast is significant, the above presented are nor valid anymore, because the difference between the optimal and heuristic algorithms becomes notable. For example, in the case of the optimal/cost/delay algorithm, the blocking probability for λ/μ = 10 is approximately 5% for conferences with 2 participants, while for conferences with 4 participants it reaches 22%. Non-unitary costs In this paragraph, the effect of the non-unitary costs is investigated. The simulation is repeated for the following 3 scenarios:
• Connections’ unitary cost; • Randomly generated connections, uniformly
between 0 and 1; • Connections’ costs set at the connections’
lengths (for example, same values as the connections’ delays)
0
0.02
0.04
0.06
0.08
0.1
0.12
0.14
0.16
5 1 0 15 20 25 3
load
bloc
king
pro
babi
lity
0
cost - function of the connection length
unitary cost
rand om cost
Fig. 15. Non – unitary costs , 25000 routes/point
The results are presented in Fig. 15 for the optimal/cost algorithm. The graphic indicates the fact that when costs are set to 1, the blocking probability is lower than in the case when costs are set proportionally with the connections’ lengths. The reason is that when the cost are equal, reducing the cost means reducing a part of the network’s resources used to route the multicast, and that would lead to a lower blocking probability. Either way, as the Fig. 15 indicates, this effect is relatively small, using random costs, uniformly distributed, leading naturally to the same results as in the case of unitary costs. Other distributions of traffic capacity In the other paragraph, it was presumed that all multicast need the same traffic capacity (10% of the network’s capacity). In a real network, it is expected to find a mix of traffic capacities corresponding to different qualities of the video signal. This mix seems to be composed of a majority of smaller traffic capacities (poorer video signal) than higher traffic capacities. Even more, the traffic capacities will pertain to a value set (for example 384 kb/s, 768 kb/s and 1.984 Mb/s for H.261; 1.5 Mb/s for MPEG I; from 2 to 8 Mb/s for MPEG II). To estimate the influence in the performance evaluation (if any) of the request for distribution of the traffic capacity the simulation are repeated for the reference case, modifying the traffic capacity from it’s primer determinist value (10% of the connections’ traffic capacity) with a random discreet variable. There are considered the values 4.5%, 9%, 18% and 36% of the network’s traffic capacity, with the 0.3, 0.3, 0.3 and respectively 0.1 as probabilities (this will approximately respond to the 2 Mb/s, 4 Mb/s, 8 Mb/s and 16 Mb/s speeds send in 45 Mb/s connections); the medium traffic capacity requested is 13%. There where observed the same quality results as in the case of a quality request of 10% of the connection’s traffic capacity. In other words, the presented results are not responsive to the distribution of the connection’s traffic capacity. 3.7 Execution time for algorithm In this paragraph, there are characterized the average execution time for the algorithms as a function of the network’s size. The algorithms are implemented in a DEC 3000/150 station in C program and compiled with the highest optimization level that is available.
WSEAS TRANSACTIONS on COMMUNICATIONS Dan Mancas, Ecaterina-Irina Manole, Nicu Enescu
ISSN: 1109-2742 1157 Issue 12, Volume 7, December 2008
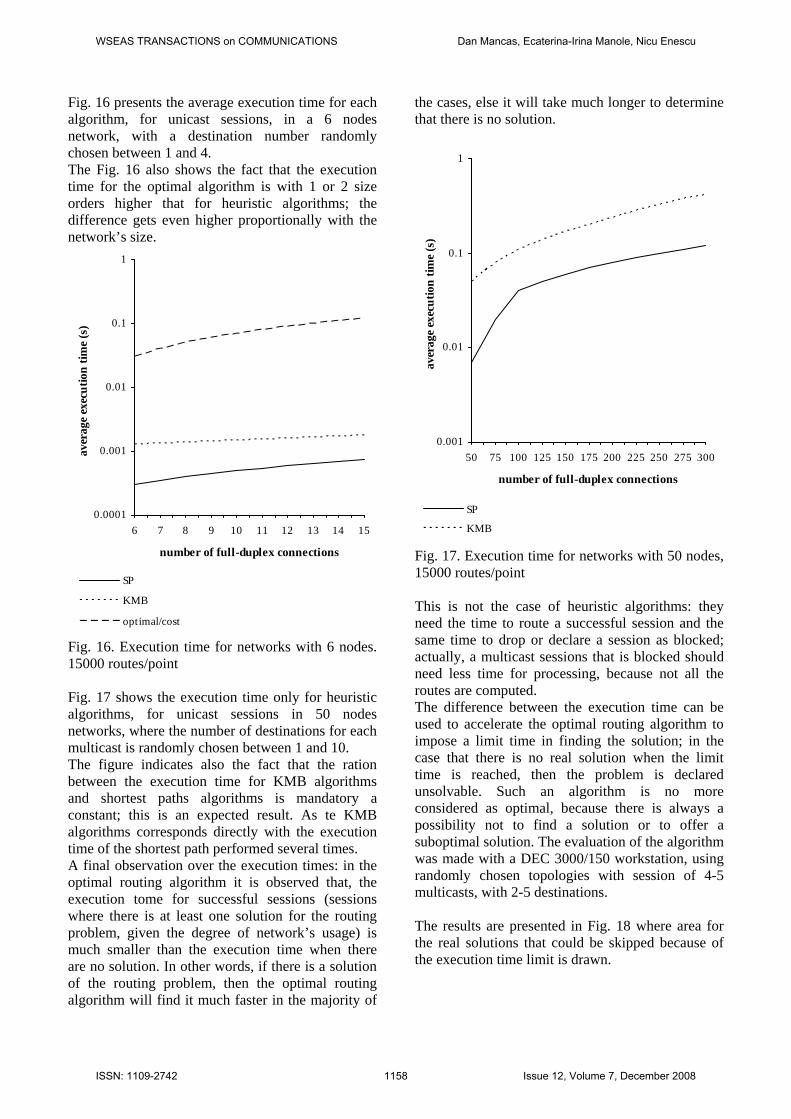
Fig. 16 presents the average execution time for each algorithm, for unicast sessions, in a 6 nodes network, with a destination number randomly chosen between 1 and 4. The Fig. 16 also shows the fact that the execution time for the optimal algorithm is with 1 or 2 size orders higher that for heuristic algorithms; the difference gets even higher proportionally with the network’s size.
0.0001
0.001
0.01
0.1
1
6 7 8 9 10 11 12 13 14 15
number of full-duplex connections
aver
age
exec
utio
n tim
e (s
)
SP
KMB
optimal/cost
Fig. 16. Execution time for networks with 6 nodes. 15000 routes/point Fig. 17 shows the execution time only for heuristic algorithms, for unicast sessions in 50 nodes networks, where the number of destinations for each multicast is randomly chosen between 1 and 10. The figure indicates also the fact that the ration between the execution time for KMB algorithms and shortest paths algorithms is mandatory a constant; this is an expected result. As te KMB algorithms corresponds directly with the execution time of the shortest path performed several times. A final observation over the execution times: in the optimal routing algorithm it is observed that, the execution tome for successful sessions (sessions where there is at least one solution for the routing problem, given the degree of network’s usage) is much smaller than the execution time when there are no solution. In other words, if there is a solution of the routing problem, then the optimal routing algorithm will find it much faster in the majority of
the cases, else it will take much longer to determine that there is no solution.
0.001
0.01
0.1
1
50 75 100 125 150 175 200 225 250 275 300
number of full-duplex connections
aver
age
exec
utio
n tim
e (s
)
SP
KMB
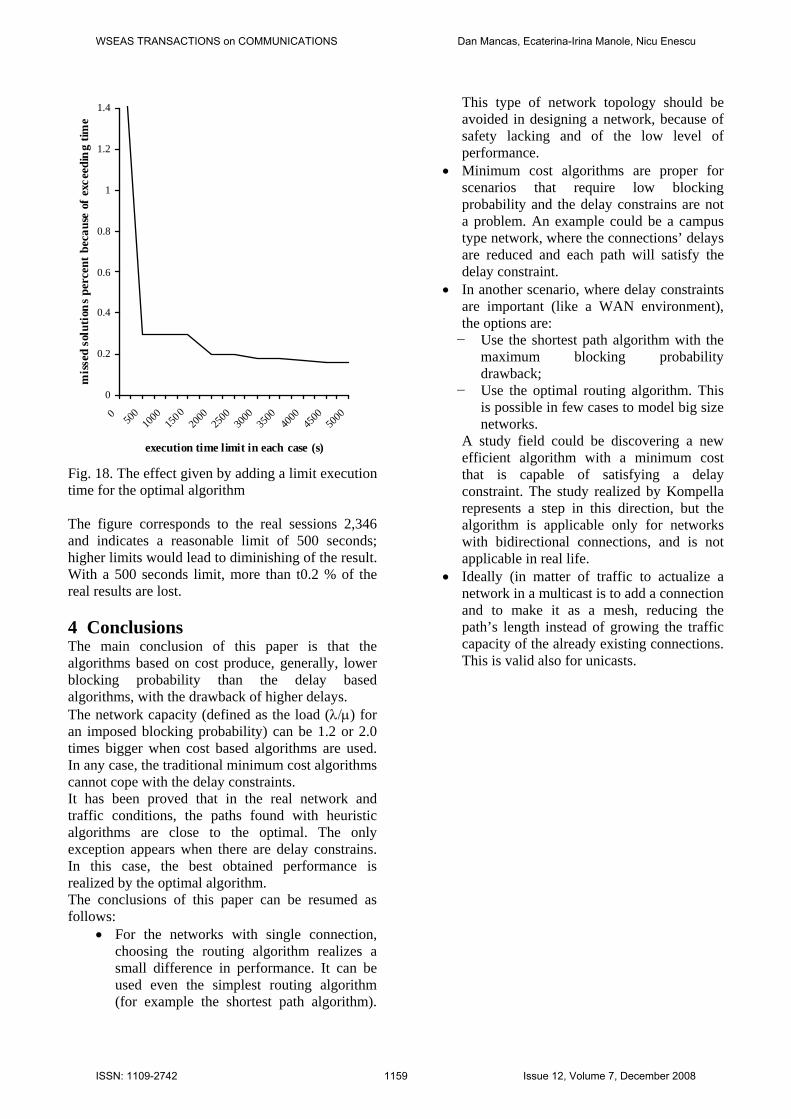
Fig. 17. Execution time for networks with 50 nodes, 15000 routes/point This is not the case of heuristic algorithms: they need the time to route a successful session and the same time to drop or declare a session as blocked; actually, a multicast sessions that is blocked should need less time for processing, because not all the routes are computed. The difference between the execution time can be used to accelerate the optimal routing algorithm to impose a limit time in finding the solution; in the case that there is no real solution when the limit time is reached, then the problem is declared unsolvable. Such an algorithm is no more considered as optimal, because there is always a possibility not to find a solution or to offer a suboptimal solution. The evaluation of the algorithm was made with a DEC 3000/150 workstation, using randomly chosen topologies with session of 4-5 multicasts, with 2-5 destinations. The results are presented in Fig. 18 where area for the real solutions that could be skipped because of the execution time limit is drawn.
WSEAS TRANSACTIONS on COMMUNICATIONS Dan Mancas, Ecaterina-Irina Manole, Nicu Enescu
ISSN: 1109-2742 1158 Issue 12, Volume 7, December 2008
0
0.2
0.4
0.6
0.8
1
1.2
1.4
0 500
1000
1500
2000
2500
3000
3500
4000
4500
5000
execution time limit in each case (s)
mis
sed
solu
tion
s pe
rcen
t be
caus
e of
exc
eedi
ng
time
Fig. 18. The effect given by adding a limit execution time for the optimal algorithm The figure corresponds to the real sessions 2,346 and indicates a reasonable limit of 500 seconds; higher limits would lead to diminishing of the result. With a 500 seconds limit, more than t0.2 % of the real results are lost. 4 Conclusions The main conclusion of this paper is that the algorithms based on cost produce, generally, lower blocking probability than the delay based algorithms, with the drawback of higher delays. The network capacity (defined as the load (λ/μ) for an imposed blocking probability) can be 1.2 or 2.0 times bigger when cost based algorithms are used. In any case, the traditional minimum cost algorithms cannot cope with the delay constraints. It has been proved that in the real network and traffic conditions, the paths found with heuristic algorithms are close to the optimal. The only exception appears when there are delay constrains. In this case, the best obtained performance is realized by the optimal algorithm. The conclusions of this paper can be resumed as follows:
• For the networks with single connection, choosing the routing algorithm realizes a small difference in performance. It can be used even the simplest routing algorithm (for example the shortest path algorithm).
This type of network topology should be avoided in designing a network, because of safety lacking and of the low level of performance.
• Minimum cost algorithms are proper for scenarios that require low blocking probability and the delay constrains are not a problem. An example could be a campus type network, where the connections’ delays are reduced and each path will satisfy the delay constraint.
• In another scenario, where delay constraints are important (like a WAN environment), the options are: − Use the shortest path algorithm with the
maximum blocking probability drawback;
− Use the optimal routing algorithm. This is possible in few cases to model big size networks.
A study field could be discovering a new efficient algorithm with a minimum cost that is capable of satisfying a delay constraint. The study realized by Kompella represents a step in this direction, but the algorithm is applicable only for networks with bidirectional connections, and is not applicable in real life.
• Ideally (in matter of traffic to actualize a network in a multicast is to add a connection and to make it as a mesh, reducing the path’s length instead of growing the traffic capacity of the already existing connections. This is valid also for unicasts.
WSEAS TRANSACTIONS on COMMUNICATIONS Dan Mancas, Ecaterina-Irina Manole, Nicu Enescu
ISSN: 1109-2742 1159 Issue 12, Volume 7, December 2008