electrocatalytic properties of bimetallic surfaces for the
TRANSCRIPT

Int. J. Electrochem. Sci., 7 (2012) 8940 - 8957
International Journal of
ELECTROCHEMICAL SCIENCE
www.electrochemsci.org
Electrocatalytic Properties of Bimetallic Surfaces for the
Oxygen Reduction Reaction
A.Ezeta-Mejía1, O.Solorza-Feria
2, H.J.Dorantes-Rosales
1, J.M.Hallen López
1, E.M.Arce-Estrada
1,*
1 Instituto Politécnico Nacional. ESIQIE. Depto. de Ingeniería en Metalurgia y Materiales, UPALM
Ed. 7, 07738, México D.F., México. 2Centro de Investigación y de Estudios Avanzados del IPN. Depto. de Química, A. Postal 14-740,
07360 México D.F., México *e-mail: [email protected]
Received: 20 February 2012 / Accepted: 14 March 2012 / Published: 1 September 2012
The physical characterization of nanocrystalline RuM (M=Se,Mo,W,Sn) prepared by mechanical
alloying (MA) technique at different milling times shows the formation of mixture of phases (FeSe2,
Fe2O3, Ru and Se), solid solution (Ru and Mo), Ru3W2 and RuSn2 intermetallic compounds with
nanocrystalline nature of 2 to 20 nm in size. The activity of the nanocatalysts supported on Vulcan
carbon was investigated by rotating disk electrode for the oxygen reduction reaction (ORR) in 0.5
H2SO4. Results reveal improved specific activities toward the ORR with multielectron transfer process
(n=4e-) to water formation. The effect of temperature on the ORR kinetics was also investigated,
concluding that the Tafel slope is temperature invariant while the transfer coefficient shows important
dependence.
Keywords: Electrocatalyst; Oxygen reduction; Ruthenium; Mechanical alloying
1. INTRODUCTION
Electrocatalyst nanotechnology is an interesting area of research which opens up new
possibilities for applications of a diversity of synthesized novel materials for the renewable energy
sector. Most of the research in nanomaterials is performed on dispersed or supported powders which
contains nanoparticles. Oxygen reduction reaction (ORR) has been intensively investigated from a
fundamental as well as from a practical point of view. The impact of the oxygen reduction reaction on
fuel cells, metal-air batteries and materials degradation as oxygen-consuming cathodes or in water
electrolysis as oxygen-electrogenerator anode put in evidence its importance [1-2]. There have been

Int. J. Electrochem. Sci., Vol. 7, 2012
8941
great efforts to develop novel, inexpensive, more active and stable nanocatalysts for the oxygen
reduction reaction because one of mayor problems is the irreversible and its large overpotential
required to reaction occur, it leads for example, to a significant loss on efficiency of the fuel cells.
ORR in platinum and platinum-based alloy electrodes has been widely studied because low
temperature fuel cell systems present a promising method of energy production [3-4] and more used
because of their high activity and stability in acid media [4]. Due the capital cost of platinum, it is
required to develop novels highly active and stable electrocatalysts for ORR. Considering that the fuel
cell efficiency is related with the catalyst activity, i.e., the size of its particles, density, geometry,
composition, dispersion and interaction with the support, it is of paramount important to control these
factors during the synthesis process. In the last years, research has been fundamental focused on the
development of two types of catalyst: catalysts based on heat treated carbon-supported iron or cobalt
compounds, whose active centers most probably consist of single metal centers coordinated by
nitrogen and carbon [5-7] or related to the preparation of carbon supported transition-metal
nanoparticles (mainly ruthenium), which surface is modified by a chalcogenide (i.e., selenium) or
clusters-like structures [8-12]. On the other hand, various metal phtalocyanines and porphyrins [13]
and metal oxides [14] have been reported to exhibit relevant ORR activity. Also, it was found that
carbon supported ruthenium nanoparticles also catalyze the ORR [15-17] in acid media, but with
limited activity that does not represent a viable alternative for technical applications. Recently, some
authors has been put in evidence that surface modification of ruthenium nanoparticles with selenium
[17-20] or molybdenum [17,21], tin [22] and tungsten [23] alters its electrochemical properties and
enhances the activity towards the oxygen reduction reaction.
The main interest of this work is to study the catalytic activity of RuM (M = Se,Mo,W,Sn)
catalysts, prepared by mechanical alloying to produce bimetallic nanoparticle materials in order to
enhance the ruthenium-based catalytic activity compared to ruthenium alone. The effect of temperature
on the ORR kinetic constitutes also part of this work.
2. EXPERIMENTAL PROCEDURE
2.1 Chemicals and reagents
Ru, Se, Mo, W and Sn powders were reagents from Aldrich with 99.9 % nominal purity and <
74 m, < 149 m, < 10 m, < 10 m and < 44 m particle size, respectively and H2SO4 of high purity
was obtained from Aldrich.
2.2 Synthesis of RuM powders by AM
Preparation of the catalytic powders (RuM) was achieved by the mechanical alloying (MA)
technique. Ru and M (Se, Mo, W, Sn) with a ratio of 1:1, were introduced in a SPEX 8000 high-energy
ball mill using a stainless steel vials and steel balls to RuSe and RuMo and zirconium balls to RuW
Int. J. Electrochem. Sci., Vol. 7, 2012
8942
and RuSn, with a ball to powder ratio of 4:1. The surfactant agent was 1 wt % of methanol to RuSe and
RuMo and 1 wt % of isopropanol to RuW and RuSn, under inert atmosphere (argon, high purity). Vials
were rotated at 1200 rpm for a period of 20 and 40 h.
2.3 Physical characterization
The phase identification of the MA bimetallic powders was performed in the X-ray
Diffractometer (XRD) for powders using a D8 Focus Bruker AXS equipment with Cu Kα radiation.
The surface morphology was examined using a scanning electron microscope (SEM) in a JEOL JSM-
6300 operated at 20 kV equipped with an energy dispersive spectrometer, and the particle size
determined from transmission electron microscopy (TEM) analysis in a JEOL 2000-FXII operated at
200 kV.
The calculation to estimate the crystallite size of the dispersed RuM catalyst was based on the
broadening of RuM reflection peaks, following the Scherrer´s equation [22].
cosB
kD (1)
Where D is the mean particle size in Å, k is a coefficient taken here as 0.9, the wavelength of
the X-rays used (1.540546 Å), B the width of the diffraction peak at half height in radians, and the
angle at the position of the peak maximum.
2.4 Electrode preparation for RDE study and electrochemical set-up
Rotating disk electrode, RDE, technique was used for electrochemical characterization. A
vitreous carbon rod with a 5 mm diameter (cross-sectional area of 0.1963 cm2) was inserted under
pressure within a cylindrical Teflon support. The exposed surface of vitreous carbon was grinded with
400 and 600 emery papers to adhere the electrocatalyst ink. The ink was prepared by mixing 1 mg of
each synthesized electrocatalysts with 0.4 mg of Vulcan carbon, 12 l of Nafion® and 0.3 ml of
ethanol. The mixture was set under ultrasonic treatment to form a homogeneous suspension; 5 l of
suspension were placed by means of a micropipette on the vitreous carbon support, forming a
homogeneous thin film. The prepared electrode was dried for 24 h at room temperature.
2.5 Experimental setup
The electrochemical measurements were performed in a conventional three-electrode cell (50
ml). A platinum stick was used as the counter electrode. The reference electrode was a saturated
calomel electrode (SCE) that was inserted separately in a compartment lodging of a Luggin capillary
and was place outside of the cell, kept at room temperature. All potentials were referred to the normal
hydrogen electrode (NHE). A 0.5 M H2SO4 aqueous solution was used as electrolyte, prepared with

Int. J. Electrochem. Sci., Vol. 7, 2012
8943
deionized water (18.6 Mcm). Prior to the electrochemical assessment and surface electrode activation
of the working electrode, the acid electrolyte was degassed with nitrogen of high purity. Thereafter, the
acid electrolyte was saturated with pure oxygen and maintained on the electrolyte surface during the
electrochemical experiments. The temperature of the cell was controlled by a thermostat (PolyScience)
from 293 to 333 K. The Cyclic Voltammetry (CV) and the Rotating Disk Electrode (RDE) studies were
performed with a potenciostat/galvanostat Autolab 30 and an EG&G PAR, model 636 rotation speed
controller. The cyclic voltammetry was performed in oxygen free electrolyte from open circuit
potential at a v = 50 mVs-1
for 40 cycles, enough time to reach stable voltammograms. Hydrodynamic
experiments were recorded in the performed in the O2 saturated electrolyte, in the range of rotation rate
of 100-1600 rpm at a v = 5 mVs-1
.
3. RESULTS AND DISCUSSIONS
3.1 Physicochemical characterization results
3.1.1 X-Ray Diffraction
Table 1. Phases and crystallite size determined by Scherrer´s equation of the electrocatalysts produced
by mechanical milling.
ELECTROCATALYSTS
MILLING TIME
PHASES CRYSTALLITE
SIZE (nm)
Ru-Se 20 h Ru 2-5
Se 4-12
Ru-Se 40 h Ru 10-20
Se 4-7
Fe2O3 6-11
FeSe2 4-9
Ru-Mo 20 h Ru 4-11
Ru-Mo 40 h Ru 3-13
Ru-W 20 h Ru 7-9
W 3-8
Ru-W 40 h Ru3W2 2-6
Ru-Sn 20 h Ru 6-20
Sn 7-25
RuSn2 5-9
Ru-Sn 40 h Ru 4-5
RuSn2 3-13
X-ray diffraction patterns of (A) RuSe, (B) RuMo, (C) RuW and (D) RuSn powder mixture at
0, 20 and 40 h of milling, are shown in Figure 1. It is observed at 0 h of milling in all patterns, a well
defined diffraction peaks corresponding to pure phase to each element. The X-ray diffraction patterns
of RuSe to 20 h of milling time, shows a slight displacement of Ru peaks, towards lower values new
peaks begin to appear in different positions. To 40 h of milling time, it is observed the formation of
homogeneous new phases formed with Fe, Se and oxygen, such as FeSe2 and Fe2O3, mainly formed in

Int. J. Electrochem. Sci., Vol. 7, 2012
8944
2 between 20° and 65º, and several peaks of Ru and one peak of Se. In this material, Se has a greater
affinity with Fe (came from the wear of the container and milling balls, inherent to the mechanical
alloying process) and FeSe2 is forming and Ru appears free. These phases were determined by EVA
V1.02 software from Bruker. X-ray diffraction pattern of RuMo to 20 h of milling time shows that the
Mo peaks disappeared which indicates that the Mo atoms entered Ru lattice. Peak displacement toward
lower 2 values, indicates the formation of a solid solution.
20 40 60 80 100
Re
lative
in
ten
sity (
a.u
)
2degrees)
RuSe 0h
RuSe 20h
RuSe 40h
Se
Ru
Fe2O
3
FeSe2
20 40 60 80 1000
20
40
60
80
100
120
140
160
180
500
1000
1500
2000
2500
3000
Re
lative
In
ten
sity (
u.a
)
2degree
Ru
Mo
RuMo 0 h
RuMo 20h
RuMo 40h
A B
20 40 60 80 100
Re
lative
In
ten
sity (
a.u
)
2degrees
W
Ru
RuW 0h
RuW 20h
RuW 40h 00
2
10
1
11
0
10
3
10
2 11
2
20
1
10
4
Ru3W
2
20 40 60 80 100 120
Rela
tive Inte
nsi
ty (
a.u
)
2degrees)
RuSn 40h
RuSn 20h
RuSn 0h
Ru
Sn
33
0
40
22
04
43
13
14
53
05
12
44
2
60
2
11
6 71
04
44
43
5 52
5
33
6
C D
Figure 1. XRD patterns: (A) RuSe, (B) RuMo, (C) RuW, (D) RuSn.
In the RuW, X- ray diffraction patterns showed that to 20 h of milling time, all the Ru peaks
disappear and for 40 h of milling time some new peaks appear corresponding to Ru3W2 intermetallic
compound, identified by EVA V1.02 software. X-ray diffraction pattern of RuSn to 20 h, shows a
decrease Ru and Sn peaks intensity and to 40 h of milling, new peaks appear corresponding to RuSn2
intermetallic compound also identified by EVA V1.02. In all systems broad peaks are observed with
lower intensity due to the reduction of crystallite size as a result of mechanical milling. The crystallite

Int. J. Electrochem. Sci., Vol. 7, 2012
8945
size was determined by Scherrer´s equation [24] and these results are reported in Table 1. In the RuSe
y RuMo catalysts a growth in the crystallite size between 20 and 40 h of milling time is observed
associated to an increase in lattice parameter by incorporation of iron atoms to the crystalline structure
of these systems. The crystallite size in the RuW catalyst decreased to 40 h milling time due to
hardness and brittleness of the Ru and W causing continuous particle fracture. To 20 and 40 h of
milling in the RuSn a regular size is observed because the Sn is very ductile and only deform without
breaking.
3.1.2 Scanning Electron Microscopy
At the early stages of milling, the components get flattened shapes which have been attributed
to a micro-forging process [25].
Figure 2. SEM micrographs of as synthesized particles of a) RuSe, b) RuMo, c) RuW, d) RuSn at 100
000X.
(b)
(c)
)
(d)
(a)

Int. J. Electrochem. Sci., Vol. 7, 2012
8946
Figure 2 shows SEM micrographs for (a) RuSe, (b) RuMo, (c) RuW, (d) RuSn catalyst after 40
h of milling. In these micrographs it is observed agglomerates between 7-22 µm and 12-30 µm for
RuSe and RuMo, respectively, formed by numerous granular morphology particles with sizes between
9–20 µm and 1-3 µm; these particles sizes are still much larger than the calculated crystallite size
(~14nm), indicating that the particles are nanocrystalline as commonly reported for metallic materials
produces by mechanical alloying [26]. The RuW and RuSn catalysts shows agglomerated particles
with irregular morphology of 8-23 m and 10-25 µm, respectively, formed by dispersed particles of 4-
8 m and 3-10 m, in that order.
3.1.3 Transmission Electron Microscopy
A
B
Figure 3. (a) Selected area electron diffraction patterns and (b) TEM dark field image: (A) RuSe, (B)
RuMo electrocatalysts to 40 h of milling.
50 nm
Int. J. Electrochem. Sci., Vol. 7, 2012
8947
Figure 3 shows the TEM images obtained for the (A) RuSe and (B) RuMo catalysts milled for
40 h where a heavily agglomerate material is observed by SEM in both catalysts. These agglomerates
are formed of nano-sized crystallites with a size about 7-30 nm for RuSe and 2-20 nm for RuMo.
Then, the milling process induced the formation of nanometric grain size [27]. The indexed selected
area of electron diffraction pattern confirmed the presence of different phases for RuSe and a solid
solution for RuMo, determined by XRD. For RuW and RuSn catalysts nano-sized crystallites of about
2-6 nm and 3-13 nm, respectively were observed, and the indexed electron diffraction pattern,
corresponding to Ru3W2 and RuSn2 intermetallic compounds.
3.2 Electrochemical evaluation results
3.2.1 Electrochemical study of oxygen reduction reaction
The activation process is required to restructure the materials electrode surface at atomic scale
in order to enhance the electrocatalytic properties by removing impurities and adsorbed molecular
oxygen on the electrode surface. The reported current density is referred to the geometric electrode
surface.
0.0 0.5 1.0 1.5
1.0
0.5
0.0
0.5
1.0
1.5
RuSe
RuMo
RuW
RuSn
j /
mA
cm
-2
E/V (NHE)
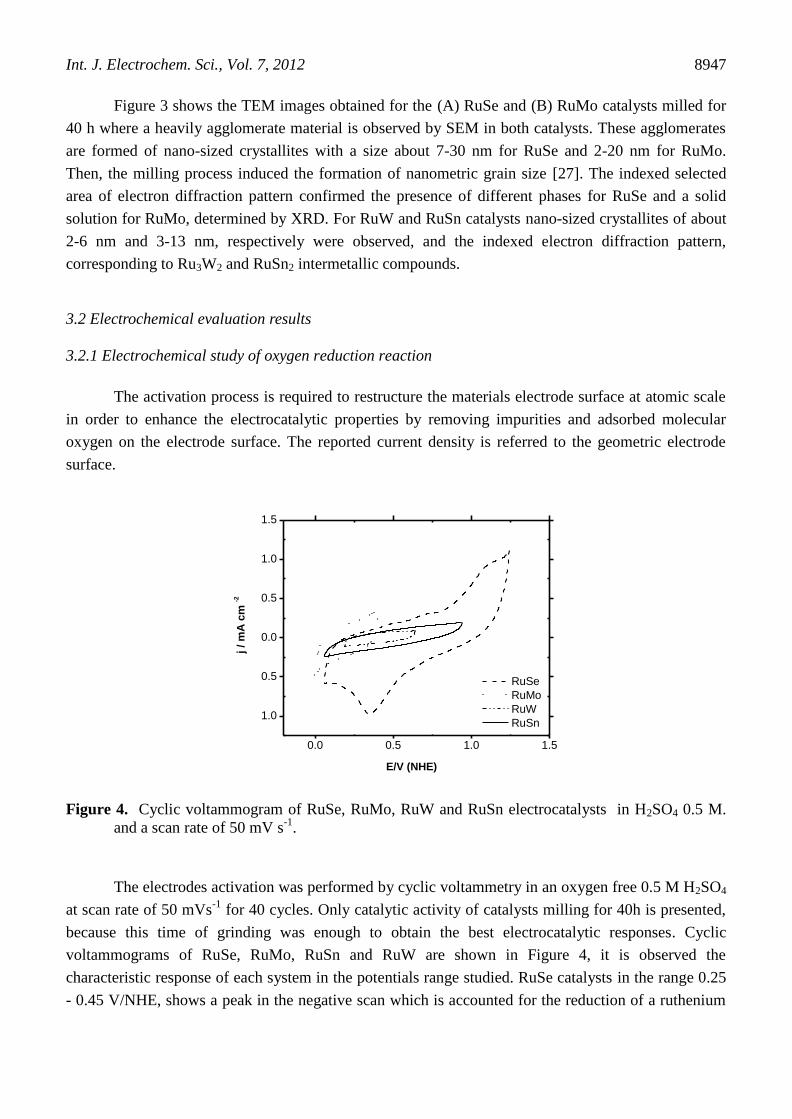
Figure 4. Cyclic voltammogram of RuSe, RuMo, RuW and RuSn electrocatalysts in H2SO4 0.5 M.
and a scan rate of 50 mV s-1
.
The electrodes activation was performed by cyclic voltammetry in an oxygen free 0.5 M H2SO4
at scan rate of 50 mVs-1
for 40 cycles. Only catalytic activity of catalysts milling for 40h is presented,
because this time of grinding was enough to obtain the best electrocatalytic responses. Cyclic
voltammograms of RuSe, RuMo, RuSn and RuW are shown in Figure 4, it is observed the
characteristic response of each system in the potentials range studied. RuSe catalysts in the range 0.25
- 0.45 V/NHE, shows a peak in the negative scan which is accounted for the reduction of a ruthenium

Int. J. Electrochem. Sci., Vol. 7, 2012
8948
surface oxide film. The broad peak indicates higher catalyst reducibility, probably caused by changes
in the oxide coverage on the electrode surface. This is associated to the formation of mixed oxygen-
selenium coverage of the ruthenium particles or to a catalytic influence of selenium on the ruthenium
reducibility [28]. In the region 0.4 - 0.8 V an increasing anodic current is observed caused by
overlapping of two stages of the ruthenium surface oxidation (Ru(0) to Ru(I) and Ru(II)), as suggested
by Conway et. al. [29], while the other catalysts no presented significant redox peaks.
Figure 5. Current potential curves for the molecular oxygen reduction reaction on RuSe electrode in
O2 saturated 0.5M H2SO4 at 20C. Inset b) Koutecky Levich plots represented in experimental
and theoretical slopes and c) reaction order determination.
Figure 5, shows the polarization curves at different rotation rates of RuSe catalysts with
Vulcan carbon powder dispersed into a Nafion film coated on a vitreous carbon, tested under oxygen
saturated 0.5 M H2SO4 solution at 20C, recorded from the open circuit potential to - 0.1 V/NHE. To
RuSe catalysts, well defined kinetic currents are observed from 0.8 to 0.65 V/NHE, and mixed-
diffusion limiting currents from 0.65 to -0.1 V/NHE, so the process is controlled by both charge
transfer and mass transport processes. There is a dependence of the current density with the rotation
rate as a consequence of the oxygen diffusion through the electrode surface. Comparing
electrochemical responses of RuSe 20h and 40 h of milling, it is observed that at 40 h, the polarization
curves present better mixed control zones and higher current density, due to the optimum particle size
as well as the high concentration of Fe, obtained from the mechanical alloying process. Figure 6 shows
RuMo polarization curves, where kinetic control between 0.70V and 0.60 V/NHE is observed; mixed
control from 0.60V to 0.35 V/NHE and diffusion limiting currents from 0.60 to 0.35 V/NHE. Kinetic
and diffusion limited currents in this material are well defined in the range of the electron transfer and
Int. J. Electrochem. Sci., Vol. 7, 2012
8949
mass transport zone due to the existence of a uniform distribution of electrocatalytic sites on the
electrode surface [30], promoting a better electrocatalytic activity of this material. Compared RuMo 20
h and 40 h milling, at 20 h, there is a quasi-diffusion current from 0.5 to -0.096 V/NHE.
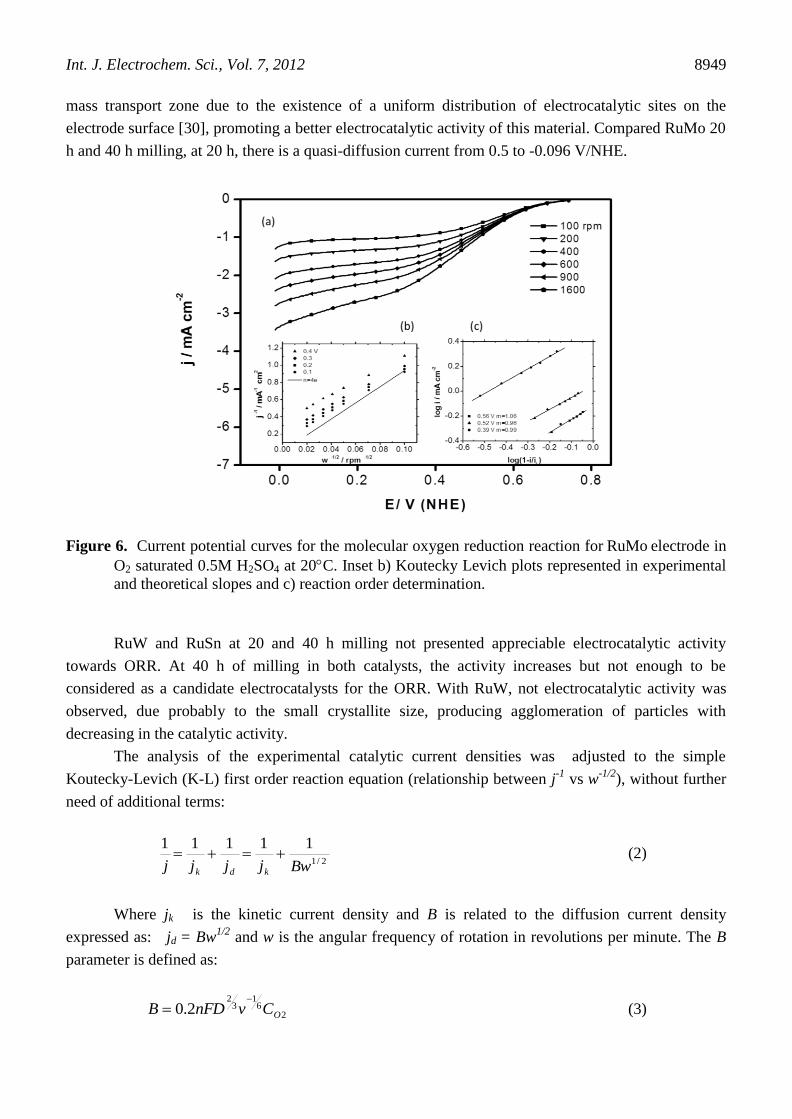
Figure 6. Current potential curves for the molecular oxygen reduction reaction for RuMo electrode in
O2 saturated 0.5M H2SO4 at 20C. Inset b) Koutecky Levich plots represented in experimental
and theoretical slopes and c) reaction order determination.
RuW and RuSn at 20 and 40 h milling not presented appreciable electrocatalytic activity
towards ORR. At 40 h of milling in both catalysts, the activity increases but not enough to be
considered as a candidate electrocatalysts for the ORR. With RuW, not electrocatalytic activity was
observed, due probably to the small crystallite size, producing agglomeration of particles with
decreasing in the catalytic activity.
The analysis of the experimental catalytic current densities was adjusted to the simple
Koutecky-Levich (K-L) first order reaction equation (relationship between j-1
vs w-1/2
), without further
need of additional terms:
2/1
11111
Bwjjjj kdk
(2)
Where jk is the kinetic current density and B is related to the diffusion current density
expressed as: jd = Bw1/2
and w is the angular frequency of rotation in revolutions per minute. The B
parameter is defined as:
26
13
2
2.0 OCvnFDB
(3)

Int. J. Electrochem. Sci., Vol. 7, 2012
8950
Where 0.2 is a constant used when w is expressed in revolutions per minute, n is the number of
electrons transferred in the overall reduction process, F is the Faraday constant (96490 Cmol-1
), D is
the diffusion coefficient of the molecular O2 in 0.5 M H2SO4 (1.4 x10⁻⁵
cm2s
-1), v is the kinematic
viscosity (0.01 cm2s
-1) and CO2 is the concentration of molecular oxygen (1.1x10
-6 molcm
-3) [31]. A
plot of j-1
vs w-1/2
should give parallel straight lines for different potentials in mixed kinetic-diffusion
controlled region, indicates that the number of electrons transferred per O2 molecule and the active
surface area for the reaction do not change significantly within the potential range studied. Figure 5 (b)
and 6 (b), show the K-L plot of RuSe and RuMo to 40 h respectively. The linearity and parallelism of
the lines in both systems, suggest that the oxygen reduction proceed via the overall four electrons
transfer process indicating the complete reduction of O2 to water formation, i.e., O2 + 4H+
+ 4e-
2H2O. Parallelism of the straight line indicates that the number of electrons transferred per O2
molecule and the active surface area for the reaction do not change significantly within the potential
range studied. The experimental slope (B) of 7.60x10⁻²
mAcm-2
for RuSe and 7.62x10⁻²
mAcm-2
for
RuMo are in agreement with the theoretical calculated value of 10.63 x10⁻²
mAcm-2
estimating for
ORR of other Ru based compounds [10,32-35].
-0.2 0.0 0.2 0.4 0.6 0.8 1.0
0.01
0.1
1
10RuSe 40 h
RuMo 40 h
i K /
mA
cm
-2
E/V (NHE)
Figure 7. Mass transfer corrected Tafel plots for RuSe and RuMo at 40 h of milling, corresponding to
the potential for attained 0.4 mA cm-2
.
The reaction order was evaluated further by plotting log j vs log ((1-j)/jd) using data for
polarization curves. As expected, the slop of the straight lines of the Figure 5 (c) y 6 (c) to RuSe y
RuMo respectively, is close to one, confirming a first-order dependence on the kinetics, that
corresponds to the transfer of the first electron of the catalysts to the molecule of oxygen adsorbed in

Int. J. Electrochem. Sci., Vol. 7, 2012
8951
the surface of the electrode, in agreement with the reaction: adsads
HOeHO 22 , being the
rate determining step of the reduction reaction.
The Tafel plots were obtained after the measured currents were corrected for diffusion to give
the kinetic currents in the mixed activation-diffusion region, calculated from:
jj
jjj
d
dk
(4)
Where jd/(jd-j) is the mass transfer correction. The Tafel plots show a linear behavior in the
mixed activation-difussion region and a deviation of the kinetic current occurs with higer slope at high
current density.
Table 2. Kinetic parameters deduced for the oxygen reduction on RuSe, RuMo, RuW, RuSn catalysts
to 20 and 40 h of milling in a 0.5 M H2SO4 solution.
In all cases, the Tafel plots show a linear behavior in the mixed activation-diffusion region and
a deviation of the kinetic currents are observed. For practical applications, is better to work at a fixed
current density and rank the catalysts not in term of exchange current density and mainly in terms of
the overpotential, so Figure 7 depicts the corresponding potential attained at 0.4 mAcm-2
for RuSe and
RuMo (40 h milling). As one can see, RuSe has the lowest overpotential at this current density and
would be considered as the best electrocatalyst for ORR in the acid electrolyte al 20 ºC. The kinetics
parameters deduced for the ORR on all the catalyst at room temperature are presented in Table 2.
The intrinsic electrochemical properties for the ORR of the bimetallic surfaces have superior
activity compared to ruthenium alone, which could be attributed to the bifunctional and electrical
effects [36], in which the unique catalytic properties of each of the elements in the binary compound
combine in a synergetic fashion to yield a more active surface than each of the elements alone, i.e., the
selenium acting as an oxygen adsorption site, promoting the electron transfer between the support
(Vulcan carbon) and the catalytic center (Ru). This mechanism is thought to protect the catalyst from
the formation of inactive ruthenium oxide, making the ruthenium-selenide base material stable against
ELECTROCATALYSTS E1=0
V/ENH
Reaction
order
- b
mVdec-1
iO
mA cm-2
n E
V/ENH at
i=0.4mAc
m-2
V
Ru-Se 20 h 0.77 1.3 129.08 0.459 1.82x10⁻⁶
4 0.103 0.459
Ru-Se 40 h 0.80 1.0 109.13 0.542 4.10x10⁻⁶
4 0.604 0.429
Ru-Mo 20 h 0.55 1.0 196.07 0.302 1.28 x 10⁻⁴
4 0.407 0.679
Ru-Mo 40 h 0.70 1.0 134.23 0.441 9.55 x 10⁻⁶
4 0.588 0.529
Ru-W 20 h 0.60 - - - - - - 0.629
Ru-W 40 h 0.63 - - - - - - 0.599
Ru-Sn 20 h 0.62 - - - - - - 0.609
Ru-Sn 40 h 0.64 - - - - - - 0.589

Int. J. Electrochem. Sci., Vol. 7, 2012
8952
the corrosive environment within the fuel cell [37]. The molybdenum facilitates electron delocalization
resulting a high conductivity [38].
3.2.2. Temperature dependence of the electrode kinetics of O2 reduction
A study of temperature dependence of the electrode kinetic and mass transfer parameters is
essential for the analysis of the influence of activation and diffusion controlled processes on the
performance of fuel cells. The temperature dependence study was conducted in an oxygen saturated
0.5 M H2SO4 and temperature was varied from 293 to 333 K.
The charge transfer coefficients, , considered as one of the parameters that allows to evaluate
the mechanism of electrode reactions or to distinguish between different plausible mechanisms [39]
and the exchange current density, jo, were evaluated from the Tafel slope as a function of
temperature, taking into account the reversible oxygen electrode potential, Er, at each temperature
[40]. The dependence of Er on the temperature was evaluated using the value of Gº at various
temperatures from an equation reported by Lewis and Randall [41]:
TTTG 8.389ln6.33658.2960 J mol-1
(5)
nFGEr /0 (6)
0G represents the free energy for the H2-O2 reaction producing liquid water and n number of
electrons transferred to produce one mole of water (n=2).
The Tafel slopes are important to know the electrochemical reaction mechanisms with a linear
dependence on temperature. The Tafel slopes were calculated using the following relationship:
Fn
RT
id
dEb
303.2
log (7)
The Tafel plots at all temperatures show linear regions at low current density from which
kinetic parameters were deduced. The electrode potential shift to more positive values and an increase
of the catalytic current density is observed with raised temperature. This behavior is similar for RuSe
and RuMo to 40 h of milling and it is attributed to an enhancement of the electrocatalytic kinetic
reduction of the adsorbed oxygen with temperature. Figures 8 and 9 (a), show the temperature
dependence of the mass transfer corrected Tafel coefficient for the oxygen reduction to RuSe and
RuMo respectively, the Tafel slopes are temperature invariant with a constant slope of - 0.100 and -
0.135 Vdec-1
, indicating that in the range of 293-333 K, the rate determining step in ORR is the first
electron charge transfer, i.e., adsads
HOeHO 22 . The charge transfer coefficient, ,
calculated from the Tafel slopes are plotted as a function of temperature in Figure 8, for RuSe slope,
increases lineally with the absolute temperature (d/dT = 5 x 10⁻⁴
K-1
) and the slope for RuMo
electrocatalysts (Figure 9), increases lineally too with the absolute temperature, (d/dT = 2 x 10⁻⁴
K-1
).

Int. J. Electrochem. Sci., Vol. 7, 2012
8953
The finding that the transfer coefficient has a direct proportionality to temperature represents a
significant feature.
Figure 8. Tafel slope and transfer coefficient variation as a function of temperature for RuSe. Inset:
Conway plot of the reciprocal of the Tafel slope against 1000/T.
Figure 9. Tafel slope and transfer coefficient as a function of temperature for RuMo. Inset: Conway
plot of the reciprocal of the Tafel slope against 1000/T.
Int. J. Electrochem. Sci., Vol. 7, 2012
8954
Table 3. Kinetic parameters deduced of ORR on RuSe and RuMo catalysts in 0.5 M H2SO4 at different
temperature.
Electrocatalysts bprom
V dec-1
d/dT
K-1
=H+TS E#
kJ mol-1
RuSe -0.100 5x10⁻⁴
-1.69x10⁻⁴
+ 2.52x10⁻³
K-1
T 34.93
RuMo -0.136 2x10⁻⁴
-0.522x10⁻⁴
- 1.29x10⁻³
K-1
T 49.29
The kinetic parameters deduced of ORR studies on RuSe and RuMo electrocatalysts in 0.5 M
H2SO4 at different temperature are showing in Table 3. In general, the transfer coefficient () varies
with the absolute temperature by the linear relationship:
SH T (8)
Where H is related to the change of electrochemical enthalpy of activation with electrode
potential and S is related to the change of electrochemical entropy of activation with electrode
potential [42]. According to this equation, the Tafel slopes of eq. (7) can be represented as:
FT
RTb
SH )(3.2
(9)
Where H and S can be determined by plotting the Tafel slope reciprocal in function of the T
reciprocal, named as Conway plot (inset Fig 8 and 9). From the slope and the intercept of this line,
H and S are calculated for RuSe and RuMo as seen as Table 3.
2.8 2.9 3.0 3.1 3.2 3.3 3.4 3.5 3.61E-6
1E-5
1E-4
j o /
mA
cm
-2
1000 T -1 / K
-1
RuSe 40 h
RuMo 40 h
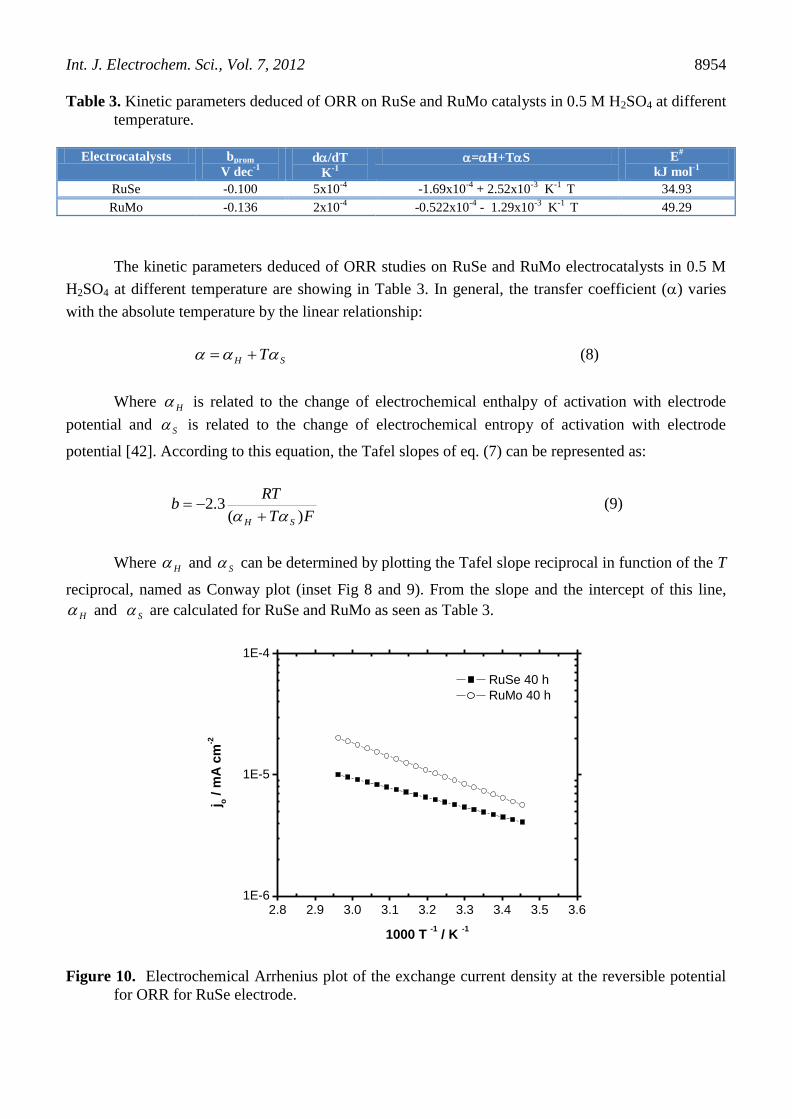
Figure 10. Electrochemical Arrhenius plot of the exchange current density at the reversible potential
for ORR for RuSe electrode.

Int. J. Electrochem. Sci., Vol. 7, 2012
8955
The low value of H in both electrocatalysts, suggests a negligible enthalpic contribution on
the electrocatalysts behavior, therefore, the entropic contribution largely affects the final value of the
global charge transfer. This behavior is common in the electrocatalysts that contain transition metals as
active site [42-44].
The exchange current density (jo), corresponding to each Tafel slope was calculated by
extrapolating the potential to the Er value at the operated cell temperature evaluated from eq. 9. The
apparent activation energy, E#, was calculated from the Arrhenius slope represented by the
relationship:
td
idRE
1
log303.2 0# (10)
Figure 10, depicts the Arrhenius plots from the exchange current density. The apparent
activation energy for RuSe and RuMo are 34.93 and 49.29 KJmol-1
, respectively. These values are in
the range of 30 - 80 KJmol-1
reported for ORR in acid media [3,45,46]. The apparent activation energy
of RuSe is greater than RuMo, indicating that the energetically the ORR is favored on RuSe
electrocatalyst. The apparent activation energy for RuSe and RuMo are shown in Table 3.
4. CONCLUSIONS
The present study demonstrates that mechanical alloying is an effective method for the
preparation of nanometric RuSe, RuMo, RuW and RuSn electrocatalysts. The addition of a second
material to Ru, improves the electrocatalytic activity toward the ORR by bifunctional and electronic
effects. The physical characterization of RuSe catalysts to 40 h of milling time, showed the formation
of FeSe2, Fe2O3, Ru and Se mixture of phases; a RuMo solid solution, both electrocatalysts with
granular morphology; a RuSe2 intermetallic and a Ru3W2 intermetallic with irregular morphology. The
electrochemical characterization shows that the materials studied are active towards the ORR with the
exception of RuW and RuSn. The ORR proceeds predominantly with four electrons transfer to water
formation with a first order reaction respect the oxygen concentration. The Tafel slope and transfer
coefficient values show the influence of the Ru intrinsic characteristics used by active center, but in the
exchange current and the activation energy, there are greater influences of the second transition metal.
The temperature effect on the electrochemical parameters indicates that the Tafel slope is temperature
invariant while the transfer coefficient shows important absolute temperature dependence. In RuSe and
RuMo electrocatalysts, the enthalpic contribution is the determining factor for the electrocatalytic
activity of this reaction. The apparent activation energy values are presented in following order: RuSe
> RuMo. The ORR activity shows a significant relationship with the crystallite size. The
electrocatalytic efficiency order of the materials studies is RuSe > RuMo > RuSn > RuSn to 40 h of
milling.

Int. J. Electrochem. Sci., Vol. 7, 2012
8956
ACKNOWLEDGEMENTS
A. Ezeta-Mejía is grateful for her postgraduate fellowship from CONACYT and SIP-IPN. The authors
are also grateful for the financial support from the SIP 2009-0561 project and SNI-CONACYT.
References
1. D.C. Martínez-Casillas, G. Vázquez-Huerta, J.F. Pérez-Robles, O. Solorza Feria, J. Power Sources.
196 (2011) 4468.
2. W. Jensen, O. Winther Jensen, M. Forsyth, D.R. MacFarlane, Science. 321 (2008) 671.
3. K. Kinoshita, Electrochemical Oxygen Technology, Willey, New York (1992).
4. T. Maiyalagan, S. Pasupathi, Mat. Sci. Forum, 657 (2010) 143.
5. P. He, M. Lefévre, G. Faubert, J.P. Dodelet, J. New Mater. Electrochem. Syst. 2 (1999) 243.
6. M. Lefévre, J.P. Dodelet, P. Bertrand, J. Phys. Chem. B 104 (2000) 11238.
7. M. Bron, S. Fiechter, M. Hilgendorff, P. Bogdanoff, J. Appl. Electrochem. 32 (2002) 211.
8. S. Durón, R. Rivera Noriega, M.A. Leyva, P. Nkeng, G. Poillerat, O. Solorza-Feria, J. Solid State
Electrochem. 4 (2000) 7.
9. R.G. González-Huerta, A. Guzmán-Guzmán, O. Solorza-Feria, Int. J. Hydrogen Energy, 35
(2010)12115.
10. H. Tributsch, M. Bron, M. Hilgendorff, H. Schulenburg, I. Dorbandt, V. Eyert, P. Bogdanoff, S.
Fiechter, J. Appl. Electrochem. 31 (2001) 739.
11. F. Dassenoy, W. Vogel, N. Alonso Vante, J. Phys. Chem. B 106 (2002) 12152.
12. R. González Cruz, O. Solorza Feria, J. Solid State Electrochem. 7 (2003) 289.
13. V. Le Rhun, N. Alonso Vante. J. New Mater. Electrochem. Syst. 3 (2000) 331.
14. L. Mao, D. Zhang, T. Sotomura, K. Nakatsu, N. Koshiba, T. Ohsaka, Electrochim. Acta. 48 (2003)
1015.
15. M. Bron, P. Bogdanoff, S. Fiechter, M. Hilgendorff, J. Radnik, I. Dorbandt, H. Schulenburg, H.
Tributsch, J. Electroanal. Chem. 517 (2001) 85.
16. M. Hilgendorff, K. Diesner, H. Schulenburg, P. Bogdanoff, M. Bron, S. Fiechter, J. New Mater.
Electrochem. Syst. 5 (2002) 71.
17. T.J. Schmidt, U.A. Paulus, H.A. Gasteiger, N. Alonso Vante, R.J. Behm, J. Electrochem. Soc. 147
(2000) 2620.
18. H. Cheng, W. Yuan, K. Scott, Electrochim. Acta. 52 (2006) 466.
19. K.S. Nagabhushana, E. Dinjus, H. Bönnemann, V. Zaikovskii, C. Hartnig, G. Ehl, I. Dorbandt, S.
Fiechter, P. Bogdanoff, J. Appl Electrochem. 37 (2007) 515.
20. M. Montiel, S. García Rodríguez, P. Hernández Fernández, R. Díaz, S. Rojas, J.L. Fierro, E. Fatás,
P. Ocón, J. Power Sources. 195 (2010) 2478.
21. K. Suárez-Alcántara, O. Solorza-Feria, Electrochim. Acta. 53-15 (2008) 4981.
22. M.T.M. Koper, Surface Science. 548 (2004) 1.
23. L. Xiong, T. He, Electrochem. Comun. 8 (2006) 1671.148.
24. B.D. Cullity, Elements of X-Ray Difracction, Addison-Wesley Publishing Company, INC., USA
(1978).
25. M.R. Paruchuri, D.L. Zhang, T.B. Massalski, Mater. Sci. Eng. A 174 (1994) 119.
26. P. Sotelo Mazón, R.G. González Huerta, J.G. Cabañas Moreno, O. Solorza-Feria, Int. J.
Electrochem.Sci. 2 (2007) 523.
27. C.C. Koch, Annu. Rev. Mater. Sci. 19 (1989) 121.
28. M.Bron, P. Bogdanoff, S. Fiechter, I. Dorbandt, M. Hilgendorff, H. Schulenburg, H. Tributsch, J.
Electroanal Chemistry. 500 (2001) 510.
29. S. Hadzi Jordanov, H. Angerstein Kozlowska, M. Vuckovic, B.E. Conway, J. Phys. Chem. 81
(1977) 2271.

Int. J. Electrochem. Sci., Vol. 7, 2012
8957
30. U.A. Paulus, T.J. Schmidt, H.A. Gasteiger, R.J. Behm, J. Electroanal. Chem. 495 (2001) 134.
31. C. Coutanceau, P. Crouigneau, J.M. Léger, C. Lamy, J. Electroanal. Chem. 379 (1994) 389.
32. R.G. González Huerta, R. González Cruz, S. Citalán Cigarroa, C. Montero Ocampo, O. Solorza
Feria, J. New Mat. Electrochem. Systems. 8 (2005) 15.
33. R. González Cruz, O. Solorza Feria, J. Sol. State Electrochem. 7 (2003) 289.
34. T.J. Schmidt, U.A. Paulus, H. Gasteiger, N. Alonso Vante, R.J. Behm, J. Electrochem. Soc. 147
(2000) 2620.
35. J. Prakash, H. Joachin, Electrochim. Acta. 45 (2000) 2289.
36. M.T.M. Koper, Surface Science. 548 (2004) 1.
37. K. Suárez Alcántara, O. Solorza Feria, Electrochim. Acta.. 53 (2008) 4981.
38. N. Alonso Vante, W. Jaegermann, H. Trbutsch, W. Honle, K. Yvon, J. Am. Chem. Soc. 109 (1987)
3251.
39. S. Durón. PhD. Thesis, Cinvestav-IPN, México (2000).
40. A. Parthasaranthy, S. Srinivasan, A.J. Appleby, C.R. Martin, J. Electrochem Soc. 139 (1992) 2530.
41. G. Lewis, M. Randall, International critical tables. Vol. 7. Mc Graw Hill, New York (1930).
42. A. Damjanovic, J. Electroanal. Chem. 355 (1993) 57.
43. B.E. Conway, Modern Aspects of Electrochemistry. Vol 16. Cap. 2. B.E. Conway, R.E. White,
J.O´M. Brockris. Ede. Plenum Press. N.Y. USA (1985).
44. B.E Conway, D.F. Tessier, D.P. Wilkinson, J. Electrochem. Soc. 136 (9) (1989) 2486.
45. R.G. González Huerta, R. González Cruz, C. Montero Ocampo, J. Chávez Carvallar, O. Solorza
Feria, J. New Mater. Electrochem. Syst. 8 (2005) 15.
46. K. Suárez Alcántara, A. Rodríguez Castellanos, R. Dante, O. Solorza-Feria, J. Power Sources. 157
(2006) 114.
© 2012 by ESG (www.electrochemsci.org)