Faculteit der Technologische Wetenschappen
“The geological structures in the Bight basin and the possibility of petroleum”
Geotektoniek
Field of study : Mineral Resources Phase : B 2 Course : Geotektoniek Teacher : Drs. A. Nelson
Paramaribo, Friday 5th of june 2015 Names en student numbers : Biharie Dheeraj (20130423) Dwarka Arvind (12dp1012) Gopie Rishi (12dp1014) Samjhawan Anroedh (20130179) Jhan Jhan Lokhnath (11dp1029)
1
Preface
This report is made as a completion of the course Geotectonic. In this report the students; Biharie, Dwarka,
Gopie, Jhan- Jhan and Samjhawan did a case study of an area in the Bight Basin. The case was given by the
teacher, Drs. A. Nelson. The students tasks was to use their knowledge and creativity to analyze the given case.
The results of the group analysis are displayed in this report.
We would like to thank our teacher, Drs. A. Nelson, for his valuable input and support throughout the entire
course period.
2
Content List Of Figures ....................................................................................................................................................... 3
Introduction ............................................................................................................................................................ 4
1. Background information of the bight basin .................................................................................................... 5
2. Stratigraphy of the bight basin ........................................................................................................................ 7
2.1 Aspects of the Petroleum systems ................................................................................................................ 9
2.2 Source rock ................................................................................................................................................... 9
2.3 Reservoirs and seals ................................................................................................................................... 10
2.4 Reservoir traps............................................................................................................................................ 10
3. Exploration ................................................................................................................................................... 12
4. Environmental Impact & Risk Assessment according to seismic activity ..................................................... 13
4.1 System of methods to identify environmental impacts and risks ......................................................... 14
4.2 Lightning 3D Marine Seismic Survey environmental hazards .............................................................. 14
Conclusion ........................................................................................................................................................... 17
Sources ................................................................................................................................................................. 18

3
List Of Figures
Fig. 1: Rifting between the Australian and Antarctic plates 5
Fig. 2: Australian bight basin (Red Square) 6
Fig. 3: Geological summary of the Bight Basin 7
Fig. 4: Seismic lines bight basin 8
Fig. 5: 2D Seismic line interpretation overview 11
Fig. 6: Licensed area 12
Fig. 7: Regional Location of the Lightning 3D MSS 13
4
Introduction
The Bight Basin (Jurassic-Cretaceous) is a large basin, mainly offshore, that extends along the southern
Australian margin. From the southern tip of Western Australia, across the Great Australian Bight to the
western tip of Kangaroo Island. The Basin contains a Late Jurassic to Late Cretaceous sedimentary succession
that is 15 km thick in the thickest deposition centre, the Ceduna Sub-basin. In the east of the main deposition
centre, a thin Bight Basin succession overlies the western tip of the mostly Proterozoic Polda Basin (Totterdell
& Krassay, 2003).
Geoscience Australia undertook an integrated geological study of the Bight Basin between 1999 and 2003,
which resulted in a new chronostratigraphic framework and an improved understanding of the tectonic and
depositional history of the basin. The stratigraphic and structural interpretation of 8600 kilometers of new and
high quality regional 2D seismic reflection data was the key component of this study (Totterdell & Krassay,
2003).
The stratigraphic columns and 2D seismic reflection data described above, is used for the interpretation of the
Bight Basin and is displayed in this report named : “The geological structures in the Bight basin and the
possibility of petroleum”. The core of the report can be divided in the following 4 chapters:
1. Background information of the bight basin
2. Stratigraphy of the bight basin
3. Exploration
4. Environment of the area program
The report also includes a list of figures, a conclusion and a list of sources that are used to complete the report.

5
1. Background information of the bight basin
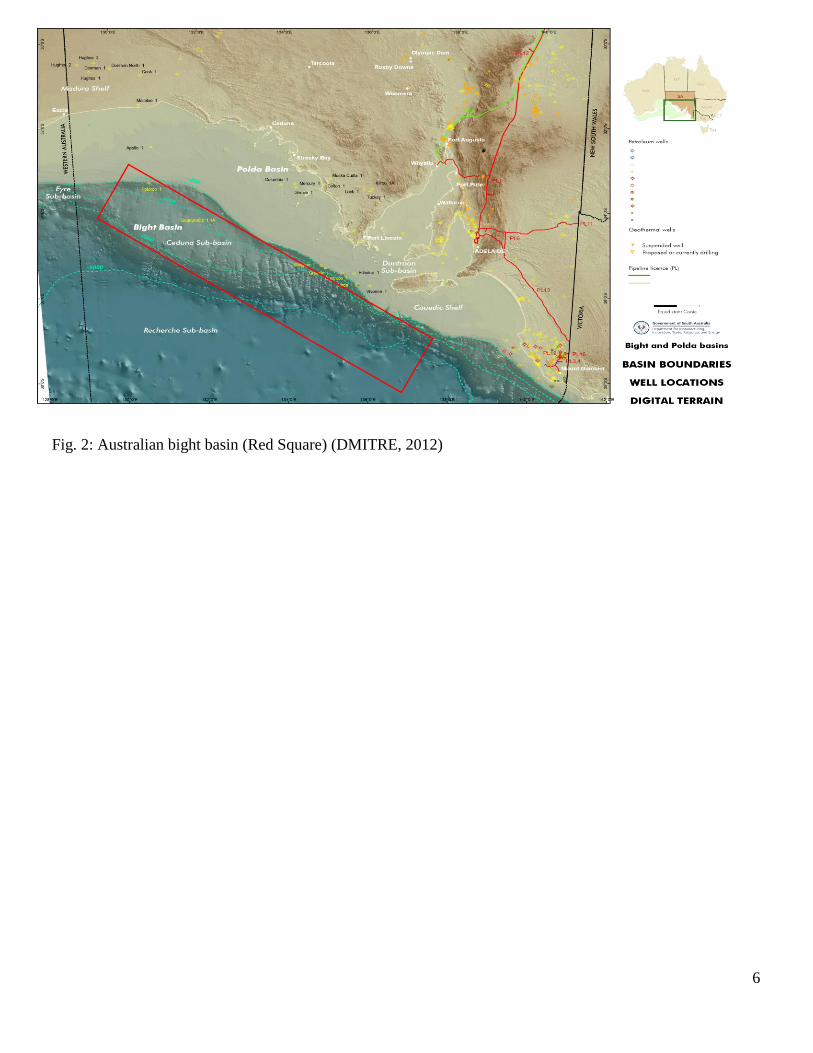
The Bight Basin (Fig. 2) is an area of over 800 000 km2, straddling the Western border of Australia and South
Australia. The Basin is onshore and offshore in water depths over 5000 meter. It is one of the largest offshore
frontier basins in the world (DMITRE, 2012) (Geoscience Australia, n.d.).
The Bight Basin contains a Late Jurassic to Late Cretaceous sedimentary succession and is located in the
central portion of the Australian Southern Rift System. The Basin is the result of extension and subsidence
following the rifting between the Australian and Antarctic plates (Fig. 1) (Wilcox, 1988).
The basin has fluvial to paralic, a mixture of marine and continental deposits, sediments of Late Jurassic to
Early Cretaceous age. These sediments are disconformably overlain by nearshore marine to non-marine Late
Cretaceous sediments. Sediments from the interior was dumped into the rapidly subsiding rift system to the
south, the plat formal portion of the basin. The platform is thus a clastic bypass margin (Wilcox, 1988).
Fig. 1: Rifting between the Australian and Antarctic plates
Australia-Antarctica Rift
6
Fig. 2: Australian bight basin (Red Square) (DMITRE, 2012)
7
2. Stratigraphy of the bight basin
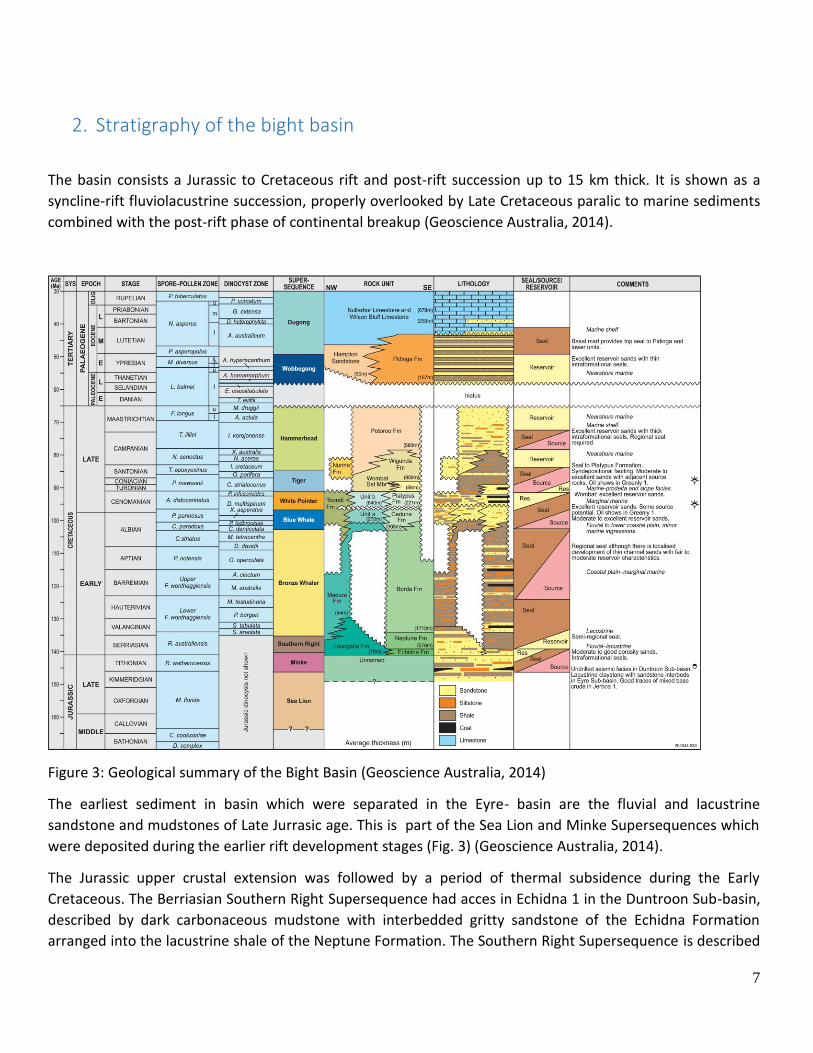
The basin consists a Jurassic to Cretaceous rift and post-rift succession up to 15 km thick. It is shown as a
syncline-rift fluviolacustrine succession, properly overlooked by Late Cretaceous paralic to marine sediments
combined with the post-rift phase of continental breakup (Geoscience Australia, 2014).
Figure 3: Geological summary of the Bight Basin (Geoscience Australia, 2014)
The earliest sediment in basin which were separated in the Eyre- basin are the fluvial and lacustrine
sandstone and mudstones of Late Jurrasic age. This is part of the Sea Lion and Minke Supersequences which
were deposited during the earlier rift development stages (Fig. 3) (Geoscience Australia, 2014).
The Jurassic upper crustal extension was followed by a period of thermal subsidence during the Early
Cretaceous. The Berriasian Southern Right Supersequence had acces in Echidna 1 in the Duntroon Sub-basin,
described by dark carbonaceous mudstone with interbedded gritty sandstone of the Echidna Formation
arranged into the lacustrine shale of the Neptune Formation. The Southern Right Supersequence is described
8
by the fluvial sandy to shaly succession of the Loongana Formation, in the Eyre and Ceduna subbasins. The
fluviolacustrine succession is pursued by the Valanginian to mid-Albian Bronze Whaler Supersequence,
comprising mudstone, claystone, siltstone and minor coal of the Borda Formation in the Duntroon Sub-basin
and the eastern part of the Ceduna Sub-basin. Nearby the central and the northern parts of the Bight Basin,
the Bronze Whaler Supersequence includes sandstone, silt and shale with wood fragments of the late
Loongana Formation. Glauconitic and carbonaceous rich claystone, sandstone, siltstone and shale of the
Madura Formation. Claystone, siltstone and shales of the early parts of the Toondi Formation. Marine
incursions were explained during the Albian, and appear more common in the central to western areas,
marking the beginning of a period of accelerated subsidence (Fig. 4 ) (Geoscience Australia, 2014).
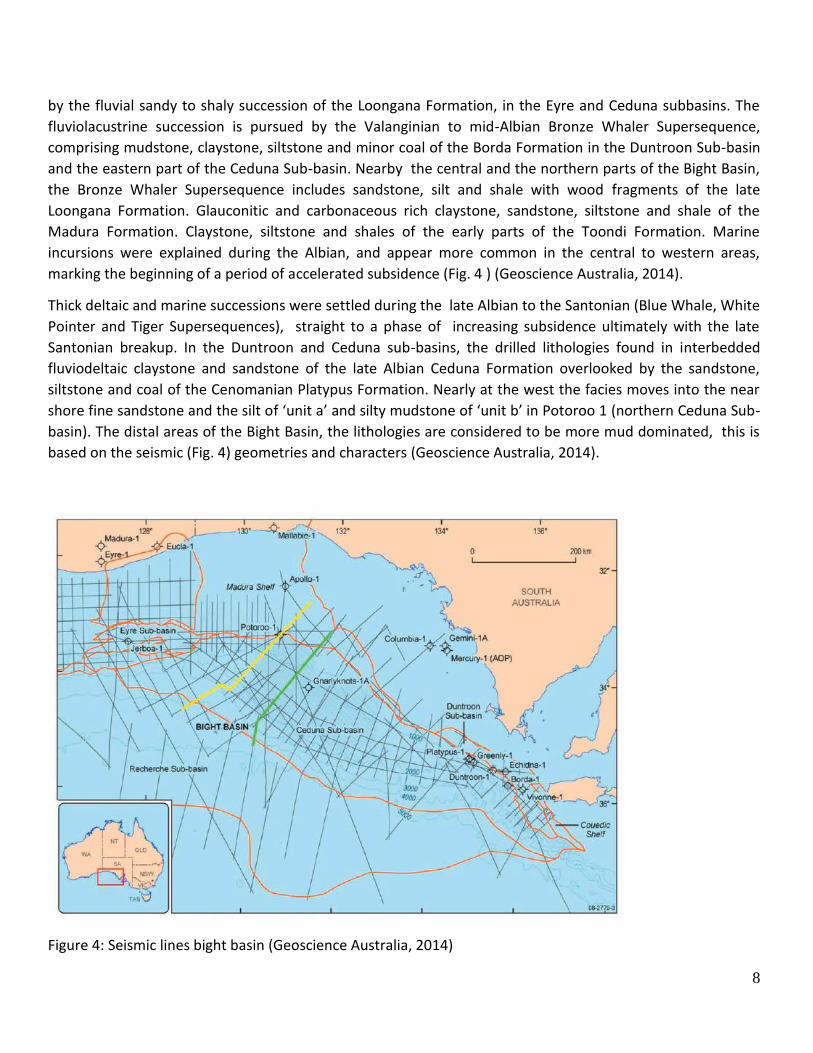
Thick deltaic and marine successions were settled during the late Albian to the Santonian (Blue Whale, White
Pointer and Tiger Supersequences), straight to a phase of increasing subsidence ultimately with the late
Santonian breakup. In the Duntroon and Ceduna sub-basins, the drilled lithologies found in interbedded
fluviodeltaic claystone and sandstone of the late Albian Ceduna Formation overlooked by the sandstone,
siltstone and coal of the Cenomanian Platypus Formation. Nearly at the west the facies moves into the near
shore fine sandstone and the silt of ‘unit a’ and silty mudstone of ‘unit b’ in Potoroo 1 (northern Ceduna Sub-
basin). The distal areas of the Bight Basin, the lithologies are considered to be more mud dominated, this is
based on the seismic (Fig. 4) geometries and characters (Geoscience Australia, 2014).
Figure 4: Seismic lines bight basin (Geoscience Australia, 2014)
9
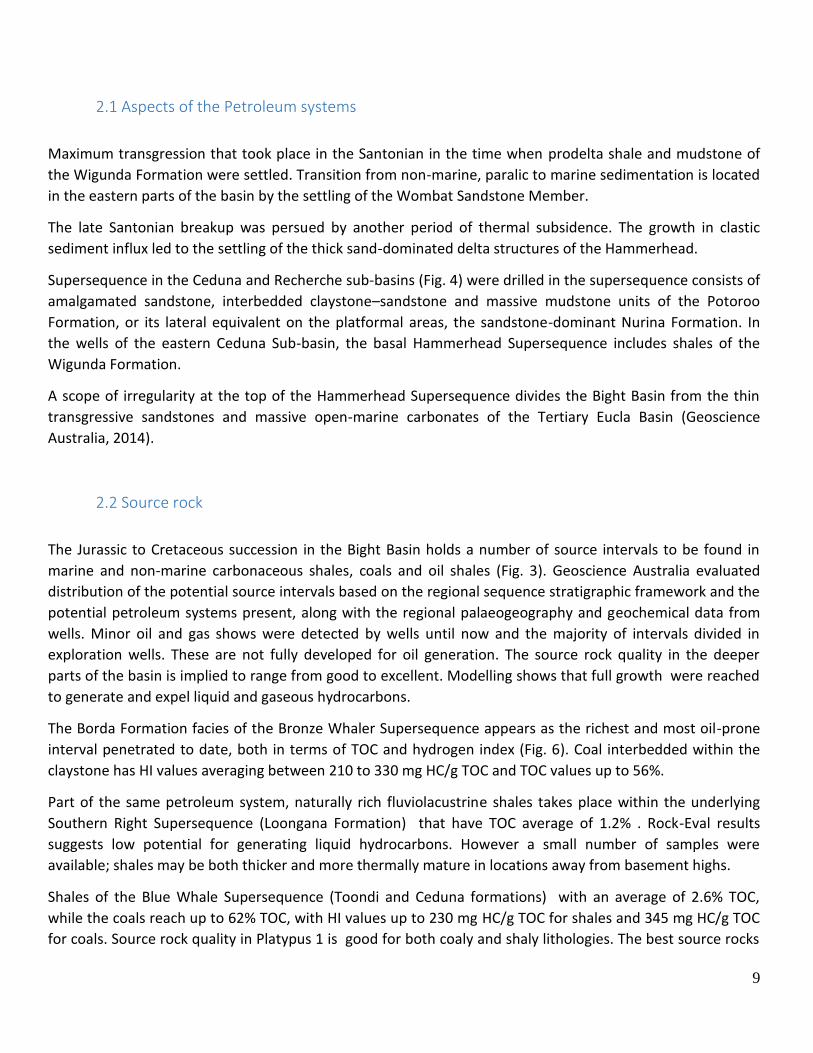
2.1 Aspects of the Petroleum systems
Maximum transgression that took place in the Santonian in the time when prodelta shale and mudstone of
the Wigunda Formation were settled. Transition from non-marine, paralic to marine sedimentation is located
in the eastern parts of the basin by the settling of the Wombat Sandstone Member.
The late Santonian breakup was persued by another period of thermal subsidence. The growth in clastic
sediment influx led to the settling of the thick sand-dominated delta structures of the Hammerhead.
Supersequence in the Ceduna and Recherche sub-basins (Fig. 4) were drilled in the supersequence consists of
amalgamated sandstone, interbedded claystone–sandstone and massive mudstone units of the Potoroo
Formation, or its lateral equivalent on the platformal areas, the sandstone-dominant Nurina Formation. In
the wells of the eastern Ceduna Sub-basin, the basal Hammerhead Supersequence includes shales of the
Wigunda Formation.
A scope of irregularity at the top of the Hammerhead Supersequence divides the Bight Basin from the thin
transgressive sandstones and massive open-marine carbonates of the Tertiary Eucla Basin (Geoscience
Australia, 2014).
2.2 Source rock
The Jurassic to Cretaceous succession in the Bight Basin holds a number of source intervals to be found in
marine and non-marine carbonaceous shales, coals and oil shales (Fig. 3). Geoscience Australia evaluated
distribution of the potential source intervals based on the regional sequence stratigraphic framework and the
potential petroleum systems present, along with the regional palaeogeography and geochemical data from
wells. Minor oil and gas shows were detected by wells until now and the majority of intervals divided in
exploration wells. These are not fully developed for oil generation. The source rock quality in the deeper
parts of the basin is implied to range from good to excellent. Modelling shows that full growth were reached
to generate and expel liquid and gaseous hydrocarbons.
The Borda Formation facies of the Bronze Whaler Supersequence appears as the richest and most oil-prone
interval penetrated to date, both in terms of TOC and hydrogen index (Fig. 6). Coal interbedded within the
claystone has HI values averaging between 210 to 330 mg HC/g TOC and TOC values up to 56%.
Part of the same petroleum system, naturally rich fluviolacustrine shales takes place within the underlying
Southern Right Supersequence (Loongana Formation) that have TOC average of 1.2% . Rock-Eval results
suggests low potential for generating liquid hydrocarbons. However a small number of samples were
available; shales may be both thicker and more thermally mature in locations away from basement highs.
Shales of the Blue Whale Supersequence (Toondi and Ceduna formations) with an average of 2.6% TOC,
while the coals reach up to 62% TOC, with HI values up to 230 mg HC/g TOC for shales and 345 mg HC/g TOC
for coals. Source rock quality in Platypus 1 is good for both coaly and shaly lithologies. The best source rocks
10
are supposed to be found in the central Ceduna Sub-basin, where deep water, restricted marine
environments of deposition are interpreted for this time.
Other important source intervals are the coal-prone Platypus Formation (and its ‘unit b’ equivalent in Potoroo
1) and the claystone of the basal Wigunda Formation, within the White Pointer and early Tiger
Supersequences. In the inboard basin areas these intervals are volumetrically less significant and more gas
prone, but the distal portions of these sections, in the outer Ceduna Sub-basin, are interpreted to be much
thicker and more mature. So they may have generated light oils (Geoscience Australia, 2014).
2.3 Reservoirs and seals
Reservoir, seal and source potential of each unit are summarised in Figure 3. With the existence and quality
of the source rock, are wells mostly loacated on the basin margin, reservoir and seal distribution is explained
by associating the well results to seismic data and gathered depositional models.
Fluviodeltaic sandstones of the Potoroo Formation have great reservoir but they may not have enough
regional seal. Thick and laterally extensive claystone units within the Hammerhead Supersequence are
possibly present and supply intraformational seals. Some parts of the basin may have enough sealing quality
of the interbedded marl and limestone of the overlying Eucla Basin.
Other important reservoir aspirant are deltaic sandstones of the Ceduna and Platypus formations, where
porosities of up to 30% have been detected. Marine sandstones of the Tiger Supersequence (Wigunda and
Potoroo formations) also have great reservoir quality. Apart of the regional highs, prodelta mudstone of the
Wigunda Formation brings usefull seal for these highly porous intervals.
Although the high reservoir quality, these intervals are not easy to be balanced, because of the high depth
burial. Shales of the Madura and Toondi formations and intraformational shale of the Loongana Formation
can give enough seal for these potential reservoirs. Major cap rocks lays in the Borda and Neptune
formations. Great quality reservoir rocks have been detected in the overlying Eucla Basin, within the marine
Wobbegong Supersequence (Pidinga Formation and Hampton Sandstone) (Geoscience Australia, 2014).
2.4 Reservoir traps
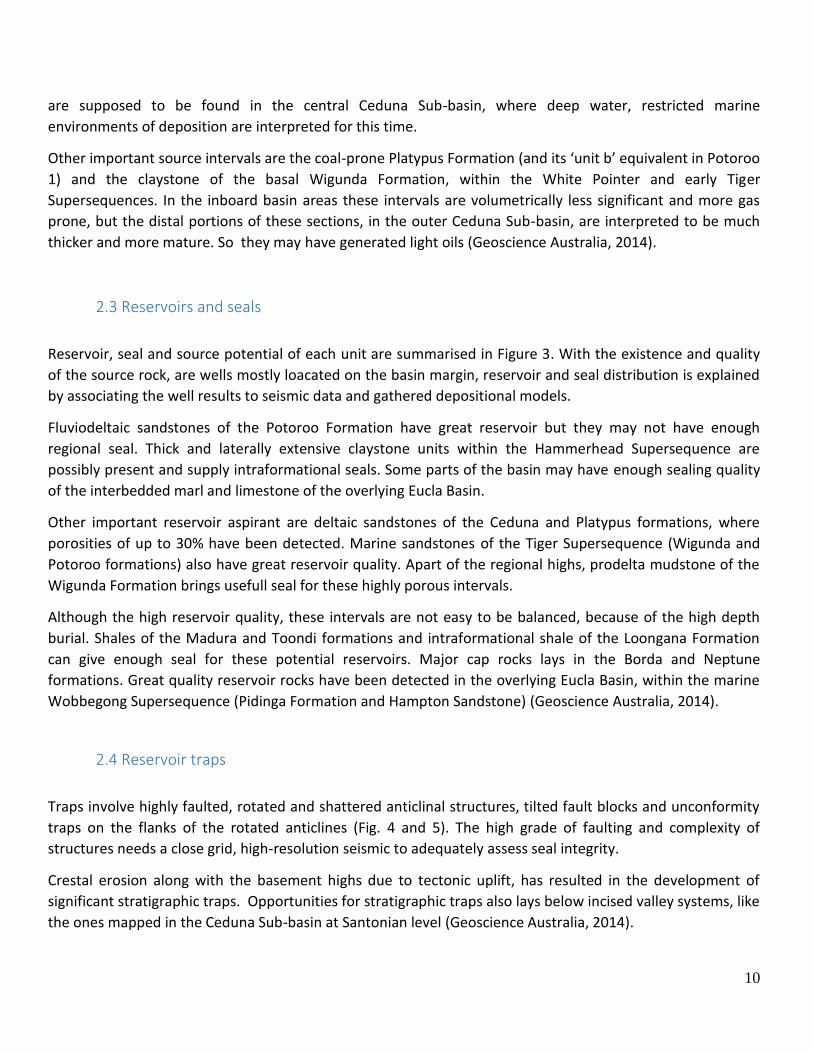
Traps involve highly faulted, rotated and shattered anticlinal structures, tilted fault blocks and unconformity
traps on the flanks of the rotated anticlines (Fig. 4 and 5). The high grade of faulting and complexity of
structures needs a close grid, high-resolution seismic to adequately assess seal integrity.
Crestal erosion along with the basement highs due to tectonic uplift, has resulted in the development of
significant stratigraphic traps. Opportunities for stratigraphic traps also lays below incised valley systems, like
the ones mapped in the Ceduna Sub-basin at Santonian level (Geoscience Australia, 2014).
11
Figure 5: 2D Seismic line interpretation overview of the group
12
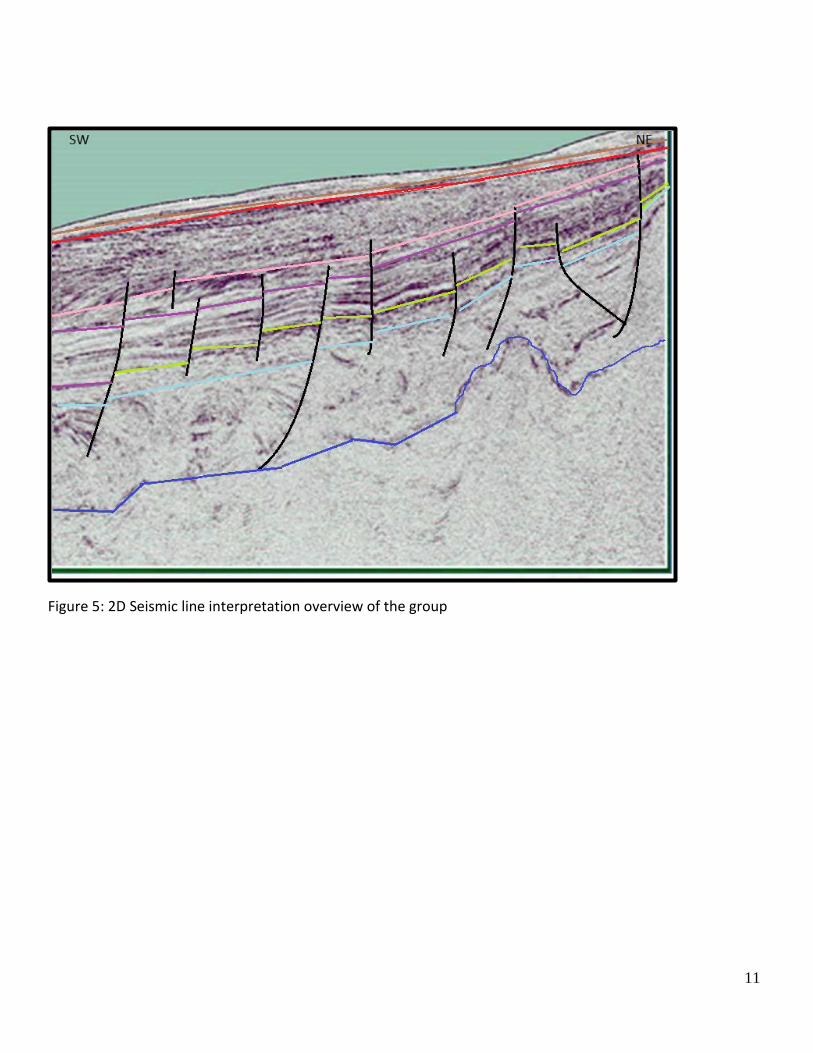
3. Exploration
The use of 3D seismic is to better understand the subsurface geology within the license blocks Epp 31 and Epp
32 (Fig. 6) and to define potential prospective petroleum targets for exploration. This mapping should be
undertaken by an experienced seismic contractor using a purpose-built seismic ship, towing equipment along a
series of established seismic lines within the survey area. As the ship l travels along the survey lines, a series of
acoustic pulses, activated at approximately every 11 seconds, will be directed down through the water column
into the seafloor via a dual source array (Geoscience Australia, 2014).
The acoustic signals are weakened through the subsurface geological structure; reflect at geological
boundaries and the reflected signals are detected using hydrophones, arranged in series along a number of
cables (in a string) towed behind the ship. Data collected by the hydrophones is stored in on board computers
for processing and analysis, allowing the structure of the underlying geological strata to be mapped and
potential hydrocarbon reservoir targets to be identified (Geoscience Australia, 2014).
The geology structurally is very complex for 2D interpretation, 3D seismic mapping is capable of unlocking
the complex geology of the Bight basin. Poor interpretation can led to drilling off structure.
Figure 6: Licensed area (O’Brien, Paraschivoiu, & Hibburt, 1990)
13
4. Environmental Impact & Risk Assessment according to seismic activity
In agreement with the offshore petroleum and Greenhouse Gas storage, environmental hazard identification
and risk assessment has been started to evaluate the possibly sources of environmental and social impacts
connected with lightning MSS action. This includes an evaluation of impacts and risks created by operational
and unplanned actions, and the identification of control measures to minimize the impacts and risks to
acceptable degree (Australia/New Zeeland Authorities, 2012) (Australian Government, 2010).
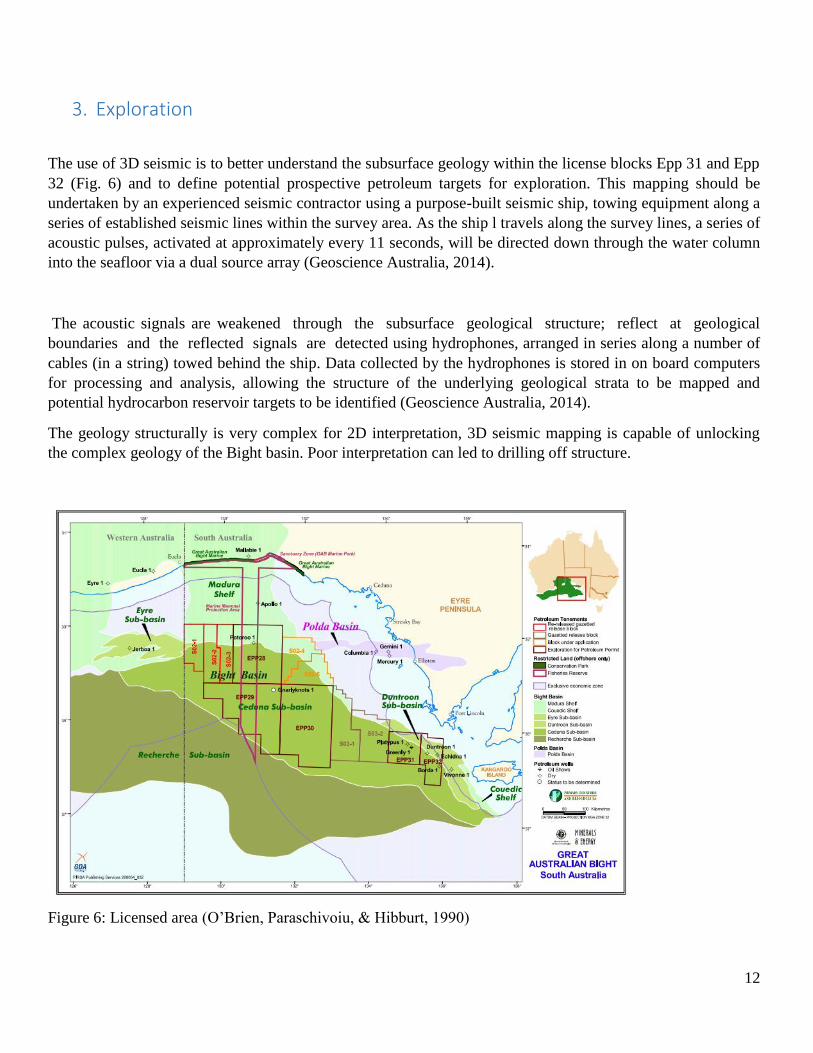
Activity location
The Lightning 3D MSS activity, shown on a regional basis in (Fig. 7) will be undertaken within the blocks
EPP31 (41) and EPP32 (42) non‐permit areas (Bight Basin). The Lightning 3D MSS covers an area of
approximately 3,000km2 and is located entirely within Commonwealth waters of the bight basin.
Fig 7: Regional Location of the Lightning 3D MSS (Australia/New Zeeland Authorities, 2012)
14
4.1 System of methods to identify environmental impacts and risks
Environmental threats, possible impacts and risks that are created by the lightning MSS have been recognized
by taking the followings steps (Australia/New Zeeland Authorities, 2012) :
Describe the activity and related environmental characteristics
Determine the environmental and social values
Determining the essential risks of each possible environmental hazard associated with the action of the
MSS
Determining the remaining risks of each possible environmental hazard with recognized control
measured adopted
With control applied we should describe if the impact or risk it at acceptable level, if it’s not the case
than the activity will be reviewed and other control measures will be added until the impacts and risks
are at an acceptable level.
Evaluation of the impact and risk assessment of each possible environmental hazard is done by using
Qualitative Environmental Risk Assessment based on ISO14001 (Environmental Management Systems),
ISO31000: 2009 (Risk Management) and HB203: 2012 (Environmental Risk Management – principles
and process )
4.2 Lightning 3D Marine Seismic Survey environmental hazards
There are in total 19 hazards that could have an impact on the environment by using the lightning 3D marine
seismic survey, which can be grouped in the following categories (Australia/New Zeeland Authorities, 2012):
Mobilisation of the seismic and support vessels to the proposed survey area:
Introduction of non- indigenous invasive marine species (IMS) from ballast water discharge or
biofouling.
Physical presence of the Seismic ship:
Disruption to commercial fishing activities;
Disruption to commercial shipping;
Disruption to Tourism; and
Light pollution due to 24 hour MSS activities.
15
Seismic acquisition:
Discharge of acoustic source pulses in the proposed MSS area;
Sound from operation of vessels; and
Sound from operation of helicopters.
General vessel operations:
Routine waste discharges from the seismic and support vessels (oily water, sewage,
foodscraps); and Air emissions.
Non-Routine events:
Accidental hydrocarbon spill due to collision with another vessel;
Chemical/oil spill through deck drain system;
Oil spill during refueling at sea;
Solid non-biodegradable/hazardous waste overboard incident;
Seismic streamer perforation and/or loss in the marine environment; and
Collision with a cetacean.
To have an idea how these hazard activities should be monitored an example will follow next.
1. Non Routine Incident – refueling Spill
Background Information and Potential Impacts:
A well- known source of oil spill in offshore marine operations is associated with refueling (bunkering)
activities. Causal pathways include hose breaks, coupling failures and tank over fill. Sea refueling of the
lightning MSS is a risky activity and will be the exception. The refueling of it will happen at port facilities.
Spills to the marine environment may cause impacts to marine fauna through contact with
contaminated water residues (Australia/New Zeeland Authorities, 2012).
2. Control measures
If refueling will happen offshore the following steps will be applied (Australia/New Zeeland Authorities,
2012):
Activity will be fully supervised, in accordance with documented bunkering procedures
there will be a meeting to check all the tools for the operation before it starts
refueling activity will only happy in good weather conditions, good visibility and during daylight hours
the refueling equipment will be constantly inspected and tested
Tank levels will be monitored so they are not over‐filled;
The transfer area will be bunded with spill kits in the event of a spill or leak
To make sure that SOPEP (Ship Oil Pollution Emergency Plan) equipment is available, and tested to
response by spill events by appropriately trained personnel.
16
3. Spill Response Strategy:
In the event of a spill, it is expected a natural weathering/surveillance monitoring strategy will
be adopted due to the type and volume of the hydrocarbon released.
Given the small spill volumes involved, the very limited area where marine impacts might be experienced; and
the rapid evaporation/dispersion of MGO( marine gas oil ), impacts to protection priorities if present
(whales, turtles, seabirds, sharks, pinnipeds) are expected to be negligible and exposure considered very
unlikely. The residual risk associated with the adoption of a natural weathering/monitoring response
strategy to these protection priorities is assessed as low. After all there should be a monitoring team to
observe and check the progress or quality of the process of the MSS to maintain a good environment at all
times (Australia/New Zeeland Authorities, 2012).

17
Conclusion
Research has shown that there are source rock, traps, seals and reservoirs in the bight basin. This is an
indication of petroleum in the basin. The 2D interpretation of the group also shows potential traps for
petroleum (faults and anticline). The different also show that blocks EPP31 (41) and EPP32 (42) are potential
sources of petroleum. 3D seismic is used after the 2D survey for better data.
3D seismic data is used by the big companies because they are reliable and give a better insight. Other
methodic, such as drilling, are used for further exploration.
Environmental Impact and Risk Assessment are done according to seismic activity. These assessments are
done for the protection of the ecosystems, in the area of exploration, from environmental disasters.
18
Sources Australia/New Zeeland Authorities. (2012). Managing environmentrelated risk. Sydney: SAI GLOBAL
limited.
Australian Government. (2010). ISO 31000 - Risk management. Sydney: SAI GLOBAL limited.
DMITRE. (2012). Bight BASIN. Opgeroepen op 6 3, 2015, van Petroleum en geothermal in Australia:
http://www.petroleum.dmitre.sa.gov.au/__data/assets/pdf_file/0020/26912/prospectivity_bight.pdf
Geoscience Australia. (2014). Regional Geology Of The Bight BASIN. OFFSHORE PETROLEUM
EXPLORATION, pp. 1-16.
Geoscience Australia. (n.d.). Bight Basin. Opgeroepen op 6 3, 2015, van Geoscience Australia:
http://www.ga.gov.au/scientific-topics/energy/province-sedimentary-basin-
geology/petroleum/offshore-southern-australia/bight
O’Brien, G., Paraschivoiu, E., & Hibburt, J. (1990). Great Australian Bight. The petroleum geology of South
Australia, p. ch. 4.
Totterdell, & Krassay. (2003, 1). Bight Basin. Opgeroepen op 6 1, 2015, van Geoscience Australië:
http://www.ga.gov.au/scientific-topics/energy/province-sedimentary-basin-
geology/petroleum/offshore-southern-australia/bight
Wilcox, J. (1988). Rig Seismic research cruises 10 & 11 : geology of the central Great Australian Bight
region. Canberra: Bureau of Mineral Resources, Geology and Geophysics.


