N° d’ordre :………………
THESE
présentée
pour obtenir
LE TITRE DE DOCTEUR DE L’INSTITUT NATIONAL POLYTECHNIQUE DE TOULOUSE École doctorale : Mécanique Energétique Génie Civil et Procédés………………..
Spécialité : Génie des Procédés et Environnement ……………………………..
Par M KLAMKLANG Songsak………………………………………………
Titre de la thèse Restaurant wastewater treatment by electrochemical oxidation in continuous process
Soutenue le 13/11/2007. devant le jury composé de :
Mme Pattarapan PRASASSARAKICH Présidente
MM. Patrick DUVERNEUL ………………..
Somsak DAMRONGLERD
Directeur de thèse
Codirecteur de thèse
Jean Pierre BONINO ………….. Rapporteur
Tawach CHATCHUPONG Rapporteur
Hugues VERGNES
François SENOCQ
Membre
Invité
Mme Kejvalee PRUKSATHORN
Sangobtip PONGSTABODEE
Invité
Invitée
Institut National Polytechnique de Toulouse Ecole doctorale : Transfert, Dynamique des Fluides, Energétique, Procédés
Université Chulalongkorn
Klamklang Songsak
• Doctorat d'Université
Spécialité Génie des Procédés et de l’Environnement
Restaurant wastewater treatment by electrochemical oxidation in
continuous process
Nom du directeur de thèse Professeur Patrick Duverneuil Nom du co-directeur Professeur Somsak Damronglerd
Date de soutenance 13 novembre 2007
Composition du jury
M. J. P. Bonino
M. T. Chatchupong
Mlle. P. Prasassarakich
M. P. Duverneuil
M. S. Damronglerd
Mlle. K. Pruksathorn
M. H. Vergnes
M. F. Senocq
Mme. S. Pongstabodee

การบําบัดน้ําเสียจากภัตตาคารโดยออกซิเดชันเชิงไฟฟาเคมีในกระบวนการตอเนื่อง
นายทรงศักดิ์ กล่ําคลัง
วิทยานิพนธนี้เปนสวนหนึ่งของการศึกษาตามหลักสูตรปริญญาวิทยาศาสตรดุษฎีบัณฑิต สาขาวิชาเคมีเทคนิค ภาควิชาเคมีเทคนิค คณะวิทยาศาสตร จุฬาลงกรณมหาวิทยาลัย
ปการศึกษา 2549 ISBN 974-14-3476-6
ลิขสิทธิ์ของจุฬาลงกรณมหาวิทยาลัย
RESTAURANT WASTEWATER TREATMENT BY ELECTROCHEMICAL
OXIDATION IN CONTINUOUS PROCESS
Mr. Songsak Klamklang
A Dissertation Submitted in Partial Fulfillment of the Requirements for the Degree of Doctor of Philosophy Program in Chemical Technology
Department of Chemical Technology Faculty of Science
Chulalongkorn University Academic year 2006 ISBN 974-14-3476-6
Copyright of Chulalongkorn University
Thesis Title RESTAURANT WASTEWATER TREATMENT BY ELECTROCHEMICAL OXIDATION IN CONTINUOUS PROCESS
By Mr. Songsak Klamklang Filed of study Chemical Technology Thesis Advisor Professor Somsak Damronglerd, Dr. Ing. Thesis Advisor Professor Patrick Duverneuil, Dr. de l’INPT Thesis Co-advisor Associate Professor Kejvalee Pruksathorn, Dr. de l’INPT
Accepted by the Faculty of Science, Chulalongkorn University in Partial Fulfillment of the Requirements for the Doctoral Degree …………………………………………Dean of the Faculty of Science (Professor Piamsak Menasveta, Ph.D.) THESIS COMMITTEE ………………………………………....Chairman (Professor Pattarapan Prasassarakich, Ph.D.) …………………………………………Thesis Advisor (Professor Somsak Damronglerd, Dr. Ing.) …………………………………………Thesis Advisor (Professor Patrick Duverneuil, Dr. de l’INPT) …………………………………………Thesis Co-advisor (Associate Professor Kejvalee Pruksathorn, Dr. de l’INPT) …………………………………………Member (Assistant Professor Hugues Vergnes, Dr. de l’INPT) …………………………………………Member (Mr. François Senocq, Dr. de l’INPT))
…………………………………………Member (Mr. Thawach Chatchupong, Ph.D.) ………………………………………….Member (Mr. Jean Pierre Bonino, Dr. De l’INPT) …………………………………………Member (Assistant Professor Sangobtip Pongstabodee, Ph.D.)
V
ทรงศักดิ์ กลํ่าคลัง : การบําบัดน้ําเสียจากภัตตาคารโดยออกซิเดชนัเชิงไฟฟาเคมใีนกระบวนการตอเนื่อง. (RESTAURANT WASTEWATER TREATMENT BY ELECTROCHEMICAL OXIDATION IN CONTINUOUS PROCESS) อ. ที่ปรึกษา: ศ. ดร. สมศักดิ์ ดํารงคเลิศ, Prof. Patrick Duverneuil, Dr. de l’INPT อ. ที่ปรึกษารวม: รศ. ดร. เก็จวลี พฤกษาทร 199 หนา. ISBN 974-14-3476-6.
การบําบัดน้ําเสียโดยการออกซิเดชันเชิงไฟฟาเคมีจําเปนตองใชขั้วไฟฟาที่มีประสิทธิภาพในการยอยสลายสารมลพิษอินทรียที่อยูในน้ําเสีย งานวิจัยนี้ศึกษาการเตรียมขั้วไฟฟา โดยเทคนิคการเคลือบผิวดวยวิธี metal-organic chemical vapor deposition (MOCVD) การเคลือบผิวดังกลาวแบงเปน 2 ช้ัน คือ การเคลือบผิวดวยอีรีเดียมเพื่อปองกันการสึกกรอนของขั้วไฟฟาโดยใช (Methylcyclopentadienyl) (1,5-cyclooctadiene) iridium (I) เปนสารตั้งตน ที่ภาวะอุณหภูมิ 300 องศาเซลเซียส อัตราสวนโดยโมลของ O2/(MeCp)Ir(COD) เทากับ 125 ความดัน 12 ทอร และการเคลือบผิวดวยดีบุกออกไซดเปนพื้นผิวสําหรับเกิดปฏิกิริยาการผลิตอนุมูลไฮดรอกซิลโดยใช tetraethyltin เปนสารตั้งตน ที่ภาวะอุณหภูมิ 380 องศาเซลเซียส อัตราสวนโดยโมลของ O2/TET เทากับ 1200 และความดัน 15 ทอร จากการจําลองกระบวนการเคลือบผิวดวยอีรีเดียมโดยโปรแกรม FLUENT® พบวา แบบจําลองมีความสอดคลองกับผลการทดลอง เมื่อนําขั้วไฟฟา SnO2/Ir/Ti ที่เตรียมไดมาใชในการบําบัดน้ําเสียสังเคราะหที่เตรยีมจากกรดออกซาลิค พบวา สามารถลดปริมาณของคารบอนอินทรียไดรอยละ 80 ภายในเวลา 2 ช่ัวโมง โดยกลไกการยอยสลายสารมลพิษอินทรียในน้าํเสียแบงเปน 2 แบบ คือ ปฏิกิริยาลําดับศูนยและลําดับหนึ่ง เมื่อมีความเขมขนของสารมลพิษอินทรียในน้าํเสียสูงและต่ําตามลําดับ ในการศึกษาการบําบดัน้ําเสียจากโรงอาหารของจุฬาลงกรณมหาวิทยาลัย พบวา การเพิ่มความหนาแนนกระแสไฟฟาที่ปอนใหขัว้ไฟฟาจาก 5 เปน 10 มิลลิแอมแปรตอตารางเซนติเมตร ทําใหประสิทธิภาพการกําจัดคารบอนอินทรียและคาซโีอดีลดลง เนือ่งจากการเพิ่มความหนาแนนกระแสไฟฟาที่ปอนใหขั้วไฟฟาทําใหศักยไฟฟาของเซลลมีคาสูงขึ้น ซ่ึงทําใหเกดิปฏิกิริยาขางเคยีงมากขึ้น สวนการเพิม่ระยะเวลาทีน่้ําเสียอยูในเครื่องปฏิกรณเพิม่ขึ้นจาก 2 เปน 3 ช่ัวโมง ทําใหประสิทธิภาพการกําจัดคารบอนอินทรียและคาซีโอดีเพิ่มขึ้นเล็กนอย เนื่องจากอัตราการเกิดปฏกิิริยาในชวง 2 ช่ัวโมงแรกมีคาสูง ความหนาของผิวเคลือบดีบุกออกไซดไมมีผลตอประสิทธิภาพการกําจัดคารบอนอินทรียและคาซีโอดี เนื่องจากปฏิกิริยาการผลิตอนุมูลไฮดรอกซิลเกิดเพียงที่ผิวของขั้วไฟฟาเทานัน้
ภาควิชา............เคมีเทคนิค.................................. ลายมือช่ือนิสิต.................................................................. สาขาวิชา..........เคมีเทคนิค.................................. ลายมือช่ืออาจารยที่ปรึกษา............................................... ปการศึกษา.......2549........................................... ลายมือช่ืออาจารยทีปรึกษา……....................................... ลายมือช่ืออาจารยทีปรึกษารวม........................................
VI
# # 4473810523: MAJOR CHEMICAL TECHNOLOGY KEY WORD: RESTAURANT WASTEWATER / ELECTROCHEMICAL OXIDATION / MOCVD / SnO2 SPECIFIC ELECTRODE / WASTEWATER TREATMENT
SONGSAK KLAMKLANG: RESTAURANT WASTEWATER TREATMENT BY ELCTROCHEMICAL OXIDATION IN CONTINUOUS PROCESS. THESIS ADVISOR: PROF. SOMSAK DAMRONGLERD, Dr. Ing, PROF. PATRICK DUVERNEUIL, Dr. de l’INPT, THESIS CO-ADVISORS: ASSOC. PROF. KEJVALEE PRUKSATHORN, Dr. de l’INPT, 199 pp. ISBN 974-14-3476-6.
The specific electrode is necessary for destruction of organic pollutant in restaurant wastewater by electrochemical oxidation. In this research, the specific electrode was prepared by metal-organic chemical vapor deposition (MOCVD) in a hot-wall CVD reactor with the presence of O2 under reduced pressure. The Ir protective layer was deposited by using (Methylcyclopentadienyl) (1,5-cyclooctadiene) iridium (I), (MeCp)Ir(COD), as precursor. Tetraethyltin (TET) was used as precursor for the deposition of SnO2 active layer. The optimum condition for Ir film deposition was 300 ºC, 125 of O2/(MeCp)Ir(COD) molar ratio and 12 torr of total pressure. While that of SnO2 active layer was 380 ºC, 1200 of O2/TET molar ratio and 15 torr of total pressure.
The simulation of Ir deposition using FLUENT® shows the good agreement with the experimental data. However, the case of 300 ºC and titanium substrate, the simulation results have deviated from the experimental data that maybe attributed by the different on surface chemistry of each substrate or the higher surface roughness of titanium substrate.
The prepared SnO2/Ir/Ti electrodes were tested for anodic oxidation of organic pollutant in a simple three-electrode electrochemical reactor using oxalic acid as model solution. The electrochemical experiments indicate that more than 80% of organic pollutant was removed in 2 hr. In first 2 hr, the kinetic investigation gives a zero-order respect to TOC of model solution and the destruction of pollutant was limited by the reaction kinetic. Then, it was first-order respect to TOC of model solution that limited by the mass transfer of pollutant to the electrode.
Furthermore, the SnO2/Ir/Ti electrodes were used in this restaurant wastewater treatment within Chulalongkorn University. The increase of current density leads to the decrease of TOC and COD removal efficiency as a results of the increases of cell voltage and side reaction. Increasing residence time from 2 to 3 hr had not greatly influenced on TOC and COD removal efficiency due to slower reaction after 2 hr. The SnO2 film thickness had no effect on TOC and COD removal efficiency because the production of adsorbed hydroxyl radicals for pollutant destruction occurred only at the surface of electrode.
Department...Chemical Technology......... Student’s signature...........................................
Field of study...Chemical Technology...... Advisor’s signature..........................................
Academic Year …..2006........................... Advisor’s signature..........................................
Co-advisor’s signature......................................
VII
# # 4473810523: MAJOR CHEMICAL TECHNOLOGY KEY WORD: RESTAURANT WASTEWATER / ELECTROCHEMICAL OXIDATION / MOCVD / SnO2 SPECIFIC ELECTRODE / WASTEWATER TREATMENT
SONGSAK KLAMKLANG: RESTAURANT WASTEWATER TREATMENT BY ELCTROCHEMICAL OXIDATION IN CONTINUOUS PROCESS. THESIS ADVISOR: PROF. SOMSAK DAMRONGLERD, Dr. Ing, PROF. PATRICK DUVERNEUIL, Dr. de l’INPT, THESIS CO-ADVISORS: ASSOC. PROF. KEJVALEE PRUKSATHORN, Dr. de l’INPT, 199 pp. ISBN 974-14-3476-6.
Cette étude traite de l’élaboration et de la mise en œuvre d’électrodes spécifiques
pour la destruction par oxydation électrochimiques des polluants organiques présents dans les eaux résiduaires de restaurants. Dans ce travail, les électrodes spécifiques sont préparées par dépôt chimique à partir d’une phase vapeur de précurseur organométallique (OMCVD). La sous-couche protectrice d’iridium ou d’oxyde d’iridium est déposée à partir d’iridium methylcyclopentadiene 1-5 cyclooctadiène, (MeCp)Ir(COD) ou d’acetylacétonate d’iridium, Ir(acac)3. La couche catalytique d’oxyde d’étain est quant à elle déposée à partir de tétraéthyl étain (TET). La première partie de l’étude a consisté à déterminer les conditions opératoires optimales pour les différentes couches (iridium, oxyde d’iridium, oxyde d’étain). Un travail de modélisation a également été développé dans le cas du dépôt d’iridium afin d’identifier les paramètres clef du procédé et de faciliter un changement d’échelle du procédé.
Les électrodes composites (SnO2/Ir/Ti) ont ensuite été testées lors de la dégradation de solution d’acide oxalique. Les résultats expérimentaux montrent que 80% de la pollution organique est éliminée en 2 heures. Une étude de la cinétique de cette réaction a permis de mettre en évidence que cette dégradation s’opère en deux étapes. La première étape, correspondant aux fortes concentrations de carbone organique total (COT) suit une loi d’ordre zéro alors que pour les faibles valeurs du COT, la cinétique suit une loi d’ordre un qui a été attribuée à une limitation par le transfert de matière.
Enfin, ces électrodes ont été mises en œuvre pour traiter les eaux résiduaires du restaurant universitaire de l’Université Chulalongkorn (Thaïlande). Il a été montré que l’augmentation de la densité de courant conduisait à une diminution de l’efficacité du procédé tant sur la demande chimique en oxygène (DCO) que sur le COT. Il est également apparu que l’augmentation du temps de traitement (de 2 heures à 3 heures) n’avait pas beaucoup d’effet sur l’efficacité du traitement. Il a été montré par ailleurs que l’épaisseur de la couche d’oxyde d’étain n’avait pas d’effet sur l’efficacité de la diminution du COT et de la DCO.
Department...Chemical Technology......... Student’s signature...........................................
Field of study...Chemical Technology...... Advisor’s signature..........................................
Academic Year …..2006........................... Advisor’s signature..........................................
Co-advisor’s signature......................................
Acknowledgements
I would like to express my sincere gratitude and appreciation to
Professor Dr. Somsak Damronglerd, Professor Dr. Patrick Duverneuil
and Associate Professor Dr. Kejvalee Pruksathorn, for providing me with
the insights and guidance to recognize my mistakes and constant
encouragement. I would also like to thank them for lending me adequate
freedom and flexibility while working on my Ph.D. study.
I would like to thank Professor Dr. Pattarapan Prasassarakich for
serving as chairman of the committee and also for some kindness helps
during my Ph.D. study. Furthermore, I would like to thank Assistant Professor
Dr. Hugues Vergnes and Dr. François Senocq for their keen observations
regarding my work and for providing valuable suggests and for their care
while I stayed at Toulouse, France. Dr. Jean Pierre Bonino, Dr. Thawach
Chatchupong and Assistant Professor Dr. Sangobtip Pongstabodee have also
been very supportive for my Ph.D. work. I would like to thank them for their
guidance and for serving as members of my thesis committee.
I would like to acknowledge the Royal Golden Jubilee Ph.D.
Program of the Thailand Research Fund and the Embassy of France in
Thailand for the financial support to my Ph.D. work.
I wish to express my grateful appreciation to Department of
Chemical Technology, Faculty of Science, Chulalongkorn University,
Thailand. I also gratefully thank to Laboratoire de Génie Chimique and
Centre Inter-universitaire de Recherche et d’Ingéniérie des Matériaux,
Ecole Nationale Supérieure des Ingénieurs en Arts Chimiques et
Technologiques, Institut National Polytechnique de Toulouse, France.
A very special thank has expressed to my father, my mother, my
family and my friends for their encouragement and love.

Table of Contents Page
Abstract (in Thai)………………………………………………. Abstract (in English)…………………………………………… Abstract (in French)…………………………………………… Acknowledgements…………………………………………...… Table of Contents………………………………...……………... List of Tables…………………………………………………..… List of Figures………………………………………………...….
VVI
VIIVIII
IXXIIIXIV
Chapter 1 General Introduction…………………………….. 11.1 Introduction…………………………………………………. 1.2 Objectives…………………………………………………... 1.3 The steps of work…………………………………………....
134
Chapter 2 Bibliography……………………………………….. 2.1 Wastewater…………………………………………………. 2.2 Restaurant wastewater……………………………………… 2.3 Wastewater treatment process………………………………
2.3.1 Physical treatment…………………………………… 2.3.2 Biological treatment…………………………………. 2.3.3 Chemical treatment………………………………......
2.4 Electrochemical treatment………………………………….. 2.4.1 Electrocoagulation…………………………………... 2.4.2 Electroflotation…………………………………….... 2.4.3 Electrochemical oxidation…………………………...
2.5 Mechanisms of electrochemical oxidation…………………. 2.5.1 Electrochemical conversion…………………………. 2.5.2 Electrochemical combustion………………………… 2.5.3 Electrochemical oxidation performance……………..
2.6 Electrocatalytic electrodes…………………………………. 2.7 Influence of electrode material on process performance…... 2.8 SnO2 type dimensionally stable anodes…………………….
2.8.1 Preparation of SnO2 type dimensionally stable anodes………………………………………………..
2.9 Chemical vapor deposition………………………………….
66778
11121515181919222528343741
4248
X
2.9.1 Thermodynamics of chemical vapor deposition…….. 2.9.2 Thermal chemical vapor deposition processes……… 2.9.3 Metal-organic chemical vapor deposition (MOCVD). 2.9.4 Metal-organic chemical vapor deposition of tin oxide (SnO2) 2.9.5 Metal-organic chemical vapor deposition of iridium
(Ir) and iridium oxide (IrO2)……………………….... 2.10 Computational fluid dynamics (CFD)……………………...
2.10.1 Fundamentals of computational fluid dynamics……. 2.10.2 Commercial CFD software package………………...
2.10.3 Simulation by using FLUENT®……………………..
2.10.4 Simulation of CVD Process Using FLUENT®……...
2.11 Conclusions…………………………….…………………...
52535455
61646670
73
7475
Chapter 3 Materials and Methods………………………..… 3.1. Chemicals…………………………………………………... 3.2. Substrate pretreatment………………………………………
3.2.1. Stainless steel 316L………………………………..... 3.2.2. Borosilicate glass……………………………………. 3.2.3. Silicone wafer……………………………………….. 3.2.4. Titanium……………………………………………... 3.2.5. Tantalum…………………………………………..… 3.2.6. Tantalum carbide over tantalum…………………..…
767677777777777878
3.3. Deposition of TiO2 by spray coating……………………….. 3.4. Deposition SnO2 by spray pyrolysis……………………….. 3.5. Metal-organic chemical vapor deposition…………………..
3.5.1. Choice of precursor………………………………..… 3.5.2. Choice of substrate…………………………………... 3.5.3. Substrate placement…………………………………. 3.5.4. Deposition condition………………………………… 3.5.5. Deposition characterization………………………….
3.6. Simulation of Ir deposition using FLUENT®…..………….. 3.6.1. Simulation domain and boundary conditions……..… 3.6.2. Main assumptions for the simulation………………...
7878798081818287878790
XI
3.7. Electrochemical oxidation………………………………….. 3.7.1. Batch electrochemical oxidation…………………….. 3.7.2. Continuous electrochemical oxidation………………. 3.7.3. Pollutant removal efficiency………………………… 3.7.4. Characteristics of restaurant wastewater……………..
3.8. Conclusions……………..…………………………………..
929294959696
Chapter 4 Electrodes Elaboration…………………………... 4.1 Treatment of substrates ………...………………………….. 4.2 Protective underlayers elaboration...………………………..
4.2.1 Deposition of IrO2 by MOCVD …………….………. 4.2.2 Deposition of Ir by MOCVD ………………………..
4.3 Electrocatalytic layer deposition …………………………... 4.3.1 Deposition of TiO2 by spray coating ………………... 4.3.2 Deposition of SnO2 by spray pyrolysis ……………... 4.3.3 Deposition of SnO2 by MOCVD ……………………
4.4 Simulation of Ir deposition using FLUENT®……………..... 4.4.1 Reaction kinetic…………………… ………………... 4.4.2 Velocity and pressure profiles……….. ……………... 4.4.3 Temperature and gas density distribution …………... 4.4.4 Species and growth rate distribution………………… 4.4.5 Comparison of experimental data and simulation
results………………………………………………... 4.5 Conclusions……………………………………………….....
9898
101101105110110110 111 118118120123126
129132
Chapter 5 Electrochemical Oxidation……………………… 5.1 Activation of new electrodes………………………………. 5.2 Application of SnO2/Ir/Ti specific electrodes in batch
process with model solution………………………………... 5.2.1 Influence of SnO2 active film thickness……………… 5.2.2 Kinetic investigation…………………………………. 5.2.3 Influence of current density…………………………..
5.3 Application of SnO2/Ir/Ti specific electrodes for actual restaurant wastewater………………………………………. 5.3.1 Influence of current density………………………….. 5.3.2 Influence of residence time...........................................
133133
137138139143
145 145 148
XII
5.3.3 Influence of SnO2 active layer thickness…………….. 5.4 Treatment cost analysis of restaurant wastewater treatment
by electrochemical oxidation………………………………. 5.5 Conclusions…………………………………………………..
151
154 155
Chapter 6 General Conclusions …………………………….. 6.1 Electrodes elaboration……………………………………….
6.1.1 Protective underlayers elaboration…………………… 6.1.2 Electrocatalytic layer deposition……………………... 6.1.3 Simulation of Ir deposition using FLUENT®………...
6.2 Electrochemical oxidation…………………………………... 6.2.1 Application of specific electrodes in batch process
with model solution…………………………………. 6.2.2 Kinetic investigation for batch process with model
solution……………………………………………… 6.2.3 Application of specific electrodes for actual restaurant
wastewater…………………………………………...
158158158159160161
161
161
162References………………………………………………………... Appendices……………………………………………………….. Appendix A……………………………………………………… Appendix B………………………………………………………
Appendix C……………………………………………………… Biography……………………………………….………………...
164174175189192199
List of Tables
Table Page
2-1 2-2 2-3 3-1 3-2 3-3 3-4 3-5 3-6 3-7 5-1 5-2 5-3 A-1
Properties of various organo-tin…………………..................... Physical properties of iridium CVD precursors ……………… Common commercial CFD software………………………….. Operating conditions of IrO2 deposition using Ir(acac)3 as precursor……………………………………………………… Operating conditions of Ir deposition using ((MeCp)Ir(COD) as precursor…………………………………………………… Operating conditions of SnO2 deposition using tetraethyl tin as precursor……………………………………………………… Characteristics of model solution……………………………... Operating conditions for batch electrochemical oxidation of model solution………………………………………………… Operating conditions for continuous electrochemical oxidation.Characterization of wastewater from Chulalongkorn University Student Canteen………………………………………………...Effect of current density on restaurant wastewater treatment cost by electrochemical oxidation…………………………….. Effect of residence time on restaurant wastewater treatment cost by electrochemical oxidation…………………………….. Effect of SnO2 thickness on restaurant wastewater treatment cost by electrochemical oxidation…………………………….. Sample and reagent quantities for various digestion vessels…..
566371
83
84
8593
9394
96
156
156
157179
List of Figures
Figure Page
2-1 2-2 2-3
2-4
2-5
2-6
2-7 2-8
2-9
2-10 2-11
2-12
3-1 3-2
3-3 3-4 3-5 3-6 3-7
Scheme of electrocoagulation……………………………….. Electroflotation process……………………………………... Generalized scheme of the electrochemical conversion and combustion of organics with simultaneous oxygen evolution.................................................................................. Electrochemical corrosion rate of base metals as a function of H2SO4 concentration at anode potential of 2 V/SCE……………………………………………………….. Instantaneous current efficiency of various coating materials……………………………………………………... Influence of current density on the degradation rate of phenol……………………………………………………….. Crystalline structure of SnO2………………………………... Schematic overview of a medium frequency (MF) powered twin magnetron reactive sputtering system…………………. Cracking of IrO2 layer by sol-gel dip coating technique….. Schematic set-up for spray pyrolysis technique…………….. Sequence of gas transport and reaction processes contributing to CVD film growth…………………………… Schematic diagram of chemical, transport and geometrical complexities involved in modeling CVD process…………... MOCVD apparatus………………………………………….... Schematic diagram of silicon wafer and actual substrates placement in MOCVD reactor………………………………. Side view of the simulation domain………………………… Isometric view of the simulation domain…………………… Visualization of horizontal plane at y = 0…………………… Visualization of vertical plane at x = 0……………………… Visualization of vertical plane at z = 0.129 m……………….
1718
20
29
30
3342
444547
50
5180
828788919192
XV
3-8
3-9
3-10 4-1 4-2 4-3
4-4 4-5
4-6 4-7
4-8
4-9
4-10
4-11
4-12 4-13 4-14
4-15
4-16
4-17
Schematic diagram of batch electrochemical oxidation apparatus…………………………………………………….. Schematic diagram of continuous electrochemical oxidation apparatus…………………………………………………….. Shimadzu TOC-5050A TOC analyzer……………………… Roughness profile of 24 hr HF etched Ta substrate………… Roughness profile of 1 hr hot-HCl etched Ti substrate…....... Average surface roughness of Ta substrates with various etching time by HF………………………………….............. Scanning electron micrographs of some substrates…………. Effect of O2/Ir(acac)3 molar ratio on IrO2 film growth rate at 400 ºC and 25 Torr …………………………………………. X-Ray diffraction of IrO2 coated Si wafer…………………... Cross-sectional and surface microstructure of IrO2 film over Si wafer………………………………………………………. Effect of deposition temperature on deposition area of Ir film at 12 Torr and O2/(MeCp)Ir(COD) molar ratio of 1500…..…. Effect of deposition temperature on Ir film growth rate at 12 Torr and O2/(MeCp)Ir(COD) molar ratio of 1500…………... Effect of oxygen content in feed gas mixture on deposition area of Ir film at 300 ºC and 12 Torr………………………... Effect of oxygen molar ratio on Ir film growth rate at 300 ºC and 12 Torr………………………………………………….. Scanning electron micrographs of Ir film…………………… X-Ray diffraction of Ir coated Ti substrate…………………. Effect of feed gas composition on SnO2 film growth rate at 380 ºC and 15 Torr………………………………………….. The comparison of SnO2 film thickness at each point in the reactor, when deposition temperature of 380 °C, deposition pressure of 15 Torr and O2/TET molar ratio of 1,200………. X-Ray diffraction of SnO2 film over Si wafer at 380 ºC and 15 Torr………………………………………………………. Effect of total pressure on SnO2 film growth rate at 380 ºC and 15 Torr…………………………………………………..
93
94959999
100100
102103
104
106
106
107
108109109
112
113
114
115
XVI
4-18
4-19
4-20
4-21
4-22
4-23
4-24
4-25 4-26 4-27
4-28 4-29 4-30 4-31 4-32 4-33
4-34
4-35
5-1
5-2
Effect of substrate on SnO2 film growth rate at 380 ºC and 15 Torr………………………………………………………. Surface and cross-sectional microstructure of SnO2 film over various substrates……………………………………………. Contour of the velocity magnitude for the horizontal plane at y = 0…………………………………………………………. Contour of the velocity magnitude for the vertical plane corresponding at x = 0………………………………………. Velocity vector for the vertical plane corresponding to x = 0 around the third silicon substrate……………………………. Velocity path line for the vertical plane corresponding to x = 0 around the third silicon substrate……………………………. Velocity path line for the vertical plane corresponding to x = 0 around the real substrate and substrate holder………………. Contour of absolute pressure………………………………... Contour of gas temperature…………………………………. Comparison of the experimental and simulated temperature profile ……………………………………………………….. Contour of gas density………………………………………. Contour of oxygen mass fraction……………………………. Contour of (MeCp)Ir(COD) mass fraction………………….. Contour of by product mass fraction………………………... Contours of surface deposition rate…………………………. Comparison of experimental data and simulation results on Ir growth rates of electrode No. 40………………………….. Comparison of experimental data and simulation results on Ir growth rates of electrode No. 39………………………….. Comparison of experimental data and simulation results on Ir growth rates of electrode No. 40………………………….. Activation of SnO2/Ir/Ti electrode, current density of 10 mA/cm2 ……………………………………………………... Activation of SnO2/TaC/Ta electrode, current density of 10 mA/cm2.……………………………………………………...
116
117
120
121
121
122
122123124
125125126127127128
129
130
130
135
136
XVII
5-3
5-4
5-5
5-6
5-7
5-8
5-9 5-10
5-11
5-12
5-13
SnO2/TaC/Ta after activation, current density of 10 mA/cm2……………………………………………………… Evolution of the TOC concentration of an oxalic acid model solution obtained for electrode no. 52 ………………. Effect of SnO2 layer thickness on TOC removal by using of SnO2/Ir/Ti, electrode surface area of 3.2 cm2 and current density of 5 mA/cm2…………………………………………. Effect of SnO2 layer thickness on TOC removal efficiency by using of SnO2/Ir/Ti, electrode surface area of 3.2 cm2 and current density of 5 mA/cm2………………………………….. TOC concentration profile of model solution when t ≤ 2 hr by using of SnO2/Ir/Ti, SnO2 thickness of 1.8 micron, electrode surface area of 3.2 cm2 and current density of 5 mA/cm2……………………………………………………… TOC concentration profile of model solution when t > 2 hr by using of SnO2/Ir/Ti, SnO2 thickness of 1.8 micron, electrode surface area of 3.2 cm2 and current density of 5 mA/cm2.................................................................................... Comparison of experimental data and kinetic model……….. Effect of current density on TOC removal by using of SnO2/Ir/Ti, SnO2 thickness of 2.9 micron and electrode surface area of 3.2 cm2 obtained by electrode No. 55………. Effect of charge loading to the system on TOC removal by using of SnO2/Ir/Ti, SnO2 thickness of 2.9 micron and electrode surface area of 3.2 cm2 obtained by electrode No. 55……………………………………………………………. Effect of current density on TOC removal in continuous restaurant wastewater treatment by using of SnO2/Ir/Ti, SnO2 thickness of 1.8 micron……………………………….. Effect of current density on TOC removal efficiency in continuous restaurant wastewater treatment by using of SnO2/Ir/Ti, SnO2 thickness of 1.8 micron……………………..
136
137
138
139
140
142142
143
144
146
146
XVIII
5-14
5-15
5-16
5-17
5-18
5-19
5-20
5-21
5-22
5-23
Effect of current density on COD removal in continuous restaurant wastewater treatment by using of SnO2/Ir/Ti, SnO2 thickness of 1.8 micron……………………………….. Effect of current density on COD removal efficiency in continuous restaurant wastewater treatment by using of SnO2/Ir/Ti, SnO2 thickness of 1.8 micron…………………... Effect of residence time on TOC removal in continuous restaurant wastewater treatment by using of SnO2/Ir/Ti, SnO2 thickness of 1.8 micron and current density 5 mA/cm2……… Effect of residence time on TOC removal efficiency in continuous restaurant wastewater treatment by using of SnO2/Ir/Ti, SnO2 thickness of 1.8 micron and current density 5 mA/cm2……………………………………………………… Effect of residence time on COD removal in continuous restaurant wastewater treatment by using of SnO2/Ir/Ti, SnO2 thickness of 1.8 micron, current density of 5 mA/cm2…………. Effect of residence time on COD removal efficiency in continuous restaurant wastewater treatment by using of SnO2/Ir/Ti, SnO2 thickness of 1.8 micron and current density of 5 mA/cm2…………………………………………………….. Effect of SnO2 layer thickness on TOC removal in continuous restaurant wastewater treatment by using of SnO2/Ir/Ti and current density of 5 mA/cm2………………... Effect of SnO2 layer thickness on TOC removal efficiency in continuous restaurant wastewater treatment by using of SnO2/Ir/Ti and current density of 5 mA/cm2………………... Effect of SnO2 layer thickness on COD removal in continuous restaurant wastewater treatment by using of SnO2/Ir/Ti and current density 5 mA/cm2............................... Effect of SnO2 layer thickness on COD removal efficiency in continuous restaurant wastewater treatment by using of SnO2/Ir/Ti and current density of 5 mA/cm2………………...
147
147
149
149
150
150
152
152
153
153
Chapter 1
General Introduction
1.1 Introduction
In a big city as Bangkok, there are a lot of restaurants, food shops
and food centers, which everyday make large amounts of wastewater. The
direct discharge of wastewater from these restaurants and food shops to
the drainage system is a huge extra burden to the municipal wastewater
collection and treatment works. The oil and grease contained in the
wastewater aggregate and foul the sewer system and generate an
unpleasant odor.
Basically, restaurant wastewater treatment facilities must be highly
efficient in removing oil and grease, cause no food contamination and be
compact size. Low capital and operating costs are important because
profit margins of most restaurants are small. In addition, the technology
has to be simple so that it can be operated easily either by a chef or a
waiter [1].
Conventional biological processes are therefore ruled out due to the
requirement of large space, long residence time and skilled technicians.
Chemical coagulation/settlement is not practicable because of the low
efficiency in removing light and finely dispersed oil particles and possible
contamination of foods by chemicals. The G-bag approach, which uses a
bag of absorbent to capture the pollutants and degrade the pollutants with
the immobilized microorganisms on the absorbent, seems to be a good
2
alternative only if the system can be designed as simple and free from
fouling [1].
Electrochemistry is a clean, versatile and powerful tool for the
destruction of organic pollutants in water. Electrochemical oxidation of
organic compounds in aqueous solution is an anodic process occurring in
the potential region of water discharge to produce oxygen. Two different
pathways are described in the literatures for the anode oxidation of
undesired organic pollutants [2].
Electrochemical conversion transforms only the toxic non-
biocompatible pollutants into biocompatible organics, so that biological
treatment is still required after the electrochemical oxidation [3]. The
ideal electrode material which can be used in the electrochemical
conversion method must have high electrochemical activity for aromatic
ring opening and low electrochemical activity for further oxidation of the
aliphatic carboxylic acids which are in general biocompatible [3].
Electrochemical combustion method completely oxidizes the
organic pollutants to CO2 by physisorbed hydroxyl radicals. In this case,
the electrode material must have high electrocatalytic activity towards the
electrochemical oxidation of organics to CO2 and H2O [3].
Comparison of different anode materials, SnO2 is one of the best
candidates for removal of organic pollutants from wastewater by
electrochemical oxidation [2]. There are varieties of methods suitable for
preparing the SnO2 layer for obtaining dimensionally stable anodes such
as reactive sputtering, sol-gel dip coating, spray-pyrolysis or chemical
vapor deposition [2].
3
Chemical vapor deposition (CVD) is very attractive for thin film
coating. It has advantages for growing thin films such as good conformal
coverage on patterned or rough surfaces because of high throwing power
of gaseous reagents and a good ability for large-scale production. CVD is
particularly well adapted to uniform deposition on complex-shaped base
material with a relatively high growth rate [4]. Furthermore, using metal–
organic chemical vapor deposition (MOCVD) permits decreasing
significantly the deposition temperature and obtaining high purity of
deposited layer.
In this research, metal-organic chemical vapor deposition was used
as the technique for the preparation of electrocatalytic electrodes for
electrochemical oxidation of organic pollutants presented in restaurant
wastewater. The effects of substrate materials, SnO2 active layer thickness
and current density on pollutants removal efficiency of prepared
electrodes were investigated.
1.2 Objectives
1. Design and fabricate the continuous electrochemical oxidation
system for restaurant wastewater treatment
2. Determine the efficiency of pollutant reduction by electrochemical
oxidation in continuous process
3. Prepare the economical evaluation for restaurant wastewater
treatment by electrochemical oxidation in continuous process
4
1.3 The steps of work
- Literature surveys, that will continue throughout the research work.
- Part I Batch process
1. Prepare electrodes by metal-organic chemical vapor deposition and
characterize the prepared electrodes by SEM and XRD.
• In this part, the elaboration IrO2 and Ir coating for using as
protective layer were performed by using Ir(Acac)3 and
(MeCp)Ir(COD) as iridium source, repectively.
Subsequently, the deposition of SnO2 active layer was
perform using TET as precursor. The deposition was perform
in a hot-wall CVD reactor. Then, the coating will be
characterization by SEM and XRD. The simulation of Ir
deposition was archived using FLUENT® software.
2. Study and determine the optimum condition for removal of organic
pollutants in batch electrochemical oxidation using the prepared
electrodes;
• The various type of elaborated electrodes as shown
previously were utilized in destruction of organic pollutant
using oxalic acid as model solution. The pollutant removal
efficiency was determined on the effect of current density
and SnO2 film thickness. The kinetic of pollutant destruction
was also exmined in this part.
- Part II Continuous process
1. Fabricate the continuous electrochemical oxidation system.

5
2. Study and determine the organic pollutants removal efficiency from
actual restaurant wastewater in the continuous process by using the
optimum condition of batch experiment.
• The influences of current density, residense time and SnO2
film thinkness were examined and treatment cost analysis
was also determined in this part.
3. Result interpretation and discussions.
4. Conclude and write of dissertation manuscript

Chapter 2
Bibliography
2.1 Wastewater [5]
Water is a combination of two parts, hydrogen and oxygen as H2O.
However, pure water is only manufactured in a laboratory, water as we
know, it is not pure hydrogen and oxygen. Even the distilled water we
purchase in the store has measurable quantities of various substances in
addition to hydrogen and oxygen. Rainwater, before it reaches the earth,
contains many substances. These substances, since they are not found in pure
water, may be considered as the impurities. When rain falls through the
atmosphere, it gains nitrogen and other gases. As soon as the rain flows over
land, it begins to dissolve from the earth and rocks such substances as
calcium, magnesium, sodium, chloride, sulfate, iron, nitrogen, phosphorus,
and many other materials. Organic matter is also dissolved by water from
contact with decaying leaves, twigs, grass, or small insects and animals.
Thus, a fresh flowing mountain stream may pick up many natural impurities,
some possibly in harmful amounts, before it ever reaches civilization or is
affected by the waste discharges of society. Many of these substances are
needed in small amounts to support life and are useful to humans.
The waste discharge that first comes to mind in any discussion of
stream pollution is the discharge of domestic wastewater, wastewater
contains a large amount of organic waste. Industry also contributes
8
substantial amounts of organic waste. Some of these organic industrial
wastes come from vegetable and fruit packing, dairy processing, meat
packing, tanning and processing of poultry, oil, paper, and fiber (wood) and
many more. All organic materials have one thing in common - they all
contain carbon.
2.2 Restaurant wastewater [6]
Wastewater from restaurants and other commercial food service
facilities differ significantly from residential wastewater. In addition to
higher surge volumes during busy periods and generally higher temperature.
The pollutants in restaurant wastewater are come from the cleaning of
dishes, kitchen wares, meat and vegetable. Restaurant wastewater is
typically higher in strength than residential wastewater. This due to the
higher content in organic pollutants exactly oil and grease.
Oil and grease frequently cause problems of both wastewater
collection and treatment systems. The problem occurs when oil and grease
solidifies in sewage lines and will cover on the surface of treatment systems
causing a decrease in the treatment system efficiency.
2.3 Wastewater treatment processes [7]
Wastewater treatment consists of applying known technology to
improve or upgrade the quality of a wastewater. Usually wastewater
9
treatment will involve collecting the wastewater in a central, segregated
location and subjecting the wastewater to various treatment processes. Most
often, since large volumes of wastewater are involved, treatment processes
are carried out on continuously flowing wastewaters or open systems rather
than as batch or a series of periodic treatment processes in which treatment is
carried out on parcels or batches of wastewaters. While most wastewater
treatment processes are continuous flow, certain operations, such as vacuum
filtration, involving as it does, storage of sludge, addition of chemicals,
filtration and removal or disposal of the treated sludge, are routinely handled
as periodic batch operations. Wastewater treatment can be organized or
categorized by the nature of the treatment process operation being used such
as physical, chemical or biological treatment.
2.3.1 Physical treatment [7]
Sedimentation
Sedimentation is employed for the removal of suspended solids from
wastewaters. The process can be considered in the three basic classifications,
depending on the nature of the solids present in the suspension, there are
discrete, flocculent and zone settling. In the discrete settling, the particle
maintains its individuality and does not change in size, shape or density
during the settling process. Flocculent settling occurs the particles
agglomerate during the settling period with a resulting change in size and
settling rate. Zone settling involves a flocculated suspension which forms a
lattice structure and settles as a mass, exhibiting a distinct interface during
the settling process. Compaction of the settled sludge occurs in all
sedimentation but will be considered separately under thickening.
10
Flotation
Flotation is used for the removal of suspended solids, oil and grease
from the wastewaters and for the separation and concentration of sludge. The
waste flow of a portion of clarified effluent is pressurized to 3.4-4.8 atm in
the presence of sufficient air to approach saturation. When this pressurized
air-liquid mixture released to atmospheric pressure in the floatation unit,
minute air bubbles are released from the solution. The sludge flocs,
suspended solids or oil globules are floated by these minute air bubbles,
which attach themselves to and became in the floc particles. The air-solids
mixture rises to the surface, where it is skimmed off. The clarified liquid is
removed from the bottom of the flotation unit, at this time a portion of the
effluent may be recycled back to the pressure chamber. When flocculent
sludges are to be clarified, pressurized recycle will usually yield a superior
effluent quality since the flocs are not subjected to shearing stress through
the pumps and pressurizing system.
Coagulation
Coagulation is employed for the removal of waste materials in
suspended or colloidal form. Colloids are presented by particles over a range
of 0.1-1.0 nm. These particles do not settle out on standing and cannot be
removed by conventional physical treatment processes.
Colloids present in wastewater can be either hydrophobic or
hydrophilic. The hydrophobic colloids possess no affinity for the liquid
medium and lack stability in the presence of electrolytes. They are readily
susceptible to coagulation. Hydrophilic colloids, such as proteins, exhibit a
11
marked affinity for water. The absorbed water retards flocculation and
frequently requires special treatment to achieve effective coagulation.
Electrical properties of the colloids create a repelling force and
prevent agglomeration and settling. Stabilizing ions are strongly adsorbed to
an inner fixed layer which provides a particle charge that varies with the
valence and number of adsorbed ions. Ions of an opposite charge form a
diffuse outer layer which is held near the surface by electrostatic forces. The
stability of a colloid is due to the repulsive electrostatic forces and in the
case of hydrophilic colloids to solvation in which an envelope of water
retards coagulation.
Adsorption
Many wastewaters contain organics which are refractory and which
are difficult or impossible to remove by conventional biological treatment
processes, such as acrylonitrile-butadiene-styrene (ABS) and some of
heterocyclic organics. These materials can frequently be removed by
adsorption on an active-solid surface. The most commonly used adsorbent is
activated carbon. The solid surface in contact with the solution tends to
accumulation a surface layer of solute molecules because of the unbalance of
the surface forces. The physical adsorption results from molecular
condensation in the capillaries of the solid. In general, substances of high
molecular weight are most easily adsorbed. There is a rapid formation of an
equilibrium interfacial concentration, follow by the slow diffusion into the
carbon particles. The overall rate of adsorption is controlled by the rate of
diffusion of the solute molecules within the capillary pores of the carbon
particles. The rate varies reciprocally with the square of the particle diameter

12
and increases with the increasing of solute concentration and increasing of
temperature, but decreases with the increasing of molecular weight of the
solute.
2.3.2 Biological treatment [7]
The biological processes in treatment plants are carried out by a very
diversified group of organisms. It is only possible roughly to list which
species are present as it proves that the fauna in a treatment plant is very
dependent on the external conditions.
All organisms in the biological treatment plant must necessarily have
their origins from the outside; that is, they come from the wastewaters, from
the air, the soil or from the animals which live close to the plant. An
essential part of individual organisms has grown in the plant itself.
The two main types of biological treatment plants are activated sludge
and biofilters treatment plants.
Activated sludge treatment
The principle in activated sludge treatment plants is that a mass of
activated sludge is kept moving in the water by stirring or aeration. Apart
from the living biomass, the suspended solids contain inorganic as well as
organic particles. Some of the organic particles can be degraded by
subjecting them to hydrolysis whereas others are non-degraded.
The amount of suspended solids in the treatment plant is granulated
through the recycle of the suspended solids and by removing the so called-
13
excess sludge. The handling and disposal of the excess-sludge is one of the
environmentally difficult problems in water treatment processes.
Biofilters
Biofilters are characterized by bacteria being attached to a solid
surface in the form of a biofilm. Biofilm is a dense layer of bacteria
characterized by their ability to adhere to a solid medium and form a fixed
film of polymers in which the bacteria are protected against sloughing off.
Biofilters have a short hydraulic retention time and hence free bacteria in the
water will be washed out.
The disadvantage of the biofilters is the low efficiency of the biomass.
The reason is that the substances must be carried through the biofilm to be
removed by the bacteria. This transport takes place by molecular diffusion
which is a slow process. In practice it proves that the general rule is that the
removal is limited by diffusion. These phenomena must be understood in
order to understand the functioning of biofilters.
2.3.3 Chemical treatment [7]
Ozonation
Ozone is a gas at normal temperature and pressure. As with oxygen,
the solubility of ozone in water depends on temperature and the partial
pressure of ozone in the gas phase and has recently been thought to also be a
function of pH. Ozone is unstable and the rate of decomposition increases
with temperature and pH. The decomposition is catalyzed by the hydroxyl
radical (OH•), the radical decomposition product of ozone, the organic solute
14
decomposition products and by variety of the other substances such as solid
alkalis, transition metals, metal oxides and carbon. Under practical
conditions, complete degradation of fairly unreactive compounds such as
saturated hydrocarbons and halogenated aliphatic compounds does not occur
with ozone alone, but current research has shown that ozone with addition of
energy source such as sonification or ultraviolet readily decomposes these
refractory compounds.
Ozonation of unsaturated aliphatic or aromatic compounds causes a
reaction with water and oxygen to form acids, ketones and alcohols. At a pH
greater than 9 in presence of redox salts such as Fe, Mn and Cu, aromatic
may form some hydroxyaromatic structures (phenolic compound) with
maybe toxic. Many of the byproducts of ozonation are readily biodegradable.
Organic removal is improved with the ultraviolet radiation. It is
postulated that the ultraviolet activates the ozone molecule and may also
activate the organics. Ozone-ultraviolet is effective for the oxidative
destruction of pesticides to terminal end products of CO2 and H2O.
Hydrogen peroxide
Hydrogen peroxide in the presence of a catalyst such as iron,
generated hydroxyl radical (•OH) which react with organics and reduced
compounds in a similar to ozone [7].
OHOHFeOHFe •−++ ++→+ 322
2 (2-1)
+•++ ++→+ HOOHFeOHFe 222
3
(2-2)
15
OHRRHOH 2+→+ •• (2-3)
OHROHOHR •• +→+ 22 (2-4)
+−+• +→+ 32 FeOHFeOH (2-5)
Chlorine
Chlorine may be used as a chemical oxidant. In reaction with inorganic
materials terminal end products usually result such as NaCl and nitrogen gas
were produced from the oxidation of cyanide by using NaOCl as chlorine
source. While chlorinated hydrocarbons were produced from organic
oxidations.
Wet air oxidation
Wet air oxidation has been successfully applied in a number of
applications for organics reduction. Wet air oxidation is based on a liquid
phase reaction between organic materials in wastewater and oxygen supplied
by compressed air. The reaction takes place flamelessly in an enclosed
vessel, which is pressurized and at high temperatures, typically 136 atm
gauge and 288 oC. The system temperature is initiated by a startup boiler and
maintained through autothermal combustion of organics once the reaction
starts.
16
2.4 Electrochemical treatment [8]
Water treatment by electricity was used for several years, but
electrochemical water or wastewater technologies did not find wide
application by the limitation of relatively high capital investment and the
expensive electricity supply. However, with the increasing standard of
drinking water supply and the stringent environmental regulations regarding
the wastewater discharge, electrochemical technologies have regained their
importance worldwide during the past two decades. There are companies
supplying facilities for metal recoveries, for treating drinking water or
process water, treating various wastewaters resulting from tannery,
electroplating, diary, textile processing, oil and oil-in-water emulsion, etc.
Nowadays, electrochemical technologies have reached such a state that they
are not only comparable with other technologies in terms of cost but also are
more efficient and more compact. For some situations, electrochemical
technologies may be the indispensable step in treating wastewaters
containing refractory pollutants. In addition, electrochemical process is a
clean process that does not generate by-product or other pollutants.
2.4.1 Electrocoagulation
Electrocoagulation involves the in situ generation of coagulants by
dissolving electrically either aluminum or iron ions from aluminum or iron
electrodes, repectively. The metal ions generation takes place at the anode,
hydrogen gas is released from the cathode. The hydrogen gas would also
help to float the flocculated particles out of the water. This process
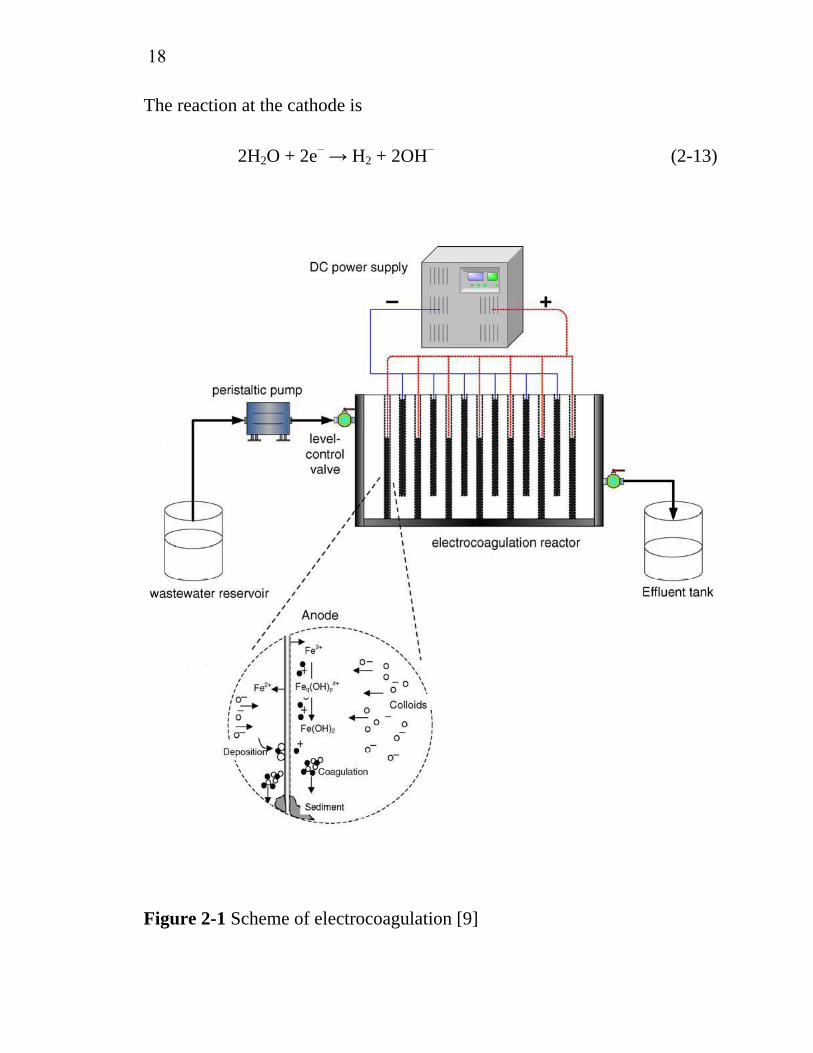
sometimes is called electroflocculation. It is schematically shown in Figure
2-1. The electrodes can be arranged in a mono-polar or bi-polar mode. The
17
materials can be aluminum or iron in plate form or packed form of scraps
such as steel turnings, millings, etc. The chemical reactions taking place at
the anode are given as follows.
For aluminum anode:
Al → Al3+ + 3e− (2-6)
At alkaline conditions
Al3+ + 3OH− → Al(OH)3 (2-7)
At acidic conditions
Al3+ + 3H2O → Al(OH)3 + 3H+ (2-8)
For iron anode:
Fe → Fe2+ + 2e− (2-9)
At alkaline conditions
Fe2+ + 2OH− → Fe(OH)2 (2-10)
At acidic conditions
4Fe2+ + O2 + 2H2O → 4Fe3+ + 4OH− (2-11)
In addition, there is oxygen evolution reaction
2H2O → O2 + 4H+ + 4e− (2-12)
18
The reaction at the cathode is
2H2O + 2e− → H2 + 2OH− (2-13)
Figure 2-1 Scheme of electrocoagulation [9]
19
The Al3+ or Fe2+ ions are very efficient coagulants for particulates
flocculating. The hydrolyzed aluminum ions can form large networks of Al–
O–Al–OH that can chemically adsorb pollutants such as F−. Aluminum is
usually used for water treatment and iron for wastewater treatment [3]. The
advantages of electrocoagulation include high particulate removal efficiency,
compact treatment facility, relatively low cost and possibility of complete
automation.
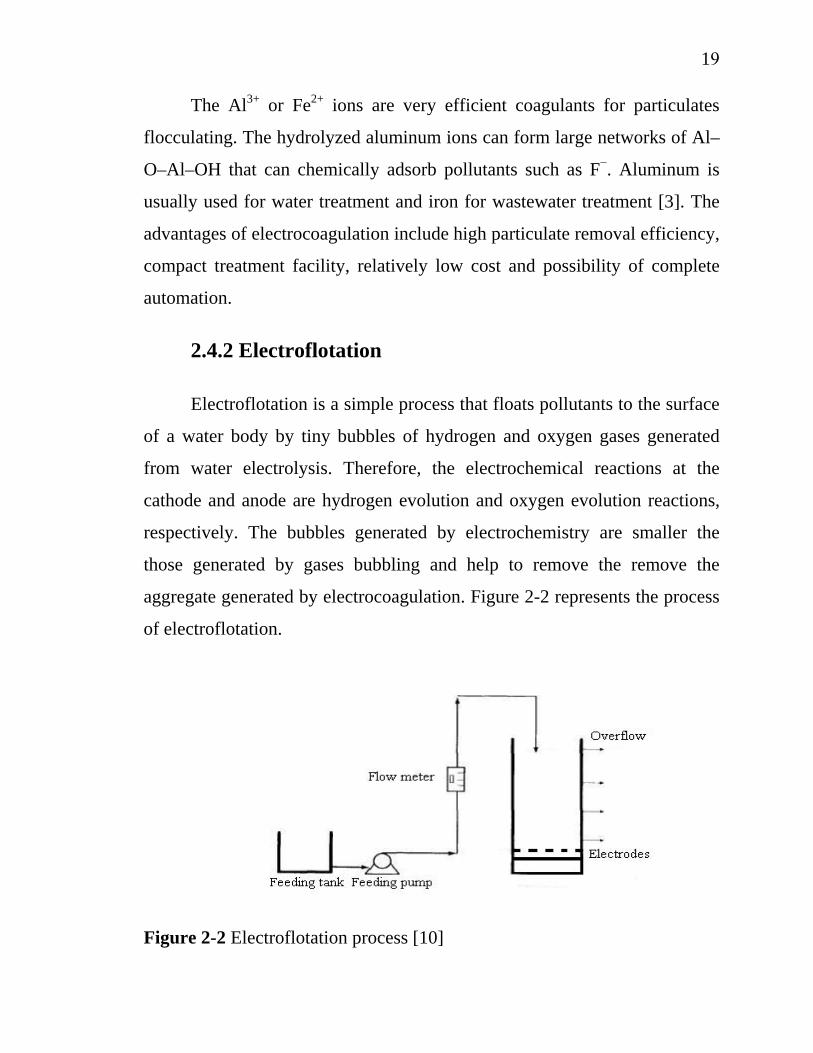
2.4.2 Electroflotation
Electroflotation is a simple process that floats pollutants to the surface
of a water body by tiny bubbles of hydrogen and oxygen gases generated
from water electrolysis. Therefore, the electrochemical reactions at the
cathode and anode are hydrogen evolution and oxygen evolution reactions,
respectively. The bubbles generated by electrochemistry are smaller the
those generated by gases bubbling and help to remove the remove the
aggregate generated by electrocoagulation. Figure 2-2 represents the process
of electroflotation.
Figure 2-2 Electroflotation process [10]
20
2.4.3 Electrochemical oxidation
Study on electrochemical oxidation for wastewater treatment goes
back to the 19th century, when electrochemical decomposition of cyanide
was investigated [11]. Extensive investigation of this technology
commenced since the late 1970s [8]. During the last two decades, research
works have been focused on the efficiency in oxidizing various pollutants on
different electrodes, improvement of the electrocatalytic activity and
electrochemical stability of electrode materials, investigation of factors
affecting the process performance, and exploration of the mechanisms and
kinetics of pollutant degradation. Experimental investigations focus mostly
on the behaviors of anodic materials, the effect of cathodic materials was not
investigated extensively although Azzam et al. [12] have found a
considerable influence of the counter electrode material in the anodic
destruction of 4-chlorophenol.
2.5 Mechanisms of electrochemical oxidation [7]
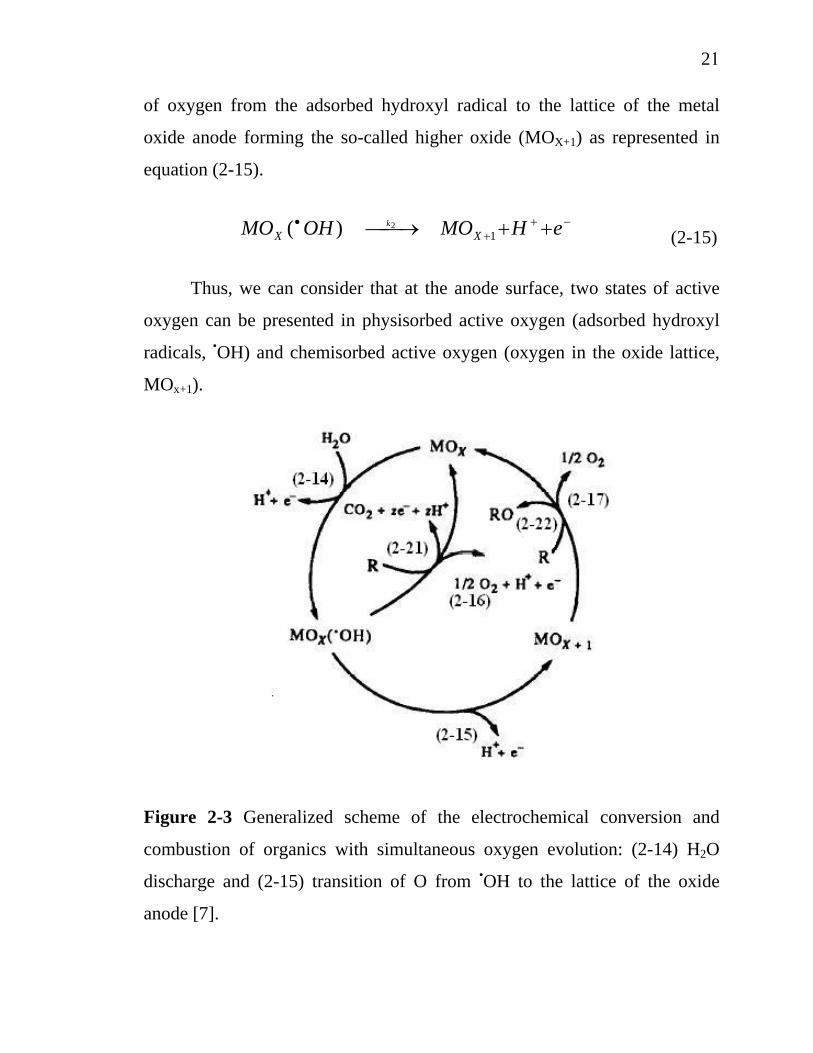
In Figure 2-3, a generalized scheme of the electrochemical conversion
and combustion of organics on metal oxide anode (MOx) is presented. In the
first step, H2O in acid or OH- in alkali solution is discharged at the anode to
produce adsorbed hydroxyl radical according to the equation (2-14).
(2-14) −+• ++⎯→⎯+ eHOHMOOHMO X
kX )(1
2
In the second step, the adsorbed hydroxyl radicals may interact with
the oxygen already present in the metal oxide anode with possible transition
21
of oxygen from the adsorbed hydroxyl radical to the lattice of the metal
oxide anode forming the so-called higher oxide (MOX+1) as represented in
equation (2-15).
(2-15) −+
+• ++⎯→⎯ eHMOOHMO XX
k1
2)(
Thus, we can consider that at the anode surface, two states of active
oxygen can be presented in physisorbed active oxygen (adsorbed hydroxyl
radicals, •OH) and chemisorbed active oxygen (oxygen in the oxide lattice,
MOx+1).
Figure 2-3 Generalized scheme of the electrochemical conversion and
combustion of organics with simultaneous oxygen evolution: (2-14) H2O
discharge and (2-15) transition of O from •OH to the lattice of the oxide
anode [7].
22
In the absence of any oxidizable organics, the physisorbed and
chemisorbed active oxygen produce dioxygen according to the equation (2-
16) and (2-17).
XX MOeHOOHMO ok +++⎯→⎯ −+•
221)(
(2-16)
21 21OMOMO XX
dk +⎯→⎯+ (2-17)
Direct evidence for the last route of oxygen evolution at platinum
oxide (PtOx) is provided by the work of Rosenthal [13] who used 18O as a
tracer to show that portion of the evolved gas comes from oxygen already
present in the oxide film. This view was put forward several times with other
electrodes (RuO2, IrO2, NiCo2O4 and NiOOH) [14].
Such a result may be explained in terms of the equations (MO = oxide
anode).
−+• ++→+ eHOHOMOHOM 22)(222 1618162
18 (2-18)
−+• ++→ eHOMOHOM 222)(2 216/181618
(2-19)
(2-20) 216/181618
216/182 OOMOMOM ++→
In the presence of oxidizable organics, it is speculated that the
physisorbed active oxygen (•OH) should cause predominantly the complete
combustion of organics according to equation (2-21), and chemisorbed
23
active oxygen (MOx+1) participate in the formation of selective oxidation
products as represented in equation (2-22).
Complete combustion:
(2-21) Xk
X MOzezHCOOHMOR c +++⎯→⎯+ −+•2)(
Selective oxidation:
(2-22) Xk
X MOROMOR S +⎯→⎯+ +1
2.5.1 Electrochemical conversion
For the electrochemical conversion or selective oxidation of organics,
the concentration of adsorbed hydroxyl radicals on the anode surface must
be almost zero. To satisfy this condition, the rate of transition of oxygen into
the oxide lattice in equation (2-15), must be much more faster than the rate
of hydroxyl radicals formation in equation (2-14).
when
Rate of hydroxyl radicals formation = k1[MOX]
Rate of transition of oxygen in the oxide lattice = k2[ ]
k2[ ] » k1[MOX] (2-23)
24
where
k1 = Electrochemical rate constant for H2O discharge
k2 = Electrochemical rate constant for transition of
oxygen into oxide lattice
[MOX]= Concentration of active sites on the oxide anode
[ ] = Concentration of oxygen vacancies in the oxide
lattice.
Thus, efficient anodes for selective oxidation or electrochemical
conversion of organics must have low concentration of active sites on the
anode surface and must have a high concentration of oxygen vacancies in the
oxide lattice.
Oxides forming is called higher oxide (MOx+1) at potentials above the
thermodynamic potential for O2 evolution can be considered as oxides
having a high concentration of oxygen vacancies and can favor selective
oxidation of organics.
The current efficiency depends on the relative rate of the selective
oxidation of organics, equation (2-22) to rate of oxygen evolution by
decomposition of the higher oxide according to equation (2-17)
25
When
Rate of selective oxidation of organics = zsks[O][R]t
Rate of O2 evolution by decomposition of MOx+1 = kd[O]
Where
zs = Stoichiometry factor for selective oxidation;
ks = Electrochemical rate constant for the selective
oxidation of organics in equation (2-22)
kd = Electrochemical rate constant for O2 evolution in
equation (2-17)
[O] = Steady state concentration of active oxygen in the
oxide lattice
[R]t = Concentration of organics at a given time, t
The instantaneous current efficiency (ICE) can be given by the
relation in equation (2-24)
dtss
tss
kRkzRkzICE+
=][
][
(2-24)
26
This relation shows that the instantaneous current efficiency for the
selective oxidation is independent of the anode potential ,but depends on the
reactivity of organics. High ICE can be obtained with reactive organics and
with anodes having low rate for the decomposition of their higher oxide.
2.5.2 Electrochemical combustion
For the combustion of organics, high concentration of hydroxyl
radicals on the anode surface must be present. This is the case when the rate
of hydroxyl radicals formation according to equation (2-14), is much faster
than the rate of oxygen transition into oxide lattice as represented in equation
(2-15). The following relation must be satisfied.
k1[MOX] » k2[ ] (2-25)
Thus efficient oxide anodes for combustion of organics must have a
large number of active sites for the adsorption of hydroxyl radicals and must
have a very low concentration of oxygen vacancies in the oxide lattice.
Oxides in which the oxidation state of the cation is the highest
possible and/or which contains an excess oxygen in the oxide lattice can be
considered as oxides at the surface of which the hydroxyl radicals are
accumulated and favor the combustion of organics.
The current efficiency for the combustion of organics depends on the
relative rate of combustion of organics, represented in equation (2-21), to the
rate of oxygen by discharge of the adsorbed hydroxyl radicals according to
equation (2-16).
27
when
Rate of combustion of organics = zckc[•OH][R]t
Rate of O2 evolution by discharge of •OH = k0[•OH]
where
zc = Stoichiometry factor for complete combustion of
organics
kc = Electrochemical rate constant for the combustion of
organics
k0 = Electrochemical rate constant for O2 evolution
[•OH] = Steady-state concentration of adsorbed hydroxyl
radicals at the oxide anode
[R]t = Concentration of organics at a given time
The instantaneous current efficiency for electrochemical combustion
can be given by the relation.
0][][
kRkzRkzICEtcc
tcc
+=
(2-26)
This relation shows that the instantaneous current efficiency for the
combustion of organics depends on the nature of organics, its concentration,
the anode material and on the anode potential. High instantaneous current
28
efficiency for the combustion of organics can be obtained with anodes
having low electrochemical activity for O2 evolution by discharge of
hydroxyl radicals according to equation (2-16).
In the mechanism, it is very probable that dioxygen participates also in
the combustion of organics according to the following reaction scheme:
Formation of organic radicals by a hydrogen abstraction mechanism:
R-H + •OH → R• + H2O (2-27)
Reaction of the organic radicals with dioxygen formed at the anode:
R• + O2 → ROO• (2-28)
Further abstraction of a hydrogen atom with the formation of an
organic hydroperoxide (ROOH) and another organic radical:
ROO• + R’H → ROOH + R’• (2-29)
Since the organic hydroperoxides formed are relatively unstable,
decomposition of such intermediates often leads to molecular breakdown
and formation of subsequent intermediates with lower carbon numbers.
These scission reactions continue rapidly until the formation of carbon
dioxide and water.
29
2.5.3 Electrochemical oxidation performance
There are several researchers’ work on the parameters that affect on
the electrochemical oxidation process efficiency. In this section, we literate
on some important parameters for electrochemical treatment by
electrochemical oxidation.
Support materials
Vercesi et al. [15] worked on searching for a good dimensionally
stable electrode (DSA) that long service life for O2-evolution based on the
effects of support materials. Titanium, tantalum, zirconium, niobium and
some of their alloys were used as support materials on the performance of
IrO2-Ta2O5 coated electrodes. The thermal behavior and oxygen affinity
sequence of the metals, in relation to the electrode preparation procedure,
were determined thermogravimetrically. The electrochemical corrosion of
base metals was represented in Figure 2-4, the tantalum-based materials
presented the highest stability with the minimum corrosion rate. The
chemical and electrochemical stability of the base metals was found to be
directly related to the service life of the electrode, measured in 30% H2SO4
at 80°C and 750 mA/cm2. Tantalum-based electrodes represented the highest
service life, 1700 h and 120 h for titanium-based electrodes.
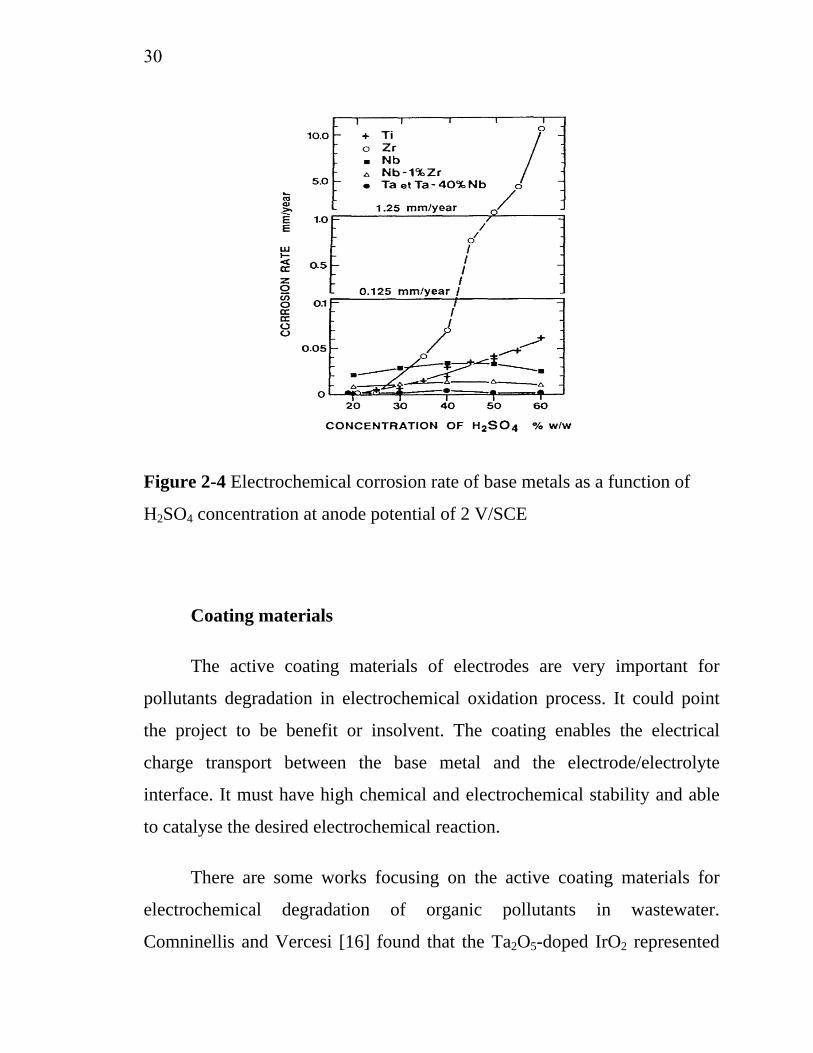
30
Figure 2-4 Electrochemical corrosion rate of base metals as a function of
H2SO4 concentration at anode potential of 2 V/SCE
Coating materials
The active coating materials of electrodes are very important for
pollutants degradation in electrochemical oxidation process. It could point
the project to be benefit or insolvent. The coating enables the electrical
charge transport between the base metal and the electrode/electrolyte
interface. It must have high chemical and electrochemical stability and able
to catalyse the desired electrochemical reaction.
There are some works focusing on the active coating materials for
electrochemical degradation of organic pollutants in wastewater.
Comninellis and Vercesi [16] found that the Ta2O5-doped IrO2 represented
31
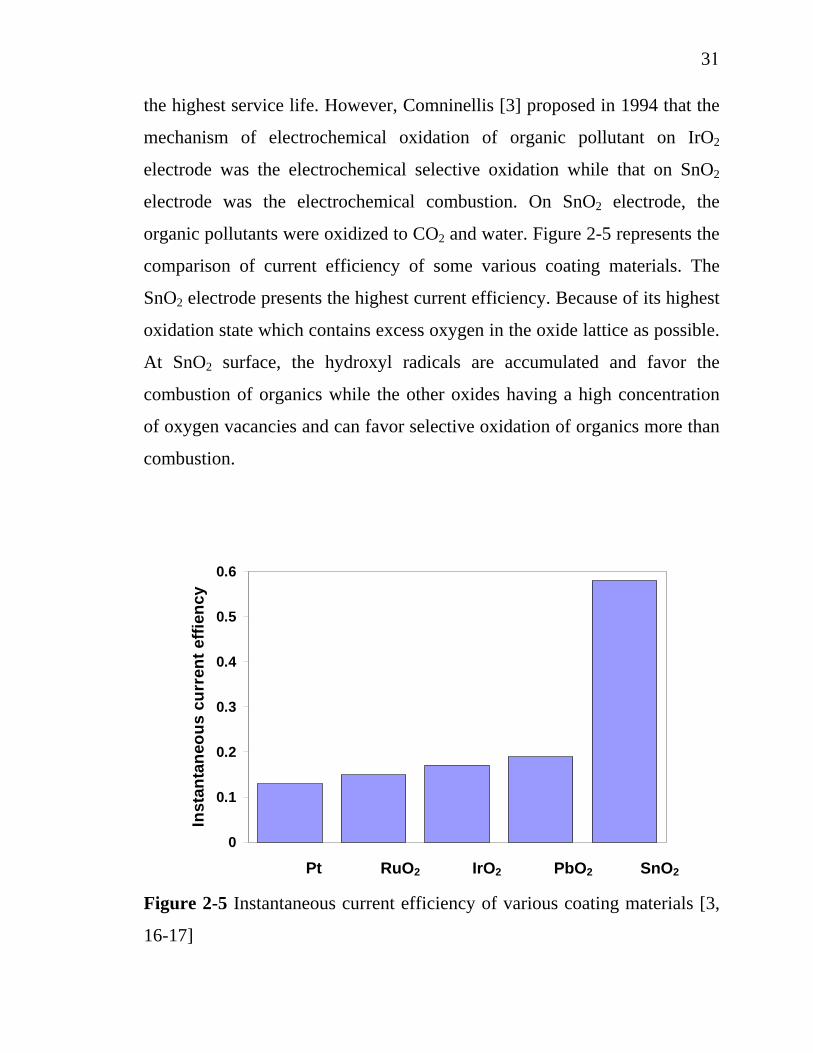
the highest service life. However, Comninellis [3] proposed in 1994 that the
mechanism of electrochemical oxidation of organic pollutant on IrO2
electrode was the electrochemical selective oxidation while that on SnO2
electrode was the electrochemical combustion. On SnO2 electrode, the
organic pollutants were oxidized to CO2 and water. Figure 2-5 represents the
comparison of current efficiency of some various coating materials. The
SnO2 electrode presents the highest current efficiency. Because of its highest
oxidation state which contains excess oxygen in the oxide lattice as possible.
At SnO2 surface, the hydroxyl radicals are accumulated and favor the
combustion of organics while the other oxides having a high concentration
of oxygen vacancies and can favor selective oxidation of organics more than
combustion.
0
0.1
0.2
0.3
0.4
0.5
0.6
Inst
anta
neou
s cu
rren
t effi
ency
Pt RuO2 IrO2 PbO2 SnO2
Figure 2-5 Instantaneous current efficiency of various coating materials [3,
16-17]
32
Not only SnO2 electrode has the good attractive to be used as electrode
for wastewater treatment in electrochemical oxidation, the diamond thin
films have been widely used in electrochemical studies due to the unique
properties like chemical stability, large potential range and mechanical
resistance. Their applications embrace the electroanalysis, electrosynthesis,
fuel cell and the organic pollutant degradation in wastewater [18]. Some
studies showed that conducting diamond electrodes could be grown by
energy-assisted (plasma or hot-filament) chemical vapor deposition on
several substrates, such as silicon, titanium, niobium, tantalum,
molybdenum, glassy carbon. Although all these substrates are currently
used, they still have some drawbacks. In fact, a silicon substrate is very
brittle, Nb, Ta, W are too expensive and the stability of the diamond layer
deposited on the Ti substrate is still not satisfactory, because cracks may
appear and cause the detachment of the diamond film during long-term
electrolysis [19]. The organic compound electrochemical oxidation
efficiency strongly depends on the used anode material and diamond is very
interesting due to its superior properties [18]. In recent years, there are some
publications on the application of diamond electrode for wastewater
treatment [18-22]. However, the application of diamond electrode for
organic pollutant degradation still limited due to the cost of diamond
electrode is too expensive.
pH
Normally, the efficiency of the oxidation of organics tends to be
superior in alkaline solution. That also holds for the anodic treatment using
standard electrode materials. The wastewater accessible to treatment process
has any pH and pH adjustment before treatment to the more favorable value
33
above 7 will be too expensive. Moreover, Stuki et. al. [23] proved that on
SnO2 electrodes, the degradation of benzoic acid was pH independent.
Cañizares et. al [24] proposed that the pH does not influence in the global
oxidation rate. Even if initial oxidation rate was higher in alkaline media.
However, after the galvanostatic developed, the oxidation rate in acidic
media surpasses those in the alkaline media. Because the accumulation of
oxalic acid in alkaline media was higher than that in acidic media, due to its
lower oxidazability at alkaline conditions.
Current density
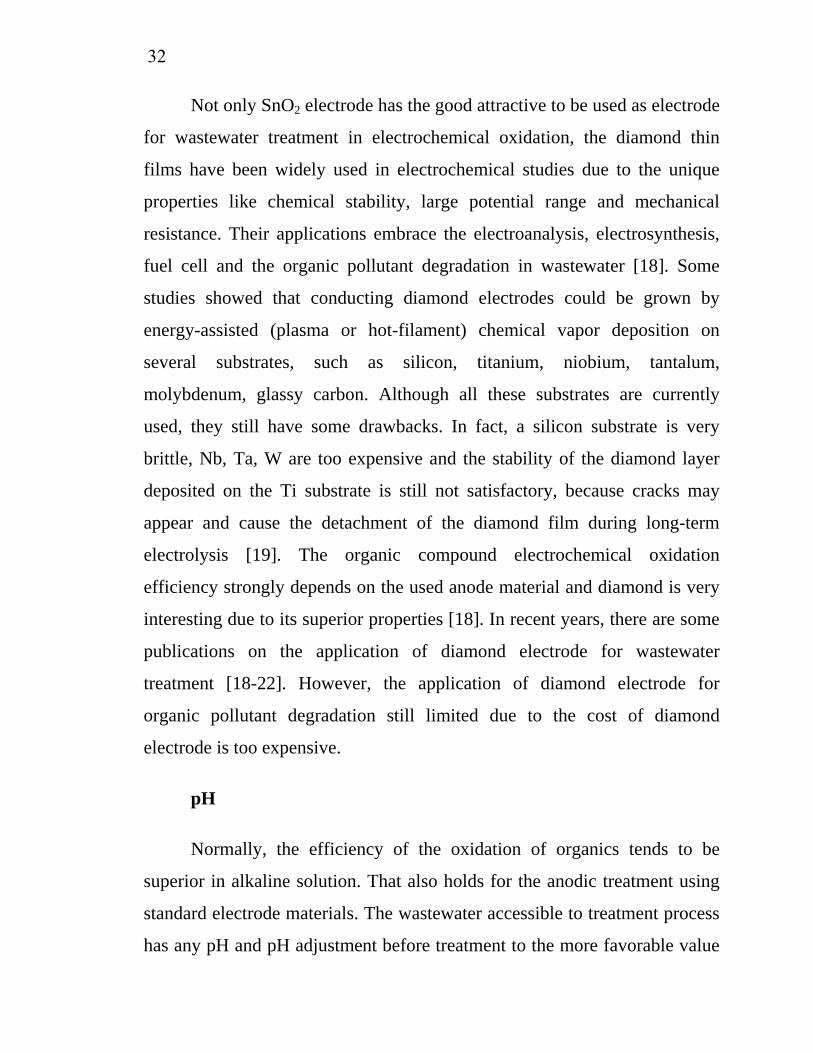
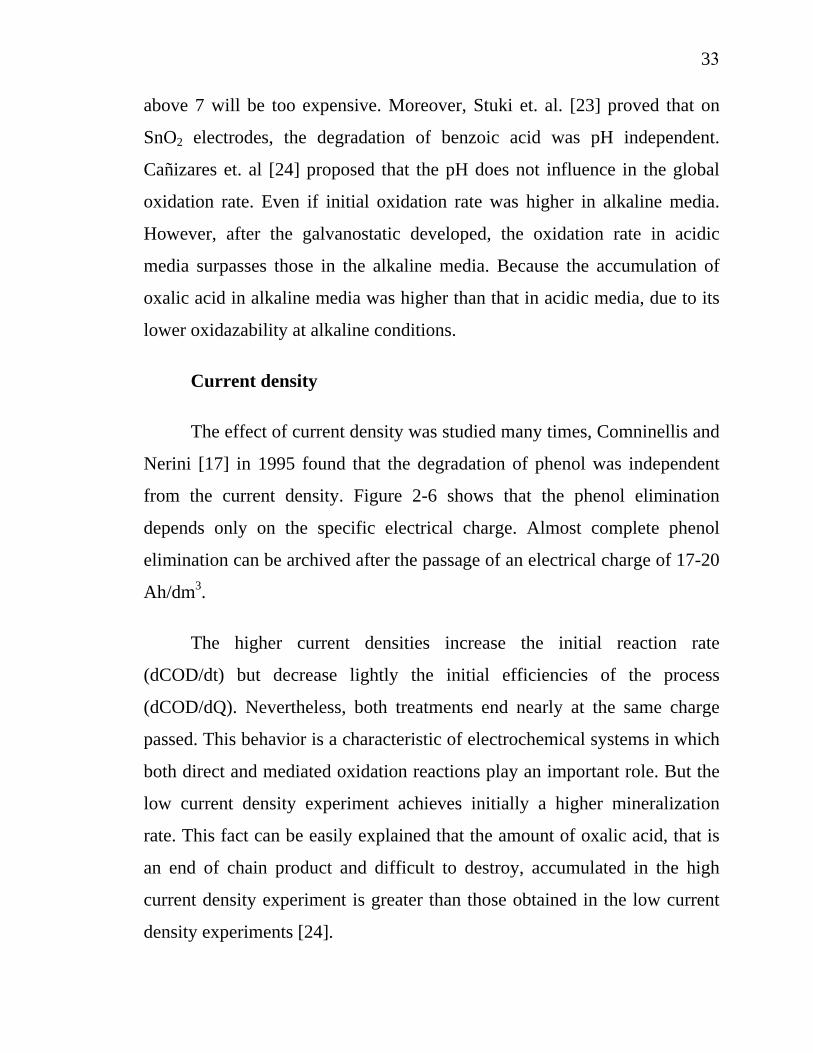
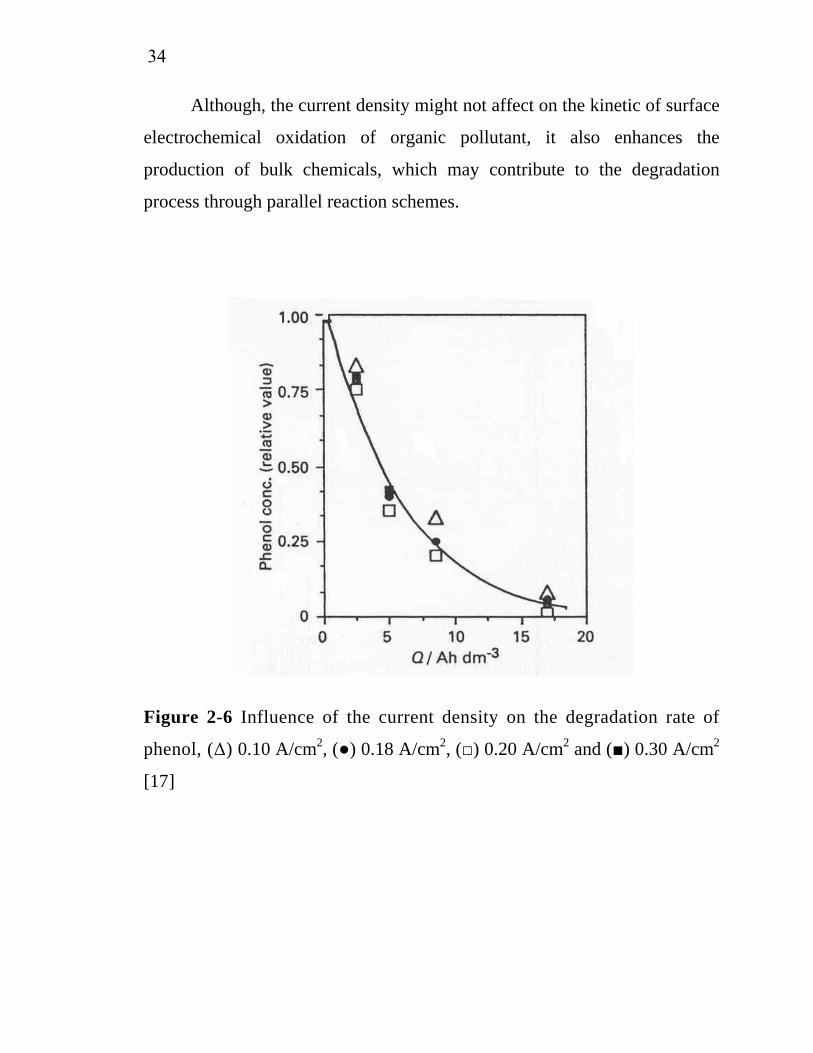
The effect of current density was studied many times, Comninellis and
Nerini [17] in 1995 found that the degradation of phenol was independent
from the current density. Figure 2-6 shows that the phenol elimination
depends only on the specific electrical charge. Almost complete phenol
elimination can be archived after the passage of an electrical charge of 17-20
Ah/dm3.
The higher current densities increase the initial reaction rate
(dCOD/dt) but decrease lightly the initial efficiencies of the process
(dCOD/dQ). Nevertheless, both treatments end nearly at the same charge
passed. This behavior is a characteristic of electrochemical systems in which
both direct and mediated oxidation reactions play an important role. But the
low current density experiment achieves initially a higher mineralization
rate. This fact can be easily explained that the amount of oxalic acid, that is
an end of chain product and difficult to destroy, accumulated in the high
current density experiment is greater than those obtained in the low current
density experiments [24].
34
Although, the current density might not affect on the kinetic of surface
electrochemical oxidation of organic pollutant, it also enhances the
production of bulk chemicals, which may contribute to the degradation
process through parallel reaction schemes.
Figure 2-6 Influence of the current density on the degradation rate of
phenol, (Δ) 0.10 A/cm2, (●) 0.18 A/cm2, (□) 0.20 A/cm2 and (■) 0.30 A/cm2
[17]
35
Temperature
An increase in the temperature leads to more efficient processes by
global oxidation. While direct oxidation processes remain almost unaffected
by temperature, this fact may be explained in terms of the presence of
inorganic electrogenerated reagents. The oxidation carried out by these redox
reagents is a chemical reaction. Consequently, its rate normally increases
with temperature. But the oxidation process can be carried out either at the
electrode surface and by electrogenerated reagents-mainly hypochlorite and
peroxodisulphates. However, the new organic intermediates are not formed
with the increase of temperature, indicating that the process mechanisms do
not vary with temperature [24].
2.6 Electrocatalytic electrodes [25]
Electrochemical degradation of organic pollutants, presence in the
wastewater needs specific electrodes. Typical substrates that used as
electrocatalytic electrodes must have low voltage drop through the substrates
and substrate-solvent interface. Many metallic electrodes could answer these
criteria and many alloys can also be used as good composite electrodes
covered with an active layer and a long service life of electrodes.
The complexity of electrode behaviors and our lack of detailed
insights make it impossible to select the optimum electrode for a given
process on a theoretical basis. Instead, an empirical approach must be used.
The initial selection is based on process experience, and this is then tested
and refined during an extensive development program. Indeed, it is very
36
difficult to predict the success of an electrode material or to define its
lifetime without extended studies under realistic process conditions.
Accelerated testing is rarely satisfactory except to indicate catastrophic
failure.
There are some general guidelines to assist the choice of an electrode
material;
Physical stability
The electrode material must have adequate mechanical strength, must
not be prone to erosion by the electrolyte, reactants, or products, and must be
resistant to cracking.
Chemical stability
The electrode material must be resistant to corrosion, unwanted oxide
or hydride formation, and the deposition of inhibiting organic films under all
conditions (e.g., potential and temperature) experienced by the electrode.
Suitable physical form
It must be possible to fabricate the material into the form demanded by
the reactor design, to facilitate sound electrical connections, and to permit
easy installation and replacement at a variety of scales. The shape and design
of the electrode may take into account the separation of products, including
the disengagement of gases or solids.
37
Rate and product selectivity
The electrode material must support the desired reaction and, in some
cases, significant electrocatalytic properties are essential. The electrode
material must promote the desired chemical change while inhibiting all
competing chemical changes.
Electrical conductivity
This must be reasonably high throughout the electrode system
including the current feeder, electrode connections, and the entire electrode
surface exposed to the electrolyte. Only in this fashion it is possible to obtain
a uniform current and potential distribution as well as to avoid voltage losses
leading to energy inefficiencies.
Cost/lifetime
A reasonable and reproducible performance including a lifetime
probably extending over several years must be achieved for an acceptable
initial investment.
It is important to note that the choice of working and counter
electrodes cannot be made independently since the chemistry at each has
consequences to the solution composition throughout the cell. Indeed, the
selection of electrode material and its form must be an integrated decision
within the prospective of the cell and process design. In some cases such as
the manufacture of pharmaceutical products, the electrodes and their
compounds must have a low toxicity.
38
2.7 Influence of electrode material on process performance [25]
This section is literated the ways in which the choice of electrode
material influences the design of electrochemical reactors and process
performance.
Energy Consumption
The specific energy consumption should be minimized in order to
minimize the power costs. In general, the total power requirement has
contributions for both electrolysis and movement of either the solution or the
electrode. The design of electrodes and cell has an important role in reducing
each of these components. Thus, a very open flow-through porous electrode
will have a low pressure drop associated with it, giving rise to modest
pumping costs and facilitating reactor sealing. A high surface area electrode
which itself a turbulence promoter in bed electrode, will give rise to a
moderately high mass transfer coefficient and active area without the need
for high flow rates through the cell; the pumping cost will again be
moderately low.
The direct electrolytic power could be minimized by
- Obtaining a current efficiency approaching 1.0
- Minimizing the cell voltage.
It is therefore important to select the electrode material and operating
conditions so as to maintain a high current efficiency. This also assists the
operation of the process by reducing the amount of product purification that
is necessary and/or byproducts that must be handled.
39
The cell voltage is a function of the reversible cell voltage, the over-
potentials at the two electrodes, and ohmic drops in the electrolyte, the
electrodes, busbars etc., and any separator in the cell. Again, the
maintenance of a low cell voltage demands attention to the design of both
electrodes and cell. Where possible, the following features should be
included:
- The counter electrode reaction should be chosen so as to minimize
the reversible cell voltage. This requires the availability of a
suitably stable electrode material.
- The over-potentials at both electrodes should be minimized by the
use of electrocatalysts.
- The electrodes, current feeders, and connectors should be made
from highly conducting materials to lower ohmic drops.
- The electrodes should facilitate low IR drop in the electrolyte by,
for example, allowing efficient gas disengagement and passage out
of the interelectrode gap. Meshes as well as louvred and lantern
blade electrodes can be used.
- Electrode and cell design should allow a small interelectrode or
electrode membrane gap. In the limit, the electrode may touch the
membrane as in zero-gap or solid polymer electrolyte cells.
- A separator should be avoided by suitable selection of the counter
electrode chemistry or, if essential, a thin conductive membrane
should be used.
40
Current efficiency
Current efficiency is the fraction of the total charge passed that is used
in the formation of the desired product. This can be a strong function of
electrode material, e.g., because of differences in the rate of hydrogen
evolution as a competing reaction. Competing reactions can also lead to the
corrosion and/or erosion of the electrode material as well changes to the
electrode (e.g., by formation of a hydroxide or oxide or the deposition of
another metal onto the surface).
Material Yield
This is the fraction of the starting material that is converted into the
desired product. This is also dependent on electrode material in many cases.
Values less than one indicate byproducts and hence perhaps the need to
introduce additional purification steps that inevitably increases the
complexity of the overall process and costs.
Space-Time Yield
One of the most valuable statements of reactor performance is the
space-time yield or weight of product per unit time per unit volume of
reactor. It is determined by the current density, the current efficiency, and
the area of electrode per unit volume of cell, all dependent on the electrode
material and its form. Commonly, the cell is operated in conditions where
the electrode reaction is mass-transport controlled (especially when a high
fractional conversion is desirable or when the concentration of reactant is
limited by solubility or process considerations. Then, the current density is
determined by the concentration of reactant and the mass transport condition.
41
The latter is therefore frequently enhanced by the use of high flow rates,
turbulence promoters, and/or electrode movement.
The current is proportional to the active electrode area in the cell. A
compact cell design requires a high area per unit cell volume. This suggests
the use of a three-dimensional electrode but such electrodes make it difficult
to maintain a uniform fluid flow and electrode potential, i.e., to control the
reaction environment. Hence, the use of porous, flow-through electrodes
often involves a trade-off between enhanced electrode area and material
yield and/or current efficiency.
Ease of product isolation
Many industrial electrosyntheses benefit from clever process design to
reduce the number of steps in the product isolation and purification. This can
be critical to the process economics.
Other Factors
Of course, other factors are important in the design of electrodes and
cells. These include cost, safety, ease of maintenance, and convenience to
use. It is also essential that the performance of the electrodes is maintained
throughout the projected operating life of the cell, maybe several years.
Examples of problems that frequently arise include (a) deposition onto
cathode surfaces of hydrogen evolution catalysts due to trace transitional
metal ions in the electrolyte and (b) poisoning of PbO2 anodes by organic
molecules leading to enhanced corrosion as well as oxygen evolution.
42
2.8 SnO2 type dimensionally stable anodes (DSA)
The discovery of the dimensionally stable anodes (DSA) has
brought significant improvements in the chlor-alkali industry and in
many other applications such as water electrolysis, metal electrowinning,
selective synthesis and destructive oxidation of organic contaminants
[26]. The DSA electrodes consist of pure or mixed metal oxide coatings
deposited on a base metal using an appropriate precursor.
The pure SnO2 is an n-type semiconductor with a direct band gap
of roughly 3.5 eV and can be used as an electrode material with
reasonable conductivity only at high temperatures. The doped SnO2 has
been used as transparent electrode material in photoelectrochemistry.
The electrochemical properties of polycrystalline as well as single
crystalline, SnO2 were investigated by several researchers [27].
The combination of high chemical and electrochemical stability as
a consequence of the rather large band gap, high conductivity of doped
SnO2 and the high oxygen evolution overpotential, makes SnO2 as an
attractive electrode material for the anodic oxidation of organics in
aqueous solutions [27]. The crystalline structure of SnO2 is presented in
Figure 2-7 [28].
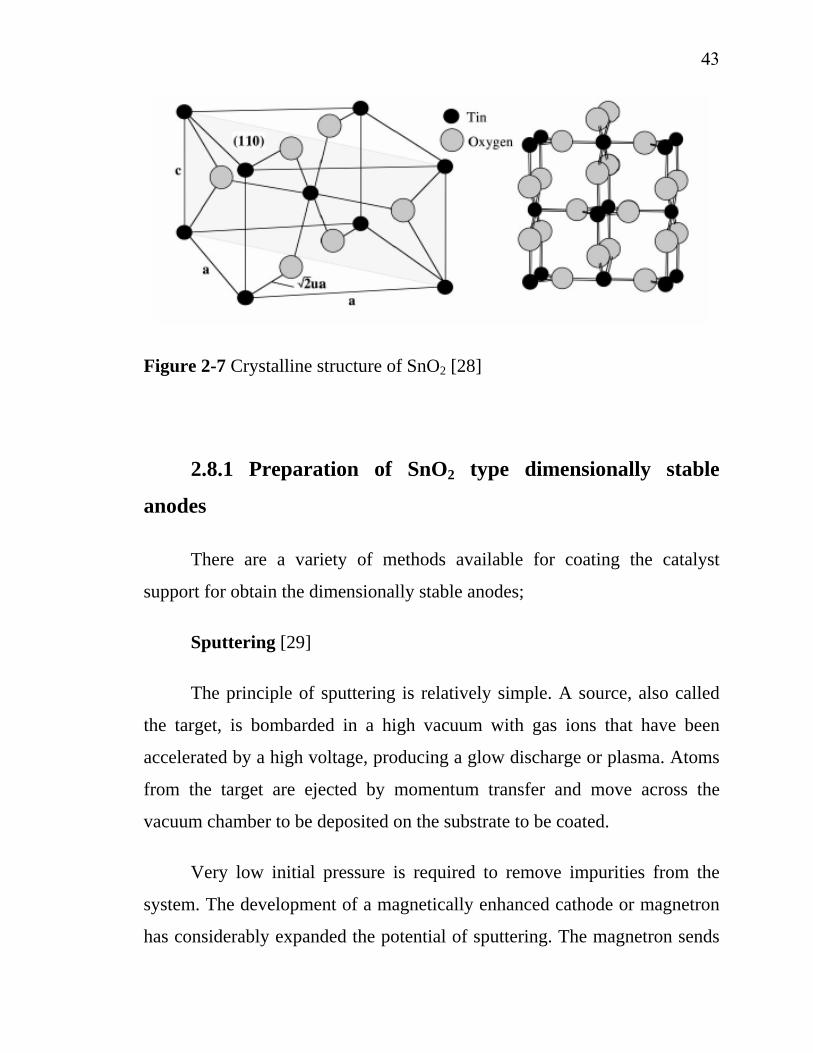
43
Figure 2-7 Crystalline structure of SnO2 [28]
2.8.1 Preparation of SnO2 type dimensionally stable
anodes
There are a variety of methods available for coating the catalyst
support for obtain the dimensionally stable anodes;
Sputtering [29]
The principle of sputtering is relatively simple. A source, also called
the target, is bombarded in a high vacuum with gas ions that have been
accelerated by a high voltage, producing a glow discharge or plasma. Atoms
from the target are ejected by momentum transfer and move across the
vacuum chamber to be deposited on the substrate to be coated.
Very low initial pressure is required to remove impurities from the
system. The development of a magnetically enhanced cathode or magnetron
has considerably expanded the potential of sputtering. The magnetron sends
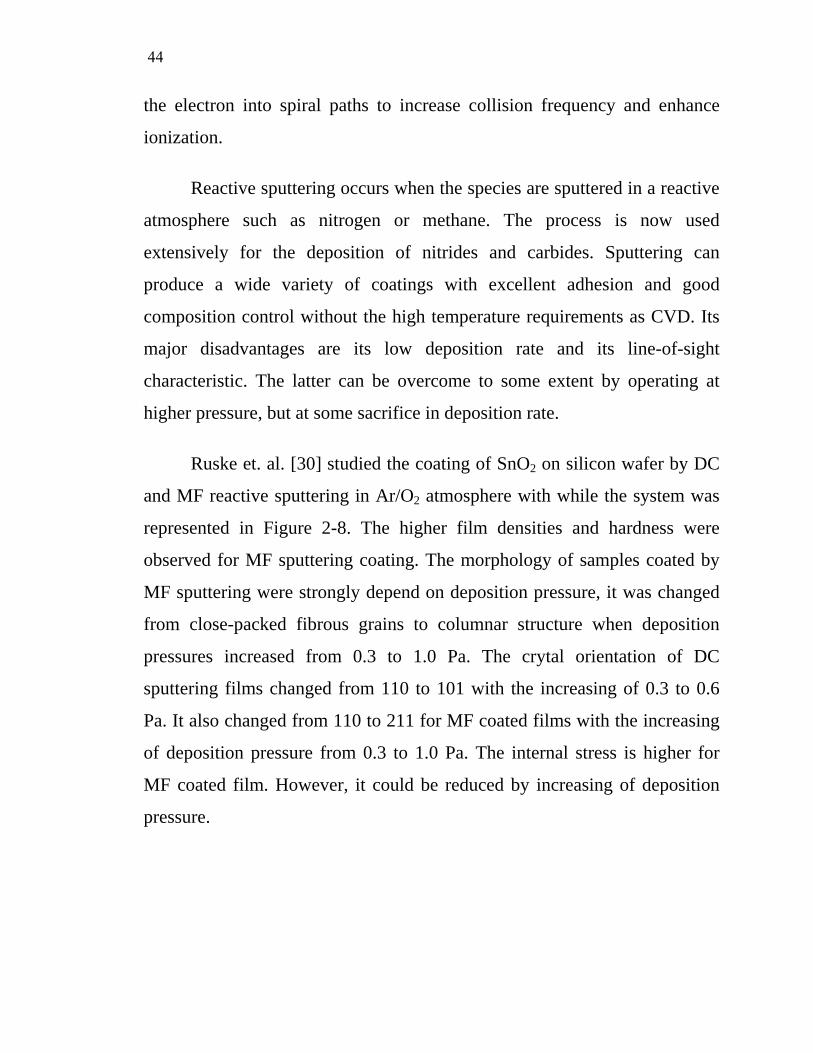
44
the electron into spiral paths to increase collision frequency and enhance
ionization.
Reactive sputtering occurs when the species are sputtered in a reactive
atmosphere such as nitrogen or methane. The process is now used
extensively for the deposition of nitrides and carbides. Sputtering can
produce a wide variety of coatings with excellent adhesion and good
composition control without the high temperature requirements as CVD. Its
major disadvantages are its low deposition rate and its line-of-sight
characteristic. The latter can be overcome to some extent by operating at
higher pressure, but at some sacrifice in deposition rate.
Ruske et. al. [30] studied the coating of SnO2 on silicon wafer by DC
and MF reactive sputtering in Ar/O2 atmosphere with while the system was
represented in Figure 2-8. The higher film densities and hardness were
observed for MF sputtering coating. The morphology of samples coated by
MF sputtering were strongly depend on deposition pressure, it was changed
from close-packed fibrous grains to columnar structure when deposition
pressures increased from 0.3 to 1.0 Pa. The crytal orientation of DC
sputtering films changed from 110 to 101 with the increasing of 0.3 to 0.6
Pa. It also changed from 110 to 211 for MF coated films with the increasing
of deposition pressure from 0.3 to 1.0 Pa. The internal stress is higher for
MF coated film. However, it could be reduced by increasing of deposition
pressure.
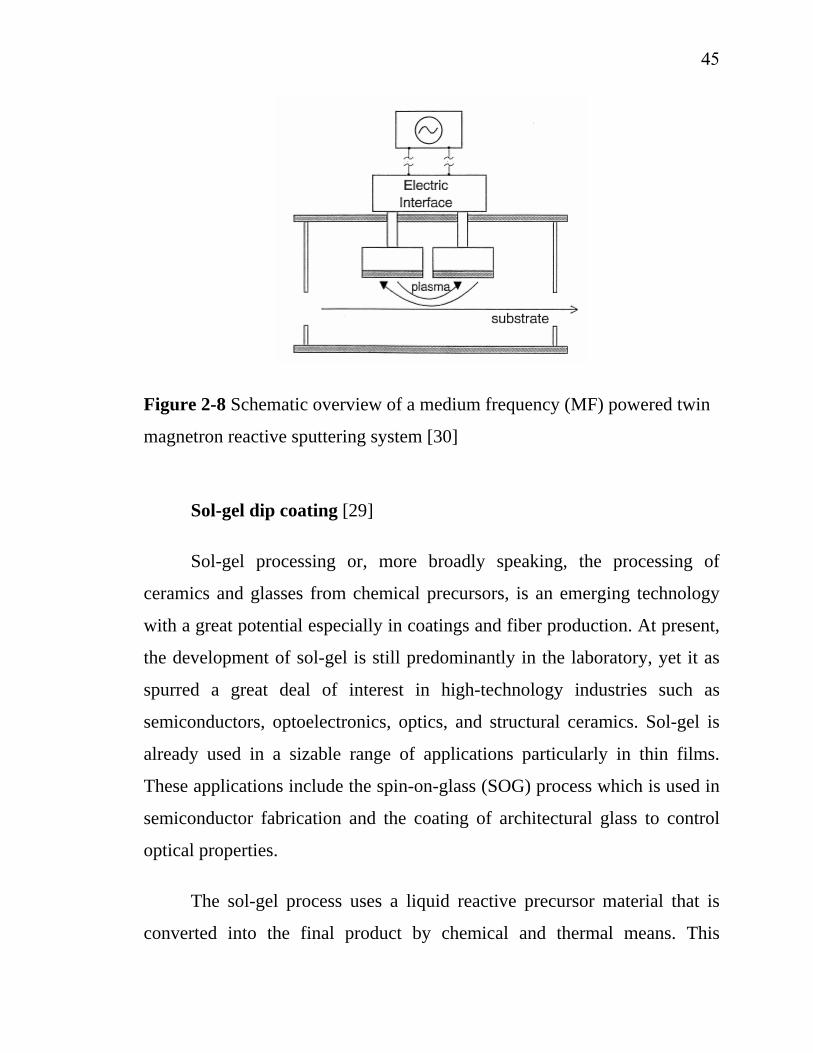
45
Figure 2-8 Schematic overview of a medium frequency (MF) powered twin
magnetron reactive sputtering system [30]
Sol-gel dip coating [29]
Sol-gel processing or, more broadly speaking, the processing of
ceramics and glasses from chemical precursors, is an emerging technology
with a great potential especially in coatings and fiber production. At present,
the development of sol-gel is still predominantly in the laboratory, yet it as
spurred a great deal of interest in high-technology industries such as
semiconductors, optoelectronics, optics, and structural ceramics. Sol-gel is
already used in a sizable range of applications particularly in thin films.
These applications include the spin-on-glass (SOG) process which is used in
semiconductor fabrication and the coating of architectural glass to control
optical properties.
The sol-gel process uses a liquid reactive precursor material that is
converted into the final product by chemical and thermal means. This
46
precursor is prepared to form a colloidal suspension or solution (sol) which
goes through a gelling stage (gel) followed by drying and consolidation. The
process requires only moderate temperatures, in many cases less than half
the conventional glass or ceramics processing temperatures. It also permits
very close control of the composition and structure of the deposit on the
molecular level and mates possible the production of near-net shapes. These
are very important advantages.
A number of processing problems still need to be solved. The need for
better control of shrinkage and cracking is critical. The cracking of coating
was presented in Figure 2-9 [31]. Moreover, the cost of precursor materials
is still high, although it is likely to come down as applications are developed
and consumption increases.
a) b)
Figure 2-9 Cracking of IrO2 layer by sol-gel dip coating technique a)
2,500X and b) 20,000X [31]
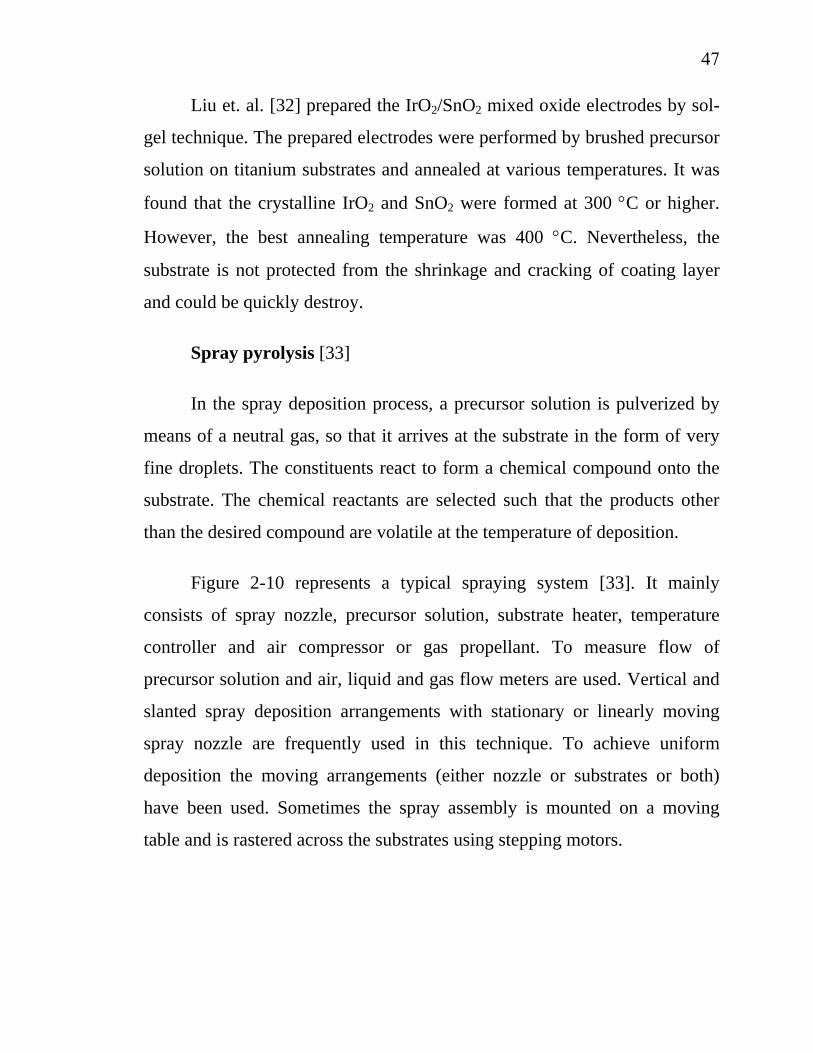
47
Liu et. al. [32] prepared the IrO2/SnO2 mixed oxide electrodes by sol-
gel technique. The prepared electrodes were performed by brushed precursor
solution on titanium substrates and annealed at various temperatures. It was
found that the crystalline IrO2 and SnO2 were formed at 300 °C or higher.
However, the best annealing temperature was 400 °C. Nevertheless, the
substrate is not protected from the shrinkage and cracking of coating layer
and could be quickly destroy.
Spray pyrolysis [33]
In the spray deposition process, a precursor solution is pulverized by
means of a neutral gas, so that it arrives at the substrate in the form of very
fine droplets. The constituents react to form a chemical compound onto the
substrate. The chemical reactants are selected such that the products other
than the desired compound are volatile at the temperature of deposition.
Figure 2-10 represents a typical spraying system [33]. It mainly
consists of spray nozzle, precursor solution, substrate heater, temperature
controller and air compressor or gas propellant. To measure flow of
precursor solution and air, liquid and gas flow meters are used. Vertical and
slanted spray deposition arrangements with stationary or linearly moving
spray nozzle are frequently used in this technique. To achieve uniform
deposition the moving arrangements (either nozzle or substrates or both)
have been used. Sometimes the spray assembly is mounted on a moving
table and is rastered across the substrates using stepping motors.
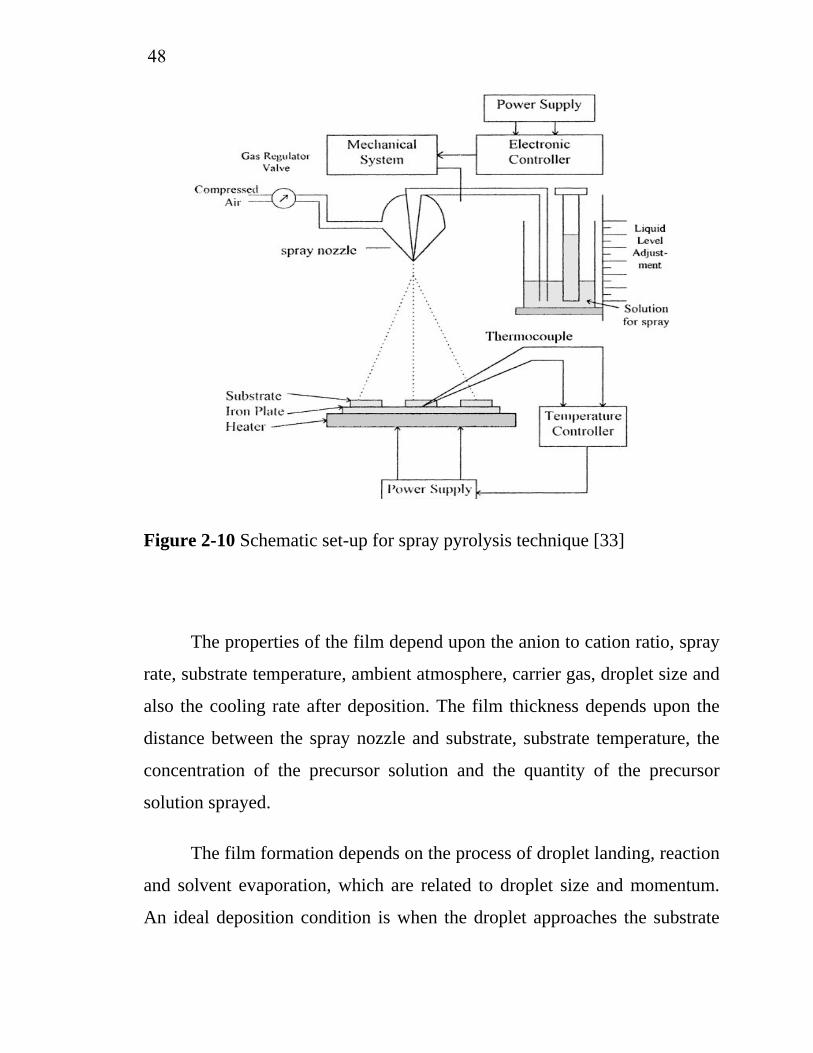
48
Figure 2-10 Schematic set-up for spray pyrolysis technique [33]
The properties of the film depend upon the anion to cation ratio, spray
rate, substrate temperature, ambient atmosphere, carrier gas, droplet size and
also the cooling rate after deposition. The film thickness depends upon the
distance between the spray nozzle and substrate, substrate temperature, the
concentration of the precursor solution and the quantity of the precursor
solution sprayed.
The film formation depends on the process of droplet landing, reaction
and solvent evaporation, which are related to droplet size and momentum.
An ideal deposition condition is when the droplet approaches the substrate
49
just as the solvent is completely removed. Lampkin [34] showed that,
depending on droplet velocity and flow direction, a droplet will flatten, skip
along the surface or hover motionless.
Kötz et. al. [27] prepared the Sb, F and Cl doped SnO2 electrodes on
titanium substrate by using of SnCl4x5H2O as precursor and SbCl3, NH4F
and residue Cl were used as doping agent at temperature around 500 °C.
The best composition of spray solution was found to be 10 g of SnCl4x5H2O
and 0.1 g of SbCl3 in 100 ml of ethanol. The results represented that lowest
resistance films are fluorine doped SnO2 film at temperature between 400-
500 °C. At reference current density 0.1 mA/cm2 in 0.1 N H2SO4 the oxygen
evolution potential increased from 1.50 to 1.65 and to 1.95 V/SCE for Pt,
PbO2 and prepared SnO2 electrode, respectively. Furthermore, it was found
that the reaction mechanism of phenol anodic oxidation on SnO2 electrode
was different from that on Pt/Ti electrode. The quinine intermediates was not
formed in the reaction. That means that either the quinines are much more
rapid oxidized on SnO2 than on platinum or the ring-opening of phenol was
occurred as the first step of the reaction.
2.9 Chemical vapor deposition [35]
Chemical vapor deposition (CVD) is the process of chemically
reacting a volatile compound of a material with other gases to be deposited,
to produce a nonvolatile solid that deposits atomistically on a suitably placed
substrate. It differs from physical vapor deposition (PVD), which relies on
material transfer from condensed-phase evaporant or sputter target sources.
50
Because CVD processes do not require vacuum or unusual levels of electric
power, they were practiced commercially prior to PVD. A century ago, CVD
methods were used to deposit a protective tungsten coating on carbon
filaments in an attempt to extend the life of incandescent lamps. Today,
high-temperature CVD processes for producing thin films and coatings have
found increasing applications in such diverse technologies as the fabrication
of solid-state electronic devices, the manufacture of ball bearings and cutting
tools, and the production of rocket engine and nuclear reactor components.
In particular, the need for high-quality epitaxial films with single crystal in
both silicon and compound-semiconductor technology, coupled with the
necessity to deposit associated insulating and passivating films, has served as
a powerful driver spurring the development of CVD processing methods.
Among the reasons for the growing adoption of CVD methods is the
ability to produce a large variety of films and coatings of metals,
semiconductors and inorganic as well as organic compounds in either a
crystalline or vitreous form, possessing desirable properties. Furthermore,
the ability to controllably create films of widely varying stoichiometry
makes CVD unique among deposition techniques. Other advantages include
the affordable cost of the equipment and operating expenses, the suitability
for both batch and semi-continuous operation, and the compatibility with
other processing steps. Because of this, many variants of CVD processing
have been researched and developed, including atmospheric pressure
(APCVD), low-pressure (LPCVD), plasma-enhanced (PECVD), and laser-
enhanced (LECVD) chemical vapor deposition. Hybrid processes combining
features of both physical and chemical vapor deposition have also emerged.
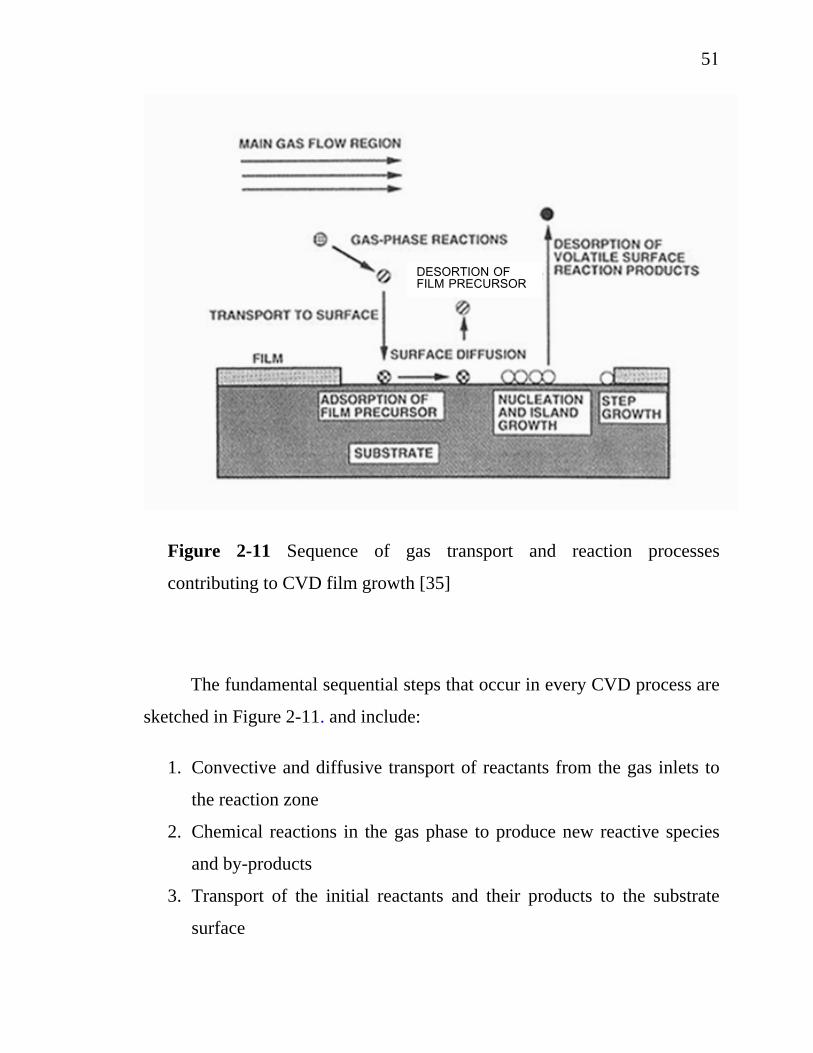
51
DESORTION OF FILM PRECURSOR
Figure 2-11 Sequence of gas transport and reaction processes
contributing to CVD film growth [35]
The fundamental sequential steps that occur in every CVD process are
sketched in Figure 2-11. and include:
1. Convective and diffusive transport of reactants from the gas inlets to
the reaction zone
2. Chemical reactions in the gas phase to produce new reactive species
and by-products
3. Transport of the initial reactants and their products to the substrate
surface
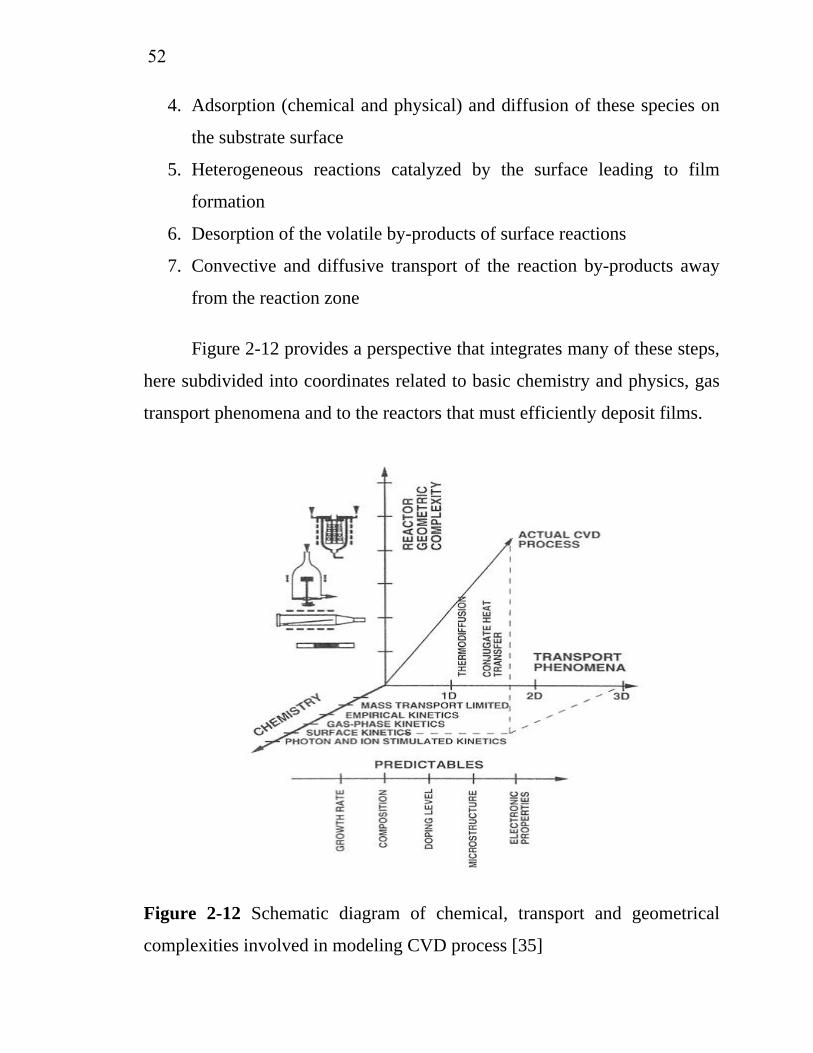
52
4. Adsorption (chemical and physical) and diffusion of these species on
the substrate surface
5. Heterogeneous reactions catalyzed by the surface leading to film
formation
6. Desorption of the volatile by-products of surface reactions
7. Convective and diffusive transport of the reaction by-products away
from the reaction zone
Figure 2-12 provides a perspective that integrates many of these steps,
here subdivided into coordinates related to basic chemistry and physics, gas
transport phenomena and to the reactors that must efficiently deposit films.
Figure 2-12 Schematic diagram of chemical, transport and geometrical
complexities involved in modeling CVD process [35]
53
2.9.1 Thermodynamics of chemical vapor deposition [35]
Reaction feasibility
Thermodynamics addresses a number of important issues with respect
to CVD. Once it is shown that a reaction is possible, thermodynamic
calculation can frequently provide information on the partial pressures of the
involved gaseous species and the direction of transport in the case of
reversible reactions. Importantly, it provides an upper limit of what to expect
under specified conditions. However, address questions related to the speed
of the reaction and resulting film growth rates. Actually, processes which are
thermodynamically possible frequently proceed at such low rates because of
both vapor transport kinetics and vapor-solid reaction limitations that they
are unfeasible in practice. Furthermore, the use of thermodynamics implies
that chemical equilibrium has been attained. Although this may occur in a
closed system, it is generally not the case in an open or flow reactor where
gaseous reactants and products are continuously introduced and removed. In
general, CVD may be viewed as an empirical science with thermodynamic
guidelines.
Condition of equilibrium
Thermodynamics can provide us with much more than a prediction of
whether a reaction will proceed or not. Under certain circumstances, it can
yield quantitative information on the operating intensive variables which
characterize the equilibrium. The problem is to evaluate the partial pressures
or concentrations of the involved species within the reactor given the
reactant compositions and operating temperature. In practice, the calculation
54
is frequently more complicated than initially envisioned because in situ mass
spectroscopic analysis of operating reactors has surprisingly revealed the
presence of unexpected species which must be accounted.
2.9.2 Thermal chemical vapor deposition processes [35]
This topic builds on the fundamentals of gas flow and reactions in
CVD processes by describing their practical exploitation in producing films
and coatings of interest. Most CVD processes can be conveniently
subdivided into two categories. Thermal CVD processes employ heat energy
to activate the required gas and gas-solid phase reactions. In contrast, the
plasma-enhanced CVD processes derive benefit from plasma activation of
the involved chemical species. However, even with similar input gases used
to deposit the same nominal materials, films produced by thermal and
plasma CVD processes can differ widely with respect to film structure,
composition, and properties.
The great variety of materials deposited by thermal CVD methods has
inspired the design and construction of an equally large number of processes
and systems. Thermal processes have been broadly differentiated by such
descriptors as low and high temperature, atmospheric and low pressure, cold
and hot wall, and closed and open system. Within a specific category of
process, the variations in design and operating variables frequently make it
difficult to compare performance of individual systems or reactors, even
when depositing the same material. Regardless of process type, however, the
associated equipment must have the following capabilities:
1. Deliver and meter the reactant and diluent gaseous into the reactor
55
2. Supply heat to the substrates so that reaction and deposition can
proceed efficiently
3. Remove the by-product and depleted gases
2.9.3 Metal-organic chemical vapor deposition (MOCVD)
Metal-organic chemical vapor deposition is sometime called
organometallic vapor phase epitaxy (OMVPE) or metal-organic vapor phase
epitaxy (MOVPE) [36]. It was originally developed in the late 1960s to grow
epitaxial compound semiconductor films [37]. Metal-organic chemical vapor
deposition is a specialized area of chemical vapor deposition which used
metal-organic compounds as precursors usually in combination with
hydrides or other reactants [29]. The early results demonstrated that
deposition of critical semiconductor materials could be obtained at lower
temperature than conventional thermal CVD in a continuous flow process
and that epitaxial growth could be successfully achieved. The quality of the
equipment and the diversity and purity of the precursor chemicals have
steadily improved since then and the process is being refined constantly [38].
A wide variety of materials can be deposited by MOCVD, either as
single crystal, polycrystalline or amorphous films [39]. The most important
application is deposition of the group III-V semiconductor compounds [29].
Metal-organic chemical vapor deposition possess has the high
potential for large-area deposition, good composition control and film
uniformity, high film-deposition rates and densities, and conformal step
coverage. The success of MOCVD strongly hinges on the availability of
suitable precursors [35].
56
The great advantage of metal-organics is their generally high volatility
at moderately low temperatures. Since all constituents are in the vapor phase,
precise electronic control of gas flow rates and partial pressures is possible
without dealing with troublesome liquid or solid sources in the reactor. That,
combined with pyrolysis reactions which are relatively insensitive to
temperature, allows for efficient and reproducible deposition. Carbon
contamination of films is a disadvantage of MOCVD [35], but it was solved
by the addition of co-reagent in the gas phase to eliminate the carbon
impurity [4].
The commercial scale-up of metal-organic chemical vapor deposition
requires the following:
1. Batch precursor amounts must rise from a few grams to a few
kilograms
2. Production yields must rise and quality be consistent
3. The environmental impact must be minimal
4. Safety must be assured
2.9.4 Metal-organic chemical vapor deposition of tin oxide
(SnO2)
Several researchers have studied about the preparation of SnO2 thin
films by metal-organic chemical vapor deposition and some parameter
effects on coating performance and film properties were studied [40-43].
Some organo-tin can be used as precursors for preparation of SnO2 in
MOCVD process. Table 2-1 presents some data about various organo-tin
precursors.

57
Table 2-1 Properties of various organo-tin
Precursor name Molecular formula
Melting
point
(°C)
Boiling point
(°C)
Dibutyl tin
diacetate1
(C4H9)2Sn(CH3COO)2 12 >200
Tetrabutyl tin Sn(C4H9)4 -97 127-1452
Tetraethyl tin Sn(C2H5)4 -112 1813
Tetramethyl tin Sn(CH3)4 -53 74-753
Remark: 1From http://www.chemtrack.org/MSDS.asp
2At 10 mm Hg
3At 760 mm Hg
Kaminori and Mizuhashi [42] studied MOCVD of SnO2 by various
organo-tin, dibutyl tin diacetate (DTD), tetrabutyl tin (TBT), tetraethyl tin
(TET) and tetramethyl tin (TMT) were used in their work. The depositions
were performed in a cold-wall CVD reactor with rotating substrate holder.
They found that, the best tin precursor is TET because of its molecular size
is most appropriate for forming regularly arranged Sn-O bonds leading to the
prepared SnO2 film with good crystallinity.
Amjoud et. al. [40] prepared the thin SnO2 films by using tetraethyl tin
as precursor with deposition temperature between 320-470 °C. Results from
energy dispersive spectroscopy, show that deposited film at 320 °C contained
some excess of Sn. It seems to be the uncompleted oxidation of the precursor.
58
At temperatures between 320-360 °C the films represented a columnar
growth. When the temperature was increased to 360-440 °C, the films were
well formed and faceted grains. The grains size was increased with the
increasing of deposition temperature; it reached 1 μm when the deposition
temperature was 470 °C.
Amjoud et al. [43] studied the effect of tetraethyl tin molar fraction in
vapor phase in the range between 2x10⁻⁴-1x10⁻³. The grain size decreased
with the increasing of tetraethyl tin molar fraction in vapor phase, because it
was affected by the higher nucleation rate of coating. Consequently, the
SnO2 films will be smoother and dense at high tetraethyl tin composition.
Moreover, when the mean grain size and film roughness decreased, the film
porosity will be decreased, that will decrease the electrical resistivity of the
films.
Reaction mechanism of SnO2 deposition by MOCVD
The reaction mechanism of SnO2 deposition by MOCVD with using
TET as precursor could be separated in homogeneous gas phase reaction and
heterogeneous reaction. The mechanism was presented by Bertrand, N. [44].
The reaction mechanism was initiated by a pyrolysis of the TET that
takes place at 380 °C and led to a rupture of a connection C-Sn. This
homolytic rupture of a connection leads to the formation of two free radicals
from both side of the TET molecule as presented in equation (2-30).
(CH3-CH2)4Sn → (CH3-CH2)3Sn• + CH3-CH2• (2-30)
59
Then, the triethyltin radicals ((CH3-CH2)3Sn•) will be oxidized. There
are two oxidation path ways of triethyltin radicals.
Mechanism 1: The triethyltin radicals are reacted with oxygen gas to
produce (CH3-CH2)2Sn=O and CH3-CH2O• radicals represents in equation
(2-31).
(CH3-CH2)3Sn• + O2 (CH3-CH2)2Sn=O + (CH3-CH2)-O• (2-31)
Mechanism 2: The triethyltin radicals are reacted with oxygen gas to produce
(CH3-CH2)Sn•(OH)2 radicals and C4H8 as shown in equation (2-32).
(CH3-CH2)3Sn• + O2 (CH3-CH2)Sn•(OH)2 + C4H8 (2-32)
The (CH3-CH2)2Sn=O species, formed during the oxidation of the
(CH3-CH2)3Sn• radical according to path 1, is a very active species due to its
double bond in Sn=O connection. This species strongly reacts with the CH3-
CH2• radical to produce (CH3-CH2)2Sn •OH, as shown in equation (2-33).
(CH3-CH2)2Sn=O + CH3-CH2• (CH3-CH2)2Sn •OH + C2H4 (2-33)
Mechanism 3: (CH3-CH2)2Sn •OH could be oxidized in the CVD reactor to
produced (CH3-CH2)SnOOH. Then (CH3-CH2)SnOOH is reacted with CH3-
CH2• to produce (CH3-CH2)Sn•(OH)2 and C2H4 presented in equation (2-34)
and (2-35).
60
(CH3-CH2)2Sn•OH + O2 (CH3-CH2)SnOOH + CH3-CH2-O• (2-34)
(CH3-CH2)SnOOH + CH3-CH2• (CH3-CH2)Sn•(OH)2 + C2H4 (2-
35)
Mechanism 4: However, (CH3-CH2)2Sn•OH could be reacted with O2 to
produce SnO as in equation (2-36)
(CH3-CH2)2Sn•OH + O2 SnO + C4H8 + •OH + H2O (2-36)
The (CH3-CH2)Sn•(OH)2 from both equation (2-32) and (2-35) is
oxidized to produce SnO2 as presented in equation (2-37).
(CH3-CH2)Sn•(OH)2 + O2 → SnO2 + C2H4 + •OH + H2O (2-37)
In addition, the TET also reacted with •OH, produced form equation
(2-36) and (2-37), to produce (CH3-CH2)3Sn(OH) as present in equation (2-
38).
(CH3-CH2)4Sn + •OH → (CH3-CH2)3Sn(OH) + CH3-CH2• (2-38)
The (CH3-CH2)3Sn(OH) decompose to produce (CH3-CH2)2Sn•OH as
presented in equation (2-39).
61
(CH3-CH2)3Sn(OH) → (CH3-CH2)2Sn•OH + CH3-CH2• (2-39)
There are some possible reactions in the SnO2 listed previously.
However, with the thermodynamic point of view, there are 2 reaction path
ways that possible occur during the deposition of SnO2 film could be
summary.
Path way 1:
(CH3-CH2)4Sn → (CH3-CH2)3Sn• + CH3-CH2• (2-30)
(CH3-CH2)3Sn• + O2 (CH3-CH2)2Sn=O + (CH3-CH2)-O• (2-31)
(CH3-CH2)2Sn=O + CH3-CH2• (CH3-CH2)2Sn •OH + C2H4 (2-33)
(CH3-CH2)4Sn + •OH → (CH3-CH2)3Sn(OH) + CH3-CH2• (2-38)
(CH3-CH2)3Sn(OH) → (CH3-CH2)2Sn•OH + CH3-CH2• (2-39)
Path way 2:
(CH3-CH2)4Sn → (CH3-CH2)3Sn• + CH3-CH2• (2-30)
(CH3-CH2)3Sn• + O2 (CH3-CH2)Sn•(OH)2 + C4H8 (2-32)
(CH3-CH2)Sn•(OH)2 + O2 → SnO2 + C2H4 + •OH + H2O (2-37)
(CH3-CH2)4Sn + •OH → (CH3-CH2)3Sn(OH) + CH3-CH2• (2-38)
62
(CH3-CH2)3Sn(OH) → (CH3-CH2)2Sn•OH + CH3-CH2• (2-39)
(CH3-CH2)2Sn•OH + O2 SnO + C4H8 + •OH + H2O (2-36)
In heterogeneous reaction, the SnO in gas phase is reacted with O2 and
deposited on the substrate as presented in equation (2-40) and (2-41).
SnO(g) + O2 → SnO2(s) + 1/2 O2 (2-40)
SnO2(g) → SnO2(s) (2-41)
2.9.5 Metal-organic chemical vapor deposition of iridium
(Ir) and iridium oxide (IrO2)
Iridium (Ir) and Iridium oxide (IrO2) films have attracted much
attention due to their excellent properties. Iridium is a noble metal with a
small unit cell dimension, high melting point (2727 K) and good chemical
stability. Due to its properties, iridium is a good diffusion barrier for oxygen.
Iridium has a great interest as protective layer due to its good resistance
against corrosion and oxidation at high temperature [4]. Iridium oxide films
have excellent properties, especially their electrocatalyic properties and good
stability in strong acidic solution for chlorine and oxygen evolution [33].
Several methods have been developed for preparing Ir and IrO2 films
such as metal-organic chemical vapor deposition. There are some influences
on the deposition of Ir and IrO2 films, such as choice of precursors,
deposition temperature and co-reactive gaseous, etc.
63
Because of the potential of Ir and IrO2 films for application, many
types of Ir source precursors were investigated for Ir and IrO2 films coating
by CVD. Initially, Ir(III) halides were used as precursor for Ir and IrO2 CVD
[4, 45]. Due to its low volatility and high decomposition temperature
typically more than 800 ºC [4], iridium halides were not good alternative. In
addition, corrosive and harmful atmosphere is generated during the
decomposition of iridium halides.
Due to some drawbacks of iridium halides precursor, organometallic
iridium compounds are preferred for Ir film CVD. The iridium tris-
acetylacetonate (Ir(acac)3) and iridium tris-alkyl (Ir(C3H5)3) complexes, are
two chemical species commonly used as CVD precursors. For commercial
available, Ir(acac)3 is a better choice due to its excellent air stability.
However, the high melting point and low volatility of Ir(acac)3 has limited
its development as the industrial standard [45].
In addition, other iridium sources reagents consist of Ir(I) metal
complexes such as (MeCp)Ir(COD) [4, 46-50], Ir(COD)(acac) [51],
[Ir(COD)(µ-OAc)]2 [52], Ir(COD)(hfac) [53] and Ir(COD)(amak) [47]
appear to be more useful for Ir and IrO2 deposition due to their enhanced
volatility and vapor phase transport properties which are uncomplicated by
monomer-dimer equilibria. The physical properties of some Ir precursors are
presented in Table 2-2.
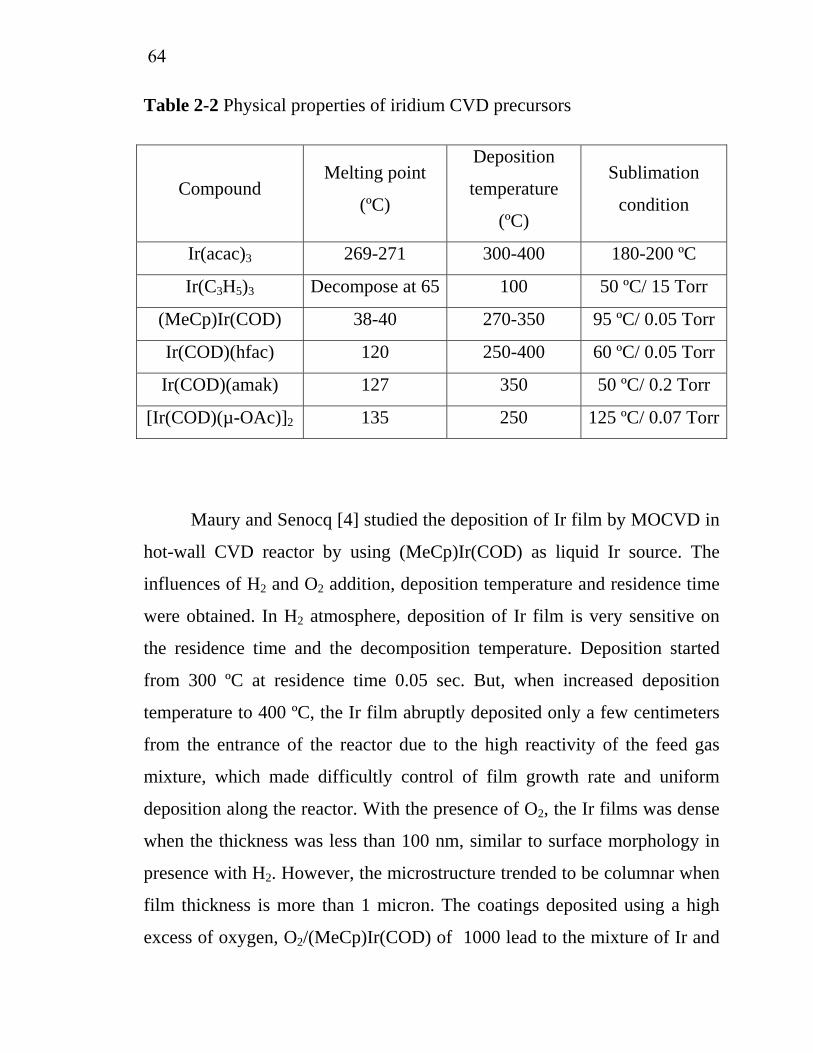
64
Table 2-2 Physical properties of iridium CVD precursors
Compound Melting point
(ºC)
Deposition
temperature
(ºC)
Sublimation
condition
Ir(acac)3 269-271 300-400 180-200 ºC
Ir(C3H5)3 Decompose at 65 100 50 ºC/ 15 Torr
(MeCp)Ir(COD) 38-40 270-350 95 ºC/ 0.05 Torr
Ir(COD)(hfac) 120 250-400 60 ºC/ 0.05 Torr
Ir(COD)(amak) 127 350 50 ºC/ 0.2 Torr
[Ir(COD)(µ-OAc)]2 135 250 125 ºC/ 0.07 Torr
Maury and Senocq [4] studied the deposition of Ir film by MOCVD in
hot-wall CVD reactor by using (MeCp)Ir(COD) as liquid Ir source. The
influences of H2 and O2 addition, deposition temperature and residence time
were obtained. In H2 atmosphere, deposition of Ir film is very sensitive on
the residence time and the decomposition temperature. Deposition started
from 300 ºC at residence time 0.05 sec. But, when increased deposition
temperature to 400 ºC, the Ir film abruptly deposited only a few centimeters
from the entrance of the reactor due to the high reactivity of the feed gas
mixture, which made difficultly control of film growth rate and uniform
deposition along the reactor. With the presence of O2, the Ir films was dense
when the thickness was less than 100 nm, similar to surface morphology in
presence with H2. However, the microstructure trended to be columnar when
film thickness is more than 1 micron. The coatings deposited using a high
excess of oxygen, O2/(MeCp)Ir(COD) of 1000 lead to the mixture of Ir and
65
IrO2. However, the co-deposition of Ir and IrO2 was not observed at
O2/(MeCp)Ir(COD) molar ratio less than 135. In addition, the film thickness
gradient was observed with the increasing of O2 partial pressure. For high
temperature and residence time, the growth rate is maximum at the entrance
of the reactor, but rapidly decreases downstream. Better thickness uniformity
can be obtained by optimization of O2 feed rate, deposition temperature and
residence time that detrimental to the conversion rate of the precursor,
subsequently, to achieve the mean growth rate along the reactor.
Chen [50] deposited IrO2 on Si substrate in vertical cold-wall CVD
reactor by using of (MeCp)Ir(COD) as iridium source. The oxygen was used
as both carrier and reactive gas. The supplying rate of oxygen is 100 sccm
and oxygen pressure was 1, 10 and 30 torr. The deposition temperature
ranged between 250 and 500 °C. At 1 torr, high Ir purity film was obtained
at temperature below 400 °C. At 450 and 500 °C, the rutile IrO2 was
detected. However, the diffraction signal due to the IrO2 phase at 500 °C was
diminished. At 10 torr, the Ir signal obtained at temperature ≤ 300 °C and the
optimized temperature for growth of IrO2 is between 400 and 450 °C. At 30
torr, the highly 101 orientation IrO2 nanorods were deposited at temperature
between 300-350 °C.
2.10 Computational fluid dynamics (CFD) [54]
Computational fluid dynamics (CFD) was originally developed from
the pioneering accomplishments of enthusiasts [55-56], who in their
endeavors to procure insight into fluid motion instigated the development of
66
powerful numerical techniques that have advanced the numerical description
of all types of fluid flow [57]. CFD is now maturing into a powerful and
pervasive tool in many industries, with each solution representing a rich
tapestry of mathematical physics, numerical methods, user interfaces and
state-of-the art visualization techniques [58]. So great has the impetus been
to propel CFD that it is now used as much as the traditional didactic methods
of experimentation and analytical modeling to solve fluid flow problems.
This recent adoption of CFD has been both inevitable and progressive, as the
high costs and time consumption associated with experimentation has often
precluded the desire to produce efficient in-depth results. Moreover, the
assumptions, generalizations and approximations associated with analytical
models have swayed their reduction in the development of flow solutions.
By considering these limitations coupled with recent achievements in the
development of numerical solutions for the Navier–Stokes equations and the
amelioration of computing power and efficiency, it is easy to understand
why confidence has both increased and advanced the application of CFD as a
viable alternative in industry and science.
The technical achievements observed in the last two decades include
vast improvements in numerical algorithms and CFD modeling techniques
[58]. This means that features like unstructured and adaptive meshing,
moving boundaries and multiple frames of reference now cooperate with
physical models to confront complex phenomena involving Newtonian and
non-Newtonian fluid flow.
67
2.10.1 Fundamentals of computational fluid dynamics
Governing equations
The governing equations of fluid flow and heat transfer can be
considered as mathematical formulations of the conservation laws of fluid
mechanics and are referred to as the Navier–Stokes equations. When applied
to a fluid continuum, these conservation laws relate the rate of change of a
desired fluid property to external forces and can be considered as:
1. The law of conservation of mass or continuity, which states that the
mass flows entering a fluid element must balance exactly with those
leaving.
2. The law of conservation of momentum or Newton's second law of
motion, which states that the sum of the external forces acting on a
fluid particle is equal to its rate of change of linear momentum.
3. The law of conservation of energy or the first law of thermodynamics,
which states that the rate of change of energy of a fluid particle is
equal to the heat addition and the work done on the particle.
By enforcing these conservation laws over discrete spatial volumes in
a fluid domain, it is possible to achieve a systematic account of the changes
in mass, momentum and energy as the flow crosses the volume boundaries.
The resulting equations can be written as:
Continuity equation:
( ) 0=∂∂
+∂∂
ji
uxt
ρρ (2-42)
68
Momentum equation:
( ) ( ) ii
j
j
iij
jji
ji g
xu
xup
xuu
xu
tρμδρρ +
⎥⎥⎦
⎤
⎢⎢⎣
⎡⎟⎟⎠
⎞⎜⎜⎝
⎛
∂∂
+∂∂
+−∂∂
=∂∂
+∂∂ (2-43)
Energy equation:
( ) ( ) Tjj
ajj
a sxT
xTCu
xTC
t=⎟
⎟⎠
⎞⎜⎜⎝
⎛
∂∂
∂∂
−∂∂
+∂∂ λρρ (2-44)
There are two ways to model the density variations that occur due to
buoyancy. The first is to assume that the density differentials in the flow are
only required in the momentum equations and are represented by:
( )[ ]refref TT −−= βρρ 1 (2-45)
This method is known as the Buossinesq approximation [59].
However, at high temperature differentials, the approximation is no longer
valid and another method must be applied [60]. One way is to treat the fluid
as an ideal gas and express the density by means of the following equation:
RTWp aref=ρ (2-46)
This method can be considered as a weakly compressible formulation,
which means that the density of the fluid is dependent on temperature and
composition but not pressure. This assumption has also been used
successfully in some engineering applications. However, solutions were
found to be more difficult to converge using this method [61].
69
Numerical analysis
A fundamental consideration for CFD code developers is the choice of
suitable techniques to discretise the modeled fluid continuum. Of the many
existing techniques, the most important include finite difference, finite
elements and finite volumes. Although all these produce the same solution at
high grid resolutions, the range of suitable problems is different for each.
This means that the employed numerical technique is determined by the
conceived range of code applications [54].
Finite difference techniques are limited use in many engineering flows
due to difficulties in their handling of complex geometries. This has led to
increased use of finite elements and finite volumes, which employ suitable
meshing structures to deal appropriately with arbitrary geometry. Finite
elements can be shown to have optimality properties for some types of
equations [60]. However, only a limited number of commercial finite
element packages exist, which is undoubtedly a reflection of the difficulties
involved in the programming and understanding of this technique [54].
Fortunately, such difficulties are obviated through implementation of
finite volumes methods. When the governing equations are expressed
through finite volumes, they form a physically intuitive method of achieving
a systematic account of the changes in mass, momentum and energy as fluid
crosses the boundaries of discrete spatial volumes within the computational
domain [62]. The ease in the understanding, programming and versatility of
finite volumes has meant that they are now the most commonly used
techniques by CFD code developers.
70
Solving the flow problem
In order to solve for a flow field a CFD code must take the
mathematical statements inputted by the user, structure them into a suitable
arrangement and solve them for the specified boundary conditions. Iterative
methods are commonly used by CFD codes to solve a whole set of
discretised equations so that they may be applied to a single dependent
variable. The segregated solver SIMPLE (Semi-Implicit Method for
Pressure-Linked Equations), devised by Patankar and Spalding in 1972 [63],
or its descendents are conventionally employed by many commercial
packages [54]. SIMPLE determines the pressure field indirectly by closing
the discretised momentum equations with the continuity equations in a
sequential manner. Consequently, as the number of cells increases, the
elliptic nature of the pressure field becomes more profound and the
convergence rate decreases substantially [64]. This has led to the
development of multigrid techniques that compute velocity and pressure
corrections in a simultaneous fashion, thereby enhancing convergence rates.
Unfortunately, the improvement in solver efficiency afforded by multigrid is
foiled by memory requirements that increase in tandem with the number of
cells, thus making it difficult, in some cases, to achieve grid independency
with current computing capabilities [54]. Nevertheless, many CFD packages,
even those based on unstructured grids now successfully employ multigrid
as the default solver option. Detailed techniques used by multigrid are
described in the literature [64].
71
Interpreting the solution
Visualization is often necessary to represent the resulting field
solution. Contour, vector and line plots enhance the accurate interpretation of
results and have been used successfully in many studies to aid in system
design [65]. In addition, field data are often easily exported to external
modeling programs so that they can be processed further.
2.10.2 Commercial CFD software package
Over the last two decades, there has been enormous development of
commercial CFD codes to enhance their marriage with the sophisticated
modeling requirements of many research fields, thereby accentuating their
versatility and attractiveness. These challenges have led to unprecedented
competition between commercial CFD developers and have expedited non-
uniform development, causing the range of afforded functionalities to vary
from code to code. Thus, among the many codes that exist today not all
provide the features required in engineering. Such requirements include the
provision of powerful pre-processor, solver and post-processor
environments, the power to import grid geometry, boundary conditions and
initial conditions from an external text file, and the capability to model non-
Newtonian fluids, two-phase flows, flow dependent properties, phase change
and flow through porous media [66]. Therefore, intuitive functional
considerations of a code should be taken into account before selection. The
commercial software packages featured incorporate at least a minimum
number of all these functionalities, employ graphical user interfaces, and
support Windows, UNIX and Linux platforms. State-of-the-art features of
the most commonly used general-purpose codes available are elucidated
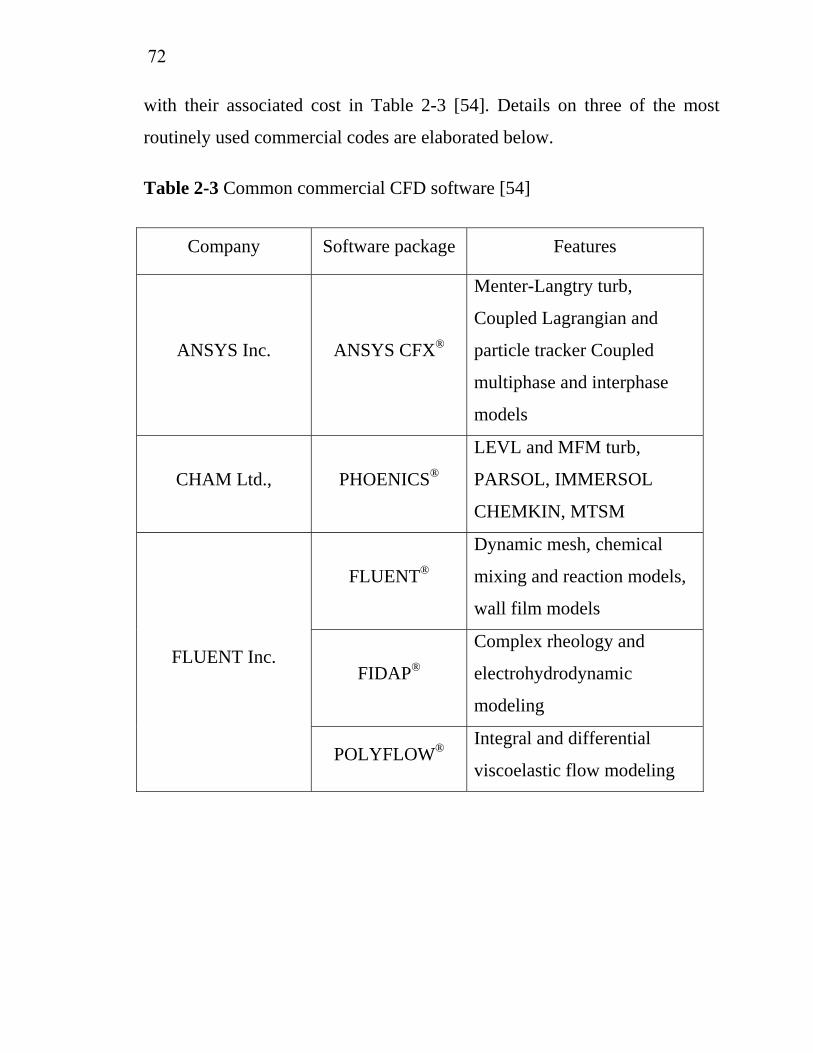
72
with their associated cost in Table 2-3 [54]. Details on three of the most
routinely used commercial codes are elaborated below.
Table 2-3 Common commercial CFD software [54]
Company Software package Features
ANSYS Inc. ANSYS CFX®
Menter-Langtry turb,
Coupled Lagrangian and
particle tracker Coupled
multiphase and interphase
models
CHAM Ltd., PHOENICS®
LEVL and MFM turb,
PARSOL, IMMERSOL
CHEMKIN, MTSM
FLUENT®
Dynamic mesh, chemical
mixing and reaction models,
wall film models
FIDAP®
Complex rheology and
electrohydrodynamic
modeling
FLUENT Inc.
POLYFLOW® Integral and differential
viscoelastic flow modeling
73
CFX®
CFX® was recently taken over by ANSYS Inc. in 2003 and is now
branded as ANSYS CFX®. Within the framework of ANSYS CFX®
numerous different types of software packages exist that can be used to solve
various types of flow problems. There are also a large number of up-to-date
fully functional physical models, which include multiphase flow, porous
media, heat transfer, combustion and radiation models. Advanced turbulence
models are also a feature of ANSYS CFX® and it contains a predictive
laminar to turbulent flow transition model (Menter–Langtry γ−θ model).
ANSYS CFX® also affords an easy-to-use fully parametrical CAD tool with
a bi-directional link compatible with most CAD software [54].
PHOENICS®
PHOENICS® is a multipurpose CFD package that has numerous
modeling capabilities, including Newtonian and non-Newtonian fluid
modeling, flow through porous media with direction-dependent resistances,
and conjugate heat transfer. There is also an extensive suite of embedded
turbulence models including the unique wall distance turbulence model
(LVEL), which circumvents the inaccuracies associated with wall-function
computations of most turbulence models by using the knowledge of wall
distances, and local velocities to compute the near-wall flow. PHOENICS®
is a structured grid code and it necessitates the use of body fitted coordinates
to model complex geometry. This can substantially increase the pre-
processing and solution times of a simulation.
74
FLUENT®
FLUENT Inc. offers three software packages within the CFD
framework that are suitable for modeling needs. The three packages are
FLUENT® (general purpose with multiphysics capabilities), FIDAP®
(modelling complex physics) and POLYFLOW® (polymer modeling).
FLUENT® Inc. is presently one of the leading suppliers of CFD software in
the world. The most interesting features of the FLUENT® software include
models for heat exchangers, discrete phase models for multiphase flows,
numerous high quality reaction models and the phase change model which
tracks the melting and freezing in the bulk fluid. FIDAP® is a finite element
based software that offers unique abilities for modeling non-Newtonian
flows and free surface flows. It also contains sophisticated radiation,
dispersion and heat transfer models. POLYFLOW® is a general-purpose
finite element CFD tool for the analysis of polymer processing such as glass
forming, thermoforming and fiber spinning.
2.10.3 Simulation by using FLUENT® [68]
FLUENT® is a state-of-the-art computer program for modeling fluid
flow and heat transfer in complex geometries. FLUENT® provides complete
mesh flexibility, solving flow problems with unstructured meshes that can be
generated about complex geometries with relative ease. Supported mesh
types include 2D triangular/quadrilateral, 3D tetrahedral/hexahedral/
pyramid/wedge, and mixed (hybrid) meshes. FLUENT® also allows you to
refine or coarsen grid based on the flow solution.
75
This solution-adaptive grid capability is particularly useful for
accurately predicting flow fields in regions with large gradients, such as free
shear layers and boundary layers. In comparison to solutions on structured or
block structured grids, this feature significantly reduces the time required to
generate a good grid. Solution-adaptive refinement makes it easier to
perform grid refinement studies and reduces the computational effort
required to achieve a desired level of accuracy, since mesh refinement is
limited to those regions where greater mesh resolution is needed.
FLUENT® is written in the C computer language and makes full use
of the flexibility and power offered by the language. Consequently, true
dynamic memory allocation, efficient data structures, and flexible solver
control are all made possible. In addition, FLUENT® uses a PC/server
architecture, which allows it to run as separate simultaneous processes on
desktop workstations and powerful compute servers, for efficient execution,
interactive control, and complete flexibility of machine or operating system
type.
All functions required to compute a solution and display the results are
accessible in FLUENT® through an interactive, menu-driven interface. The
user interface is written in a language called Scheme, a dialect of LISP. The
advanced user can customize and enhance the interface by writing menu
macros and functions.
2.10.4 Simulation of CVD Process Using FLUENT® [68]
FLUENT® CFD software provides the important physics required for
CVD reactor modeling, including gas phase/surface reaction chemistry,
76
multicomponent and Soret diffusion, natural convection, non-grey radiation
with participating media, and the ability to include fully compressible flow
regions. FLUENT® CFD software also combines physically accurate
transport models with proposed gas-phase and surface chemistry
mechanisms and predicts uniformity of film thickness and composition
variation during selective growth that applying for MOCVD simulation.
2.11 Conclusions
The literature review presents that SnO2 electrocatalytic electrode is
practical for destruction of organic pollutant in wastewater. However, it
needs the protection from protective layer. IrO2 and Ir have some attractive
properties for using as protective layer. The literatures also show that metal-
organic chemical vapor deposition is a powerful tool for elaboration of both
active and protective layers.
Chapter 3
Materials and Methods
This chapter presents the experimental set-up for this work. It will
be started with the materials and chemicals had been used in this study.
Then, the electrodes preparation techniques will be introduced, it
composes of substrate pretreatment, metal-organic chemical vapor
deposition of Ir, IrO2 and SnO2 over various substrates and also the
simulation of Ir deposition using FLUENT® software. The set up using
for electrochemical oxidation of model solution and restaurant effluent
from Chulalongkorn University Student Canteen are presented. Finally,
the material characterization methods are also introduced in this chapter.
3.1 Chemicals
(Methylcyclopentadienyl) (1,5-cyclooctadiene) iridium (I), 99 %w/w
was supplied by Strem Chemicals, Inc., Iridium (III) acetylacetonate, 98
%w/w, Tetraethyltin 97 %w/w were supplied by Aldrich Chemical Co.,
Inc. and oxalic acid 98%w/w was supplied by BDH Chemicals Inc. The
other chemicals used in this research work are analytical grade.
The effluent from Chulalongkorn University Student Canteen was
used in this study. The effluent was collected from the wastewater
collection system of Chulalongkorn University after passed the grease
trap.
78
3.2 Substrate pretreatment
To improve the surface roughness of substrates and the adhesion of
deposited films, the substrates need to be cleaned by the appropriating
solvent and/or etched by specific acid. In this part, the several treatment
techniques for some substrates are presented.
3.2.1 Stainless steel 316L
To remove some impurities stainless steel SUS 316L sheets (25.4
mm x 16.2 mm x 10 mm) were polished by sand paper No. 0. Degreased
in acetone with sonication for 15 minute, rinsed with deionized water and
dried by compressed air.
3.2.2 Borosilicate glass
The borosilicate glass sheets (25.4 mm x 16.2 mm x 10 mm) were
carefully degreased in acetone with sonication for 15 minute, rinsed with
deionized water and dried by compressed air
3.2.3 Silicon wafer
The Si wafers (8 mm x 10 mm) were degreased in hot acetone,
rinsed with deionized water and dried by compressed air.
3.2.4 Titanium
Ti sheets (8 mm x 30 mm) were etched in hot 35% HCl for 1 hr,
rinsed by deionized water and dried by compressed air. The pretreatment
of Ti substrate was followed Duverneuil et al. [41].
79
3.2.5 Tantalum
Ta substrates (8 mm x 30 mm) were etched in 40% HF from 1 min
to 24 hr, rinsed by deionized water and dried by compressed air.
3.2.6 Tantalum carbide over tantalum
TaC/Ta sheets were brushed by stainless steel rotating brush and
etched in 40% HF for 1 hr to remove free carbon on the surface.
3.3 Deposition of TiO2 by spray coating
The deposition of TiO2 coated electrode was the following [69].
1. 1 g of TiO2 was suspended in 100 ml of methanol, the
suspension was homogenized by sonication
2. The cleaned SUS 316L was heated to 80 ºC
3. The precursor solution in (1) was sprayed to heated substrate
using simple atomizer
4. The procedure was repeated until a uniform coating of TiO2 was
visible on the substrates.
5. The coated substrates were annealed in air at 700 ºC. After 1 h
the substrates were removed from the furnace and allowed to
cool at room temperature
3.4 Deposition of SnO2 using spray pyrolysis
The most common procedure to apply a thin layer of SnO2 is a
spraying of tin precursor solution onto a hot substrate surface. To
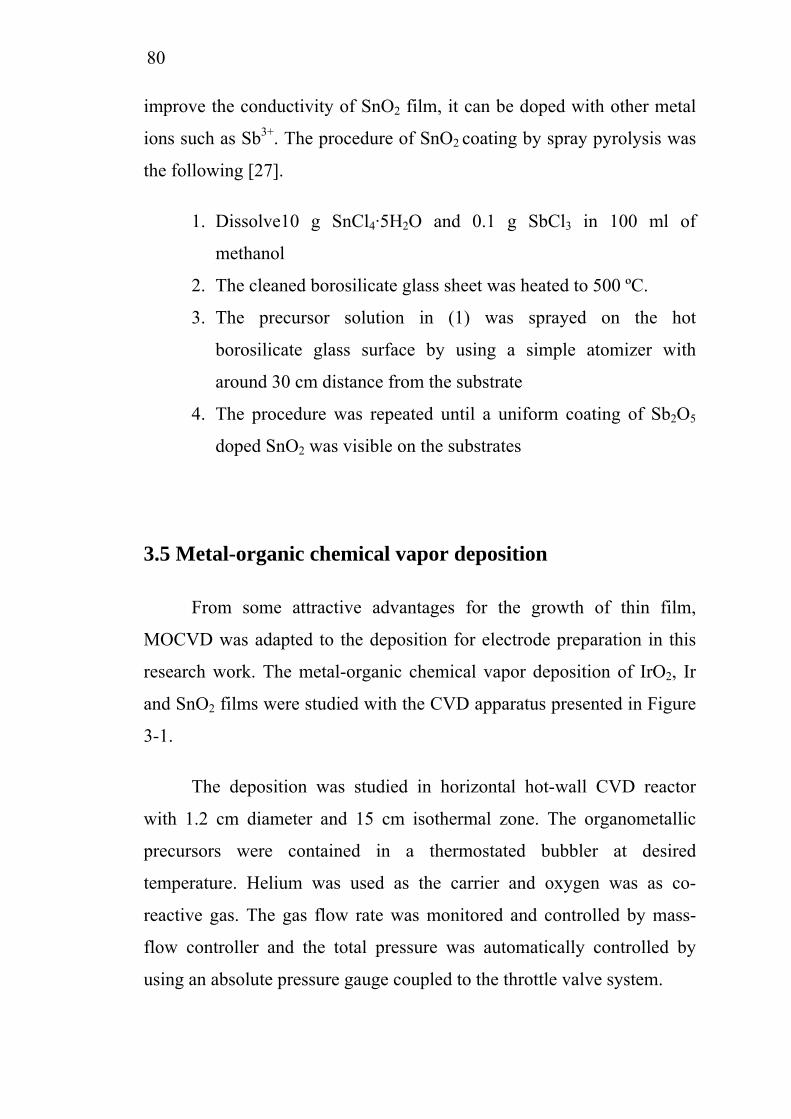
80
improve the conductivity of SnO2 film, it can be doped with other metal
ions such as Sb3+. The procedure of SnO2 coating by spray pyrolysis was
the following [27].
1. Dissolve10 g SnCl4·5H2O and 0.1 g SbCl3 in 100 ml of
methanol
2. The cleaned borosilicate glass sheet was heated to 500 ºC.
3. The precursor solution in (1) was sprayed on the hot
borosilicate glass surface by using a simple atomizer with
around 30 cm distance from the substrate
4. The procedure was repeated until a uniform coating of Sb2O5
doped SnO2 was visible on the substrates
3.5 Metal-organic chemical vapor deposition
From some attractive advantages for the growth of thin film,
MOCVD was adapted to the deposition for electrode preparation in this
research work. The metal-organic chemical vapor deposition of IrO2, Ir
and SnO2 films were studied with the CVD apparatus presented in Figure
3-1.
The deposition was studied in horizontal hot-wall CVD reactor
with 1.2 cm diameter and 15 cm isothermal zone. The organometallic
precursors were contained in a thermostated bubbler at desired
temperature. Helium was used as the carrier and oxygen was as co-
reactive gas. The gas flow rate was monitored and controlled by mass-
flow controller and the total pressure was automatically controlled by
using an absolute pressure gauge coupled to the throttle valve system.
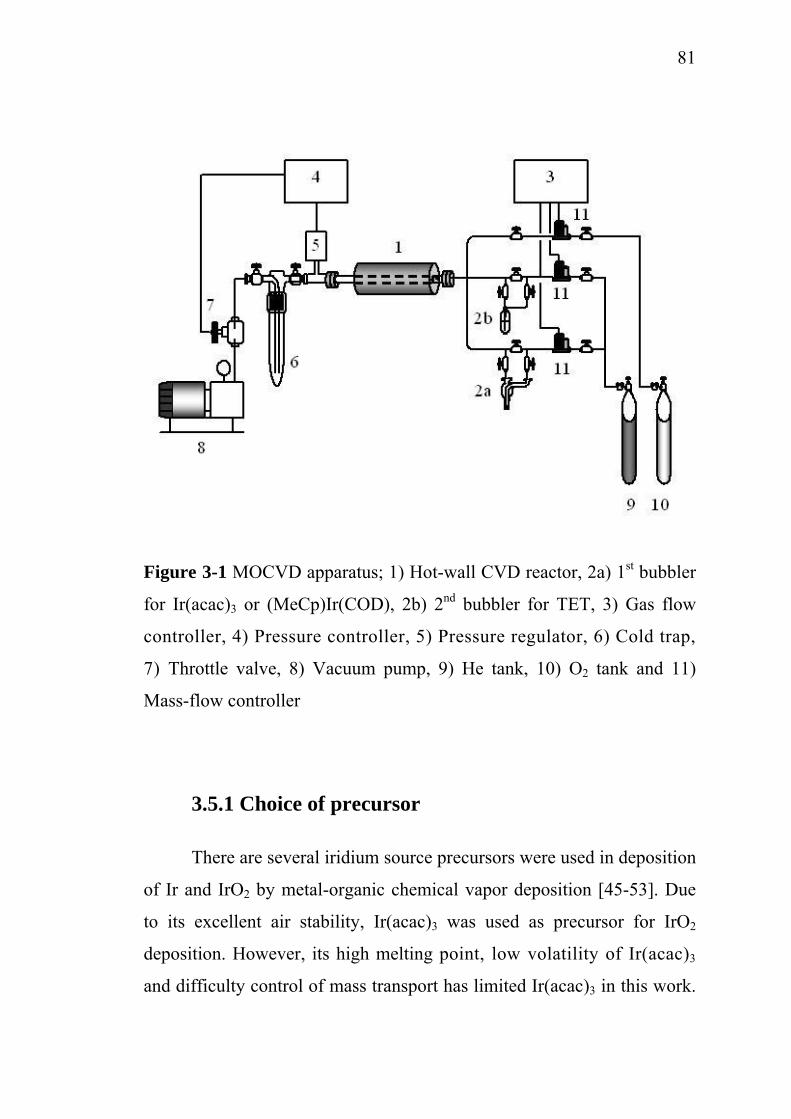
81
Figure 3-1 MOCVD apparatus; 1) Hot-wall CVD reactor, 2a) 1st bubbler
for Ir(acac)3 or (MeCp)Ir(COD), 2b) 2nd bubbler for TET, 3) Gas flow
controller, 4) Pressure controller, 5) Pressure regulator, 6) Cold trap,
7) Throttle valve, 8) Vacuum pump, 9) He tank, 10) O2 tank and 11)
Mass-flow controller
3.5.1 Choice of precursor
There are several iridium source precursors were used in deposition
of Ir and IrO2 by metal-organic chemical vapor deposition [45-53]. Due
to its excellent air stability, Ir(acac)3 was used as precursor for IrO2
deposition. However, its high melting point, low volatility of Ir(acac)3
and difficulty control of mass transport has limited Ir(acac)3 in this work.
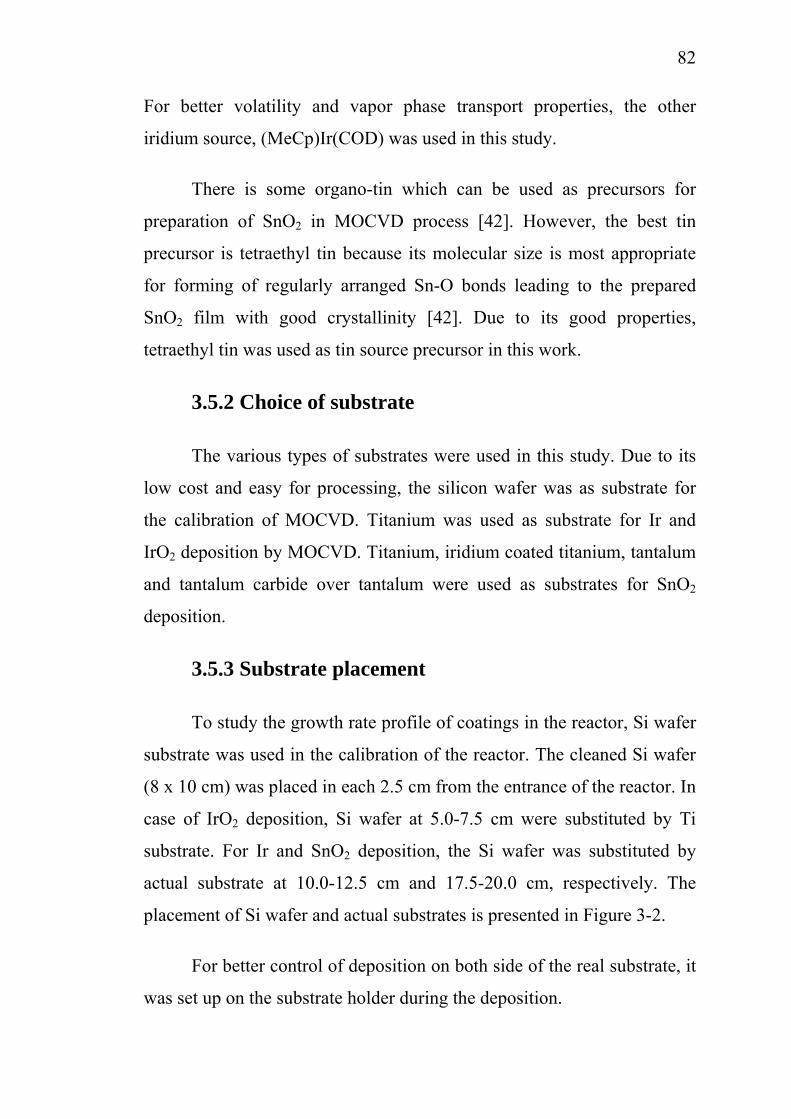
82
For better volatility and vapor phase transport properties, the other
iridium source, (MeCp)Ir(COD) was used in this study.
There is some organo-tin which can be used as precursors for
preparation of SnO2 in MOCVD process [42]. However, the best tin
precursor is tetraethyl tin because its molecular size is most appropriate
for forming of regularly arranged Sn-O bonds leading to the prepared
SnO2 film with good crystallinity [42]. Due to its good properties,
tetraethyl tin was used as tin source precursor in this work.
3.5.2 Choice of substrate
The various types of substrates were used in this study. Due to its
low cost and easy for processing, the silicon wafer was as substrate for
the calibration of MOCVD. Titanium was used as substrate for Ir and
IrO2 deposition by MOCVD. Titanium, iridium coated titanium, tantalum
and tantalum carbide over tantalum were used as substrates for SnO2
deposition.
3.5.3 Substrate placement
To study the growth rate profile of coatings in the reactor, Si wafer
substrate was used in the calibration of the reactor. The cleaned Si wafer
(8 x 10 cm) was placed in each 2.5 cm from the entrance of the reactor. In
case of IrO2 deposition, Si wafer at 5.0-7.5 cm were substituted by Ti
substrate. For Ir and SnO2 deposition, the Si wafer was substituted by
actual substrate at 10.0-12.5 cm and 17.5-20.0 cm, respectively. The
placement of Si wafer and actual substrates is presented in Figure 3-2.
For better control of deposition on both side of the real substrate, it
was set up on the substrate holder during the deposition.
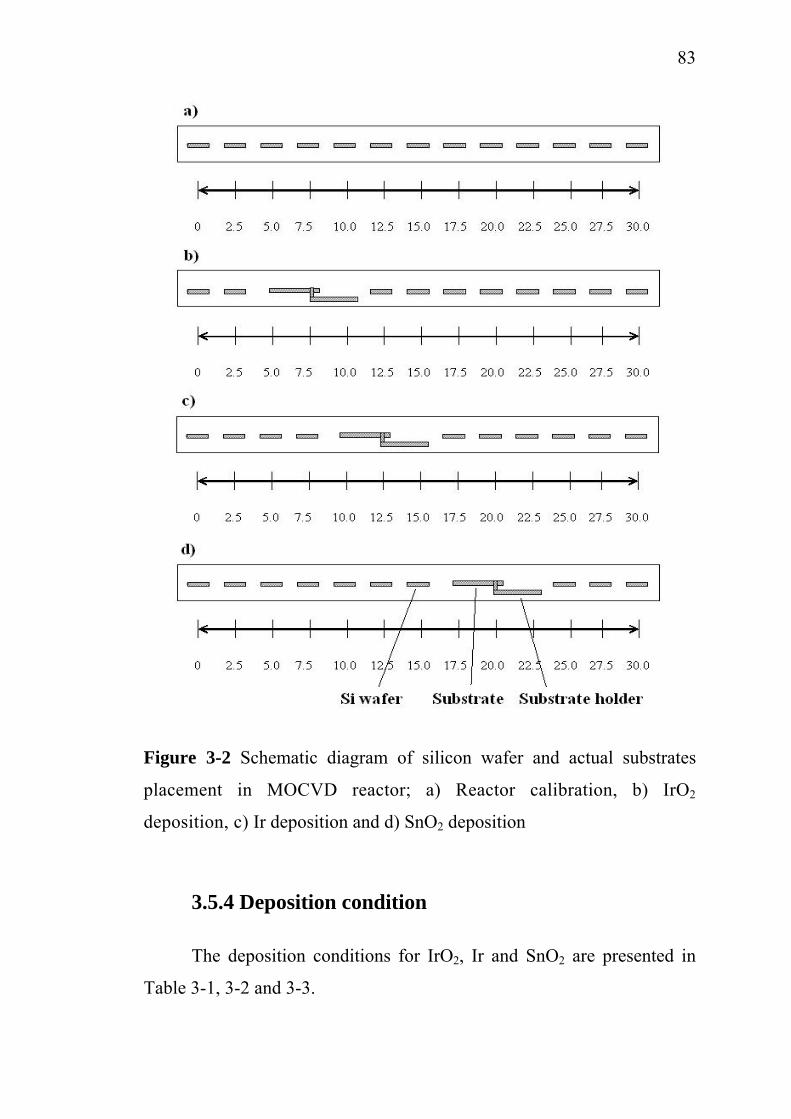
83
Figure 3-2 Schematic diagram of silicon wafer and actual substrates
placement in MOCVD reactor; a) Reactor calibration, b) IrO2
deposition, c) Ir deposition and d) SnO2 deposition
3.5.4 Deposition condition
The deposition conditions for IrO2, Ir and SnO2 are presented in
Table 3-1, 3-2 and 3-3.
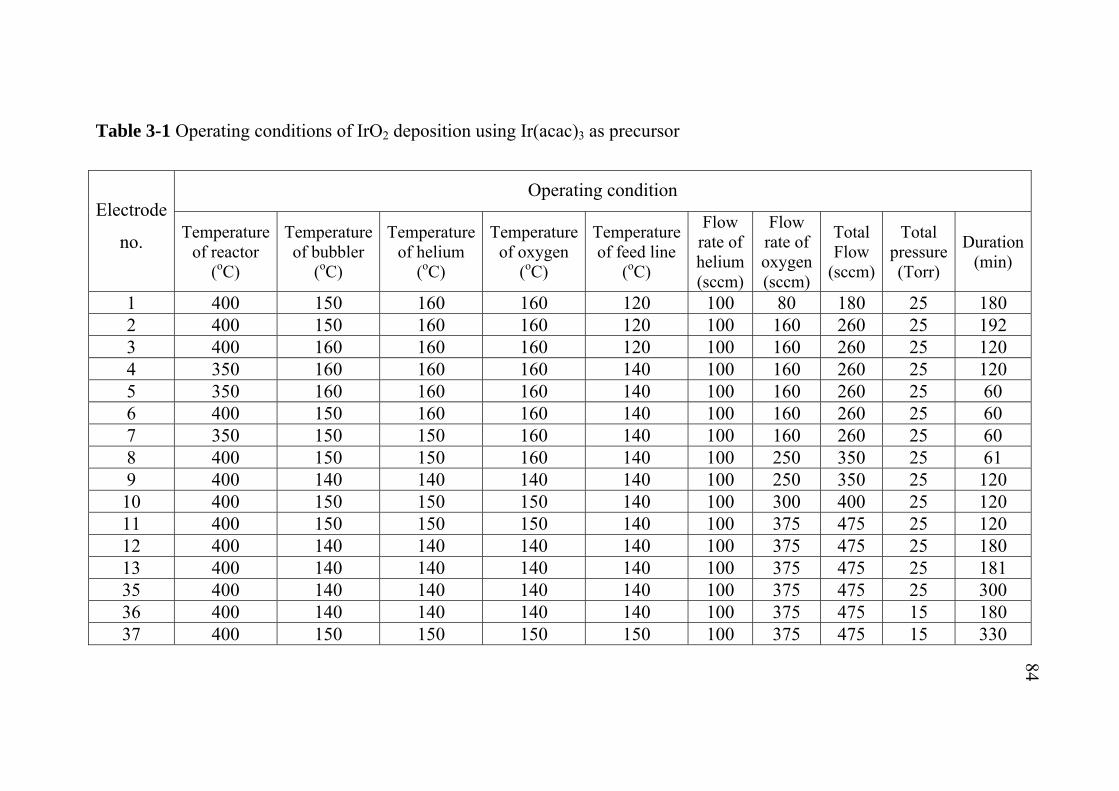
Table 3-1 Operating conditions of IrO2 deposition using Ir(acac)3 as precursor
Operating condition Electrode
no. Temperature of reactor
(oC)
Temperature of bubbler
(oC)
Temperature of helium
(oC)
Temperature of oxygen
(oC)
Temperature of feed line
(oC)
Flow rate of helium (sccm)
Flow rate of oxygen (sccm)
Total Flow
(sccm)
Total pressure (Torr)
Duration (min)
1 400 150 160 160 120 100 80 180 25 180 2 400 150 160 160 120 100 160 260 25 192 3 400 160 160 160 120 100 160 260 25 120 4 350 160 160 160 140 100 160 260 25 120 5 350 160 160 160 140 100 160 260 25 60 6 400 150 160 160 140 100 160 260 25 60 7 350 150 150 160 140 100 160 260 25 60 8 400 150 150 160 140 100 250 350 25 61 9 400 140 140 140 140 100 250 350 25 120 10 400 150 150 150 140 100 300 400 25 120 11 400 150 150 150 140 100 375 475 25 120 12 400 140 140 140 140 100 375 475 25 180 13 400 140 140 140 140 100 375 475 25 181 35 400 140 140 140 140 100 375 475 25 300 36 400 140 140 140 140 100 375 475 15 180 37 400 150 150 150 150 100 375 475 15 330
84
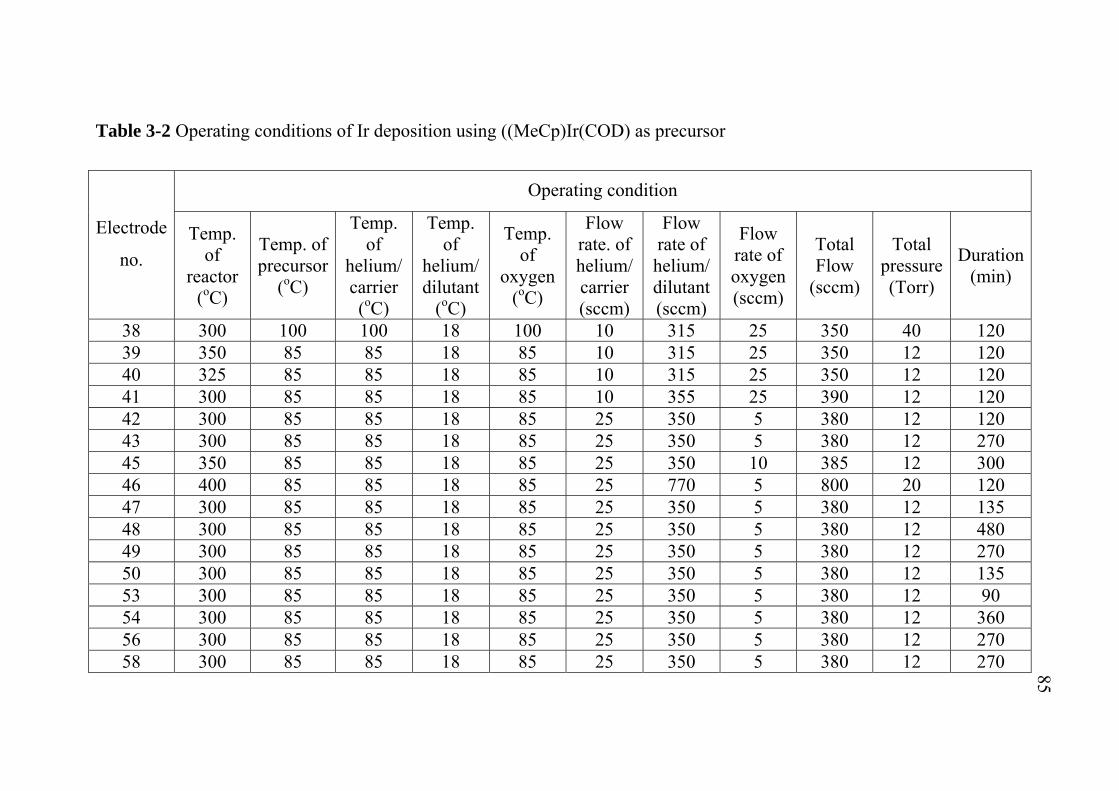
Table 3-2 Operating conditions of Ir deposition using ((MeCp)Ir(COD) as precursor
Operating condition
Flow rate of helium/ dilutant (sccm)
Temp. of
helium/ dilutant
(
Temp. of
helium/
Flow rate. of helium/ carrier (sccm)
Electrode
no. Flow
rate of oxygen (sccm)
Temp. of
reactor (
Temp. of
oxygen (
Total Flow
(sccm)
Total pressure (Torr)
Temp. of precursor
(
Duration (min) oC) carrier o oC) C) o o( C) C)
38 300 100 100 18 100 10 315 25 350 40 120 39 350 85 85 18 85 10 315 25 350 12 120 40 325 85 85 18 85 10 315 25 350 12 120 41 300 85 85 18 85 10 355 25 390 12 120 42 300 85 85 18 85 25 350 5 380 12 120 43 300 85 85 18 85 25 350 5 380 12 270 45 350 85 85 18 85 25 350 10 385 12 300 46 400 85 85 18 85 25 770 5 800 20 120 47 300 85 85 18 85 25 350 5 380 12 135 48 300 85 85 18 85 25 350 5 380 12 480 49 300 85 85 18 85 25 350 5 380 12 270 50 300 85 85 18 85 25 350 5 380 12 135 53 300 85 85 18 85 25 350 5 380 12 90 54 300 85 85 18 85 25 350 5 380 12 360 56 300 85 85 18 85 25 350 5 380 12 270 58 300 85 85 18 85 25 350 5 380 12 270 85
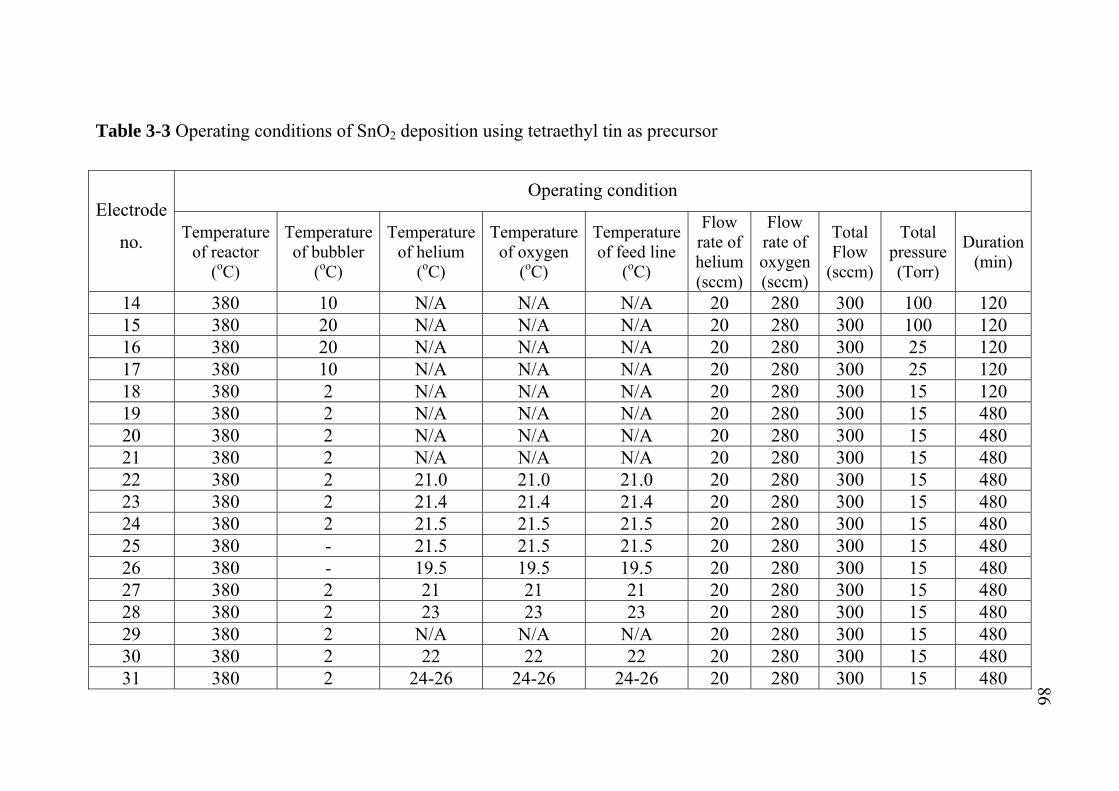
Table 3-3 Operating conditions of SnO2 deposition using tetraethyl tin as precursor
Operating condition Electrode
no. Flow
rate of helium (sccm)
Flow rate of oxygen (sccm)
Temperature of reactor
(
Temperature of bubbler
(
Temperature of helium
(
Temperature of oxygen
(
Temperature of feed line
(
Total Flow
(sccm)
Total pressure (Torr)
Duration (min) o o o o oC) C) C) C) C)
14 380 10 N/A N/A N/A 20 280 300 100 120 15 380 20 N/A N/A N/A 20 280 300 100 120 16 380 20 N/A N/A N/A 20 280 300 25 120 17 380 10 N/A N/A N/A 20 280 300 25 120 18 380 2 N/A N/A N/A 20 280 300 15 120 19 380 2 N/A N/A N/A 20 280 300 15 480 20 380 2 N/A N/A N/A 20 280 300 15 480 21 380 2 N/A N/A N/A 20 280 300 15 480 22 380 2 21.0 21.0 21.0 20 280 300 15 480 23 380 2 21.4 21.4 21.4 20 280 300 15 480 24 380 2 21.5 21.5 21.5 20 280 300 15 480 25 380 - 21.5 21.5 21.5 20 280 300 15 480 26 380 - 19.5 19.5 19.5 20 280 300 15 480 27 380 2 21 21 21 20 280 300 15 480 28 380 2 23 23 23 20 280 300 15 480 29 380 2 N/A N/A N/A 20 280 300 15 480 30 380 2 22 22 22 20 280 300 15 480 31 380 2 24-26 24-26 24-26 20 280 300 15 480 86
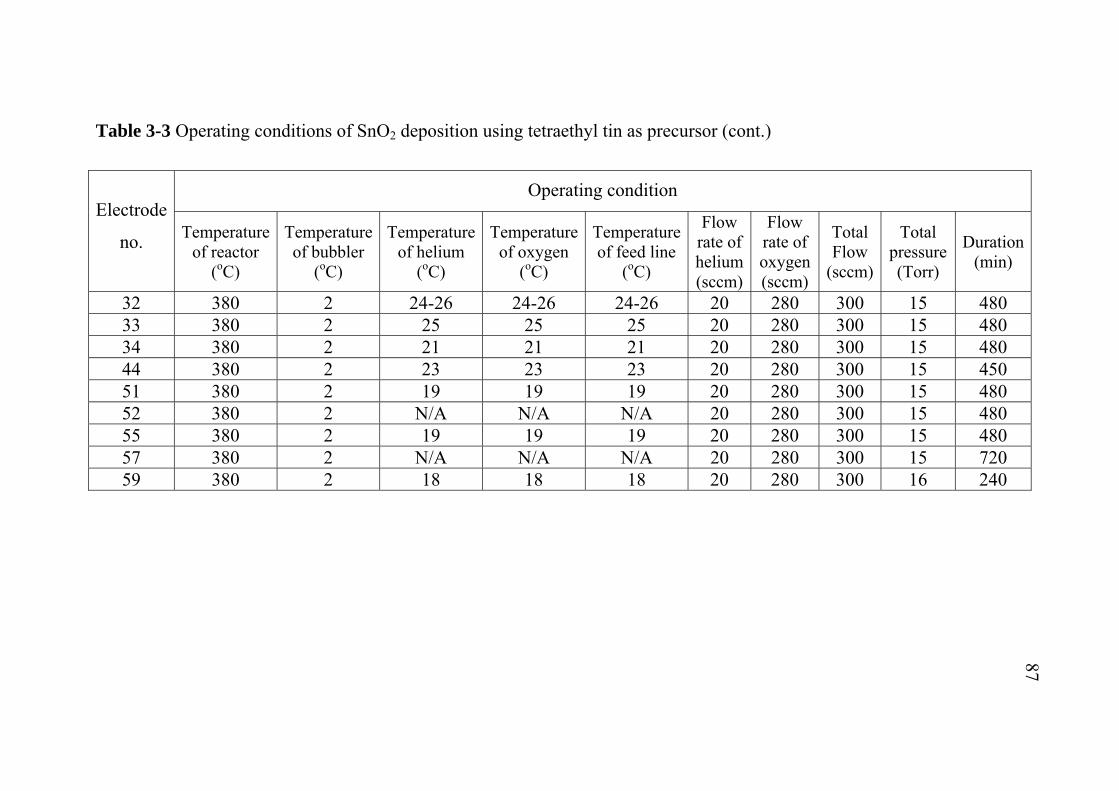
Table 3-3 Operating conditions of SnO2 deposition using tetraethyl tin as precursor (cont.)
Operating condition Electrode
no. Flow
rate of helium (sccm)
Flow rate of oxygen (sccm)
Temperature of reactor
(
Temperature of bubbler
(
Temperature of helium
(
Temperature of oxygen
(
Temperature of feed line
(
Total Flow
(sccm)
Total pressure (Torr)
Duration (min) o o o o oC) C) C) C) C)
32 380 2 24-26 24-26 24-26 20 280 300 15 480 33 380 2 25 25 25 20 280 300 15 480 34 380 2 21 21 21 20 280 300 15 480 44 380 2 23 23 23 20 280 300 15 450 51 380 2 19 19 19 20 280 300 15 480 52 380 2 N/A N/A N/A 20 280 300 15 480 55 380 2 19 19 19 20 280 300 15 480 57 380 2 N/A N/A N/A 20 280 300 15 720 59 380 2 18 18 18 20 280 300 16 240
87
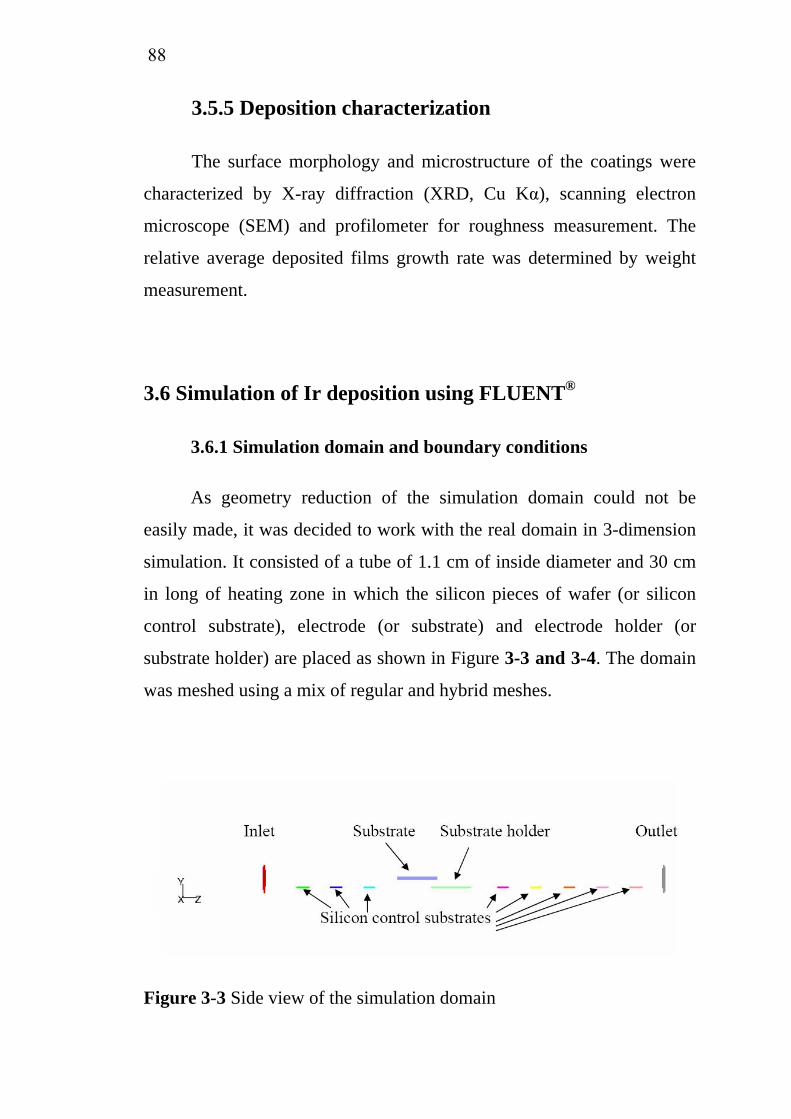
88
3.5.5 Deposition characterization
The surface morphology and microstructure of the coatings were
characterized by X-ray diffraction (XRD, Cu Kα), scanning electron
microscope (SEM) and profilometer for roughness measurement. The
relative average deposited films growth rate was determined by weight
measurement.
3.6 Simulation of Ir deposition using FLUENT®
3.6.1 Simulation domain and boundary conditions
As geometry reduction of the simulation domain could not be
easily made, it was decided to work with the real domain in 3-dimension
simulation. It consisted of a tube of 1.1 cm of inside diameter and 30 cm
in long of heating zone in which the silicon pieces of wafer (or silicon
control substrate), electrode (or substrate) and electrode holder (or
substrate holder) are placed as shown in Figure 3-3 and 3-4. The domain
was meshed using a mix of regular and hybrid meshes.
Figure 3-3 Side view of the simulation domain
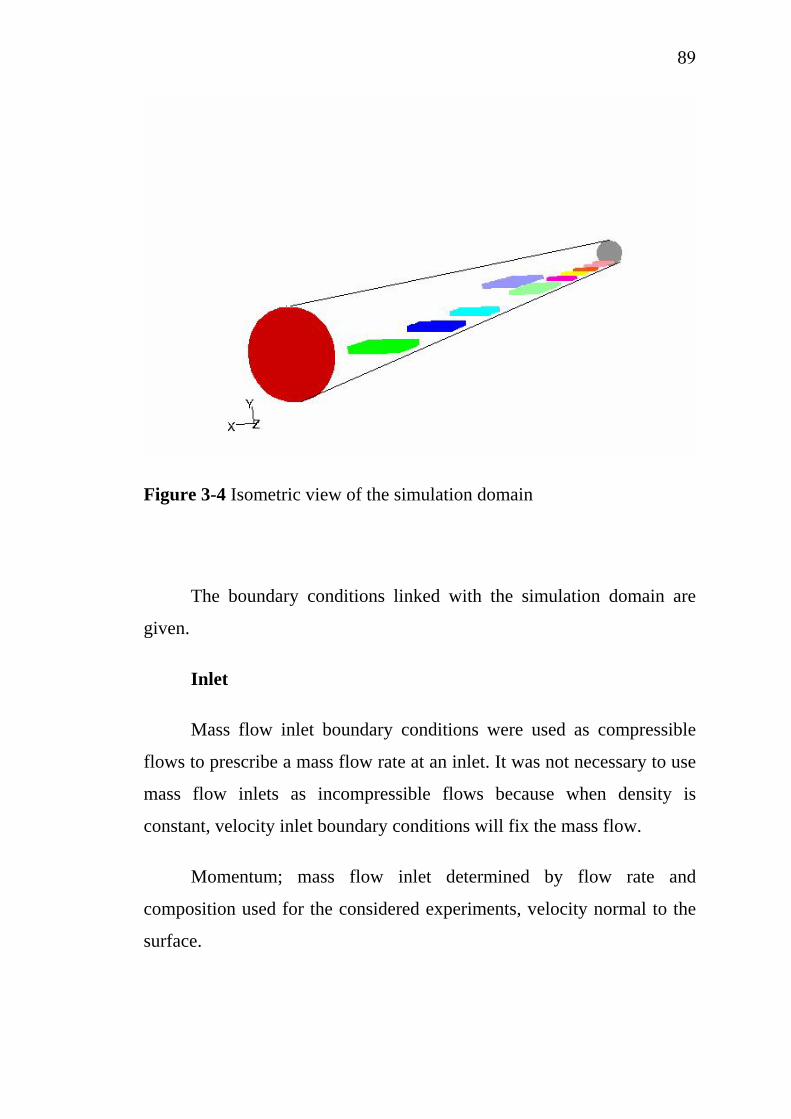
89
Figure 3-4 Isometric view of the simulation domain
The boundary conditions linked with the simulation domain are
given.
Inlet
Mass flow inlet boundary conditions were used as compressible
flows to prescribe a mass flow rate at an inlet. It was not necessary to use
mass flow inlets as incompressible flows because when density is
constant, velocity inlet boundary conditions will fix the mass flow.
Momentum; mass flow inlet determined by flow rate and
composition used for the considered experiments, velocity normal to the
surface.
90
Thermal condition; temperature was corresponding to the measured
experimental value.
Species; mass fraction was corresponding to operating conditions
using simulation.
Substrate, substrate holder, silicon control substrate and
reactor wall
Momentum; stationary wall and no slip condition.
Thermal conditions; temperature fixed using experimental thermal
profile.
Species; flow was corresponding to the kinetics reaction.
Outlet
Outflow conditions for momentum, thermal and species; outflow
boundary conditions were used to simulate the flow exited where the
details of the flow velocity and pressure were unknown prior to solution
of the flow problem. They are appropriate where the exit flow was close
to a fully developed condition, as the outflow boundary condition
assumed a zero normal gradient for all flow variables except pressure.
They were inappropriate for compressible flow calculations.
As thermal boundary conditions, it has been decide to fix these
values to the values measured experimentally.
91
3.6.2 Main assumptions for the simulation
As the pressure drop through the reactor was very low, less than 1
torr, it was assumed that gases could be considered as incompressible
ideal gases.
The mass diffusivity has been calculated using kinetic-theory and
Lennard-Jones parameters. Values for Lennard-Jones parameters were
taken from the data table of the FLUENT® software for referenced
species.
Viscosity and thermal capacity have been computed using mixing
law using FLUENT® software.
It has been assumed that the flow was laminar. Energy equation
was solved for determine the thermal profile in the gas mixtures. As the
temperature was not quite high, radiation effect was taken into account
and only convective and diffusive energy transport were considered.
Figures 3-5, 3-6 and 3-7 represents the different planes that were
taken into account for the presentation of the results of the simulation. It
will be used a horizontal plane (y = 0) corresponding to the bottom of
substrate. We will use also a vertical plane (x = 0) corresponding to the
only symmetry plane of the system. The plane for z = 0.129 m
corresponded to the vertical plane for the end of the substrate.
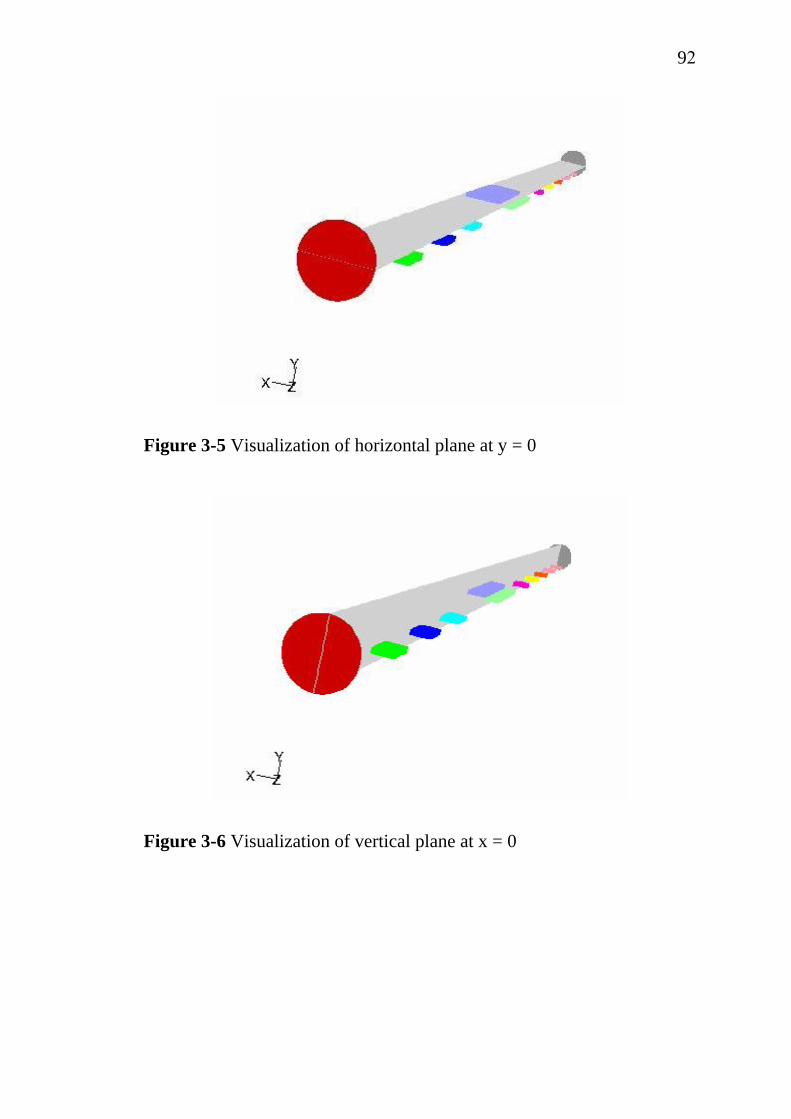
92
Figure 3-5 Visualization of horizontal plane at y = 0
Figure 3-6 Visualization of vertical plane at x = 0
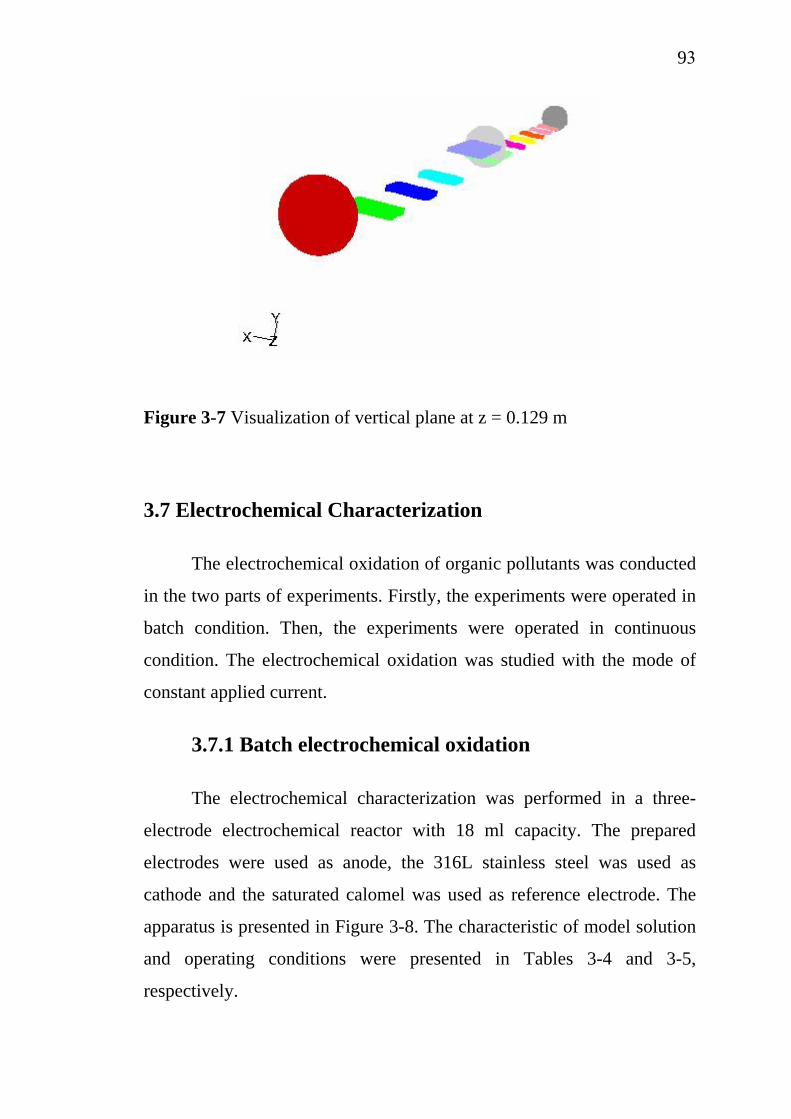
93
Figure 3-7 Visualization of vertical plane at z = 0.129 m
3.7 Electrochemical Characterization
The electrochemical oxidation of organic pollutants was conducted
in the two parts of experiments. Firstly, the experiments were operated in
batch condition. Then, the experiments were operated in continuous
condition. The electrochemical oxidation was studied with the mode of
constant applied current.
3.7.1 Batch electrochemical oxidation
The electrochemical characterization was performed in a three-
electrode electrochemical reactor with 18 ml capacity. The prepared
electrodes were used as anode, the 316L stainless steel was used as
cathode and the saturated calomel was used as reference electrode. The
apparatus is presented in Figure 3-8. The characteristic of model solution
and operating conditions were presented in Tables 3-4 and 3-5,
respectively.
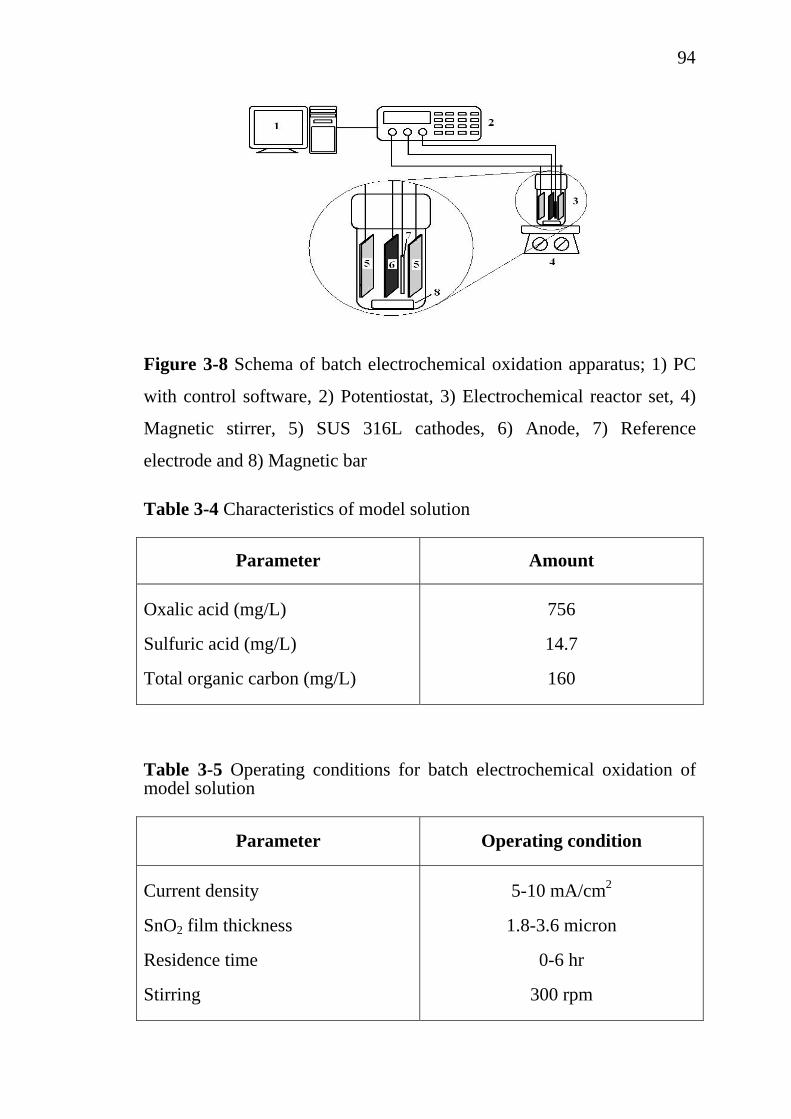
94
Figure 3-8 Schema of batch electrochemical oxidation apparatus; 1) PC
with control software, 2) Potentiostat, 3) Electrochemical reactor set, 4)
Magnetic stirrer, 5) SUS 316L cathodes, 6) Anode, 7) Reference
electrode and 8) Magnetic bar
Table 3-4 Characteristics of model solution
Parameter Amount
Oxalic acid (mg/L)
Sulfuric acid (mg/L)
Total organic carbon (mg/L)
756
14.7
160
Table 3-5 Operating conditions for batch electrochemical oxidation of model solution
Parameter Operating condition
Current density
SnO2 film thickness
Residence time
Stirring
5-10 mA/cm2
1.8-3.6 micron
0-6 hr
300 rpm
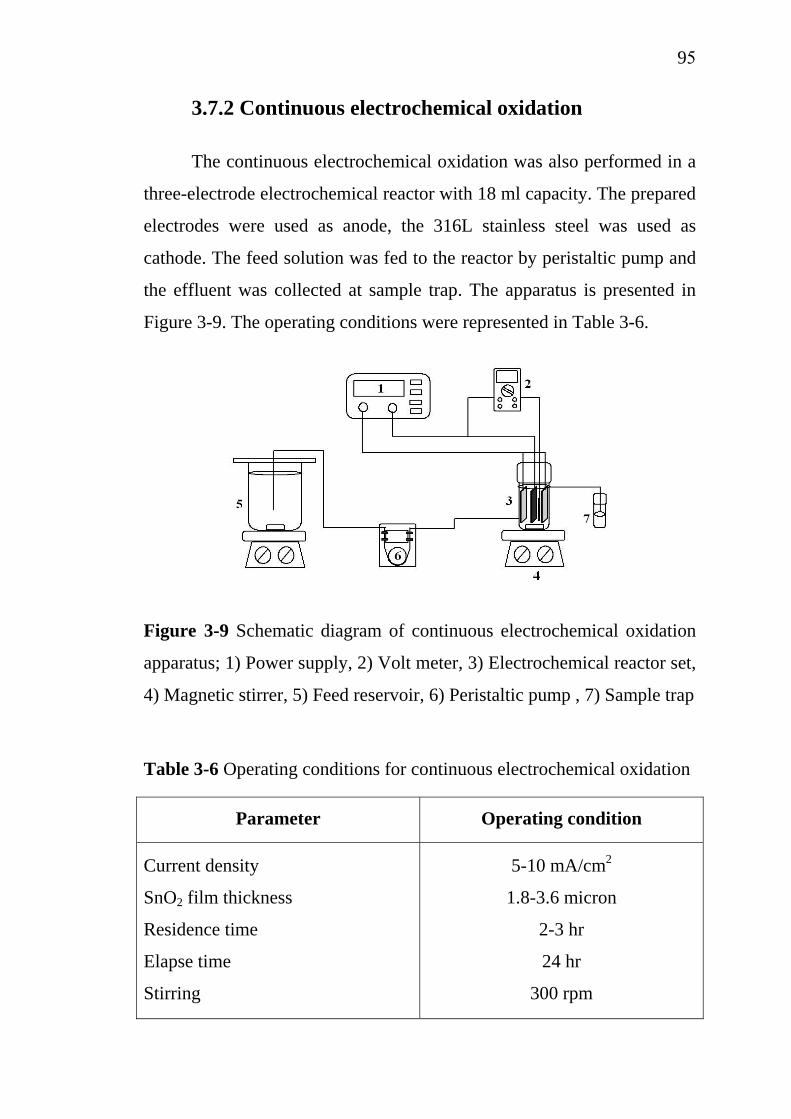
95
3.7.2 Continuous electrochemical oxidation
The continuous electrochemical oxidation was also performed in a
three-electrode electrochemical reactor with 18 ml capacity. The prepared
electrodes were used as anode, the 316L stainless steel was used as
cathode. The feed solution was fed to the reactor by peristaltic pump and
the effluent was collected at sample trap. The apparatus is presented in
Figure 3-9. The operating conditions were represented in Table 3-6.
Figure 3-9 Schematic diagram of continuous electrochemical oxidation
apparatus; 1) Power supply, 2) Volt meter, 3) Electrochemical reactor set,
4) Magnetic stirrer, 5) Feed reservoir, 6) Peristaltic pump , 7) Sample trap
Table 3-6 Operating conditions for continuous electrochemical oxidation
Parameter Operating condition
Current density
SnO2 film thickness
Residence time
Elapse time
Stirring
5-10 mA/cm2
1.8-3.6 micron
2-3 hr
24 hr
300 rpm
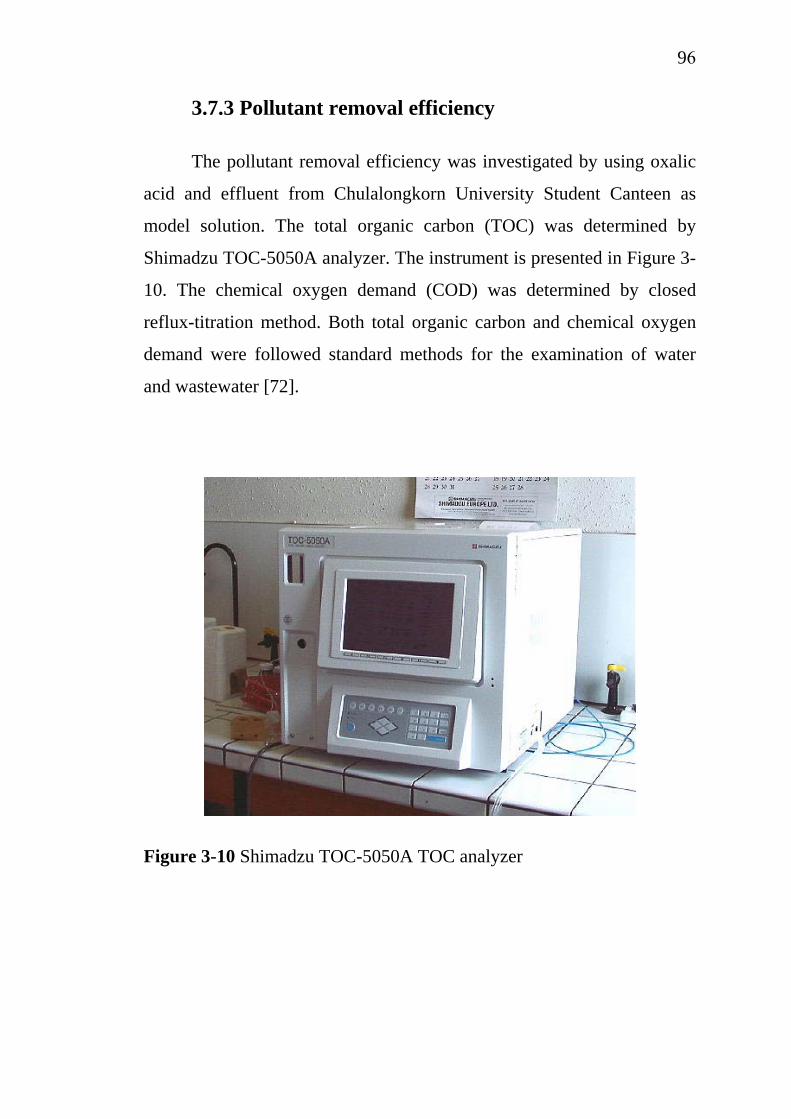
96
3.7.3 Pollutant removal efficiency
The pollutant removal efficiency was investigated by using oxalic
acid and effluent from Chulalongkorn University Student Canteen as
model solution. The total organic carbon (TOC) was determined by
Shimadzu TOC-5050A analyzer. The instrument is presented in Figure 3-
10. The chemical oxygen demand (COD) was determined by closed
reflux-titration method. Both total organic carbon and chemical oxygen
demand were followed standard methods for the examination of water
and wastewater [72].
Figure 3-10 Shimadzu TOC-5050A TOC analyzer
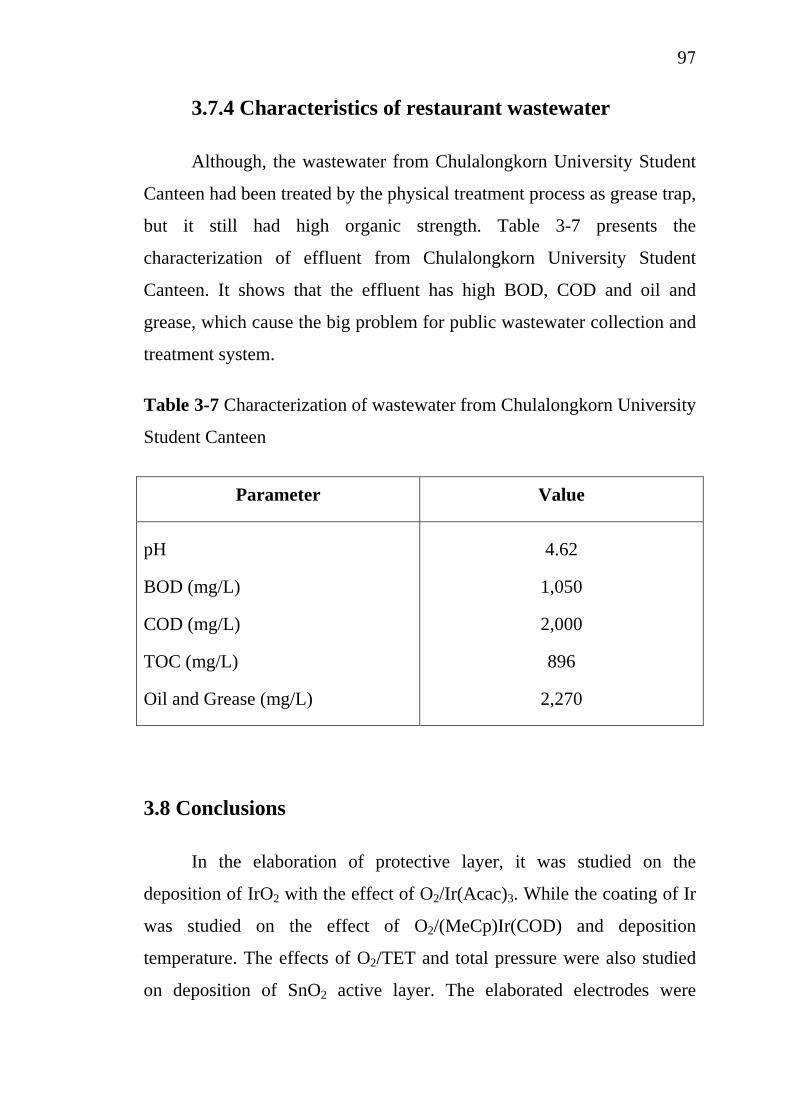
97
3.7.4 Characteristics of restaurant wastewater
Although, the wastewater from Chulalongkorn University Student
Canteen had been treated by the physical treatment process as grease trap,
but it still had high organic strength. Table 3-7 presents the
characterization of effluent from Chulalongkorn University Student
Canteen. It shows that the effluent has high BOD, COD and oil and
grease, which cause the big problem for public wastewater collection and
treatment system.
Table 3-7 Characterization of wastewater from Chulalongkorn University
Student Canteen
Parameter Value
pH
BOD (mg/L)
COD (mg/L)
TOC (mg/L)
Oil and Grease (mg/L)
4.62
1,050
2,000
896
2,270
3.8 Conclusions
In the elaboration of protective layer, it was studied on the
deposition of IrO2 with the effect of O2/Ir(Acac)3. While the coating of Ir
was studied on the effect of O2/(MeCp)Ir(COD) and deposition
temperature. The effects of O2/TET and total pressure were also studied
on deposition of SnO2 active layer. The elaborated electrodes were

98
utilized in the destruction of organic pollutant in both model solution and
actual restaurant wastewater. In addition, the FLUENT® software was
used for simulation of Ir deposition.
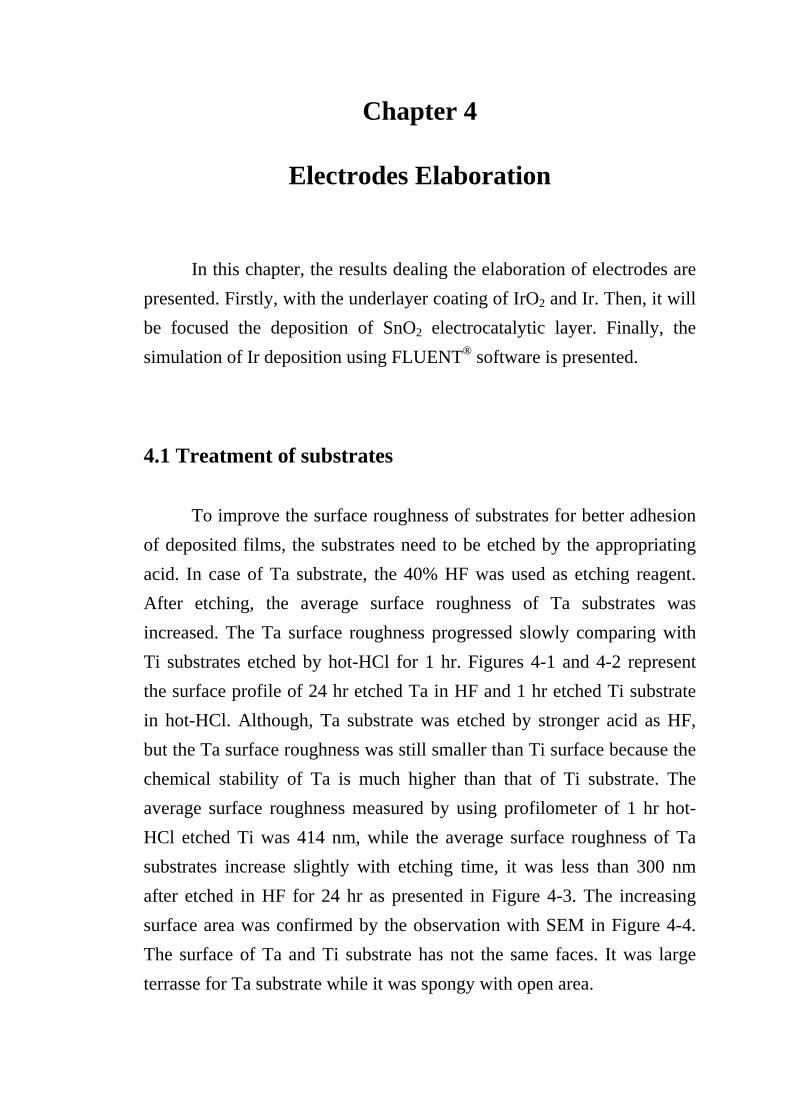
Chapter 4
Electrodes Elaboration
In this chapter, the results dealing the elaboration of electrodes are presented. Firstly, with the underlayer coating of IrO2 and Ir. Then, it will be focused the deposition of SnO2 electrocatalytic layer. Finally, the simulation of Ir deposition using FLUENT® software is presented.
4.1 Treatment of substrates
To improve the surface roughness of substrates for better adhesion of deposited films, the substrates need to be etched by the appropriating acid. In case of Ta substrate, the 40% HF was used as etching reagent. After etching, the average surface roughness of Ta substrates was increased. The Ta surface roughness progressed slowly comparing with Ti substrates etched by hot-HCl for 1 hr. Figures 4-1 and 4-2 represent the surface profile of 24 hr etched Ta in HF and 1 hr etched Ti substrate in hot-HCl. Although, Ta substrate was etched by stronger acid as HF, but the Ta surface roughness was still smaller than Ti surface because the chemical stability of Ta is much higher than that of Ti substrate. The average surface roughness measured by using profilometer of 1 hr hot-HCl etched Ti was 414 nm, while the average surface roughness of Ta substrates increase slightly with etching time, it was less than 300 nm after etched in HF for 24 hr as presented in Figure 4-3. The increasing surface area was confirmed by the observation with SEM in Figure 4-4. The surface of Ta and Ti substrate has not the same faces. It was large terrasse for Ta substrate while it was spongy with open area.
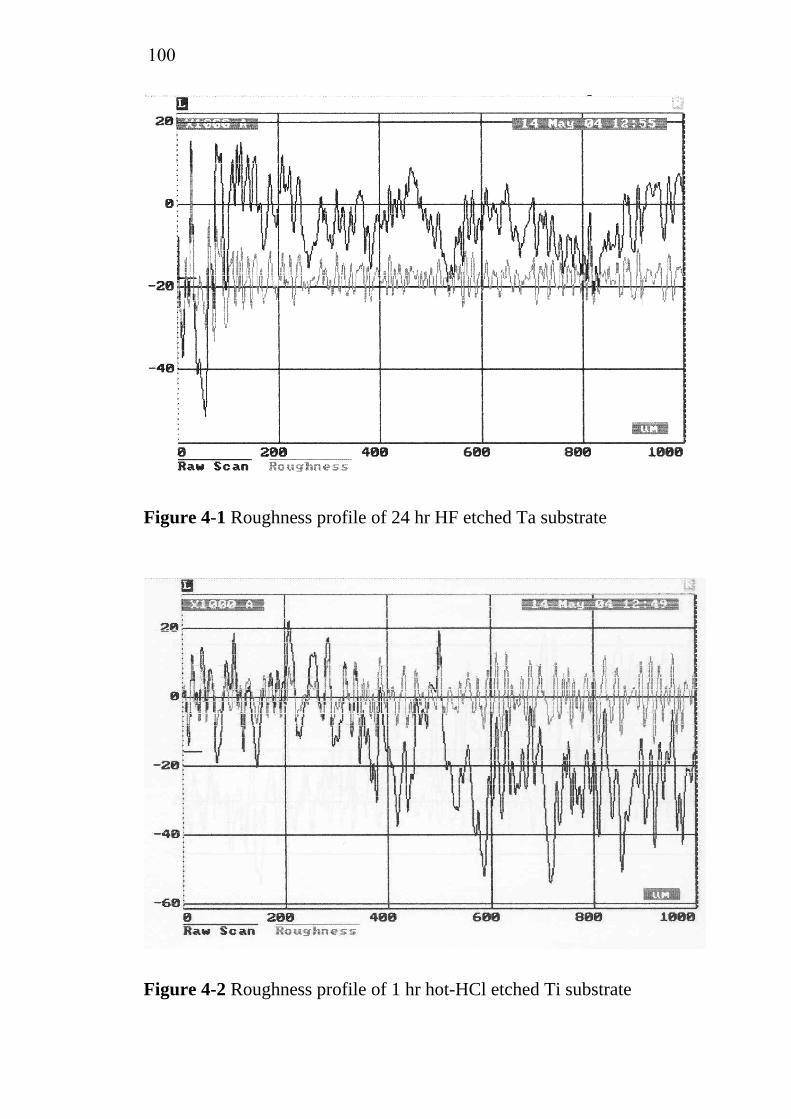
100
Figure 4-1 Roughness profile of 24 hr HF etched Ta substrate
Figure 4-2 Roughness profile of 1 hr hot-HCl etched Ti substrate
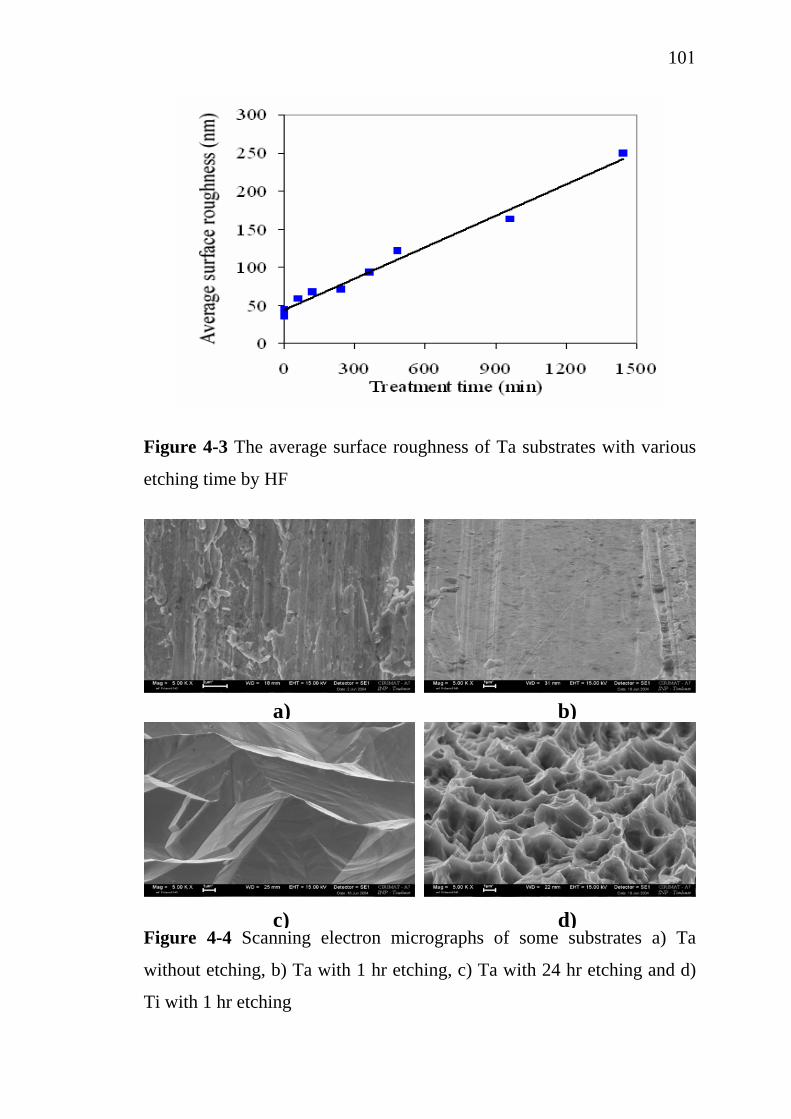
101
Figure 4-3 The average surface roughness of Ta substrates with various
etching time by HF
Figure 4-4 Scanning electron micrographs of some substrates a) Ta
without etching, b) Ta with 1 hr etching, c) Ta with 24 hr etching and d)
Ti with 1 hr etching
a) b)
d) c)
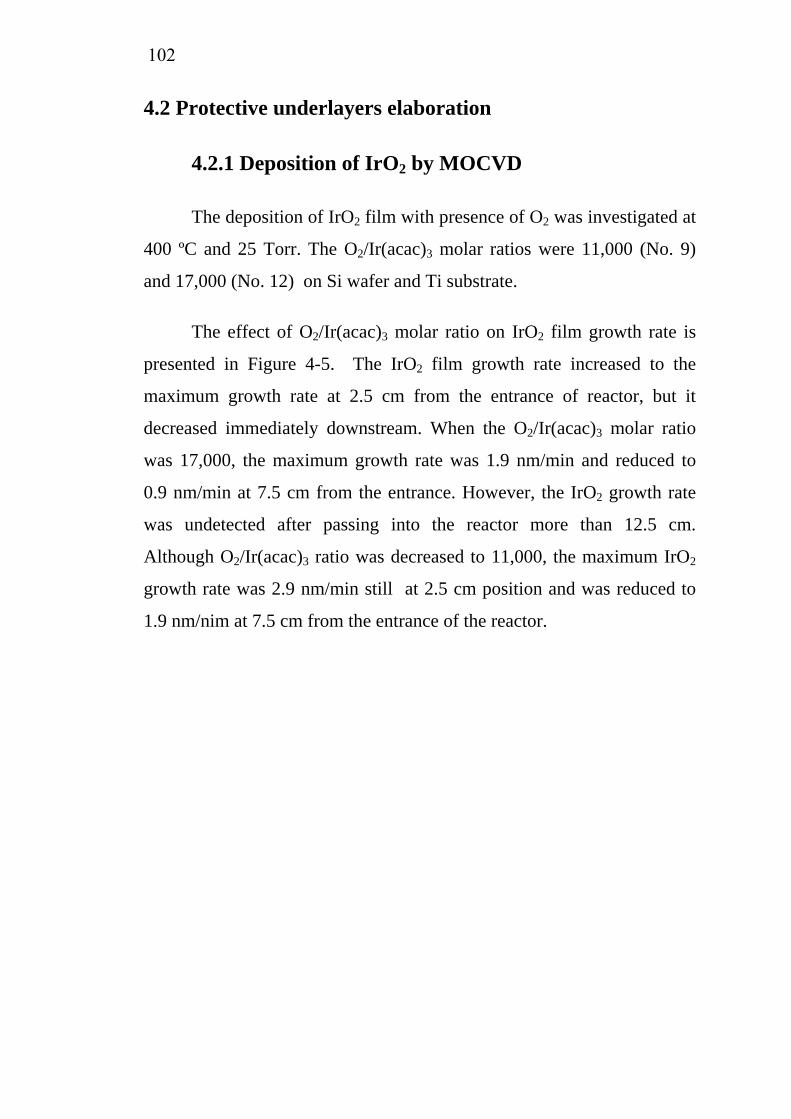
102
4.2 Protective underlayers elaboration
4.2.1 Deposition of IrO2 by MOCVD
The deposition of IrO2 film with presence of O2 was investigated at
400 ºC and 25 Torr. The O2/Ir(acac)3 molar ratios were 11,000 (No. 9)
and 17,000 (No. 12) on Si wafer and Ti substrate.
The effect of O2/Ir(acac)3 molar ratio on IrO2 film growth rate is
presented in Figure 4-5. The IrO2 film growth rate increased to the
maximum growth rate at 2.5 cm from the entrance of reactor, but it
decreased immediately downstream. When the O2/Ir(acac)3 molar ratio
was 17,000, the maximum growth rate was 1.9 nm/min and reduced to
0.9 nm/min at 7.5 cm from the entrance. However, the IrO2 growth rate
was undetected after passing into the reactor more than 12.5 cm.
Although O2/Ir(acac)3 ratio was decreased to 11,000, the maximum IrO2
growth rate was 2.9 nm/min still at 2.5 cm position and was reduced to
1.9 nm/nim at 7.5 cm from the entrance of the reactor.
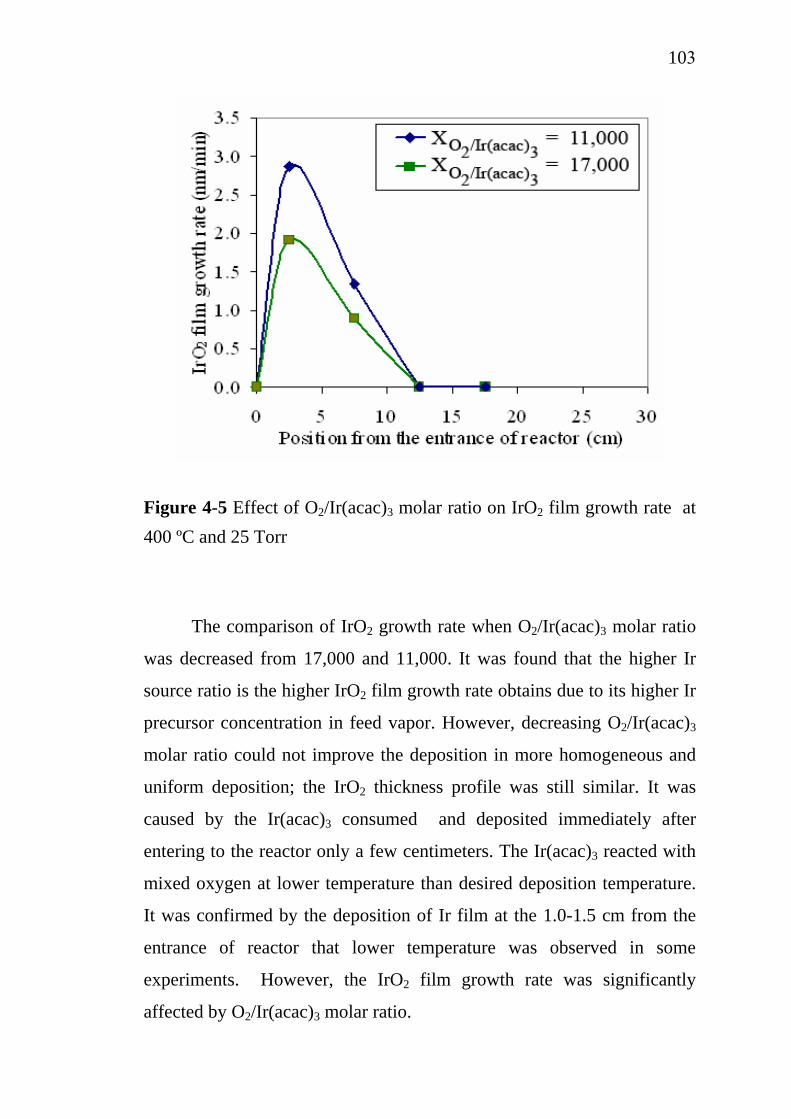
103
Figure 4-5 Effect of O2/Ir(acac)3 molar ratio on IrO2 film growth rate at 400 ºC and 25 Torr
The comparison of IrO2 growth rate when O2/Ir(acac)3 molar ratio
was decreased from 17,000 and 11,000. It was found that the higher Ir
source ratio is the higher IrO2 film growth rate obtains due to its higher Ir
precursor concentration in feed vapor. However, decreasing O2/Ir(acac)3
molar ratio could not improve the deposition in more homogeneous and
uniform deposition; the IrO2 thickness profile was still similar. It was
caused by the Ir(acac)3 consumed and deposited immediately after
entering to the reactor only a few centimeters. The Ir(acac)3 reacted with
mixed oxygen at lower temperature than desired deposition temperature.
It was confirmed by the deposition of Ir film at the 1.0-1.5 cm from the
entrance of reactor that lower temperature was observed in some
experiments. However, the IrO2 film growth rate was significantly
affected by O2/Ir(acac)3 molar ratio.
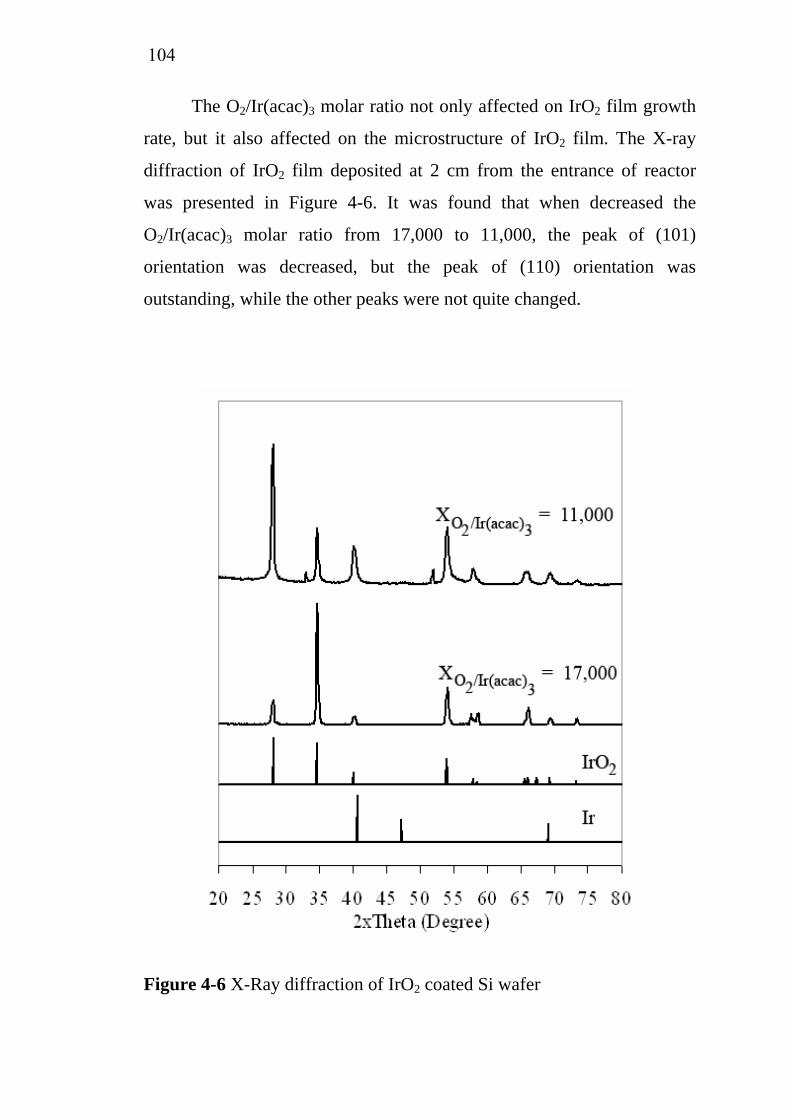
104
The O2/Ir(acac)3 molar ratio not only affected on IrO2 film growth
rate, but it also affected on the microstructure of IrO2 film. The X-ray
diffraction of IrO2 film deposited at 2 cm from the entrance of reactor
was presented in Figure 4-6. It was found that when decreased the
O2/Ir(acac)3 molar ratio from 17,000 to 11,000, the peak of (101)
orientation was decreased, but the peak of (110) orientation was
outstanding, while the other peaks were not quite changed.
Figure 4-6 X-Ray diffraction of IrO2 coated Si wafer
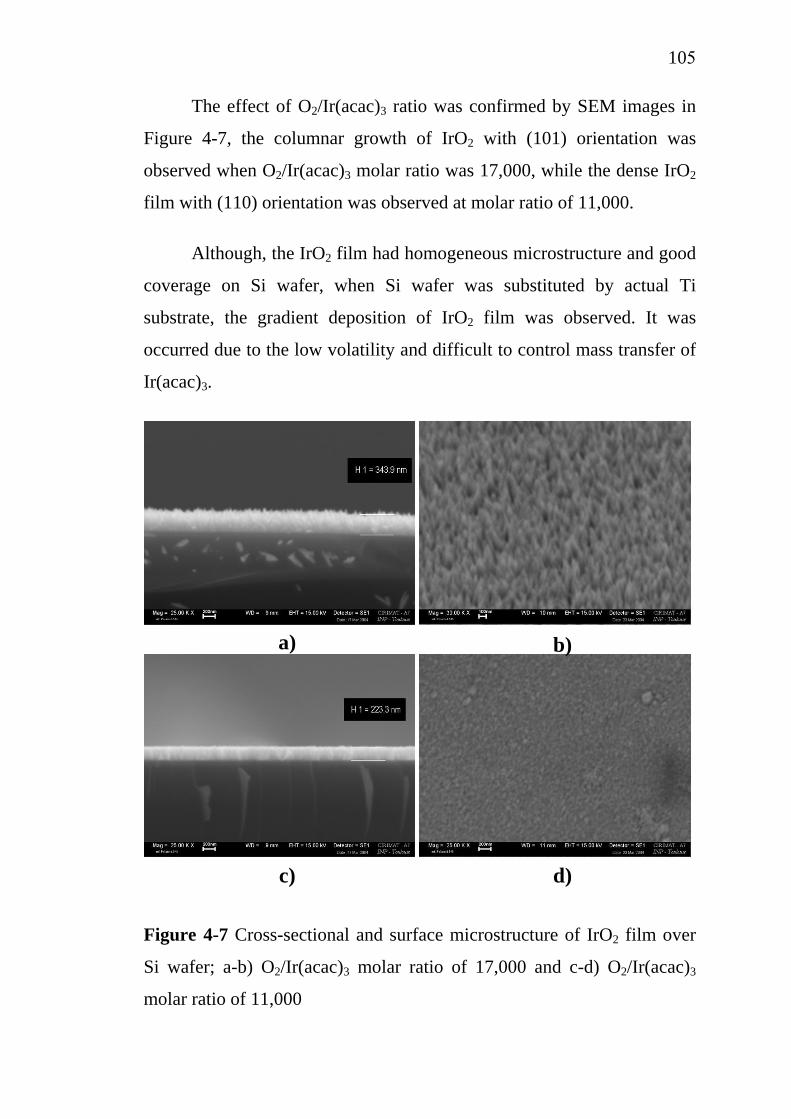
105
The effect of O2/Ir(acac)3 ratio was confirmed by SEM images in
Figure 4-7, the columnar growth of IrO2 with (101) orientation was
observed when O2/Ir(acac)3 molar ratio was 17,000, while the dense IrO2
film with (110) orientation was observed at molar ratio of 11,000.
Although, the IrO2 film had homogeneous microstructure and good
coverage on Si wafer, when Si wafer was substituted by actual Ti
substrate, the gradient deposition of IrO2 film was observed. It was
occurred due to the low volatility and difficult to control mass transfer of
Ir(acac)3.
a) b)
c) d)
Figure 4-7 Cross-sectional and surface microstructure of IrO2 film over
Si wafer; a-b) O2/Ir(acac)3 molar ratio of 17,000 and c-d) O2/Ir(acac)3
molar ratio of 11,000
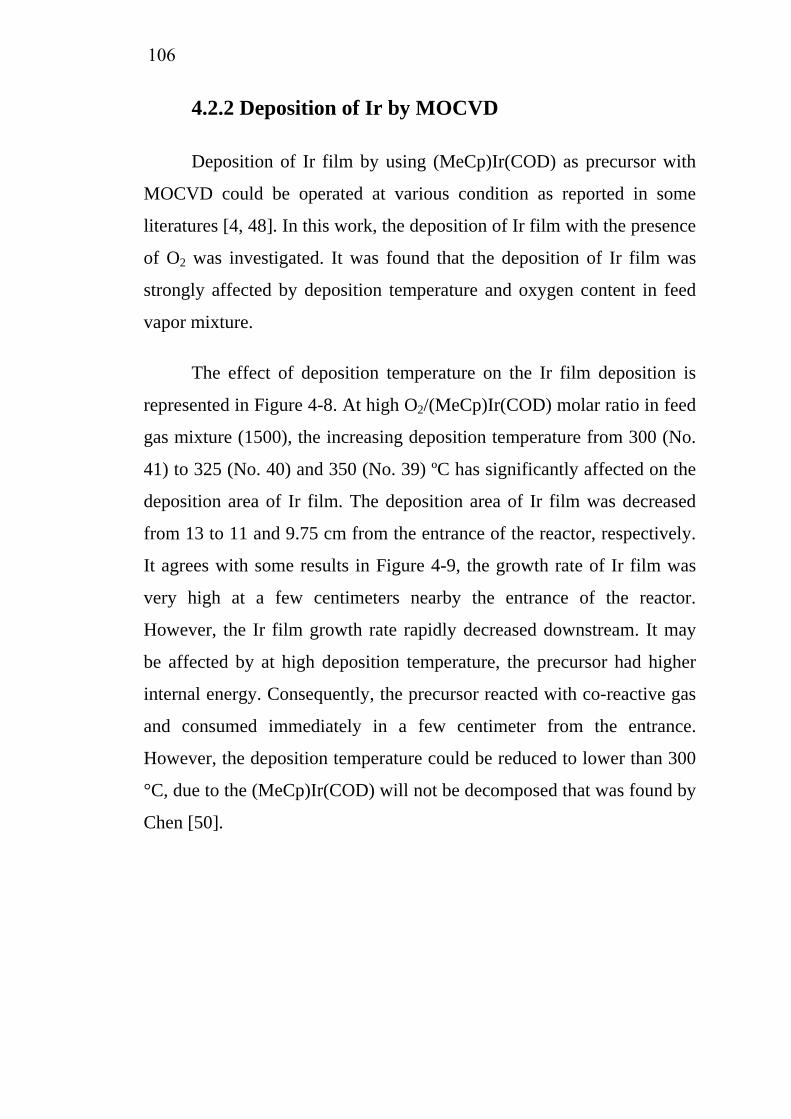
106
4.2.2 Deposition of Ir by MOCVD
Deposition of Ir film by using (MeCp)Ir(COD) as precursor with
MOCVD could be operated at various condition as reported in some
literatures [4, 48]. In this work, the deposition of Ir film with the presence
of O2 was investigated. It was found that the deposition of Ir film was
strongly affected by deposition temperature and oxygen content in feed
vapor mixture.
The effect of deposition temperature on the Ir film deposition is
represented in Figure 4-8. At high O2/(MeCp)Ir(COD) molar ratio in feed
gas mixture (1500), the increasing deposition temperature from 300 (No.
41) to 325 (No. 40) and 350 (No. 39) ºC has significantly affected on the
deposition area of Ir film. The deposition area of Ir film was decreased
from 13 to 11 and 9.75 cm from the entrance of the reactor, respectively.
It agrees with some results in Figure 4-9, the growth rate of Ir film was
very high at a few centimeters nearby the entrance of the reactor.
However, the Ir film growth rate rapidly decreased downstream. It may
be affected by at high deposition temperature, the precursor had higher
internal energy. Consequently, the precursor reacted with co-reactive gas
and consumed immediately in a few centimeter from the entrance.
However, the deposition temperature could be reduced to lower than 300
°C, due to the (MeCp)Ir(COD) will not be decomposed that was found by
Chen [50].
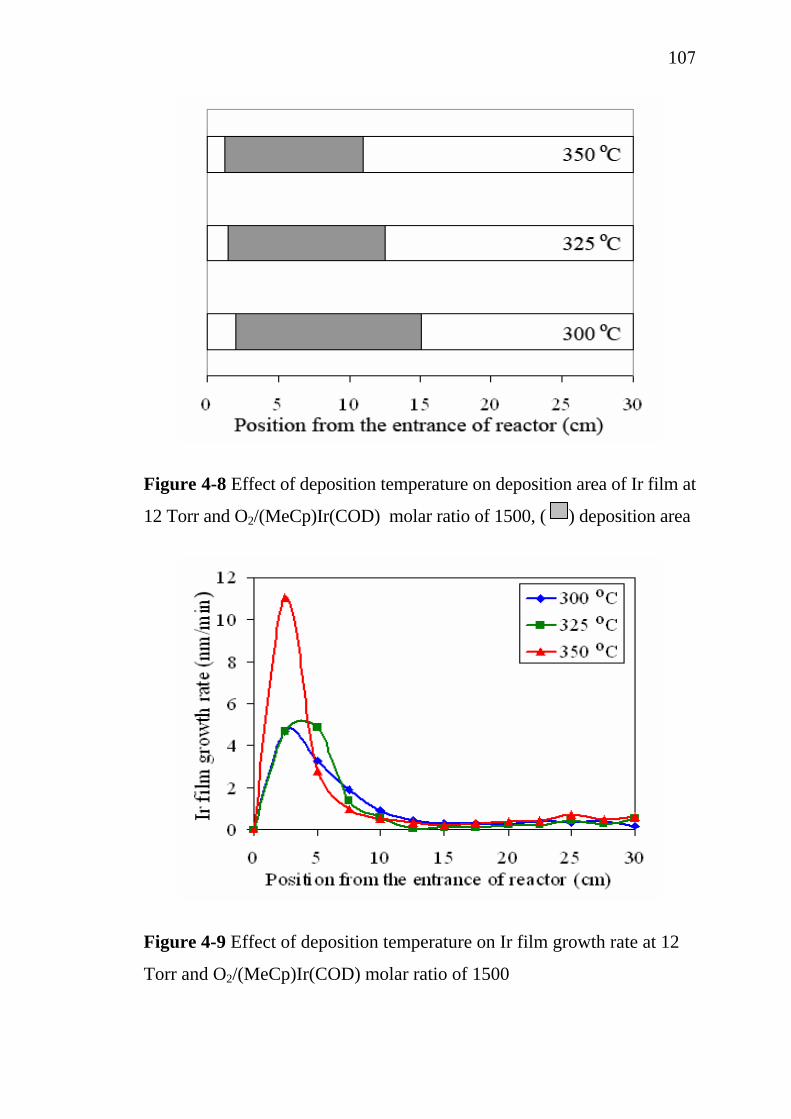
107
Figure 4-8 Effect of deposition temperature on deposition area of Ir film at
12 Torr and O2/(MeCp)Ir(COD) molar ratio of 1500, ( ) deposition area
Figure 4-9 Effect of deposition temperature on Ir film growth rate at 12
Torr and O2/(MeCp)Ir(COD) molar ratio of 1500
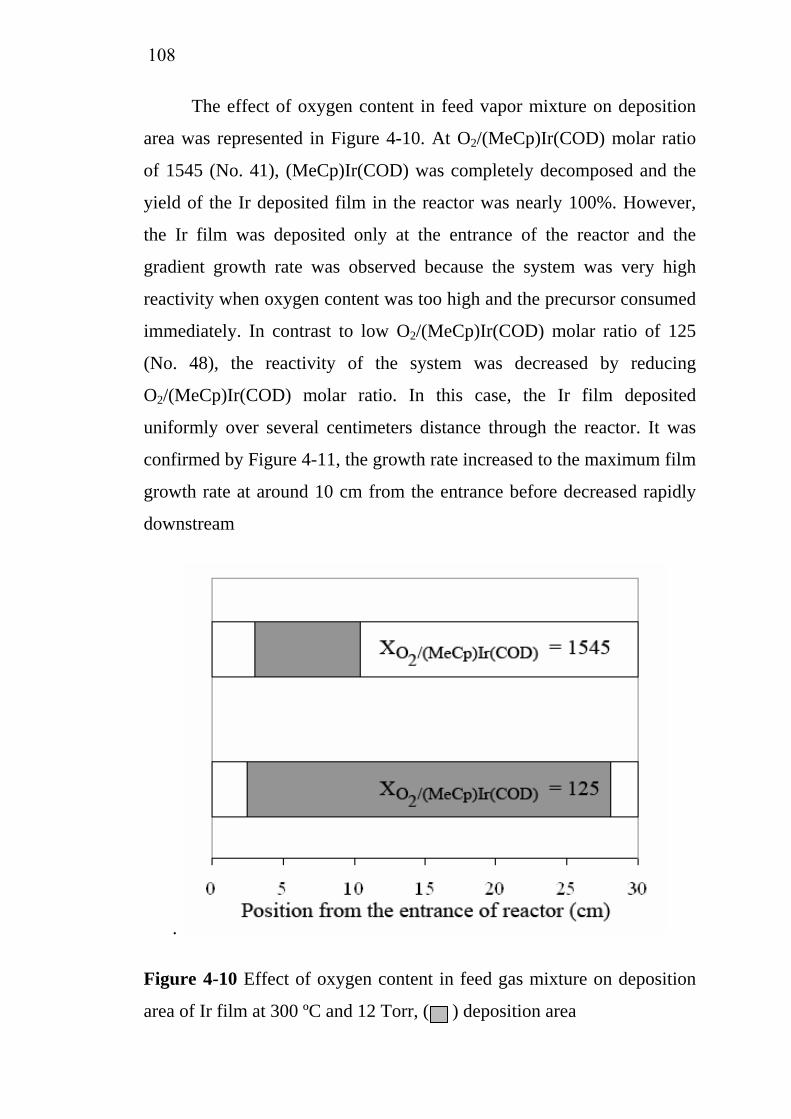
108
The effect of oxygen content in feed vapor mixture on deposition
area was represented in Figure 4-10. At O2/(MeCp)Ir(COD) molar ratio
of 1545 (No. 41), (MeCp)Ir(COD) was completely decomposed and the
yield of the Ir deposited film in the reactor was nearly 100%. However,
the Ir film was deposited only at the entrance of the reactor and the
gradient growth rate was observed because the system was very high
reactivity when oxygen content was too high and the precursor consumed
immediately. In contrast to low O2/(MeCp)Ir(COD) molar ratio of 125
(No. 48), the reactivity of the system was decreased by reducing
O2/(MeCp)Ir(COD) molar ratio. In this case, the Ir film deposited
uniformly over several centimeters distance through the reactor. It was
confirmed by Figure 4-11, the growth rate increased to the maximum film
growth rate at around 10 cm from the entrance before decreased rapidly
downstream
.
Figure 4-10 Effect of oxygen content in feed gas mixture on deposition
area of Ir film at 300 ºC and 12 Torr, ( ) deposition area
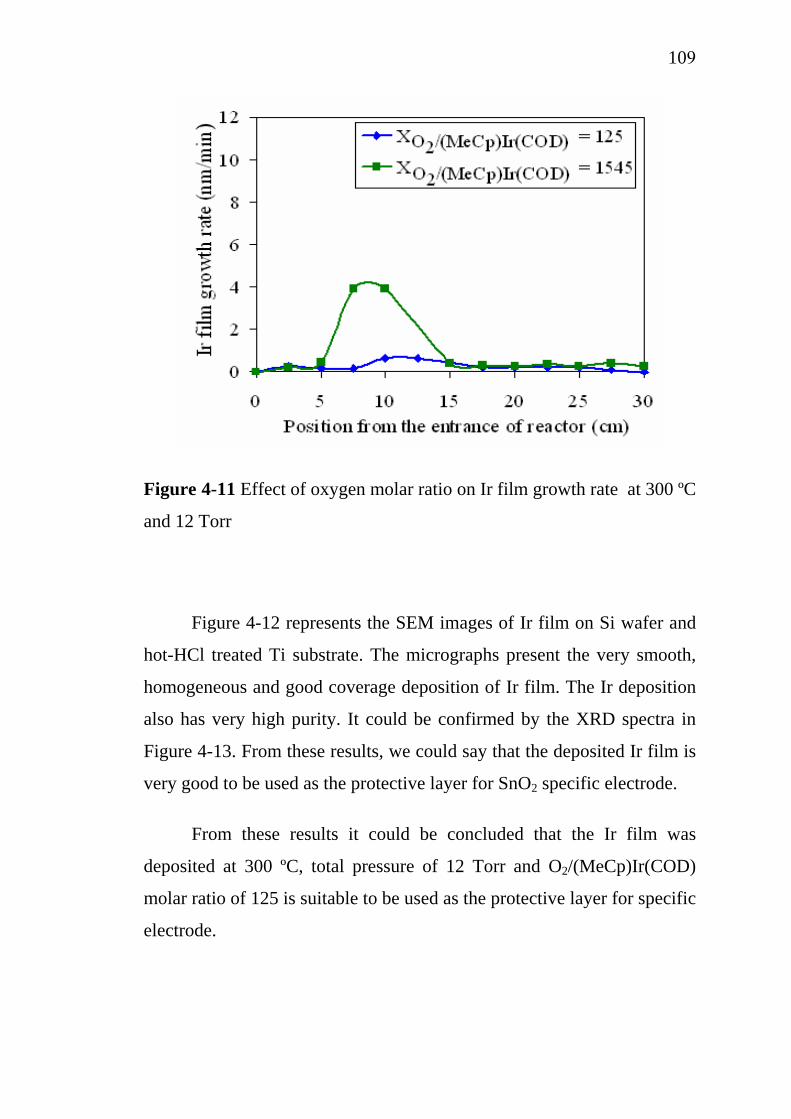
109
Figure 4-11 Effect of oxygen molar ratio on Ir film growth rate at 300 ºC
and 12 Torr
Figure 4-12 represents the SEM images of Ir film on Si wafer and
hot-HCl treated Ti substrate. The micrographs present the very smooth,
homogeneous and good coverage deposition of Ir film. The Ir deposition
also has very high purity. It could be confirmed by the XRD spectra in
Figure 4-13. From these results, we could say that the deposited Ir film is
very good to be used as the protective layer for SnO2 specific electrode.
From these results it could be concluded that the Ir film was
deposited at 300 ºC, total pressure of 12 Torr and O2/(MeCp)Ir(COD)
molar ratio of 125 is suitable to be used as the protective layer for specific
electrode.
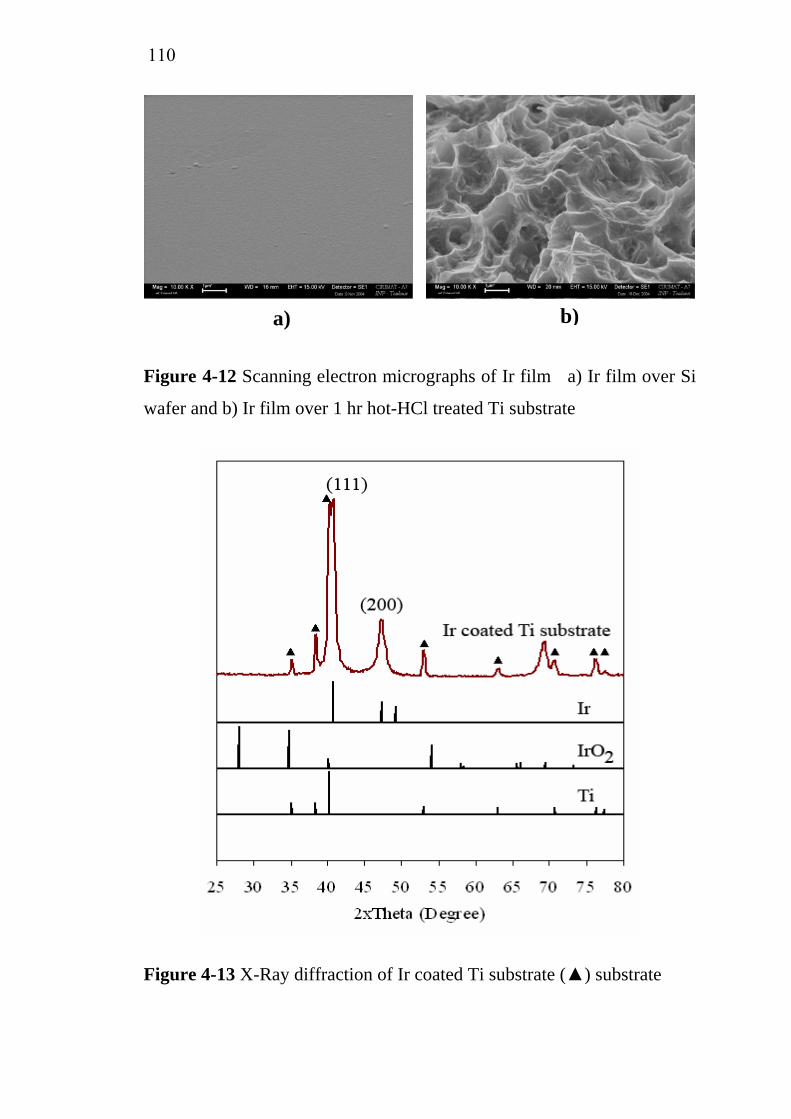
110
crographs of Ir film a) Ir film over Si
t-HCl treated Ti substrate
b)
Figure 4-12 Scanning electron mi
wafer and b) Ir film over 1 hr ho
a)
Figure 4-13 X-Ray diffraction of Ir coated Ti substrate (▲) substrate
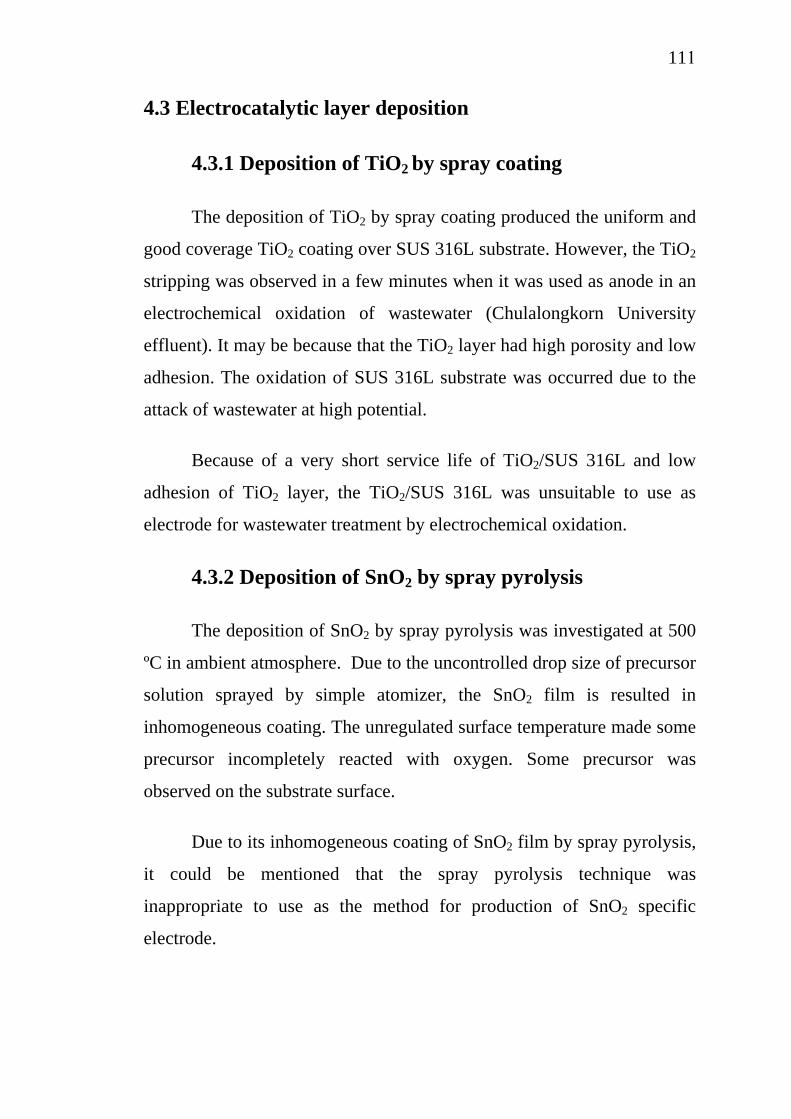
111
4.3 Electrocatalytic layer deposition
4.3.1 Deposition of TiO2 by spray coating
The deposition of TiO2 by spray coating produced the uniform and
good coverage TiO2 coating over SUS 316L substrate. However, the TiO2
stripping was observed in a few minutes when it was used as anode in an
electrochemical oxidation of wastewater (Chulalongkorn University
effluent). It may be because that the TiO2 layer had high porosity and low
adhesion. The oxidation of SUS 316L substrate was occurred due to the
attack of wastewater at high potential.
Because of a very short service life of TiO2/SUS 316L and low
adhesion of TiO2 layer, the TiO2/SUS 316L was unsuitable to use as
electrode for wastewater treatment by electrochemical oxidation.
4.3.2 Deposition of SnO2 by spray pyrolysis
500
trolled drop size of precursor
solution sprayed by simple atomizer, the SnO2 film is resulted in
inhom ture made some
precursor incompletely reacted with oxygen. Some precursor was
observ
The deposition of SnO2 by spray pyrolysis was investigated at
ºC in ambient atmosphere. Due to the uncon
ogeneous coating. The unregulated surface tempera
ed on the substrate surface.
Due to its inhomogeneous coating of SnO2 film by spray pyrolysis,
it could be mentioned that the spray pyrolysis technique was
inappropriate to use as the method for production of SnO2 specific
electrode.
112
4.3.3 Deposition of SnO2 by MOCVD
Figure 4-14 presents the effect of feed vapor composition on the
SnO2 deposition, it was found that the increasing O2/TET molar ratio
from 3 of SnO2 film
ilar in first 10 cm from the entrance of the reactor.
vapor was outstanding. The growth
each point in the reactor was presented in Figure 4-15.
The effect of deposition temperature on the SnO2 deposition was
not investigated in this work due to it was presented elsewhere that the
good d
00 (No. 16) to 1,200 (No. 15), the both growth rates
were quite sim
However, in isothermal zone (after first 10 cm), the O2/TET molar ratio
of 300 represented the higher growth rate of SnO2 film. It may caused by
the first 10 cm, the system temperature was still low and the internal
energy of TET precursor was not enough to react with mixed oxygen.
However, after system reached to the isothermal zone (after first 10 cm),
the effect of TET precursor in feed
rate of SnO2 film was a function of TET concentration in feed gas
composition. Similar result was found in deposition of Ir film by
MOCVD in previous reports [35]. The comparison of SnO2 film
thickness at
eposition temperature was 380 °C [41].
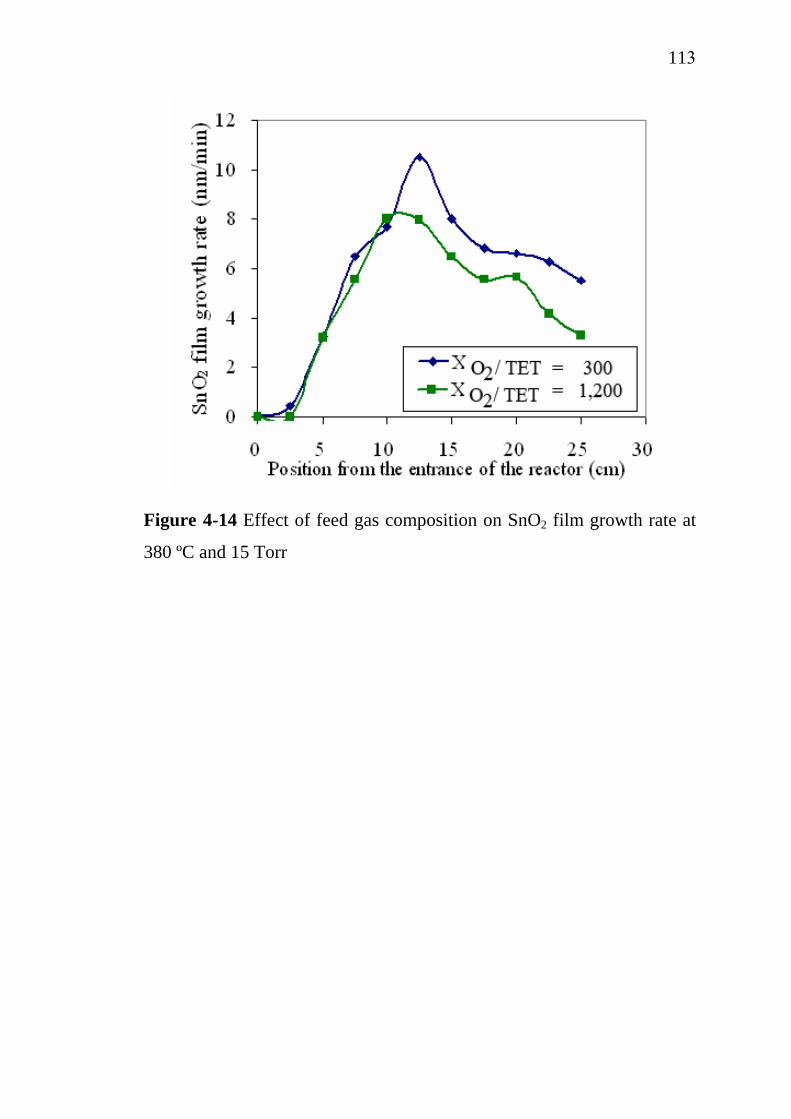
113
Figure 4-14 Effect of feed gas composition on SnO2 film growth rate at
380 ºC and 15 Torr
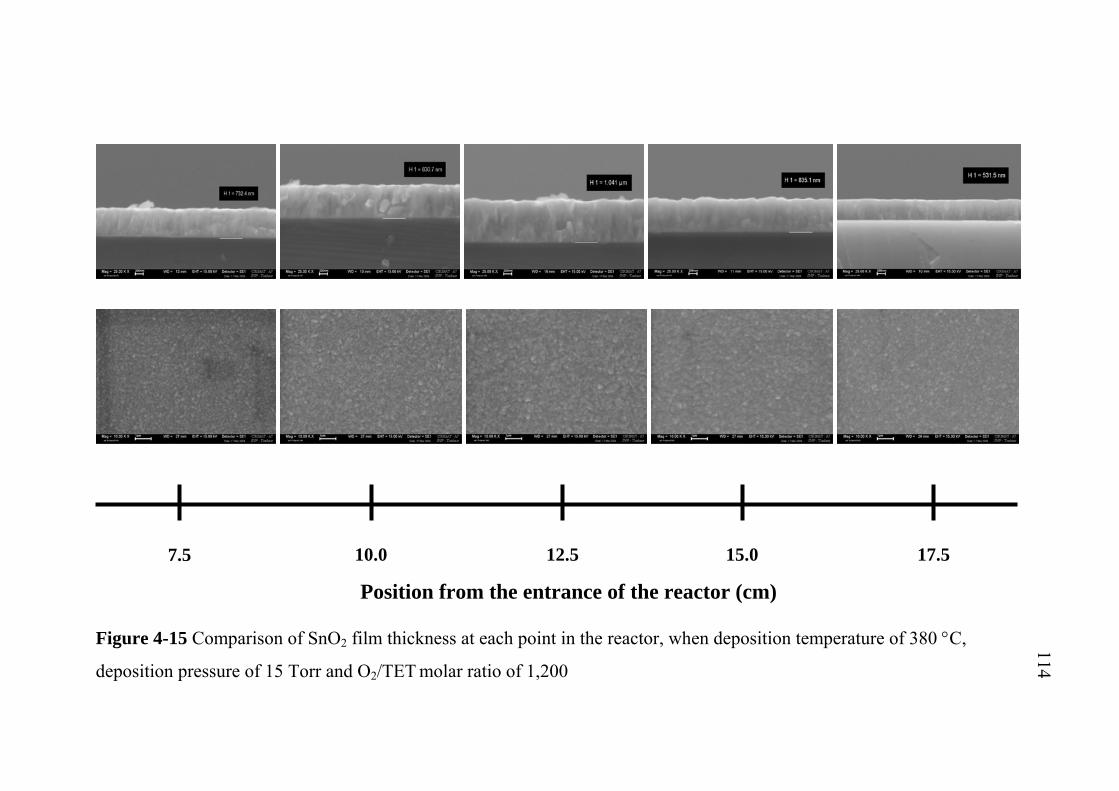
10.0 12.5 15.0 17.5 7.5
Position from the entrance of the reactor (cm)
Figure 4-15 Comparison of SnO2 film thickness at each point in the reactor, when deposition temperature of 380 °C,
deposition pressure of 15 Torr and O2/TET molar ratio of 1,200
114
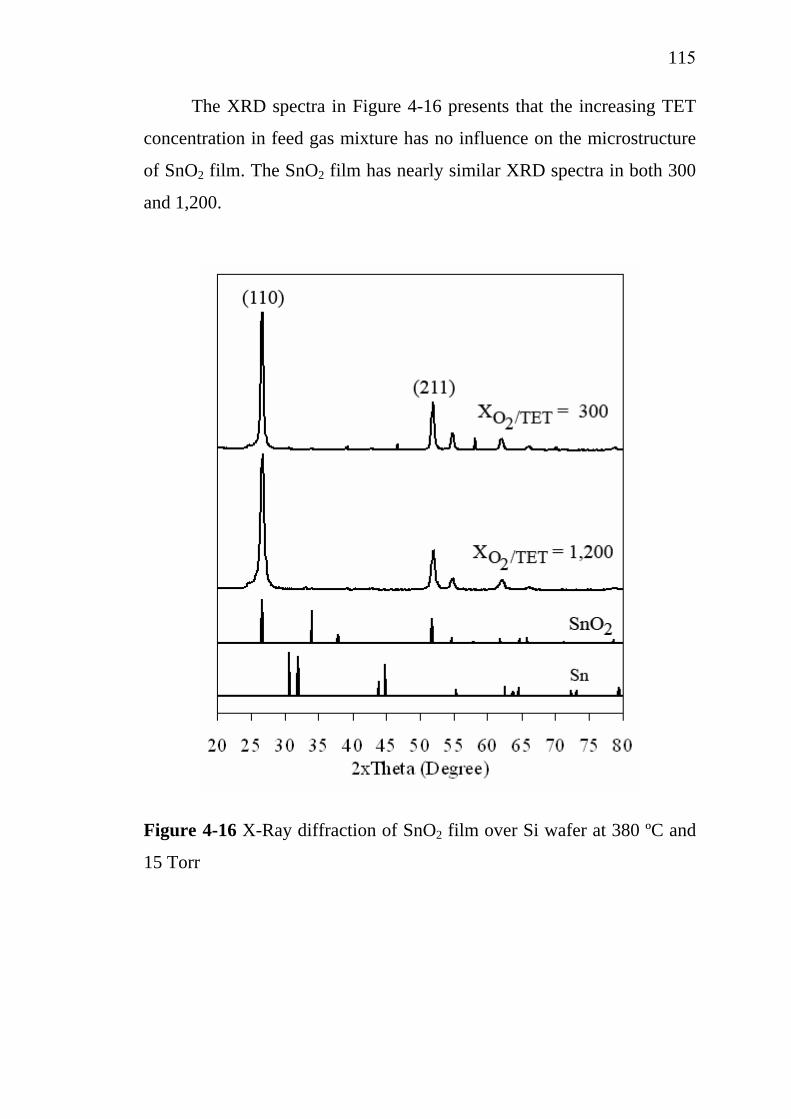
115
The XRD spectra in Figure 4-16 presents that the increasing TET
concentration in feed gas mixture has no influence on the microstructure
of SnO2 film. The SnO2 film has nearly similar XRD spectra in both 300
and 1,200.
Figure 4-16 X-Ray diffraction of SnO2 film over Si wafer at 380 ºC and
15 Torr
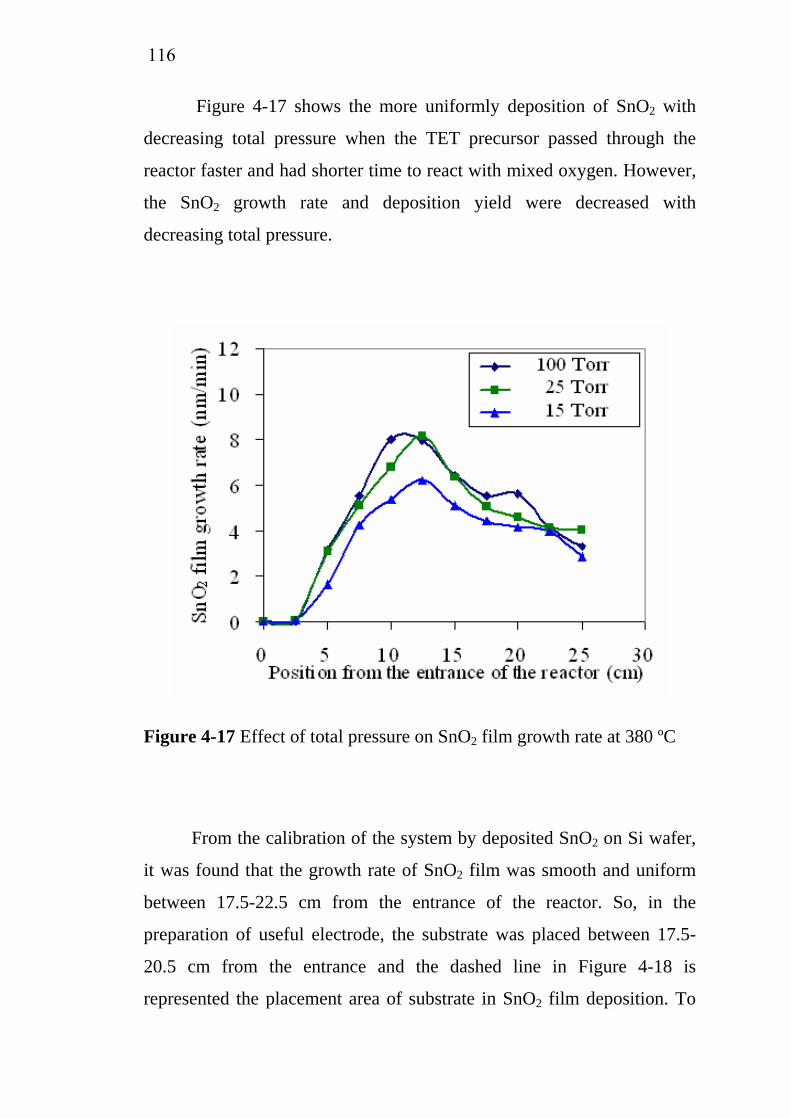
116
Figure 4-17 shows the more uniformly deposition of SnO2 with
decreasing total pressure when the TET precursor passed through the
reactor faster and had shorter time to react with mixed oxygen. However,
the SnO2 growth rate and deposition yield were decreased with
decreasing total pressure.
Figure 4-17 Effect of total pressure on SnO2 film growth rate at 380 ºC
From the calibration of the system by deposited SnO2 on Si wafer,
it was found that the growth rate of SnO2 film was smooth and uniform
between 17.5-22.5 cm from the entrance of the reactor. So, in the
preparation of useful electrode, the substrate was placed between 17.5-
20.5 cm from the entrance and the dashed line in Figure 4-18 is
represented the placement area of substrate in SnO2 film deposition. To
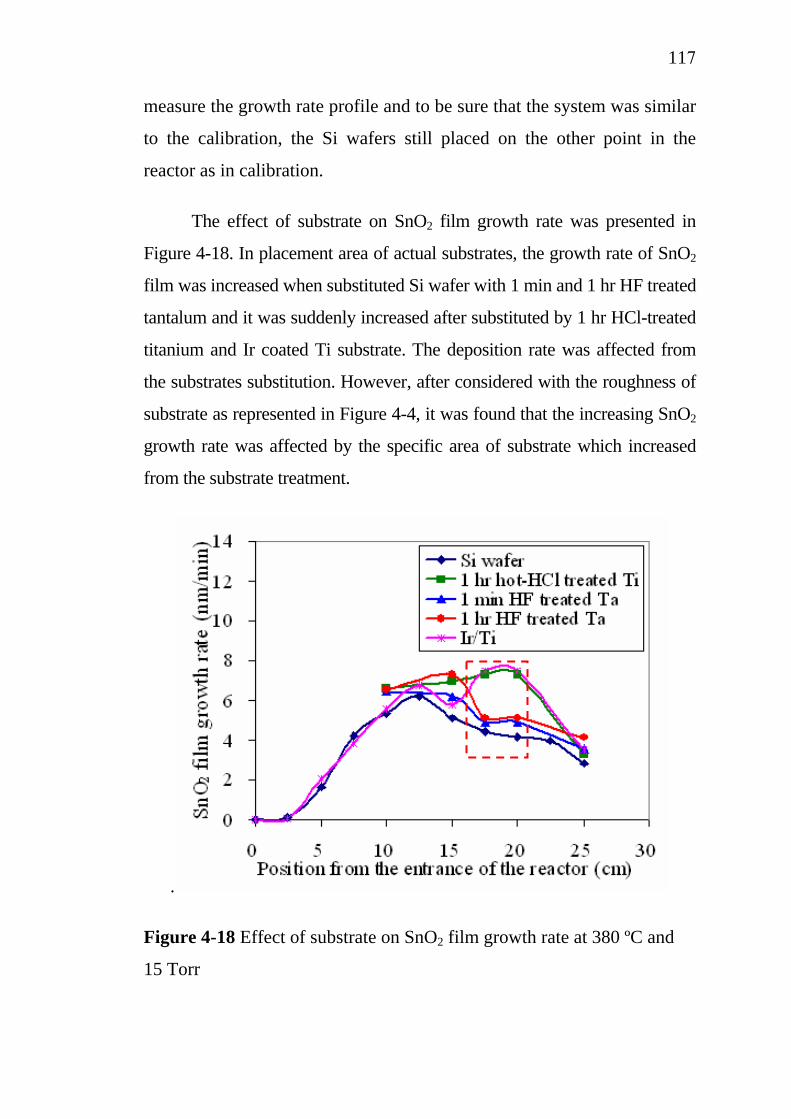
117
measure the growth rate profile and to be sure that the system was similar
to the calibration, the Si wafers still placed on the other point in the
reactor as in calibration.
The effect of substrate on SnO2 film growth rate was presented in
Figure 4-18. In placement area of actual substrates, the growth rate of SnO2
film was increased when substituted Si wafer with 1 min and 1 hr HF treated
tantalum and it was suddenly increased after substituted by 1 hr HCl-treated
titanium and Ir coated Ti substrate. The deposition rate was affected from
the substrates substitution. However, after considered with the roughness of
substrate as represented in Figure 4-4, it was found that the increasing SnO2
growth rate was affected by the specific area of substrate which increased
from the substrate treatment.
.
Figure 4-18 Effect of substrate on SnO2 film growth rate at 380 ºC and
15 Torr
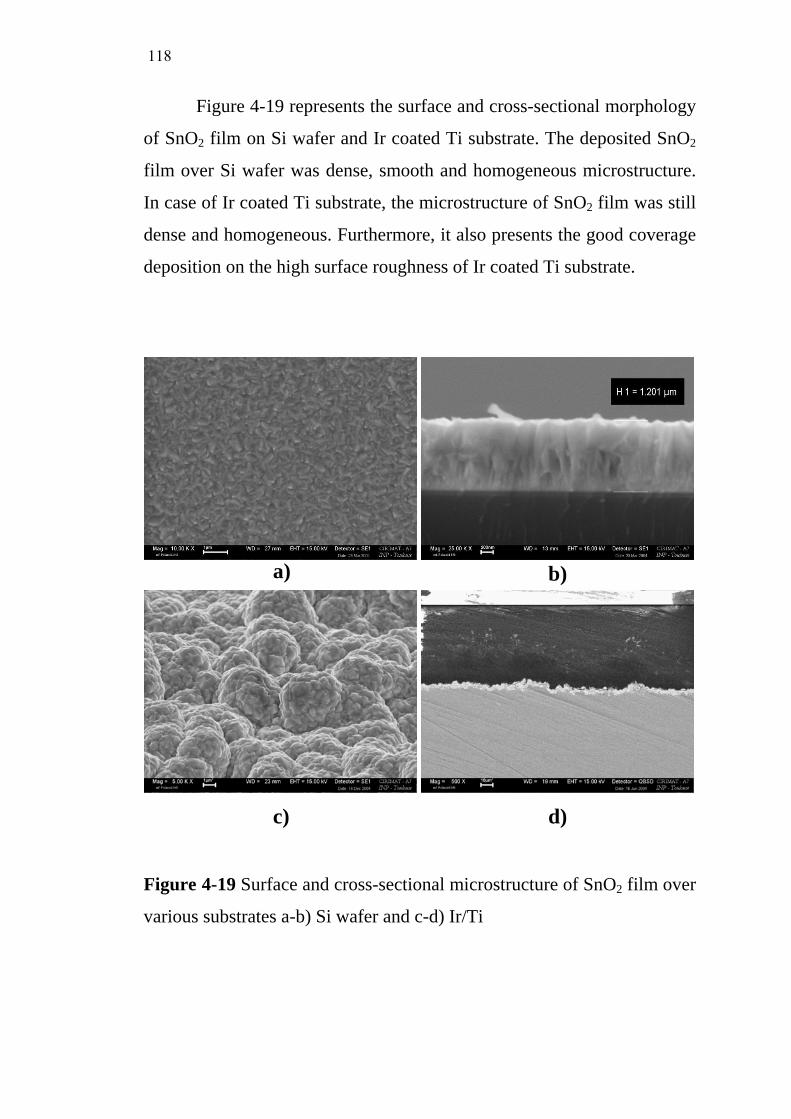
118
Figure 4-19 represents the surface and cross-sectional morphology
of SnO2 film on Si wafer and Ir coated Ti substrate. The deposited SnO2
film over Si wafer was dense, smooth and homogeneous microstructure.
In case of Ir coated Ti substrate, the microstructure of SnO2 film was still
dense and homogeneous. Furthermore, it also presents the good coverage
deposition on the high surface roughness of Ir coated Ti substrate.
a) b)
c) d)
Figure 4-19 Surface and cross-sectional microstructure of SnO2 film over
various substrates a-b) Si wafer and c-d) Ir/Ti
119
From the results, it could be concluded that the suitable SnO2
active coating for using as anode organic pollutant degradation was
deposited at 380 ºC, 15 Torr of total pressure and 1,200 of O2/TET molar
ratio.
4.4 Simulation of Ir deposition using FLUENT®
In this part, the results dealing with velocity and temperature
profile are presented before showing species concentration distributions
and a comparison between experimental data and simulated deposition
rate. For this work, only 3 operating conditions have been checked
corresponding to experiment no. 39, 40 and 41.
4.4.1 Reaction mechanism
As the goal of this part is not to develop a new reaction mechanism
of Ir deposition using (MeCp)Ir(COD) as precursor, the values and
conclusions from Maury et al.[4] were taken for developing the
simulation. In absence of O2, Maury et al. [4] had shown that
(MeCp)Ir(COD) decomposes at temperature higher than 760 K to
produce MeCpH and COD [73-74]. When O2 was used as co-reactive
gas, it oxidized the organic ligands producing CO, CO2 and H2O.
Furthermore, the presence of O2 decreased the decomposition
temperature to 465 K [74]. In addition to the by-products of this reaction,
Maury et al. [4] have analyzed by using a cold trap at the outlet of the
reactor with the presence of acetone and furan. It was concluded that the
mechanism was complicated and in their work dealing with macroscopic
modelling they have only considered the overall reaction as:
120
(MeCp)Ir(COD) + O2 → Ir + X (4-1)
Where X represents of all organic by-products occurring in
decomposition of (MeCp)Ir(COD) with presence of O2.
The deposition rate increased with the partial pressure of both the Ir
source and the oxygen. It was reported that the growth rate was
approximately first-order in O2 partial pressure at 550 K [74].
Consequently, Maury et al. [4] assumed the growth rate of the overall
CVD reaction is:
G = kp[(MeCp)Ir(COD)]p[O2] (4-2)
Where k is the rate constant (k = k0 exp(−Ea/RT)). An activation
energy Ea = 98 kJ/mol and a pre-exponential factor k0 = 5.8×10¹⁴ were
determined. In this case, Ea is approximately 30% higher than the value
reported for a cold-wall reactor [73]. It was assumed that in the hot-wall
CVD reactor there was more significant contribution of gas phase
reactions, which elevated the apparent activation energy. These values
were taken as initialisation values for the first simulation. These values
have been converted to be use in the unit system of FLUENT® and have
also been adjusted to have a better fit between experimental data and
simulation results. The final values that were retained are:
Ea = 140 kJ/mol
k0 = 1×10¹⁸ m4/(kg-s)
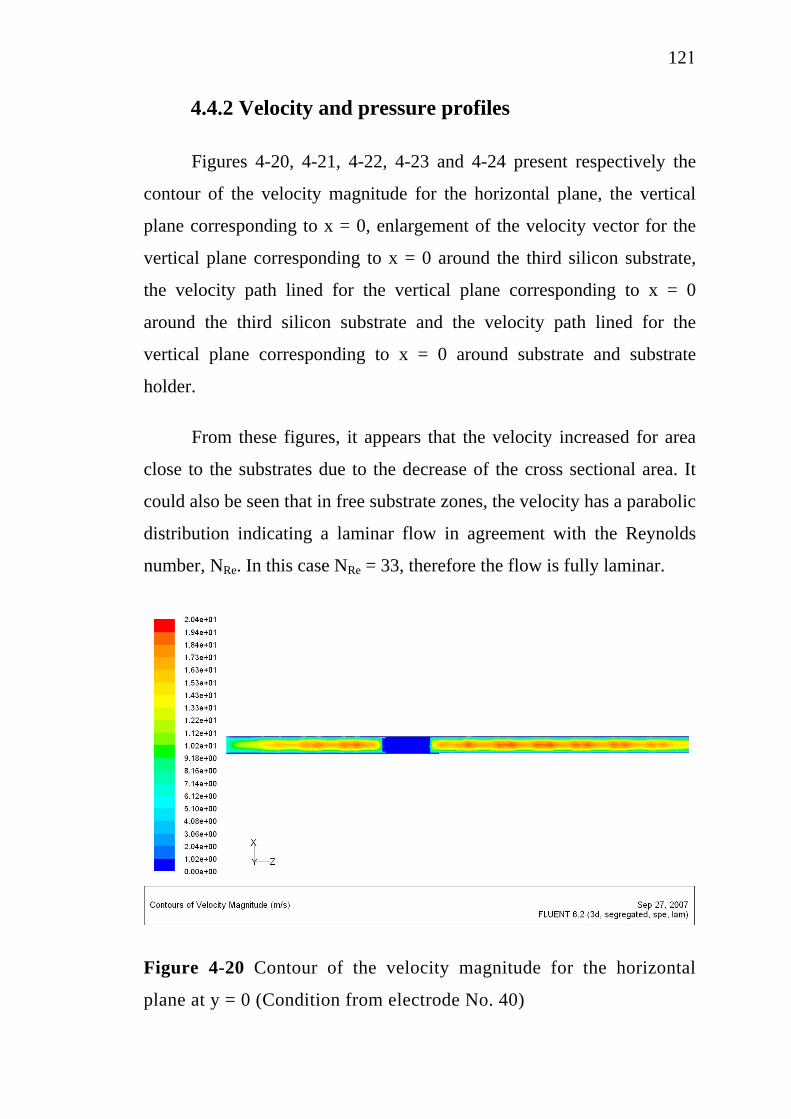
121
4.4.2 Velocity and pressure profiles
Figures 4-20, 4-21, 4-22, 4-23 and 4-24 present respectively the
contour of the velocity magnitude for the horizontal plane, the vertical
plane corresponding to x = 0, enlargement of the velocity vector for the
vertical plane corresponding to x = 0 around the third silicon substrate,
the velocity path lined for the vertical plane corresponding to x = 0
around the third silicon substrate and the velocity path lined for the
vertical plane corresponding to x = 0 around substrate and substrate
holder.
From these figures, it appears that the velocity increased for area
close to the substrates due to the decrease of the cross sectional area. It
could also be seen that in free substrate zones, the velocity has a parabolic
distribution indicating a laminar flow in agreement with the Reynolds
number, NRe. In this case NRe = 33, therefore the flow is fully laminar.
Figure 4-20 Contour of the velocity magnitude for the horizontal
plane at y = 0 (Condition from electrode No. 40)
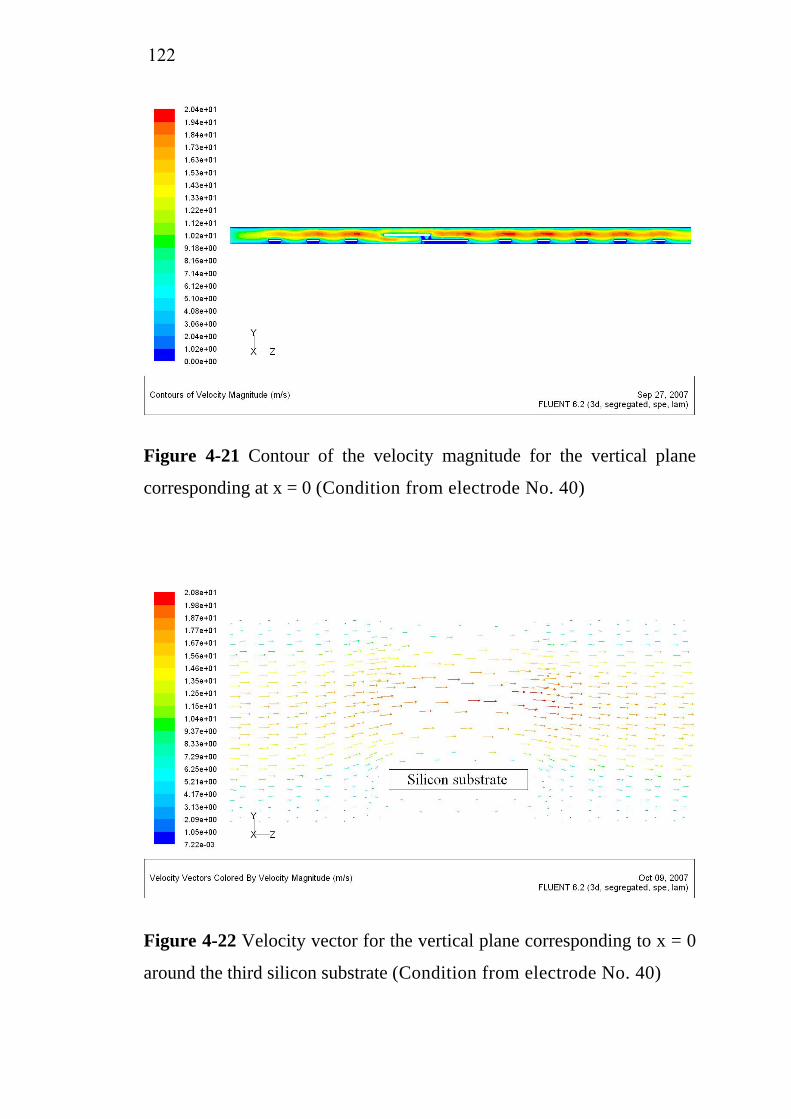
122
Figure 4-21 Contour of the velocity magnitude for the vertical plane
corresponding at x = 0 (Condition from electrode No. 40)
Figure 4-22 Velocity vector for the vertical plane corresponding to x = 0
around the third silicon substrate (Condition from electrode No. 40)
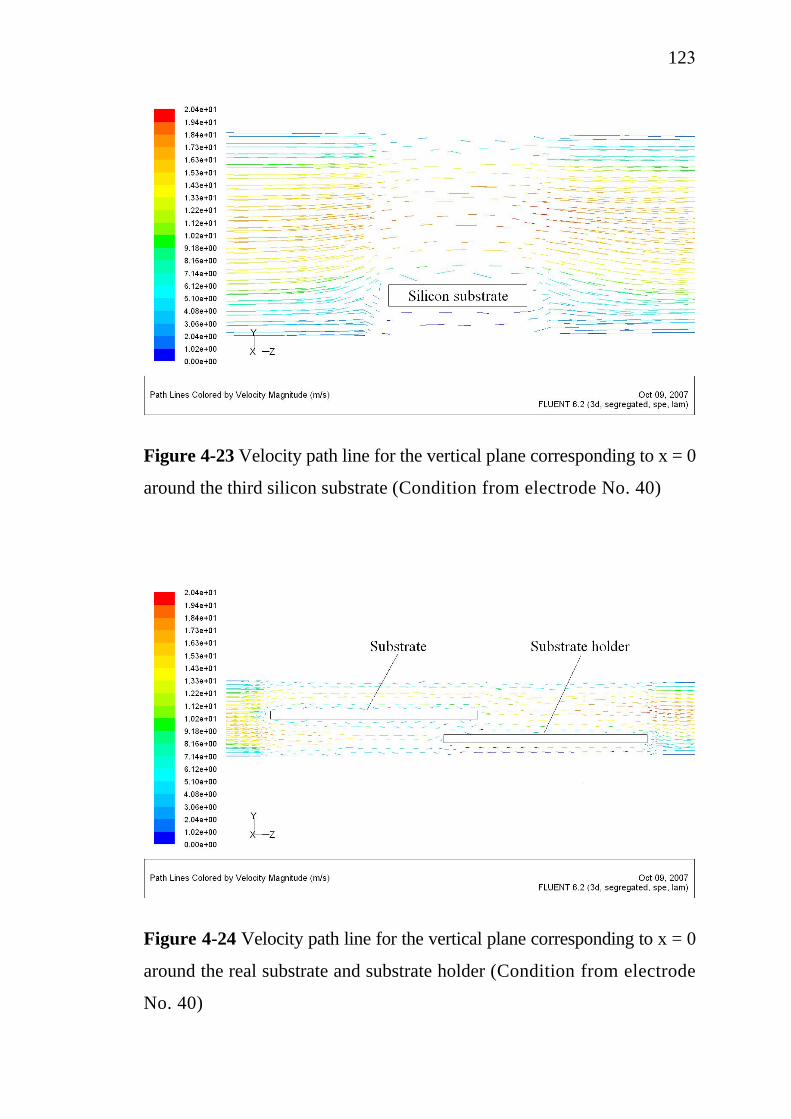
123
Figure 4-23 Velocity path line for the vertical plane corresponding to x = 0
around the third silicon substrate (Condition from electrode No. 40)
Figure 4-24 Velocity path line for the vertical plane corresponding to x = 0
around the real substrate and substrate holder (Condition from electrode
No. 40)
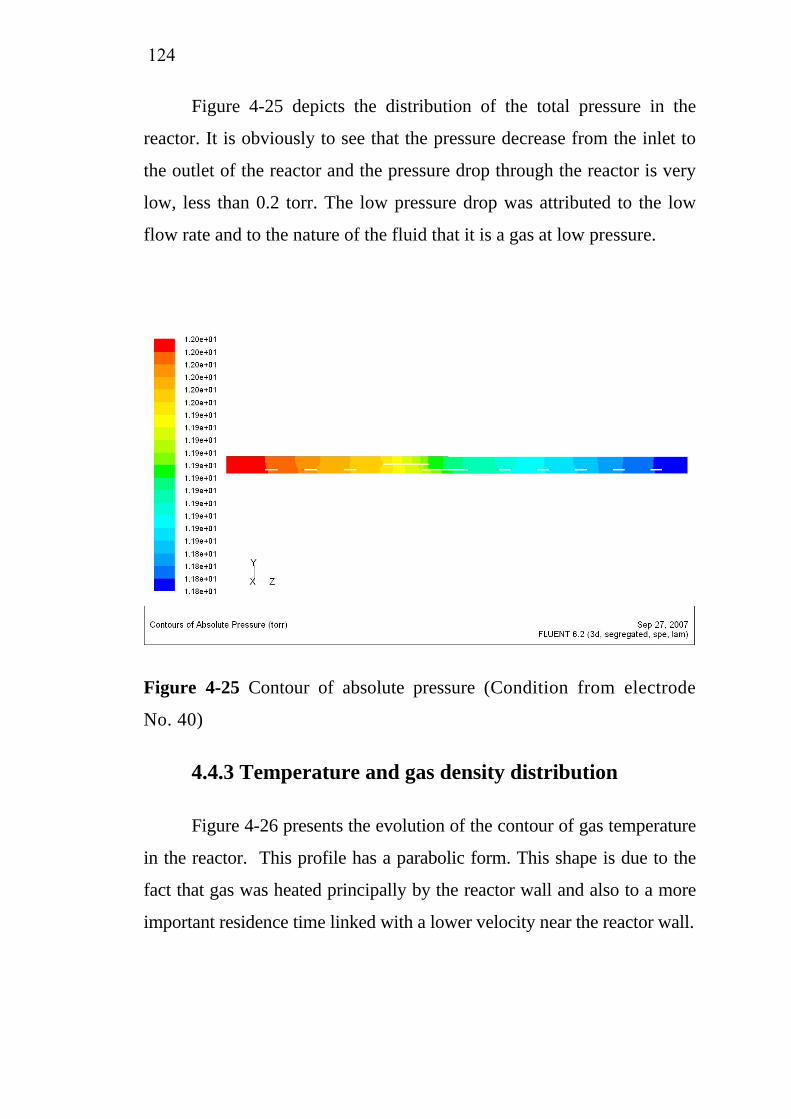
124
Figure 4-25 depicts the distribution of the total pressure in the
reactor. It is obviously to see that the pressure decrease from the inlet to
the outlet of the reactor and the pressure drop through the reactor is very
low, less than 0.2 torr. The low pressure drop was attributed to the low
flow rate and to the nature of the fluid that it is a gas at low pressure.
Figure 4-25 Contour of absolute pressure (Condition from electrode
No. 40)
4.4.3 Temperature and gas density distribution
Figure 4-26 presents the evolution of the contour of gas temperature
in the reactor. This profile has a parabolic form. This shape is due to the
fact that gas was heated principally by the reactor wall and also to a more
important residence time linked with a lower velocity near the reactor wall.
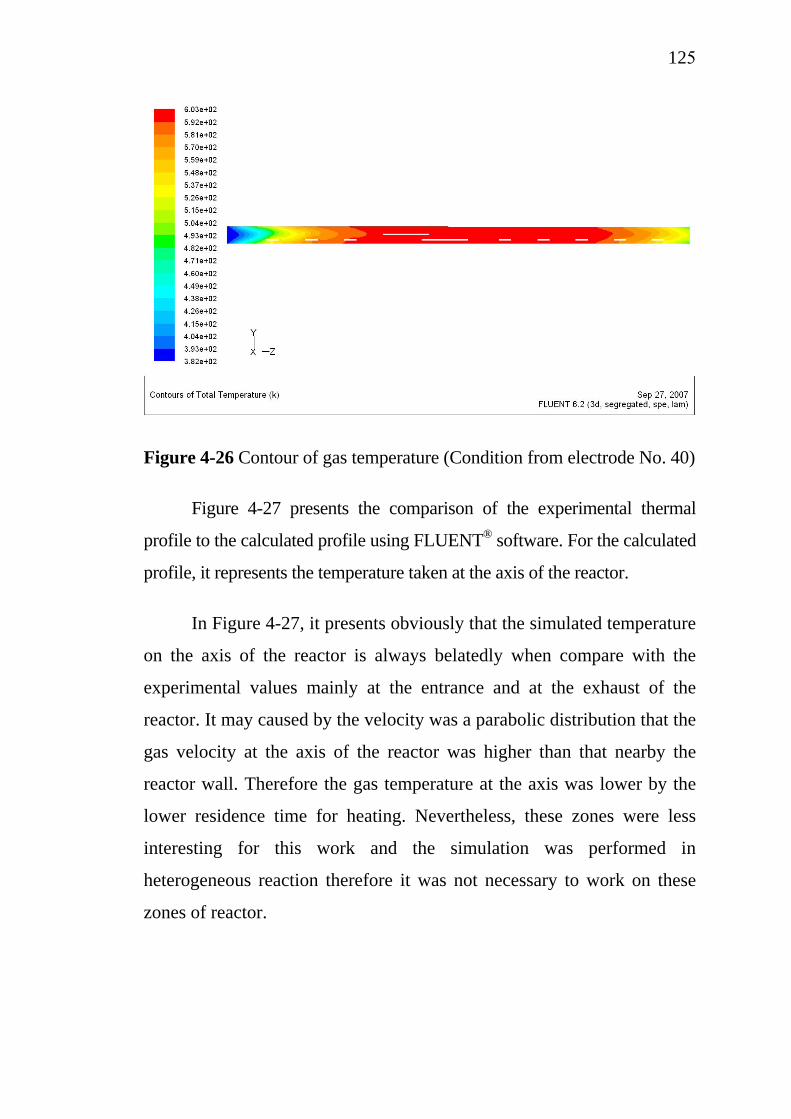
125
Figure 4-26 Contour of gas temperature (Condition from electrode No. 40)
Figure 4-27 presents the comparison of the experimental thermal
profile to the calculated profile using FLUENT® software. For the calculated
profile, it represents the temperature taken at the axis of the reactor.
In Figure 4-27, it presents obviously that the simulated temperature
on the axis of the reactor is always belatedly when compare with the
experimental values mainly at the entrance and at the exhaust of the
reactor. It may caused by the velocity was a parabolic distribution that the
gas velocity at the axis of the reactor was higher than that nearby the
reactor wall. Therefore the gas temperature at the axis was lower by the
lower residence time for heating. Nevertheless, these zones were less
interesting for this work and the simulation was performed in
heterogeneous reaction therefore it was not necessary to work on these
zones of reactor.
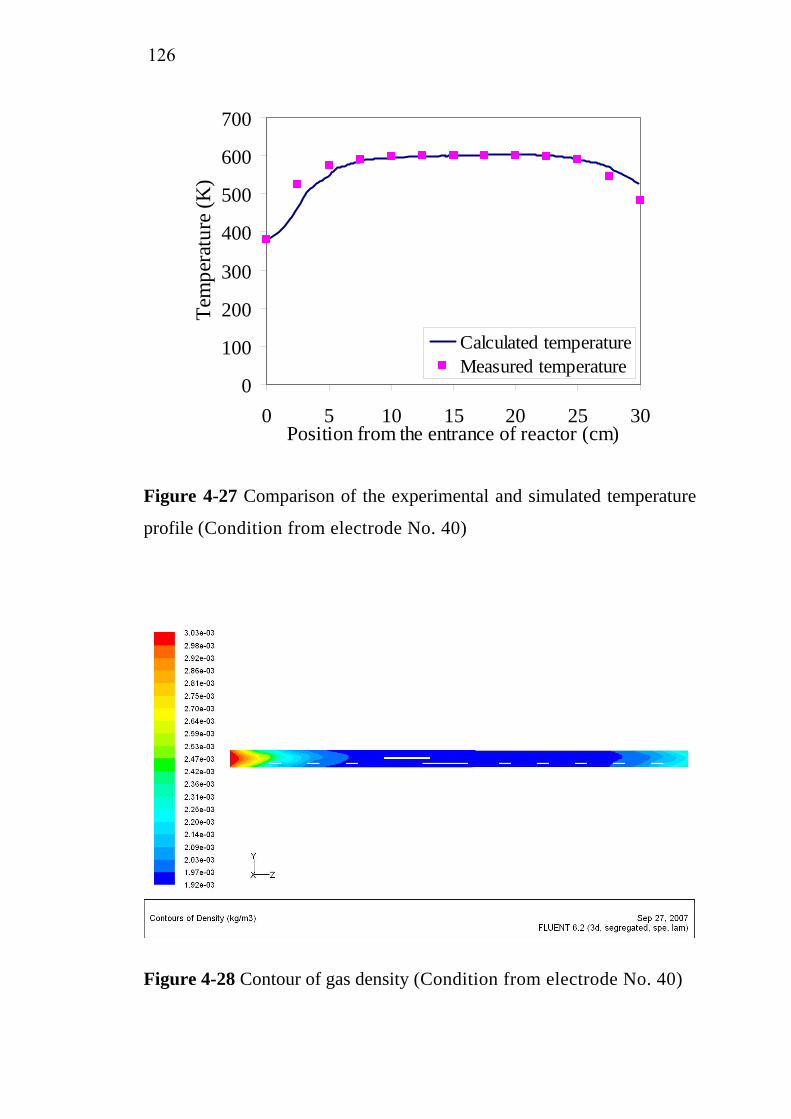
126
0
100
200
300
400
500
600
700
0 5 10 15 20 25 30Position from the entrance of reactor (cm)
Tem
pera
ture
(K)
Calculated temperatureMeasured temperature
Figure 4-27 Comparison of the experimental and simulated temperature
profile (Condition from electrode No. 40)
Figure 4-28 Contour of gas density (Condition from electrode No. 40)
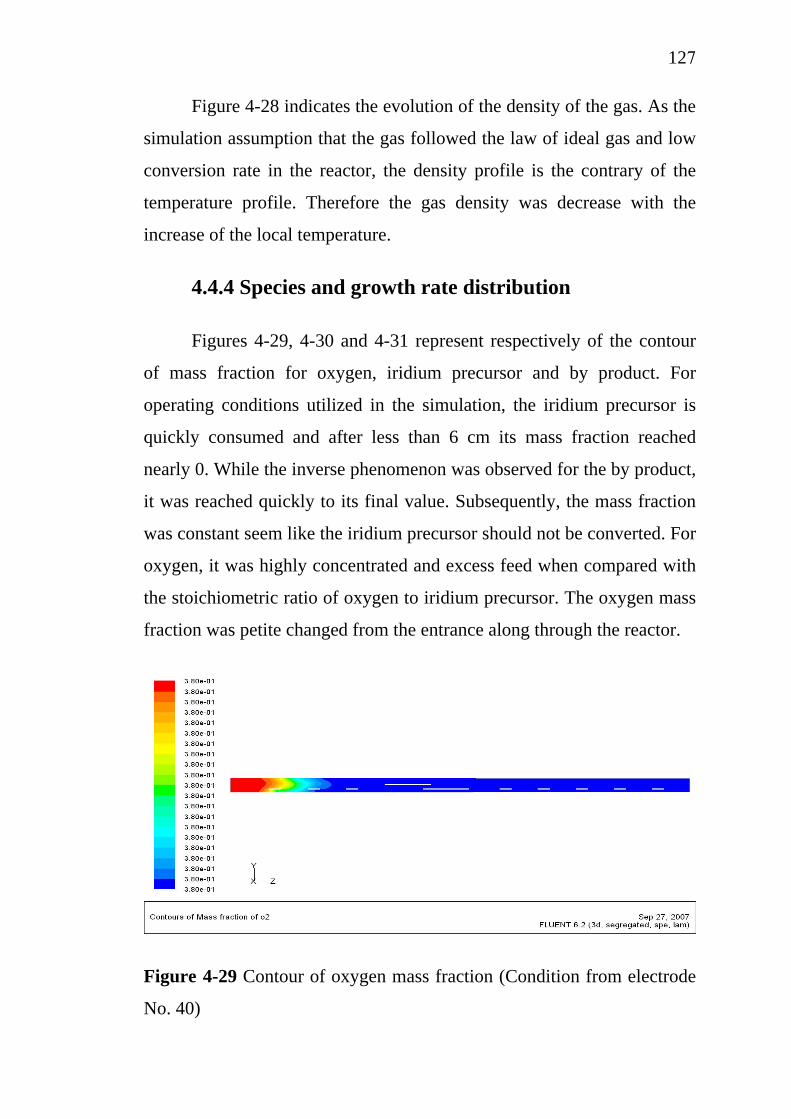
127
Figure 4-28 indicates the evolution of the density of the gas. As the
simulation assumption that the gas followed the law of ideal gas and low
conversion rate in the reactor, the density profile is the contrary of the
temperature profile. Therefore the gas density was decrease with the
increase of the local temperature.
4.4.4 Species and growth rate distribution
Figures 4-29, 4-30 and 4-31 represent respectively of the contour
of mass fraction for oxygen, iridium precursor and by product. For
operating conditions utilized in the simulation, the iridium precursor is
quickly consumed and after less than 6 cm its mass fraction reached
nearly 0. While the inverse phenomenon was observed for the by product,
it was reached quickly to its final value. Subsequently, the mass fraction
was constant seem like the iridium precursor should not be converted. For
oxygen, it was highly concentrated and excess feed when compared with
the stoichiometric ratio of oxygen to iridium precursor. The oxygen mass
fraction was petite changed from the entrance along through the reactor.
Figure 4-29 Contour of oxygen mass fraction (Condition from electrode
No. 40)
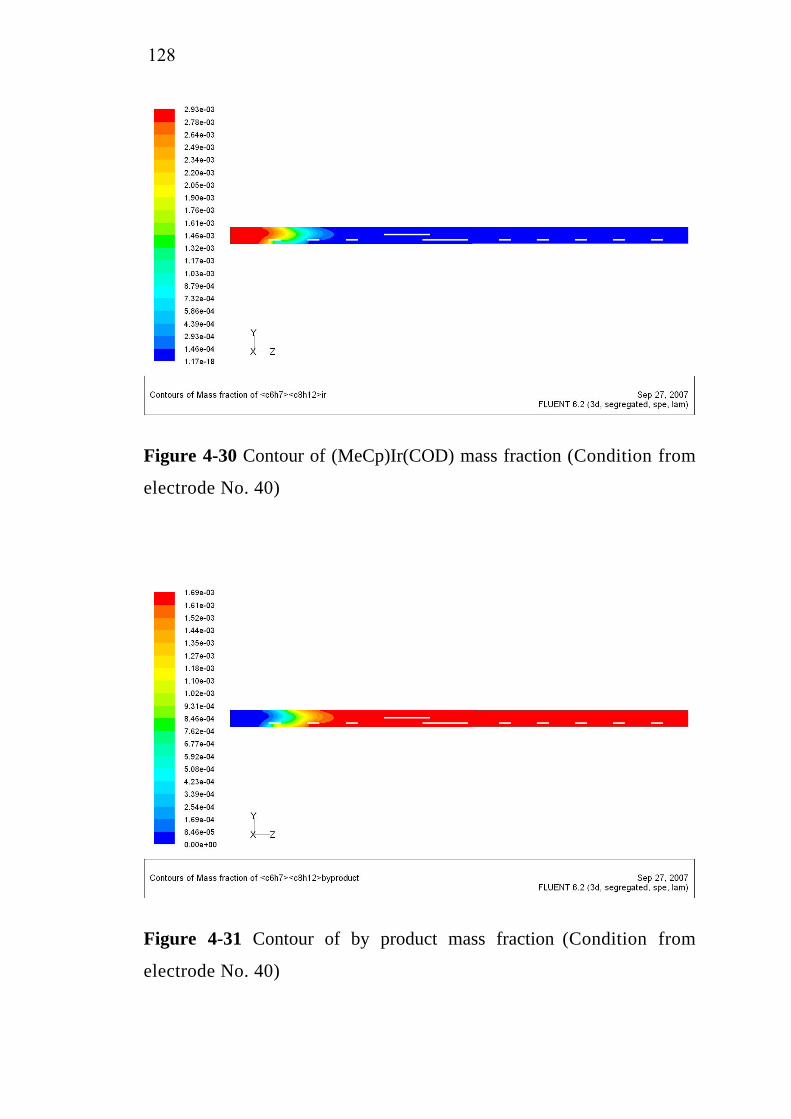
128
Figure 4-30 Contour of (MeCp)Ir(COD) mass fraction (Condition from
electrode No. 40)
Figure 4-31 Contour of by product mass fraction (Condition from
electrode No. 40)
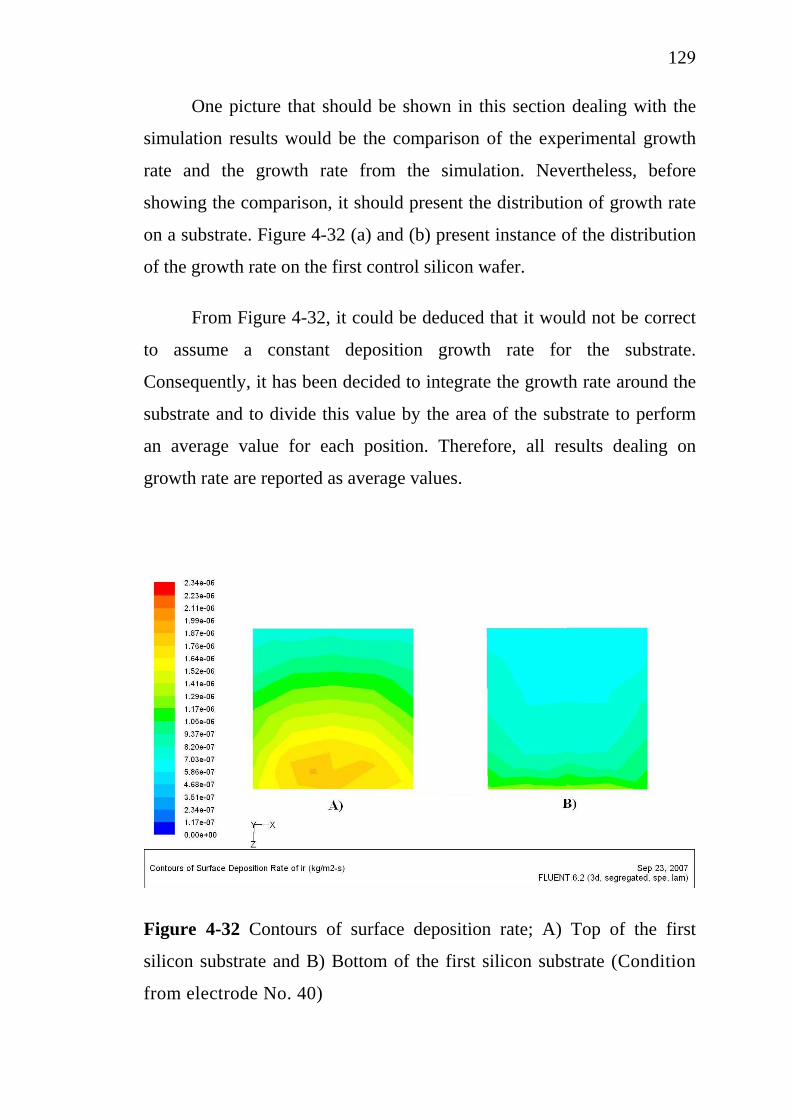
129
One picture that should be shown in this section dealing with the
simulation results would be the comparison of the experimental growth
rate and the growth rate from the simulation. Nevertheless, before
showing the comparison, it should present the distribution of growth rate
on a substrate. Figure 4-32 (a) and (b) present instance of the distribution
of the growth rate on the first control silicon wafer.
From Figure 4-32, it could be deduced that it would not be correct
to assume a constant deposition growth rate for the substrate.
Consequently, it has been decided to integrate the growth rate around the
substrate and to divide this value by the area of the substrate to perform
an average value for each position. Therefore, all results dealing on
growth rate are reported as average values.
Figure 4-32 Contours of surface deposition rate; A) Top of the first
silicon substrate and B) Bottom of the first silicon substrate (Condition
from electrode No. 40)
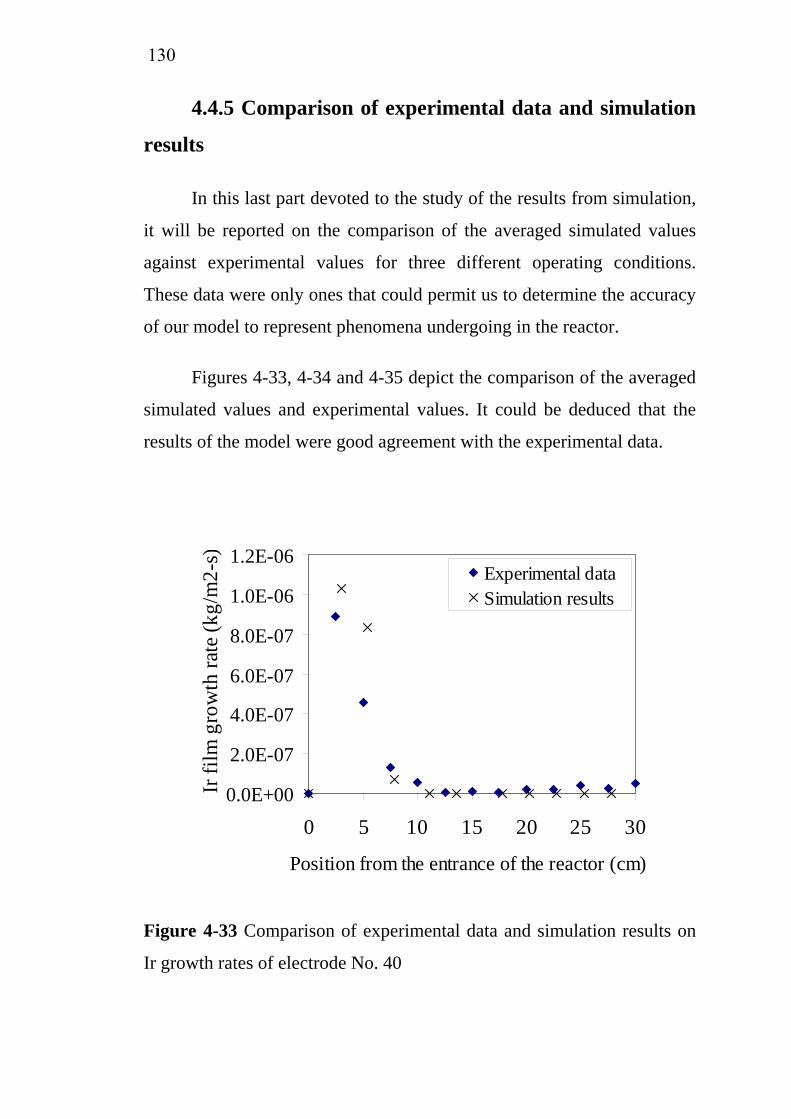
130
4.4.5 Comparison of experimental data and simulation
results
In this last part devoted to the study of the results from simulation,
it will be reported on the comparison of the averaged simulated values
against experimental values for three different operating conditions.
These data were only ones that could permit us to determine the accuracy
of our model to represent phenomena undergoing in the reactor.
Figures 4-33, 4-34 and 4-35 depict the comparison of the averaged
simulated values and experimental values. It could be deduced that the
results of the model were good agreement with the experimental data.
0.0E+00
2.0E-07
4.0E-07
6.0E-07
8.0E-07
1.0E-06
1.2E-06
0 5 10 15 20 25 30
Position from the entrance of the reactor (cm)
Ir fi
lm g
row
th ra
te (k
g/m
2-s)
Experimental dataSimulation results
Figure 4-33 Comparison of experimental data and simulation results on
Ir growth rates of electrode No. 40
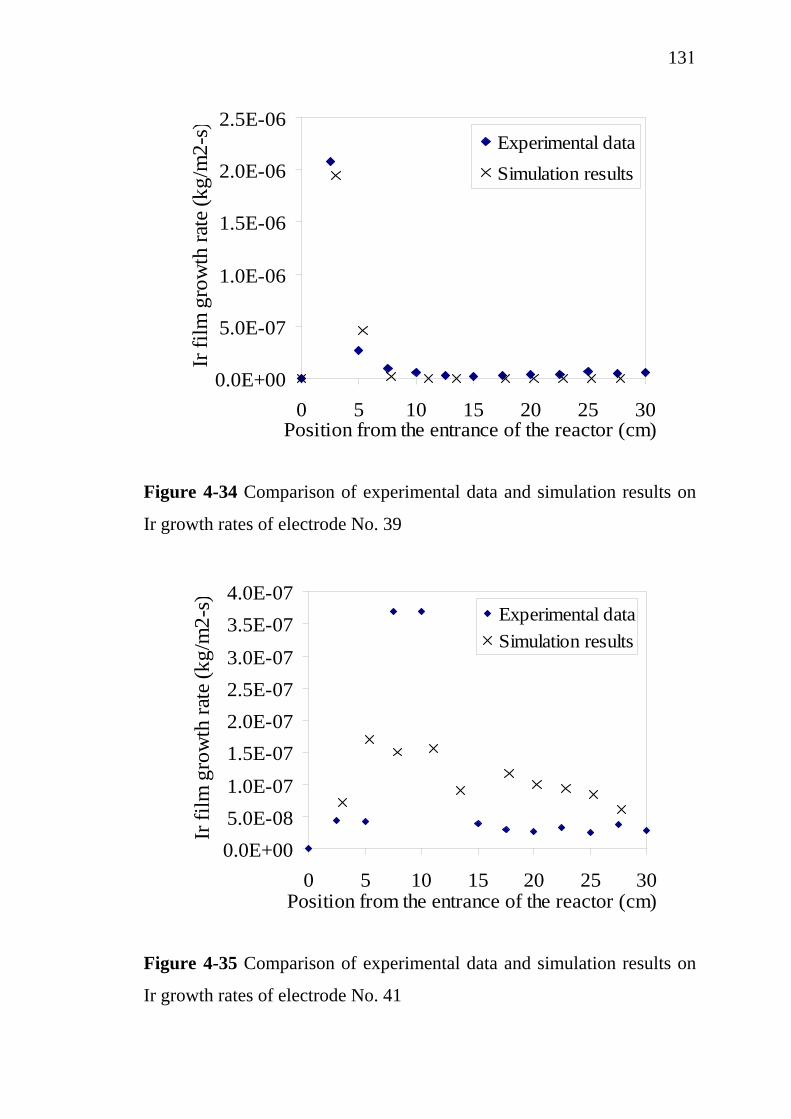
131
0.0E+00
5.0E-07
1.0E-06
1.5E-06
2.0E-06
2.5E-06
0 5 10 15 20 25 30Position from the entrance of the reactor (cm)
Ir fi
lm g
row
th ra
te (k
g/m
2-s) Experimental data
Simulation results
Figure 4-34 Comparison of experimental data and simulation results on
Ir growth rates of electrode No. 39
0.0E+005.0E-081.0E-07
1.5E-072.0E-072.5E-073.0E-07
3.5E-074.0E-07
0 5 10 15 20 25 30Position from the entrance of the reactor (cm)
Ir fi
lm g
row
th ra
te (k
g/m
2-s) Experimental data
Simulation results
Figure 4-35 Comparison of experimental data and simulation results on
Ir growth rates of electrode No. 41
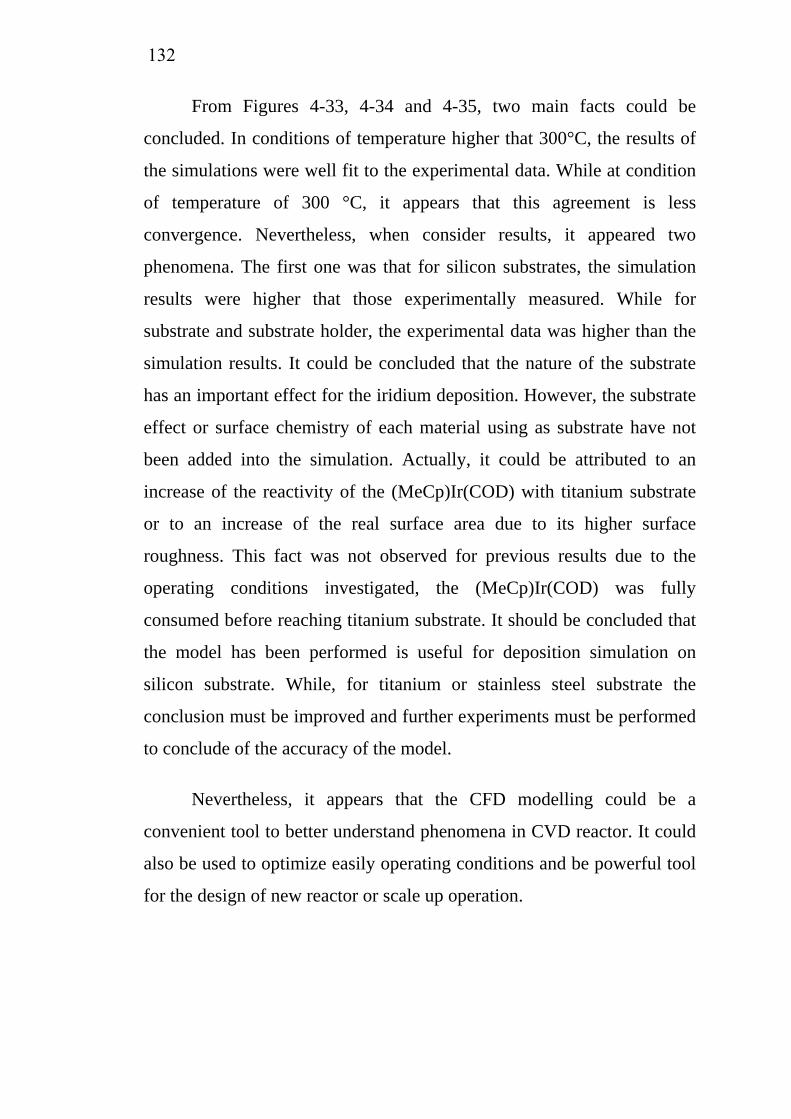
132
From Figures 4-33, 4-34 and 4-35, two main facts could be
concluded. In conditions of temperature higher that 300°C, the results of
the simulations were well fit to the experimental data. While at condition
of temperature of 300 °C, it appears that this agreement is less
convergence. Nevertheless, when consider results, it appeared two
phenomena. The first one was that for silicon substrates, the simulation
results were higher that those experimentally measured. While for
substrate and substrate holder, the experimental data was higher than the
simulation results. It could be concluded that the nature of the substrate
has an important effect for the iridium deposition. However, the substrate
effect or surface chemistry of each material using as substrate have not
been added into the simulation. Actually, it could be attributed to an
increase of the reactivity of the (MeCp)Ir(COD) with titanium substrate
or to an increase of the real surface area due to its higher surface
roughness. This fact was not observed for previous results due to the
operating conditions investigated, the (MeCp)Ir(COD) was fully
consumed before reaching titanium substrate. It should be concluded that
the model has been performed is useful for deposition simulation on
silicon substrate. While, for titanium or stainless steel substrate the
conclusion must be improved and further experiments must be performed
to conclude of the accuracy of the model.
Nevertheless, it appears that the CFD modelling could be a
convenient tool to better understand phenomena in CVD reactor. It could
also be used to optimize easily operating conditions and be powerful tool
for the design of new reactor or scale up operation.
133
4.5 Conclusions
The O2/Ir(acac)3 molar ratio was affected on the micro structure of
IrO2. The microstructure changed from dense film to columnar orientated
film when the O2/Ir(acac)3 molar ratio increased from 11,000 to 17,000.
While the deposition temperature and O2/(MeCp)Ir(COD) molar ratio
strongly affected on the deposition of Ir film. At high deposition
temperature and high O2/(MeCp)Ir(COD) molar ratio, (MeCp)Ir(COD)
was consumed immediately. The Ir film growed more homogeneously at
300 °C and O2/(MeCp)Ir(COD) of 125. While the SnO2 film was grown
uniformly at 380 °C, 15 Torr and O2/TET of 1,200. In addition, the
FLUENT® simulation results were agreed with the experimental data for
Ir coating simulation.

Chapter 5
Electrochemical Oxidation
This chapter will be focused on the activation process needed
before using the new electrodes. The results of electrochemical oxidation
and discussion about the effect of the operating conditions on the
performance of this process are presented. Finally, the cost analysis for
restaurant wastewater treatment is presented.
5.1 Activation of new electrodes
In theoretical assumption, the stoichiometric ratio between tin and
oxygen is 1:2 in SnO2. However, the non-stoichiometry of SnO2 is
presented in as prepared SnO2 film. This initial involves a larger
concentration of catalytically actives sites. The reaction takes place with
the formation of adsorbed hydroxyl radicals (•OH) as presented in
equation (5-1).
−+•−− ++→+ eHOHSnOOHSnO XX )()2(2)2( (5-1)
A further oxidation may take place with an increase in oxygen
stoichiometry. However, at this stage the oxygen stoichiometry is still
below 2, as presented in equation (5-2)
−++−
•− ++→ yeyHSnOOHSnO YXYX )2()2( )( (5-2)
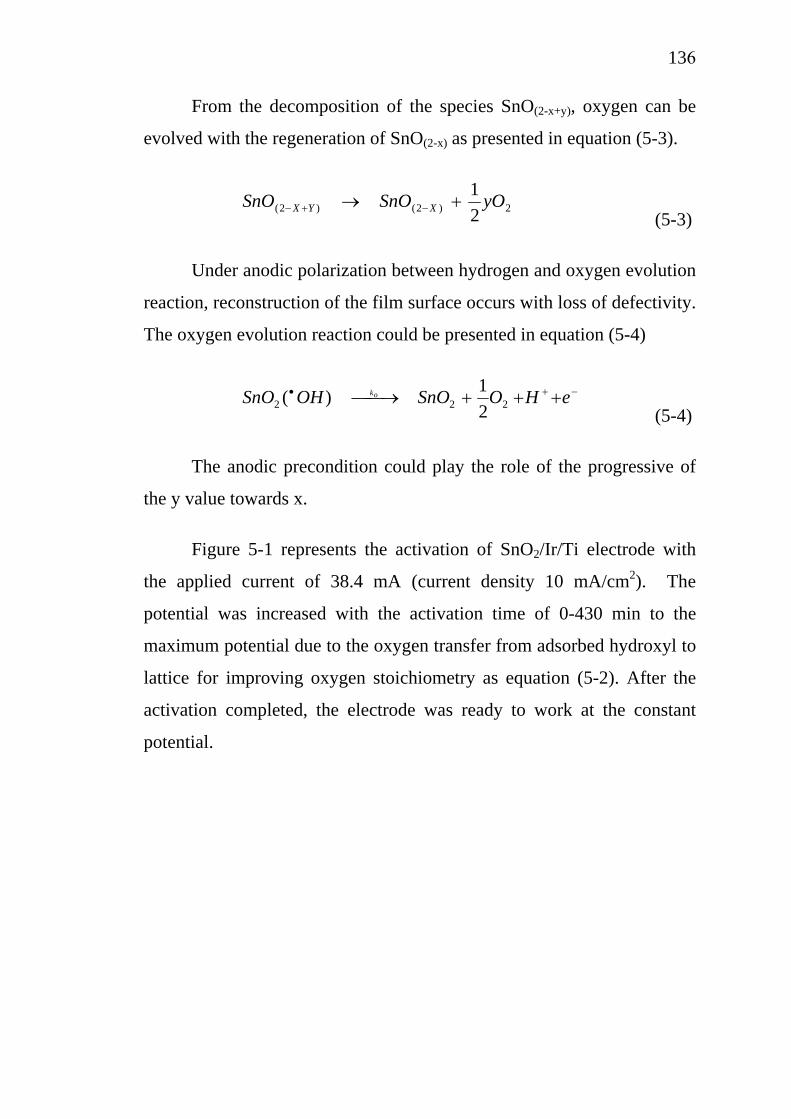
136
From the decomposition of the species SnO(2-x+y), oxygen can be
evolved with the regeneration of SnO(2-x) as presented in equation (5-3).
2)2()2( 21 yOSnOSnO XYX +→ −+−
(5-3)
Under anodic polarization between hydrogen and oxygen evolution
reaction, reconstruction of the film surface occurs with loss of defectivity.
The oxygen evolution reaction could be presented in equation (5-4)
−+• +++⎯→⎯ eHOSnOOHSnO ok222 2
1)( (5-4)
The anodic precondition could play the role of the progressive of
the y value towards x.
Figure 5-1 represents the activation of SnO2/Ir/Ti electrode with
the applied current of 38.4 mA (current density 10 mA/cm2). The
potential was increased with the activation time of 0-430 min to the
maximum potential due to the oxygen transfer from adsorbed hydroxyl to
lattice for improving oxygen stoichiometry as equation (5-2). After the
activation completed, the electrode was ready to work at the constant
potential.
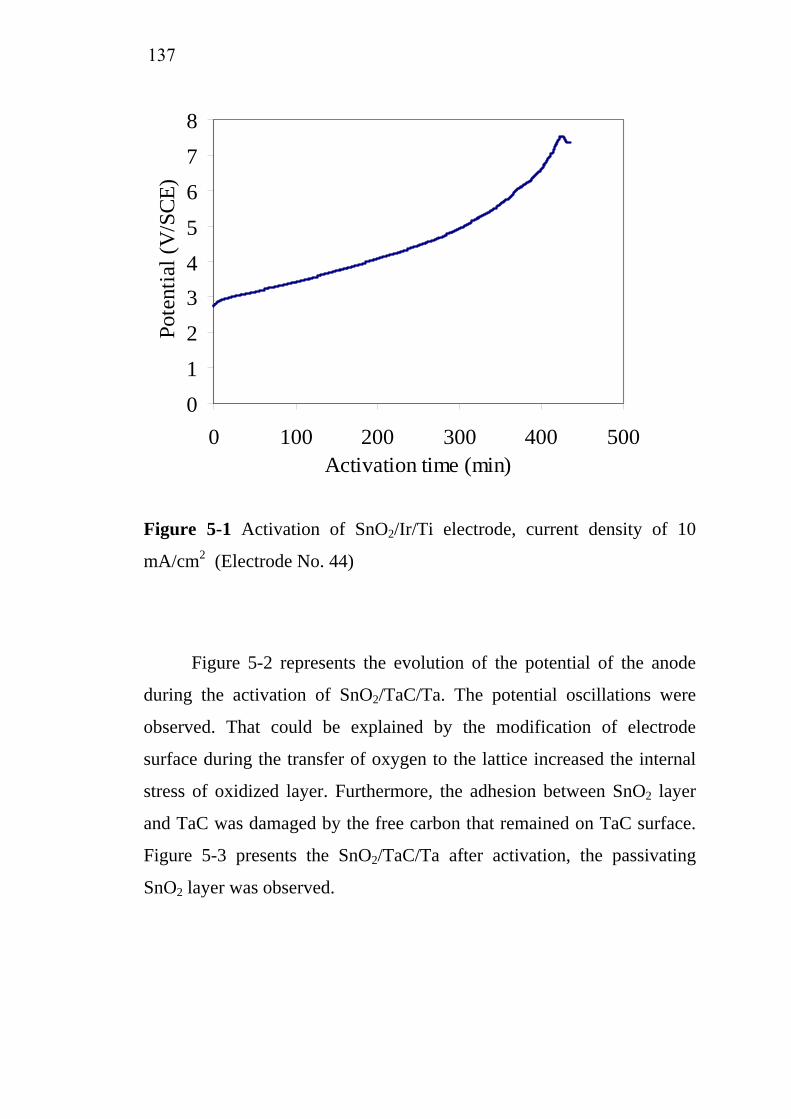
137
0
1
2
34
5
6
7
8
0 100 200 300 400 500Activation time (min)
Pote
ntia
l (V
/SCE
)
Figure 5-1 Activation of SnO2/Ir/Ti electrode, current density of 10
mA/cm2 (Electrode No. 44)
Figure 5-2 represents the evolution of the potential of the anode
during the activation of SnO2/TaC/Ta. The potential oscillations were
observed. That could be explained by the modification of electrode
surface during the transfer of oxygen to the lattice increased the internal
stress of oxidized layer. Furthermore, the adhesion between SnO2 layer
and TaC was damaged by the free carbon that remained on TaC surface.
Figure 5-3 presents the SnO2/TaC/Ta after activation, the passivating
SnO2 layer was observed.
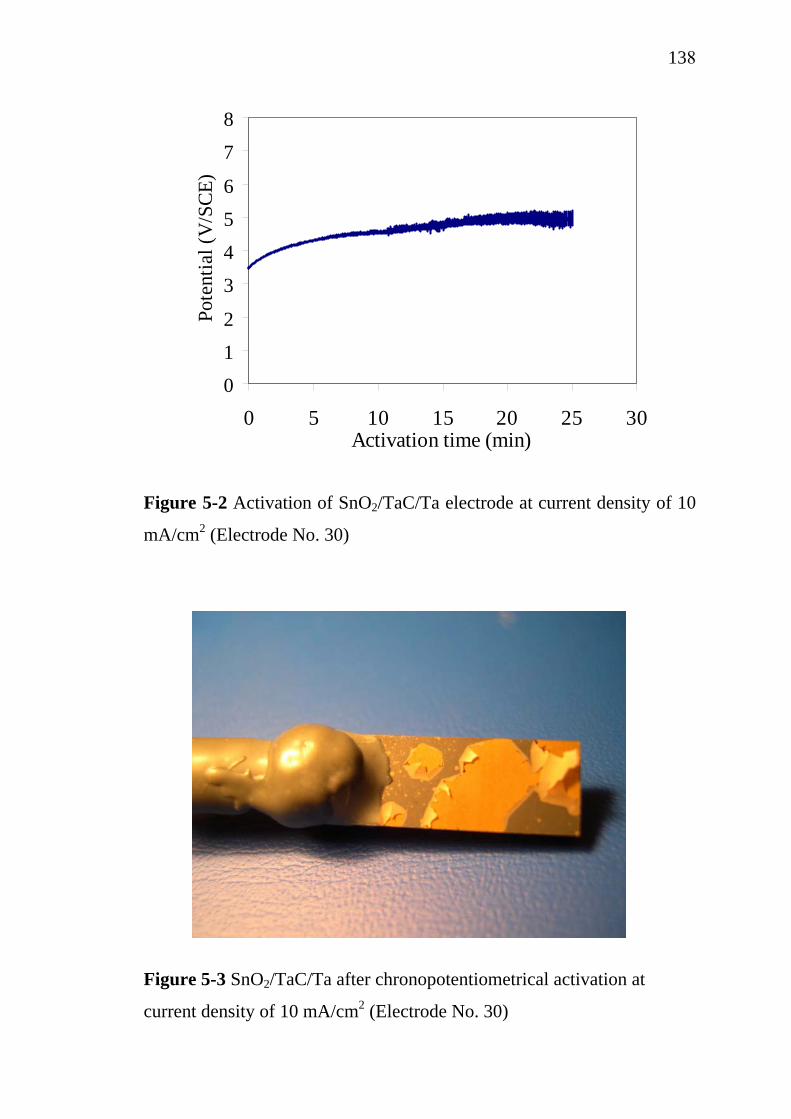
138
0
1
2
3
4
5
6
7
8
0 5 10 15 20 25 30Activation time (min)
Pote
ntia
l (V
/SCE
)
Figure 5-2 Activation of SnO2/TaC/Ta electrode at current density of 10
mA/cm2 (Electrode No. 30)
Figure 5-3 SnO2/TaC/Ta after chronopotentiometrical activation at
current density of 10 mA/cm2 (Electrode No. 30)
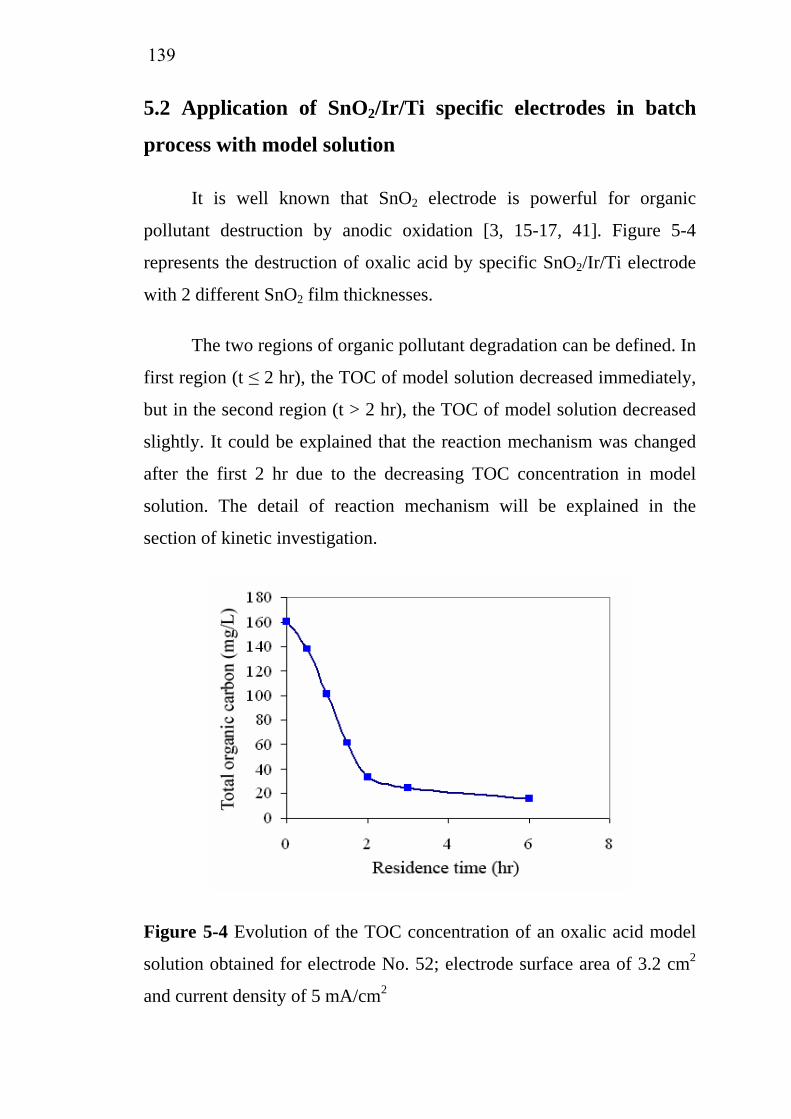
139
5.2 Application of SnO2/Ir/Ti specific electrodes in batch
process with model solution
It is well known that SnO2 electrode is powerful for organic
pollutant destruction by anodic oxidation [3, 15-17, 41]. Figure 5-4
represents the destruction of oxalic acid by specific SnO2/Ir/Ti electrode
with 2 different SnO2 film thicknesses.
The two regions of organic pollutant degradation can be defined. In
first region (t ≤ 2 hr), the TOC of model solution decreased immediately,
but in the second region (t > 2 hr), the TOC of model solution decreased
slightly. It could be explained that the reaction mechanism was changed
after the first 2 hr due to the decreasing TOC concentration in model
solution. The detail of reaction mechanism will be explained in the
section of kinetic investigation.
Figure 5-4 Evolution of the TOC concentration of an oxalic acid model
solution obtained for electrode No. 52; electrode surface area of 3.2 cm2
and current density of 5 mA/cm2
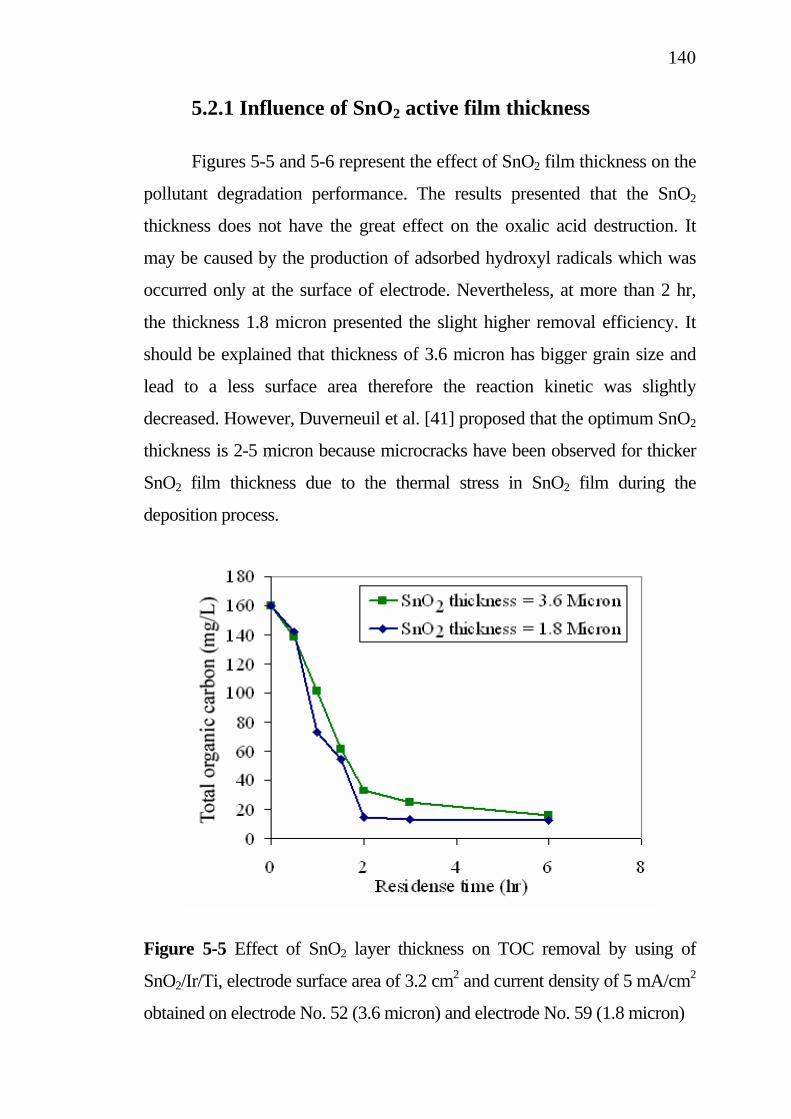
140
5.2.1 Influence of SnO2 active film thickness
Figures 5-5 and 5-6 represent the effect of SnO2 film thickness on the
pollutant degradation performance. The results presented that the SnO2
thickness does not have the great effect on the oxalic acid destruction. It
may be caused by the production of adsorbed hydroxyl radicals which was
occurred only at the surface of electrode. Nevertheless, at more than 2 hr,
the thickness 1.8 micron presented the slight higher removal efficiency. It
should be explained that thickness of 3.6 micron has bigger grain size and
lead to a less surface area therefore the reaction kinetic was slightly
decreased. However, Duverneuil et al. [41] proposed that the optimum SnO2
thickness is 2-5 micron because microcracks have been observed for thicker
SnO2 film thickness due to the thermal stress in SnO2 film during the
deposition process.
Figure 5-5 Effect of SnO2 layer thickness on TOC removal by using of
SnO2/Ir/Ti, electrode surface area of 3.2 cm2 and current density of 5 mA/cm2
obtained on electrode No. 52 (3.6 micron) and electrode No. 59 (1.8 micron)
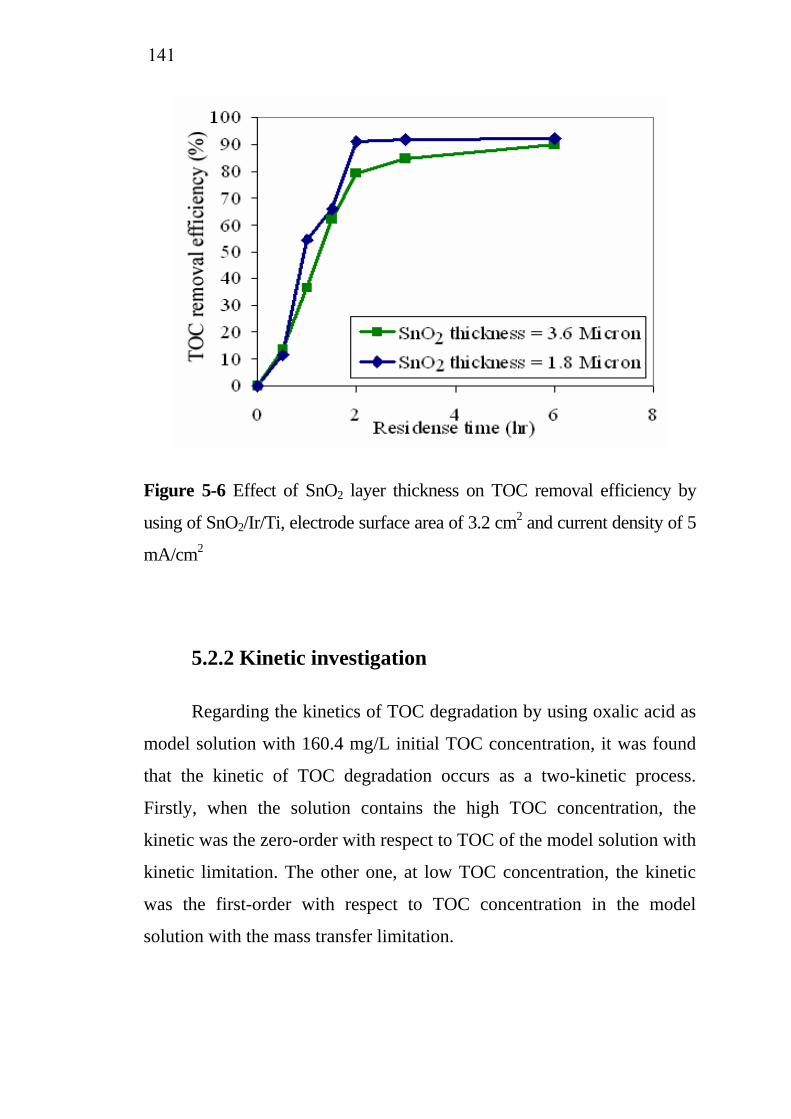
141
Figure 5-6 Effect of SnO2 layer thickness on TOC removal efficiency by
using of SnO2/Ir/Ti, electrode surface area of 3.2 cm2 and current density of 5
mA/cm2
5.2.2 Kinetic investigation
Regarding the kinetics of TOC degradation by using oxalic acid as
model solution with 160.4 mg/L initial TOC concentration, it was found
that the kinetic of TOC degradation occurs as a two-kinetic process.
Firstly, when the solution contains the high TOC concentration, the
kinetic was the zero-order with respect to TOC of the model solution with
kinetic limitation. The other one, at low TOC concentration, the kinetic
was the first-order with respect to TOC concentration in the model
solution with the mass transfer limitation.
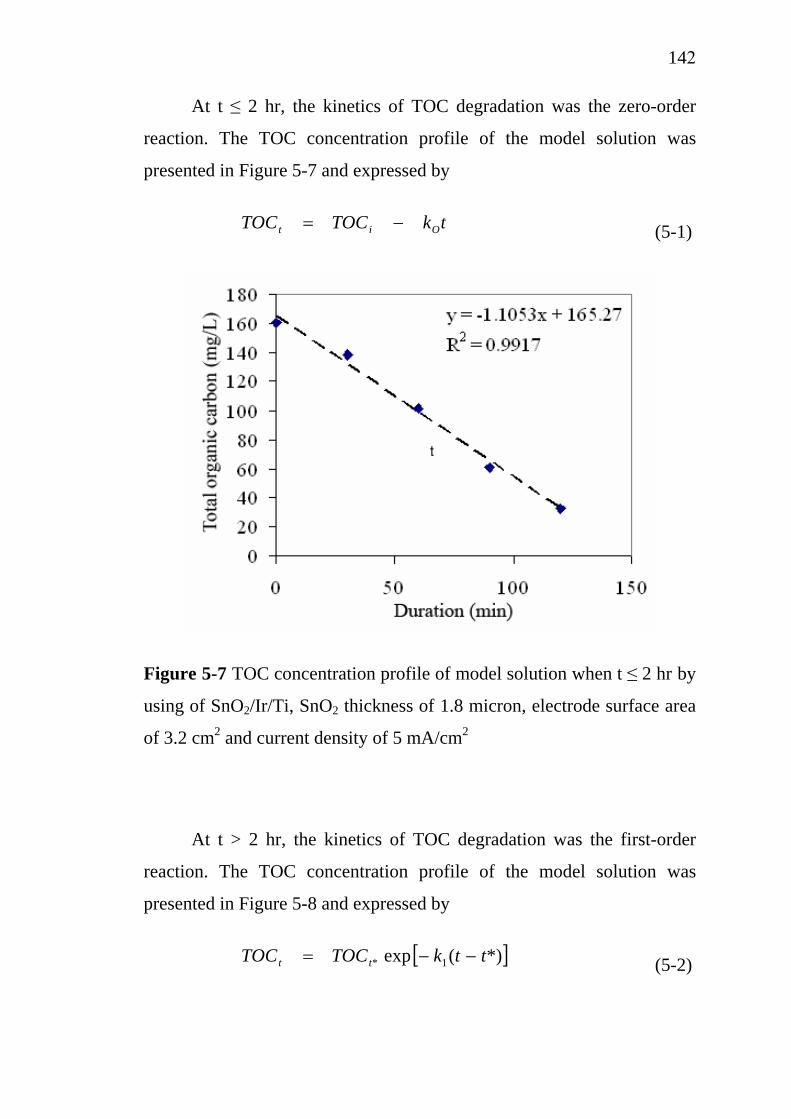
142
At t ≤ 2 hr, the kinetics of TOC degradation was the zero-order
reaction. The TOC concentration profile of the model solution was
presented in Figure 5-7 and expressed by
tkTOCTOC Oit −= (5-1)
Figure 5-7 TOC concentration profile of model solution when t ≤ 2 hr by
using of SnO2/Ir/Ti, SnO2 thickness of 1.8 micron, electrode surface area
of 3.2 cm2 and current density of 5 mA/cm2
At t > 2 hr, the kinetics of TOC degradation was the first-order
reaction. The TOC concentration profile of the model solution was
presented in Figure 5-8 and expressed by
[ ]*)(exp 1* ttkTOCTOC tt −−= (5-2)
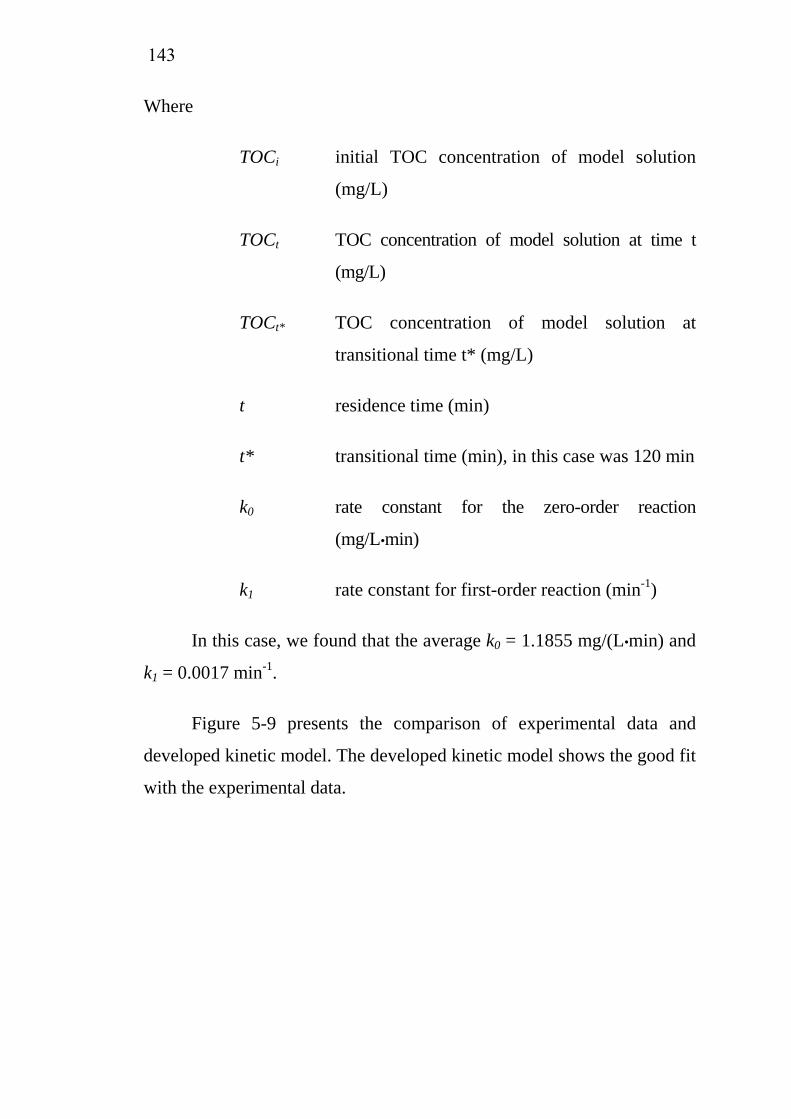
143
Where
TOCi initial TOC concentration of model solution
(mg/L)
TOCt TOC concentration of model solution at time t
(mg/L)
TOCt* TOC concentration of model solution at
transitional time t* (mg/L)
t residence time (min)
t* transitional time (min), in this case was 120 min
k0 rate constant for the zero-order reaction
(mg/L•min)
k1 rate constant for first-order reaction (min-1)
In this case, we found that the average k0 = 1.1855 mg/(L•min) and
k1 = 0.0017 min-1.
Figure 5-9 presents the comparison of experimental data and
developed kinetic model. The developed kinetic model shows the good fit
with the experimental data.
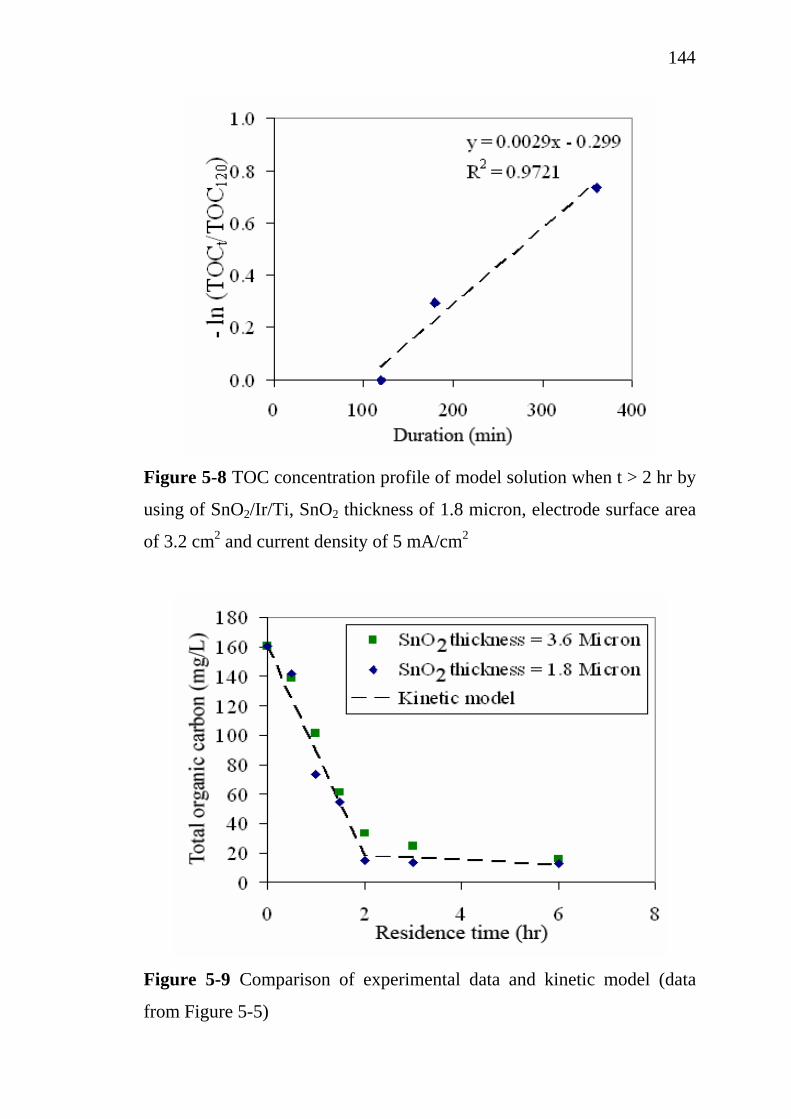
144
Figure 5-8 TOC concentration profile of model solution when t > 2 hr by
using of SnO2/Ir/Ti, SnO2 thickness of 1.8 micron, electrode surface area
of 3.2 cm2 and current density of 5 mA/cm2
Figure 5-9 Comparison of experimental data and kinetic model (data
from Figure 5-5)
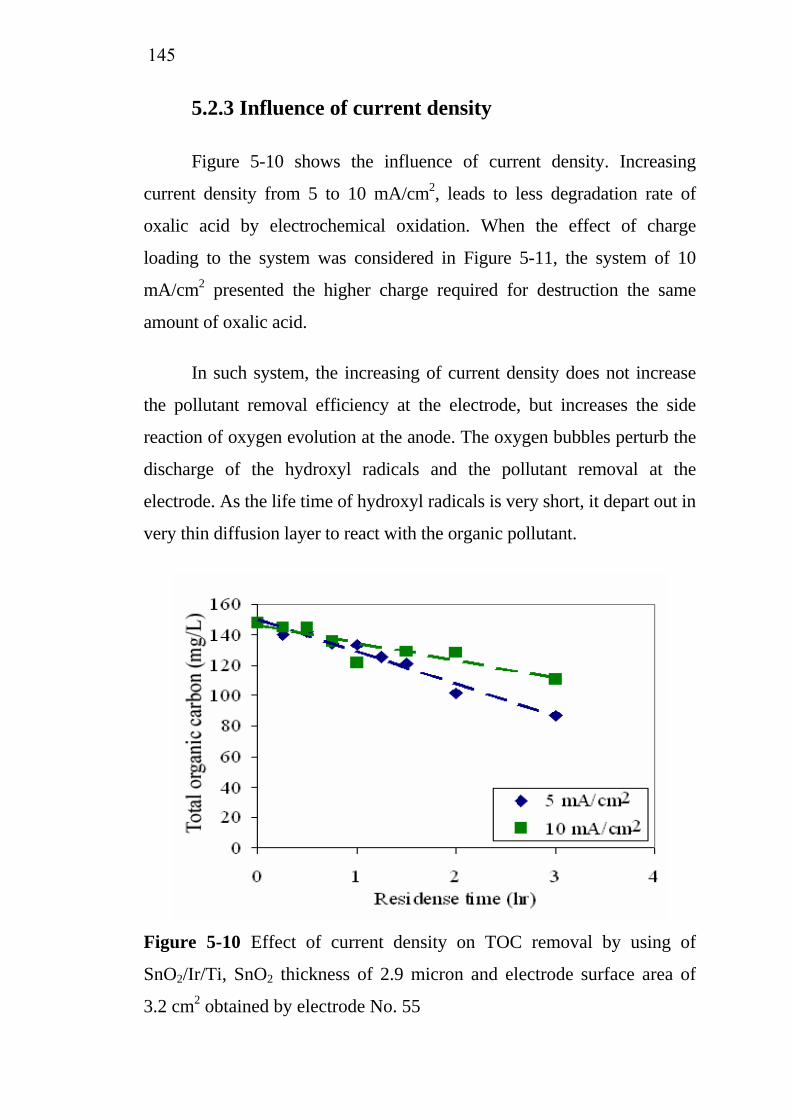
145
5.2.3 Influence of current density
Figure 5-10 shows the influence of current density. Increasing
current density from 5 to 10 mA/cm2, leads to less degradation rate of
oxalic acid by electrochemical oxidation. When the effect of charge
loading to the system was considered in Figure 5-11, the system of 10
mA/cm2 presented the higher charge required for destruction the same
amount of oxalic acid.
In such system, the increasing of current density does not increase
the pollutant removal efficiency at the electrode, but increases the side
reaction of oxygen evolution at the anode. The oxygen bubbles perturb the
discharge of the hydroxyl radicals and the pollutant removal at the
electrode. As the life time of hydroxyl radicals is very short, it depart out in
very thin diffusion layer to react with the organic pollutant.
Figure 5-10 Effect of current density on TOC removal by using of
SnO2/Ir/Ti, SnO2 thickness of 2.9 micron and electrode surface area of
3.2 cm2 obtained by electrode No. 55
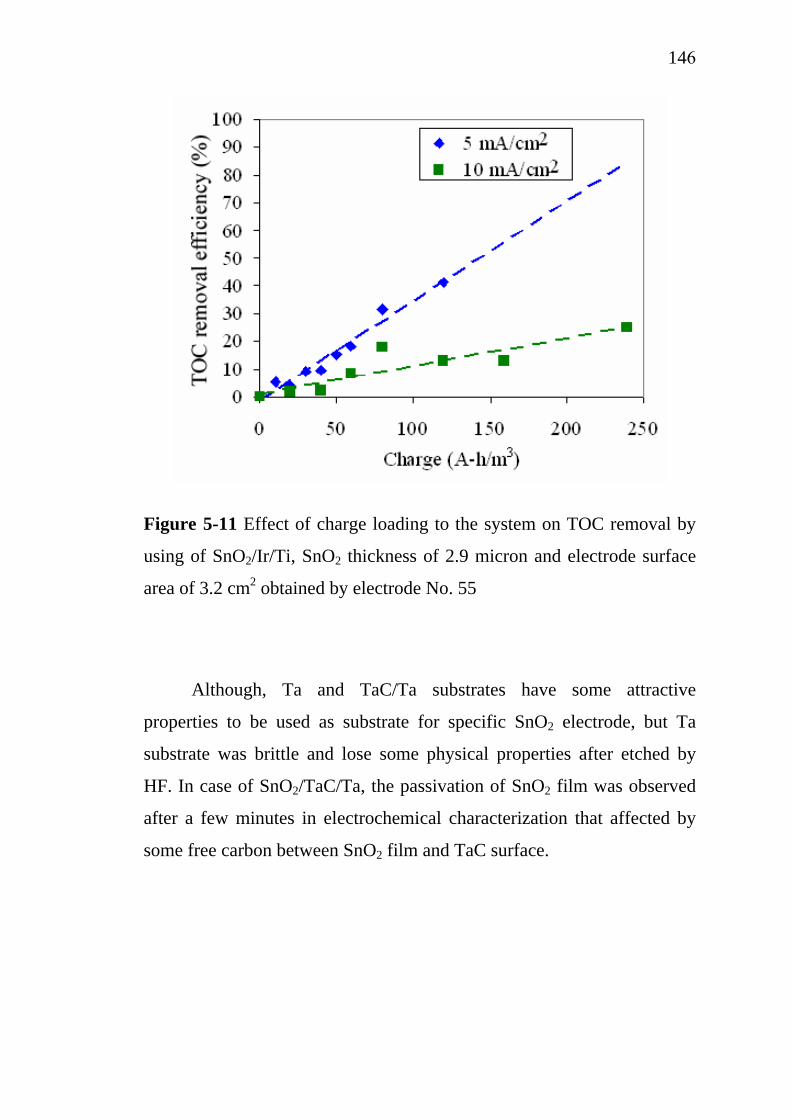
146
Figure 5-11 Effect of charge loading to the system on TOC removal by
using of SnO2/Ir/Ti, SnO2 thickness of 2.9 micron and electrode surface
area of 3.2 cm2 obtained by electrode No. 55
Although, Ta and TaC/Ta substrates have some attractive
properties to be used as substrate for specific SnO2 electrode, but Ta
substrate was brittle and lose some physical properties after etched by
HF. In case of SnO2/TaC/Ta, the passivation of SnO2 film was observed
after a few minutes in electrochemical characterization that affected by
some free carbon between SnO2 film and TaC surface.
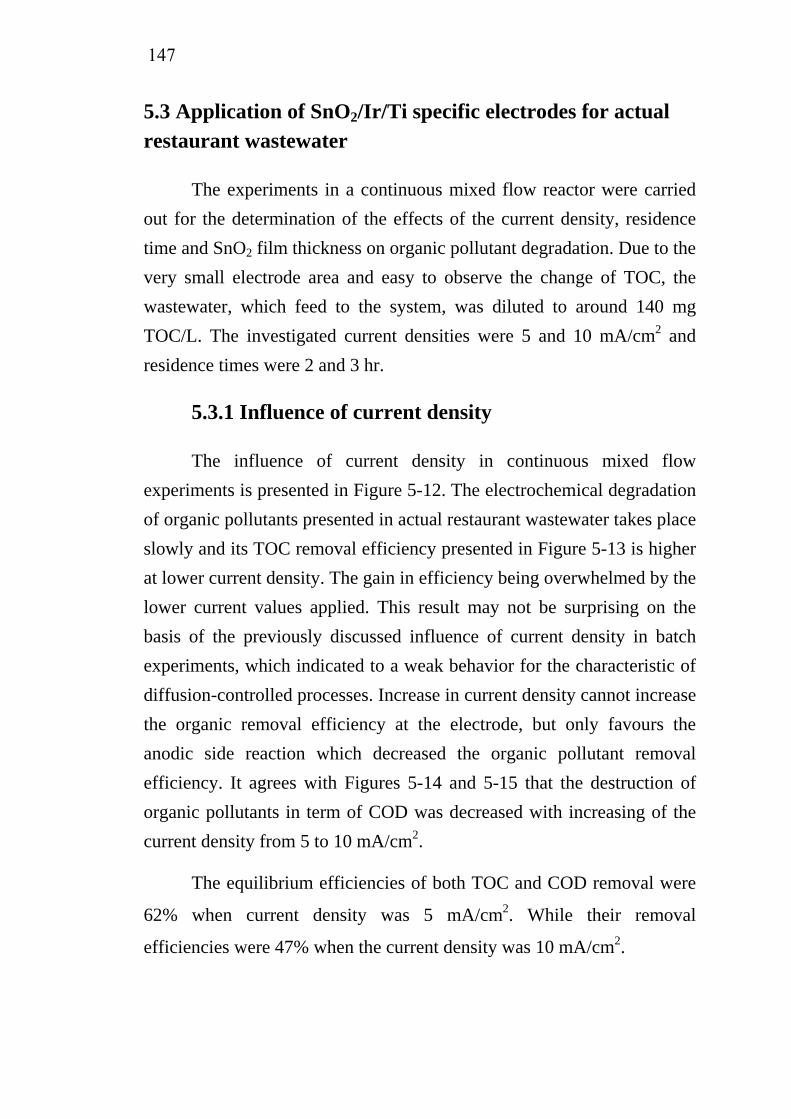
147
5.3 Application of SnO2/Ir/Ti specific electrodes for actual restaurant wastewater
The experiments in a continuous mixed flow reactor were carried out for the determination of the effects of the current density, residence time and SnO2 film thickness on organic pollutant degradation. Due to the very small electrode area and easy to observe the change of TOC, the wastewater, which feed to the system, was diluted to around 140 mg TOC/L. The investigated current densities were 5 and 10 mA/cm2 and residence times were 2 and 3 hr.
5.3.1 Influence of current density
The influence of current density in continuous mixed flow experiments is presented in Figure 5-12. The electrochemical degradation of organic pollutants presented in actual restaurant wastewater takes place slowly and its TOC removal efficiency presented in Figure 5-13 is higher at lower current density. The gain in efficiency being overwhelmed by the lower current values applied. This result may not be surprising on the basis of the previously discussed influence of current density in batch experiments, which indicated to a weak behavior for the characteristic of diffusion-controlled processes. Increase in current density cannot increase the organic removal efficiency at the electrode, but only favours the anodic side reaction which decreased the organic pollutant removal efficiency. It agrees with Figures 5-14 and 5-15 that the destruction of organic pollutants in term of COD was decreased with increasing of the current density from 5 to 10 mA/cm2.
The equilibrium efficiencies of both TOC and COD removal were
62% when current density was 5 mA/cm2. While their removal
efficiencies were 47% when the current density was 10 mA/cm2.
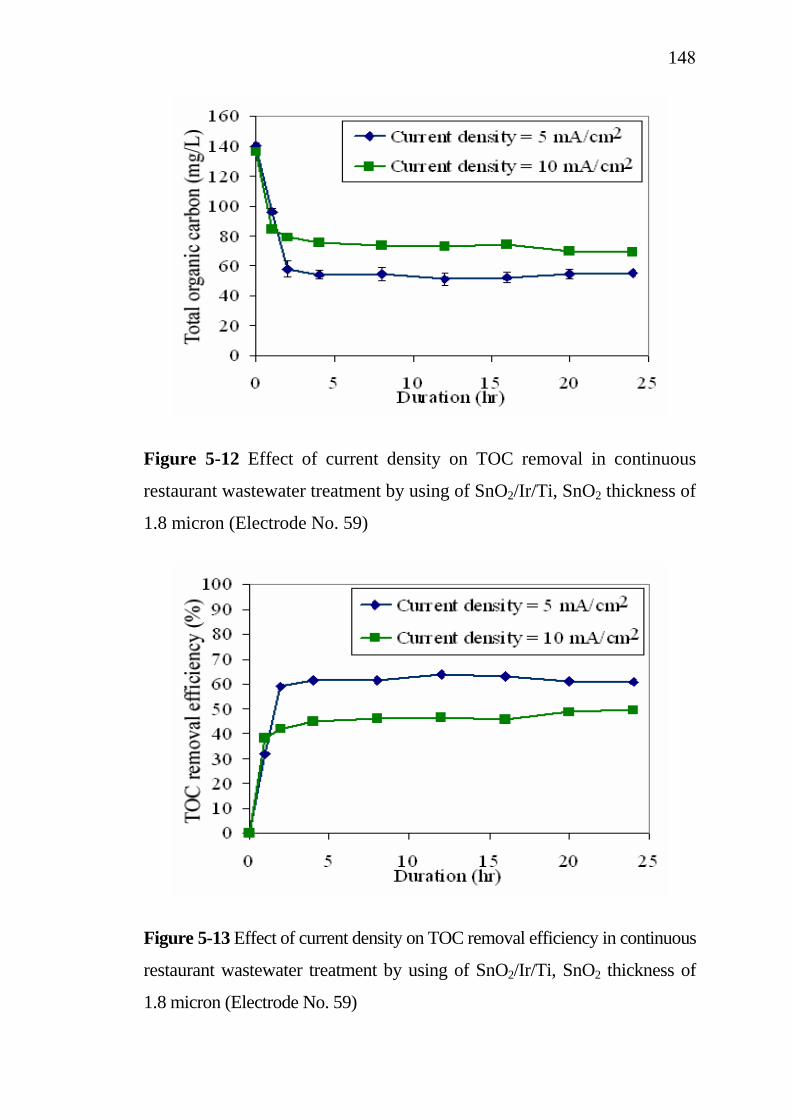
148
Figure 5-12 Effect of current density on TOC removal in continuous
restaurant wastewater treatment by using of SnO2/Ir/Ti, SnO2 thickness of
1.8 micron (Electrode No. 59)
Figure 5-13 Effect of current density on TOC removal efficiency in continuous
restaurant wastewater treatment by using of SnO2/Ir/Ti, SnO2 thickness of
1.8 micron (Electrode No. 59)
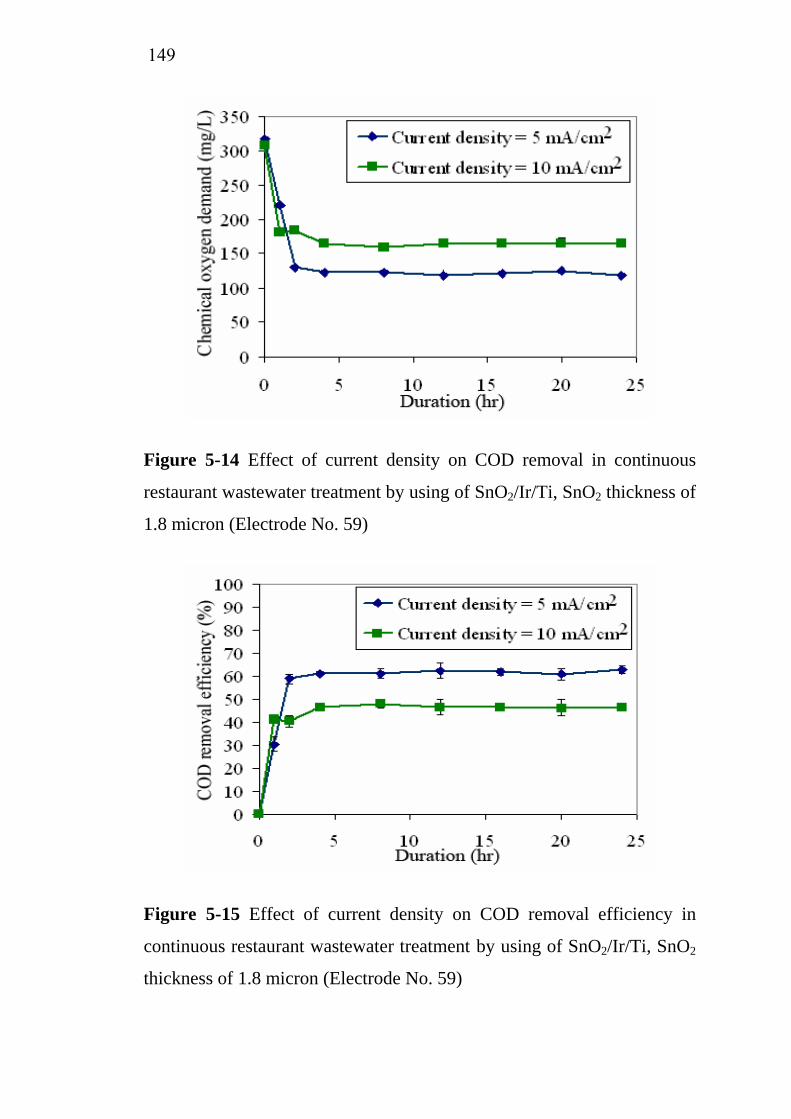
149
Figure 5-14 Effect of current density on COD removal in continuous
restaurant wastewater treatment by using of SnO2/Ir/Ti, SnO2 thickness of
1.8 micron (Electrode No. 59)
Figure 5-15 Effect of current density on COD removal efficiency in
continuous restaurant wastewater treatment by using of SnO2/Ir/Ti, SnO2
thickness of 1.8 micron (Electrode No. 59)
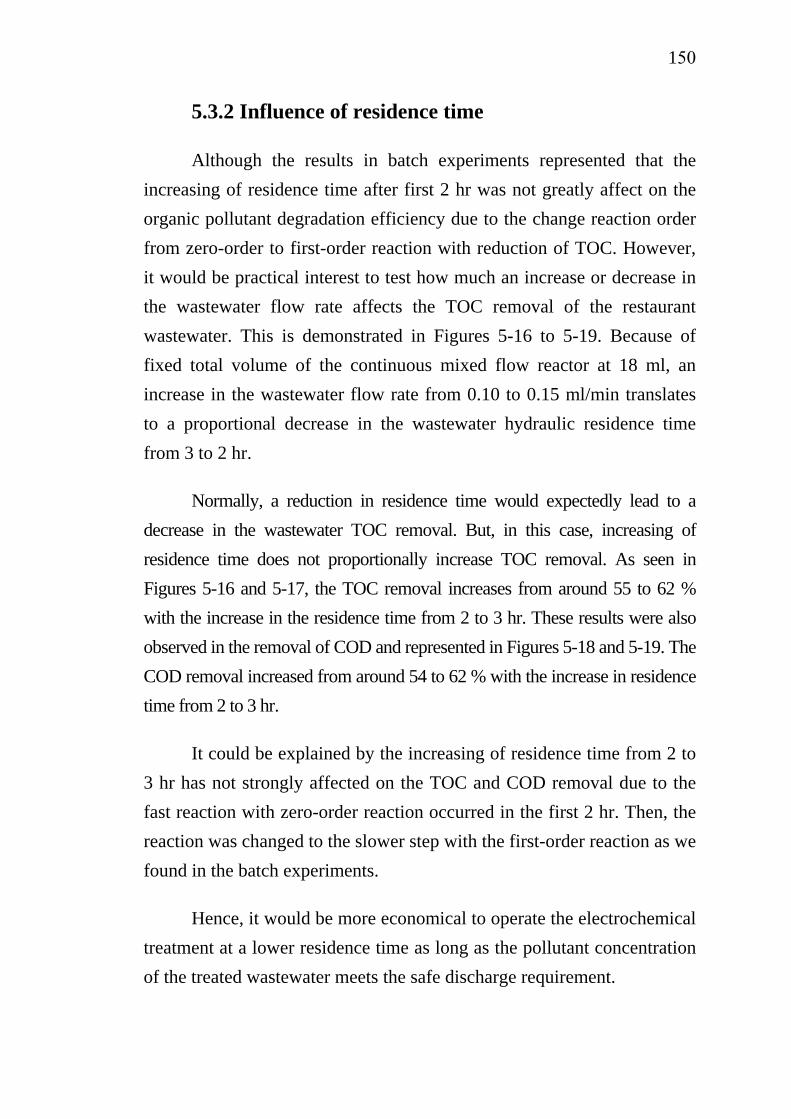
150
5.3.2 Influence of residence time
Although the results in batch experiments represented that the increasing of residence time after first 2 hr was not greatly affect on the organic pollutant degradation efficiency due to the change reaction order from zero-order to first-order reaction with reduction of TOC. However, it would be practical interest to test how much an increase or decrease in the wastewater flow rate affects the TOC removal of the restaurant wastewater. This is demonstrated in Figures 5-16 to 5-19. Because of fixed total volume of the continuous mixed flow reactor at 18 ml, an increase in the wastewater flow rate from 0.10 to 0.15 ml/min translates to a proportional decrease in the wastewater hydraulic residence time from 3 to 2 hr.
Normally, a reduction in residence time would expectedly lead to a decrease in the wastewater TOC removal. But, in this case, increasing of residence time does not proportionally increase TOC removal. As seen in Figures 5-16 and 5-17, the TOC removal increases from around 55 to 62 % with the increase in the residence time from 2 to 3 hr. These results were also observed in the removal of COD and represented in Figures 5-18 and 5-19. The COD removal increased from around 54 to 62 % with the increase in residence time from 2 to 3 hr.
It could be explained by the increasing of residence time from 2 to 3 hr has not strongly affected on the TOC and COD removal due to the fast reaction with zero-order reaction occurred in the first 2 hr. Then, the reaction was changed to the slower step with the first-order reaction as we found in the batch experiments.
Hence, it would be more economical to operate the electrochemical treatment at a lower residence time as long as the pollutant concentration of the treated wastewater meets the safe discharge requirement.
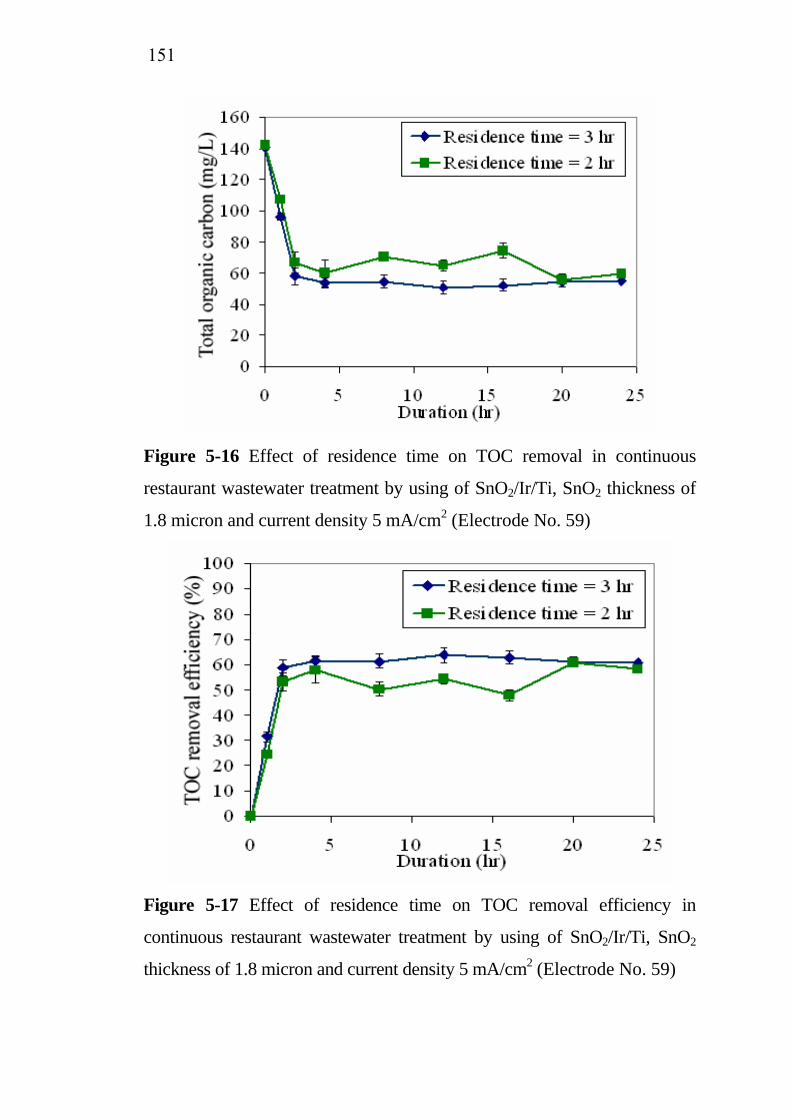
151
Figure 5-16 Effect of residence time on TOC removal in continuous
restaurant wastewater treatment by using of SnO2/Ir/Ti, SnO2 thickness of
1.8 micron and current density 5 mA/cm2 (Electrode No. 59)
Figure 5-17 Effect of residence time on TOC removal efficiency in
continuous restaurant wastewater treatment by using of SnO2/Ir/Ti, SnO2
thickness of 1.8 micron and current density 5 mA/cm2 (Electrode No. 59)
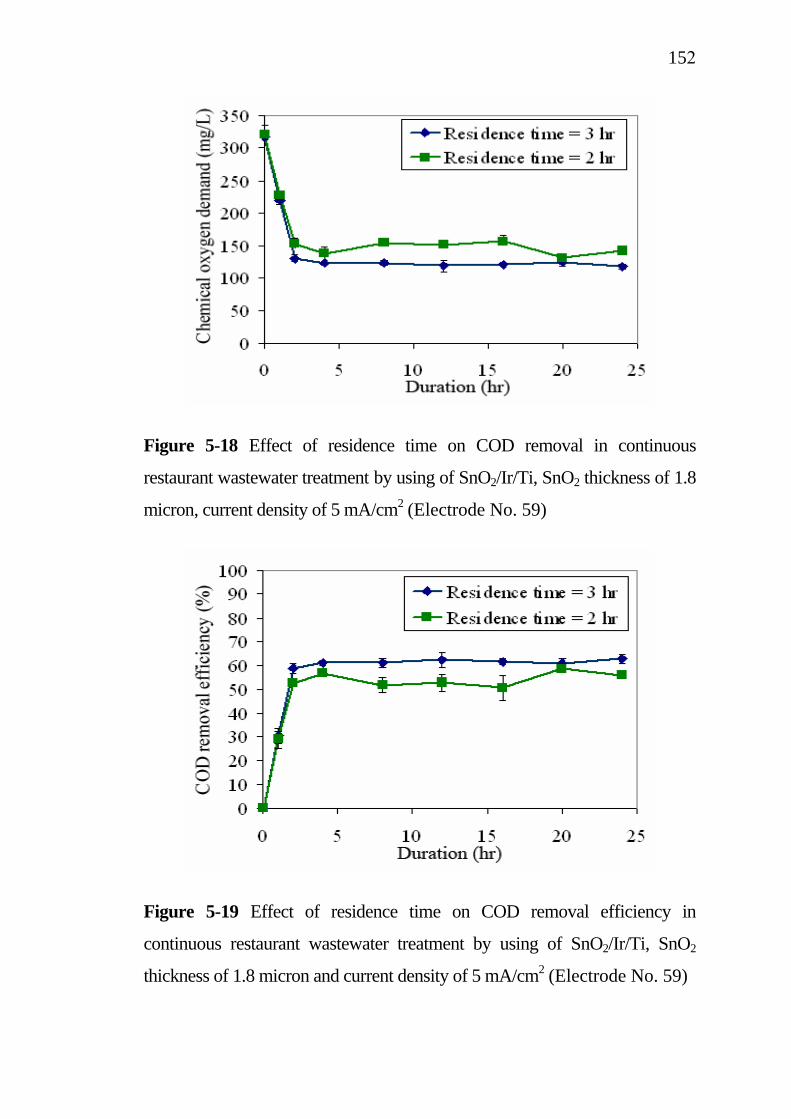
152
Figure 5-18 Effect of residence time on COD removal in continuous
restaurant wastewater treatment by using of SnO2/Ir/Ti, SnO2 thickness of 1.8
micron, current density of 5 mA/cm2 (Electrode No. 59)
Figure 5-19 Effect of residence time on COD removal efficiency in
continuous restaurant wastewater treatment by using of SnO2/Ir/Ti, SnO2
thickness of 1.8 micron and current density of 5 mA/cm2 (Electrode No. 59)
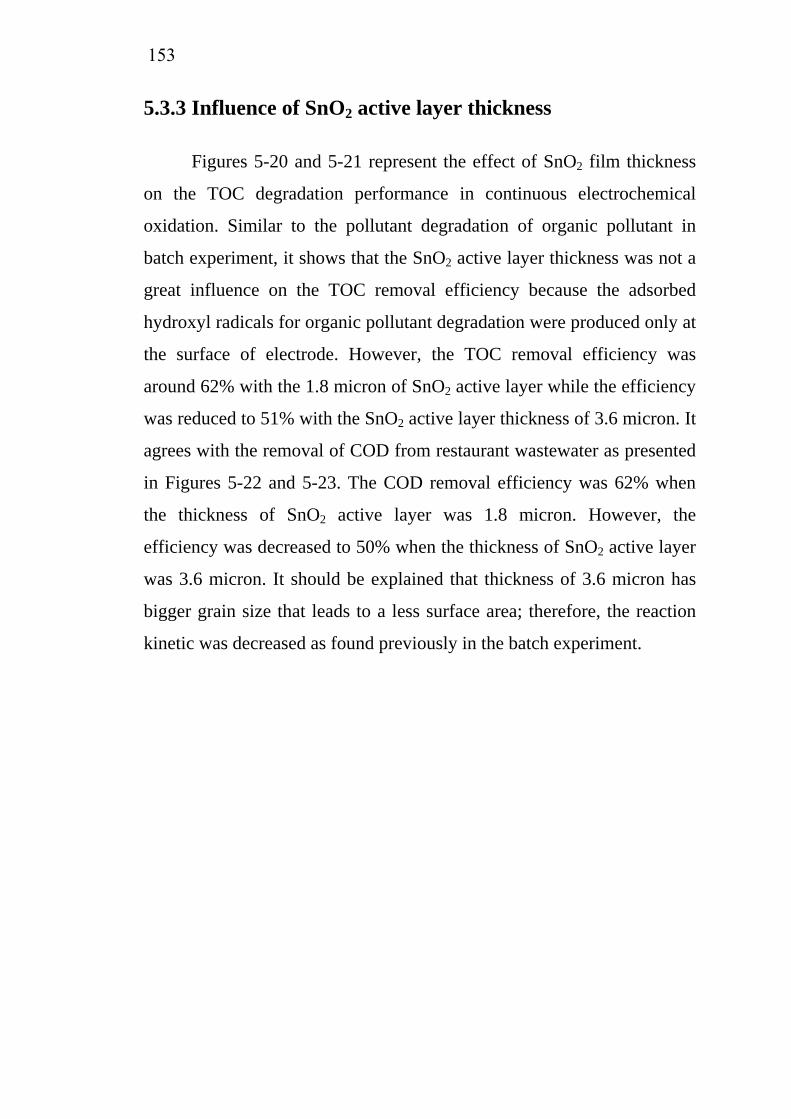
153
5.3.3 Influence of SnO2 active layer thickness
Figures 5-20 and 5-21 represent the effect of SnO2 film thickness
on the TOC degradation performance in continuous electrochemical
oxidation. Similar to the pollutant degradation of organic pollutant in
batch experiment, it shows that the SnO2 active layer thickness was not a
great influence on the TOC removal efficiency because the adsorbed
hydroxyl radicals for organic pollutant degradation were produced only at
the surface of electrode. However, the TOC removal efficiency was
around 62% with the 1.8 micron of SnO2 active layer while the efficiency
was reduced to 51% with the SnO2 active layer thickness of 3.6 micron. It
agrees with the removal of COD from restaurant wastewater as presented
in Figures 5-22 and 5-23. The COD removal efficiency was 62% when
the thickness of SnO2 active layer was 1.8 micron. However, the
efficiency was decreased to 50% when the thickness of SnO2 active layer
was 3.6 micron. It should be explained that thickness of 3.6 micron has
bigger grain size that leads to a less surface area; therefore, the reaction
kinetic was decreased as found previously in the batch experiment.
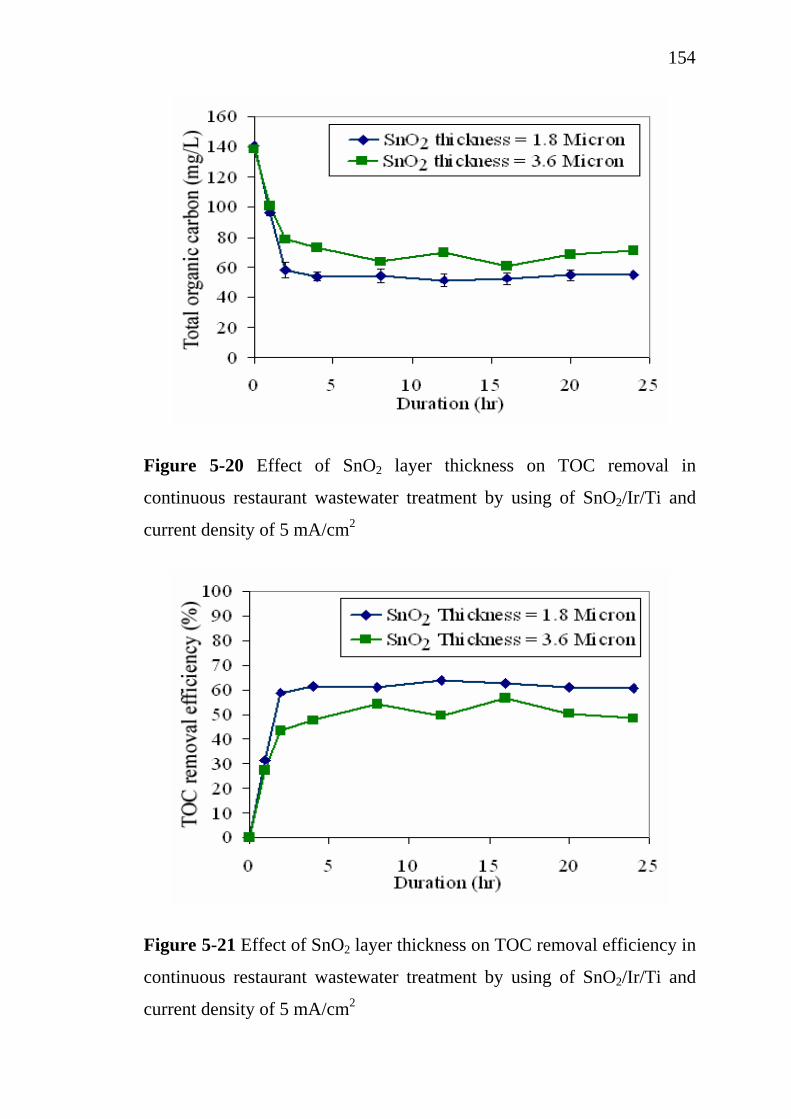
154
Figure 5-20 Effect of SnO2 layer thickness on TOC removal in
continuous restaurant wastewater treatment by using of SnO2/Ir/Ti and
current density of 5 mA/cm2
Figure 5-21 Effect of SnO2 layer thickness on TOC removal efficiency in
continuous restaurant wastewater treatment by using of SnO2/Ir/Ti and
current density of 5 mA/cm2
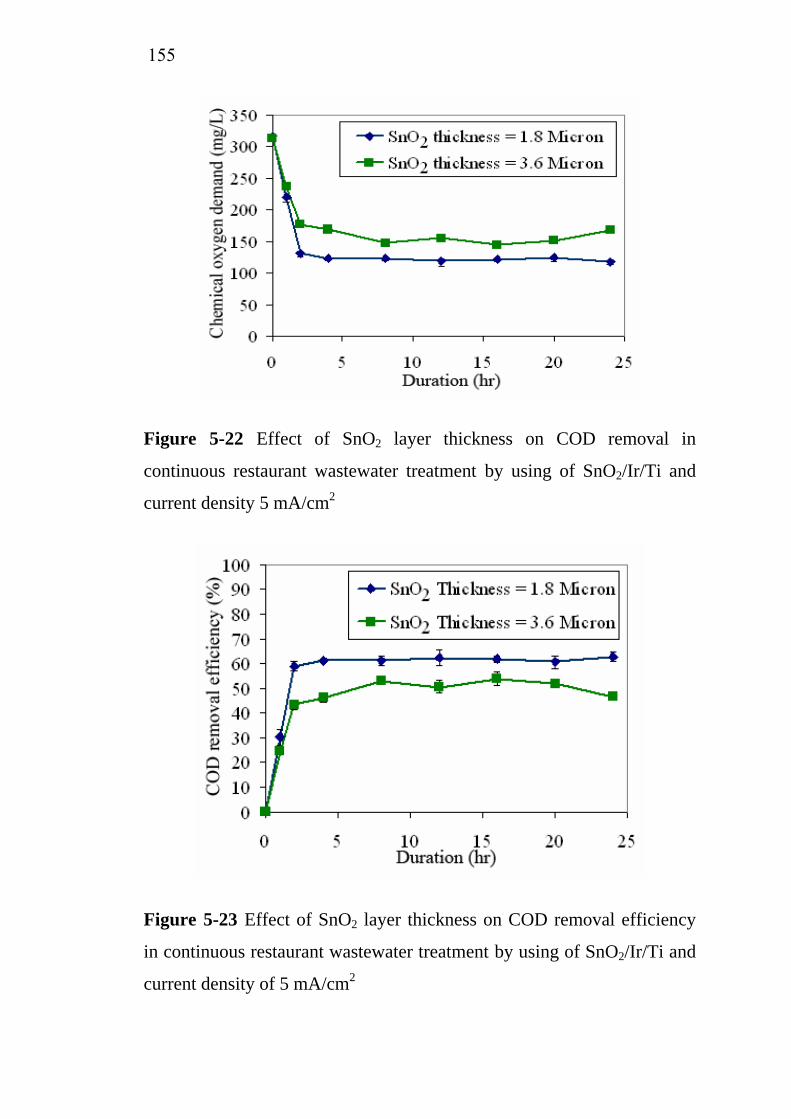
155
Figure 5-22 Effect of SnO2 layer thickness on COD removal in
continuous restaurant wastewater treatment by using of SnO2/Ir/Ti and
current density 5 mA/cm2
Figure 5-23 Effect of SnO2 layer thickness on COD removal efficiency
in continuous restaurant wastewater treatment by using of SnO2/Ir/Ti and
current density of 5 mA/cm2
156
5.4 Treatment cost analysis of restaurant wastewater
treatment by electrochemical oxidation
The cost analysis of restaurant wastewater treatment by
electrochemical oxidation is presented in Tables 5-1, 5-2 and 5-3. The
operating cost was calculated and based on the adjustment of operating
parameters.
Table 5-1 represents the cost comparison of restaurant wastewater
treatment with two current densities that were applied to wastewater
treatment system. It was found that increasing current density from 5 to
10 mA/cm3 decreases TOC and COD removal efficiency of the system
because the increase of cell voltage which causes the anodic side reaction.
Furthermore, the increase of cell voltage leads to the power requirement
of the system. Consequently, the operating costs of restaurant wastewater
treatment are 109 and 303 baht/m3 when the current densities are 5 and
10 mA/cm3, respectively.
Table 5-2 presents the operating cost with a variation of residence
time. The TOC and COD removal efficiency with the residence time of 3
hr was 62% and the efficiency was 55% with residence time of 2 hr.
However, the operating costs were 66 and 109 baht/m3 when the
residence times were 2 and 3 hr, respectively.
Table 5-3 presents the effect of the thickness of SnO2 active layer
on operating cost. It shows that the thickness of SnO2 active layer has no
effect on the operating cost. However, increasing twice SnO2 thickness
may increase the investment cost of electrode.
This study was based on a small reactor of 18 ml. and dilution of
wastewater by deionized water causing the higher cell voltage and higher
157
electrical power consumption. With the small laboratory scale and
dilution therefore the treatment cost per unit volume of solution may be
excessively high. The actual cost of treatment in the large-sized system
should be reasonably reduced per unit volume.
5.5 Conclusions
From the study of organic pollutant destruction by electrochemical
oxidation in both batch and continuous processes, it should be concluded
that the SnO2 film thickness slightly affected on the organic pollutant
removal efficiency. While the increase of current density had favored the
side reaction that resulted on decrease of the pollutant removal efficiency.
Finally, the increase of residence time leads to the increase of treatment
efficiency.
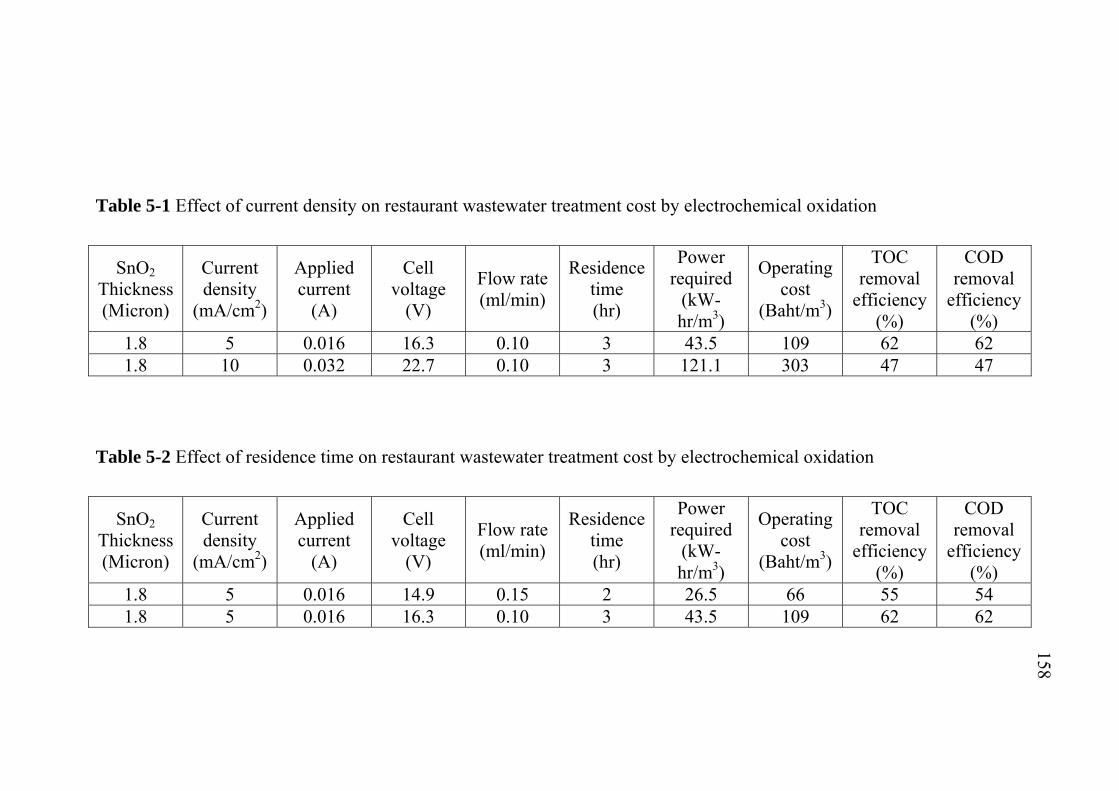
Table 5-1 Effect of current density on restaurant wastewater treatment cost by electrochemical oxidation
SnO2 Thickness (Micron)
Current density
(mA/cm2)
Applied current
(A)
Cell voltage
(V)
Flow rate (ml/min)
Residence time (hr)
Power required
(kW-hr/m3)
Operating cost
(Baht/m3)
TOC removal
efficiency (%)
COD removal
efficiency (%)
1.8 5 0.016 16.3 0.10 3 43.5 109 62 62 1.8 10 0.032 22.7 0.10 3 121.1 303 47 47
Table 5-2 Effect of residence time on restaurant wastewater treatment cost by electrochemical oxidation
SnO2 Thickness (Micron)
Current density
(mA/cm2)
Applied current
(A)
Cell voltage
(V)
Flow rate (ml/min)
Residence time (hr)
Power required
(kW-hr/m3)
Operating cost
(Baht/m3)
TOC removal
efficiency (%)
COD removal
efficiency (%)
1.8 5 0.016 14.9 0.15 2 26.5 66 55 54 1.8 5 0.016 16.3 0.10 3 43.5 109 62 62
158
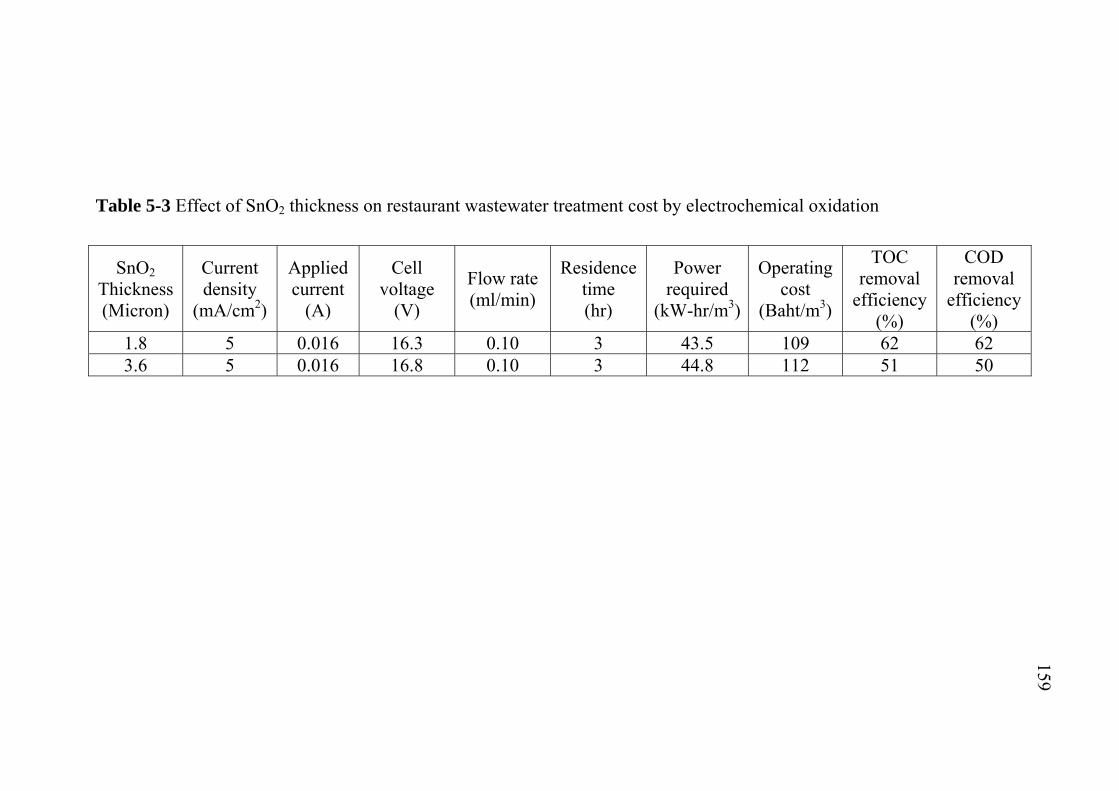
Table 5-3 Effect of SnO2 thickness on restaurant wastewater treatment cost by electrochemical oxidation
SnO2 Thickness (Micron)
Current density
(mA/cm2)
Applied current
(A)
Cell voltage
(V)
Flow rate (ml/min)
Residence time (hr)
Power required
(kW-hr/m3)
Operating cost
(Baht/m3)
TOC removal
efficiency (%)
COD removal
efficiency (%)
1.8 5 0.016 16.3 0.10 3 43.5 109 62 62 3.6 5 0.016 16.8 0.10 3 44.8 112 51 50
159

Chapter 6
General Conclusion
6.1 Electrodes elaboration
6.1.1 Protective underlayers elaboration
It was found that the IrO2 film growth rate was affected by the
O2/Ir(acac)3 molar ratio. With the increasing of O2/Ir(acac)3 molar ratio
from 11,000 to 17,000, the maximum IrO2 growth rate was decreased
from 2.9 to 1.9 nm/min due to the higher Ir precursor concentration in
feed vapor. Furthermore, the O2/Ir(acac)3 molar ratio affected on the
microstructure of IrO2 film. The SEM and X-ray diffraction of IrO2 film
indicated that the columnar growth of IrO2 with (101) orientation was
observed at O2/Ir(acac)3 molar ratio of 17,000, while the dense IrO2 film
with (110) orientation was observed at the molar ratio of 11,000. The IrO2
film had homogeneous microstructure and good coverage on Si wafer.
However, the gradient deposition of IrO2 film on Ti substrate was
observed because Ir(acac)3 had low volatility and difficultly controlled
mass transfer and also the delayed of research plan for finding the
convenient operating condition for protective layer. Therefore the
research was focused on the protection of substrate by the other material.
From the previous results, it concludes that the IrO2 film from Ir(acac)3 is
not suitable for using as protective layer for SnO2 specific electrode.
162
Deposition of Ir film by using (MeCp)Ir(COD) as precursor with
the presence of O2 was investigated. It was found that the deposition of Ir
film was strongly affected by deposition temperature and oxygen content
in feed vapor mixture. The increasing of deposition temperature from 300
to 325 and 350 ºC has significantly affected on the Ir deposition area. The
deposition area was decreased from 13 to 11 and 9.75 cm from the
entrance of the reactor, respectively. The growth rate of Ir film was very
high at a few centimeters nearby the entrance of the reactor, but rapidly
decreased downstream because the system was very active at high
deposition temperature and the (MeCp)Ir(COD) was consumed
immediately in a few centimeters from the entrance. When the
O2/(MeCp)Ir(COD) molar ratio was 1545, the precursor was totally
decomposed near the entrance of the reactor resulting the abrupt gradient
film thickness. The maximum growth rate was approximately 4 nm/min
at 10 cm from the entrance and fell down to nearly zero after a few
centimeters. While the Ir film deposited uniformly over several
centimeters long through the reactor when O2/(MeCp)Ir(COD) molar
ratio was 125 due to the reactivity of the system was reduced by
decreasing of O2/(MeCp)Ir(COD) molar ratio. The conditions for the
suitable Ir film to be used as the protective layer for specific electrode
was at 300 ºC, total pressure of 12 Torr and O2/(MeCp)Ir(COD) molar
ratio of 125.
6.1.2 Electrocatalytic layer deposition
The SnO2 coatings were uniform and exhibited good conformal
coverage. The increasing O2/TET molar ratio from 300 to 1,200 was not
greatly influence on the growth rate of SnO2 in the first 10 cm of the
reactor. However, the O2/TET molar ratio at 300 presented the higher
163
growth rate of SnO2 film after 10 cm from the entrance of the reacotr.
The growth rate of SnO2 film is a function of TET concentration in feed
gas composition. The increasing of TET concentration in feed gas
mixture has no influence on the microstructure of SnO2 film. The
substrate materials have not affected on SnO2 film growth rate. However,
the SnO2 film growth rate could be improved by the substrate with high
surface roughness due to its higher specific area. The SEM images show
that the SnO2 film was dense, smooth, homogeneous microstructure and
uniform coverage of deposition on the high surface roughness substrate.
The suitable SnO2 active coating for using as anode organic pollutant
degradation was deposited at 380 ºC, 15 Torr of total pressure and
O2/TET molar ratio of 1,200.
6.1.3 Simulation of Ir deposition using FLUENT®
The comparison of Ir deposition rate between the experimental data
and the simulation results from FLUENT®. The simulation results were
agreed with the experimental data at the position that was placed by Si
wafer. While the difference on surface chemistry and in the high genuine
surface area of Ti substrate by treating with HCl acid led to the higher Ir
deposition rate in experimental data with the same geometrical
dimension. However, the FLUENT® simulation is a powerful tool for the
optimization of suitable operating conditions and the scaling up of the
reactor.
164
6.2 Electrochemical oxidation
6.2.1 Application of specific electrodes in batch process
with model solution
From the application of SnO2/Ir/Ti specific electrode for oxalic
acid destruction, it was found that the SnO2 thickness does not have the
great influence. It may be caused by the production of adsorbed hydroxyl
radicals that was occurred only at the surface of electrode. While
increasing the current density from 5 to 10 mA/cm2 leads to less
degradation rate of oxalic acid by electrochemical oxidation due to the
characteristic of diffusion-controlled processes. In such system,
increasing current density cannot increase the organic removal efficiency,
but only favors the anodic side reaction. In case of SnO2/Ta and
SnO2/TaC/Ta electrodes, Ta substrate was brittle and lose some physical
properties after being etched by HF. While the passivation of SnO2 layer
was observed in the electrochemical activation of SnO2/TaC/Ta due to the
low cohesion between SnO2 film and TaC surface.
6.2.2 Kinetic investigation for batch process with model
solution
The kinetics of TOC degradation on SnO2/Ir/Ti occur as a two-
mechanism process. Firstly, when the solution contains the high TOC
concentration, the reaction kinetic was the zero-order with respect to
TOC, and the pollutant decomposition rate was controlled by the kinetic
of the reaction.
tkTOCTOC Oit −=
165
Secondly, at low TOC concentration, the kinetic was the first-order
with respect to TOC concentration, and the pollutant decomposition rate
was controlled by the mass transfer of pollutant to the electrode.
[ ]*)(exp 1* ttkTOCTOC tt −−=
When transitional time, t* = 120 min., k0 = 1.1855 mg/L-min and
k1 = 0.0017 min-1.
6.2.3 Application of specific electrodes for actual
restaurant wastewater
Similar to the degradation of organic pollutants in batch process,
TOC removal efficiency on SnO2/Ir/Ti is high at 5 mA/cm2, then
decreased when increased current density to 10 mA/cm2, which indicated
the characteristic of diffusion-controlled processes. Increasing of
residence time is not proportion to increase of TOC and COD removal.
Around 55 to 62 % increase for TOC and 54 to 62 % increase for COD
with an increase in the residence time from 2 to 3 hr due to the fast step
of reaction with zero-order reaction within 2 hr. Then, the reaction was
changed to the slower step with first-order reaction based on TOC
concentration in wastewater. Similar to the degradation of organic
pollutant in the batch experiments, it shows that the SnO2 active layer
thickness was not a great influence on the TOC removal efficiency due to
the adsorbed hydroxyl radicals for organic pollutant degradation were
produced only at the surface of electrode.
From these results, it should be concluded that the specific
SnO2/Ir/Ti prepared by metal-organic chemical vapor deposition can be

166
used for the degradation of organic pollutants presented in wastewater by
electrochemical oxidation.
References
[1.] Chen, X., Chen, G. and Yue, P.L. Separation of pollutants from
restaurant astewater by lectrocoagulation. Separation and
Purification Technology Vol. 19 (2000): 65-76.
[2.] Grimm, J. et al. Sol-gel film preparation electrodes for the
electrocatalytic oxidation of organic pollutants in water.
Desalination Vol. 115 (1998): 295-302.
[3.] Comninellis, C. Electrocatalysis in the electrochemical
conversion/ combustion of organic pollutants for waste
water treatment. Electrochimica Acta Vol. 39 (1994):
1857-862.
[4.] Maury, F. and Senocq, F. Irirdium coatings grown by metal-
organic chemical vapor deposition in a hot-wall CVD
reactor. Surface & Coatings Technology Vol. 163-164
(2003): 208-213.
[5.] http://www.environmental-center.com/articles/article1149/
article1149.htm
[6.] http:www.barnstablecountryhelath.org/AlternativeWebpage/Grease/
Grease.htm
[7.] Hanze, M., Harremës, P., Jansen, J. C. and Arvin, E.
Wastewater Treatment: Biological and Chemical
Processes. New York: Springer, 1995.
[8.] Chen, G. Electrochemical technologies in wastewater treatment.
Separation and Purification Technology Vol. 38 (2004):
11–41.
168
[9.] Den, W. and Huang, C. Electrocoagulation for removal of silica
nano-particles from chemical–mechanical-planarization
wastewater. Colloids and Surfaces A: Physicochemical
Engineering Aspects Vol. 254 (2005): 81–89.
[10.] Hosny, A. Y. Separating oil from oil-water emulsions by
electroflotation Technique. Separation Technology Vol. 6
(1996): 9-17.
[11.] Kuhn, A. T., Electrolytic decomposition of cyanides, phenols
and thiocyanates in effluents streams-a literature review.
Journal of Chemical Technology and Biotechnology Vol.
21 (1971): 29–34.
[12.] Azzam, M.O., Tahboub, Y. and Al-Tarazi, M. Effect of counter
electrode material on the anodic destruction of 4-Cl
phenol solution, Transactions of the Institution of
Chemical Engineers Vol. B 77 (1999): 219–226.
[13.] Rosenthal, K.I. and Veselovkii, V.I. Doklady Akademii Nauk
SSR Vol. 111 (1956): 637.
[14.] Eley, D.D., Pines, H. and Weisz, P.B. Advance in Catalysis Vol.
38 (1992): 1.
[15.] Vercesi, G. et al. Characterization of DSA-type oxygen
evolving electrodes. Choice of base metal. Thermochimica
Acta Vol. 176 (1991): 31-47.
[16.] Comninellis, C. and Vercesi, G. P. Characterization of DSA®-
type oxygen evolving electrodes. Choice of a Coating.
Journal of Applied Electrochemistry Vol. 21(1991): 335-
345.
[17.] Comninellis, C. and Nerini, A. Anodic oxidation of phenol in
the presence of NaCl for wastewater treatment. Journal of
Applied Electrochemistry Vol. 25 (1995): 23-28.
169
[18.] Diniz, A. V. et al. Efficiency study of perforated diamond
electrodes for organic compounds oxidation process.
Diamond and Related Materials Vol. 12 (2003): 577–582.
[19.] Panizza, M. and Cerisola, G. Application of diamond electrodes
to electrochemical processes. Electrochimica Acta Vol. 51
(2005): 191–199.
[20.] Fernandes, A., et al. Electrochemical degradation of C. I. Acid
Orange 7. Dyes and Pigments Vol. 61 (2004): 287–296.
[21.] Morão, A., Lopes, A. Pessoa de Amorimb, M. T. and
Gonçalves, I. C. Degradation of mixtures of phenols using
boron doped diamond electrodes for wastewater treatment.
Electrochimica Acta Vol. 49 (2004): 1587–1595.
[22.] Lissens, G., et al. Electrochemical degradation of surfactants by
intermediates of water discharge at carbon-based
electrodes. Electrochimica Acta Vol. 48 (2003): 1655-
1663.
[23.] Stucki, S., Kötz, R., Carcer, B. and Suter, W. Electrochemical
waste water treatment using high overvoltage anodes Part
II: Anode performance and applications. Journal of
Applied Electrochemistry Vol. 21(1991): 99-104.
[24.] Cañizares, P. et al. Electrochemical treatment of 2,4-
dinitrophenol aqueous wastes using boron-doped diamond
anodes: Part II. Influence of waste characteristics and
operating conditions. Electrochimica Acta Vol. 49 (2004):
4641-4650.
[25.] Couper, A.M., Pletcher, D. and Walsh, F. C. Electrode materials
for electrosynthesis. Chemical Reviews Vol. 90 (1990):
837-865.
170
[26.] Makgae, M. E. et al. Preparation and surface characterization of
Ti/SnO2–RuO2–IrO2 thin films as electrode material for
the oxidation of phenol. Material Chemistry and Physics
Vol. 92 (2005): 559-564.
[27.] Kötz, R., Stucki, S. and Capcer, B. Electrochemical Waste
Water Treatment Using High Overvoltage Anodes. Part I:
Physical and Electrochemical Properties of SnO2 Anodes.
Journal of Applied Electrochemistry Vol. 21 (1991): 14-
20.
[28.] Pierson, H. O. Handbook of chemical vapor deposition (CVD):
principles technology and applications. New Jersey, USA:
Noyes Publications, 1992.
[29.] Rantala, T. T., Rantala, T. S., and Lantto, V. Electronic
structure of SnO2 (110) surface. Materials Science in
Semiconductor Processing Vol. 3 (2000): 103-107.
[30.] Ruske, M., et al. Properties of SnO2 films prepared by DC and
MF reactive sputtering. Thin Solid Films Vol. 351 (1999):
146-150.
[31.] Vergnes, H. INPT-ENSIACET, Private contact.
[32.] Liu, Y., Li, Z. and Li, J. IrO2/SnO2 electrodes: prepared by sol–
gel process and their electrocatalytic for pyrocatechol.
Acta Materialia Vol. 52 (2004): 721-727.
[33.] Patil, P. S. Versatility of chemical spray pyrolysis. Material
Chemistry and Physics Vol. 59 (1999): 185-198.
[34.] Lampkin, C. M. Aerodynamics of nozzles used in spray
pyrolysis. Progress in Crystal Growth and
Characterization Vol. 1 (1979): 405-416.
[35.] Ohring, M. The materials science of thin films: deposition and
structure. California, U.S.A: Academic Press, 2002.
171
[36.] Stringfellow, G. B. Fundamental aspects of organometallic
vapor phase epitaxy. Materials Science and Engineering:
B Vol. 87 (2001): 97-116.
[37.] Manasevit, H. M. and Simpson, W. I. Single-Crystal Silicon on
a Sapphire Substrate. Journal of Applied Physics Vol. 35
(1964): 1349-1351.
[38.] Schuegraf, K. K. Handbook of thin-film deposition processes
and techniques: principles, methods equipment and
applications. New Jersey, USA: Noyes Publications, 1988.
[39.] Ghandhi, S. K. and Bhat, I. B. Organometallic Vapor Phase
Epitaxy: Features, Problems, New Approaches. MRS
Bulletins Vol. 13 (1988): 37-43.
[40.] Amjoud, M’B., Maury, F., Soukane, S. and Duverneuil, P.
Making of Specific Electrodes by CVD. Surface and
Coatings Technology Vol. 100-101 (1998): 169-172.
[41.] Duverneuil, P. et al. Chemical vapor deposition of SnO2
coatings on Ti plates for the preparation of electrocatalytic
anodes. Surface and Coatings Technology Vol. 151-152
(2002): 9-13.
[42.] Kaminori, T. and Mizuhashi, M. CVD of SnO2 films from
organotin compounds. Proceedings of the 8th International
Conference on Chemical Vapor Deposition. 1981,
Gouvieux-Chantilly, France.
[43.] Amjoud, M., Maury, F. and Elaatmani, M. Metalorganic
chemical vapor deposition of SnO2 thin films using
tetraethyltin: Growth and characterization. Annales de
Chimie Science des Matériaux Vol. 23 (1998) : 355-358.
172
[44.] Bertrand, N. Elaboration d'électrodes volumiques par dépôt
CVD de dioxyde d'étain. Thèse de doctorat. Génie des
procédés et de l'environnement. Institut National
Polytechnique de Toulouse, Toulouse, France, 2001.
[45.] Chi, Y. et al., Volatile noble metal organometallic complexes.
U.S. Patent No. 20050033075A1, 2005.
[46.] Dey, S. K. et al. Preparation of iridium films by liquid source
metalorganic chemical vapor deposition. Japanese Journal
of Applied Physics Vol. 38 (1999): L1052-L1054.
[47.] Chen, Y. L., Deposition of iridium thin films using new IrI CVD
precursors. Chemical Vapor Deposition Vol. 8 (2002): 17-
20.
[48.] Sun, Y. M. Precursor chemistry and film growth with
(methylcyclopentadienyl) (1,5-cyclooctadiene) iridium.
Journal of Vacuum Science & Technology: A Vol. 18
(2000): 10-16.
[49.] Chen, R. S., Growth control and characterization of vertically
aligned IrO2 nanorods. Journal of Materials Chemistry
Vol. 13 (2003): 2525-2529.
[50.] Chen, R. S., Growth of IrO2 films and nanorods by means of
CVD: An example of compositional and morphological
control of nanostructures. Chemical Vapor Deposition Vol.
9 (2003): 301-305.
[51.] Sun, Y. M., Iridium film growth with iridium tris-
acetylacetonate: Oxygen and substrate effects. Thin Solid
Films Vol. 346 (1999): 100-107.
173
[52.] Hoke, J. B., Stern, E. W. and Murray, H. H., Low-temperature
vapour deposition of high-purity iridium coatings from
cyclooctadiene complexes of iridium. Synthesis of a novel
liquid iridium chemical vapour deposition
precursor. Journal of Materials Chemistry Vol. 1 (1991):
551-554.
[53.] Xu, C., Baum, T. H. and Rheingold, A. L. New Precursors for
Chemical Vapor Deposition of Iridium. Chemistry of
Materials Vol. 10 (1998): 2329–2331.
[54.] Norton, T. and Sun, D. W. Computational fluid dynamics
(CFD)-an effective and efficient design and analysis tool
for the food industry: A review. Trend in Food Science &
Technology Vol. 17 (2006): 600-620.
[55.] Richardson, L. F. The approximate arithmetical solution by
finite differences of physical problems involving
differential equations, with an application to the stresses in
a masonry dam. Philosophical Transactions of the Royal
Society of London, Series A Vol. 210 (1910): 307–357.
[56.] Courant, R., Friedrichs, K. and Lewy, H. Die partiellen
differenzengleichungen der mathematischen Physik.
Mathematische Annalen Vol. 100 (1928): 32–74.
[57.] Shang, J. S. Three decades of accomplishments in
computational fluid dynamics. Progress in Aerospace
Sciences Vol. 40 (2004):173–197.
[58.] Xia, B. and Sun, D. W. Applications of computational fluid
dynamics (CFD) in the food industry: a review.
Computers and Electronics in Agriculture Vol. 34 (2002):
5–24.
174
[59.] Abdul Ghani, A. G., Farid, M. M., Chen, X. D. and Richards, P.
Numerical simulation of natural convection heating of
canned food by computational fluid dynamics. Journal of
Food Engineering Vol. 41 (1999): 55–64.
[60.] Ferziger, H. and Peric, M. Computational methods for fluid
dynamics. Berlin/Heidelberg, Germany: Springer-Verlag,
2002.
[61.] Foster, A. M., Barrett, R., James, S. J. and Swain, M. J.
Measurement and prediction of air movement through
doorways in refrigerated rooms. International Journal of
Refrigeration Vol. 25 (2002): 1102–1109.
[62.] Versteeg, H. K. and Malalsekeera, W. An introduction to
computational fluid dynamics. Harlow, UK: Longman
Group Ltd, 1995.
[63.] Patankar, S.V. and Spalding, D.B. A calculation procedure for
heat, mass and momentum transfer in three-dimensional
parabolic flows. International Journal for Heat and Mass
Transfer Vol. 15 (1972): 1787–1806.
[64.] Ferry, M. New features of the MIGAL solver. In Proceedings of
the 9th PHOENICS user conference. Moscow, Russia:
Moscow Power Engineering Institute, 2002: 1–23.
[65.] Foster, A. M., Madge, M. and Evans, J. A. The use of CFD to
improve the performance of a chilled multi-deck retail
display cabinet. International Journal of Refrigeration Vol.
28 (2005): 698–705.
175
[66.] Kopyt, P. and Gwarek, W. A comparison of commercial CFD
software capable of coupling to external electromagnetic
software for modeling of microwave heating process. In
Proceedings of the 6th seminar in computer modeling and
microwave power engineering, Austin, Texas, USA:
Worcester Polytechnic Institute, Worcester, 2004: 33–39.
[67.] Fluent Inc. FLUENT® 6.0 User’s Guide. New Hamshire, USA:
2001.
[68.] Fluent Inc. CVD Reactor Design [Online].2007 Available from
http://www.fluent.com/solutions/examples/x64.htm [2007,
Sep 24]
[69.] Bryne, J. A. et al. Immobilisation of TiO2 Powder for the
Treatment of Polluted Water. Applied Catalysis B:
Environmental Vol. 17 (1998): 25-36.
[70.] Kesselman, J.M. et al. Electrochemical production of hydroxyl
radical at polycrytalline Nb-doped TiO2 electrode and
estimation of the partitioning between hydroxyl radical
and direct hole oxidation pathways. Journal of Physical
Chemistry: B Vol. 101 (1997): 2637-2643.
[71.] Fluent Inc. Modeling Surface Chemistry. In FLUENT® 6.2
Tutorial. New Hamshire, USA: 2005.
[72.] Greenberg, A. E., Clesceri, L.S. and Eaton, A. D. Standard
methods for the examination of water and wastewater.
Washington, D.C., USA: American Public Health
Association, 1992.
[73.] Sun, Y. M. et al. Precursor chemistry and film growth with
(methylcyclopentadienyl) (1,5-cyclooctadiene) iridium.
Journal of Vacuum Science & Technology: A Vol. 18
(2000): 10-16.

176
[74.] Endle, J. P. et al. Iridium precursor pyrolysis and oxidation
reactions and direct liquid injection chemical vapor
deposition of iridium films. Thin Solid Films: Vol. 388
(2001): 126-133.

Appendices

Appendix A
Standard methods for the examination of
water and wastewater [72]
1. Chemical oxygen demand (COD)
1.1 Introduction
The chemical oxygen demand (COD) is used as a measure of the
oxygen equivalent of the organic matter content of a sample that is
susceptible to oxidation by a strong chemical oxidant. For samples from a
specific source, COD can be related empirically to BOD, organic carbon,
or organic matter. The test is useful for monitoring and control after
correlation has been established. The dichromate reflux method is
preferred over procedures using other oxidants because of superior
oxidizing ability, applicability to a wide variety of samples, and ease of
manipulation. Oxidation of most organic compounds is 95 to 100% of the
theoretical value. Pyridine and related compounds resist oxidation and
volatile organic compounds are oxidized only to the extent that they
remain in contact with the oxidant. Ammonia, present either in the waste
or liberated from nitrogen-containing organic matter, is not oxidized in
the absence of significant concentration of free chloride ions.
180
1.2 Closed reflux with titrimetric method
1.2.1 Principle
Most types of organic matter are oxidized by a boiling mixture of
chromic and sulfuric acids. A sample is refluxed in strongly acid solution
with a known excess of potassium dichromate (K2Cr2O7). After digestion,
the remaining unreduced K2Cr2O7 is titrated with ferrous ammonium
sulfate to determine the amount of K2Cr2O7 consumed and the oxidizable
organic matter is calculated in terms of oxygen equivalent. Keep ratios of
reagent weight, volumes, and strengths constant when sample volumes
other than 50 ml are used. The standard 2 hr reflux time may be reduced
if it has been shown that a shorter period yields the same results.
1.2.2 Interferences and limitations
Volatile organic compounds are more completely oxidized in the
closed system because of longer contact with oxidant. Before each use
inspect culture-tube caps for breaks in the TFE liner. Select culture-tube
size for the degree of sensitivity desired. Use the 25 mm x 150 mm tube
for samples with low COD content because a larger volume sample can
be treated.
1.2.3 Apparatus
1. Digestion vessels preferably use borosilicate culture tubes, 16 mm
x 100 mm, 20 mm x 150 mm, or 25 mm x 150 mm, with TFE-lined
screw caps. Alternatively, use borosilicate ampules, 10 ml
capacity, 19 to 20 mm diameter.
2. Heating block, cast aluminium, 45 to 50 mm deep, with holes sized
for close fit of culture tubes or ampules.
181
3. Block heater or oven, to operate at 150 ± 2 °C. Severe damage of
most culture tube closures from oven digestion introduces a
potential source of contamination and increases the probability of
leakage. Use an oven for culture-tube digestion only when it has
been determined that 2 hr exposure at 150 °C will not damage the
caps.
4. Ampule sealer: Use only a mechanical sealer to insure stronger,
consistent seals.
1.2.4 Reagents
1. Standard potassium dichromate digestion solution, 0.0167M: Add
to about 500 ml distilled water 4.913 g K2Cr2O7, primary standard
grade, previously dried at 103 °C for 2 hr, 167 ml concentrated
H2SO4 and 33.3 g HgSO4. Dissolve, cool to room temperature and
dilute to 1000 ml.
2. Sulfuric acid reagent.
3. Ferroin indicator solution.
4. Standard ferrous ammonium sulfate titrant (FAS), approximately
0.10M: Dissolve 39.2 g Fe(NH4)2(SO4)2.6H2O in distilled water.
Add 20 ml concentrated H2SO4, cool, and dilute to 1000 ml.
Standardize solution daily against standard K2Cr2O7 digestion
solution.
10.0,
,OCrK0167.0 722 x
mltitrationinusedFASVolumemltitratedsolutionMVolume
solutionFASofMolarity = (A-1)
5. Sulfamic acid.
6. Potassium hydrogen phthalate standard.
182
1.2.5 Procedure
Wash culture tubes and caps with 20% H2SO4 before first use to
prevent contamination. Refer to Table A. 1 for proper sample and reagent
volumes. Place sample in culture tube or ampule and add digestion
solution. Carefully run sulfuric acid reagent down inside of vessel so an
acid layer is formed under the sample digestion solution layer. Tightly
cap tubes or seal ampules, and invert each several times to mix
completely.
CAUTION: Wear face shield and protect hands from heat produced when
contents of vessels are mixed. Mix thoroughly before applying heating
heat to prevent local heating of vessel bottom and possible explosive
reaction.
Place tubes or ampules in block digester or oven preheated to 150
°C and reflux for 2 hr. Cool to room temperature and place vessels in test
tube rack. Remove culture tubes caps and add small TFE-covered
magnetic stirring bar. If ampules are used, transfer contents to a larger
container for titrating. Add 0.05 to 0.10 ml (1 to 2 drops) ferroin indicator
and stir rapidly on magnetic stirrer while titrating with 1.10M FAS. The
end point is a sharp color change from blue-green to reddish brown,
although the blue-green may reappear within minutes. In the same
manner reflux and titrate a blank containing the reagents and a volume of
distilled water equal to that of the sample.
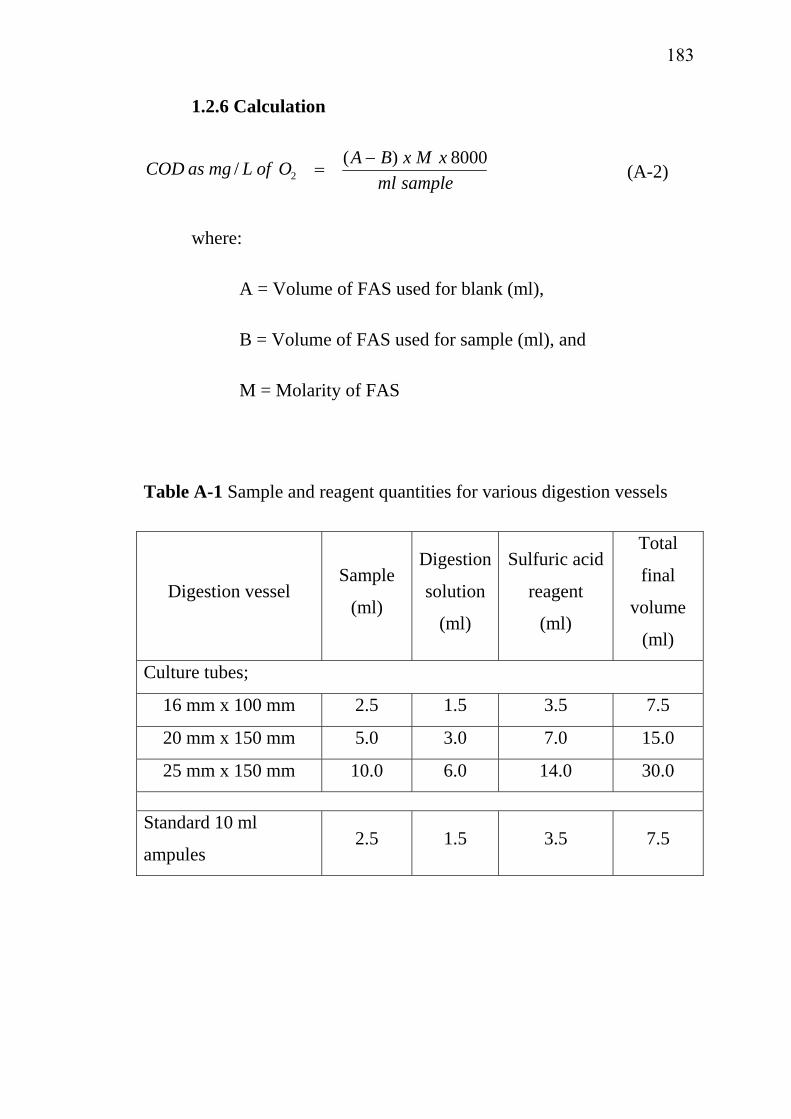
183
1.2.6 Calculation
samplemlxMxBAOofLmgasCOD 8000)(/ 2
−= (A-2)
where:
A = Volume of FAS used for blank (ml),
B = Volume of FAS used for sample (ml), and
M = Molarity of FAS
Table A-1 Sample and reagent quantities for various digestion vessels
Digestion vessel Sample
(ml)
Digestion
solution
(ml)
Sulfuric acid
reagent
(ml)
Total
final
volume
(ml)
Culture tubes;
16 mm x 100 mm 2.5 1.5 3.5 7.5
20 mm x 150 mm 5.0 3.0 7.0 15.0
25 mm x 150 mm 10.0 6.0 14.0 30.0
Standard 10 ml
ampules 2.5 1.5 3.5 7.5
184
1.2.7 Precision and Bias
Sixty synthetic samples containing potassium hydrogen phthalate
and NaCl were tested by six laboratories. At an average COD of 195 mg
O2/L in the absence of chloride, the standard deviation was ± 11 mg O2/L
(coefficient of variation, 5.6%). At an average COD of 208 mg O2/L and
100 mg Cl-/L, the standard deviation was ± 10 mg O2/L (coefficient of
variation, 4.8 %).
2. Total organic carbon (TOC)
2.1 Introduction
The organic carbon in water and wastewater is composed of a
variety of organic compounds in various oxidation states. Some of these
carbon compounds can be oxidized further by biological or chemical
processes, and the biochemical oxygen demand (BOD) and chemical
oxygen demand (COD) may used to characterize these fractions. The
presence of organic carbon that does not respond to either the BOD or
COD test makes them unsuitable for the measurement of total organic
carbon. Total organic carbon (TOC) is a more convenient and direct
expression of total organic content than either BOD or COD, but does not
provide the same kind of information. If a repeatable empirical
relationship is established between TOC and BOD or COD, then TOC
can be used to estimate the accompanying BOD or COD. This
relationship must be established independently for each set of matrix
conditions, such as various points in a treatment process. Unlike BOD or
COD, TOC is independent of the oxidation state of the organic matter and
185
does not measure other organically bound elements such as nitrogen and
hydrogen, and inorganics that can contribute to the oxygen demand
measured by BOD and COD. TOC measurement does not replace BOD
and COD testing.
To determine the quantity of organically bound carbon, the organic
molecules must be broken down to single carbon units and converted to a
single molecular form that can be measured quantitatively. TOC methods
utilize heat and oxygen, ultraviolet irradiation, chemical oxidants, or
combinations of these oxidants to convert organic carbon to carbon
dioxide (CO2). The CO2 may be measured directly by a nondispersive
infrared analyzer, it may be reduced to methane and measured with a
flame ionization detector, or CO2 may be titrated chemically.
2.2 Combustion-infrared Method
The combustion-infrared method has been used for a wide variety
of samples, but its accuracy is dependent on particle size reduction
because it uses small-orifice syringes.
2.2.1 Principle
The sample is homogenized and diluted as necessary and a
microportion is infected into a heated reaction chamber packed with an
oxidative catalyst such as cobalt oxide. The water is vaporized and the
organic carbon is oxidized to CO2 and H2O. The CO2 from oxidation of
organic and inorganic carbon is transported in the carrier gas streams and
is measured by means of a non-dispersive infrared analyzer.
Because total carbon is measured, IC must be measured separately
and TOC obtained by difference.
186
Measure IC by injecting the sample into a separate reaction
chamber packed with phosphoric acid coated quartz beads. Under the
acidic conditions, all IC is converted to CO2, which is measured. Under
these conditions organic carbon is not oxidized and only IC is measured.
Alternatively, convert inorganic carbonates to CO2 with acid and
remove the CO2 by purging before sample injection. The sample contains
only the NPOC fraction of total carbon; a VOC determination also is
necessary to measure true TOC.
2.2.2 Interference
Removal of carbonate and bicarbonate by acidification and purging
with purified gas results in the loss of volatile organic substances. The
volatiles also can be lost during sample blending, particularly if the
temperature is allowed to rise. Another important loss can occur if large
carbon-containing particles fail to enter the needle used for injection.
Filtration, although necessary to eliminate particulate organic matter
when only DOC is to be determined, can result in loss or gain of DOC,
depending on the physical properties of the carbon-containing compounds
and the adsorption of carbonaceous material on the filter, or its
desorprtion from it. Check filters for their contribution to DOC by
analyzing a filtered blank. Note that any contact with organic material
may contaminate a sample. Avoid contaminated glassware, plastic
containers, and rubber tubing. Analyze treatment, system, and reagent
blanks.
2.2.3 Minimum detectable concentration
1 mg carbon/L this can be achieved with most combustion-infrared
analyzers although instrument performance varies. The minimum
187
detectable concentration may be reduced by concentrating the sample, or
by increasing the portion taken for analysis.
2.2.4 Sampling and storage
Collect and store samples in amber glass bottles with TFE-lined cap.
Before use, wash bottles with acid, seal with aluminum foil, and bake at
400 °C for at least 1 h. Wash TFE septa with detergent, rinse repeatedly
with organic-free water, wrap in aluminum foil, and bake at 100 °C for 1
h. Preferable use thick silicone rubber-backed TFE septa with open ring
caps to produce a positive seal. Because the detection limit is relatively
high, less rigorous cleaning may be acceptable; use bottle blanks with
each set of samples. Use a Kemmerer or similar type sampler for
collecting samples from a depth exceeding 2 m. Preserve samples that
cannot be examined immediately by holding at 4 °C with minimal
exposure to light and atmosphere. Acidification with phosphoric or
sulfuric acid to a pH ≤ 2 at the time of collection is especially desirable
for unstable samples, and may be used on all samples; acid preservation,
however, requires that inorganic carbon subsequently is purged before
analysis.
2.2.5 Apparatus
1. Total organic carbon analyzer, Shimadzu TOC-5050A.
2. Syrings: 0 to 50 μl, 0 to 200 μl, 0 to 500 μl, and 0 to 1 ml capacity.
3. Sample blender or homogenizer.
4. Magnetic stirrer and TFE-coated stirring bars.
5. Filtering apparatus and 0.45-μm-pore-diameter filters.
188
2.2.6 Reagents
1. Reagent water, prepare blanks and standard solutions from carbon-
free water; preferable use carbon-filtered, redistilled water.
2. Concentrated phosphoric acid, H3PO4. Alternatively use sulfuric
acid, H2SO4, but not hydrochloric acid.
3. Organic carbon stock solution: dissolve 2.1254 g anhydrous
potassium biphthalate, C8H5KO4, in carbon free water and dilute to
1000 ml; 1.00 ml = 1.00 mg carbon. Alternatively, use any other
organic carbon-containing compound of adequate purity, stability,
and water solubility. Preserve by acidifying with H3PO4 or H2SO4
to pH ≤ 2.
4. Inorganic carbon stock solution: dissolve 4.4122 g anhydrous
sodium carbonate, Na2CO3, in water, add 3.497 g anhydrous
sodium bicarbonate, NaHCO3, and dilute to 1000 ml; 1.00 ml =
1.00 mg carbon. Alternatively, use any other inorganic carbonate
compound of adequate purity, stability, and water solubility. Keep
tightly stoppered.
5. Carrier gas: purified oxygen or air, CO2-free and containing less
than 1 ppm hydrocarbon (as methane).
6. Purging gas: Any gas free of CO2 and hydrocarbons.
2.2.7 Procedure
1. Instrument operation: Follow manufacturer’s instructions for
analyzer assembly, testing, calibration, and operation. Adjust to
optimum combustion temperature (900 °C) before using
instrument; monitor temperature to insure stability.
2. Sample treatment: If a sample contains gross solids or insoluble
matter, homogenize until satisfactory replication is obtained.
189
Analyze a homogenizing blank consisting of reagent water carried
through the homogenizing treatment.
If inorganic carbon must be removed before analysis, transfer a
representative portion of 10 to 15 ml to a 30 ml beaker, add conc H3PO4
to reduce pH to 2 or less, and purge with gas for 10 min. Do not use
plastic tubing. Inorganic carbon also may be removed by stirring the
acidified sample in a beaker while directing a stream of purified gas into
the beaker. Because volatile organic carbon will be lost during purging of
the acidified solution, report organic carbon as total nonpurgeable organic
carbon.
If the available instrument provides for a separate determination of
inorganic carbon (carbonate, bicarbonate, free CO2) and total carbon,
omit decarbonation and proceed according to the manufacturer’s
directions to determine TOC by difference between TC and IC.
If dissolved organic carbon is to be determined, filter sample
through 0.45-μm-pore-diameter filter with vacuum; analyze a filtering
blank.
3. Sample injection: Withdraw a portion of prepared sample using a
syringe fitted with a blunt-tipped needle. Select sample volume
according to manufacturer’s direction. Stir samples containing
particulates with a magnetic stirrer. Select needle size consistent
with sample particulate size. Inject samples and standards into
analyzer according to manufacturer’s directions and record
response. Repeat injection until consecutive peaks are obtained that
are reproducible to within ±10%.
190
4. Preparation of standard curve: Prepare standard organic and
inorganic carbon series by diluting stock solutions to cover the
expected range in samples, Inject and record peak height or area of
these standards and a dilution water blank. Plot carbon
concentration in milligrams per liter against corrected peak height
or area on rectangular coordinate paper. This is unnecessary for
instruments provided with a digital readout of concentration. If
desirable, prepare a standard curve having concentrations of 1 to 10
mg/L by making appropriate dilutions of the standards.
With most TOC analyzers, it is not possible to determine separate
blanks for reagent water, reagents and the entire system. In addition,
some TOC analyzers produce a variable and erratic blank that cannot be
corrected reliable. In many laboratories, reagent water is the major
contributor to the blank value. Correcting only the peak heights of
standards (which contain reagent water + reagents + system blank) crates
a positive error, while also correcting samples (which contain only
reagents and system blank contributions) for the reagent water blank
creates a negative error. Minimize errors by using reagent water and
reagents low in carbon.
Inject samples and procedural blanks (consisting of reagent water
taken through any pre-analysis steps-values are typically higher than
those for reagent water) and determine sample organic carbon
concentrations by comparing corrected peak heights to the calibration
curve.
191
2.2.8 Calculations
1. When reagent water is a major portion of the total blank:
- Calculate corrected peak height of standards by subtracting the
reagent-water blank peak height from the standard peak heights
- Prepare a standard curve of corrected peak height vs. TOC
concentration.
- Subtract the procedural blank from each sample peak height and
compare to the standard curve to determine carbon content.
NOTE: There will be a positive error if the TOC of the reagent water is
significant in comparison to the TOC of the sample. Make a special effort
to obtain carbon-free reagent water.
- Apply the appropriate dilution factor when necessary.
- Subtract the inorganic carbon from the total carbon when TOC is
determined by difference.
2. When reagent water is a minor portion of the total blank:
- Calculate corrected peak height of standards and samples by
subtracting the reagent-water blank peak height from the standard and
sample peak heights.
- Prepare a standard curve of corrected peak height vs. TOC
concentration.
- Subtract the procedural blank from each sample peak height and
compare to the standard curve to determine the carbon content. Values
192
will have a negative error equal to the blank contribution from the reagent
water.
- Apply the appropriate dilution factor when necessary.
- Subtract the inorganic carbon from the total carbon when TOC is
determined by difference.
NOTE: If the TOC analyzer design permits isolation of each of the
contributions to the total blank, apply appropriate blank corrections to
peak heights of standards (reagent blank, water blank, system blank) and
sample (reagent blank and system blank).
Appendix B
Simulation steps of MOCVD using FLUENT®
In chemically reacting laminar flows, such as those encountered in
chemical vapor deposition (CVD) applications, accurate modeling of
time-dependent hydrodynamics, heat and mass transfer and chemical
reactions is very important. The surface reactions are considered.
Modeling the reactions taking place at gas-solid interfaces is complex and
involves several elementary physico-chemical processes like adsorption
of gas-phase species on the surface, chemical reactions occurring on the
surface and desorption of gases from the surface back to the gas phase.
The steps of working with FLUENT® for simulation the growth of
Ir film by MOCVD are listed:
Step 1: Geometry and grid generation
The geometry and grid of the hot-wall CVD used in Ir film
deposition was generated by using GAMBIT.
Step 2: Start the FLUENT®
The FLUENT® was started with solver for 3D modeling.
Step 3: Import of grid
The geometry and grid of the reactor was imported by using
command;
File → Read → Case…
194
Step 4: Check for the grid;
Grid → Check…
The grid check lists the minimum and maximum x, y and z values
from the grid and reports on a number of other grid features that are
checked. Any errors in the grid would be reported.
Step 5: Define the solver default:
Choose the basic equations to be solved: laminar or turbulent,
chemical species or reaction, heat transfer models etc.
Define → Models → Solver…
Enable heat transfer by activating the energy equation;
Define → Models → Energy…
Enable chemical species transport and reaction;
Define → Models → Species → Transport & Reaction…
Step 6: Define the materials:
Define → Materials…
Create and specify the material properties of the gas-phase species,
the site species and the solid species. Set up the mixture reaction and
reaction mechanisms.
Step 7: Specify the operating conditions:
Define → Operating Conditions…
195
Step 8: Specify the boundary conditions:
Define → Boundary Conditions…
Step 9: Adjust the solution control parameters:
Solve → Controls → Solution…
Step 10: Initialize the flow field:
Initialize the flow field using the boundary conditions set at
velocity-inlet;
Solve → Initialize…
Turn on residual plotting during the calculation:
Solve → Monitor → Residual…
Step 11: Calculate for a solution:
Start the calculation by requesting the number of iterations;
Solve → Iterate…
Step 12: Examine the results:
The simulation results should be displayed in various formats such
as contour, vector and XY plot, etc.

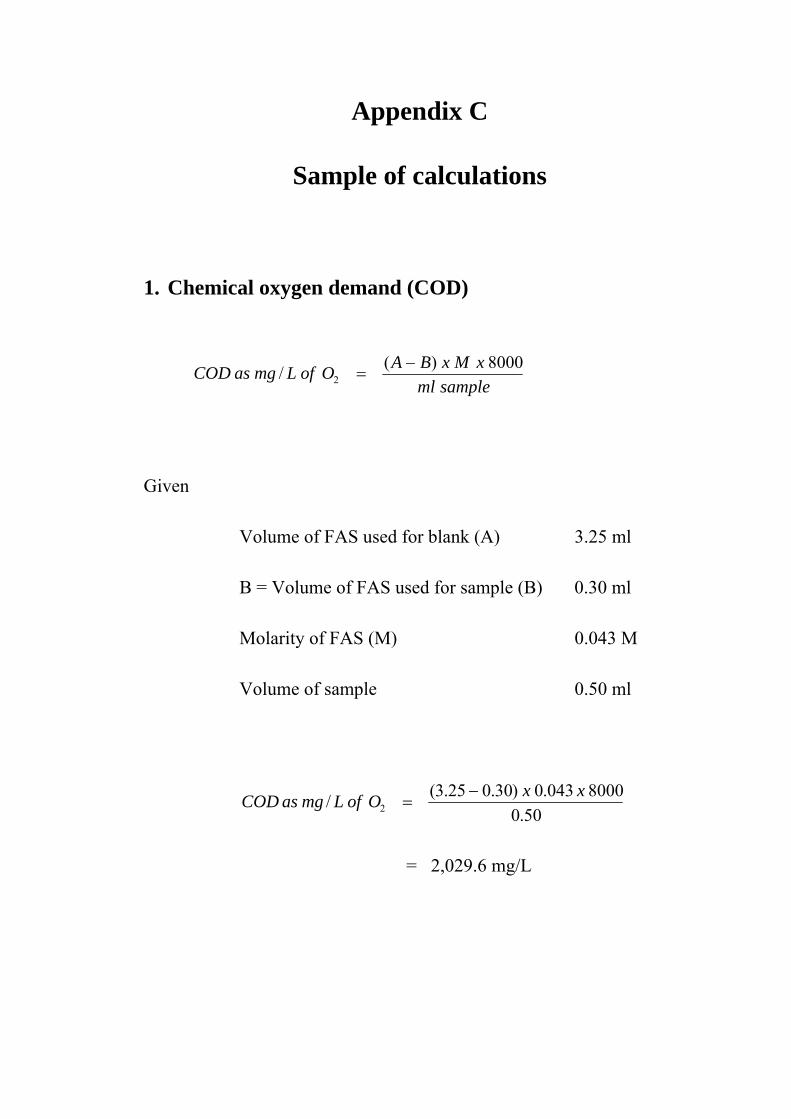
Appendix C
Sample of calculations
1. Chemical oxygen demand (COD)
samplemlxMxBAOofLmgasCOD 8000)(/ 2
−=
Given
Volume of FAS used for blank (A) 3.25 ml
B = Volume of FAS used for sample (B) 0.30 ml
Molarity of FAS (M) 0.043 M
Volume of sample 0.50 ml
50.08000043.0)30.025.3(/ 2
xxOofLmgasCOD −=
= 2,029.6 mg/L
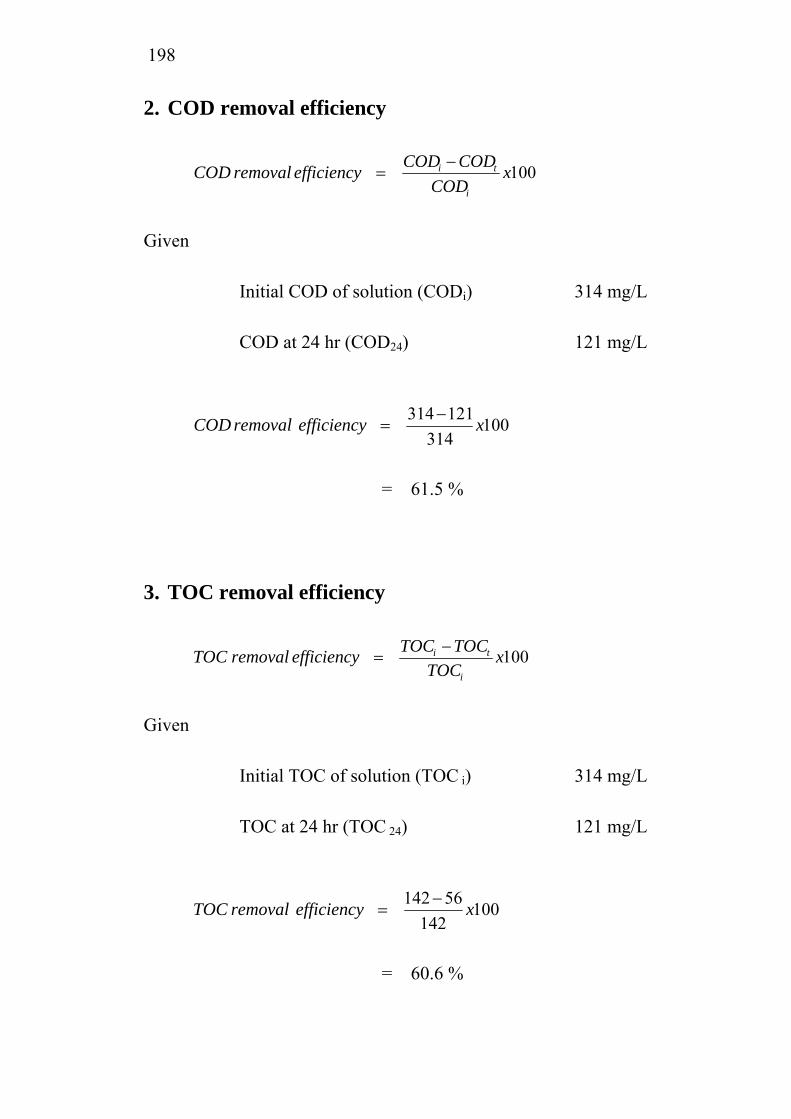
198
2. COD removal efficiency
100xCOD
CODCODefficiencyremovalCODi
ti −=
Given
Initial COD of solution (CODi) 314 mg/L
COD at 24 hr (COD24) 121 mg/L
100314
121314 xefficiencyremovalCOD −=
= 61.5 %
3. TOC removal efficiency
100xTOC
TOCTOCefficiencyremovalTOCi
ti −=
Given
Initial TOC of solution (TOC i) 314 mg/L
TOC at 24 hr (TOC 24) 121 mg/L
100142
56142 xefficiencyremovalTOC −=
= 60.6 %
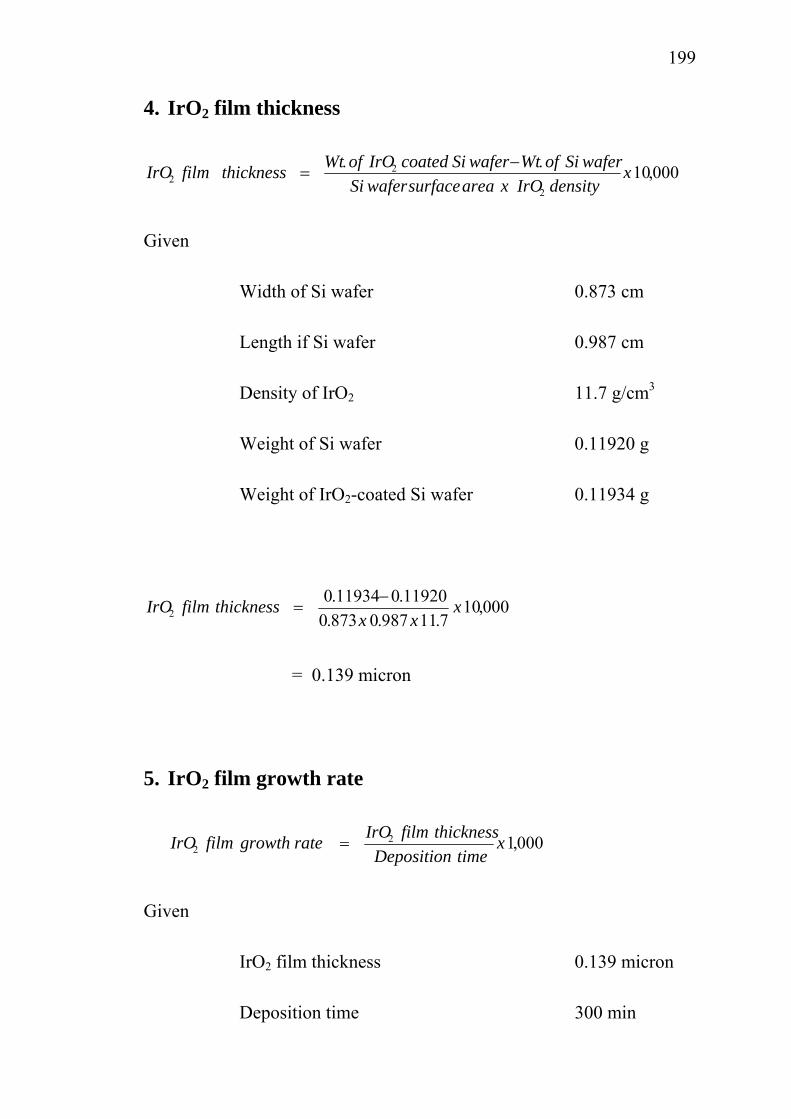
199
4. IrO2 film thickness
000,10..2
22 x
densityIrOxareasurfacewaferSiwaferSiofWtwaferSicoatedIrOofWtthicknessfilmIrO −
=
Given
Width of Si wafer 0.873 cm
Length if Si wafer 0.987 cm
Density of IrO2 11.7 g/cm3
Weight of Si wafer 0.11920 g
Weight of IrO2-coated Si wafer 0.11934 g
000,107.11987.0873.0
11920.011934.02 x
xxthicknessfilmIrO −
=
= 0.139 micron
5. IrO2 film growth rate
000,122 x
timeDepositionthicknessfilmIrOrategrowthfilmIrO =
Given
IrO2 film thickness 0.139 micron
Deposition time 300 min
200
000,1300139.0
2 xrategrowthfilmIrO =
= 0.46 nm/min
6. Ir film thickness
000,10.. xdensityIrxareasurfacewaferSi
waferSiofWtwaferSicoatedIrofWtthicknessfilmIr −=
Given
Width of Si wafer 0.819 cm
Length if Si wafer 0.878 cm
Density of Ir 22.65 g/cm3
Weight of Si wafer 0.10177 g
Weight of Ir-coated Si wafer 0.10185 g
000,1065.22878.0819.0
10177.010185.0 xxx
thicknessfilmIr −=
= 0.049 micron
201
7. Ir film growth rate
000,1xtimeDeposition
thicknessfilmIrrategrowthfilmIr =
Given
Ir film thickness 0.049 micron
Deposition time 270 min
000,1270049.0 xrategrowthfilmIr =
= 0.18 nm/min
8. SnO2 film thickness
000,10..2
22 x
densitySnOxareasurfacewaferSiwaferSiofWtwaferSicoatedSnOofWtthicknessfilmSnO −
=
Given
Width of Si wafer 0.690 cm
Length if Si wafer 0.755 cm
Density of SnO2 7 g/cm3
Weight of Si wafer 0.07444 g
Weight of SnO2-coated Si wafer 0.07536 g
202
000,107755.0690.0
07444.007536.02 x
xxthicknessfilmSnO −
=
= 2.52 micron
9. SnO2 film growth rate
000,122 x
timeDepositionthicknessfilmSnOrategrowthfilmSnO =
Given
SnO2 film thickness 2.52 micron
Deposition time 120 min
000,1120
52.22 xrategrowthfilmSnO =
= 21 nm/min
10. Power required
000,1xrateFlowvoltageCellxcurrentAppliedrequiredPower =
Given
Applied current 0.016 A
Cell voltage 14.9 V
Flow rate 9x10⁻⁶ m3/hr
203
000,11099.14016.0
6 xxxrequiredPower −=
= 26.5 kW-hr/m3
11. Treatment cost
tyElectricitxrequiredPowertTreatment coscos =
Given
Power required 26.5 kW-hr/m3
Electricity cost 2.5 Baht/kW-hr
5.25.26cos xtTreatment =
= 66.25 Baht/m3

205
Biography
Mr. Songsak Klamklang was born on March 12, 1975 in
Chainat Province, Thailand. He got his Bachelor of Engineering in
Chemical Engineering from Department of Chemical Engineering,
Faculty of Engineering, Kasetsart University in 1998. He got his
Master of Science in Chemical Technology from Department of
Chemical Technology, Faculty of Science, Chulalongkorn University
in 2000. Then, he had further persuade study and got his Doctor of
Philosophy in Chemical Technology from Chulalongkorn University
and Docteur de l’Institut National Polytechnique de Toulouse in
Chemical Engineering from Institut National Polytechnique de
Toulouse in 2007.


