NOVATECH 2010
1
Methodology Selection of Best Management Practices and Economic Analysis: A Case study in Quebec, Canada Méthodologie pour choisir les pratiques de gestion optimale et analyse économique: Une étude de cas au Québec, Canada Musandji FUAMBA*, Thomas WALLISER**, Mathurin DAYNOU* and Jean ROUSSELLE* *Ecole Polytechnique de Montreal **formerly École Nationale des Ponts et Chaussées
RÉSUMÉ Le présent article présente une méthodologie à suivre pour implanter des pratiques de gestion optimale (PGO) des eaux pluviales dans un secteur urbain. Cette méthodologie est testée dans une étude de cas choisi dans un secteur en développement résidentiel d’une municipalité québécoise. L’objectif principal de cet article est de montrer la faisabilité d’une implantation des PGO au Québec basée sur une double analyse: performance et économique. D’une part, l’analyse de la performance a permis de déterminer le gain hydrologique de chaque PGO par rapport à la pratique traditionnelle. Décrite seulement à titre indicatif, l’analyse économique sommaire a montré d’autre part que l’implantation de quelques PGO applicables au Québec sur la base d’objectifs précis de gestion intégrée et durable est réalisable et même rentable. Une analyse technique poussée reste toutefois nécessaire pour identifier et dimensionner toutes les PGO susceptibles d’améliorer les conditions de drainage urbain au Québec, de même qu’une analyse économique approfondie capable de préciser les coûts réels liés à l’investissement dans les nouvelles techniques.
ABSTRACT The paper describes a methodology to be used when planning to implement the Best Management Practices (BMP) in an urban sector. This methodology has been tested in a case study of a sector of residential development in a municipality of Quebec in Canada. The performance analysis, on one hand, makes possible the hydrologic gain of each BMP to be determined in comparison with traditional practices. The economic analysis, on the other hand, shows that the establishment of some BMP in Quebec, on the basis of a few identified objectives of sustainable stormwater management, is both feasible and beneficial. Nevertheless, an in-depth technical analysis is still necessary to identify and design the BMP that will be selected to improve the urban drainage in Quebec as well as a detailed economic analysis to determine the real costs involved in the investment of new techniques.
KEYWORDS Best Management Practices, Hydrologic performance, Sustainable stormwater management.
SESSION 3.2
2
1 INTRODUCTION Stormwater run-off is an important source of the degradation of the environment quality: erosion, flooding, possible reduction of water quality in creeks, rivers, lakes, or any water surface even for water table, etc. Erosion can result if the stormwater flow velocity is greater than the conveying velocity of the soil particles. Flooding arises when great volumes of stormwater cannot be controlled. As a result, water can invade streets, houses (basements), public and private lands. When stormwater flows through different areas, it may transport sediments, organic pollutants, oils and grease, salt from snow removal and pathogenic elements, all of which can to some extent reach the nearest water tables and water surfaces. Consequently, house owners may pay more in taxes to support government expenses for sustainable and optimized stormwater management. The government then has no choice but to implement new measures and techniques of stormwater runoff management and encourage people to use new methods to control the negative impacts of urban development. The new measures should be integrated into programs with clearly defined objectives in order to ensure that watershed goals are cooperatively met. Such programs will fall under water policies and by-laws. Disconnection of house gutters is an effective measure of reducing water volume carried to the municipal stormwater system (SS), and thus it reduces the cost of the latter.
Stormwater runoff considerations need to be integrated totally into the site planning and design processes. This involves a more comprehensive approach to site planning and a thorough understanding of the physical characteristics and resources of the site. This approach, normally called “integrated stormwater management planning”, treats stormwater as a resource to be protected and considers protection of property, aquatic resources, and water quality as complementary objectives. Ideally, stormwater is managed on a watershed basis, within the broad framework of land management and ecosystem planning or, at least, within a master drainage plan. This planning should be based on a hierarchy of principles which include pollution prevention, source controls, on-site (or lot-level) controls, conveyance controls, and end-of-pipe management practices (InfraGuide, 2003).
The insufficiencies in stormwater runoff observed in recent decades, the growing requirements of citizens, and the new challenges of sustainable development draw attention to the urgency for the province of Quebec to set up new integrated and sustainable stormwater management (Fuamba et al., 2009), similar to those existing in Minnesota (Barr Engineering, 2001; MSM, 2006), London (CIRIA, 1996), USA (EPA, 2004), Vancouver (GVRD, 2005), Calgary (Jaska, 2000) and Toronto (MOE, 2003;MOE, 2004). A provincial guide has just been finalized to help engineers, specialists in urbanism and the environment, and land managers to work together when managing urban stormwater runoff. This guide lists all potential BMP to be implemented in Quebec, based on source and on-site controls, along with criteria for selecting the most appropriate measures and techniques depending on the site and watershed characteristics. A description of BMP design methods and principles is also given, based on available approaches.
The following sections present the developed methodology to be used when implementing some BMP in Quebec and the application of this methodology to a selected case study related to a developing urban sector.
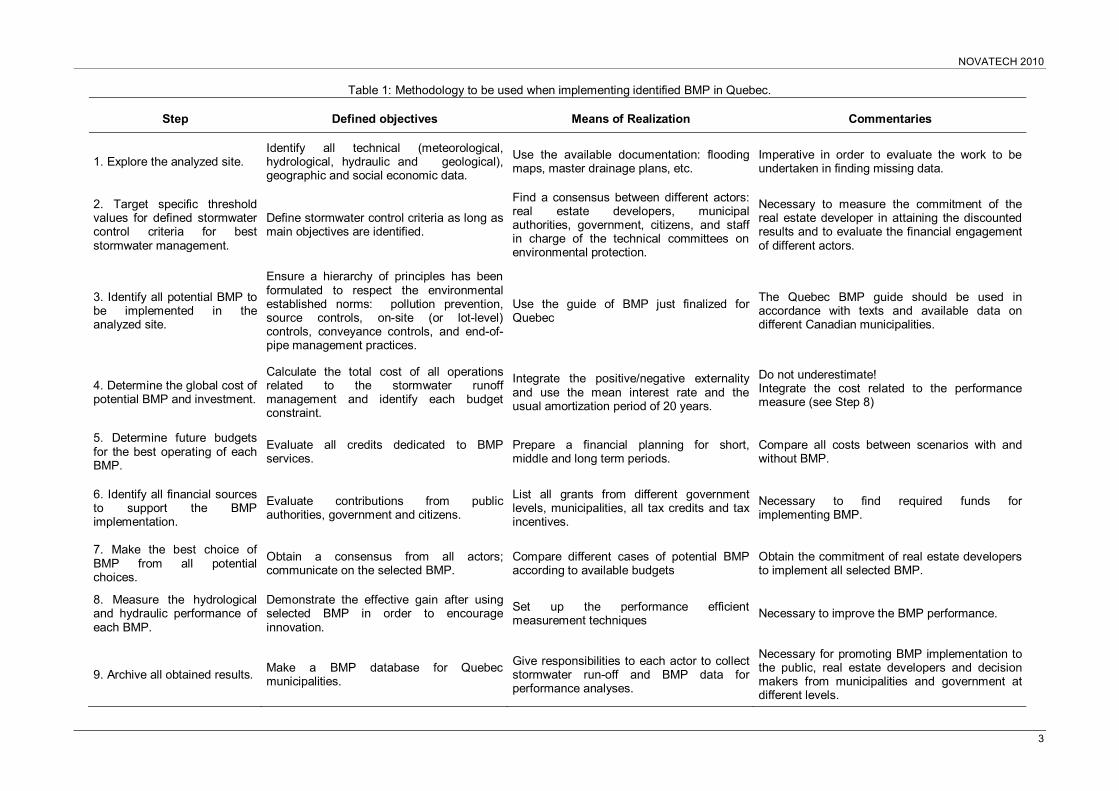
2 DEVELOPED METHODOLOGY The developed methodology is described in a 9-step procedure, as shown in Table 1. At each step, clear objectives are defined, as well as the means for their realization and useful suggestions and commentaries. For example, the first step consists of exploring the site. This step is absolutely necessary because it helps to evaluate the relevance of available documentation and references and the work to be done in order to find complementary documents. The defined objective at this step is to identify all techniques, as well as geographic and economic issues. All details concerning the 9 steps are listed in Table 1.
NOVATECH 2010
3
Table 1: Methodology to be used when implementing identified BMP in Quebec.
Step Defined objectives Means of Realization Commentaries
1. Explore the analyzed site. Identify all technical (meteorological, hydrological, hydraulic and geological), geographic and social economic data.
Use the available documentation: flooding maps, master drainage plans, etc.
Imperative in order to evaluate the work to be undertaken in finding missing data.
2. Target specific threshold values for defined stormwater control criteria for best stormwater management.
Define stormwater control criteria as long as main objectives are identified.
Find a consensus between different actors: real estate developers, municipal authorities, government, citizens, and staff in charge of the technical committees on environmental protection.
Necessary to measure the commitment of the real estate developer in attaining the discounted results and to evaluate the financial engagement of different actors.
3. Identify all potential BMP to be implemented in the analyzed site.
Ensure a hierarchy of principles has been formulated to respect the environmental established norms: pollution prevention, source controls, on-site (or lot-level) controls, conveyance controls, and end-of-pipe management practices.
Use the guide of BMP just finalized for Quebec
The Quebec BMP guide should be used in accordance with texts and available data on different Canadian municipalities.
4. Determine the global cost of potential BMP and investment.
Calculate the total cost of all operations related to the stormwater runoff management and identify each budget constraint.
Integrate the positive/negative externality and use the mean interest rate and the usual amortization period of 20 years.
Do not underestimate! Integrate the cost related to the performance measure (see Step 8)
5. Determine future budgets for the best operating of each BMP.
Evaluate all credits dedicated to BMP services.
Prepare a financial planning for short, middle and long term periods.
Compare all costs between scenarios with and without BMP.
6. Identify all financial sources to support the BMP implementation.
Evaluate contributions from public authorities, government and citizens.
List all grants from different government levels, municipalities, all tax credits and tax incentives.
Necessary to find required funds for implementing BMP.
7. Make the best choice of BMP from all potential choices.
Obtain a consensus from all actors; communicate on the selected BMP.
Compare different cases of potential BMP according to available budgets
Obtain the commitment of real estate developers to implement all selected BMP.
8. Measure the hydrological and hydraulic performance of each BMP.
Demonstrate the effective gain after using selected BMP in order to encourage innovation.
Set up the performance efficient measurement techniques Necessary to improve the BMP performance.
9. Archive all obtained results. Make a BMP database for Quebec municipalities.
Give responsibilities to each actor to collect stormwater run-off and BMP data for performance analyses.
Necessary for promoting BMP implementation to the public, real estate developers and decision makers from municipalities and government at different levels.
SESSION 3.2
4
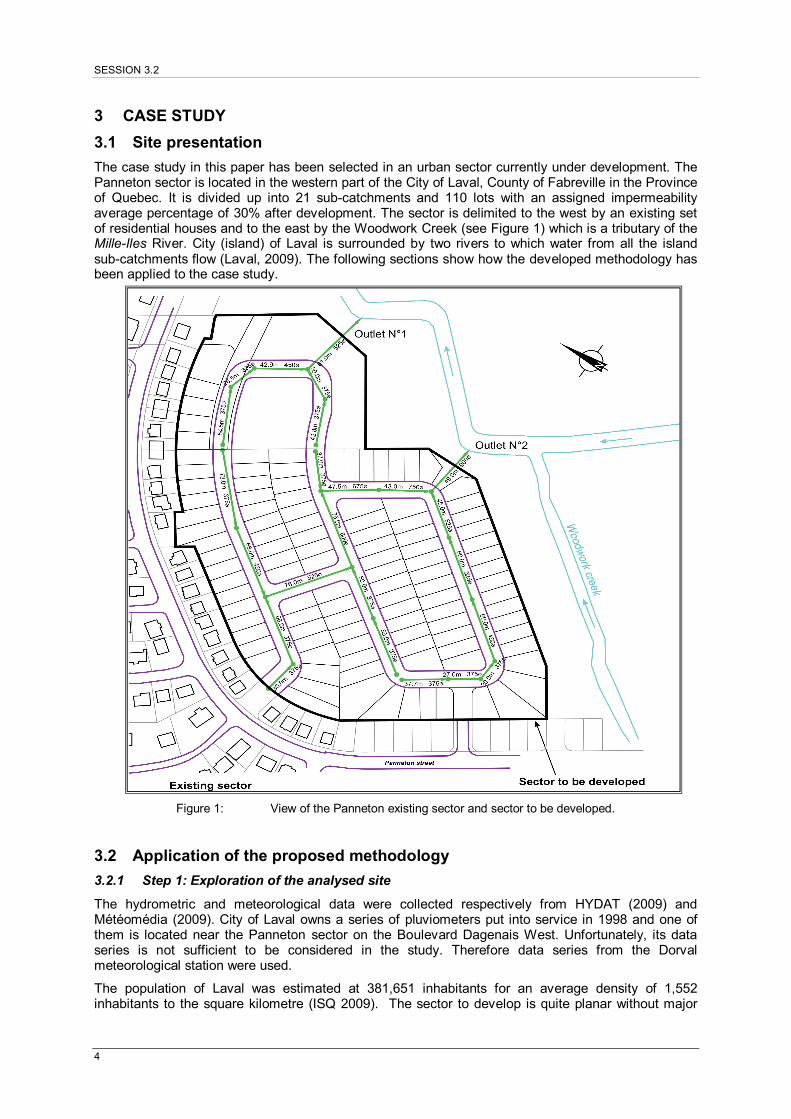
3 CASE STUDY 3.1 Site presentation The case study in this paper has been selected in an urban sector currently under development. The Panneton sector is located in the western part of the City of Laval, County of Fabreville in the Province of Quebec. It is divided up into 21 sub-catchments and 110 lots with an assigned impermeability average percentage of 30% after development. The sector is delimited to the west by an existing set of residential houses and to the east by the Woodwork Creek (see Figure 1) which is a tributary of the Mille-Iles River. City (island) of Laval is surrounded by two rivers to which water from all the island sub-catchments flow (Laval, 2009). The following sections show how the developed methodology has been applied to the case study.
Figure 1: View of the Panneton existing sector and sector to be developed.
3.2 Application of the proposed methodology 3.2.1 Step 1: Exploration of the analysed site
The hydrometric and meteorological data were collected respectively from HYDAT (2009) and Météomédia (2009). City of Laval owns a series of pluviometers put into service in 1998 and one of them is located near the Panneton sector on the Boulevard Dagenais West. Unfortunately, its data series is not sufficient to be considered in the study. Therefore data series from the Dorval meteorological station were used.
The population of Laval was estimated at 381,651 inhabitants for an average density of 1,552 inhabitants to the square kilometre (ISQ 2009). The sector to develop is quite planar without major
NOVATECH 2010
5
difference in height. It will be a majority residential development of one family type on an area of 7.88 hectares and it contains 110 constructible batches, for about 473 persons, with a density of 1,532 inhabitants to the square kilometre. Additionally, the average value of dwelling units in the existing sector situated on a nearby site is $ 104,024 (this is the figure for 2001 which has since undergone a significant increase). For calculation purpose in this study, we will take as hypothesis that the average cost of a new dwelling unit to be sold by a real estate developer in 2009 is $ 200,000.
3.2.2 Step 2: Targeting specific threshold values
Three criteria of stormwater runoff control were identified: (1) the preservation of the water cycle with the objective of allowing the infiltration of a significant amount of intensity of small rains, (2) the flood reduction with the objective of reducing the flood crest by at least 30%; and (3) the impact on the receiving bodies of water with the objective of improving the rejection quality. Because of a lack of hydrologic data on the historic series of rains greater than 2-year and of morphological data on the Woodwork creek, it was not possible to analyze the control criterion on the potential erosive. The new development of the sector is sized according to a conventional method of drainage (minor network only). The Panneton SWS was designed based on the 10-year Chicago storm. For the purpose of this study, the latter was modified for an area of less than 5 km2 and 3-hour duration.
PCSWMM 2006 (James et al., 2003) was used for modeling and simulating the hydrologic and hydraulic conditions of the Panneton SWS. Available documentation allows the characterization of different sub-catchments and runoff parameters. The following considerations have been made: • The impermeability rate was generally adjusted to 30% in dense residential sectors; • The value of the Manning coefficient is fixed at 0.25 for pervious areas and 0.016 for the impervious areas. In conduits, the coefficient of Manning has the value of 0.015; • Horton’s model of infiltration is used in the present study as it appears to be the most used model. The value used for the capacity of initial infiltration (fo) is 76.2 mm/h and the value of the capacity of ultimate infiltration (fc) is 7.62 mm/h (Rivard 2005). • The geometric characteristics of the SWS (lengths, slopes and diameters of conduits, elevations of manholes etc.) are in accordance with the Panneton SWS available data.
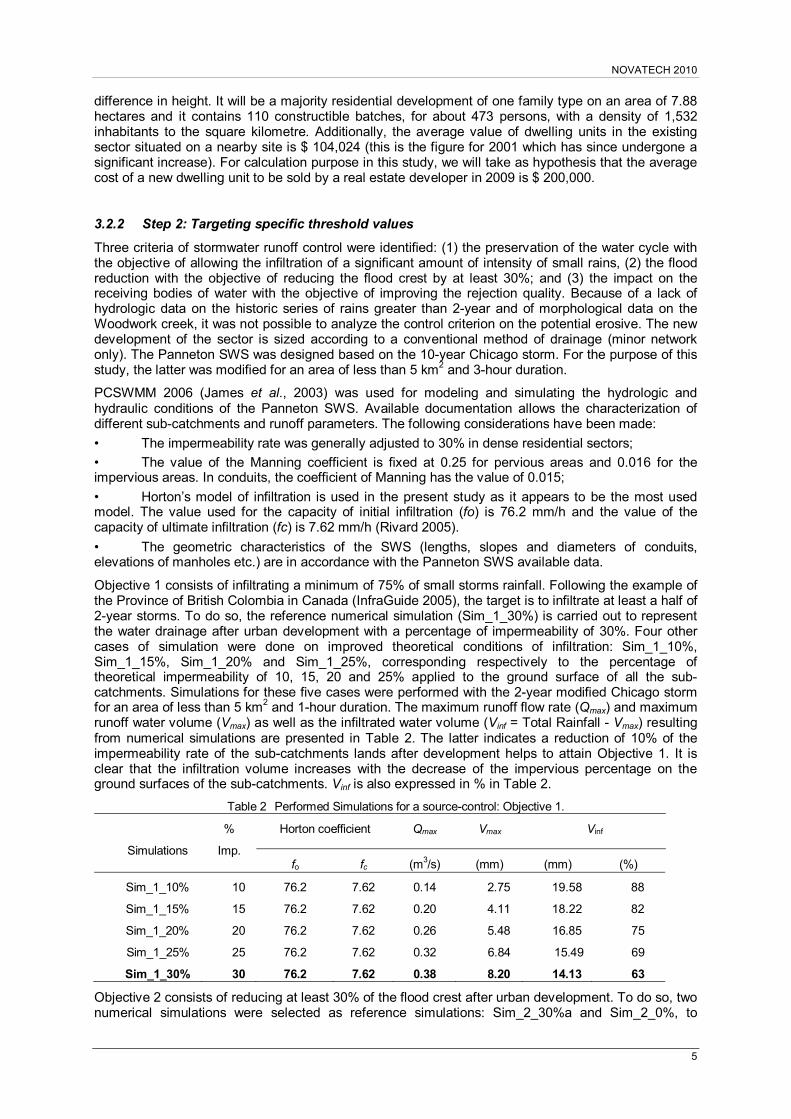
Objective 1 consists of infiltrating a minimum of 75% of small storms rainfall. Following the example of the Province of British Colombia in Canada (InfraGuide 2005), the target is to infiltrate at least a half of 2-year storms. To do so, the reference numerical simulation (Sim_1_30%) is carried out to represent the water drainage after urban development with a percentage of impermeability of 30%. Four other cases of simulation were done on improved theoretical conditions of infiltration: Sim_1_10%, Sim_1_15%, Sim_1_20% and Sim_1_25%, corresponding respectively to the percentage of theoretical impermeability of 10, 15, 20 and 25% applied to the ground surface of all the sub-catchments. Simulations for these five cases were performed with the 2-year modified Chicago storm for an area of less than 5 km2 and 1-hour duration. The maximum runoff flow rate (Qmax) and maximum runoff water volume (Vmax) as well as the infiltrated water volume (Vinf = Total Rainfall - Vmax) resulting from numerical simulations are presented in Table 2. The latter indicates a reduction of 10% of the impermeability rate of the sub-catchments lands after development helps to attain Objective 1. It is clear that the infiltration volume increases with the decrease of the impervious percentage on the ground surfaces of the sub-catchments. Vinf is also expressed in % in Table 2.
Table 2 Performed Simulations for a source-control: Objective 1.
Simulations
%
Imp.
Horton coefficient Qmax Vmax Vinf
fo fc (m3/s) (mm) (mm) (%)
Sim_1_10% 10 76.2 7.62 0.14 2.75 19.58 88
Sim_1_15% 15 76.2 7.62 0.20 4.11 18.22 82
Sim_1_20% 20 76.2 7.62 0.26 5.48 16.85 75
Sim_1_25% 25 76.2 7.62 0.32 6.84 15.49 69
Sim_1_30% 30 76.2 7.62 0.38 8.20 14.13 63
Objective 2 consists of reducing at least 30% of the flood crest after urban development. To do so, two numerical simulations were selected as reference simulations: Sim_2_30%a and Sim_2_0%, to
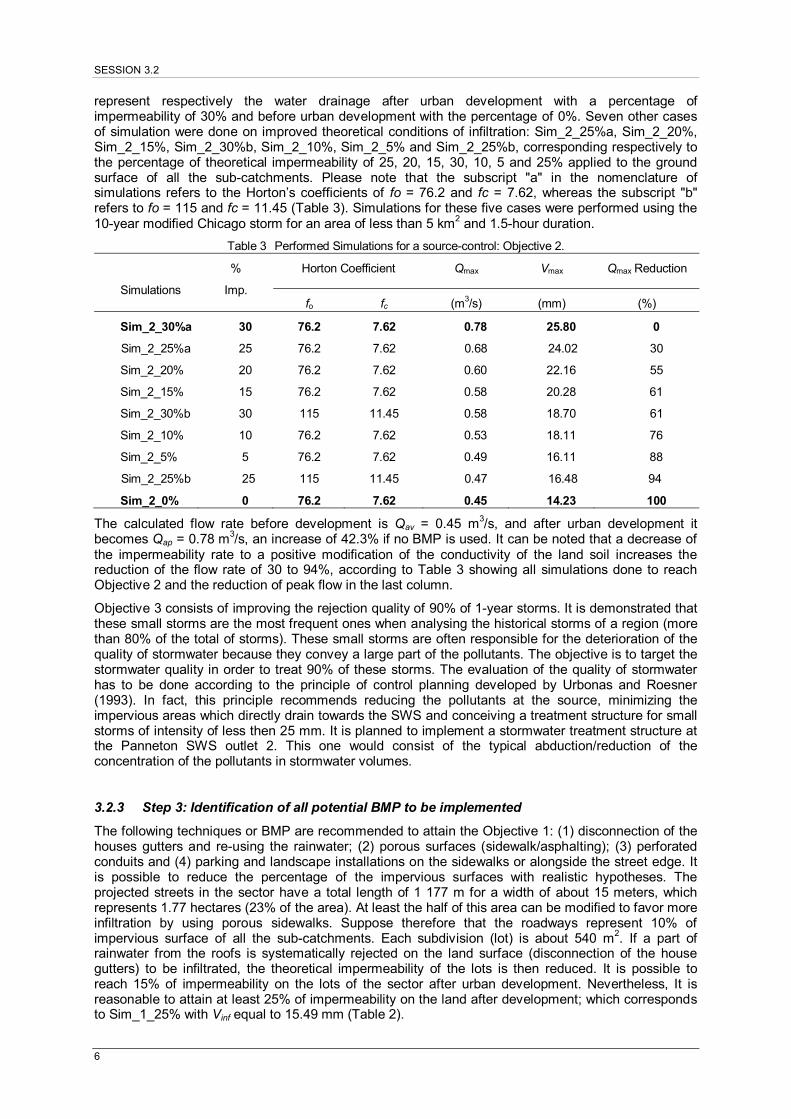
SESSION 3.2
6
represent respectively the water drainage after urban development with a percentage of impermeability of 30% and before urban development with the percentage of 0%. Seven other cases of simulation were done on improved theoretical conditions of infiltration: Sim_2_25%a, Sim_2_20%, Sim_2_15%, Sim_2_30%b, Sim_2_10%, Sim_2_5% and Sim_2_25%b, corresponding respectively to the percentage of theoretical impermeability of 25, 20, 15, 30, 10, 5 and 25% applied to the ground surface of all the sub-catchments. Please note that the subscript "a" in the nomenclature of simulations refers to the Horton’s coefficients of fo = 76.2 and fc = 7.62, whereas the subscript "b" refers to fo = 115 and fc = 11.45 (Table 3). Simulations for these five cases were performed using the 10-year modified Chicago storm for an area of less than 5 km2 and 1.5-hour duration.
Table 3 Performed Simulations for a source-control: Objective 2.
Simulations
%
Imp.
Horton Coefficient Qmax Vmax Qmax Reduction
fo fc (m3/s) (mm) (%)
Sim_2_30%a 30 76.2 7.62 0.78 25.80 0
Sim_2_25%a 25 76.2 7.62 0.68 24.02 30
Sim_2_20% 20 76.2 7.62 0.60 22.16 55
Sim_2_15% 15 76.2 7.62 0.58 20.28 61
Sim_2_30%b 30 115 11.45 0.58 18.70 61
Sim_2_10% 10 76.2 7.62 0.53 18.11 76
Sim_2_5% 5 76.2 7.62 0.49 16.11 88
Sim_2_25%b 25 115 11.45 0.47 16.48 94
Sim_2_0% 0 76.2 7.62 0.45 14.23 100
The calculated flow rate before development is Qav = 0.45 m3/s, and after urban development it becomes Qap = 0.78 m3/s, an increase of 42.3% if no BMP is used. It can be noted that a decrease of the impermeability rate to a positive modification of the conductivity of the land soil increases the reduction of the flow rate of 30 to 94%, according to Table 3 showing all simulations done to reach Objective 2 and the reduction of peak flow in the last column.
Objective 3 consists of improving the rejection quality of 90% of 1-year storms. It is demonstrated that these small storms are the most frequent ones when analysing the historical storms of a region (more than 80% of the total of storms). These small storms are often responsible for the deterioration of the quality of stormwater because they convey a large part of the pollutants. The objective is to target the stormwater quality in order to treat 90% of these storms. The evaluation of the quality of stormwater has to be done according to the principle of control planning developed by Urbonas and Roesner (1993). In fact, this principle recommends reducing the pollutants at the source, minimizing the impervious areas which directly drain towards the SWS and conceiving a treatment structure for small storms of intensity of less then 25 mm. It is planned to implement a stormwater treatment structure at the Panneton SWS outlet 2. This one would consist of the typical abduction/reduction of the concentration of the pollutants in stormwater volumes.
3.2.3 Step 3: Identification of all potential BMP to be implemented
The following techniques or BMP are recommended to attain the Objective 1: (1) disconnection of the houses gutters and re-using the rainwater; (2) porous surfaces (sidewalk/asphalting); (3) perforated conduits and (4) parking and landscape installations on the sidewalks or alongside the street edge. It is possible to reduce the percentage of the impervious surfaces with realistic hypotheses. The projected streets in the sector have a total length of 1 177 m for a width of about 15 meters, which represents 1.77 hectares (23% of the area). At least the half of this area can be modified to favor more infiltration by using porous sidewalks. Suppose therefore that the roadways represent 10% of impervious surface of all the sub-catchments. Each subdivision (lot) is about 540 m2. If a part of rainwater from the roofs is systematically rejected on the land surface (disconnection of the house gutters) to be infiltrated, the theoretical impermeability of the lots is then reduced. It is possible to reach 15% of impermeability on the lots of the sector after urban development. Nevertheless, It is reasonable to attain at least 25% of impermeability on the land after development; which corresponds to Sim_1_25% with Vinf equal to 15.49 mm (Table 2).
NOVATECH 2010
7
EATCTA CCC +=
ECC OMEA =
irir
E
n
−
⎟⎠⎞
⎜⎝⎛
++
= 11
To attain Objective 2, the designer will have to consider once more the practices that reduce the volume of the stormwater runoff. Among potential BMP, one could use the retention basin, the ditch with infiltration system, the system with perforated conduits, etc. The real estate developer could call upon the landscape artists to integrate the adequate environmental installations in the architectural plans.
Objective 3 can be attained by providing a rain garden (ABT 2003, PRIDE 2009) with a screen rake system to treat polluted rainwater from the Panneton SWS outlet 2 before rejection at the same location, and by providing a site for polluted snow.
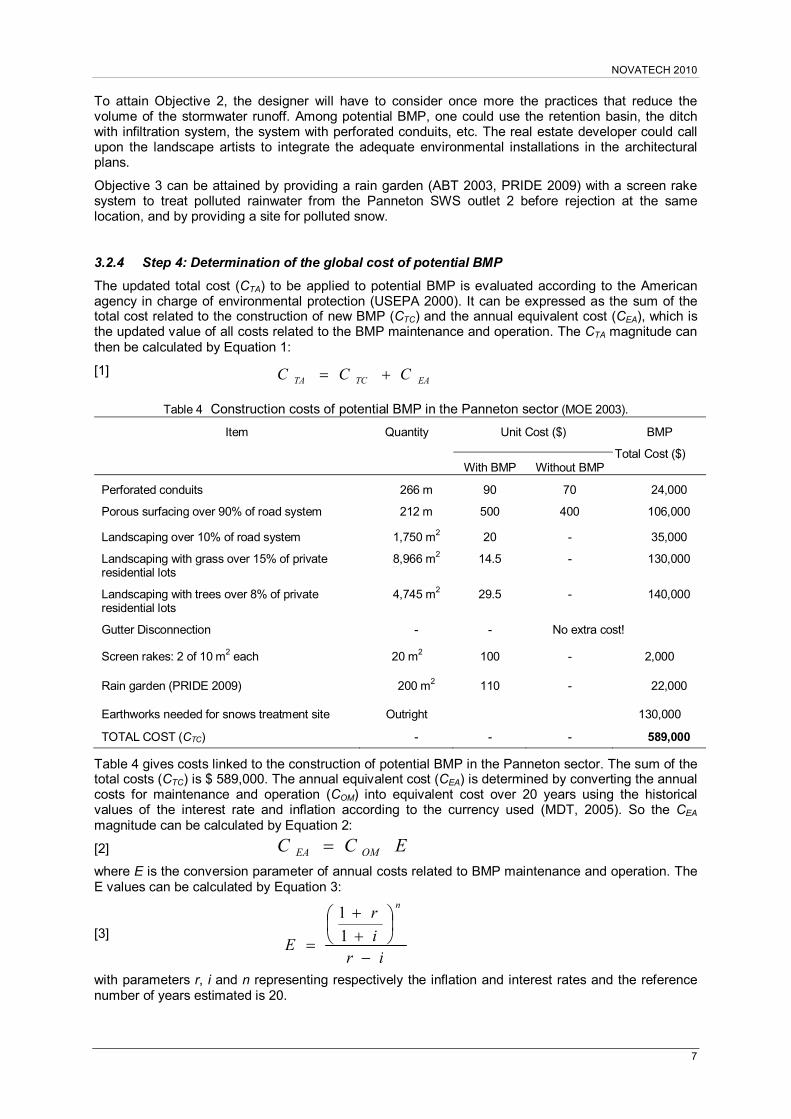
3.2.4 Step 4: Determination of the global cost of potential BMP
The updated total cost (CTA) to be applied to potential BMP is evaluated according to the American agency in charge of environmental protection (USEPA 2000). It can be expressed as the sum of the total cost related to the construction of new BMP (CTC) and the annual equivalent cost (CEA), which is the updated value of all costs related to the BMP maintenance and operation. The CTA magnitude can then be calculated by Equation 1:
[1]
Table 4 Construction costs of potential BMP in the Panneton sector (MOE 2003).
Item Quantity Unit Cost ($) BMP
Total Cost ($) With BMP Without BMP
Perforated conduits 266 m 90 70 24,000
Porous surfacing over 90% of road system 212 m 500 400 106,000
Landscaping over 10% of road system 1,750 m2 20 - 35,000
Landscaping with grass over 15% of private residential lots
8,966 m2 14.5 - 130,000
Landscaping with trees over 8% of private residential lots
4,745 m2 29.5 - 140,000
Gutter Disconnection - - No extra cost!
Screen rakes: 2 of 10 m2 each 20 m2 100 - 2,000
Rain garden (PRIDE 2009) 200 m2 110 - 22,000
Earthworks needed for snows treatment site Outright 130,000
TOTAL COST (CTC) - - - 589,000
Table 4 gives costs linked to the construction of potential BMP in the Panneton sector. The sum of the total costs (CTC) is $ 589,000. The annual equivalent cost (CEA) is determined by converting the annual costs for maintenance and operation (COM) into equivalent cost over 20 years using the historical values of the interest rate and inflation according to the currency used (MDT, 2005). So the CEA magnitude can be calculated by Equation 2:
[2]
where E is the conversion parameter of annual costs related to BMP maintenance and operation. The E values can be calculated by Equation 3:
[3]
with parameters r, i and n representing respectively the inflation and interest rates and the reference number of years estimated is 20.
SESSION 3.2
8
∑= +
+−=n
kka
PCostsNPV1 )1(
1)(
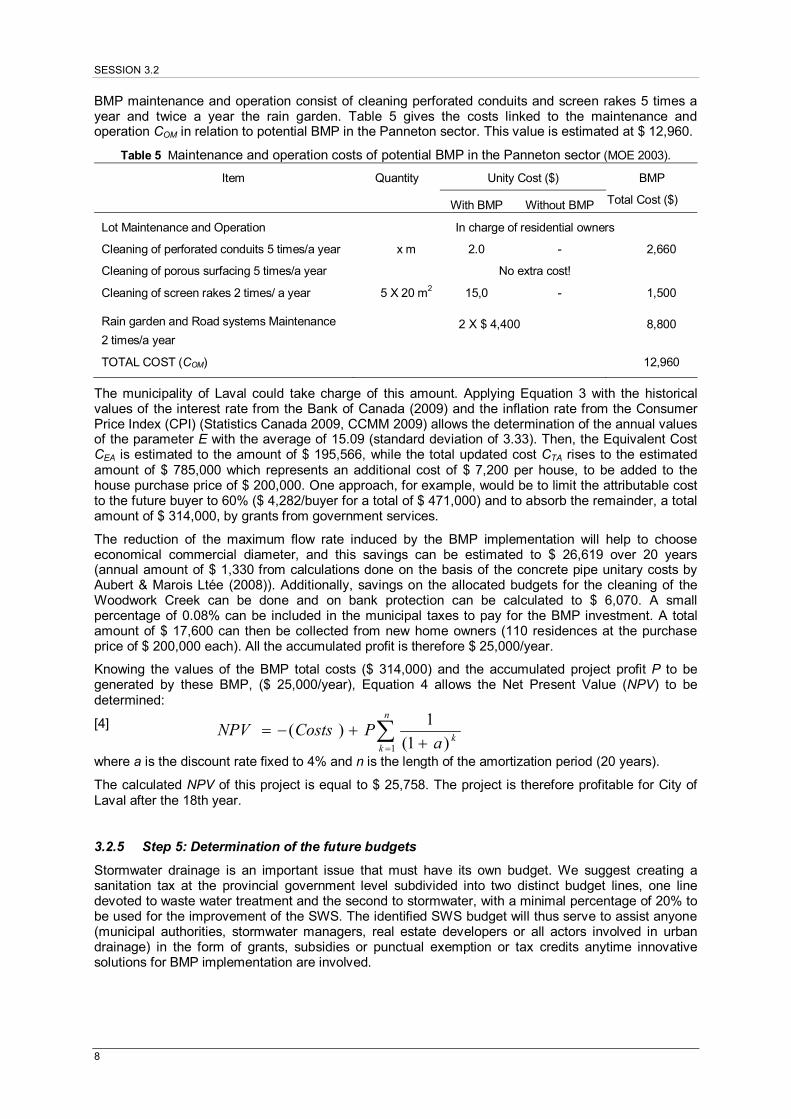
BMP maintenance and operation consist of cleaning perforated conduits and screen rakes 5 times a year and twice a year the rain garden. Table 5 gives the costs linked to the maintenance and operation COM in relation to potential BMP in the Panneton sector. This value is estimated at $ 12,960.
Table 5 Maintenance and operation costs of potential BMP in the Panneton sector (MOE 2003).
Item Quantity Unity Cost ($) BMP
Total Cost ($) With BMP Without BMP
Lot Maintenance and Operation In charge of residential owners
Cleaning of perforated conduits 5 times/a year x m 2.0 - 2,660
Cleaning of porous surfacing 5 times/a year No extra cost!
Cleaning of screen rakes 2 times/ a year 5 X 20 m2 15,0 - 1,500
Rain garden and Road systems Maintenance 2 times/a year
2 X $ 4,400 8,800
TOTAL COST (COM) 12,960
The municipality of Laval could take charge of this amount. Applying Equation 3 with the historical values of the interest rate from the Bank of Canada (2009) and the inflation rate from the Consumer Price Index (CPI) (Statistics Canada 2009, CCMM 2009) allows the determination of the annual values of the parameter E with the average of 15.09 (standard deviation of 3.33). Then, the Equivalent Cost CEA is estimated to the amount of $ 195,566, while the total updated cost CTA rises to the estimated amount of $ 785,000 which represents an additional cost of $ 7,200 per house, to be added to the house purchase price of $ 200,000. One approach, for example, would be to limit the attributable cost to the future buyer to 60% ($ 4,282/buyer for a total of $ 471,000) and to absorb the remainder, a total amount of $ 314,000, by grants from government services.
The reduction of the maximum flow rate induced by the BMP implementation will help to choose economical commercial diameter, and this savings can be estimated to $ 26,619 over 20 years (annual amount of $ 1,330 from calculations done on the basis of the concrete pipe unitary costs by Aubert & Marois Ltée (2008)). Additionally, savings on the allocated budgets for the cleaning of the Woodwork Creek can be done and on bank protection can be calculated to $ 6,070. A small percentage of 0.08% can be included in the municipal taxes to pay for the BMP investment. A total amount of $ 17,600 can then be collected from new home owners (110 residences at the purchase price of $ 200,000 each). All the accumulated profit is therefore $ 25,000/year.
Knowing the values of the BMP total costs ($ 314,000) and the accumulated project profit P to be generated by these BMP, ($ 25,000/year), Equation 4 allows the Net Present Value (NPV) to be determined:
[4]
where a is the discount rate fixed to 4% and n is the length of the amortization period (20 years).
The calculated NPV of this project is equal to $ 25,758. The project is therefore profitable for City of Laval after the 18th year.
3.2.5 Step 5: Determination of the future budgets
Stormwater drainage is an important issue that must have its own budget. We suggest creating a sanitation tax at the provincial government level subdivided into two distinct budget lines, one line devoted to waste water treatment and the second to stormwater, with a minimal percentage of 20% to be used for the improvement of the SWS. The identified SWS budget will thus serve to assist anyone (municipal authorities, stormwater managers, real estate developers or all actors involved in urban drainage) in the form of grants, subsidies or punctual exemption or tax credits anytime innovative solutions for BMP implementation are involved.
NOVATECH 2010
9
3.2.6 Step 6: Identification of all financial sources to support the BMP implementation
All potential sources must be identified to support the BMP implementation. Everyone should be involved in the investment of the BMP implementation: municipal authorities, stormwater managers, real estate developers, houses owners, because induced profits will be beneficial for all the community.
3.2.7 Step 7: Making of the best choice of BMP
The stormwater runoff management must be analyzed considering sustainable development aspects: environmental, social and economic. The final choice of the BMP to be implemented has to be done according to the sustainable character of solutions, as well as the technical performance to be targeted. All implied actors in the project, the Quebec Ministry of Environment (Ministère de Développement Durable, de l’Environnement et des Parcs MDDEP), the Quebec Ministry of Municipal Affairs (Ministère des Affaires Municipales, des Régions et Occupation du Territoire MAMROT), the City of Laval, the real estate developers, the developer contractor and the buyers of new houses have to be involved in the realization of these innovative techniques to ensure the success of this project.
3.2.8 Step 8: Performance measurement of BMP
The evaluation of the effectiveness of the implemented BMP is a necessary exercise because it helps find the maximum performance and functioning. More and more data on implemented BMP are needed to improve the performance of future projects. This is why performance measurements on stormwater quantity and quality have to be collected regularly. Concerning the quantitative control, City of Laval should install a monitor system to measure the infiltration water volumes and the runoff volumes that are intercepted by outlets. Concerning the qualitative control of rejection, it would be necessary to install two stations to measure pollutants at the rain garden: one at the entrance and the other at the exit to evaluate the structure’s performance quality.
3.2.9 Step 9: Archiving of BMP obtained results
Quebec needs to archive data on the already established BMP. It is necessary to collect all available data, following the example of the well known project entitled "Stormwater Database" (Strecker and Al. 2004). All collected results on the BMP performance will be centralized and compiled in a useful database to be consulted for future projects.
4 CONCLUSION AND RECOMENDATION A new methodology has been proposed for implementation of BMP in Quebec. This methodology was applied to a case study in City of Laval in a sector to be developed with the main objective of determining the feasibility and the performance of implementation of potential BMP in dealing with urban stormwater runoff. The present study demonstrates that selected BMP are performing by reducing stormwater runoff volumes and water pollutant rates. The brief BMP economic analysis done for information only shows that implementation of potential BMP is feasible and beneficial. Nevertheless an in-depth technical analysis still remains necessary to identify all the likely BMP to improve the conditions of urban drainage in Quebec, as long as an economic study is essential to determine the real costs due to the investment in new techniques. Finally, according to these first results, it is possible to imagine that profits are effective and that the additional costs resulting from the BMP implementation can be absorbed by several actors, without compromising innovation in the urban development solutions.
The present work is the first step in determining the feasibility and the performance of implementation of potential BMP in Quebec. Authors recommend further research to be conducted in order to develop a few specific performance indicators applicable to the Quebec’s typical BMP.
SESSION 3.2
10
LIST OF REFERENCES ABT - Augustenborgs Botaniska Takträdgard. (2003). Toitures vertes, le jardin botanique d’Augustenborg,
Scandinavian Green Roof Institute, Malmö, Suède. AM -Aubert & Marois Ltée. (2008). Liste de prix 2008. Montréal, pp. 1-24. Bank of Canada. (2009). Canadian Dollar interest rates: 10-year look-up. Web Site scanned in Nov. 2009:
http://www.bankofcanada.ca/en/rates/sel_hist.html Barr Eng. (2001). Minnesota Urban Small Sites BMP Manual/Stormwater Best Management Practices for Cold
Climates, technical report written for the Metropolitan Council, City of Minneapolis, Minnesota, USA. CCMM -Chambre de Commerce du Montréal Métropolitain. (2009). Taux annuel d’inflation au Canada. Web Site
scanned in Nov. 2009: http://www.tableaudebordmontreal.com/indicateurs/pouvoirachat/tauxinflation.fr.html CIRIA. (1996). Infiltration Drainage, Manual of Good Practice, Report 156, Londres, UK. EPA - United States Environmental Protection Agency. (1983). Results of the nationwide urban runoff program.
Volume I, Final report. Washington DC, USA. Fuamba, M., Walliser, T., Daynou, M., Rousselle, J. and Rivard, G. 2009. Vers une gestion durable et intégrée
des eaux pluviales: Application des propositions d’action publique au Québec. Paper on press in Canadian Journal of Civil Engineering.
GVRD (Greater Vancouver Regional District). 2005. Stormwater Source Controls Design Guidelines. Vancouver, Colombie-Britannique, Canada.
HYDAT (2009). Environnement Canada. 2009. Web Sites scanned in Nov. 2009: www.ec.gc.ca and Environnement Québec. Site scanned in Nov. 2009: www.mddep.ca, Canada.
InfraGuide. (2005). Planification de la gestion des eaux pluviales, version 1.0 en ligne ou CD-Rom. Guide national pour des infrastructures municipales durables, Canada.
ISQ - Institut de la Statistique du Québec. (2009). Profils statistiques des régions administratives et des MRC et territoires équivalents. Web Site: http://www.stat.gouv.qc.ca/regions/profils/region_00/region_00.htm
James, W., Huber, W.C., Rossman, L.E., Dickinson, R.E., Pitt, R.E., James, W.R.C., Roesner, L.A. and Aldrich, J.A. (2003). User’s guide to SWMM. 10th version. USA: CHI, 802 p.
Jaska. (2000). Stormwater Management & Design Manual. The City of Calgary Wastewater & Drainage. Alberta, Canada.
Laval. (2009). Portail de la Ville de Laval. Statistiques et profils socio-économiques. Web Site scanned in Nov. 2009: http://www.ville.laval.qc.ca/
Météomédia. (2009). Cartes météorologiques, des bulletins saisonniers des prévisions météorologiques personnalisées pour le Canada. Web Site scanned in Nov. 2009: http://www.meteomedia.com/
MDT - Minnesota Department of Transportation. (2005). The Cost and Effectiveness of Stormwater Management Practices. Final report published by MDT, Research Services Section, St. Paul, MN, USA.
MOE - Ministry Of Environment Ontario. (2003). Stormwater Management Planning and Design Manual. Queen’s printer for Ontario, Canada.
MSM. (2006). Minnesota Stormwater Manual. The Minnesota Pollution Control Agency St. Paul, MN, USA PRIDE - Protecting Resources in Delicate Environments. (2009). Rain Garden Guide. Web Site scanned in Nov.
2009: http://www.protectedwithpride.org/images/pdfs/Rain%20Garden%20Guide_web.pdf Rivard, G. (2005). Gestion des eaux pluviales en milieu urbain : concepts et applications. 2e édition. Laval : Alias
communication Design inc., 329 p. Statistics Canada. (2009). Consumer Price Index, Consumer price index, 1996 classification, annual average all-
items indexes, Canada historical summary. Web Site scanned in Nov. 2009: http://www.statcan.gc.ca/kits-trousses/cyb-adc1999/economy-economie/edu04_0072e-eng.htm
Strecker, E.W., Quigley, M.M., Urbonas, B.R., and Jones, J.E. (2004). Analysis of the expanded EPA/ASCE international BMP database and potential implications for BMP design. Proceedings and presentation at 2004 EWRI World Water & Environmental Congress, Salt Lake City, UT. June 27- July 1, 2004.
Urbonas, B. R. et Roesner, L. A. (1993). Hydrologic design for urban drainage and flood control. In Handbook of hydrology, ed. D. R.Maidment. New York: McGraw-Hill, 5.1–5.52.
USEPA (United States Environmental Protection Agency). (2000). US Environmental Protection Agency. Stormwater phase II final rule. Web Site scanned in Jan. 2009: http://www.epa.gov/npdes/pubs/fact1-0.pdf


