UNIVERSITÉ DE MONTRÉAL
CANADA’S TRADE FLOWS OF ELECTRONIC WASTE: MAPS AND
TRENDS
BAHRAM VAKILIAN
DÉPARTEMENT DE MATHÉMATIQUES ET DE GÉNIE INDUSTRIEL
ÉCOLE POLYTECHNIQUE DE MONTRÉAL
MÉMOIRE PRÉSENTÉ EN VUE DE L’OBTENTION
DU DIPLÔME DE MAÎTRISE ÈS SCIENCES APPLIQUÉES
(GÉNIE INDUSTRIEL)
DECEMBER 2014
© Bahram Vakilian, 2014.
UNIVERSITÉ DE MONTRÉAL
ÉCOLE POLYTECHNIQUE DE MONTRÉAL
Ce mémoire intitulé :
CANADA’S TRADE FLOWS OF ELECTRONIC WASTE: MAPS AND TRENDS
présenté par : VAKILIAN Bahram
en vue de l’obtention du diplôme de : Maîtrise ès sciences appliquées
a été dûment acceptée par le jury d’examen constitué de :
M. MARGNI Manuele, Doctorat, président
Mme BERNARD Sophie, Ph. D., membre et directeur de recherche
M. WARIN Thierry, Ph. D., membre et codirecteur de recherche
M. JOANIS Marcelin, Ph. D., membre
iii
DEDICATION
This thesis is dedicated to my parents
for their love, endless support
and encouragement.

iv
ACKNOWLEDGEMENTS
I am heartily thankful to my supervisor, Assistant Professor Sophie Bernard and co-supervisor,
Associate Professor Thierry Warin, whose encouragement, guidance and support from the initial to the
final level enabled me to develop an understanding of the subject.
I would like to dedicate this work to my beloved parents Mohammad, Anis, my sister Bita, and my
brother Kian who always believed in me, were always there for me and will always be whenever I need
them and specially my grandmother Eshrat who passed away a long time ago but whose spirit is always
with me.
Lastly, I offer my regards and blessings to all of those who supported me in any respect during the
completion of the project.
v
RÉSUMÉ
Avec les avancées technologiques et l'utilisation généralisée des dispositifs électroniques, le sujet des
rebuts électroniques comme l’une des sources de déchets avec la croissance la plus rapide au monde,
particulièrement en Amérique du Nord, a été largement souligné dans les cercles politiques et
académiques.
L’étude porte sur ce sujet dans un contexte canadien et pose l’hypothèse selon laquelle il est largement
admis que les pays développés exportent leurs rebuts électroniques vers les pays en développement; le
Canada serait donc un exportateur de déchets électroniques vers ces pays.
Afin de répondre à la question de recherche et soutenir l’hypothèse, l’étude cartographie le réseau
Canadien du commerce des déchets électroniques au moyen du code de base de données de l’ONU
Comtrade 854810 comme données de substitution pour les années 2013 et 1996 et identifie la tendance
au cours de ces périodes. Les partenaires commerciaux, les destinations, avec leur ampleur et leurs
directions au cours des différentes années sont également démontrés. En poursuivant l'analyse grâce à
l'utilisation de modèles de séries chronologiques, cette étude projette les flux commerciaux pour les
années 2014 à 2018.
En outre, cette recherche a évalué les facteurs d’échanges internationaux, y compris les réglementations
nationales et internationales, les raisons de ces opérations ainsi que les avantages et les contraintes
potentielles.
En conclusion l’étude démontre que l'hypothèse est rejetée; l'analyse des données de substitutions
montre que le flux de déchets électroniques du Canada, bien qu'il soit censé être axé vers l'exportation, a
été ces dernières années dirigé vers l'importation. Au cours de la dernière décennie, le pays est passé
d’exportateur à importateur net de déchets électroniques.
Les projections pour les années 2014 à 2018 démontrent que les importations et les exportations
devraient continuer de croître sensiblement au même rythme et qu’à la fin de cette période, la position du
Canada sera semblable à celle de l’année 2013 en tant qu'importateur net de déchets électroniques avec
trois fois plus d'importation que d’'exportation.
vi
ABSTRACT
By the expansion of technology advancement and the pandemic use of electronic devices among various
communities, the topic of electronic waste as one of the most rapidly growing source of waste in
different parts of the earth, especially in the North American region has been vastly pointed out in the
political and academic circles.
This study focuses on this issue at the Canadian scale in order to answer the hypothesis that it is widely
accepted that developed countries export their electronic waste to developing countries; therefore
Canada is an exporter of electronic waste to developing countries.
In order to answer the research question and its hypothesis, this study, by means of UN Comtrade
database code 854810 as the proxy data, mapped the Canadian e-waste trade network for 2013 and
1996, and identified its trends during these periods. The trade partners and destinations as well as their
magnitude and directions in different years have also been shown. By continuing the analysis via the use
of time series models, this study has forecasted the short term future of these trade flows from 2014 to
2018.
Furthermore, this research evaluated the international trade factors, including domestic and international
regulations, along with the reasons of such trades as well as the benefits and potential limitations.
In conclusion, this research analysis rejected the hypothesis; the analysis on the UN Comtrade database
code 854810 shows that the proxies e-waste flow for Canada, despite the fact that it is expected to be
more toward export, has been in recent years on the import. In the last decade, the country from a net
exporter switched to the net importer of electronic wastes.
The forecasts outcome also shows that the Canadian import and export from 2014 to 2018 are
expected to continue rising with almost the same speed, and that by the end of this period, Canada will
still stay similar to the latest stage in 2013 as a net importer of the electronic waste with three times more
import than export.
vii
TABLE OF CONTENTS
DEDICATION ................................................................................................................................III
ACKNOWLEDGEMENTS ........................................................................................................... IV
RÉSUMÉ .........................................................................................................................................V
ABSTRACT ................................................................................................................................... VI
TABLE OF CONTENTS .............................................................................................................. VII
LIST OF TABLES ......................................................................................................................... XI
LIST OF ABBREVIATIONS AND NOTATIONS ...................................................................... XV
LIST OF APPENDICES ........................................................................................................... XVIII
CHAPTER 1 INTRODUCTION ............................................................................................... 1
1.1 Importance of the Study ..................................................................................................... 1
1.2 Research Objectives........................................................................................................... 1
1.3 Research Questions and Hypothesis.................................................................................... 2
1.4 Thesis Chronology.............................................................................................................. 3
CHAPTER 2 LITERATURE REVIEW ...................................................................................... 4
2.1 E-waste General Prospect .................................................................................................. 4
2.2 Government of Canada’s E-waste Definition ....................................................................... 4
2.3 Canada’s Recycling Capacity ............................................................................................. 5
2.4 Regulations......................................................................................................................... 6
viii
2.5 Electronic Product Stewardship Canada ............................................................................. 7
2.6 Global Trade Flows and the Waste Haven Hypothesis ........................................................ 8
2.7 Basel Convention ............................................................................................................. 11
2.8 E-waste Categories .......................................................................................................... 14
2.9 Similar Studies.................................................................................................................. 15
CHAPTER 3 REGULATIONS AND LEGISLATIONS .......................................................... 21
3.1 Canada’s Federal E-waste Legislations ............................................................................. 21
3.2 Canada’s Provincial E-waste Legislations.......................................................................... 22
3.2.1 Ontario ........................................................................................................................ 22
3.2.2 Quebec ........................................................................................................................ 24
3.2.3 British Columbia ........................................................................................................... 25
3.2.4 Alberta......................................................................................................................... 26
3.2.5 Manitoba ..................................................................................................................... 28
3.2.6 Saskatchewan .............................................................................................................. 29
3.2.7 Nova Scotia ................................................................................................................. 30
3.2.8 Newfoundland and Labrador ........................................................................................ 31
3.2.9 Prince Edward Island ................................................................................................... 32
3.3 Non E-waste Regulated Provinces .................................................................................... 33
3.4 Legislations Comparison ................................................................................................... 33
ix
3.4.1 Provincial Legislation Comparison................................................................................. 33
3.4.2 U.S. vs. Canada ........................................................................................................... 37
3.4.3 Canada vs. European Union ......................................................................................... 38
CHAPTER 4 DATA ANALYSIS ........................................................................................... 42
4.1 Collected Data ................................................................................................................. 42
4.2 Methodology.................................................................................................................... 45
4.3 Analysis of the Data.......................................................................................................... 46
4.3.1 Canada’s e-waste Trade Flow...................................................................................... 47
4.3.2 Canada e-waste Trade Network .................................................................................. 52
4.3.3 Main Trade Partners..................................................................................................... 57
4.4 Illicit Trades ..................................................................................................................... 60
4.4.1 Reported Data from Different Countries ........................................................................ 60
4.4.2 Gap Analysis ................................................................................................................ 60
CHAPTER 5 FUTURE TRENDS ............................................................................................ 68
5.1 Time Series Model ........................................................................................................... 68
5.1.1 Double Exponential Method for Import ......................................................................... 69
5.1.2 Exponential Growth Trend Model for Import ................................................................ 73
5.1.3 Import Model Comparison ........................................................................................... 77
5.1.4 Double Exponential Method for Export ......................................................................... 80
x
5.1.5 Exponential Growth Trend Model for Export ................................................................ 84
5.1.6 Export Model Comparison ........................................................................................... 88
5.2 Discussion and Recommendation ...................................................................................... 91
5.2.1 E-waste Database ........................................................................................................ 91
5.2.2 Identified Solutions ....................................................................................................... 93
CONCLUSION ............................................................................................................................. 96
REFERENCES............................................................................................................................... 98
APPENDICES ............................................................................................................................. 107
xi
LIST OF TABLES
Table 3-1: Provincial launching and implementation time frame differences.......................................... 34
Table 3-2: Provincial end-of-life electronics collection rate ranking for 2012 and 2013 ....................... 36
Table 3-3: Provincial total program cost per tonne of collection for 2013 ........................................... 37
Table 4-1: UN Comtrade Dataset Code 854810 Advantages ........................................................... 43
Table 4-2: UN Comtrade Dataset Code 854810 Disadvantages ....................................................... 44
Table 4-3: Canada’s main trade partners with respect to the average annual trade value, from 1996 to
2013 .............................................................................................................................. 58
Table 4-4: The main trade partners with respect to the overall number of trades reported by Canada,
from 1996 to 2013 ......................................................................................................... 59
Table 5-1: Summary and results of the double exponential method for import data ............................. 71
Table 5-2: Accuracy measurements in double exponential method for import ..................................... 72
Table 5-3: Forecast using the double exponential method for import .................................................. 72
Table 5-4: Summary and results table of exponential growth trend model for import data.................... 75
Table 5-5: Accuracy measurements in exponential growth trend model for import .............................. 76
Table 5-6: Forecast using the exponential growth trend model for import ........................................... 76
Table 5-7: Accuracy measurement comparison for import models...................................................... 78
Table 5-8: Error measurement comparison for import models ............................................................ 79
Table 5-9: Summary and results of the double exponential method for export data ............................. 82
Table 5-10: Accuracy measurements using the double exponential method for export ......................... 83

xii
Table 5-11: Forecast using the double exponential method for export ................................................ 83
Table 5-12: Summary and results table of exponential growth trend model for export data.................. 86
Table 5-13: Accuracy measurements in exponential growth trend method for export .......................... 87
Table 5-14: Forecast of exponential growth trend model for export ................................................... 87
Table 5-15: Accuracy measure comparison for export models ........................................................... 88
Table 5-16: Error measurement comparison for export models .......................................................... 90
Table A-1: [Waste by HS code] © Elsevier, Inc., 2012. Reproduced with permission [25] .............. 107
Table D-1: [Specialties and capacities of consumer battery recycling facilities] © Environment
Canada, 2013. Reproduced with permission [109, table. ES-2] .................................... 110
Table E-1: [Capacity of Canadian secondary lead smelters] © Environment Canada, 2013. Reproduced
with permission [109, table. ES-3] ................................................................................ 111
Table G-1: [The main trade partners with respect to the overall number of trade reported by Canada,
from 1996 to 2013]...................................................................................................... 113
xiii
LIST OF FIGURES
Figure 2-1: Global trade in e-waste, 2001 © John Wiley & Sons, Inc., 2010. Reproduced with
permission [44, fig. 1] .................................................................................................. 17
Figure 2-2: Global trade in e-waste, 2006 © John Wiley & Sons, Inc., 2010. Reproduced with
permission [44, fig. 2] .................................................................................................. 18
Figure 2-3: The changing geography of global trade in electronic discards, inter-regional trade, 1996-
2012 © John Wiley & Sons, Inc., 2014. Reproduced with permission [45] .................. 19
Figure 3-1: WEEE collection rate, 2010 © Eurostat, 2013. Reproduced with permission [104].......... 40
Figure 4-1: Canada’s e-waste trade flow, 1996 - 2013 ..................................................................... 48
Figure 4-2: Canada’s e-waste trade network, import 2013................................................................ 53
Figure 4-3: Canada’s e-waste trade network, export 2013................................................................ 54
Figure 4-4: Canada’s e-waste trade network, import 1996................................................................ 56
Figure 4-5: Canada’s e-waste trade network, export 1996................................................................ 57
Figure 4-6: Canadian imports reported differences with other countries exports reported.................... 61
Figure 4-7: Canadian exports reported differences with other countries imports reported.................... 62
Figure 4-8: Canadian imports reported differences with other countries exports reported divided on the
average of both parties report’s numbers...................................................................... 64
Figure 4-9: Canadian exports reported differences with other countries imports reported divided on the
average of both parties report’s numbers...................................................................... 65
Figure 5-1: Fits and Forecasts using the double exponential method for import ................................... 70
Figure 5-2: Time series plot of double exponential method for import data with forecasts.................... 73
xiv
Figure 5-3: Fits and Forecasts using the exponential growth trend model for import ............................ 74
Figure 5-4: Time series plot of exponential growth trend model for import data with forecasts............. 77
Figure 5-5: Residual series of double exponential method and exponential growth trend model for import
data ............................................................................................................................ 80
Figure 5-6: Fits and Forecasts using the Double exponential method for export .................................. 81
Figure 5-7: Time series plot of double exponential method for export data with forecasts.................... 84
Figure 5-8: Fits and Forecasts using the exponential growth trend model for export ............................ 85
Figure 5-9: Time series plot of exponential growth trend model for export data with forecasts............. 88
Figure 5-10: Residual series of double exponential method and exponential growth trend model for
export data.................................................................................................................. 91
Figure 5-11: Official and unofficial data collection sources ................................................................. 93
Figure B-1: [US Exports of SLABs to Canada, Mexico and all other destinations, 2002–2011] ©
Commission for Environmental Cooperation (CEC), 2013. Reproduced with permission
[108, fig. 3-1] ........................................................................................................... 108
Figure C-1: [North American imports and exports of Spent Lead-acid Batteries (SLABs), 2011] ©
Commission for Environmental Cooperation (CEC), 2013. Reproduced with permission
[108, fig. 3-1] ........................................................................................................... 109
Figure F-1: [Facilities processing Spent Lead-acid Batteries (SLABs) in Canada and the United States]
© Commission for Environmental Cooperation (CEC), 2013. Reproduced with
permission [108, fig. 1-1a]......................................................................................... 112
xv
LIST OF ABBREVIATIONS AND NOTATIONS
ACES Atlantic Canada Electronics Stewardship
ARMA Alberta Recycling Management Authority
BAN Basel Actin Network
BC British Columbia
BOL Bill of Lading
CCME Canadian Council for Ministers of Environment
CEA Consumer Electronics Association
CFL Compact Fluorescent Light
CPI Consumer Price Index
CRT Cathode Ray Tube
CWTA Canadian Wireless Telecommunications Association
EC European Commission
EEE Electronic and Electrical Equipment
EFC Electro-Federation Canada
EHFs Environmental Handling Fees
EMA Environmental Management Act
EPA Environmental Protection Agency
xvi
EPEA Environmental Protection and Enhancement Act
EPEAT Electronic Product Environmental Assessment Tool
EPI Environmental Performance Index
EPR Extended Producer Responsibility
EPRA Electronic Products Recycling Association
EPS Electronic Product Stewardship
EPSC Electronic Product Stewardship Canada
EQA Environment Quality Act
ESABC Electronic Stewardship Association of British Columbia
EU European Union
GDP Gross Domestic Product
HS Harmonised System
HTB Home Theater in a Box
ITAC Information Technology Association of Canada
MAD Mean Absolute Deviation
MAPE Mean Absolute Percentage Error
MSD Mean Squared Deviation
OECD Organization for Economic Cooperation and Development
OES Ontario Electronic Stewardship
xvii
PSPs Provincial Electronic Product Stewardship Programs
PWGSC Public Works and Government Services Canada
RCC Retail Council of Canada
RCRA Resource Conservation and Recovery Act
RCMP Royal Canadian Mounted Police
RECYC Société Québécoise de Récupération et de Recyclage
RoHS Restriction of Hazardous Substances
SVTC Silicon Valley Toxics Coalition
SWEEP Saskatchewan Waste Electronic Equipment Program
UN United Nations
WEEE Waste of Electrical and Electronic Equipment
WDA Waste Diversion Act
WDO Waste Diversion Ontario
WRAP Waste Reduction and Prevention
xviii
LIST OF APPENDICES
APPENDIX A - WASTE BY HS CODE ...................................................................................... 107
APPENDIX B - US EXPORTS OF SLABS TO CANADA, MEXICO AND ALL OTHER
DESTINATIONS, 2002-2011 ........................................................................... 108
APPENDIX C - NORTH AMERICAN IMPORTS AND EXPORTS OF SPENT LEAD-ACID
BATTERIES (SLABS), 2011 ............................................................................. 109
APPENDIX D - SPECIALTIES AND CAPACITIES OF CONSUMER BATTERY RECYCLING
FACILITIES....................................................................................................... 110
APPENDIX E - CAPACITY OF CANADIAN SECONDARY LEAD SMELTERS .................... 111
APPENDIX F - FACILITIES PROCESSING SPENT LEAD-ACID BATTERIES (SLABS) IN
CANADA AND THE UNITED STATES .......................................................... 112
APPENDIX G - THE MAIN TRADE PARTNERS WITH RESPECT TO THE OVERALL
NUMBER OF TRADE REPORTED BY CANADA, FROM 1996 TO 2013..... 113
APPENDIX H - MAPE DEFINITION AND EQUATION ........................................................... 116
APPENDIX I - MAD DEFINITION AND EQUATION .............................................................. 117
APPENDIX J - MSD DEFINITION AND EQUATION .............................................................. 118
1
CHAPTER 1 INTRODUCTION
1.1 Importance of the Study
Canada’s environment is effected by electronic waste (E-Waste) and the influence of the defined
regulations for its disposal and the export from the country. Based on information from Environment
Canada, more than 140,000 metric tonnes of electronic equipment are aggregated in Canadian landfills
annually [1, 2], which consist of various electronic products, from phones, televisions, computer
equipment, and batteries to small electronic home appliances. It is anticipated that the same size of this
landfill’s wastes are exported annually to developing countries recycling operations, due to less
expensive labor and recycling processes which is approximately 10 times cheaper than through domestic
disposal [3].
Although no such database that shows the e-waste trade flow of the countries through their export and
import capacities and their trade partners on a global basis is in existence, Canada is therefore not an
exception. Despite this limitation, this research analysis by use of proxy data will show that the e-waste
flow for Canada, although expected in the other past literatures, has changed dramatically toward new
destinations with lots of trade flow gaps.
Therefore, it is by tracking these trade flows as well as their capacity to each final destination that the
economy would profit; this would be done by identifying the illegal trade flows and potential gaps in the
current regulations for decreasing illegal trades and domestic disposal. Also, introducing a time series
model for forecasting this growth potential based on the available statistics from preceding years with the
involved influential trade flow factors could help the government to provide a better recycling
infrastructure for confronting this environmental issue in the coming years.
1.2 Research Objectives
The aim of this thesis is to identify the e-waste trade flows of Canada along with its partners, destinations
as well as its past, present and future trends. In this way, there are three major objectives defined that
have been followed throughout this thesis:
2
Evaluation of the international trade factors, including domestic and international regulations along
with reasons of such trades as well as benefits and potential gaps.
Mapping Canada’s e-waste trade network and characterizing the trade destinations and
partners.
With conditions imposed on data, developing a time series model for forecasting the future
growth trend potential of Canada’s e-waste.
1.3 Research Questions and Hypothesis
In order to achieve the research objectives, this study will answer the following question and hypothesis:
Have there been changes to Canada’s e-waste trade flow in past years and in which direction?
Hypothesis: It is widely accepted that developed countries export their electronic waste to developing
countries; Canada is an exporter of electronic waste to developing countries.
To answer the above question and hypothesis, the following detailed narrowed down questions need to
be answered first:
How should this flow be measured?
Which factors influence this trade flow the most?
What is the short-term future picture of e-waste flow in Canada?
The detailed methodologies adopted for finding the answers for the above questions have been explained
in chapters four and five.
3
1.4 Thesis Chronology
This study is structured in five chapters, starting with the explanation of the importance of this study and
its objectives along with its milestones of the achievements and the research questions in the initial
section.
In the second part, the issue of e-waste is discussed as a general term, including its definition, variations
and identified trade flows, together with its prospect of regulation in the international format.
Furthermore, in this section also, the situation of WEEE in Canada along with its challenges, current
recycling capacities and the responsible organizations will be evaluated.
In the third chapter, the e-waste legislation and the regulations at the state and the provincial levels are
discussed. Furthermore, a detailed view of each provincial regulation, as well as their comparison with
each other and with other countries including the European Union and the United States is analyzed.
Chapter four will be the core of the database and the methodology used in this study as well as its
analysis for identifying and mapping the e-waste trade network of Canada along with its main trade
partners. Furthermore, this chapter will look at the identified gaps, their analysis and illegal flows
discoveries.
In the fifth and final chapter, the future trend of e-waste in Canada, conducted with the use of two time
series models, are analyzed and the short forecast results for five years has been offered for both the
import and the export. In this section, recommendations are also provided for the e-waste database
issue as well as its potential ways for creation in addition to a few identified solutions discussed for
confronting the issue of e-waste at the national level.
The final point of this thesis is a summary of the total findings and the conclusion along with a few
recommendations for the future studies in this topic.
4
CHAPTER 2 LITERATURE REVIEW
2.1 E-waste General Prospect
The debate between developed and developing countries as well as their current and future roles on the
world’s global flow map of e-waste has drawn great interest in the political, economic, and academic
realms. By expanding the use of electronic items in 21st century, the topic of Electronic Wastes as one of
the hazardous items that negatively affects the environment has been vastly used and discussed in recent
years [4]. Despite this cumulative interest, to the best of the author’s knowledge, there have been limited
studies done on the trade flow of e-waste in Canada with concentration on the current country’s
legislations and import and export trade partners.
Presently, Waste of Electrical and Electronic Equipment (WEEE) is a term which refers to about 900
electronic products in 58 different categories worldwide [5]. This type of waste, which represents about
5% of the total solid waste, is growing faster annually than any other source of municipal waste on the
planet [6]. In the United States alone, this expansion is estimated to be 8.6% annually, which is one of
the highest expansion rates among developed countries. This is assuming that American municipal waste
increases by only 1.2% per year [7]. Luckily, this expansion is slightly lower in Canada since it is
estimated to be 4% annually [8]. In this way, the latest statistics for e-waste generated in Canada in
2012, shows a volume of 24.72 kg per inhabitant and 860.74 metric kilotonnes for the entire nation [9].
On the other hand, in 2006 the United Nations (UN) estimated that 20 to 50 million tonnes of e-waste
were produced annually worldwide [10]. In 2010, the UN then made the estimation was predicted that
there would be a production of 40 to 70 million tonnes by 2015, mainly due to expansion of the role of
electronic products in any community lifestyle [11]. In this way, Canada is not an exception and is
influenced annually by this expansion.
2.2 Government of Canada’s E-waste Definition
WEEE category has been defined differently among countries. In Canada, the government defines e-
waste as the “…surplus electronic and electrical equipment that is not suitable for reuse…” [12].
5
Based on this definition, any electronics that are no longer reusable fall under the e-waste category. This
has slightly become controversial recently due to the fact that the e-waste definition varies among
different countries as the time period of using electronic devices has decreased by users due to
technological improvements rather than technical problems. Therefore, it is common to see people
dispose electronic devices such as mobile phones and laptops, even though they are still usable. These
devices have to be considered as e-waste, but because this is not the case, these devices end up in
developing countries as second hand electronic devices for reuse purposes.
Furthermore, the government of Canada defines electronic and electrical equipment as “…any
equipment with a plug, battery or that uses electricity to perform its intended function excluding
vehicles and vehicle parts…” [12].
2.3 Canada’s Recycling Capacity
By looking through the annual export data, the limited capacity recycling sites compared to the produced
e-waste amount per year in Canada can be more obvious. In the province of Ontario, which is the most
populated province in Canada, 9.1% out of 14,586,000 household electronic used appliances had been
collected for the purpose of reuse or recycling, which consists of information technology and
telecommunications equipment’s in 2004; the rest been discarded [13].
On the other hand from an organizational and non-residential perspective, findings from a survey by the
Ontario Electronic Stewardship (OES) in 2011 shows that if this province is used as a benchmark for
the country’s e-waste problem, two-thirds of businesses do not even have any end of life plan for their
electronic products due to the fact that their use of electronic products is expanding each year. The fact
that the technology lifecycle changes for these businesses must be taken into account as well because
their lifecycles within many organizations is currently between 18 to 36 months due to the constant
upgrades, which serves as another direct contributing factor to the production of e-wastes [14]. By
considering this fact, it seems reasonable then to accept the estimate that generally about 50 to 80 % of
all end life electronic products are exported annually from North American countries to developing
countries in Asia and elsewhere instead of being recycled domestically [15].
6
On the other hand and more specifically on just the mobile phone market, the research by recycle my
cell program of Canadian Wireless Telecommunications Association (CWTA) shows, despite this fact
that 96% of the all materials used in cell phones are recyclable, only 12% of the country’s cell phones
has been recycled [16, 17].
Generally speaking, it is estimated that in Canada itself, out of all produced e-wastes during a given year,
only 10% are recycled or refurbished whereas the remaining 90% are disposed into the country‘s
landfills [8]. One of the main reasons for this low recycling rate and high disposal rate in landfills which is
based on the Electronic Product Stewardship (EPS) in Canada, is the cost of recycling electronic
products in the country. This is estimated to be four times more than the use of a landfilling disposal [18].
Therefore, by expanding on this procedure, the risk of the waste percolating into the soil and the water
resources as well as negatively influencing nature are heightened and the need for new recycling sites for
the long term are essential.
2.4 Regulations
By the start of the 21st century, Canada like most industrial nations, followed the global trend and has
ratified several programs and policies for controlling and monitoring electronic products as well as their
end of life cycle in the hopes of transferring the responsibility and financial weight of e-waste disposal
and recycling from the users to the producers. In this way, initiatives such as the Electronic Product
Stewardship (EPS) program are of paramount importance among effective programs which are intended
to extend producers responsibility (EPR) at both the provincial and federal levels. Although the program
design changes in different provinces, it generally forces electronic producers to improve the eco-
friendliness of their products by eliminating the use of toxic materials such as toxic chemicals in the
product [9, 19]. Currently, this program is in effect in nine provinces, including British Columbia, Nova
Scotia, Prince Edward Island, Ontario, Saskatchewan, Manitoba, Quebec, Newfoundland and
Labrador and Alberta [20].
From a historical perspective, more than half of the Canadian provinces designed their own legislations
between 2003 and 2010 for disposable e-wastes [21]. Therefore, due to the fact that Canada’s e-waste
legislations are mainly provincial, the comparison of similar legislations from other parts of the world such
7
as those found in the U.S can be useful in showing significant differences. As an example, in the U.S. one
of the traditional systems used for managing the e-waste costs is general tax base funding. In this model,
a fixed amount of tax is imposed on all taxpayers for funding the e-waste costs to the entire society [22].
Although this e-waste cost management system does not specify the targeted electronic consumers and
producers, it was used in past years among different states and it has only been in recent years that the
system has started to change. This shows the recent creativity of this e-waste regulation topic among
developed countries especially in the North American region after the expansion of electronic production
and consumption. In chapter three, these issues along with the detailed comparison of the Canadian
provincial legislations will be evaluated.
2.5 Electronic Product Stewardship Canada
The Electronic Product Stewardship (EPS) is a Canadian non-profit organization established in 2003
from a collaboration effort from the Electro-Federation Canada (EFC) and the Information Technology
Association of Canada (ITAC), two fundamental Canadian associations in electronics and technology.
The main intent of this establishment was to prepare a platform to serve both governmental and industrial
organizations in order to promote, design and implement sustainable effective and efficient solutions for
the electronic waste problem in the country. According to claims from the organization, since 2004 more
than 380,000 tonnes of e-waste products have been diverted from entering landfills by various recycling
programs in throughout many provinces including British Columbia, Alberta, Saskatchewan, Manitoba,
Ontario, Quebec, Nova Scotia, PEI, and Newfoundland. Examples of such electronic products include
mobile phones, computers, printers, televisions and audio/video devices [18, 20].
The Canadian sections of the leading electronic corporations are the main members of this organization.
More than 30 well-known corporations are involved such as IBM, Apple, Dell, Toshiba, Sony, Lenovo,
Panasonic, Samsung, Hewlett-Packard (HP), Cisco Systems Inc. and Canon are the main board
members, and the associate members consist of Asus, LG Electronics Inc., Microsoft, BenQ America
Corp., Ciaratech, NetApp Inc., Northern Micro Inc., EMC Corporation, Epson Cisco Systems Inc.,
MMD-Philips, Fujitsu Canada Inc., Xerox Canada Ltd., Lexmark Canada Inc., Oracle Inc. and Brother
International Corporation (Canada) Ltd. [20].
8
Since 2006, the organization publishes an annual report for further investigation on an environmentally
friendly design of the electronic products each year. The report aims to examine technology
developments and changes in different manufacturers and their impact on the recycling and closing loop
systems progresses. The report also investigates the hazardous and non-hazardous materials contained in
different electronic products and their reuse or recovery yearly change of the technology [20].
In the 2013 report, EPSC claims that the amount collected per capita since the program’s launch was
5.1kg on average, in which, Ontario had the highest amount collected per capita [18].
2.6 Global Trade Flows and the Waste Haven Hypothesis
Through the expansion of industrialization, developed countries have seen greater incentives in recent
years to export e-waste to Asia and the other developing countries [23]. The driving factors for these
incentives are due to regulatory stringencies and shifting pollution from these industrialized countries to
the developing ones, which is widely known as the pollution haven effect [24].
As based on this hypothesis and looking at the international waste haven effects in detail, the waste trade
flow leans toward countries with a lower environmental regulation. In other words, the increase in waste
imports is directly linked to deterioration in environmental regulations. In general, it is expected that for
every percent drop in the environmental regulations in one of the bilateral waste trade partners, the
import of the wastes from the other foreign trade partner increases by 0.32%. This issue can be more
understandable when taking into consideration that developed countries in average gain from a 39%
higher environmental regulation index than the average developing nation’s environmental regulation index
[25].
These effects can be even more sensible when combined by the other waste trading facts. The pollution
haven effect is also suggesting that by rising the per capita income in a country, the willingness for
accepting the foreign hazardous waste in a country decreases [26]. As it is not hard to imagine that in
most cases, the so called developed nations are gaining from the higher per capita income and GDP,
which makes it easier to guess why a waste trade flow goes towards developing countries rather than
developed ones.
9
On the other hand, it is widely assumed in most of these trading cases, the majority go against
international treaties such as the transboundary movement of hazardous waste in the Basel convention
which restricts countries for implementing illegal exports other countries [27], and EC legislation (the
Waste Shipment Regulation) [28].
As an example, a 2005 study by Greenpeace International in Europe shows that out of 18 European
seaports that have been inspected by this organization, 47% of these exported wastes, including e-
waste, that were being shipped to various places in the world were taking place illegally [29].
By considering the forecasts for the future prospect of e-waste production, this illegal trade flow can be
even further expanded. It is expected that over the next 20 years, a western European household would
produce an estimated 900 kg of e-waste, which is the equivalent of about 46 kg per year [30].
On the other hand, it is estimated that in the European Union that around 60% to 75% of all the medium
and large-sized appliances are not collected properly annually for recycling purposes; rather, they would
be involved in the so called hidden flows, in which a portion ends up being exported into developing
Asian and African nations. A possible reason behind this phenomenon, as mentioned before for the other
parts of the world and among the industrialized countries, is based on the labor cost; recycling a
computer in a country like Sweden would cost about €10 whereas in countries such as India, the same
recycling cost would be only €1.5 [28].
In the North American region, most of the flow goes toward Asian countries, the most significant being
China. The observations from the Silicon Valley Toxics Coalition (SVTC) in the U.S. and the Basel
Action Network (BAN), both of which are non-governmental organizations, showed and predicted that
almost 80% of e-wastes in the United States which were collected for the domestic recycling have been
exported to the informal recycling sites in developing countries [31]. Although this number compared to
the landfills disposal in the country is relatively low, it shows that a great export volume into the other
developing countries exists.
Studies from the U.S. Environmental Protection Agency (EPA) from 2003 to 2005 show that about 80
to 85% of the e-waste generated during this period in the United States have been discarded into
10
landfills; therefore, all these exports is the 80% of the 15% to 20% of the remaining e-waste. The volume
of the landfills disposal in 2005 is estimated to be more than 1.36 million metric tonnes [32].
The Asian sector is the major destination of the global e-waste and is therefore an important recycling
port. China has a major role in the WEEE trade flow map of Asia, as it is the main importer of the e-
waste and, at the same time, is the largest exporter of the electronic equipment’s [33]. The second rank
in the region is India which is also the second most populated area in the world. In Delhi, which is the
second largest city in India, more than 10,000 to 20,000 tonnes of e-waste has been recorded annually,
in which there are more than 25,000 workers are employed on the scrap yards [29].
In Canada this trade is expected to be more toward Asian countries, mainly China. A study by the Basel
Actin Network (BAN) team in 2002 shows a large amount of e-waste labeled by different Canadian
institutions such as Air Canada, destined from Vancouver, British Columbia to Guiyu, a city in the
Guangdong province of China. This shipment consists of e-waste products such as printers and
computers, which are the sort of hazardous e-waste products that are banned from being exported
under the Basel convention. Canada, as a full member, is expected to refrain from getting involved in
these illegal shipments because of its agreement to the convention. BAN estimated that about 20,000
tonnes of e-waste from these kinds of exports has come from just the computer waste sector into the
Asian region in 2002 [15].
Also according to a report given by the RCMP, there has been over 500,000 kg of e-waste that has
been shipped solely from the port of Vancouver towards developing countries from 2005 onwards [34].
Based on the mentioned reports, it can be expected that with respect to future prospects, this trend of e-
waste trade flow will continue or even grow. This study did not find any evidence based on the literature
review conducted for Canada or any other developed countries that show information to the contrary. It
is widely accepted that waste and e-waste are moving from the developed to the less developing
countries.
There are different factors that can explain this issue. A difference between treatment and disposal costs
among developed and developing countries can account for part of the reason; however, the fact that it
can be due to less restrictive environmental regulations between southern and northern countries that may
11
cause this issue. A study by Bernard [35], on the second-hand markets shows, strict laws and
regulations found in the North that induce Northern firms so that product reusability is reduced. As a
result, the flow of non-reusable waste towards the southern regions increases, resulting in a magnification
of the pollution haven effect [35].
By analyzing past data and the literature reviewed, it can be seen that Canada, like any other developed
country, is expected to be part of the e-waste trade flow to developing countries. The difference for
Canada however is that these trades were not traced back to the nation and the driven factors were not
analyzed in depth as much as other countries. This is keeping in mind that the amount of e-waste has
increased from 2002 as the amount of electronic products has increased in the country. In 2011 alone,
Canadians invested more than $11.5 billion in electronic devices, excluding the amounts spent on
cellphones and video games [36]. In a tangible technology example of the new generation of electronic
products in the country, it was estimated that more than 500,000 tablets were imported in 2010 and that
this amount increased threefold to 1,500,000 the year after [37]. There is no doubt that this huge amount
of tablets is going to become e-waste in the following years.
Generally speaking, the e-waste issue that the world will face in the future will constantly grow annually,
which is evident by way of the many examples that can be illustrated. Based on the Consumer
Electronics Association (CEA), the total market revenue of the global electronic products in 2014 is
estimated to be around $208 billion. With such revenue, is not unexpected to see producers produce
more electronic products and consumers desire to consume more [38]. Therefore by the coming years is
not unexpected to see the topic of e-waste is getting more highlighted into the world news headlines.
2.7 Basel Convention
From an historical perspective, the Basel convention is most renowned for its progress in controlling the
transboundary movements of hazardous wastes under the mandate of protecting human health as well as
the environment from their adverse effects. The first convention took place on the 22nd of March
1989 in Basel, Switzerland, with its actions officially being taken into effect on the 5th of May 1992
[39]. In 1995, the Ban Amendment was adopted to the Convention, prohibiting the export of any
hazardous waste from the nations as shown in Annex VII to those nations that are not listed in this
12
section; this basically comprises of all OECD and European Union countries, including Liechtenstein.
From this point forward, this relation will be noted as being among A7 and non-A7 countries [40].
From the initial steps, Canada was one of the first countries who signed the convention on 22nd of
March 1989 and ratified it on 28 August 1992. This is not the case for the other important member of
the North American region, the United States which signed the contract but did not ratify it [41].
As per the information at the time of this study, 181 parties are members of the Basel Convention. From
these nations, Sao Tome and Principe, and Afghanistan are the two most recent countries who ratified
this convention [41].
Canada, as one of the full members to this convention, is therefore required to follow the rules and
policies exerted by the convention for the transboundary movements of its hazardous wastes. Some of
these general obligations are as follows:
I: In the scope of the convention in article 1, section 1b. of the Basel convention mentions that
wastes shall be considered hazardous in the transboundary movements, if “…Wastes that are
not covered under paragraph (a) but are defined as, or are considered to be, hazardous
wastes by the domestic legislation of the party of export, import or transit…” (Basel
convention. Article 1, 1, b) [39].
II: General obligations in article 4 section 1b. for export countries Basel convention mention:
“…Parties shall prohibit or shall not permit the export of hazardous wastes and other
wastes to the parties which have prohibited the import of such wastes, when notified
pursuant to subparagraph (a)...” (Basel convention. Article 4, 1, b) [39].
III: In the other part, general obligations in article 4 section 2d. ask parties to take proper
measures for ensuring that “…the transboundary movement of hazardous wastes and other
wastes is reduced to the minimum consistent with the environmentally sound and efficient
management of such wastes, and is conducted in a manner which will protect human
health and the environment against the adverse effects which may result from such
movement…” (Basel convention. Article 4, 2, d) [39].
13
IV: Also, general obligations in article 4 section 2e. ask parties to take proper measures to
“…not allow the export of hazardous wastes or other wastes to a State or group of
States belonging to an economic organization that are parties, particularly developing
countries, which have prohibited by their legislation all imports, or if it has reason to
believe that the wastes in question will not be managed in an environmentally sound
manner…” (Basel convention. Article 4, 2, e) [39].
The above clauses are a portion of the obligations to which Canada, as a full member of Basel
convention must follow. A study on “Exporting Harm: The High-Tech Trashing of Asia, The Canadian
Story” from the Basel Convention shows that Canada like other convention members, does not
necessarily follow the policies that members are obliged to follow. In some cases, Canada has been in
violation of some of them.
As an example, the case of exported e-wastes from Vancouver to China in 2002 contains policies which
have been vastly violated by Canada. As the above clauses clearly show, exporter parties are prohibited
to export hazardous wastes to other countries if the importer parties prohibits the import of such wastes,
in this case, China as the importer prohibited the import of electronic wastes. Canada’s position in this
case was to ignore categorizing e-waste under the hazardous wastes; however, even if this is their
position as the exporter party, the importer party policies are still important according to the Basel
Convention. Therefore, Canada cannot ignore the importer country regulations [15].
Also as the articles (4, 2, d) and (4, 2, e) address clearly, the parties need to take precautions in
ensuring that the exported hazardous wastes from their nations are being handled in an environmentally
appropriate manner; in the case of 2002, these articles have been violated, as Canada does not took any
precaution activities [15].
Although the case that was mentioned above is outdated since it occurred 12 years ago, it is still
important to note the lessons learnt from this case because there is always the possibility that similar
events could happen in the future. This is true regardless of the fact that many modifications have been
done on existing legislations. Also it should be mention that the above clauses are only a small part of the
obligations and responsibilities that Canada as a full member needs to follow and there are many more
that need to be considered.
14
2.8 E-waste Categories
E-waste or WEEE covers a wide range of products that contain different materials. These materials can
be divided into the hazardous and non-hazardous categories. Each category consists of 1000 different
substances ranging from ferrous materials such as iron and steel which account for more than 50% of the
e-waste substances to other materials such as plastic accounting for 21% as well as other non-ferrous
metals such as gold, silver, aluminum, platinum which account for 13% of the overall substances of the
WEEE products respectively [42].
The main type of products are categorized into 10 different sections, each of which contains a wide
range of different electronic products. These categories are sorted by United Nations Environmental
Program and EU directive as follows [42, 43];
1. Large household appliances: i.e. Refrigerators and freezers
2. Small household appliances: i.e. Toasters and coffee machines
3. IT and telecommunications equipment: i.e. Mobile phones and computers
4. Consumer equipment: i.e. Television sets and video cameras
5. Lighting equipment: i.e. Straight fluorescent lamps and compact fluorescent lamps
6. Electrical and electronic tools (with the exception of large-scale stationary industrial tools): i.e.
Tools for welding and soldering
7. Toys, leisure and sports equipment: i.e. Video games and electric toys
8. Medical devices (with the exception of all implanted and infected products): i.e. Radiotherapy
and dialysis equipment
9. Monitoring and control instruments: i.e. Thermostats and smoke detectors
10. Automatic dispensers: i.e. Automatic dispensers for hot drinks [42, 43]
15
One issue that should not be overlooked and must be considered in all of the above categories,
especially in the IT and telecommunications sectors, is the effect of hazardous chemical compounds
among the 1000 substances which influence the environment, despite a less elevated effect with respect
to the other factors. Gallium is one of the 200 different chemical compounds of a mobile phone and is
toxic; however, it has not been documented vastly in literature. Few environmental organizations such as
Greenpeace in recent years have started to document Gallium as well as other toxic materials that may
have been overlooked [28].
2.9 Similar Studies
There are several quantitative and qualitative studies done in this field which have heavily influenced the
core of this thesis. This section briefly outlines these studies and their findings.
In similar studies to this topic, Nordbrand [28] investigated the e-waste trade flows from the EU to
developing countries. It is a concentrated study on the trade flows of the European countries, especially
Sweden, and the export of the second hand goods and the e-waste illegal trade flows to the developing
countries.
This paper evaluates the Euro zone policies, and the paper mentioned improvements for these
regulations. It also cites illegal movements that occur in different formats such as mislabeled shipments
within the import and export countries for covering up and rounding the regulations for the illegal exports,
and concludes that factors such as price reduction of the valuable substances such as metal can decrease
the motives of the importing countries for receiving the e-waste products.
Furthermore, Nordbrand [28] mentioned that besides all the findings, there is still a further need for
future studies on this topic in the international platform for more findings in the e-waste trade flow
between EU and the other courtiers.
Another similar study by Rolf et al. [27] was conducted on the global perspectives on e-waste. The
paper studied different aspects of e-waste in the global format from facing challenges by different e-
waste categories expansion to environmental problems that may cause in different parts of the world,
especially among developing nations such as China, India and South Africa. They studied in detail
16
various definitions of e-waste as defined by different organizations, and tried to investigate more on the
role of managerial approach between developed and developing countries and the effect of domestic and
international regulations on the trades between them.
In conclusion, Rolf et al. [27] mentioned three major obstacles in industrial countries that may cause an
effect on the management of the end life of products, obstacles such as; lack of reliable data and
appropriate international standards and finally lack of a safe WEEE recycling infrastructure.
Furthermore in another series of related studies done by Lepawsky and his colleagues in 2010 [44] and
2014 [45]. Lepawsky and Mcnabb [44] investigated mapping international flows of electronic waste,
with the intent of identifying the global e-waste direction in different timing periods. They used the UN
COMTRADE database for this analysis and as shown in Figure 2-1 for the year 2001 and in Figure 2-2
for the year 2006, their calculations identified the direction and the changes in the volume of the trade
flow between the seven world continents.
In the mapping procedure, Lepawsky and Mcnabb [44] mentioned a few findings that are important to
consider. It is important to note that the global volume estimation of the e-waste is a tricky job and it is
due to this main reason that there is still a lack of a proper e-waste definition as a trade category.
Because of this issue, the trade systems recognized the old and the new computers under a same trade
data category, which makes the tracking hard because of the difficulty found in differentiating them.
Therefore, it is because of these issues that a proxy measure is required in order to map the international
regions where global trade is found to affect e-waste.
Also Lepawsky and Mcnabb [44] conducted tests incorporating the pollution haven hypothesis in order
to provide correct reasoning for their observed trends as shown in e-waste with respect to the
international trade. There are two ways in which this is done; one way is through the analysis of each
nation’s net trade balance on an annual basis against measures of relative wealth and poverty whereas
the second way by means of examining each transaction between trading countries in regards to their
GDP per capita.
Lepawsky and Mcnabb [44] conclude from the results of their analysis that there are four major findings.
Firstly, the complexity of the e-waste global map is more than just a simple export from industrialized to
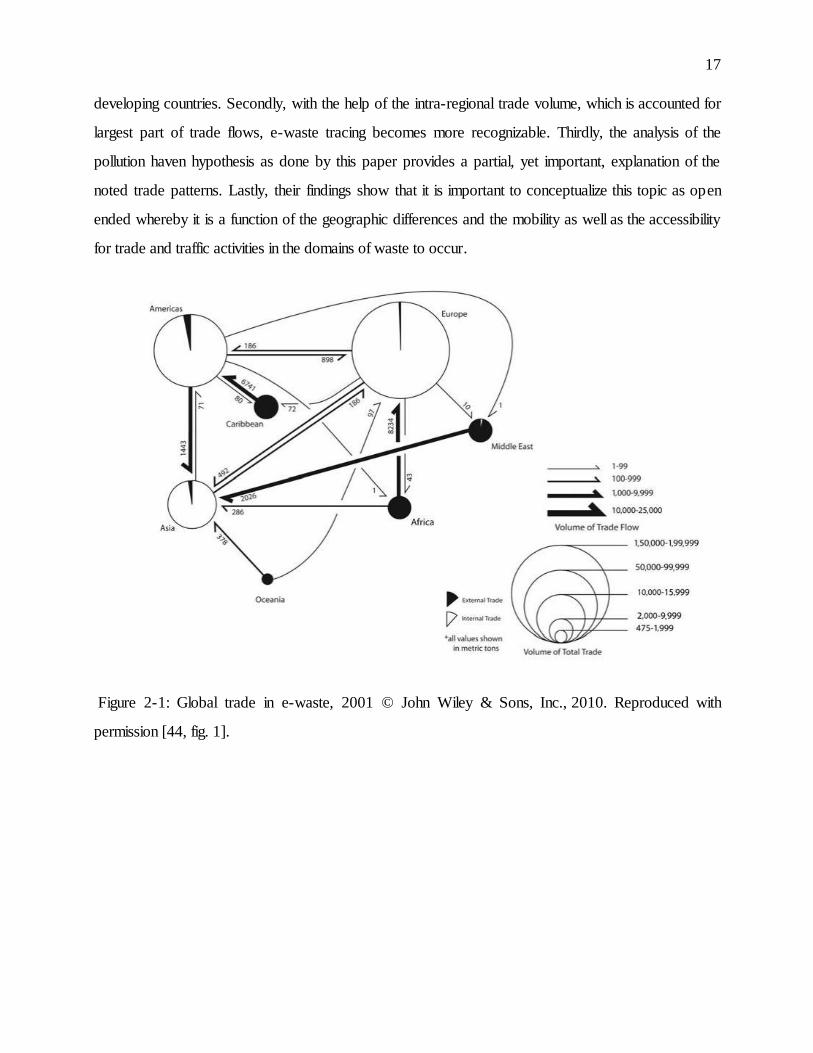
17
developing countries. Secondly, with the help of the intra-regional trade volume, which is accounted for
largest part of trade flows, e-waste tracing becomes more recognizable. Thirdly, the analysis of the
pollution haven hypothesis as done by this paper provides a partial, yet important, explanation of the
noted trade patterns. Lastly, their findings show that it is important to conceptualize this topic as open
ended whereby it is a function of the geographic differences and the mobility as well as the accessibility
for trade and traffic activities in the domains of waste to occur.
Figure 2-1: Global trade in e-waste, 2001 © John Wiley & Sons, Inc., 2010. Reproduced with
permission [44, fig. 1].
18
Figure 2-2: Global trade in e-waste, 2006 © John Wiley & Sons, Inc., 2010. Reproduced with
permission [44, fig. 2].
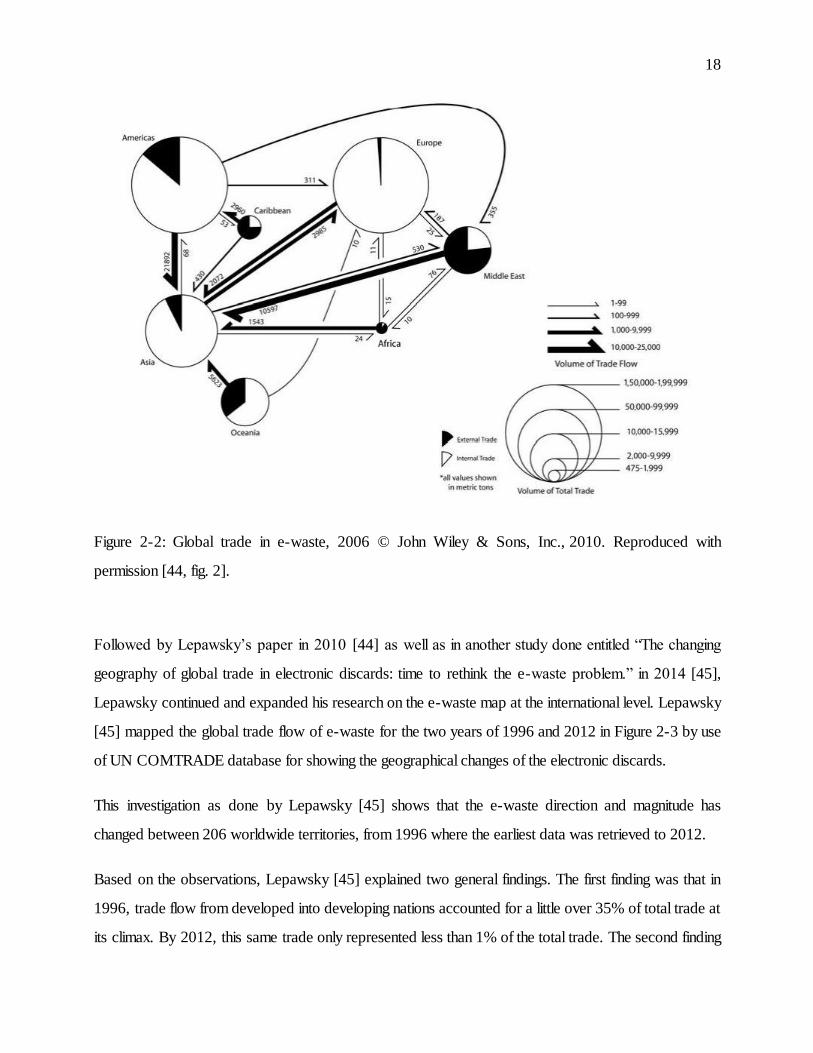
Followed by Lepawsky’s paper in 2010 [44] as well as in another study done entitled “The changing
geography of global trade in electronic discards: time to rethink the e-waste problem.” in 2014 [45],
Lepawsky continued and expanded his research on the e-waste map at the international level. Lepawsky
[45] mapped the global trade flow of e-waste for the two years of 1996 and 2012 in Figure 2-3 by use
of UN COMTRADE database for showing the geographical changes of the electronic discards.
This investigation as done by Lepawsky [45] shows that the e-waste direction and magnitude has
changed between 206 worldwide territories, from 1996 where the earliest data was retrieved to 2012.
Based on the observations, Lepawsky [45] explained two general findings. The first finding was that in
1996, trade flow from developed into developing nations accounted for a little over 35% of total trade at
its climax. By 2012, this same trade only represented less than 1% of the total trade. The second finding
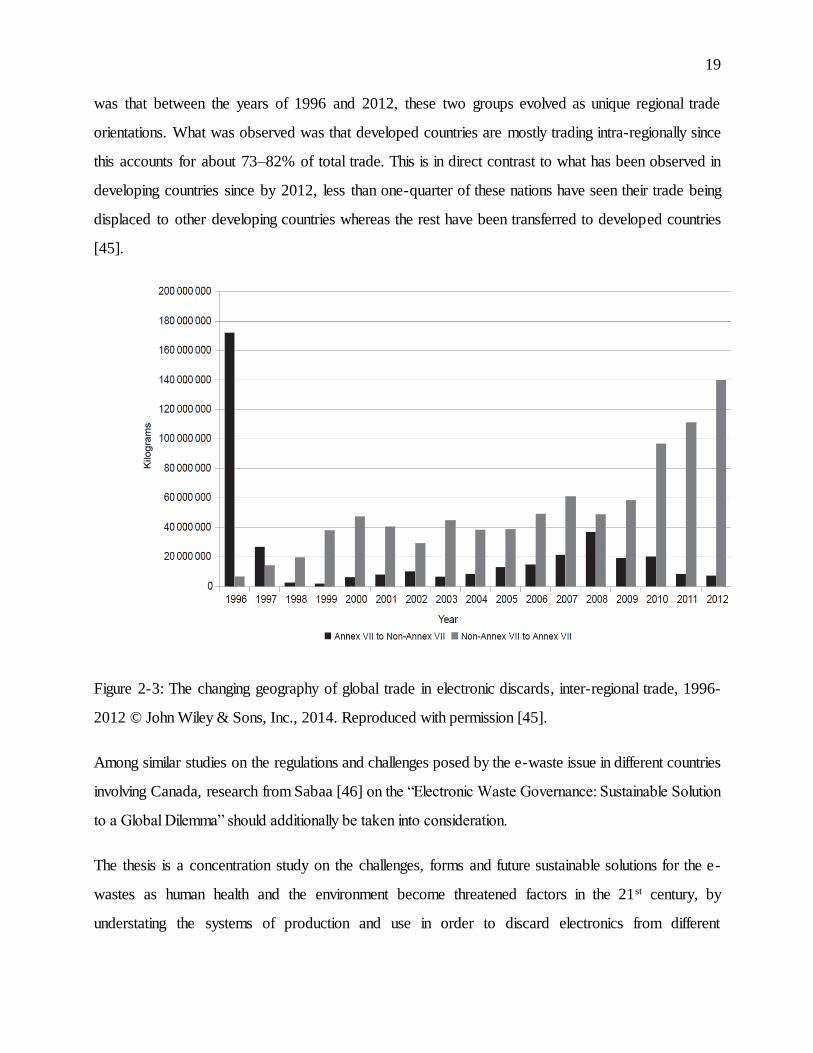
19
was that between the years of 1996 and 2012, these two groups evolved as unique regional trade
orientations. What was observed was that developed countries are mostly trading intra-regionally since
this accounts for about 73–82% of total trade. This is in direct contrast to what has been observed in
developing countries since by 2012, less than one-quarter of these nations have seen their trade being
displaced to other developing countries whereas the rest have been transferred to developed countries
[45].
Figure 2-3: The changing geography of global trade in electronic discards, inter-regional trade, 1996-
2012 © John Wiley & Sons, Inc., 2014. Reproduced with permission [45].
Among similar studies on the regulations and challenges posed by the e-waste issue in different countries
involving Canada, research from Sabaa [46] on the “Electronic Waste Governance: Sustainable Solution
to a Global Dilemma” should additionally be taken into consideration.
The thesis is a concentration study on the challenges, forms and future sustainable solutions for the e-
wastes as human health and the environment become threatened factors in the 21st century, by
understating the systems of production and use in order to discard electronics from different
20
stakeholders. In this way, Sabaa [46] studied the institutions as well as the governmental regulations that
were formed to confront this global issue by posing different national and international regulations such as
banning the export of the electronic wastes towards developing countries and the mandatory recycling
policies.
The Sabaa [46] thesis studied in detail parts of the Basel convention, looking at perspectives from its
history and creation to its different Annexes. It also investigated the role of the Basel Ban as well as its
obligation and impact on different Basel members. Furthermore, the thesis went through the WEEE
legislations in different part of the world, including North America (mainly U.S and Canada), Asia
(mainly China) and Europe, at the state, provincial and national levels.
It concludes that directives such as the restriction of hazardous substances (RoHS) and programs such
as extended producer responsibility (EPR) at the state-level are not the only possible solutions and that
the appropriate treatment for solving the e-waste generation problem is to create more improvements
and reforms. On the other hand, imposing trade restrictions and instilling clean production cannot truly be
the solution for confronting the global environmental crisis concerning e-waste; rather, it needs a more in-
depth analysis of the functional and cultural aspects of everyday life among members of these societies in
order to better understand their relation with electronic goods and services [46].
By analyzing these similar studies and to the best of the author’s knowledge, there have been limited
studies done on the trade flows of Canadian e-waste to the other countries. Therefore, this study can be
a light for future studies on this topic. Also, by further investigating this trade flow, the Canadian
environment and economy can obtain benefits in the short and the long run.
21
CHAPTER 3 REGULATIONS AND LEGISLATIONS
3.1 Canada’s Federal E-waste Legislations
This chapter directly relates to the first defined objective of the thesis with respect to identifying the
domestic and international trade factors as well as their potential effects on the trade flow of electronic
waste in Canada. It will take a specific look at the regulations and legislations as the most important
elements of these factors. In this way, Canada’s e-waste domestic regulation at the federal and the
provincial basis will be discussed followed by its comparison to the other developed countries including
U.S and the European Union countries.
At the federal level, Canada has not defined any specific legislation for e-waste management. Similarly,
the United States has also not defined any particular federal legislation for recycling of the e-wastes.
Both countries set e-waste legislations at the provincial and state level respectively; however, the
Canadian federal government indirectly influences e-waste regulations by way of the laws passed on
toxic substance control [47, 48]
Despite this fact, the Canadian government gains from the e-waste strategy involving the reuse and
leverage of the existing mechanisms put in place which was introduced in February 2010 by the Public
Works and Government Services Canada (PWGSC) for better recycling in an environmentally sound
manner for all electronic and electrical equipment. Based on Government of Canada, in just 2011/2012,
the federal government spent around $1.2 billion on the disposal of a wide array of electronic and
electrical equipment [12].
For better recycling the end-of-life electronic products at the national level, Canada introduced the
Electronic Products Recycling Association (EPRA) in 2011, a not-for-profit association created by
Canada’s electronics industry, responsible for promoting and managing the e-waste products in the
volunteer provinces. Currently, the program is operating in the provinces of Quebec, Saskatchewan,
British Columbia, Manitoba, Prince Edward Island, Nova Scotia and Newfoundland and Labrador [49,
50].
22
Based on EPRA annual report in 2012, there are more than 3,000 stewards registered in the program in
the entire country with up to 700 permanent collection sites and over 40 verified processors. Also based
on EPRA claims, the program safely collected and recycled over 25,000 tonnes of e-waste in 2012
alone at the national level [50].
Furthermore, with respect to the legislative aspect at the federal level, the governmental approach on the
e-waste issue is based on a two-tier approach:
1. Discovering new ways to confront and minimize the issue of toxic materials used in electronic
products.
2. Finding methods to promote the minimization of the release of end of life toxins [51].
3.2 Canada’s Provincial E-waste Legislations
In this section, the Canadian provincial legislations on e-waste will be studied by using the latest data and
information with respect to their regulations and program performance, going from the largest to the
smallest producer. At the moment of conducting this study, nine provinces have passed and use e-waste
legislation through extended producer responsibility (EPR) for better management of the issue of end-of-
life electronic products.
At the end of this section, comparisons on the policies, used programs and statistics among provinces
will be evaluated in order to clearly show the impact of current legislation among these areas.
3.2.1 Ontario
The first WEEE regulation for the issue of waste in general was created in December 2004 under
Ontario’s Waste Diversion Act (WDA) which was passed as law in 2002, with aim of decreasing,
reusing and recycling of the selected waste products [48, 52]. Following the introduction of this
regulation, provincial legislation was established in April 2009 particularly for the collection, reuse and
recycling of electronic products while the province launched the WEEE program and the followed the
obliged legislations for a limited category of electronic products. As of April 2010, the program
expanded to the 44 designated items, categorized under eight major material types, which include
23
“…Display devices, desktop computers, portable computers, computer peripherals, printing,
copying and multi-function devices, telephones and telephone answering machines, cellular
devices and pagers, image, audio and video devices…” [53], for legalizing the obligation of collecting
and recycling the end-of-life Electrical and Electronic Equipment (EEE) under regulation of 393/04 for
the entire province [53-55].
The managerial and implementation aspects of the program have been allocated to the Ontario Electronic
Stewardship (OES), which is a non-for-profit industrial funding organization developed with the intent of
collecting fees from industry stewards in order to better manage the WEEE program. The initiative is
done on behalf of the Ontario government as well as the electronics industry. In this initiative, plans have
been approved by Waste Diversion Ontario (WDO) and the Ministry of the Environment [52, 54].
Currently, more than 600 collection sites are active throughout the province due to this program [56],
which is the highest number among all provinces in the country.
Furthermore, the responsibility of monitoring for tracking the quality performance of the program has
been allocated to the Waste Diversion Ontario (WDO), and then gets reported directly to the Ontario
ministry of the environment [54]. According to information from December 2012 from the WDO, over
200,000 tonnes of e-waste has been efficiently processed for extracting purposes in order to draw out
both valuable and reusable materials due to the implementation of this program from its inception in 2009
onwards [52].
The timing of launching such a program in 2009 does not match the expansion of electronic products and
the technology improvements from prior years; it would have been more appropriate to have had the
program implemented in the early 2000s. Despite this fact, the program shows proper improvements
over the years of operation from its creation time, from collecting 1.31 kg/capita of electronic and
electrical equipment in 2009-2010 to 5.61 kg/capita and 5.67 kg/capita in 2012 and 2013 respectively,
which is expected to be the highest rate in the EPS program among all provinces throughout the country
[57, 58].
It should be noted that Ontario, as the most populated province in Canada, is estimated to own more
than 38% of all electronic devices throughout the country. It seems reasonable that Ontario would,
therefore, have the largest EPS program with respect to all other Canadian provinces, as Ontarians
24
produce the largest amount of e-wastes annually. Looking at mobile phones alone, 81% of Ontarians
own at least one mobile device which represents 42% of the Canadian population [59].
The use of electronic devices is increasing annually since new technologies are constantly replacing
existing ones and that both the Ontarian and Canadian populations are on the rise; therefore, it is
reasonable to assume that the growth rate of the e-waste generated in response to these changes would
increase each year as well. Additionally, statistics show that 80% of Ontario households were in
possession of at least one out-of-use device in 2010 alone. In the year after and in the individual’s
electronics rate, this number increased to the 90%, where in other words 1 out of every 10 individuals,
had at least one out-of-use electronic device [59]. Based on this data and by considering the potential
amount of e-waste that is expected to be produced over the coming years, the future blueprint for
improvements towards the WEEE program as well as better management and monitoring of the OES
and WDO should be of utmost importance for the Ontario government.
3.2.2 Quebec
Regulation Respecting the Recovery and Reclamation of Products by Enterprises (Q-2, r. 40.1) has
been established as the core of e-waste regulation in November 2009 under the Environment Quality
Act (EQA) to confront the issue of WEEE in the province. The legislation came into effect in July 2011
through initial mandatory policies for electronic producers to manage to collect and recycle specific
electronic product categories in the province [60].
The Société Québécoise de Récupération et de Recyclage (Recyc-Quebec) is the initial responsible
organization for implementing e-waste regulations in the province. This is a provincial organization which
was founded in 1990 with the intent of controlling, reducing, and recycling waste in general for the
province of Quebec [48].
Also to continue with this improvement process, Quebec implemented the EPRA stewardship program
which was introduced and established in May 2012 and recognized by Recyc-Quebec. EPRA-Quebec
claims it created 270 collection sites throughout the province in 2012, which is considered to be a great
number for such a short period of time since its inception [50]. However, despite this large number of
collection sites that have been created, the province ranked last among the other provinces with respect
25
to its performance for having the lowest collection rate of the 1.30 kg/capita based on the latest data
released by the EPRA for the 2013 [61].
The sites are responsible for the collection of end-of-life electronic products under twelve major
categories free of charge. These categories include “…Portable Computers, Desktop/Countertop
Computers, Computer and Video Game Peripherals, Display Devices, Cellular Devices and
Pagers, Desktop Printers/Scanners/Fax Machines/Copiers and Multi-Function Devices, Floor-
Standing IT Equipment, Personal/Portable Audio/Video Systems, Non-Portable Audio/Video
Systems, Vehicle Audio/Video and Navigation Systems, Home Theatre in a Box, Non-Cellular
Telephones and Answering Machines…” [62]. From October 2012, environmental handling fees
(EHFs) have been introduced in the province and EPRA-Québec is responsible for collecting these fees
[63, 64].
3.2.3 British Columbia
The first waste legislation movement in B.C. started in July 2004, after creation of the Environmental
Management Act (EMA) by the Ministry of the Environment. The movement continued by the
introduction of British Columbia’s Recycling Regulation in October of the same year for recycling and
the waste category in general for protecting the environment in the province [65]. Under this act,
electronic producers must be approved as of August 2007 by one of the provincial electronic product
stewardship programs (PSPs) in the province; either the Electronic Products Recycling Association
(EPRA), formerly known as Electronic Stewardship Association of BC (ESABC) which is operated by
the Encorp Pacific, or Canadian Wireless or Telecommunication Association [50, 66].
Despite the fact that the EPRA (formerly known as ESABC) was active in the province since 2007, the
province officially established and implemented its own Electronic Products Recycling Association in
2011 [67]. Since its official establishment, the association claims a couple of successful e-waste
collection reports of 4.7 kg/capita for 2011 and 4.8 kg/capita for 2012 [50, 68]. This number in 2013
increased to the 5.04 kg/capita collection level, which put B.C. the same as the Nova Scotia in the rank
second among the other member provinces [61]. This is taking into account that this number for 2010
and before the official change from ESABC to EPRA was only 3.8 [68].
26
It must also be mentioned that, with respect to the advantages of the recycling regulations and its
implementation system in the province, the main positive point to be retained is the responsibility of
recycling and its financial liabilities on the producers and consumers involved in the transaction of
electronic products rather than placing these burdens on the tax payers in society. Therefore, following
these regulations, it is the responsibility of the producers to efficiently manage their products end-of-life
[69].
In B.C, as well as in some other provinces, the recycling implementation of the electronic and electrical
equipment (EEE) has been introduced in different phases according to the schedule set out for various
products. The phases include five time periods with different electronic products, starting in 2007 by
“…televisions, computers, computer monitors, keyboard, mice and other peripherals and
printers…” [69]. After the first two years of implementation of this phase from 2007, there has been
about 4,200 metric tonnes of e-waste that has been prevented from entering landfills; currently, about
1200 metric tonnes of e-waste is diverted on a monthly basis [34].
The second phase has been implemented three years later in 2010 for electronics such as; “…Cell
phones, audio-visual and consumer equipment, thermostats, batteries products and residential
compact fluorescent light (CFL) bulbs…” [69], followed by the third and the fourth phases being
implemented in 2011 for products such as smoke detectors and small appliances [69].
The fifth and final phase with a broader range of products list introduced and came into effect in 2012,
included “…large appliances, electrical and electronic tools, medical devices, automatic
dispensers, lighting equipment, toys, leisure and sports equipment, monitoring and control
instruments, and telecommunications equipment…” [69].
3.2.4 Alberta
Despite the fact that Alberta is ranked fourth among the other provinces with respect to the production
of electronic waste in the country, Alberta is the premier leader in the e-waste regulatory throughout the
country. Alberta was the first province to establish its own e-waste management program under
Environmental Protection and Enhancement Act (EPEA) and based on the Canadian Council for
Ministers of Environment (CCME) principles in October 2004 serving as a pioneer in this domain [51].
27
The program is run by the Alberta Recycling Management Authority (ARMA), in accordance with the
Designated Material Recycling and Management Regulation and Electronic Recycling Bylaw, for
mandating electronics producers to pay an environmental handling advance disposal fee for a select
basket of electronic products before selling into the market [66, 70].
These surcharges are allocated to all suppliers who import or produce designated new electronics into
Alberta’s electronics market, and mandates all the electronics suppliers to be registered by ARMA
regardless of, despite the fact that they may be subject to paying the required stewardship fees [66].
Regarding its performance, e-waste collection and recycling statistics show that the success rate of the
program varies in depending on the year. As of the latest data for 2012/2013, the program has
succeeded in processing 4.67 kg/capita of e-waste, which is the equivalent of 17,280 metric tonnes. It
should be noted that this number is very close to the processing rate of three years earlier 2009/2010
where the processing rate was 4.57 kg/capita. Aside from these mentioned results, for the years of
2008/09, 2010/11 and 2011/12, the processing rate were lower, sitting at 4.30, 4.28 and 4.40
kg/capita respectively [71]. Also on the forecasting side, ARMA predicts a forecast of 4.79 kg/capita
for the current year of 2013/2014 as a preparation stage for jumping to the coming years processing and
collection target rate of 5 kg/capita [72].
With respect to ARMA’s claims, there has been a significant amount of computer equipment and
television devices that have been recycled by Albertans since the start of the program, totaling to
approximately six million units. Due to the program, it is estimated that 129,000 metric tonnes of
recyclable material such as metal, plastic, and glass have been effectively extracted and shipped into the
marketplace for the future use [73].
Also based on ARMA report, more than 350 collection sites are currently operating in the entire
province for the collection of the designated list of electronics waste. This consists of; “…Televisions,
computer monitors, CPUs, keyboards, cables, mice, speakers, laptops, notebook computers and
printers…” [73].
28
3.2.5 Manitoba
One of the provinces that recently passed law and operated the EPRA program for controlling and
decreasing e-waste is Manitoba. Although the province gains from the initial regulation for reducing solid
wastes in general since 1990 under the Waste Reduction and Prevention (WRAP) act, the direct
regulation for the electronic waste came into force under WRAP in February 2010 also known as
Manitoba’s Electrical and Electronic Equipment Stewardship Regulation [66, 74].
Under this regulation, province set the planned target date for establishing an industrially-led program for
April 2011 with implementation coming into effect as of April 2012 [66]. Therefore, in order to reach
these targets, in 2011 the EPRA has been started up by the Retail Council of Canada (RCC) and the
members of the Electronics Product Stewardship Canada (EPSC), and has been launched in August
2012 [75, 76].
Based on the EPRA claims, the Manitoba program successfully recycled and collected over 1349 metric
tonnes of end-of-life electronic products without causing any harmful effects to the environment from the
beginning of its existence in August 2012, of which 830 metric tonnes comes from the first five months of
the program operation [50, 76]. The 2013 report shows that this number increased to the 3,026 metric
tonnes, which is the equivalent of the 2.38 kg/capita [61]. Furthermore, it is estimated that as of that
date, the program succeeded in attracting more than 380 stewards to join the association [76].
Similarly to the other provinces, Manitoba’s EPRA program only collected the designated basket of
electronics for the purpose of recycling. At the time of conduction of this study, the accepted list is
limited to the following items: “…Display Devices, Desktop Computers, Portable Computers,
Printers/Scanners and Fax Machines, Computer Peripherals, Non-Cellular Phone and Answering
Machines, Home Audio/Video Systems, Home Stereos Systems or Components, Vehicle
Audio/Video System, Counter Top Microwave Ovens, Personal Portable Audio/Video and Floor
Standing Multi-Function Devices…” [77].
29
3.2.6 Saskatchewan
The Waste Electronic Equipment Regulations, which came into effect in February 2006, was established
under the Environmental Management and Protection Act of 2002 as the core regulation for electronic
waste in the province. The regulation has been amended in 2009 [78].
On the operational side, the Saskatchewan Waste Electronic Equipment Program (SWEEP) was
created in late 2006 and came into effect in February 2007 by the government of Saskatchewan for
coordinating the collection and recycling of the end-of-life electronic products [79, 80].
In April 2013, members of SWEEP have passed the motion of dissolving SWEEP entirely in favor of
integrating as part of the EPRA in order to find more efficient ways for diverting the end-of-life of
designated waste electronics coming from landfills as well as illegal exports, among other efficiencies
gained by becoming a part of a program on the national level. Hence, EPRA/SWEEP has been formed
[81, 82].
From a performance point of view based on claims by SWEEP, since its establishment in 2007, the
program successfully collected more than 15,000 metric tonnes of the end-of-life electronic products
and prevent them from landfill disposal. From this amount, more than 6,000 metric tonnes is a result of
the last two years of operation [82]. Also based on the EPRA report, the province had a collection rate
of 3,288 metric tonnes, which is equivalent to 2.95 kg/capita for 2013 [61].
The program currently accepts the designated end-of-life electronics in 71 recycling plants across the
province and Saskatchewan's Ministry of Environment has the responsibility of surveying program
performance as well as ensuring that industrial compliances with the Waste Electronic Equipment
Regulations are met and satisfied [79].
The SWEEP list of collection electronics for the purpose of recycling is almost the same as the Manitoba
EPRA, with four differences. In Manitoba there are two additional collection lists of Floor Standing
Multi-Function Devices and Counter Top Microwave Ovens which is non-existent in Saskatchewan’s
list, and in front in Saskatchewan EPRA, there is the list of Home Theater In-A-Box (HTB) Systems
which does not exist in Manitoba’s EPRA collection items. Additionally in Saskatchewan, the cell phone
30
category is managed by the Canadian Wireless Telecommunications Association (CWTA) which is not
the case in Manitoba [77, 83].
3.2.7 Nova Scotia
According to the government of Nova Scotia, the e-waste regulation in this province is the first of its
kind in Atlantic Canada [84]. The Electronic Product Stewardship Regulations has been designed and
proposed under the sections 18J to 18Q (Electronic Products Stewardship Program) in the amended
version of Solid Waste-Resource Management Regulations in February 2007; it has been approved as
law in July 2007 for recycling and diverting the end-of-life electronics from landfill disposals throughout
the province [84-86].
The program came into effect in two phases for the collection of the designated basket of end-of-life
electronic products. The first phase began in February 2008 and includes the following categories:
(Televisions, Notebook and Desktop computers and their lateral components, Computer monitors and
printers). In February 2009, the second phase began and consists of the following categories:
“…Computer Scanners, Audio and video playback and recording systems, Telephones and fax
machines, Cell phones and other wireless devices…” [86], by the Atlantic Canada Electronic
Stewardship (ACES) which is the organization responsible for managing the program, with the exception
of cell phones and other wireless devices. These particular devices are under the control of the Recycle
My Cell program, which is a part of the Canadian Wireless Telecommunications Association (CWTA)
[84, 86, 87].
Currently the list has slightly been expanded to include four additional categories based on the Nova
Scotia EPRA; these include: “…Personal or Portable Audio/Video Systems, Vehicle Audio/Video
Systems (After market), Home Theater in a Box (HTB) Systems and Home Audio/Video
Systems…” [88].
It is estimated that in 2003 alone about 4500 metric tonnes of e-waste has been generated in the
province. Based on this finding, the e-waste generated for 2010 was predicted to be almost 5000 metric
tonnes [50]. For controlling the generation of the e-waste on an annual basis, the EPRA has succeeded
in collecting 4719 metric tonnes of e-waste, the equivalent of 4.97 kg/capita in 2012. This is higher than
31
the 4354 metric tonnes collected in 2011, the equivalent of 4.61 kg/capita [87]. This improvement
increased in the year after as well, as the province succeeded in collecting 5.04 kg/capita in 2013 [61].
This program currently accepts the designated end-of-life electronics in 37 drop-off plants across the
province. Nova Scotia Environment, which oversees climate change and protecting the environment, has
the responsibility of surveying program performance in order to ensure that industrial compliances are
maintained and put into effect with the Waste Electronic Equipment Regulations [87].
3.2.8 Newfoundland and Labrador
Following the amendment found in the Waste Management Regulations, 2003 under the Environmental
Protection Act that has been taken into effect as of October 2012 (O.C. 2012-288), Newfoundland
and Labrador became the last province in Canada to introduce e-waste regulations for managing,
collecting and recycling the WEEE [89].
In August 2013, the EPRA has been launched in the province and Newfoundland and Labrador. The
EPRA has been designated as the organization responsible for managing the end-of-life electronics
program in the province [90]. Based on the fact that this has recently come into effect, there is no report
that has been published regarding the collection and recycling performance of the program, though it is
expected that the first year performance report of the program will be published by the EPRA by the end
of 2014.
Primarily, it was estimated that the EPRA will begin establishing somewhere between 17 and 19
permanent drop-off locations covering the entire province of Newfoundland and Labrador, effective as
of the first year of this initiative, based on the EPRA report [90]. But, based on the most recent data
available on the Newfoundland and Labrador EPRA website, the program has succeeded in running 21
collection sites throughout the province from the conduction of this study [91], and currently the
designated collection list of electronics is the same as what is found in Nova Scotia [88, 92].
32
3.2.9 Prince Edward Island
The Materials Recycling Regulations, which was passed under the Environmental Act and has come into
effect in July 2010, is the first regulation for end-of-life electronics disposal and recycling in the province
for diverting designated end-of-life electronics from the landfills disposal and preventing their illegal
exportation to other countries [66, 93].
In the same year, Prince Edward Island has come into an agreement with Atlantic Canada Electronics
Stewardship (ACES) so that the development, effectiveness and administration of an end-of-life
electronics stewardship program is applied all over the province. As a result, ACES became the
organization responsible for managing the program [48]. Since July 2013, both the provinces of Prince
Edward Island and Nova Scotia have officially merged into national EPRA [61].
Based on the EPRA report for 2013, the program succeeded in collecting and recycling 645 metric
tonnes, which is the equivalent of 4.44 kg/capita of the designated end-of-life electronic products in this
year [61]. This is almost the same as the year before where 649 metric tonnes, which is the equivalent of
4.44 kg/capita, was also collected and recycled [50]. This is in the situation that from July 2010 to
March 2011, statistics show collection rates were lower at 3.81 kg/capita, which is the equivalent of 543
metric tonnes [94].
In order to monitor the program’s performance, the Prince Edward Island Department of Environment,
Energy and Forestry has been designated as the organization responsible for ensuring that the
performance and industrial compliances are satisfied according to what is specified in the Materials
Recycling Regulations [94].
As of conducting this study, six drop-off locations are operating for the collection of the designated list of
end-of-life electronics in the province [95]. Additionally, the designated collection list of electronics is
currently the same as that found in the EPRA lists in Saskatchewan, Nova Scotia as well as
Newfoundland and Labrador [83, 88, 92, 96].
33
3.3 Non E-waste Regulated Provinces
Despite the fact that it is beneficial for all Canadian provinces and territories to implement environmental
protection legislations and policies for controlling waste in general, this study has found that New
Brunswick, Yukon, the Northwest Territories, and Nunavut have not yet defined any specific regulations
regarding the e-waste issue.
Although province of New Brunswick gains from having a limited environmental stewardship program, it
presently has not been expanded to the category of e-waste. In this province, the program is only
designed for the collection and recycling of tires, paint, oil and glycol [97].
One of the possible reasons that legislation has not been created may be due to the low population found
in these areas because they have been ranked as the lowest populated areas in the country. Therefore, it
is not surprising to see that this issue is not highlighted in these areas.
3.4 Legislations Comparison
3.4.1 Provincial Legislation Comparison
This section is divided into two main categories of legislation similarities and differences among provinces
that gain from the e-waste regulation.
From a legislative perspective, one of the main likelihoods is the fact that the responsible association for
managing the stewardship programs in eight out of the nine provinces which gain from the e-waste
regulation is the electronic products recycling association (EPRA), with exception of Alberta since
Alberta Recycling is the association that is in charge.
In contrast, the differences are divided into four main categories which include: legislation launching and
implementing time frame, designated electronics basket, performance/efficiency comparison and total
program cost per metric tonne of collection. Table 3-1 shows the establishment and implementation time
period of WEEE for nine provinces. As it can clearly be seen on the launch timing and implementation
period, Alberta can be ranked as the province with the oldest launch date whereas Newfoundland and
Labrador is the most recent.
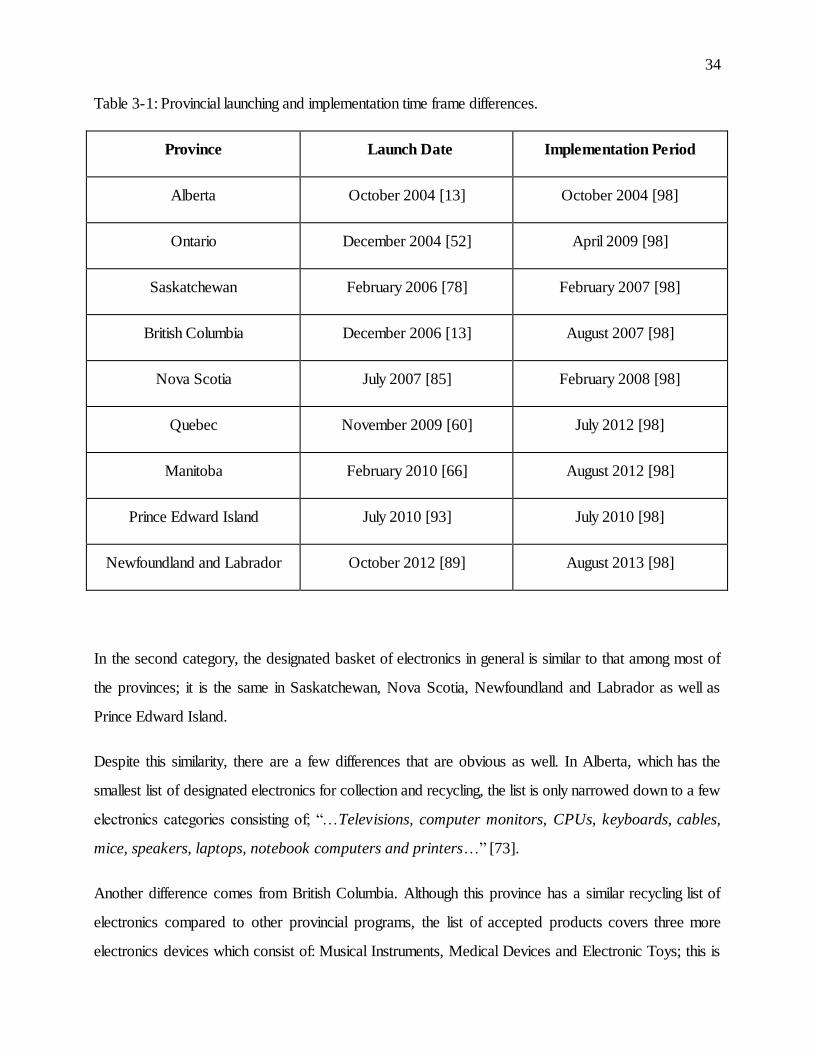
34
Table 3-1: Provincial launching and implementation time frame differences.
Province Launch Date Implementation Period
Alberta October 2004 [13] October 2004 [98]
Ontario December 2004 [52] April 2009 [98]
Saskatchewan February 2006 [78] February 2007 [98]
British Columbia December 2006 [13] August 2007 [98]
Nova Scotia July 2007 [85] February 2008 [98]
Quebec November 2009 [60] July 2012 [98]
Manitoba February 2010 [66] August 2012 [98]
Prince Edward Island July 2010 [93] July 2010 [98]
Newfoundland and Labrador October 2012 [89] August 2013 [98]
In the second category, the designated basket of electronics in general is similar to that among most of
the provinces; it is the same in Saskatchewan, Nova Scotia, Newfoundland and Labrador as well as
Prince Edward Island.
Despite this similarity, there are a few differences that are obvious as well. In Alberta, which has the
smallest list of designated electronics for collection and recycling, the list is only narrowed down to a few
electronics categories consisting of; “…Televisions, computer monitors, CPUs, keyboards, cables,
mice, speakers, laptops, notebook computers and printers…” [73].
Another difference comes from British Columbia. Although this province has a similar recycling list of
electronics compared to other provincial programs, the list of accepted products covers three more
electronics devices which consist of: Musical Instruments, Medical Devices and Electronic Toys; this is
35
not the case among other provinces. Also with respect to other differences, Manitoba’s Counter Top
Microwave Ovens list is another other unique element in the accepted list of electronics not found in
other provinces.
In the performance/efficiency collection comparison among the provinces, Ontario has the highest
performance rate among other provinces with the 5.61 kg/capita collection rate for 2012 and 5.67
kg/capita record for 2013. The provinces of British Columbia and Nova Scotia follow with the same
collection rates of 5.04 kg/capita for 2013 per province.
Alberta comes in third with 4.67 kg/capita, then Prince Edward Island with 4.44 kg/capita, making it the
last province with a collection rate above 4 kg/capita. The provinces at the bottom of the performance
list with collection rates of less than 4 kg/capita includes the provinces of Saskatchewan, Manitoba and
Quebec with the collection rates of the 2.95, 2.38 and 1.30 kg/capita respectively. These are weaker
performances when compared to global collection rates such as those from European countries and even
the other internal provinces.
Table 3-2 shows the provincial end-of-life electronics collection ranking for 2012 and 2013. As it can
clearly be seen, Ontario can be ranked as the province with the highest collection rate whereas Quebec
was the lowest one.
For the collection rate column from 2012, it should be noted that the provinces of Manitoba and Quebec
do not have any reported data. This is due to the fact that they have recently entered into the EPRA
program and the implementation period, which began at the end of 2012.
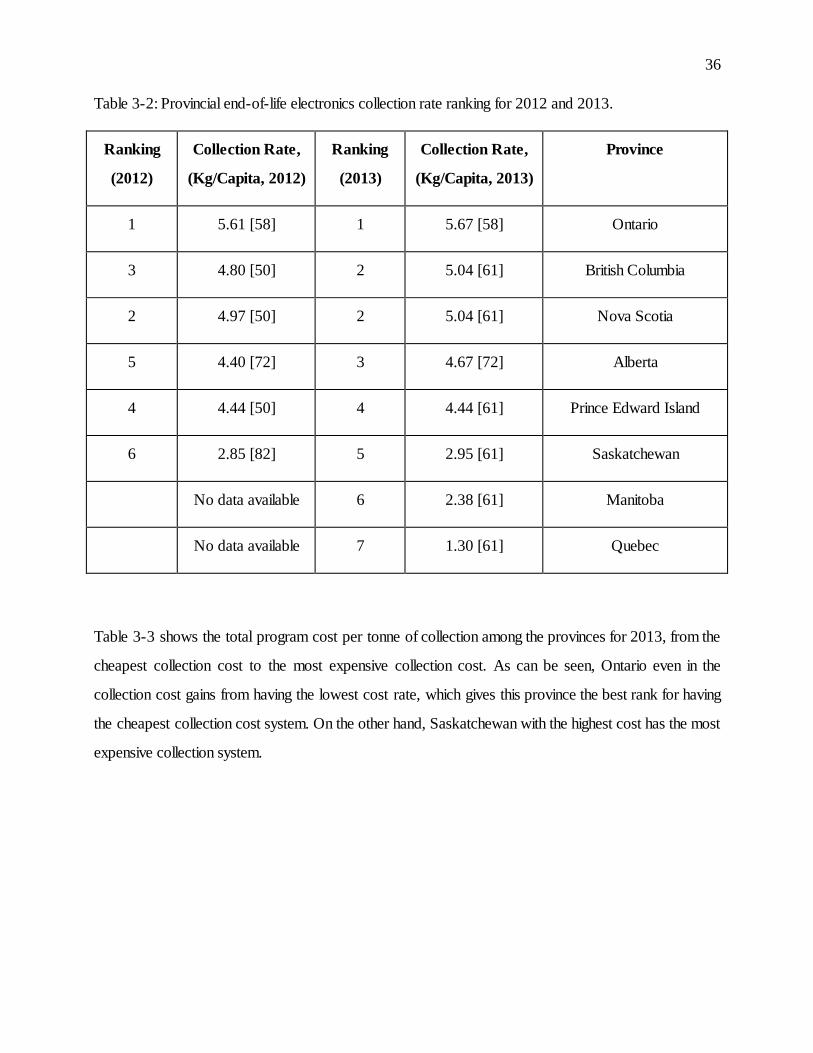
36
Table 3-2: Provincial end-of-life electronics collection rate ranking for 2012 and 2013.
Ranking
(2012)
Collection Rate,
(Kg/Capita, 2012)
Ranking
(2013)
Collection Rate,
(Kg/Capita, 2013)
Province
1 5.61 [58] 1 5.67 [58] Ontario
3 4.80 [50] 2 5.04 [61] British Columbia
2 4.97 [50] 2 5.04 [61] Nova Scotia
5 4.40 [72] 3 4.67 [72] Alberta
4 4.44 [50] 4 4.44 [61] Prince Edward Island
6 2.85 [82] 5 2.95 [61] Saskatchewan
No data available 6 2.38 [61] Manitoba
No data available 7 1.30 [61] Quebec
Table 3-3 shows the total program cost per tonne of collection among the provinces for 2013, from the
cheapest collection cost to the most expensive collection cost. As can be seen, Ontario even in the
collection cost gains from having the lowest cost rate, which gives this province the best rank for having
the cheapest collection cost system. On the other hand, Saskatchewan with the highest cost has the most
expensive collection system.
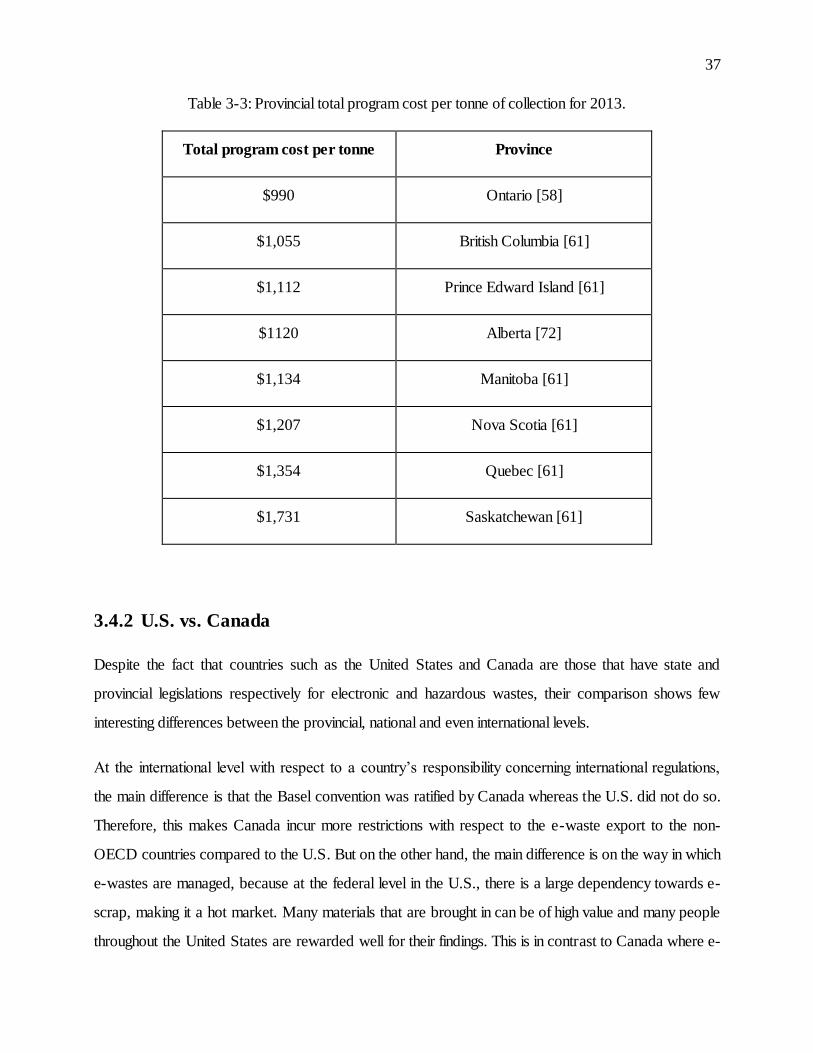
37
Table 3-3: Provincial total program cost per tonne of collection for 2013.
Total program cost per tonne Province
$990 Ontario [58]
$1,055 British Columbia [61]
$1,112 Prince Edward Island [61]
$1120 Alberta [72]
$1,134 Manitoba [61]
$1,207 Nova Scotia [61]
$1,354 Quebec [61]
$1,731 Saskatchewan [61]
3.4.2 U.S. vs. Canada
Despite the fact that countries such as the United States and Canada are those that have state and
provincial legislations respectively for electronic and hazardous wastes, their comparison shows few
interesting differences between the provincial, national and even international levels.
At the international level with respect to a country’s responsibility concerning international regulations,
the main difference is that the Basel convention was ratified by Canada whereas the U.S. did not do so.
Therefore, this makes Canada incur more restrictions with respect to the e-waste export to the non-
OECD countries compared to the U.S. But on the other hand, the main difference is on the way in which
e-wastes are managed, because at the federal level in the U.S., there is a large dependency towards e-
scrap, making it a hot market. Many materials that are brought in can be of high value and many people
throughout the United States are rewarded well for their findings. This is in contrast to Canada where e-
38
waste runs under a social program fuelled by the use of eco-fees, despite the fact that in most cases
individual recycling services are for profit organizations [99].
One of these differences at the provincial or state level includes the type of programs that are being used.
As of an example, among all states that have introduced similar programs as to that of the EPSC among
Canadian provinces, California and Maine are using similar programs with slight modifications. An
example of such programs is the use of the point of purchase environmental handling fees, which is a
similar program but with a different implementation. In Maine, fees vary because they depend on the
market share from individual manufacturers, something that is not applied in Canada [48]. On the other
hand, a number of U.S. states, regardless of whether a recycling legislation is in effect, have imposed
embargos on used electronic disposal coming from landfills [100], another measure which is not in effect
in Canada, with the exception of the province of Nova Scotia.
In regards to the legislation framework for hazardous waste including e-waste in the United States, dates
back to 1976 when the federal law governing the removal of solid and hazardous waste under the
platform of the resource conservation and recovery act (RCRA) was taken into effect. This law has been
amended three times later on in 1984, 1992 and 1996 in order to implement several modifications, such
giving more authority to the U.S. Environmental Protection Agency (EPA) in order to regulate the
disposal of hazardous wastes, including e-waste, for additional flexibility to implement appropriate
policies, or designing more dynamic regulations in order to implement effective land disposal methods of
certain wastes, or even allow what is stipulated in the RCRA to be enforced at Federal facilities [101].
3.4.3 Canada vs. European Union
Europe, without a doubt, has one of the best reputations with respect to other regions throughout the
world for monitoring, controlling and managing this issue; it is even ranked higher than North America,
implying that countries including Canada are inferior in comparison. Therefore, an investigation
comparing and contrasting the policies implemented between Canada and Europe can prove to be
beneficial for Canada.
One of these differences is the unique legislation of the EU as a union and its mandate for the member
countries to follow, as the decisions are made in group and must be followed by the members. This is in
39
contrast to what is found in Canada as legislations are made on a provincial basis and centralized by the
federal government.
The other difference is from the basic regulation and direction. The Restriction of Hazardous Substances
(RoHS), was a fundamental law passed in 2003 for restricting and prohibiting the producers of the
electrical and electronic equipment in the European Union for using the six hazardous materials in the
manufacturing of their new electronic products from July 2006 onwards. Such substances include: Lead,
Mercury, Cadmium, Hexavalent Chromium, Polybrominated Biphenyls and Polybrominated Diphenyl
Ethers [102]. This list of hazardous substances has been identified by the Canadian federal government
and has been listed under toxic substance control in 1988 [103]. Despite this fact, Canada does not
bring the same mandate as the EU does to the producers of the new electronic products in the country.
The other comparison on the performance side shows a few interesting points as well. As Figure 3-1
shows, the collection weight of the WEEE in EU states on average is heavier than the Canadian
provinces on an annual basis. This is the situation that the future collection target rates have been set to
rise in most of the EU states as opposed to the Canadian provinces, especially in the Northern, Central
and Western European states.
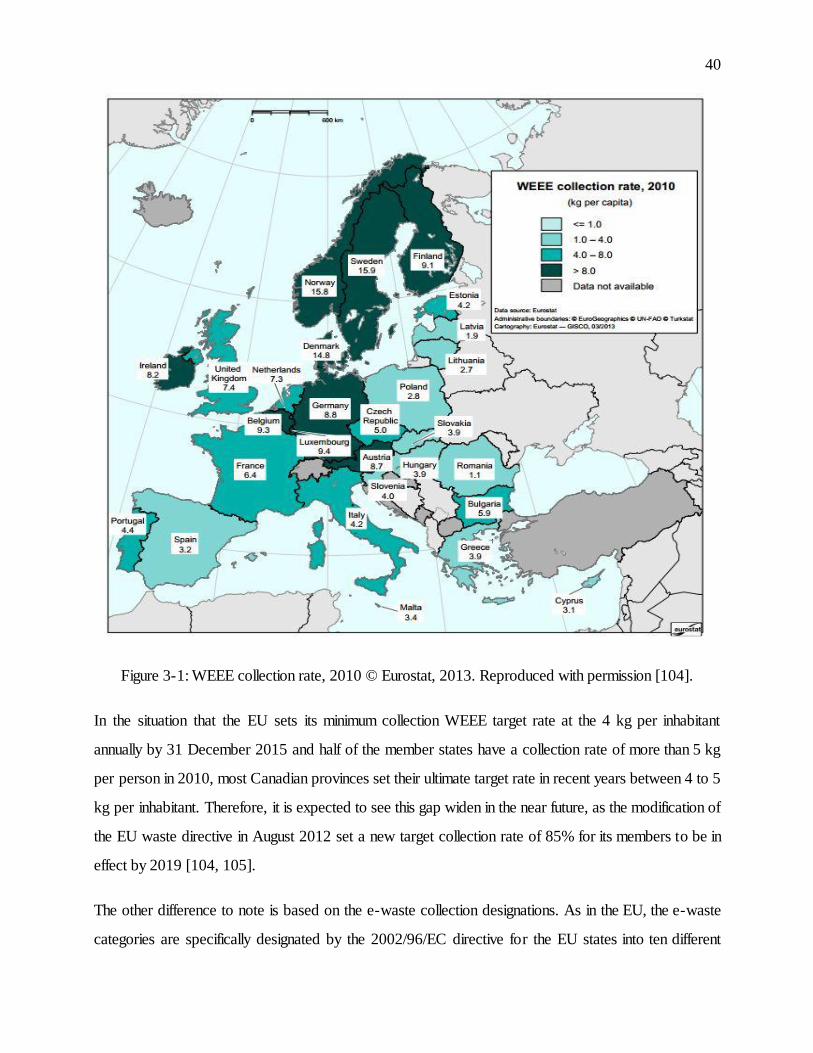
40
Figure 3-1: WEEE collection rate, 2010 © Eurostat, 2013. Reproduced with permission [104].
In the situation that the EU sets its minimum collection WEEE target rate at the 4 kg per inhabitant
annually by 31 December 2015 and half of the member states have a collection rate of more than 5 kg
per person in 2010, most Canadian provinces set their ultimate target rate in recent years between 4 to 5
kg per inhabitant. Therefore, it is expected to see this gap widen in the near future, as the modification of
the EU waste directive in August 2012 set a new target collection rate of 85% for its members to be in
effect by 2019 [104, 105].
The other difference to note is based on the e-waste collection designations. As in the EU, the e-waste
categories are specifically designated by the 2002/96/EC directive for the EU states into ten different
41
categories that have been listed in chapter one [102]; in contrast for Canadian provinces, the collection
list is assigned by each province separately.
Generally speaking, the e-waste legislations in the EU is well developed compared to other parts of the
world in recent years. With respect to performance as revealed by statistical data, the collection and the
recycling rates had the great improvements as well.
42
CHAPTER 4 DATA ANALYSIS
4.1 Collected Data
In this study, the data that has been used for identifying the e-waste trade flows in Canada is the same
database that Lepawsky and his colleagues used in two papers of 2010 [44] and 2014 [45] for mapping
the global e-waste trade flows.
The data has been extracted from the UN Comtrade database, Specific Harmonised System (HS)
category 2002 code 854810 entitled (Waste and scrap of primary cells, primary batteries and electrical
accumulators), from 1996 to 2013, since this year range contains all data available from both ends of the
date spectrum. The complete list of UN Comtrade Harmonised System (HS) waste categories is
available in APPENDIX A.
This database has been used based on the fact that, at the time of writing this research and to the best of
author’s knowledge, there is no other database that is similar to 854810 in existence that can be used as
a proxy for measuring e-waste at the international or domestic levels. Therefore, there is no complete e-
waste data found that can be used for measuring the e-waste trade flows and it is therefore necessary to
use a proxy for sampling a database for evaluating this flow.
However, it should be also noted that this issue does not necessarily mean that the database is an
absolute representation of all e-waste categories in Canada. Therefore, the terms used in this study are
only in reference to this sample database and its analysis with the assumption that this database can be a
proper proxy of a bigger picture and are not referring the total absolute e-waste flows in Canada.
Based on this fact, this study uses UN Comtrade HS code 854810 as the main database and the proxy
for assuming the global e-waste flow of Canada. As shown in Table 4-1, the following are the
assumptions and the reasons for using this database:
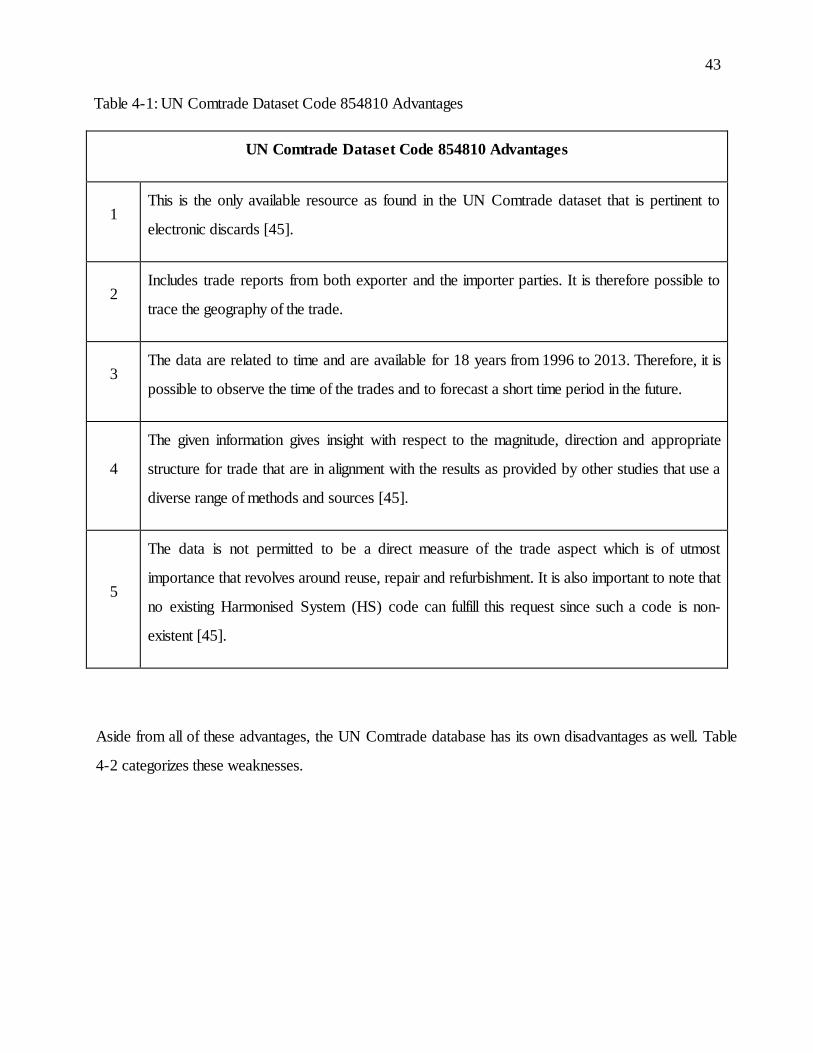
43
Table 4-1: UN Comtrade Dataset Code 854810 Advantages
UN Comtrade Dataset Code 854810 Advantages
1 This is the only available resource as found in the UN Comtrade dataset that is pertinent to
electronic discards [45].
2 Includes trade reports from both exporter and the importer parties. It is therefore possible to
trace the geography of the trade.
3 The data are related to time and are available for 18 years from 1996 to 2013. Therefore, it is
possible to observe the time of the trades and to forecast a short time period in the future.
4
The given information gives insight with respect to the magnitude, direction and appropriate
structure for trade that are in alignment with the results as provided by other studies that use a
diverse range of methods and sources [45].
5
The data is not permitted to be a direct measure of the trade aspect which is of utmost
importance that revolves around reuse, repair and refurbishment. It is also important to note that
no existing Harmonised System (HS) code can fulfill this request since such a code is non-
existent [45].
Aside from all of these advantages, the UN Comtrade database has its own disadvantages as well. Table
4-2 categorizes these weaknesses.
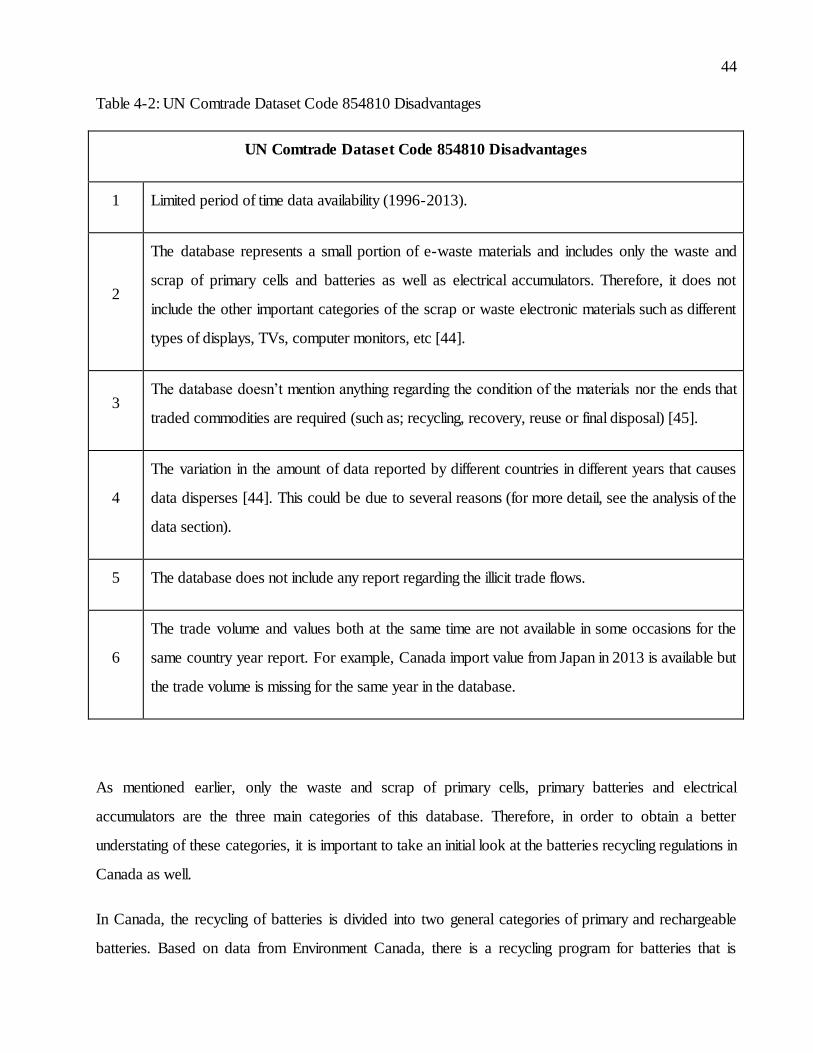
44
Table 4-2: UN Comtrade Dataset Code 854810 Disadvantages
UN Comtrade Dataset Code 854810 Disadvantages
1 Limited period of time data availability (1996-2013).
2
The database represents a small portion of e-waste materials and includes only the waste and
scrap of primary cells and batteries as well as electrical accumulators. Therefore, it does not
include the other important categories of the scrap or waste electronic materials such as different
types of displays, TVs, computer monitors, etc [44].
3 The database doesn’t mention anything regarding the condition of the materials nor the ends that
traded commodities are required (such as; recycling, recovery, reuse or final disposal) [45].
4
The variation in the amount of data reported by different countries in different years that causes
data disperses [44]. This could be due to several reasons (for more detail, see the analysis of the
data section).
5 The database does not include any report regarding the illicit trade flows.
6
The trade volume and values both at the same time are not available in some occasions for the
same country year report. For example, Canada import value from Japan in 2013 is available but
the trade volume is missing for the same year in the database.
As mentioned earlier, only the waste and scrap of primary cells, primary batteries and electrical
accumulators are the three main categories of this database. Therefore, in order to obtain a better
understating of these categories, it is important to take an initial look at the batteries recycling regulations in
Canada as well.
In Canada, the recycling of batteries is divided into two general categories of primary and rechargeable
batteries. Based on data from Environment Canada, there is a recycling program for batteries that is
45
voluntary among select provinces. Out of all Canadian provinces, only British Columbia, Manitoba and
Quebec have regulated and mandated the collection and the recycling of rechargeable batteries [106]. For
the primary portable batteries, the situation is slightly different as Ontario is also included in the mentioned
provinces; therefore, four provinces gain from a mandatory collection and recycling programs [107].
4.2 Methodology
Tracing the e-waste trade flow and identifying its illegal trade is a challenging issue due to a variety of
reasons. As mentioned in a vast amount of literature in this field and especially as stated by Lepawsky
and his colleagues in 2010 [44] and 2014 [45], the most important reason is due to the lack of a proper
international definition for e-waste on a global basis. Since there is no data category defined to the best
of author’s knowledge for the electronic waste in the global databases.
Besides the lack of a definition for electronic waste and a global standard database in this field, there are
other problematic issues as well as Lepawsky mentions that are cause hardships for measuring the e-
waste trade flows. These issues include a lack of data in that categorize used and new electronics in
different categories for distinguishing each other. Therefore, it is mainly due to this weakness of data that
is difficult to identify the exact illegal trade flows [45].
By taking all the above challenges and the data limitations into consideration, this study tries to simulate
the e-waste trade flow map for Canada from 1996 to 2013 by using proxy data that have been
discussed earlier. In this way, a different methodology has been used on the data chosen compared to
other similar studies that use the same UN Comtrade database. As in this research, data trade values
have been used for the analysis instead of the trade volume.
Therefore, the U.S dollar has been used due to this fact that based on the authors observations on the
UN Comtrade database, most of the trade volumes are missing or have never been reported by different
countries, mainly from Canada. Therefore, the trade volume could not be used as a proper proxy due to
lots of data missing and the data value chosen instead.
Firstly, the author collected trade value data based on the reports released by Canada in the last 18
years. After observing the missing data for some years for many countries, for comparison purposes, the
46
author also collected data reported by the all other countries that exist on the UN Comtrade database
list, which are those who reported e-waste exports or imports to or from Canada for the same time
period. Furthermore, these reports have been compared and analyzed for identifying the gaps on the
trades that has been reported differently.
In continuation, a new database has been created by the author including the largest amount of data
value reported by one of the trade parties between Canada and its trade partner for mapping Canada’s
e-waste trade network.
The largest amount has been chosen due to the assumption that in the reports of the hazardous wastes
such as electronic waste, due to the nature of the trade, countries would prefer to report a lower amount
than the real one. Therefore none of the importer or exporter countries gain from reporting a larger
amount; hence, one with the larger number can be assumed to be a more likely real number.
Furthermore, all the collected data has been converted from the current dollar value to the constant
dollar value. This has been implemented through the use of the annual rates from the Consumer Price
Index (CPI) in United Sates for all years prior to 2013 in the database.
For this purpose, the current dollar value has been multiplied by the 2013 CPI index rate (i.e. the base
year), and then divided by the CPI index rate of the specific year which needs to be converted to
constant value.
4.3 Analysis of the Data
In this section, the finding and the results from the analysis of the data are going to be discussed in five
main sections:
The proxy e-waste flow in Canada with respect to the rest of the world from 1996 to 2013
Canada’s proxy e-waste trade network for 1996 and 2013
Canada’s top e-waste trade partners (from the average annual trade value and the overall
number of trades)
47
Identified gaps between the bilateral e-waste trade information released by Canada and the
other trade partners
Illicit trades
4.3.1 Canada’s e-waste Trade Flow
As analysis of the proxy data in Figure 4-1 shows, Canada’s e-waste trade flow has dramatically
changed from an exporter country between 1997 and 2006 to a net importer from 2007 onwards.
Figure 4-1 also reveals that this sudden change has been followed by a big jump by the start of 2009
and the years after.
The data shows that import rose by more than 6 times, from $17.6 million in 2009 to over $105.6
million in 2011. For the same period, export increases only twice as much, increasing from $10.8 million
to $21.7 million.
This expansion was not steady and has slowed down in 2012 for both the import and export sections.
The import has dropped to $88 million in 2012 yet has increased to $91 million in the following year
whereas the export has increased to $33 million in 2012 then dropped again to $26 million the following
year.
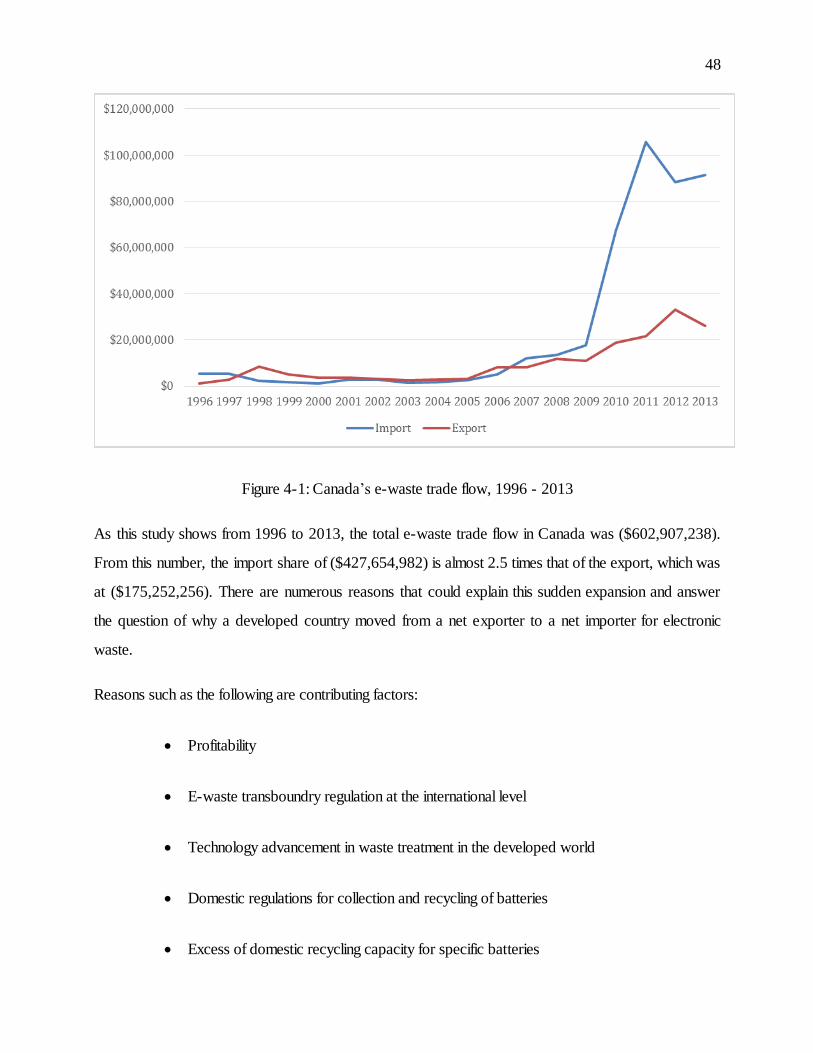
48
Figure 4-1: Canada’s e-waste trade flow, 1996 - 2013
As this study shows from 1996 to 2013, the total e-waste trade flow in Canada was ($602,907,238).
From this number, the import share of ($427,654,982) is almost 2.5 times that of the export, which was
at ($175,252,256). There are numerous reasons that could explain this sudden expansion and answer
the question of why a developed country moved from a net exporter to a net importer for electronic
waste.
Reasons such as the following are contributing factors:
Profitability
E-waste transboundry regulation at the international level
Technology advancement in waste treatment in the developed world
Domestic regulations for collection and recycling of batteries
Excess of domestic recycling capacity for specific batteries
49
Pollution haven hypothesis effects
In the first case, one of the main reasons that could be the cause of this movement is the profitability of
this action on a short term basis that provides a positive gain for the importer country’s economy,
especially countries with large areas. If this is the major reason for such a trade, then the cause can be
the same as in developing countries that pursue profitability as a major reason for importing the
hazardous wastes such as e-waste.
In contrast, being convinced by such a reason is difficult because in developed countries such as
Canada, environmental regulations play an enormous role for preserving nature and health. Additionally,
importing e-waste is in contradiction with the environmental regulations in most of the provinces. At the
same time, such a profit in comparison to the economical size of countries such as Canada is not as
large, therefore not providing enough of an incentive for countries to do such actions and risk the
environment in the long run.
The other important issue is the role of international treaties such as the Basel convention. As in the past
decade, the issue of e-waste trade flow has been discussed and highlighted as a dumping waste action
done from developed to developing countries; therefore, the restrictions for transboundry movements are
concentrated more on this issue and not the other way around or even inter-regional movements
between developed countries.
In regards to the batteries specifically, the other regulations such as domestic transboundry movements
for hazardous wastes in different countries can play an enormous role in the creation and magnitude
direction of such trades as well. For example, in the trade case of the spent lead-acid batteries (SLABs)
between Canada and the United States, the latter nation does not need a manifest for SLABs
international movements. Additionally, it does not need SLAB exporters to acquire a recovery certificate
from the recycling plant before shipment, something that is not the case in Canada [108].
It should be also noted that for the trade case of hazardous wastes between Canada and the United
States, Canada has a bilateral trade agreement for these sorts of trades with the United States. This is
due to this fact that the United States is not a participant in the Basel convention, and therefore does not
need to follow its limitations whereas Canada, with a trade agreement, is able to trade with this country.
50
Based on the export data on the trade flows for SLABs from 2002 to 2011, export from the United
States to Canada sharply increased from 2009 and in 2011 reaches its peak. The full trend graph of this
trade movement can be found in APPENDIX B along with its import and export stage in 2011 in
APPENDIX C [108].
The other aspect that can also be discussed is the technological advances that in the past decade were
reached by some developed countries for enhancing their domestic recycling capabilities. This would
pursue them to accept some external marginal e-waste from the other countries for economic reasons.
With respect to the recycling of batteries, Canada is privileged to have a high recycling capacity in all
types of batteries that are available in Canada and the United States [107].
Even with this important reason and despite all the technological advances that Canada has obtained
from recycling processes in the 21st century; this reason is still not acceptable as the country still is not
capable of recycling all its e-waste, including domestic batteries. Based on information from Environment
Canada, more than 140,000 metric tonnes of electronic equipment are aggregated annually in Canadian
landfills rather than being recycled [1]. Additionally concentrating on batteries, the statistics for the
collection rate of the primary batteries for 2011 shows at best only one seventh of the available primary
batteries have been collected [107].
The other logical reason that can be discussed is the role of domestic regulations for collection and
recycling of batteries that are the major members of the UN Comtrade used database.
The main aspect of this reason can be due to the lack of mandatory recycling regulations in most
provinces. As per the latest information, almost two-thirds of these provinces do not even have
mandated programs for the recycling of batteries, as the program at the national level is run voluntarily by
each province separately.
Another important reason that can explain this movement especially for the year 2007, is Environment
Canada’s claim for having the domestic excess recycling capacity of some specific sort of consumer
batteries as well as the existing bilateral commercial arrangements between smelters and battery
manufacturers in Canada and the United States. As based on this report, in 2007 three out of four
Canadian consumer battery recycling facilities had an excess capacity of recycling for Lithium, Alkaline,
51
Zinc Carbon and Cobalt bearing batteries. And five facilities for Lead smelters had almost twice the
capacity from what they received for recycling for that year. The list of these recycling capacities can be
found in APPENDIX D, APPENDIX E [109].
One interesting point about these recycling facilities is their locations as shown in APPENDIX F that are
located near the United States border, which might not be coincidental.
The other plausible issue that might be the reason for the import expansions from 2008 onwards is the
avoidance of environmental and health protection costs relevant to their stricter regulations in the United
States. Specially in 2008 and 2012 by improving and tightening the ambient air and lead emission
standards at battery recycling plants [108], caused export expansion from the United States to its trade
partners including Canada. This tightness in the environmental regulation as Kellenberg mentioned earlier
can lead to a waste haven atmosphere, which results in an increased export in movements from a country
with high environmental regulations to lower ones [25].
In a general view on Canada’s environmental performance for 2009 onwards, one key issue that should
be taken into consideration is the massive downgrading of Canada’s environmental performance index
(EPI) during these years up to 2012. As the EPI shows, Canada stood in rank 12 in 2008, downgraded
to rank 46 in 2010 and 37 in 2012 [110-112]. Additionally to this downgrading, it should be also noted
that in the broader waste categories, Canada’s municipal waste generation per capita fell from grade “C”
in 1990 to grade “D” in 2002, which is lower than that of the United States [113]. Based on the recent
international ranking in 2009, Canada stands at 17th out of the 17 OECD members ranked countries
[113, 114].
These poor records on the environmental performance can also strengthen the impact of the pollution
haven hypothesis for causing more imports than exports. On the other hand, it can be another proof to
what was mentioned earlier by Kellenberg; for every percent fallen in the environmental regulations in
one of the bilateral waste trade partners, the import of the wastes from the other foreign trade partner
increases by 0.32% [25].
52
4.3.2 Canada e-waste Trade Network
After considering the numerous gaps between the values reported by Canada and its trade partners in
the proxy used data, mapping Canada’s e-waste trade flow has been implemented based on the largest
values reported by each one of the importer or exporter parties for 1996 and 2013.
This issue opposes other similar research in this field such as Lepawsky’ papers in 2010 [44] and 2014
[45]) which works on the same dataset. Other studies put in terms of the imported volume as the core
data for their research because it is expected that countries tend to report their import more accurately
than the exports. While in this study and by comparison the data reported by Canada and its trade
partners, this issue was in contradiction.
For example, in Canada’s e-waste trade flows case with the Unites states for most years, the imported
value has been reported by the importer country less than the exporter value reported by the exporter
country. This is not logical or reasonable because it was expected that equal numbers be produced or
that this situation be reversed.
As shown in Figure 4-2, the majority of the Canadian e-waste import network in 2013, as is the same as
the other map for 1996, is more toward the North American region, especially the United States that
exported more than $95 million of the e-waste in 2013. In this year, Mexico with a far distance trade
value away is the second exporter country in the region with slightly over $69,000 in export.
As it can be seen, Asian countries are the second largest exporter partners for this year to Canada, with
Japan being the main exporter country at over $2.6 million, well above other countries in that region. For
a better understanding of this distance, the second biggest exporter of the region after Japan is Vietnam
with slightly over $126,000 export, therefore exhibiting a large gap between Japan and other nations.
Additionally as clearly shown by the map, Europe with a slightly lower total trade value than Asia, is the
third region with the highest value of export to Canada. In this region, France with over $1.48 million
trade is the leading exporter followed by Germany and Netherlands with each one trade of above $0.5
million in 2013.
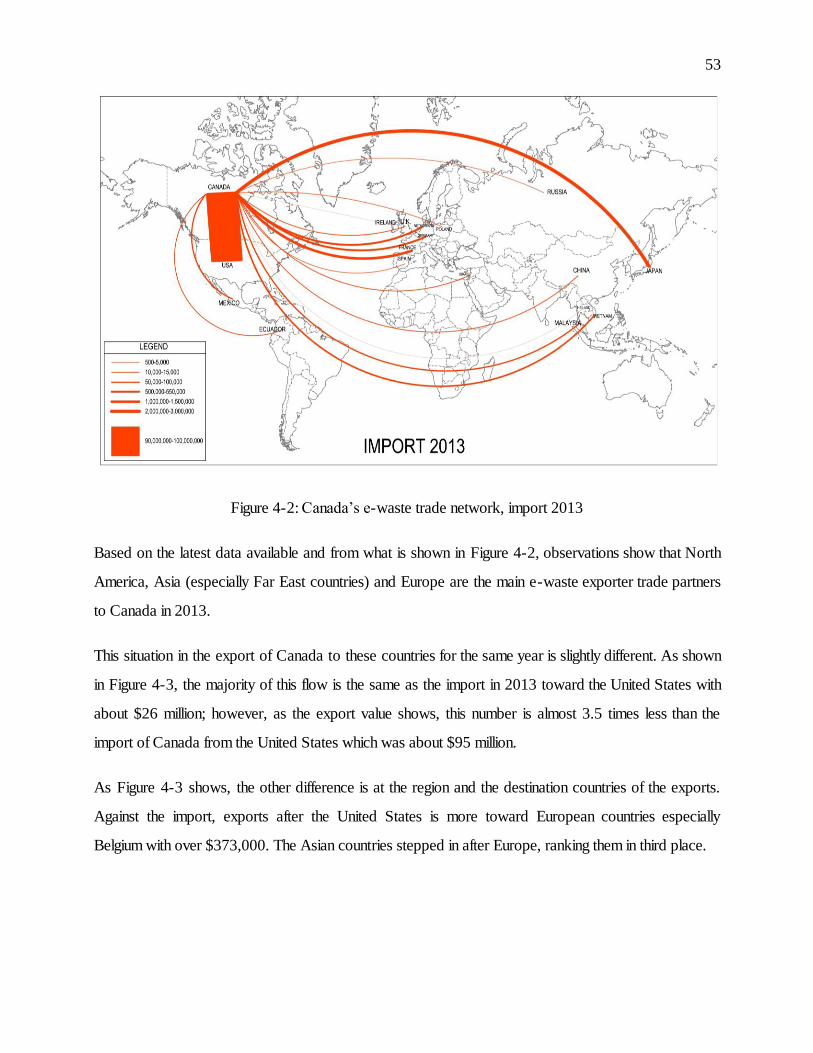
53
Figure 4-2: Canada’s e-waste trade network, import 2013
Based on the latest data available and from what is shown in Figure 4-2, observations show that North
America, Asia (especially Far East countries) and Europe are the main e-waste exporter trade partners
to Canada in 2013.
This situation in the export of Canada to these countries for the same year is slightly different. As shown
in Figure 4-3, the majority of this flow is the same as the import in 2013 toward the United States with
about $26 million; however, as the export value shows, this number is almost 3.5 times less than the
import of Canada from the United States which was about $95 million.
As Figure 4-3 shows, the other difference is at the region and the destination countries of the exports.
Against the import, exports after the United States is more toward European countries especially
Belgium with over $373,000. The Asian countries stepped in after Europe, ranking them in third place.
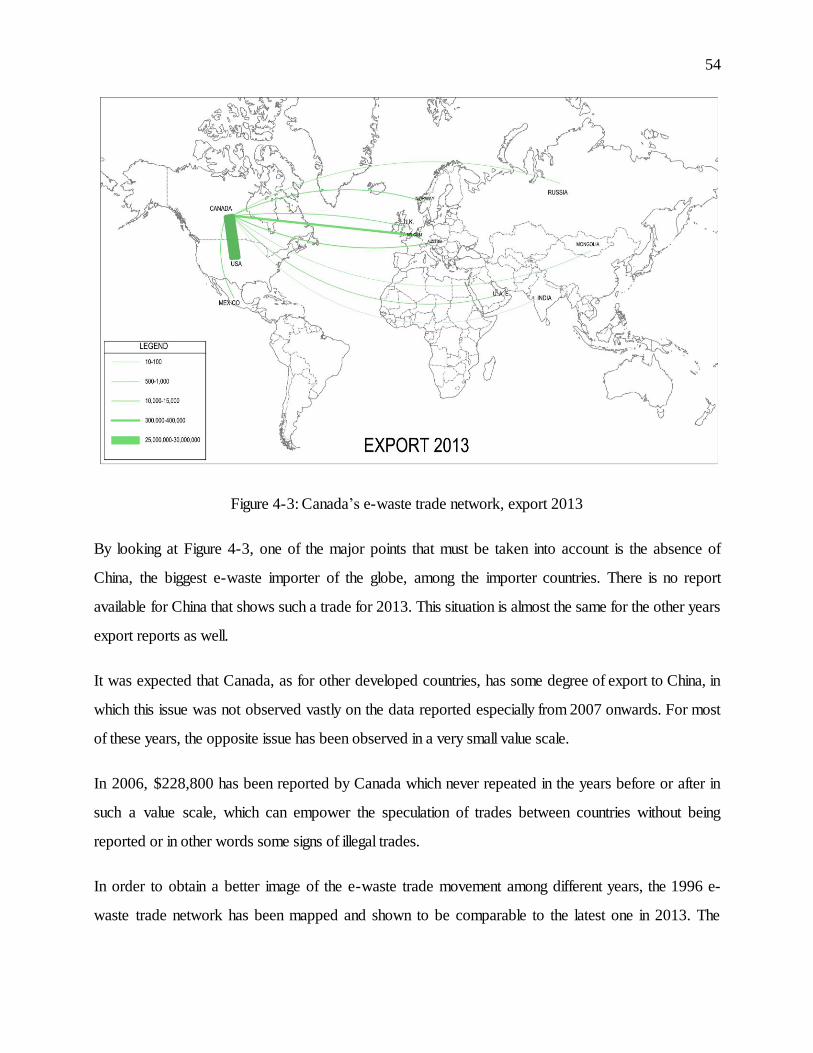
54
Figure 4-3: Canada’s e-waste trade network, export 2013
By looking at Figure 4-3, one of the major points that must be taken into account is the absence of
China, the biggest e-waste importer of the globe, among the importer countries. There is no report
available for China that shows such a trade for 2013. This situation is almost the same for the other years
export reports as well.
It was expected that Canada, as for other developed countries, has some degree of export to China, in
which this issue was not observed vastly on the data reported especially from 2007 onwards. For most
of these years, the opposite issue has been observed in a very small value scale.
In 2006, $228,800 has been reported by Canada which never repeated in the years before or after in
such a value scale, which can empower the speculation of trades between countries without being
reported or in other words some signs of illegal trades.
In order to obtain a better image of the e-waste trade movement among different years, the 1996 e-
waste trade network has been mapped and shown to be comparable to the latest one in 2013. The
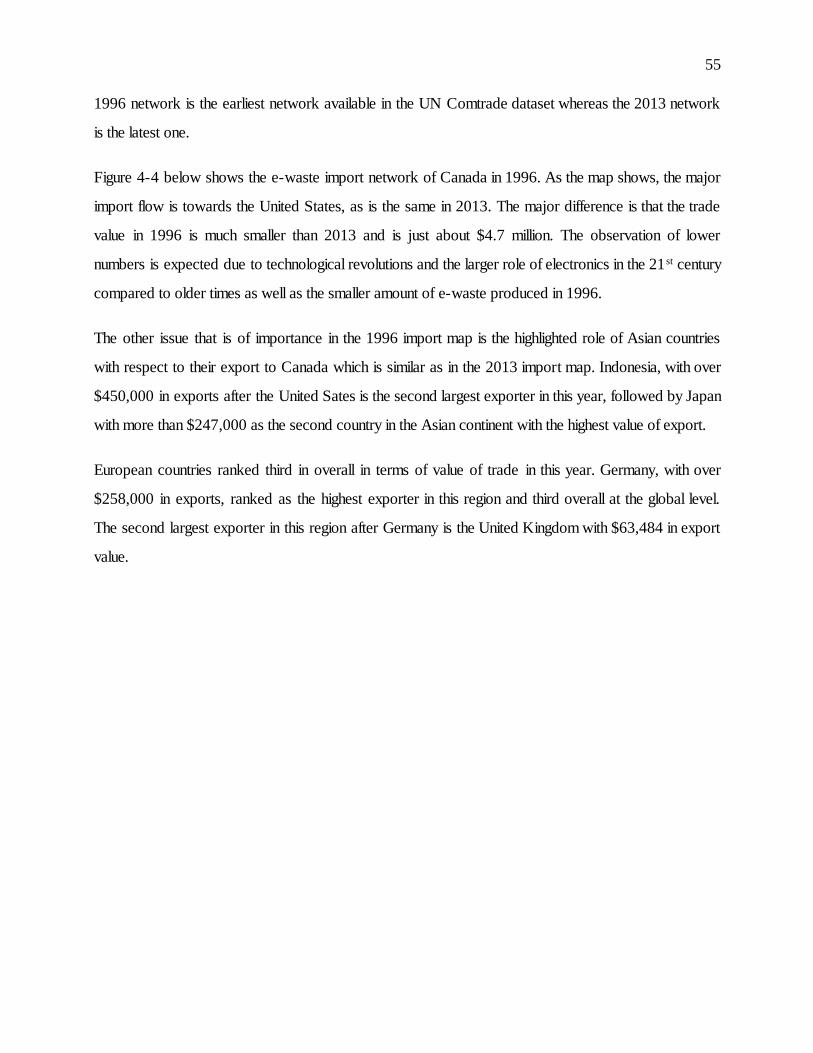
55
1996 network is the earliest network available in the UN Comtrade dataset whereas the 2013 network
is the latest one.
Figure 4-4 below shows the e-waste import network of Canada in 1996. As the map shows, the major
import flow is towards the United States, as is the same in 2013. The major difference is that the trade
value in 1996 is much smaller than 2013 and is just about $4.7 million. The observation of lower
numbers is expected due to technological revolutions and the larger role of electronics in the 21 st century
compared to older times as well as the smaller amount of e-waste produced in 1996.
The other issue that is of importance in the 1996 import map is the highlighted role of Asian countries
with respect to their export to Canada which is similar as in the 2013 import map. Indonesia, with over
$450,000 in exports after the United Sates is the second largest exporter in this year, followed by Japan
with more than $247,000 as the second country in the Asian continent with the highest value of export.
European countries ranked third in overall in terms of value of trade in this year. Germany, with over
$258,000 in exports, ranked as the highest exporter in this region and third overall at the global level.
The second largest exporter in this region after Germany is the United Kingdom with $63,484 in export
value.
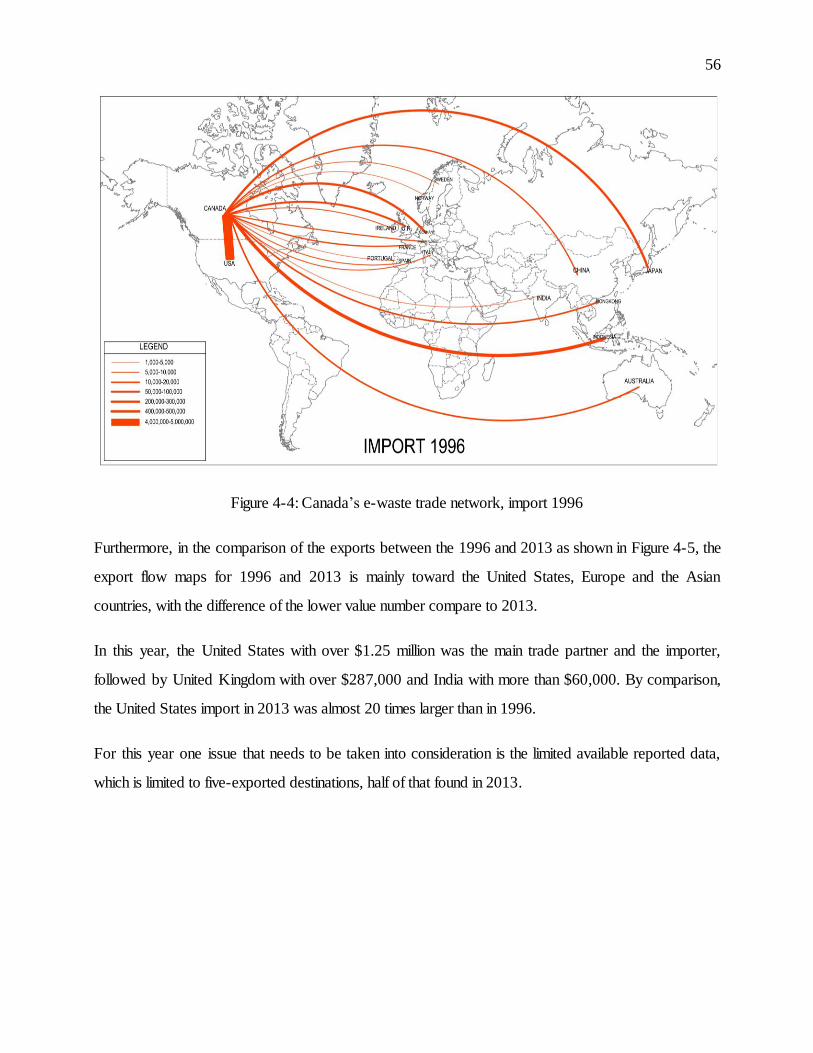
56
Figure 4-4: Canada’s e-waste trade network, import 1996
Furthermore, in the comparison of the exports between the 1996 and 2013 as shown in Figure 4-5, the
export flow maps for 1996 and 2013 is mainly toward the United States, Europe and the Asian
countries, with the difference of the lower value number compare to 2013.
In this year, the United States with over $1.25 million was the main trade partner and the importer,
followed by United Kingdom with over $287,000 and India with more than $60,000. By comparison,
the United States import in 2013 was almost 20 times larger than in 1996.
For this year one issue that needs to be taken into consideration is the limited available reported data,
which is limited to five-exported destinations, half of that found in 2013.
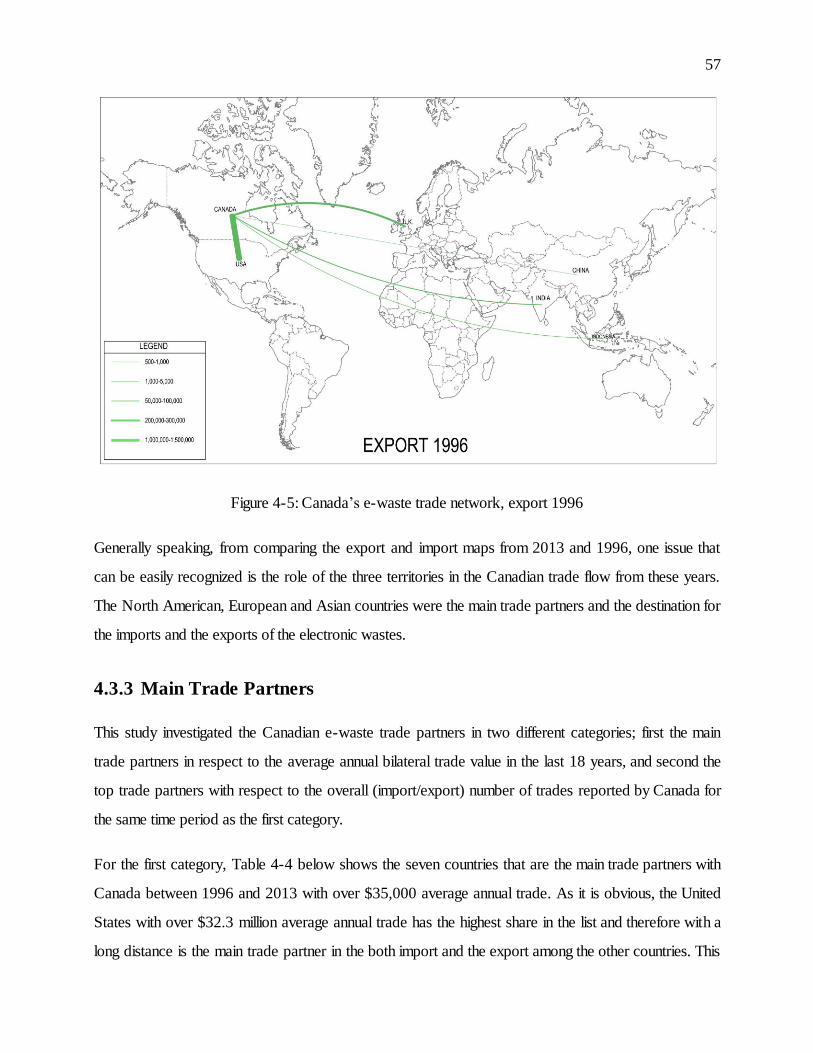
57
Figure 4-5: Canada’s e-waste trade network, export 1996
Generally speaking, from comparing the export and import maps from 2013 and 1996, one issue that
can be easily recognized is the role of the three territories in the Canadian trade flow from these years.
The North American, European and Asian countries were the main trade partners and the destination for
the imports and the exports of the electronic wastes.
4.3.3 Main Trade Partners
This study investigated the Canadian e-waste trade partners in two different categories; first the main
trade partners in respect to the average annual bilateral trade value in the last 18 years, and second the
top trade partners with respect to the overall (import/export) number of trades reported by Canada for
the same time period as the first category.
For the first category, Table 4-4 below shows the seven countries that are the main trade partners with
Canada between 1996 and 2013 with over $35,000 average annual trade. As it is obvious, the United
States with over $32.3 million average annual trade has the highest share in the list and therefore with a
long distance is the main trade partner in the both import and the export among the other countries. This
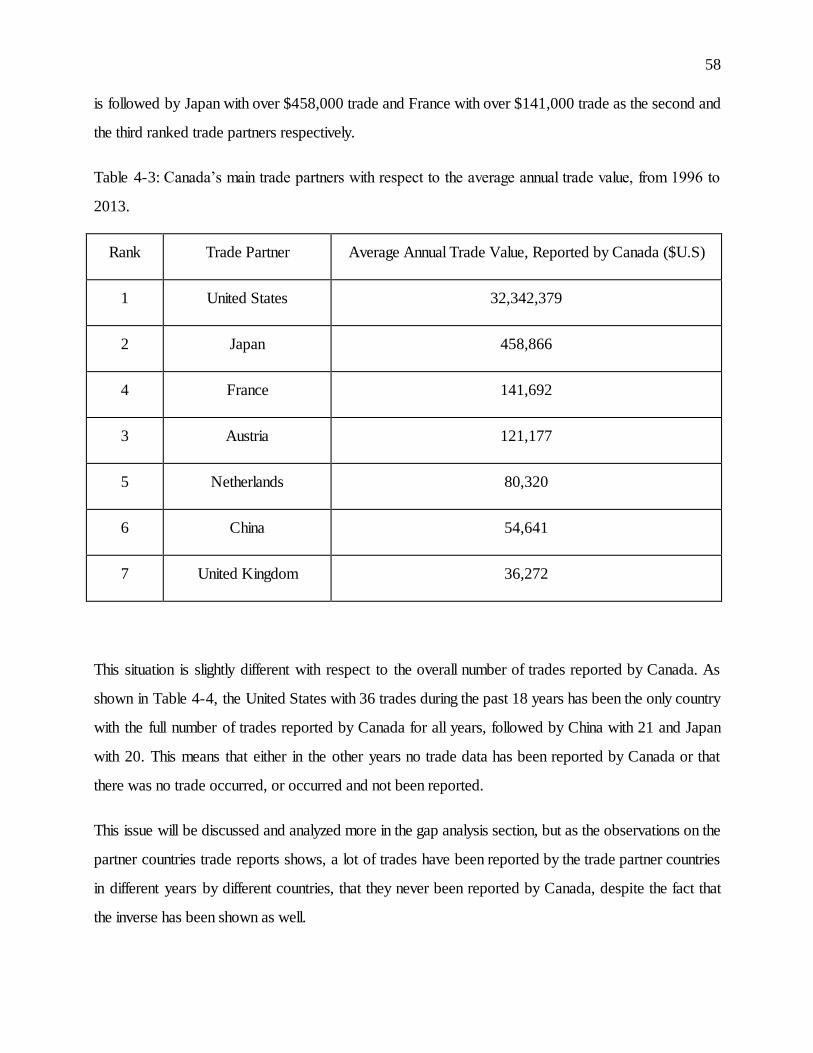
58
is followed by Japan with over $458,000 trade and France with over $141,000 trade as the second and
the third ranked trade partners respectively.
Table 4-3: Canada’s main trade partners with respect to the average annual trade value, from 1996 to
2013.
Rank Trade Partner Average Annual Trade Value, Reported by Canada ($U.S)
1 United States 32,342,379
2 Japan 458,866
4 France 141,692
3 Austria 121,177
5 Netherlands 80,320
6 China 54,641
7 United Kingdom 36,272
This situation is slightly different with respect to the overall number of trades reported by Canada. As
shown in Table 4-4, the United States with 36 trades during the past 18 years has been the only country
with the full number of trades reported by Canada for all years, followed by China with 21 and Japan
with 20. This means that either in the other years no trade data has been reported by Canada or that
there was no trade occurred, or occurred and not been reported.
This issue will be discussed and analyzed more in the gap analysis section, but as the observations on the
partner countries trade reports shows, a lot of trades have been reported by the trade partner countries
in different years by different countries, that they never been reported by Canada, despite the fact that
the inverse has been shown as well.
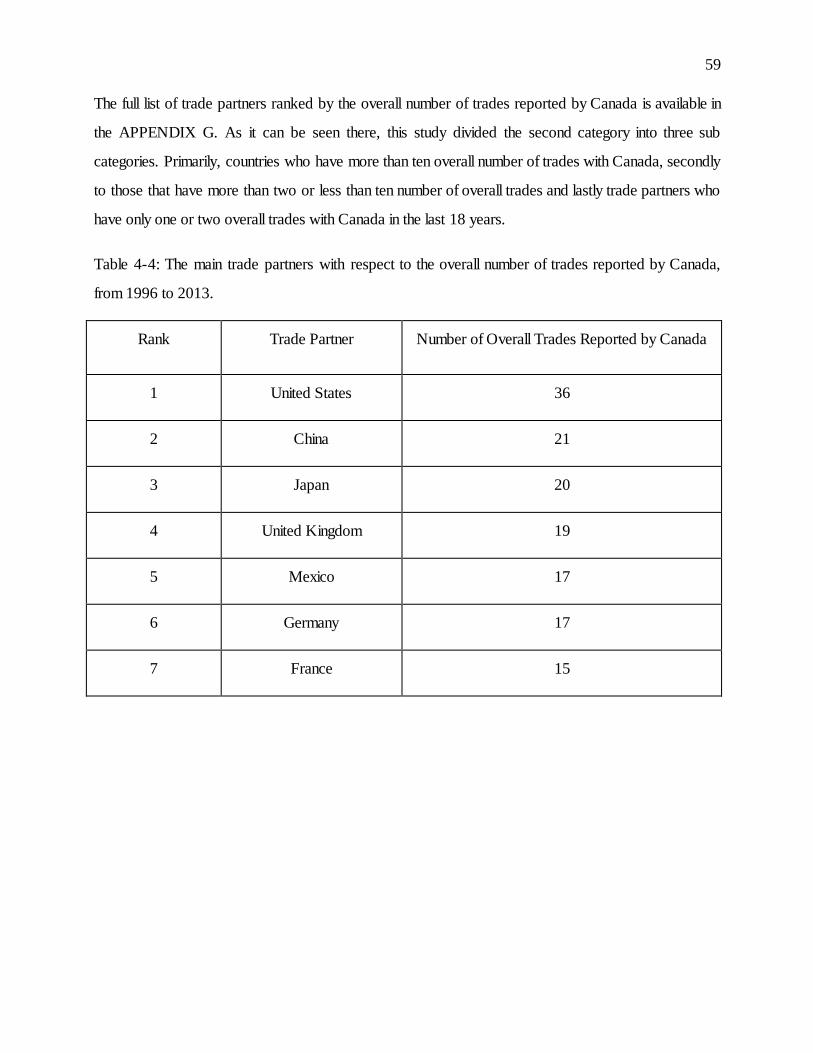
59
The full list of trade partners ranked by the overall number of trades reported by Canada is available in
the APPENDIX G. As it can be seen there, this study divided the second category into three sub
categories. Primarily, countries who have more than ten overall number of trades with Canada, secondly
to those that have more than two or less than ten number of overall trades and lastly trade partners who
have only one or two overall trades with Canada in the last 18 years.
Table 4-4: The main trade partners with respect to the overall number of trades reported by Canada,
from 1996 to 2013.
Rank Trade Partner Number of Overall Trades Reported by Canada
1 United States 36
2 China 21
3 Japan 20
4 United Kingdom 19
5 Mexico 17
6 Germany 17
7 France 15
60
4.4 Illicit Trades
4.4.1 Reported Data from Different Countries
By observing and analyzing the data from the UN Comtrade database, one important issue that can be
vastly surveyed and requires to be carefully considered is the fact that there is a large gap in most reports
as provided for different years between the numbers that the imported and the exported countries.
It is expected that the countries would not tend to have enough interest for recording and reporting
accurate export numbers compared to imports, especially for those who signed the international treaties
such as Basel convention due to international boundaries for transboundary movements of hazardous
wastes including electronic waste within the regions and the countries. But despite this fact, the UN
Comtrade dataset HS code 854810 in some cases shows that can sway in the opposite direction. The
importing countries have even reported numbers of lesser value than the exporting countries for the same
report year.
4.4.2 Gap Analysis
As was mentioned and discussed earlier in this chapter during the analysis of the data, the big gaps
observed in the reported data submitted by Canada and its trade partners to the UN Comtrade
database.
For better understanding of these gaps in different years, Figure 4-6 has been drawn based on the
comparison of the import data reported by Canada and the exported data reported by the other trade
partners in different years.
As it can be expected in the normal situation and by considering the exchange rate, the reported data by
the importer and the exporter country for a specific year should be the same or similar. But as this study
shows, for some countries this issue is not valid and the importer and the exporter countries have
reported the data differently.
The top nine of these countries have been considered in Figure 4-6 and, as it can be clearly seen for
most years in the exported data reported by the United States and the imported data reported by
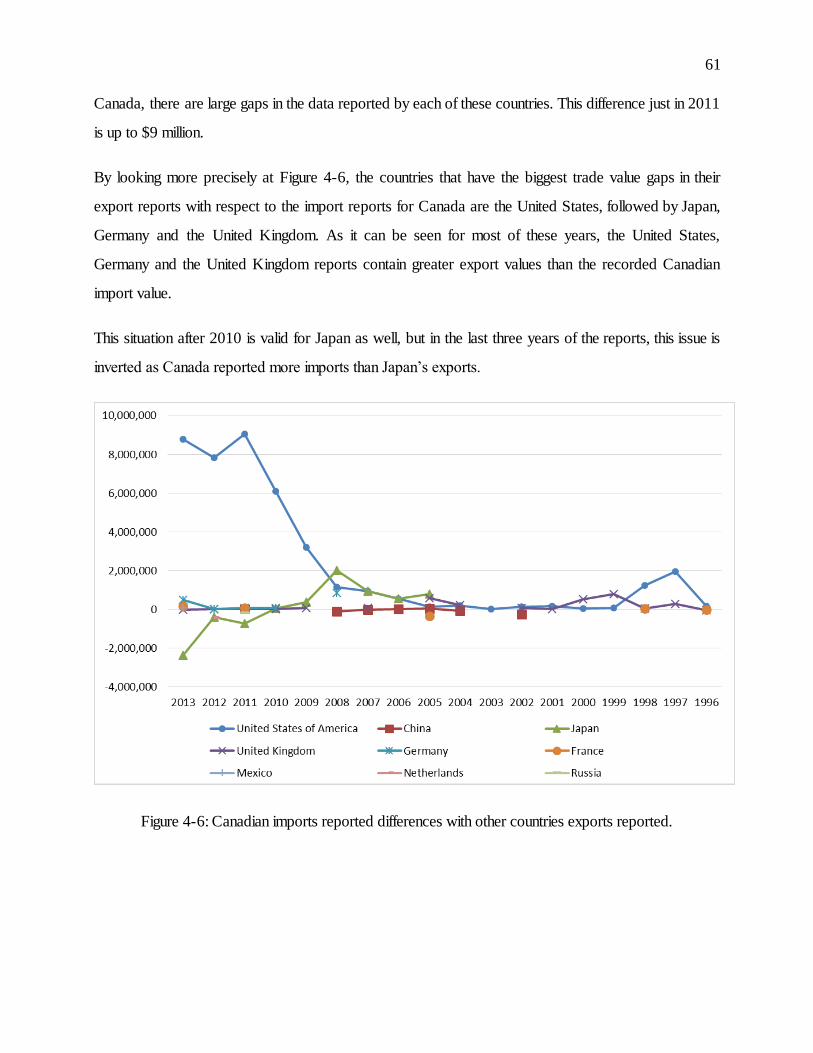
61
Canada, there are large gaps in the data reported by each of these countries. This difference just in 2011
is up to $9 million.
By looking more precisely at Figure 4-6, the countries that have the biggest trade value gaps in their
export reports with respect to the import reports for Canada are the United States, followed by Japan,
Germany and the United Kingdom. As it can be seen for most of these years, the United States,
Germany and the United Kingdom reports contain greater export values than the recorded Canadian
import value.
This situation after 2010 is valid for Japan as well, but in the last three years of the reports, this issue is
inverted as Canada reported more imports than Japan’s exports.
Figure 4-6: Canadian imports reported differences with other countries exports reported.
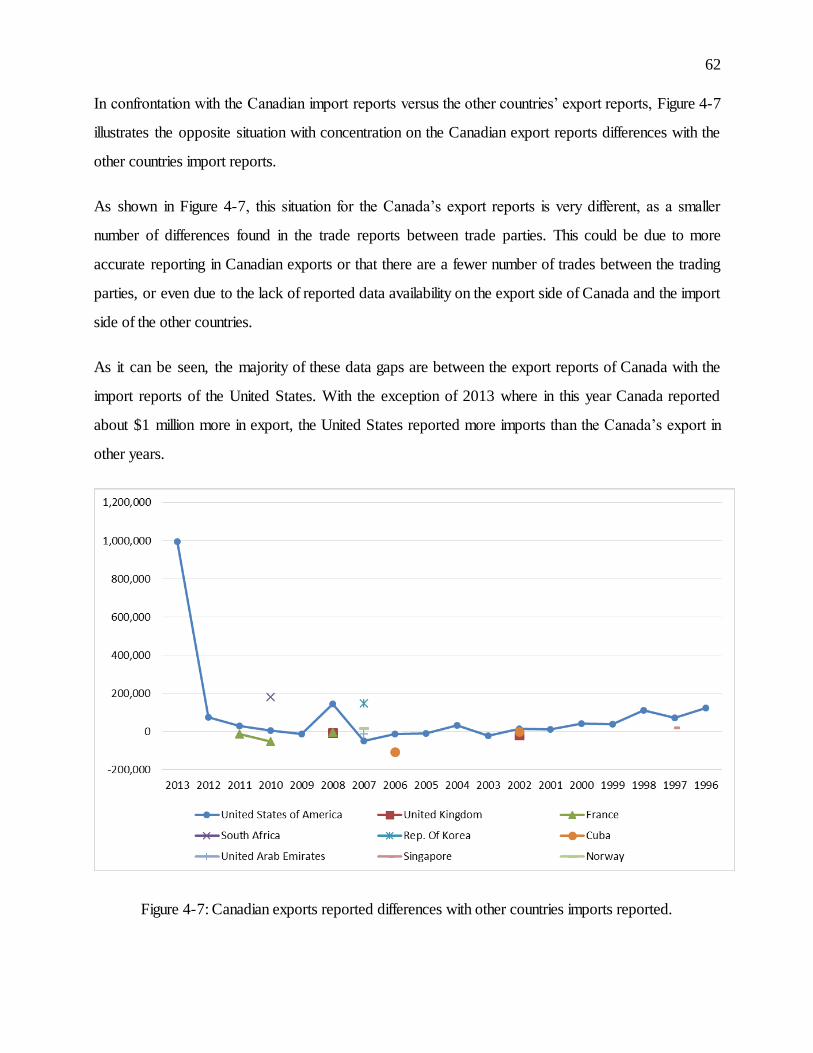
62
In confrontation with the Canadian import reports versus the other countries’ export reports, Figure 4-7
illustrates the opposite situation with concentration on the Canadian export reports differences with the
other countries import reports.
As shown in Figure 4-7, this situation for the Canada’s export reports is very different, as a smaller
number of differences found in the trade reports between trade parties. This could be due to more
accurate reporting in Canadian exports or that there are a fewer number of trades between the trading
parties, or even due to the lack of reported data availability on the export side of Canada and the import
side of the other countries.
As it can be seen, the majority of these data gaps are between the export reports of Canada with the
import reports of the United States. With the exception of 2013 where in this year Canada reported
about $1 million more in export, the United States reported more imports than the Canada’s export in
other years.
Figure 4-7: Canadian exports reported differences with other countries imports reported.
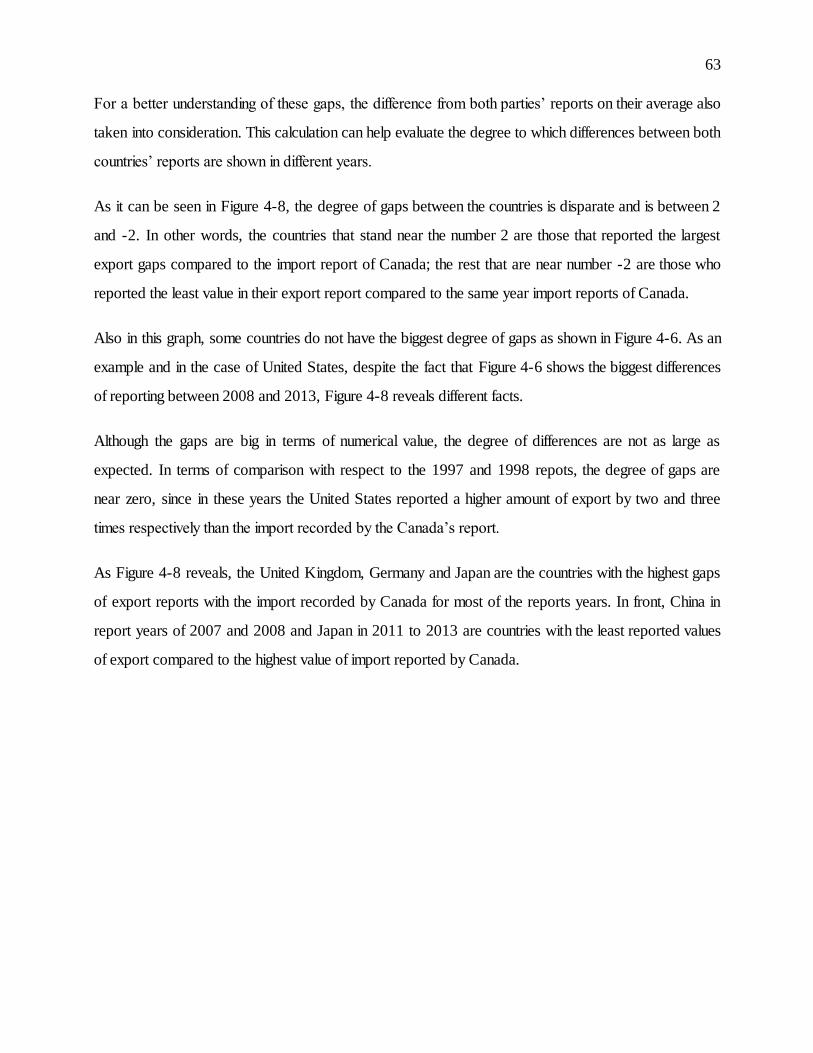
63
For a better understanding of these gaps, the difference from both parties’ reports on their average also
taken into consideration. This calculation can help evaluate the degree to which differences between both
countries’ reports are shown in different years.
As it can be seen in Figure 4-8, the degree of gaps between the countries is disparate and is between 2
and -2. In other words, the countries that stand near the number 2 are those that reported the largest
export gaps compared to the import report of Canada; the rest that are near number -2 are those who
reported the least value in their export report compared to the same year import reports of Canada.
Also in this graph, some countries do not have the biggest degree of gaps as shown in Figure 4-6. As an
example and in the case of United States, despite the fact that Figure 4-6 shows the biggest differences
of reporting between 2008 and 2013, Figure 4-8 reveals different facts.
Although the gaps are big in terms of numerical value, the degree of differences are not as large as
expected. In terms of comparison with respect to the 1997 and 1998 repots, the degree of gaps are
near zero, since in these years the United States reported a higher amount of export by two and three
times respectively than the import recorded by the Canada’s report.
As Figure 4-8 reveals, the United Kingdom, Germany and Japan are the countries with the highest gaps
of export reports with the import recorded by Canada for most of the reports years. In front, China in
report years of 2007 and 2008 and Japan in 2011 to 2013 are countries with the least reported values
of export compared to the highest value of import reported by Canada.
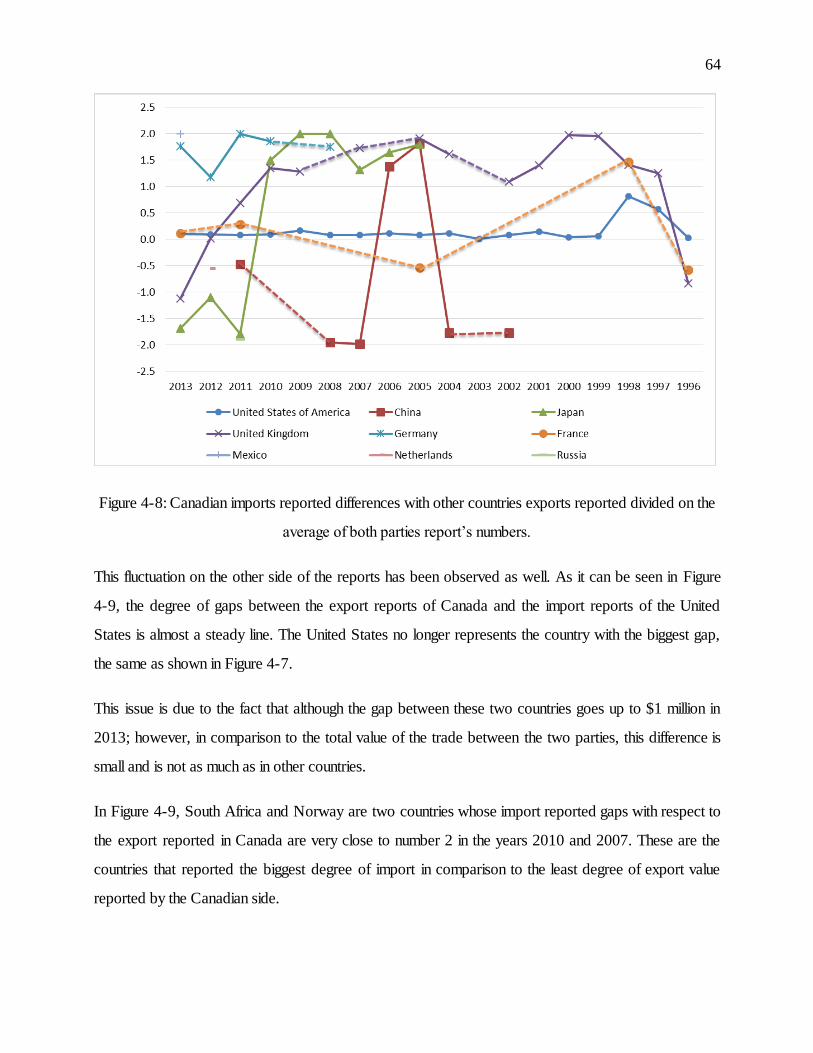
64
Figure 4-8: Canadian imports reported differences with other countries exports reported divided on the
average of both parties report’s numbers.
This fluctuation on the other side of the reports has been observed as well. As it can be seen in Figure
4-9, the degree of gaps between the export reports of Canada and the import reports of the United
States is almost a steady line. The United States no longer represents the country with the biggest gap,
the same as shown in Figure 4-7.
This issue is due to the fact that although the gap between these two countries goes up to $1 million in
2013; however, in comparison to the total value of the trade between the two parties, this difference is
small and is not as much as in other countries.
In Figure 4-9, South Africa and Norway are two countries whose import reported gaps with respect to
the export reported in Canada are very close to number 2 in the years 2010 and 2007. These are the
countries that reported the biggest degree of import in comparison to the least degree of export value
reported by the Canadian side.
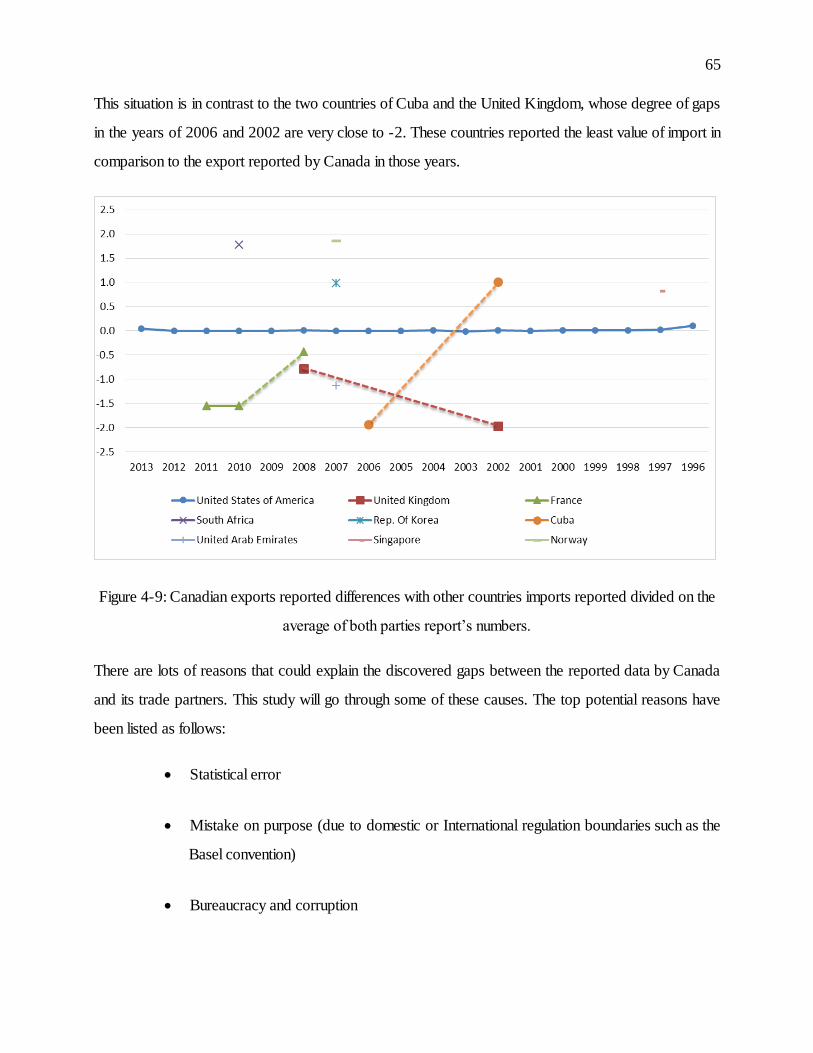
65
This situation is in contrast to the two countries of Cuba and the United Kingdom, whose degree of gaps
in the years of 2006 and 2002 are very close to -2. These countries reported the least value of import in
comparison to the export reported by Canada in those years.
Figure 4-9: Canadian exports reported differences with other countries imports reported divided on the
average of both parties report’s numbers.
There are lots of reasons that could explain the discovered gaps between the reported data by Canada
and its trade partners. This study will go through some of these causes. The top potential reasons have
been listed as follows:
Statistical error
Mistake on purpose (due to domestic or International regulation boundaries such as the
Basel convention)
Bureaucracy and corruption
66
Illegal trade
As it can be expected, the statistical error in any sort of mass data reporting is inescapable; however, the
issue that matters the most here is the degree of these errors.
In the case of UN Comtrade database, the gap between the countries’ reports cannot have simply just
occurred due to some accidental errors on the reporting data since the observed gaps are not limited to
a few countries and consist of a large majority of most of the reported countries. Hence, the next
potential issue that might be the reason of this occurrence can be discussed which is mistake by purpose.
There are plenty of reasons that can encourage the countries involved in such a trade to report the wrong
trade data. The most important of them is the international conventions and their regulation boundaries
that banned the trade and export of such a hazardous waste between the developed and the developing
countries. Ignoring such regulations for the members of such conventions can be penalized and have
negative points for the involved parties.
This issue can also be valid for the domestic regulations of countries such as Canada as well. As in this
case, each Canadian province manages e-waste and waste of batteries regulation independently.
Therefore, one province regulation is not necessarily the same as the other one, and each one of them
reports its own data separately from the others. In general, insuring all these reports are accurate is a
difficult task as these variations in reporting can lead to statistical errors as well.
On the other hand, this variation in reporting can increase the chance of error via bureaucratic and
corruptive means between the involved parties and organizations within and outside of Canada. This may
also apply among other trading countries as well since not all countries have the same e-waste, battery
regulations, and follows the same collection and reporting procedures.
Furthermore, at the top of all-potential reasons for the observed gaps on the database is false reporting
by the purpose of illegal trades among the involved parties, since the importer and the exporter parties
have their own benefits in such a trade.
One issue that this study has faced and discovered by its research on the recycling sites in Canada is the
existence of the unofficial recycling plants. For example, in the province of Ontario privatization exists

67
and does not necessarily work on reporting to government agencies directly, which would raise suspicion
of illicit trades by such recycling plants for the aim of profitability. It should be noted that this issue is not
proven and is just a supposition which needs to be addressed and further evaluated in depth in a
separate study.
68
CHAPTER 5 FUTURE TRENDS
5.1 Time Series Model
In regards to the third defined objective of the thesis, creating a future picture of the e-waste in Canada
is possible based on the condition imposed on the current available data. This chapter fulfills this
objective while trying to establish a platform for comparing the current and the future e-waste scenarios.
This might help the country to have a better future vision for confrontation with this issue as opposed to
threatening nature and the environment.
As the UN Comtrade e-waste trade data for Canada is related to time and is available from 1996 to
2013, it is therefore possible to forecast the future trend of the trade flows by means of a time series
model for a short period of time over the next five years. Therefore, in order to better underline these
trends, the import and export forecasting models have been calculated in this section.
At first, several time series models have been evaluated by the Minitab software for all trade data.
Additionally, the double exponential and exponential growth methods have been chosen among others
which best suits these analyses.
For a more accurate analysis of the results, both models have been implemented on both the imports and
the exports data continuously whereas the outputs have been compared together in each section
separately.
Due to the fact that the predictions are not absolute because of the different external factors that can
effects the results, it should be mentioned that the results can be effective and useful for the future if
everything stays the same. Issues such as change of regulations and the future environmental situation of
Canada among its trade partners can affect the forecasts.
69
5.1.1 Double Exponential Method for Import
The concept of double exponential smoothing involves the smoothing of data by Holt (and Brown under
exceptional circumstances) so that short-term forecasts are provided. This process works effectively
when a trend is noted; however, it additionally serves as a smoothing method for all potential scenarios.
The level and trend are the two components in which calculations for dynamic estimates are done [115].
Model Equation:
Double exponential smoothing uses a level and a trend component for each period. It uses two weights,
also known as smoothing parameters, in order to update each of the respective components per period.
The equations are [115]:
Lt = Yt + (1 ) [Lt -1 + Tt -1]
Tt = Lt Lt -1] + (1 Tt -1
t = Lt -1 + Tt -1
t
Where:
“…Lt is the level at time t, is the weight for the level
Tt is the trend at time t, is the weight for the trend
Yt is the data value at time t, and t is the fitted value, or one-step-ahead forecast, at time t
Resi is the residual value at time t…” [115].
Figure 5-1 shows the smoothing plot for import in the double exponential method. As Figure 5-1 shows,
the actual numbers have been plotted by the blue line, and the model fits can be seen next to it by the red
line color.
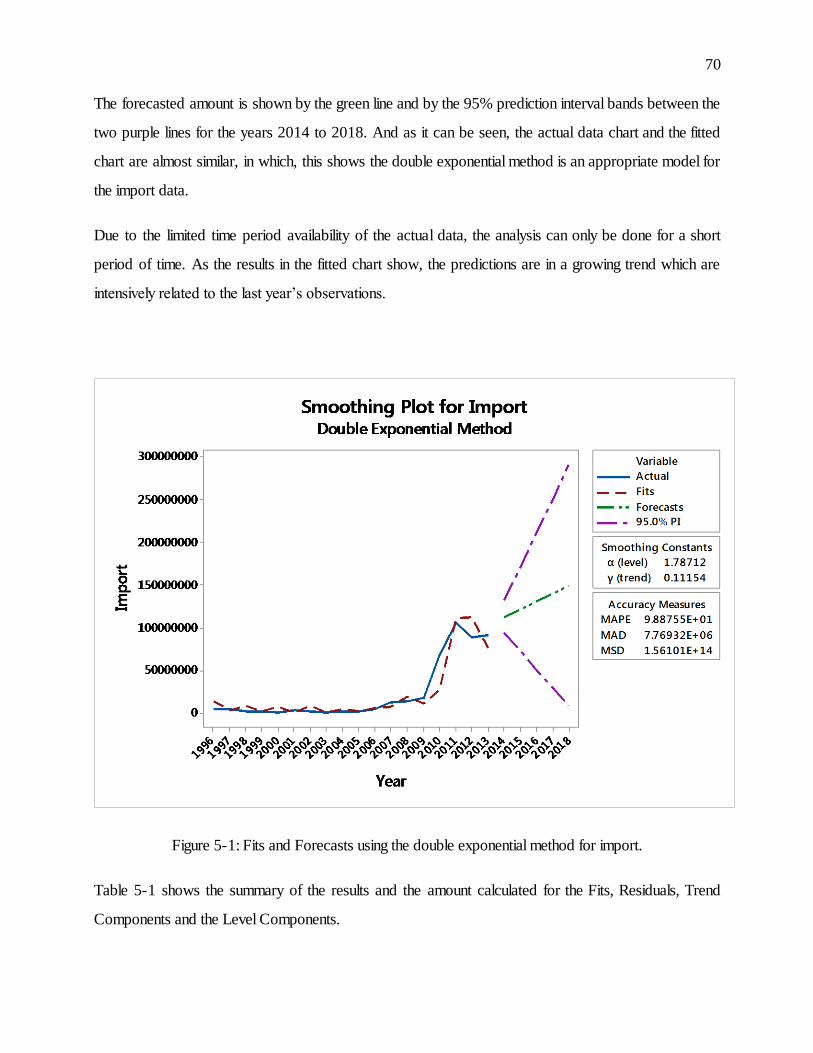
70
The forecasted amount is shown by the green line and by the 95% prediction interval bands between the
two purple lines for the years 2014 to 2018. And as it can be seen, the actual data chart and the fitted
chart are almost similar, in which, this shows the double exponential method is an appropriate model for
the import data.
Due to the limited time period availability of the actual data, the analysis can only be done for a short
period of time. As the results in the fitted chart show, the predictions are in a growing trend which are
intensively related to the last year’s observations.
Figure 5-1: Fits and Forecasts using the double exponential method for import.
Table 5-1 shows the summary of the results and the amount calculated for the Fits, Residuals, Trend
Components and the Level Components.
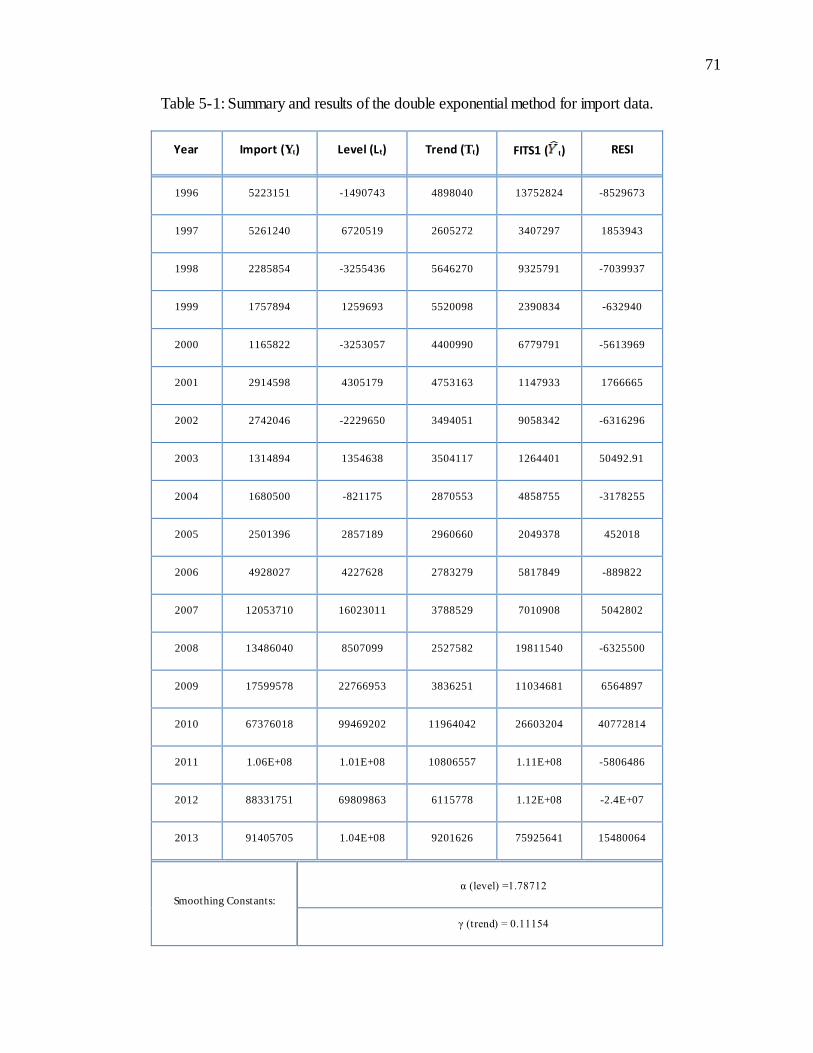
71
Table 5-1: Summary and results of the double exponential method for import data.
Year Import (Yt) Level (Lt) Trend (Tt) FITS1 ( t) RESI
1996 5223151 -1490743 4898040 13752824 -8529673
1997 5261240 6720519 2605272 3407297 1853943
1998 2285854 -3255436 5646270 9325791 -7039937
1999 1757894 1259693 5520098 2390834 -632940
2000 1165822 -3253057 4400990 6779791 -5613969
2001 2914598 4305179 4753163 1147933 1766665
2002 2742046 -2229650 3494051 9058342 -6316296
2003 1314894 1354638 3504117 1264401 50492.91
2004 1680500 -821175 2870553 4858755 -3178255
2005 2501396 2857189 2960660 2049378 452018
2006 4928027 4227628 2783279 5817849 -889822
2007 12053710 16023011 3788529 7010908 5042802
2008 13486040 8507099 2527582 19811540 -6325500
2009 17599578 22766953 3836251 11034681 6564897
2010 67376018 99469202 11964042 26603204 40772814
2011 1.06E+08 1.01E+08 10806557 1.11E+08 -5806486
2012 88331751 69809863 6115778 1.12E+08 -2.4E+07
2013 91405705 1.04E+08 9201626 75925641 15480064
Smoothing Constants:
α (level) =1.78712
γ (trend) = 0.11154
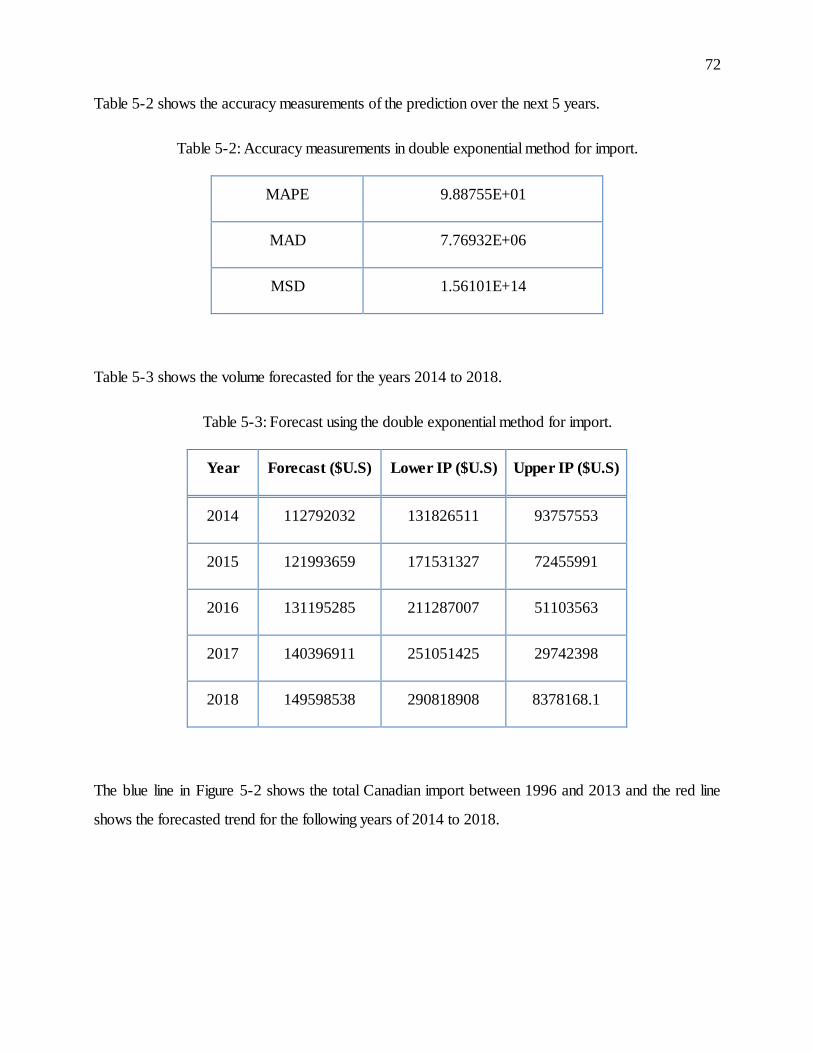
72
Table 5-2 shows the accuracy measurements of the prediction over the next 5 years.
Table 5-2: Accuracy measurements in double exponential method for import.
MAPE 9.88755E+01
MAD 7.76932E+06
MSD 1.56101E+14
Table 5-3 shows the volume forecasted for the years 2014 to 2018.
Table 5-3: Forecast using the double exponential method for import.
Year Forecast ($U.S) Lower IP ($U.S) Upper IP ($U.S)
2014 112792032 131826511 93757553
2015 121993659 171531327 72455991
2016 131195285 211287007 51103563
2017 140396911 251051425 29742398
2018 149598538 290818908 8378168.1
The blue line in Figure 5-2 shows the total Canadian import between 1996 and 2013 and the red line
shows the forecasted trend for the following years of 2014 to 2018.
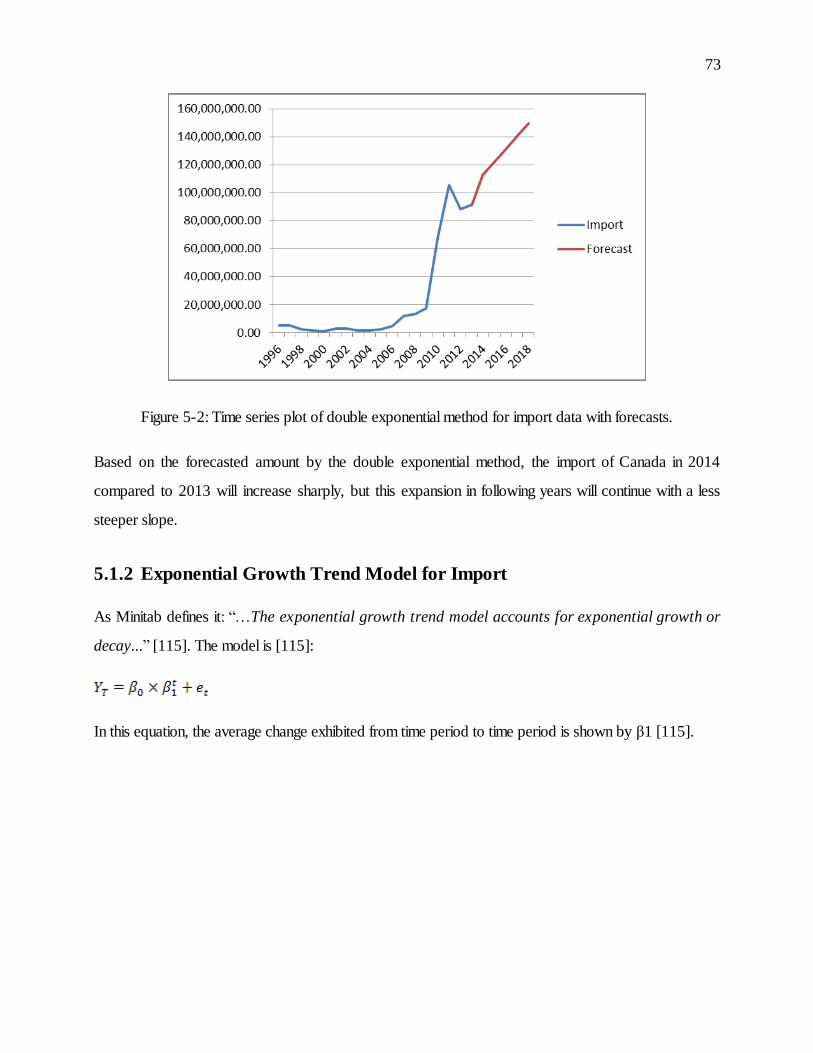
73
Figure 5-2: Time series plot of double exponential method for import data with forecasts.
Based on the forecasted amount by the double exponential method, the import of Canada in 2014
compared to 2013 will increase sharply, but this expansion in following years will continue with a less
steeper slope.
5.1.2 Exponential Growth Trend Model for Import
As Minitab defines it: “…The exponential growth trend model accounts for exponential growth or
decay...” [115]. The model is [115]:
In this equation, the average change exhibited from time period to time period is shown by β1 [115].
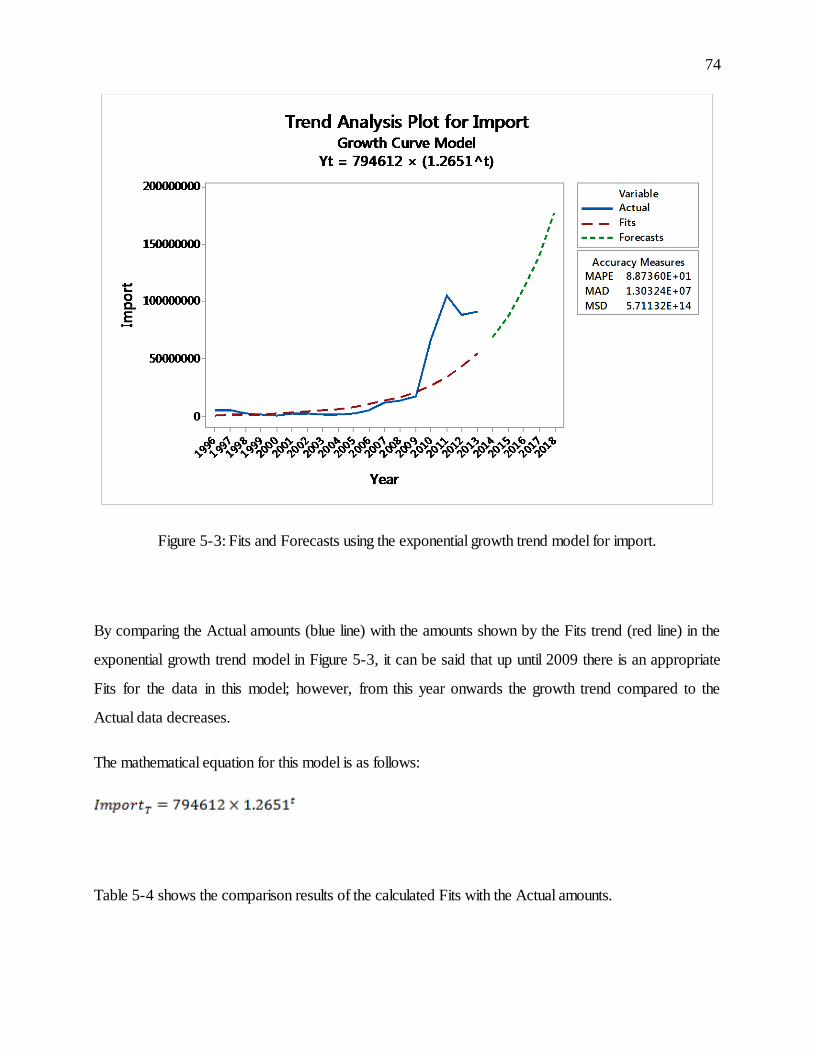
74
Figure 5-3: Fits and Forecasts using the exponential growth trend model for import.
By comparing the Actual amounts (blue line) with the amounts shown by the Fits trend (red line) in the
exponential growth trend model in Figure 5-3, it can be said that up until 2009 there is an appropriate
Fits for the data in this model; however, from this year onwards the growth trend compared to the
Actual data decreases.
The mathematical equation for this model is as follows:
Table 5-4 shows the comparison results of the calculated Fits with the Actual amounts.
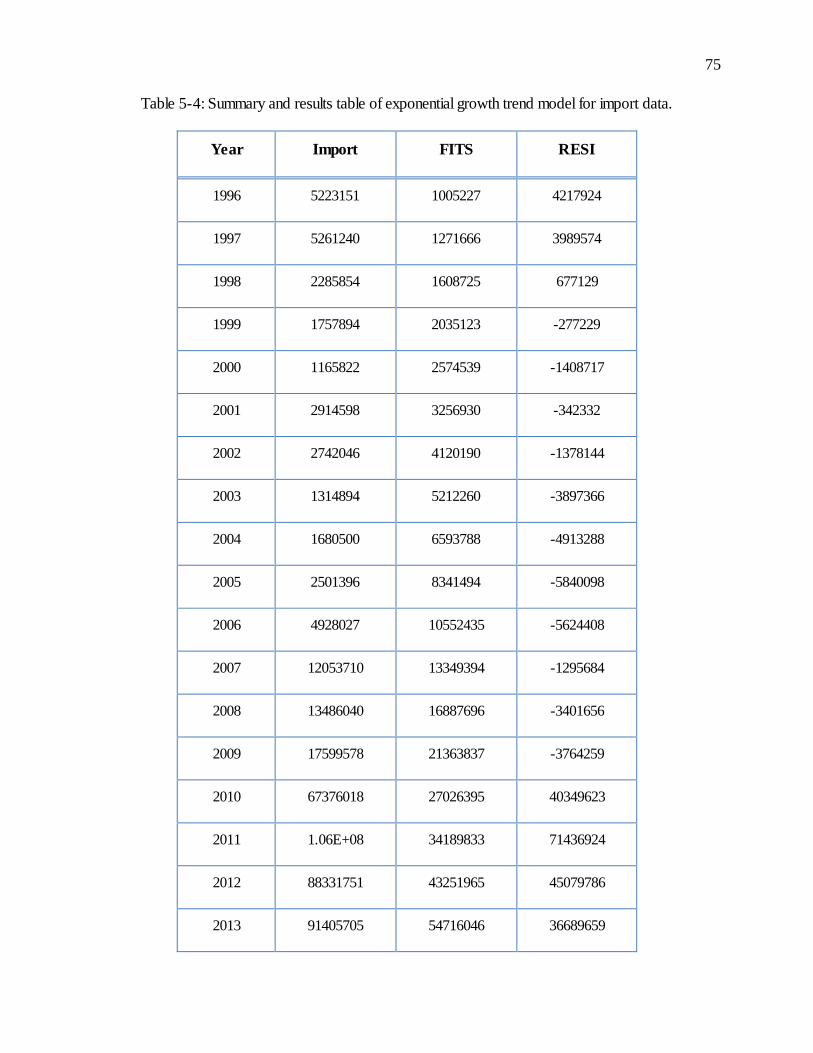
75
Table 5-4: Summary and results table of exponential growth trend model for import data.
Year Import FITS RESI
1996 5223151 1005227 4217924
1997 5261240 1271666 3989574
1998 2285854 1608725 677129
1999 1757894 2035123 -277229
2000 1165822 2574539 -1408717
2001 2914598 3256930 -342332
2002 2742046 4120190 -1378144
2003 1314894 5212260 -3897366
2004 1680500 6593788 -4913288
2005 2501396 8341494 -5840098
2006 4928027 10552435 -5624408
2007 12053710 13349394 -1295684
2008 13486040 16887696 -3401656
2009 17599578 21363837 -3764259
2010 67376018 27026395 40349623
2011 1.06E+08 34189833 71436924
2012 88331751 43251965 45079786
2013 91405705 54716046 36689659
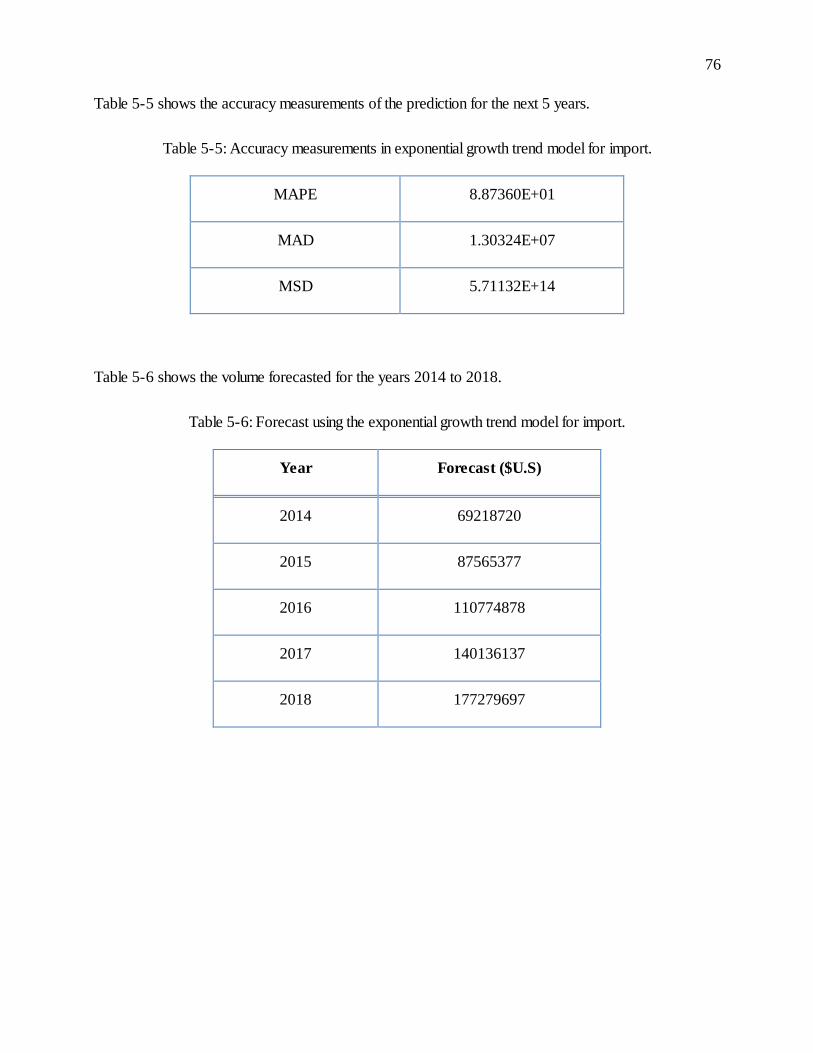
76
Table 5-5 shows the accuracy measurements of the prediction for the next 5 years.
Table 5-5: Accuracy measurements in exponential growth trend model for import.
MAPE 8.87360E+01
MAD 1.30324E+07
MSD 5.71132E+14
Table 5-6 shows the volume forecasted for the years 2014 to 2018.
Table 5-6: Forecast using the exponential growth trend model for import.
Year Forecast ($U.S)
2014 69218720
2015 87565377
2016 110774878
2017 140136137
2018 177279697
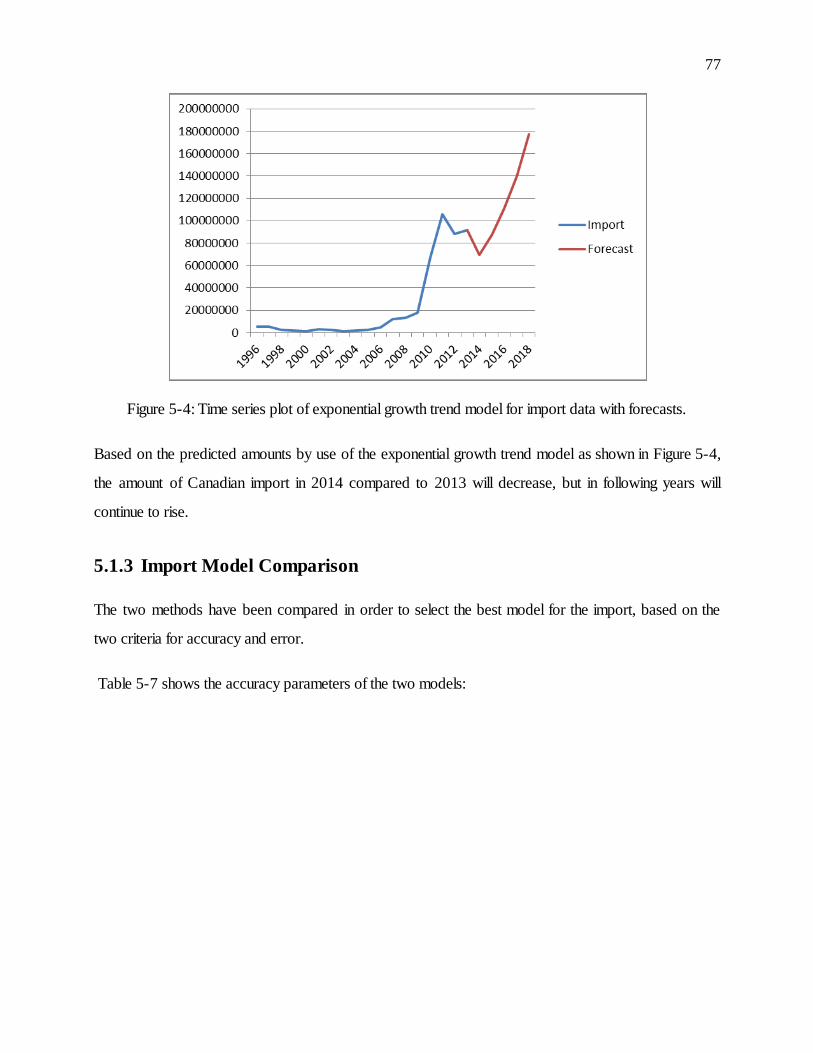
77
Figure 5-4: Time series plot of exponential growth trend model for import data with forecasts.
Based on the predicted amounts by use of the exponential growth trend model as shown in Figure 5-4,
the amount of Canadian import in 2014 compared to 2013 will decrease, but in following years will
continue to rise.
5.1.3 Import Model Comparison
The two methods have been compared in order to select the best model for the import, based on the
two criteria for accuracy and error.
Table 5-7 shows the accuracy parameters of the two models:
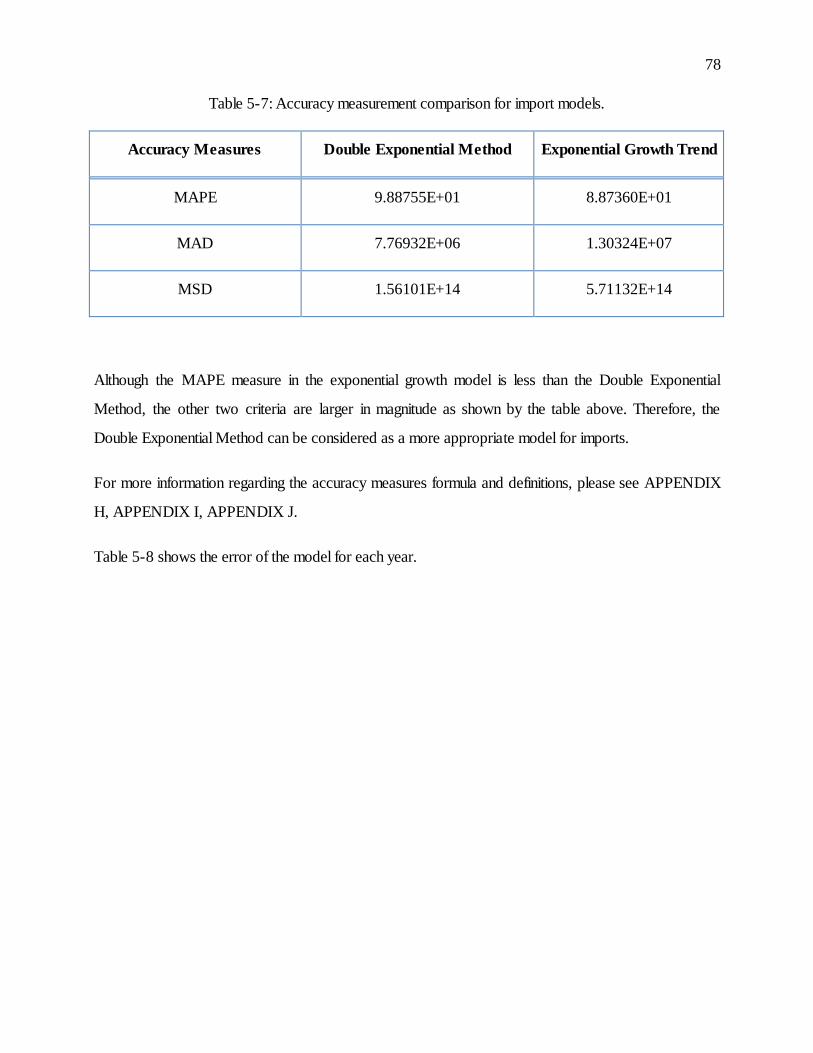
78
Table 5-7: Accuracy measurement comparison for import models.
Accuracy Measures Double Exponential Method Exponential Growth Trend
MAPE 9.88755E+01 8.87360E+01
MAD 7.76932E+06 1.30324E+07
MSD 1.56101E+14 5.71132E+14
Although the MAPE measure in the exponential growth model is less than the Double Exponential
Method, the other two criteria are larger in magnitude as shown by the table above. Therefore, the
Double Exponential Method can be considered as a more appropriate model for imports.
For more information regarding the accuracy measures formula and definitions, please see APPENDIX
H, APPENDIX I, APPENDIX J.
Table 5-8 shows the error of the model for each year.
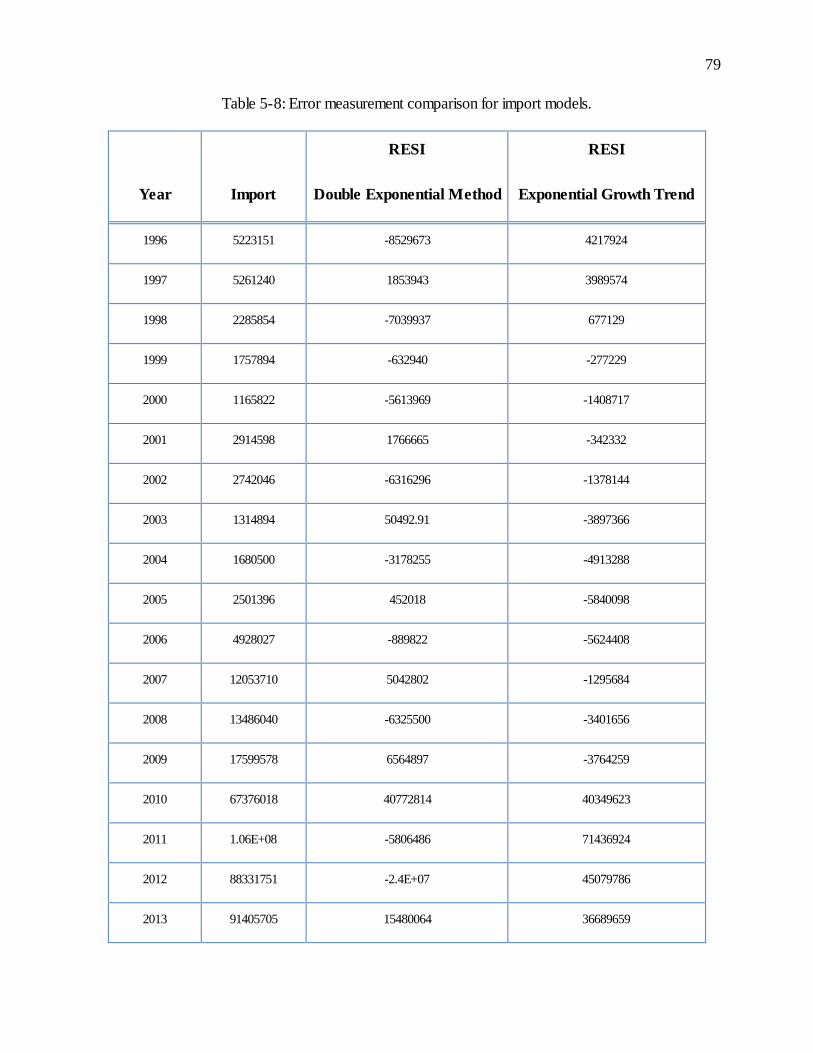
79
Table 5-8: Error measurement comparison for import models.
Year Import
RESI
Double Exponential Method
RESI
Exponential Growth Trend
1996 5223151 -8529673 4217924
1997 5261240 1853943 3989574
1998 2285854 -7039937 677129
1999 1757894 -632940 -277229
2000 1165822 -5613969 -1408717
2001 2914598 1766665 -342332
2002 2742046 -6316296 -1378144
2003 1314894 50492.91 -3897366
2004 1680500 -3178255 -4913288
2005 2501396 452018 -5840098
2006 4928027 -889822 -5624408
2007 12053710 5042802 -1295684
2008 13486040 -6325500 -3401656
2009 17599578 6564897 -3764259
2010 67376018 40772814 40349623
2011 1.06E+08 -5806486 71436924
2012 88331751 -2.4E+07 45079786
2013 91405705 15480064 36689659
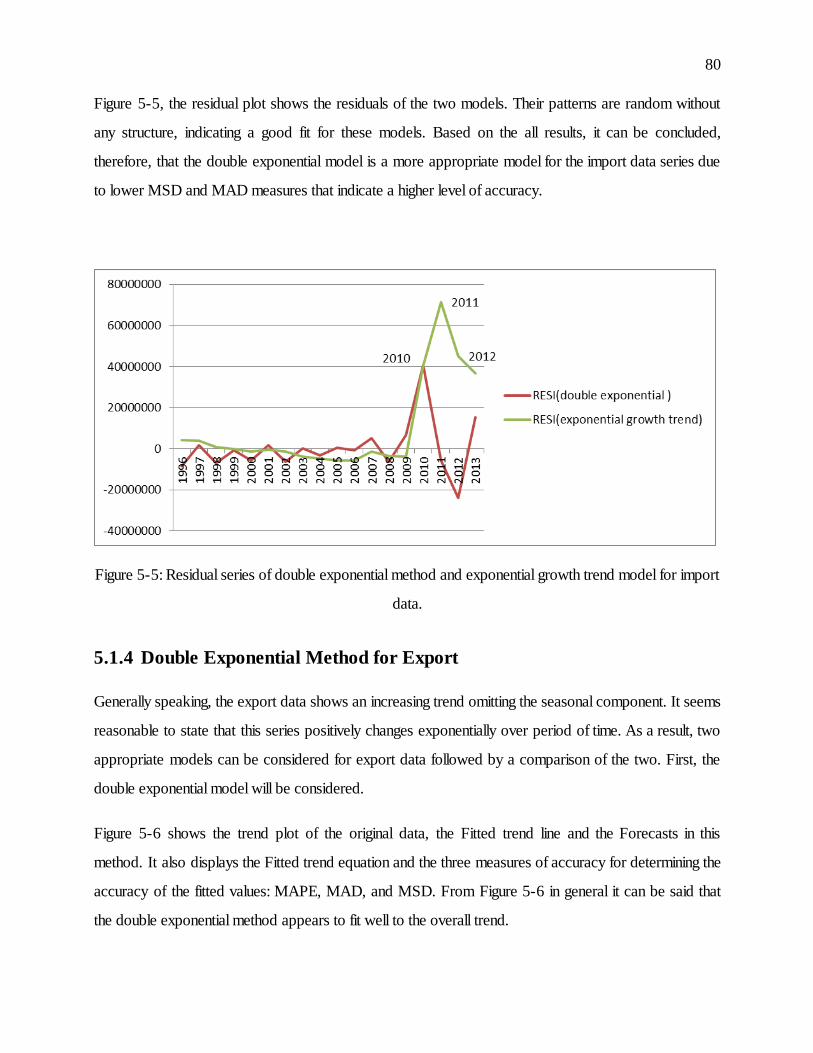
80
Figure 5-5, the residual plot shows the residuals of the two models. Their patterns are random without
any structure, indicating a good fit for these models. Based on the all results, it can be concluded,
therefore, that the double exponential model is a more appropriate model for the import data series due
to lower MSD and MAD measures that indicate a higher level of accuracy.
Figure 5-5: Residual series of double exponential method and exponential growth trend model for import
data.
5.1.4 Double Exponential Method for Export
Generally speaking, the export data shows an increasing trend omitting the seasonal component. It seems
reasonable to state that this series positively changes exponentially over period of time. As a result, two
appropriate models can be considered for export data followed by a comparison of the two. First, the
double exponential model will be considered.
Figure 5-6 shows the trend plot of the original data, the Fitted trend line and the Forecasts in this
method. It also displays the Fitted trend equation and the three measures of accuracy for determining the
accuracy of the fitted values: MAPE, MAD, and MSD. From Figure 5-6 in general it can be said that
the double exponential method appears to fit well to the overall trend.
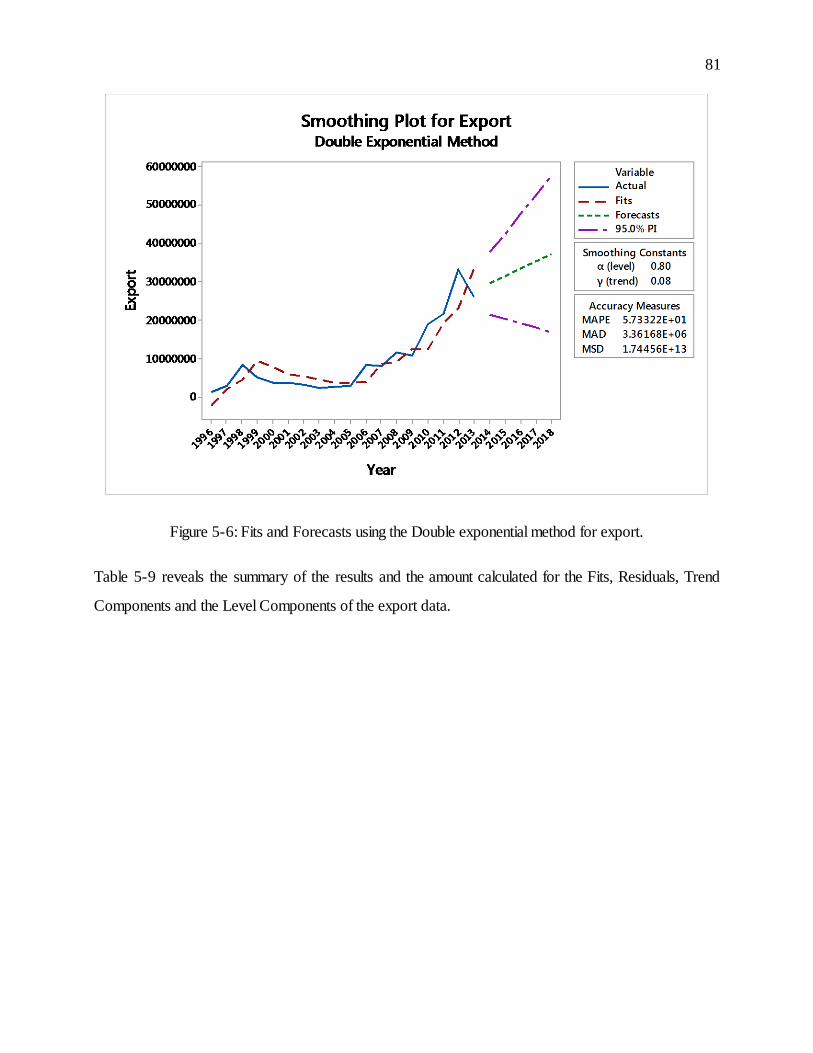
81
Figure 5-6: Fits and Forecasts using the Double exponential method for export.
Table 5-9 reveals the summary of the results and the amount calculated for the Fits, Residuals, Trend
Components and the Level Components of the export data.
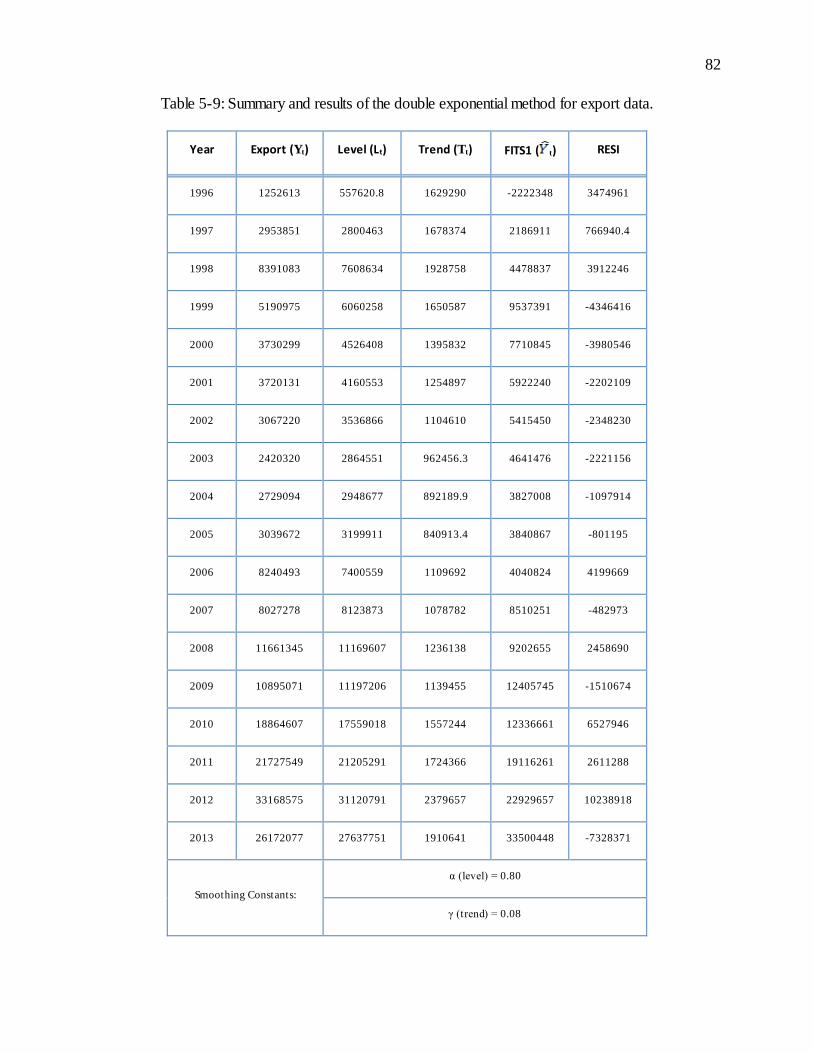
82
Table 5-9: Summary and results of the double exponential method for export data.
Year Export (Yt) Level (Lt) Trend (Tt) FITS1 ( t) RESI
1996 1252613 557620.8 1629290 -2222348 3474961
1997 2953851 2800463 1678374 2186911 766940.4
1998 8391083 7608634 1928758 4478837 3912246
1999 5190975 6060258 1650587 9537391 -4346416
2000 3730299 4526408 1395832 7710845 -3980546
2001 3720131 4160553 1254897 5922240 -2202109
2002 3067220 3536866 1104610 5415450 -2348230
2003 2420320 2864551 962456.3 4641476 -2221156
2004 2729094 2948677 892189.9 3827008 -1097914
2005 3039672 3199911 840913.4 3840867 -801195
2006 8240493 7400559 1109692 4040824 4199669
2007 8027278 8123873 1078782 8510251 -482973
2008 11661345 11169607 1236138 9202655 2458690
2009 10895071 11197206 1139455 12405745 -1510674
2010 18864607 17559018 1557244 12336661 6527946
2011 21727549 21205291 1724366 19116261 2611288
2012 33168575 31120791 2379657 22929657 10238918
2013 26172077 27637751 1910641 33500448 -7328371
Smoothing Constants:
α (level) = 0.80
γ (trend) = 0.08
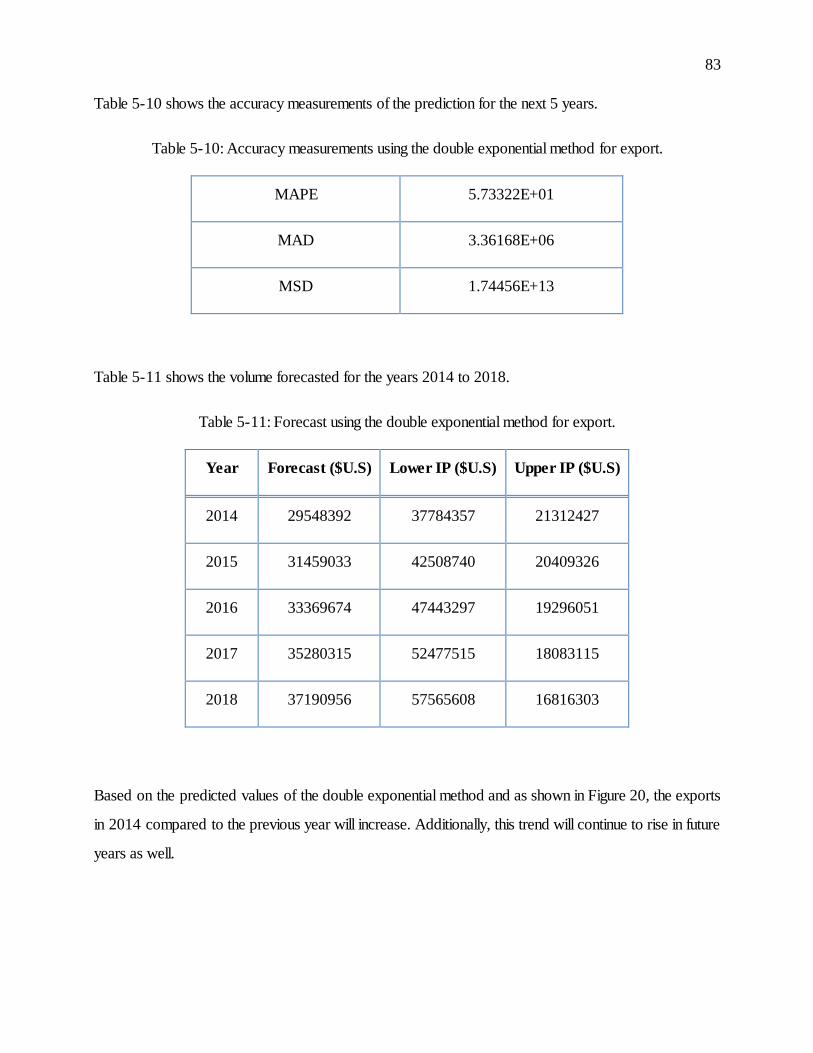
83
Table 5-10 shows the accuracy measurements of the prediction for the next 5 years.
Table 5-10: Accuracy measurements using the double exponential method for export.
MAPE 5.73322E+01
MAD 3.36168E+06
MSD 1.74456E+13
Table 5-11 shows the volume forecasted for the years 2014 to 2018.
Table 5-11: Forecast using the double exponential method for export.
Year Forecast ($U.S) Lower IP ($U.S) Upper IP ($U.S)
2014 29548392 37784357 21312427
2015 31459033 42508740 20409326
2016 33369674 47443297 19296051
2017 35280315 52477515 18083115
2018 37190956 57565608 16816303
Based on the predicted values of the double exponential method and as shown in Figure 20, the exports
in 2014 compared to the previous year will increase. Additionally, this trend will continue to rise in future
years as well.
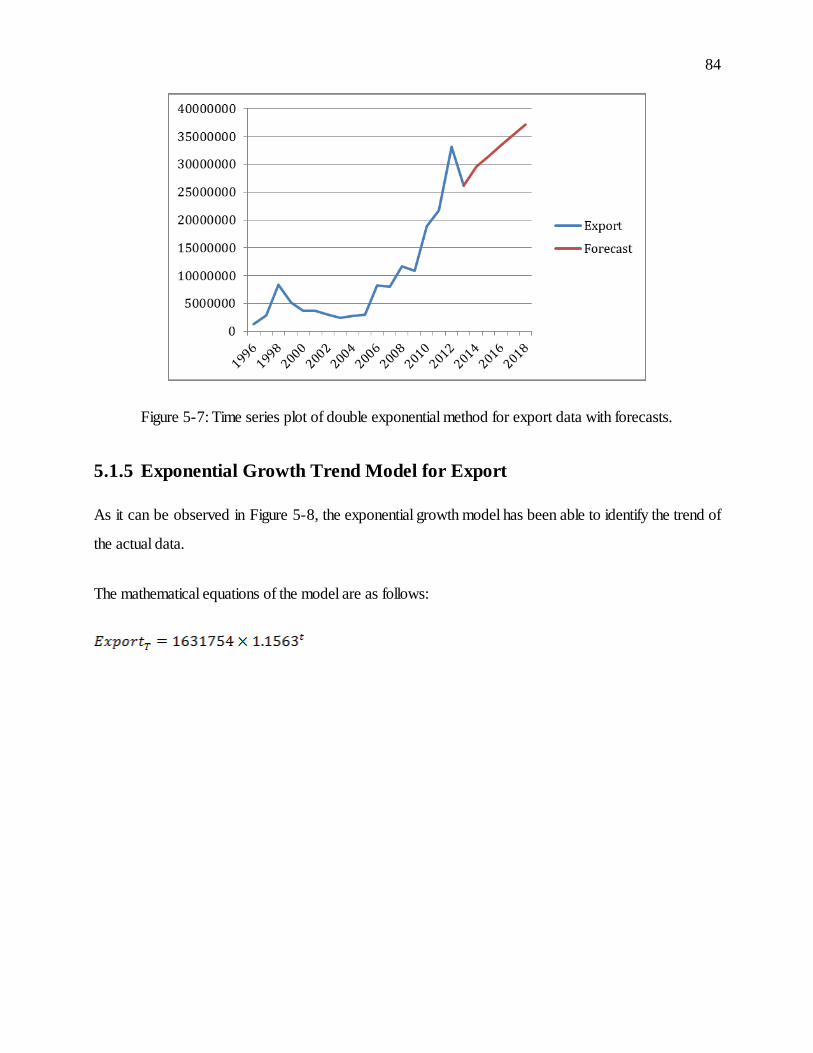
84
Figure 5-7: Time series plot of double exponential method for export data with forecasts.
5.1.5 Exponential Growth Trend Model for Export
As it can be observed in Figure 5-8, the exponential growth model has been able to identify the trend of
the actual data.
The mathematical equations of the model are as follows:
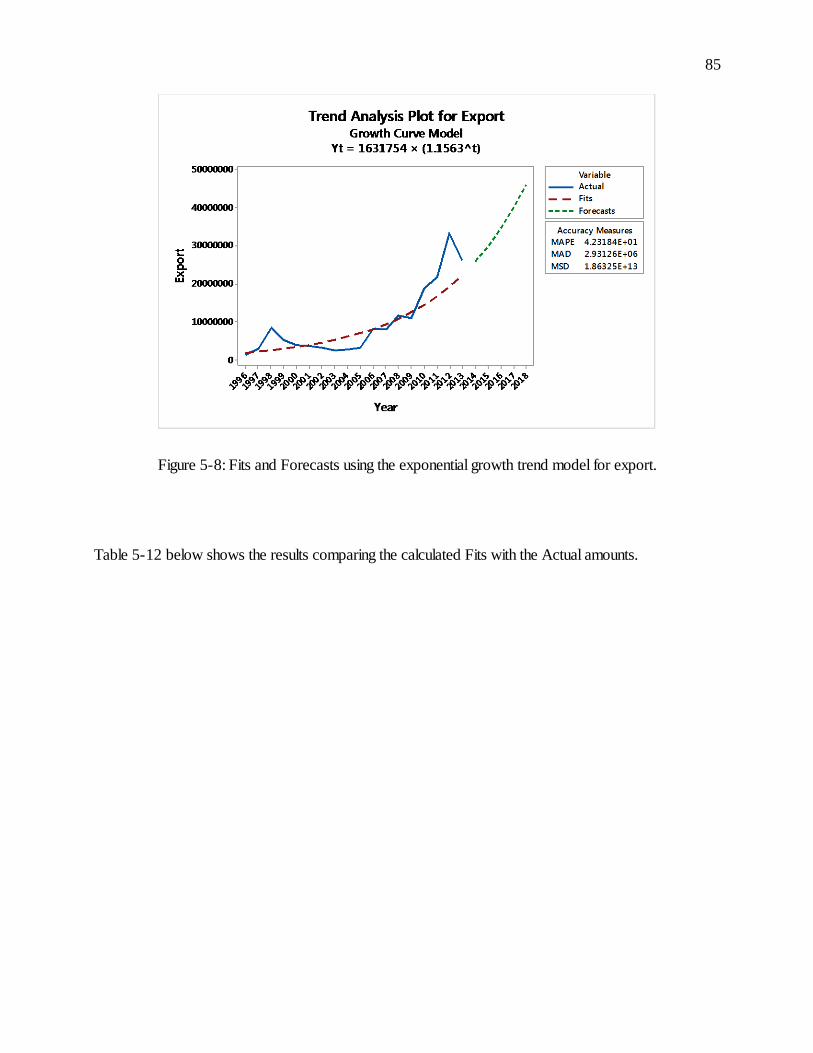
85
Figure 5-8: Fits and Forecasts using the exponential growth trend model for export.
Table 5-12 below shows the results comparing the calculated Fits with the Actual amounts.
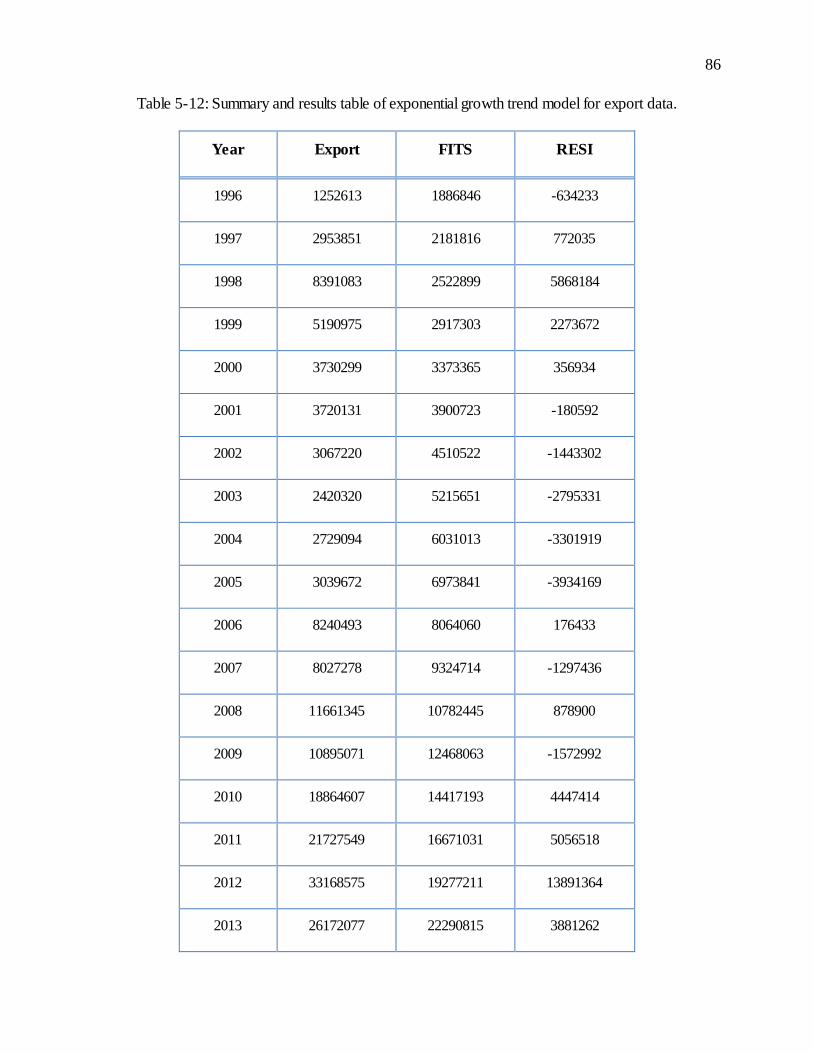
86
Table 5-12: Summary and results table of exponential growth trend model for export data.
Year Export FITS RESI
1996 1252613 1886846 -634233
1997 2953851 2181816 772035
1998 8391083 2522899 5868184
1999 5190975 2917303 2273672
2000 3730299 3373365 356934
2001 3720131 3900723 -180592
2002 3067220 4510522 -1443302
2003 2420320 5215651 -2795331
2004 2729094 6031013 -3301919
2005 3039672 6973841 -3934169
2006 8240493 8064060 176433
2007 8027278 9324714 -1297436
2008 11661345 10782445 878900
2009 10895071 12468063 -1572992
2010 18864607 14417193 4447414
2011 21727549 16671031 5056518
2012 33168575 19277211 13891364
2013 26172077 22290815 3881262
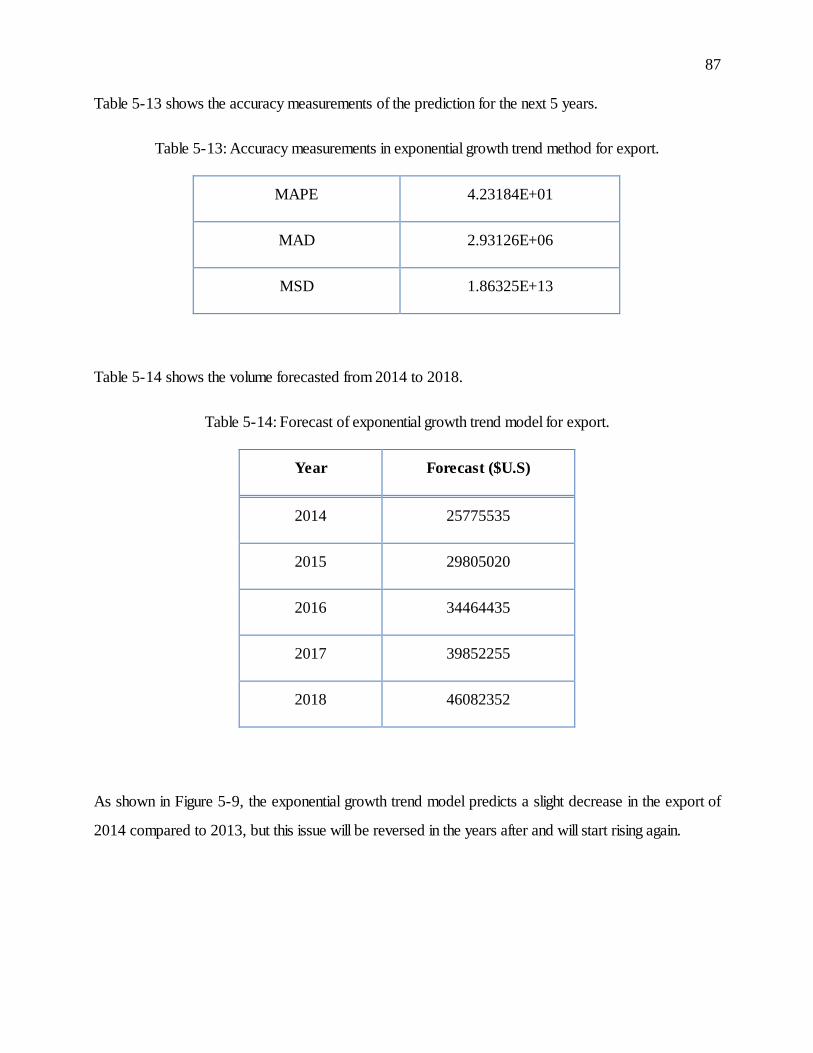
87
Table 5-13 shows the accuracy measurements of the prediction for the next 5 years.
Table 5-13: Accuracy measurements in exponential growth trend method for export.
MAPE 4.23184E+01
MAD 2.93126E+06
MSD 1.86325E+13
Table 5-14 shows the volume forecasted from 2014 to 2018.
Table 5-14: Forecast of exponential growth trend model for export.
As shown in Figure 5-9, the exponential growth trend model predicts a slight decrease in the export of
2014 compared to 2013, but this issue will be reversed in the years after and will start rising again.
Year Forecast ($U.S)
2014 25775535
2015 29805020
2016 34464435
2017 39852255
2018 46082352
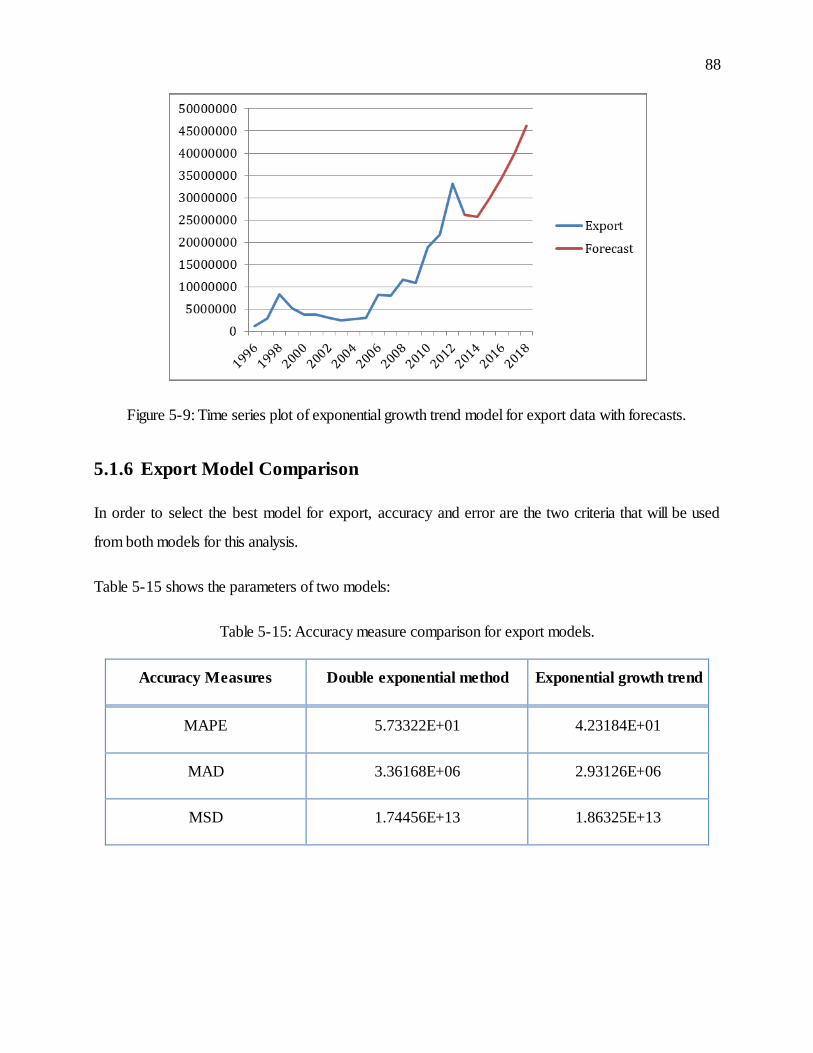
88
Figure 5-9: Time series plot of exponential growth trend model for export data with forecasts.
5.1.6 Export Model Comparison
In order to select the best model for export, accuracy and error are the two criteria that will be used
from both models for this analysis.
Table 5-15 shows the parameters of two models:
Table 5-15: Accuracy measure comparison for export models.
Accuracy Measures Double exponential method Exponential growth trend
MAPE 5.73322E+01 4.23184E+01
MAD 3.36168E+06 2.93126E+06
MSD 1.74456E+13 1.86325E+13

89
In this table, it is observed that the MAPE and MAD measures in the exponential growth trend model
are lower than that of the double exponential method, and the MSD criterion is slightly higher, though
very close to the number found with the double exponential method.
The following table shows the error of the models for each year:
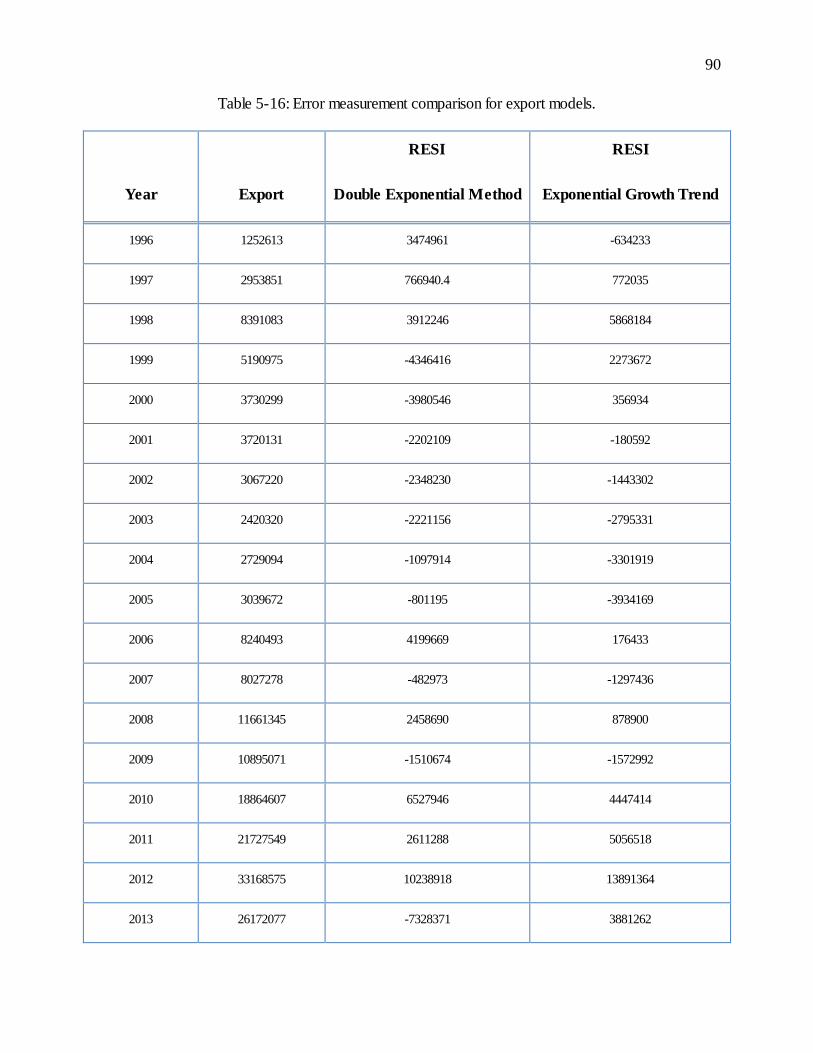
90
Table 5-16: Error measurement comparison for export models.
Year Export
RESI
Double Exponential Method
RESI
Exponential Growth Trend
1996 1252613 3474961 -634233
1997 2953851 766940.4 772035
1998 8391083 3912246 5868184
1999 5190975 -4346416 2273672
2000 3730299 -3980546 356934
2001 3720131 -2202109 -180592
2002 3067220 -2348230 -1443302
2003 2420320 -2221156 -2795331
2004 2729094 -1097914 -3301919
2005 3039672 -801195 -3934169
2006 8240493 4199669 176433
2007 8027278 -482973 -1297436
2008 11661345 2458690 878900
2009 10895071 -1510674 -1572992
2010 18864607 6527946 4447414
2011 21727549 2611288 5056518
2012 33168575 10238918 13891364
2013 26172077 -7328371 3881262
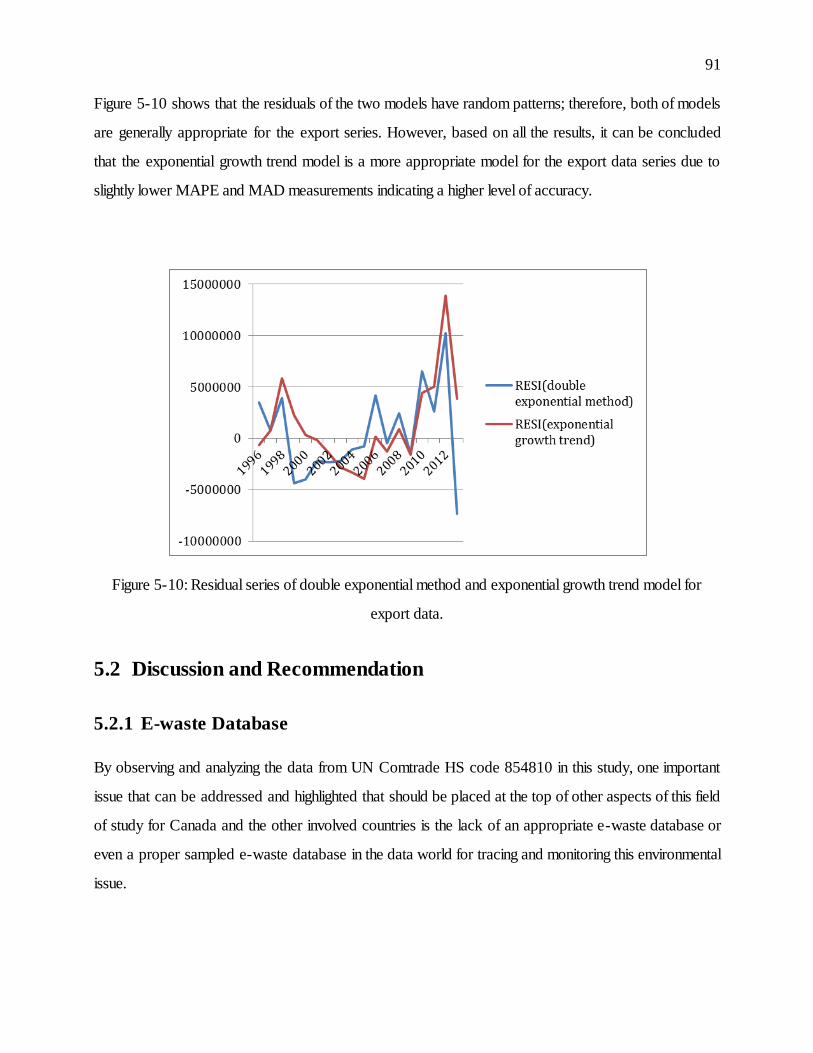
91
Figure 5-10 shows that the residuals of the two models have random patterns; therefore, both of models
are generally appropriate for the export series. However, based on all the results, it can be concluded
that the exponential growth trend model is a more appropriate model for the export data series due to
slightly lower MAPE and MAD measurements indicating a higher level of accuracy.
Figure 5-10: Residual series of double exponential method and exponential growth trend model for
export data.
5.2 Discussion and Recommendation
5.2.1 E-waste Database
By observing and analyzing the data from UN Comtrade HS code 854810 in this study, one important
issue that can be addressed and highlighted that should be placed at the top of other aspects of this field
of study for Canada and the other involved countries is the lack of an appropriate e-waste database or
even a proper sampled e-waste database in the data world for tracing and monitoring this environmental
issue.
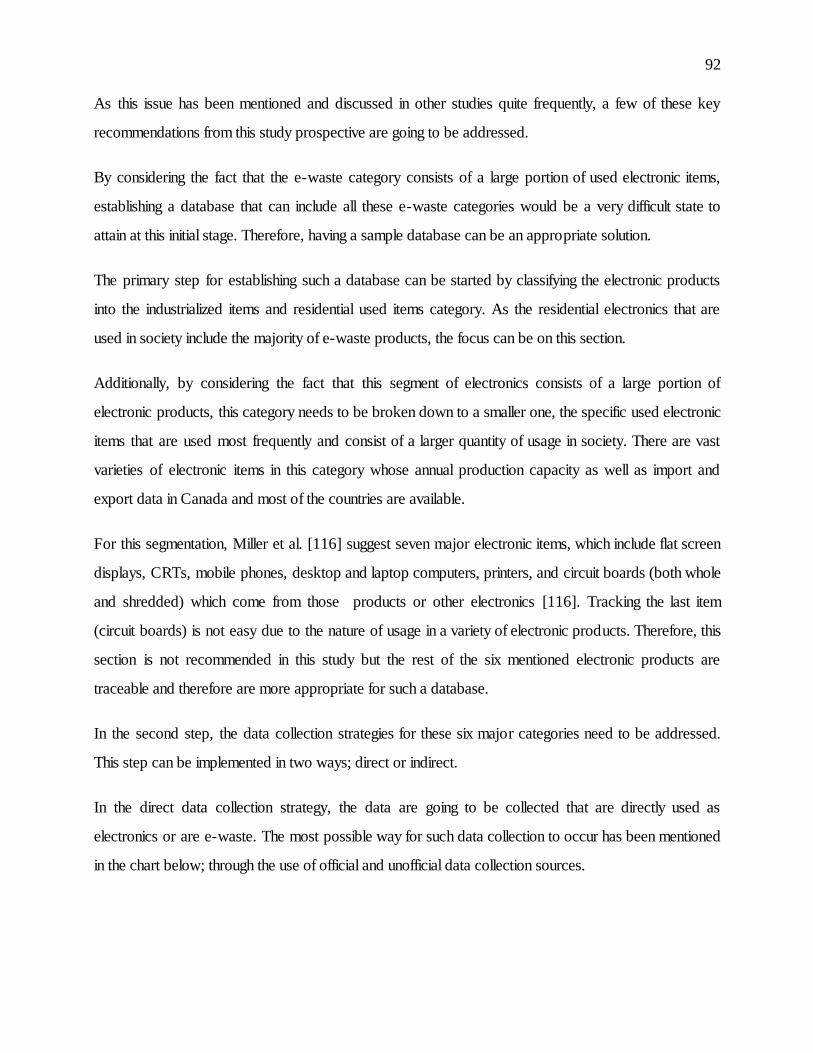
92
As this issue has been mentioned and discussed in other studies quite frequently, a few of these key
recommendations from this study prospective are going to be addressed.
By considering the fact that the e-waste category consists of a large portion of used electronic items,
establishing a database that can include all these e-waste categories would be a very difficult state to
attain at this initial stage. Therefore, having a sample database can be an appropriate solution.
The primary step for establishing such a database can be started by classifying the electronic products
into the industrialized items and residential used items category. As the residential electronics that are
used in society include the majority of e-waste products, the focus can be on this section.
Additionally, by considering the fact that this segment of electronics consists of a large portion of
electronic products, this category needs to be broken down to a smaller one, the specific used electronic
items that are used most frequently and consist of a larger quantity of usage in society. There are vast
varieties of electronic items in this category whose annual production capacity as well as import and
export data in Canada and most of the countries are available.
For this segmentation, Miller et al. [116] suggest seven major electronic items, which include flat screen
displays, CRTs, mobile phones, desktop and laptop computers, printers, and circuit boards (both whole
and shredded) which come from those products or other electronics [116]. Tracking the last item
(circuit boards) is not easy due to the nature of usage in a variety of electronic products. Therefore, this
section is not recommended in this study but the rest of the six mentioned electronic products are
traceable and therefore are more appropriate for such a database.
In the second step, the data collection strategies for these six major categories need to be addressed.
This step can be implemented in two ways; direct or indirect.
In the direct data collection strategy, the data are going to be collected that are directly used as
electronics or are e-waste. The most possible way for such data collection to occur has been mentioned
in the chart below; through the use of official and unofficial data collection sources.
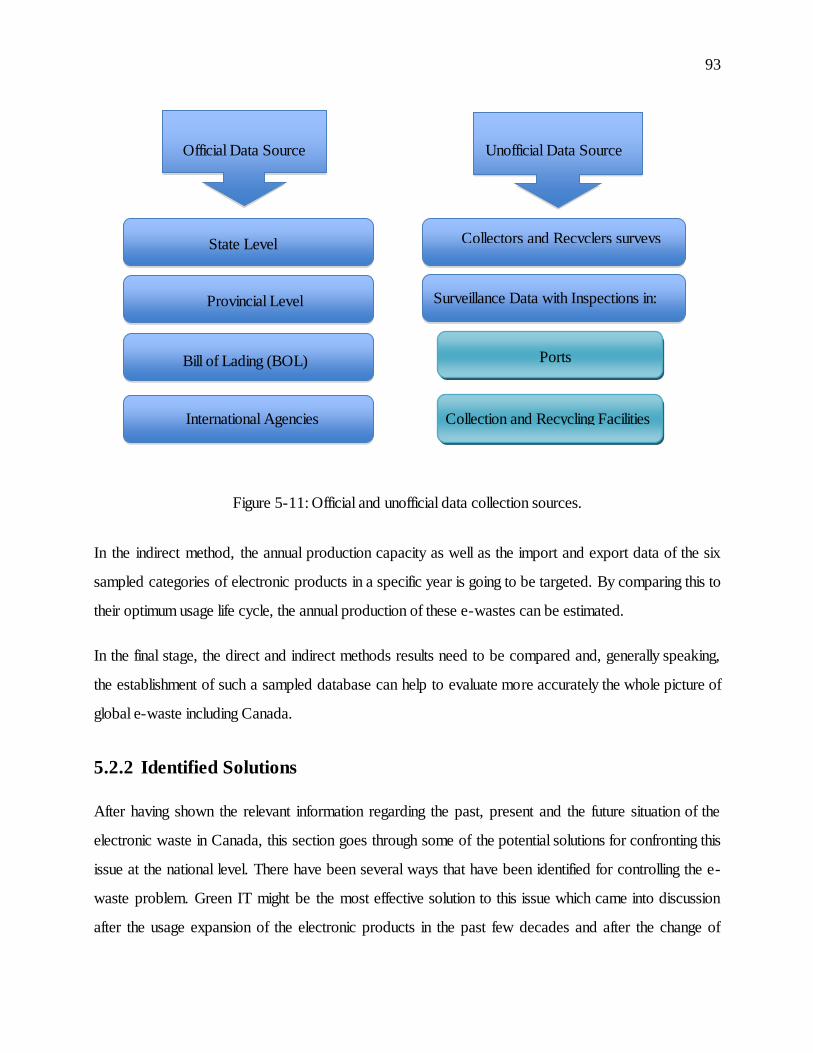
93
Figure 5-11: Official and unofficial data collection sources.
In the indirect method, the annual production capacity as well as the import and export data of the six
sampled categories of electronic products in a specific year is going to be targeted. By comparing this to
their optimum usage life cycle, the annual production of these e-wastes can be estimated.
In the final stage, the direct and indirect methods results need to be compared and, generally speaking,
the establishment of such a sampled database can help to evaluate more accurately the whole picture of
global e-waste including Canada.
5.2.2 Identified Solutions
After having shown the relevant information regarding the past, present and the future situation of the
electronic waste in Canada, this section goes through some of the potential solutions for confronting this
issue at the national level. There have been several ways that have been identified for controlling the e-
waste problem. Green IT might be the most effective solution to this issue which came into discussion
after the usage expansion of the electronic products in the past few decades and after the change of
Unofficial Data Source Official Data Source
Provincial Level
Collectors and Recyclers surveys
Surveillance Data with Inspections in:
Ports
International Agencies Collection and Recycling Facilities
State Level
Bill of Lading (BOL)
94
global regulations in different countries for confronting this issue. The environmental policy changes are
aimed at direct manufacturers of the electronic products in order to move toward a greater usage of the
recyclable and less harmful chemical materials in their production lines.
These days by improving the technology and innovation, there are more possibilities that will become
evident for decreasing the hazardous effect of the electronic products by their producers [117]. In this
way, awareness initiatives with the involvement of the government could be an effective way for
designing electronic products that work more efficiently in an environmentally friendly way [48]. The new
designs and technologies, such as the Electronic Product Environmental Assessment Tool (EPEAT) or
EnergyStar, are examples of those that move toward compatibility with the global environmental green
rating systems and standards.
The sales of the registered products by the EPEAT rating system is expected to increase twofold
globally in 2010. In that same year, this number increased by nearly a third to more than 4.2 million
products in Canada alone [118]. It should be noted that, smaller sizes and lower weights with respect to
the volume of the electronic products are being favored. One of the best examples could be the change
of design from the cathode ray tubes (CRTs) displays to flat panel displays which are 82% lighter and
take 75% lower volume [119].
Furthermore from a technological perspective, the new online data platforms are the other revolution for
usage reduction of electronic products and e-waste production. Technologies, such as the effective
platform for providing virtual space for documents and programs through the web, also known as cloud
computing, enables a variety of users to have unlimited access anywhere in the world without a need for
the use of digital products. It is one of the contributing factors that has effectively lowered the weight and
size of electronics for both professional and personal use [120]. It has been noted that cloud computing
has the potential and capability to lower the carbon emissions by 30% to 90% in organizational platforms
[121].
The other revolution from a technological perspective is the expansion of applications from different
electronic devices such as smartphones, tablets and smart televisions, which has widely reduced the need
of using different devices for different purposes. It is expected that this industry will vastly expand in the
future, based on projections that the number of downloads for all apps will hit 187 billion by 2017
95
knowing that there were 87.8 billion downloads done in 2013 [122], and that there were only 10.9
billion in 2010 [123].
The other effective and controversial solution is having more user involvement in the process of recycling
by creating more public awareness for highlighting the role of each individual for decreasing the
hazardous effects of used electronic products. By increasing awareness for recycling the old mobile
phones among the public as an example, 240,000 tonnes of the raw material emissions can potentially be
reduced in the world scale. It is estimated that the total number of mobile phone owners has surpassed 3
billion around the globe, out of which based on the Nokia research, it is estimated that only 3% recycle
their phones [28].
The development of national and international legislations in exporter and importer countries is the other
possible way for this reduction to occur. As long as these regulations enforce more harmonization among
nations, they can be implemented as well as be more influential. On the other hand, more efficient e-
waste management through improving different aspects such as technology and safe transportation
among developed counties is the other way for ensuring that a reduction occurs [48].
Finally, the most important aspect that needs to be addressed is the importance of expanding the
recycling sites and the national recycling capacity due to the reason that the collection and the recycling
of the e-waste products can be a potential cause of economic gain for the nation. This can become a
potential outcome by considering the fact that most of these products contain the valuable substances
that can be recycled and be used again in the new electronic devices As it is estimated, the global
electronics end-of-life products offer 40 million tonnes of potential material resources annually, many of
which could be reused again towards new useful products [18, 124].
Therefore, the promotion of private businesses to become more involved in this business opportunity
could be a bilateral profitable agreement as well, since it serves as a political gain while also being
profitable for the private sector. Canada in this sector is more governmental, as in most of the provinces,
the non-profit entities are responsible for managing the different programs such as product stewardship
programs [48]. The government can act as a more cost effective means if it gives more responsibilities to
the private businesses and take the monitoring responsibility in a broader aspect for controlling these
activities.
96
CONCLUSION
The role of the electronic waste as the member of the hazardous waste family in the environment and its
trade flow as well as its reason for existence has been vastly discussed for different countries in the
academic and non-academic realms. This study has taken a more specific look at this issue on the
Canadian scale with the aim of identifying its trade network and its international trade factors, including
domestic and international regulations along with reasons of such trades as well as benefits and potential
gaps.
The analysis of this study on the UN Comtrade code 854810 as the only available sample database
found by the author for tracking the e-waste on the global databases platforms shows that Canada,
despite the assumption regarding its export of e-waste toward developing countries as a net exporter of
this hazardous waste, is in contrast to this assumption as observations on data have been found to be in
the opposite direction.
This research is not a representation of all e-waste flow in Canada due to its data limitations; since the
database used is limited to only the waste and scrap of primary cells, primary batteries and electrical
accumulators, it therefore does not include all other e-waste categories. Despite the fact that there is no
database category defined or existent as electronic waste, this is the only database that exists with its
specific characterization for tracking the e-waste directions from 1996 to 2013.
Therefore, the study answered its research question by use of the mentioned database and its conditions
as a proxy data by mapping Canada’s e-waste trade flows and showing its trends in past years. As the
results show, Canada’s e-waste flow nature in the last decade has changed from a net exporter to a net
importer; therefore, the analysis rejected the initial hypothesis.
There have been several reasons mentioned in this study for explaining the existence of such a trade. The
most important ones are as follows: profitability, e-waste transboundry regulations at the international
level and international treaties such as the Basel convention that have banned the export of such
hazardous waste between countries, especially toward developing ones. This can also be a potential
reason that turns this flow towards developed countries, especially those with vastly unpopulated lands
such as Canada.
97
Technology advancements in recent years can also be another contributing factor. Furthermore, a limited
amount of mandatory domestic regulations for collecting and recycling the batteries in addition to an
excess of domestic recycling capacity for specific sorts of batteries, especially in 2007, might also be
another contributing factor.
Lastly, the pollution haven hypothesis effects have been vastly seen over the e-waste trades especially in
2008 to 2012, the years of import expansion. Canada’s environmental performance index (CPI)
downgraded and the domestic health and environment protection laws strengthened in this time period
for Canada’s main trade partner countries, such as the United States. This tightness in the environmental
regulation as Kellenberg mentioned earlier resulted in an increased export in movements from a country
with high environmental regulations to lower ones, resulting in an international waste haven effect.
It should be also noted that, all of the mentioned reasons need to be investigated more in depth with
evidence to be proven, as at the moment they are just rational assumptions.
Furthermore, the analysis of the two time series models show the trend of this flow for the next 5 years
and the results reveal a brighter picture of what is expected to happen.
Based on this analysis, it can be expected that the import and export growth trends are both rising for the
next five years, though the slope of the export growth is more likely to be flat for the first year of these
forecasts until 2014.
For the last four years of the estimations, it is expected that the import and the export will both continue
rising at almost the same speed. By the end of this period, Canada will still stay similar to the latest stage
in 2013 as a net importer of the electronic waste with three times the amount of import than export.
Based on the forecasts and by considering the expansion of the e-waste production in the coming years,
this study concludes that it can be a major concern for the environment and the nature of Canada to be a
net importer of such a hazardous waste in the future; therefore, it is essential that this topic be further
investigated to answer the remaining questions, as this can aid in the betterment of the economy and the
environment.
98
REFERENCES
[1] REV-AMP Electrical equipment LTD. (n.d.). About us. Available:
http://www.revampelectrical.com/about-us/
[2] L. Jerome. (December 29, 2011). Don't trash that computer. Available:
http://www.intelligencer.ca/2011/12/28/dont-trash-that-computer
[3] Shift Recyling. (n.d.). E-waste problem. Available: http://shiftrecycling.com/e-waste.php
[4] K. Hieronymi, R. Kahhat, and E. Williams, E-waste Management: From Waste to Resource:
Routledge, 2012.
[5] F. Wang, J. Huisman, K. Balde, and A. Stevels, "A systematic and compatible classification of
WEEE," in Electronics Goes Green 2012+(EGG), 2012, 2012, pp. 1-6.
[6] Greenpeace. (2014). The e-waste problem. Available:
http://www.greenpeace.org/international/en/campaigns/toxics/electronics/the-e-waste-problem/
[7] eWaste Direct Inc. (March 15, 2013). The hazards of electronic waste (e-waste). Available:
http://www.ewastedirect.com/the-hazards-of-electronic-waste-e-waste/
[8] S. Harold. (January 2012) Managing e-waste in Canada presents many challenges and
opportunities. Environmental Science & Engineering Magazine. 32. Available:
http://ese.dgtlpub.com/2012/2012-02-
29/pdf/Managing_e_waste_in_Canada_presents_many_challenges_and_opportunities.pdf
[9] Solving the e-waste problem (StEP). (2014). Canada. Available: http://step-
initiative.org/index.php/Overview_Canada.html
[10] Nairobi. (November 27, 2006). Basel conference addresses electronic wastes challenge.
Available:
http://www.unep.org/Documents.Multilingual/Default.asp?DocumentID=485&ArticleID=5431&
l=en
[11] United Nations Environment Programme (UNEP). (n.d.). E-waste management workshop on
take back system. Available:
http://www.unep.org/ietc/wastemanagementworkshopontakebacksystem/tabid/79437/default.as
px
[12] Public Works and Government Services Canada. (2014). Federal electronic waste strategy.
Available: http://www.tpsgc-pwgsc.gc.ca/ecologisation-greening/dechets-waste/index-eng.html
[13] C.-W. Maureen and W. Carolyn. (January 2008). Waste bytes! Diverting waste electrical
and electronic equipment in Ontario Available: http://cielap.org/pdf/EwasteOntario.pdf
[14] Ontario Electronic Stewardship (OES). (2011). End-of-life technology: do policies and plans
on e-waste management make a difference to your business? Available:
http://www.recycleyourelectronics.ca/wp-content/uploads/2014/03/End-of-Life-
Technology_White_Paper_Report_revised_FINAL.pdf
[15] The Basel Action Network. (October 22, 2002). Exporting harm: the high-tech trashing of
Asia, the Canadian story. Available: http://ban.org/E-waste/Exporting%20Harm_canada.PDF
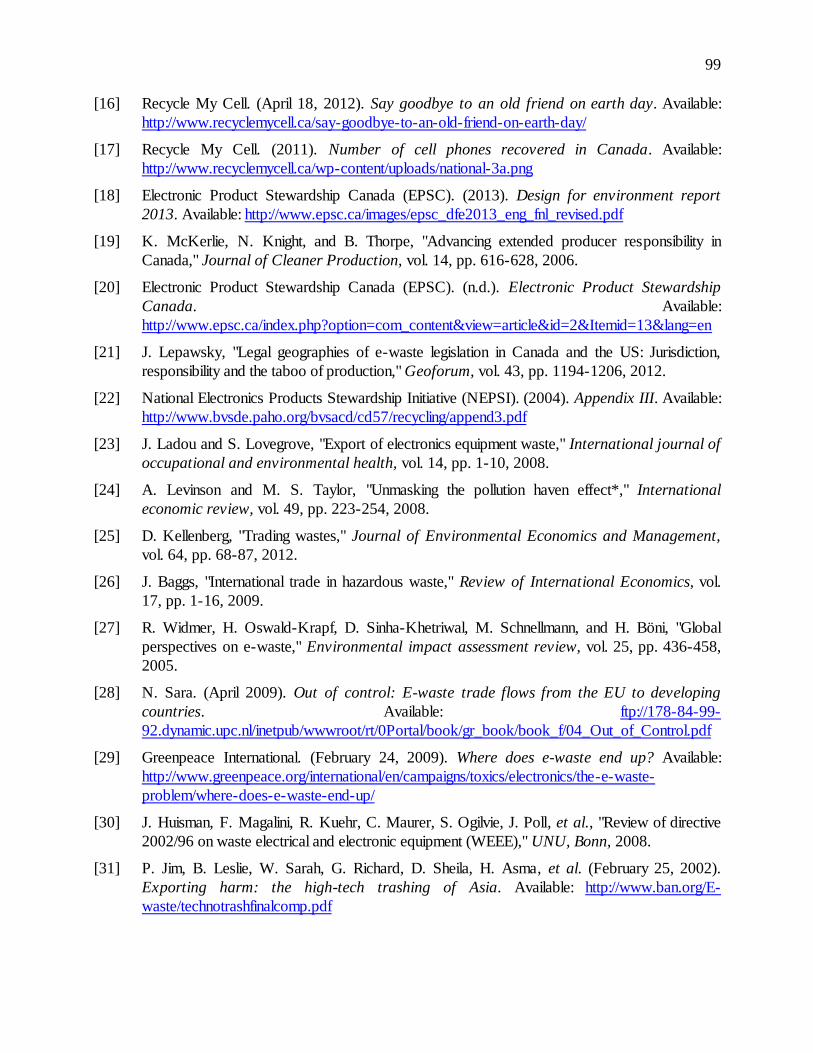
99
[16] Recycle My Cell. (April 18, 2012). Say goodbye to an old friend on earth day. Available:
http://www.recyclemycell.ca/say-goodbye-to-an-old-friend-on-earth-day/
[17] Recycle My Cell. (2011). Number of cell phones recovered in Canada. Available:
http://www.recyclemycell.ca/wp-content/uploads/national-3a.png
[18] Electronic Product Stewardship Canada (EPSC). (2013). Design for environment report
2013. Available: http://www.epsc.ca/images/epsc_dfe2013_eng_fnl_revised.pdf
[19] K. McKerlie, N. Knight, and B. Thorpe, "Advancing extended producer responsibility in
Canada," Journal of Cleaner Production, vol. 14, pp. 616-628, 2006.
[20] Electronic Product Stewardship Canada (EPSC). (n.d.). Electronic Product Stewardship
Canada. Available:
http://www.epsc.ca/index.php?option=com_content&view=article&id=2&Itemid=13&lang=en
[21] J. Lepawsky, "Legal geographies of e-waste legislation in Canada and the US: Jurisdiction,
responsibility and the taboo of production," Geoforum, vol. 43, pp. 1194-1206, 2012.
[22] National Electronics Products Stewardship Initiative (NEPSI). (2004). Appendix III. Available:
http://www.bvsde.paho.org/bvsacd/cd57/recycling/append3.pdf
[23] J. Ladou and S. Lovegrove, "Export of electronics equipment waste," International journal of
occupational and environmental health, vol. 14, pp. 1-10, 2008.
[24] A. Levinson and M. S. Taylor, "Unmasking the pollution haven effect*," International
economic review, vol. 49, pp. 223-254, 2008.
[25] D. Kellenberg, "Trading wastes," Journal of Environmental Economics and Management,
vol. 64, pp. 68-87, 2012.
[26] J. Baggs, "International trade in hazardous waste," Review of International Economics, vol.
17, pp. 1-16, 2009.
[27] R. Widmer, H. Oswald-Krapf, D. Sinha-Khetriwal, M. Schnellmann, and H. Böni, "Global
perspectives on e-waste," Environmental impact assessment review, vol. 25, pp. 436-458,
2005.
[28] N. Sara. (April 2009). Out of control: E-waste trade flows from the EU to developing
countries. Available: ftp://178-84-99-
92.dynamic.upc.nl/inetpub/wwwroot/rt/0Portal/book/gr_book/book_f/04_Out_of_Control.pdf
[29] Greenpeace International. (February 24, 2009). Where does e-waste end up? Available:
http://www.greenpeace.org/international/en/campaigns/toxics/electronics/the-e-waste-
problem/where-does-e-waste-end-up/
[30] J. Huisman, F. Magalini, R. Kuehr, C. Maurer, S. Ogilvie, J. Poll, et al., "Review of directive
2002/96 on waste electrical and electronic equipment (WEEE)," UNU, Bonn, 2008.
[31] P. Jim, B. Leslie, W. Sarah, G. Richard, D. Sheila, H. Asma, et al. (February 25, 2002).
Exporting harm: the high-tech trashing of Asia. Available: http://www.ban.org/E-
waste/technotrashfinalcomp.pdf
100
[32] R. Kahhat, J. Kim, M. Xu, B. Allenby, E. Williams, and P. Zhang, "Exploring e-waste
management systems in the United States," Resources, Conservation and Recycling, vol. 52,
pp. 955-964, 2008.
[33] J. Yu, E. Williams, M. Ju, and C. Shao, "Managing e-waste in China: Policies, pilot projects and
alternative approaches," Resources, Conservation and Recycling, vol. 54, pp. 991-999, 2010.
[34] Recycling Council of British Columbia (RCBC). (2014). E-waste: end-of-life electronic
equipment. Available: http://www.rcbc.ca/resources/additional-resources-links/e-waste
[35] S. Bernard, "Transboundary movement of waste: second-hand markets and illegal shipments,"
CIRANO2011.
[36] Canadian Auto Workers (CAW). and Workers Health & Safety Centre (WHSC). (2011).
Taking charge of electronic waste. Available: https://www.whsc.on.ca/Files/Resources/Earth-
Day-in-the-schools/Electronic-Waste-Resource-Booklet.aspx
[37] International Data Corporation (IDC). (November 8, 2010). Vendors vie for first mover
advantage in the Canadian media tablet market. Available:
http://www.idc.com/about/viewpressrelease.jsp?containerId=prCA22565110
[38] Consumer Electronics Association (CEA). (July 1, 2014). CE industry revenues to reach
record high of $208 Billion in 2014, according to CEA sales and forecast report . Available:
http://www.ce.org/News/News-Releases/Press-Releases/2013-Press-Releases/CE-Industry-
Revenues-to-Reach-Record-High-of-$208.aspx?feed=Market-Research-Press-Releases
[39] United Nations Environment Programme (UNEP). (2011). Basel convention on the control of
the transboundary movements of hazardous wastes and their disposal. Available:
http://www.basel.int/Portals/4/Basel%20Convention/docs/text/BaselConventionText-e.pdf
[40] D. Kellenberg and A. Levinson, "Waste of Effort? International Environmental Agreements,"
National Bureau of Economic Research2013.
[41] United Nations. (2014). Treaty collection. Available:
https://treaties.un.org/pages/ViewDetails.aspx?src=TREATY&mtdsg_no=XXVII-
3&chapter=27&lang=en#17
[42] United Nations Environmental Programme (UNEP). (2007). E-waste, volume i: Inventory
assessment manual. Available:
http://www.unep.or.jp/ietc/Publications/spc/EWasteManual_Vol1.pdf
[43] European Union. (2003). Directive 2002/96/EC of the European parliament and of the
council of 27 January 2003 on waste electrical and electronic equipment (WEEE) - joint
declaration of the European parliament, the council and the commission relating to article
9. Available: http://eur-lex.europa.eu/legal-content/EN/TXT/?uri=CELEX:32002L0096
[44] J. Lepawsky and C. Mcnabb, "Mapping international flows of electronic waste," The Canadian
Geographer/Le Geographe canadien, vol. 54, pp. 177-195, 2010.
[45] J. Lepawsky, "The changing geography of global trade in electronic discards: time to rethink the
e‐waste problem," The Geographical Journal, 2014.
101
[46] S. A. Khan, "Electronic waste governance: sustainable solutions to a global dilemma," Master's
thesis, Université de Montréal, Montréal, QC, 2010.
[47] United States Environmental Protection Agency (U.S. EPA). (July 11, 2013). Wastes -
Resource conservation - Common wastes & materials - eCycling. Available:
http://www.epa.gov/epawaste/conserve/materials/ecycling/rules.htm
[48] H. Schroeder. (January 2013). E-waste management in Canada. Available:
http://schroederschroederinc.files.wordpress.com/2013/02/e-waste-management-white-
paper.pdf
[49] Electronic Products Recycling Association (EPRA). (2013). Responsible recycling. Available:
http://www.eprassociation.ca/about-epra/responsible-recycling/#
[50] Electronic Products Recycling Association (EPRA). (2012). Annual report 2012. Available:
http://eprassociation.ca/ar/en/2012/EPRA2012%20-%20Annual%20Report.pdf
[51] A. L. Deathe, E. MacDonald, and W. Amos, "E‐waste Management Programmes and the
Promotion of Design for the Environment: Assessing Canada's Contributions," Review of
European Community & International Environmental Law, vol. 17, pp. 319-334, 2008.
[52] Waste Diversion Ontario (WDO). (2014). Waste electrical & electronic equipment program
Available: http://www.wdo.ca/programs/e-waste/
[53] Ontario Electronic Stewardship (OES). (July 10, 2009). Final revised (phase 1 and 2) Waste
Electrical and Electronic Equipment (WEEE) program plan Available:
http://www.ontarioelectronicstewardship.ca/wp-
content/uploads/2014/02/program_plan_jul10_2009.pdf
[54] Environment Canada. (2013). Electronic waste recycling program, region: Ontario.
Available: http://www.ec.gc.ca/gdd-mw/default.asp?lang=En&n=DB5C8F07-1
[55] Ontario Electronic Stewardship (OES). (2014). Accepted electronics & product clarification.
Available: http://www.ontarioelectronicstewardship.ca/accepted-electronics-and-product-
clarification/
[56] Ontario Electronic Stewardship (OES). (n.d.). Recycle your electronics. Available:
http://mattawa.ca/uploads/docs/departments/Public%20Works%20-
%20Misc/Electronics%20Waste%20Depot%20Flyer.pdf
[57] Ontario Electronic Stewardship (OES). (2012). 2012 Annual report, growing and building
reforms for a sustainable future. Available: http://www.ontarioelectronicstewardship.ca/wp-
content/themes/Avada-Child-Theme/annualreport/2012/files/inc/4d82ba63fa.pdf
[58] Ontario Electronic Stewardship (OES). (2013). 2013 Annual report, hard at work for you.
Available: http://www.ontarioelectronicstewardship.ca/wp-content/themes/Avada-Child-
Theme/annualreport/2013-final/files/inc/a3b00616cd.pdf
[59] Ontario Electronic Stewardship (OES). (n.d.). Ecycle pledge. Available:
http://www.recycleyourelectronics.ca/wp-content/uploads/2014/01/EcyclePledge.pdf
[60] D. Marie, B. Darijo, S. Elisabeth, L. Valérie, B. Martin, B. Nicolas, et al. (March 2012).
Regulation respecting the recovery and reclamation of products by enterprises (Q-2, r.
102
40.1). Available: http://www.recycfluo.ca/fr/files/doc-archives/Guide-to-the-Application-of-the-
Regulation.pdf
[61] Electronic Products Recycling Association (EPRA). (2013). Annual Report 2013. Available:
http://eprassociation.ca/ar/en/2013/EPRA2013%20-%20Annual%20Report.pdf
[62] Electronic Products Recycling Association (EPRA) Quebec. (2013). Recycle what? Available:
http://recyclemyelectronics.ca/qc/what-can-i-do/recycle-what/
[63] Electronic Products Recycling Association (EPRA). (August 1, 2013). EHF reporting &
remittance rules. Available:
http://www.eprassociation.ca/pdfs/EPRA%20EHF%20Reporting%20%20Remittance%20Rule
s_EN.pdf
[64] Electronic Products Recycling Association (EPRA) Quebec. (2013). What are EHFs?
Available: http://recyclemyelectronics.ca/qc/what-can-i-do/environmental-handling-fee/
[65] Multi-Material British Columbia (MMBC). (n.d.). BC recycling regulation. Available:
http://multimaterialbc.ca/faq/bc-recycling-regulation-2
[66] Blake Cassels & Graydon LLP. (December 2011). Summary of electronic waste regulations
in Canada. Available:
http://blakesfiles.com/Bulletins/legal_updates/environmental/jan_2012/E_waste_Regs_Canada.p
df
[67] Electronic Products Recycling Association (EPRA) British Columbia. (2013). Who is EPRA?
Available: http://www.recyclemyelectronics.ca/bc/who-is-epra/
[68] Electronic Stewardship Association of British Columbia (ESABC). (2011). 2011 Annual
report. Available: http://www.recyclemyelectronics.ca/bc/wp-
content/uploads/2013/07/ESABCAR2011-FINAL.pdf
[69] Environment Canada. (2013). Electronic waste recycling program, region: British
Columbia. Available: http://www.ec.gc.ca/gdd-mw/default.asp?lang=En&n=D65DC132-1
[70] Alberta Recycling Management Authority (ARMA). (n.d.). About us. Available:
http://www.albertarecycling.ca/about-us
[71] Alberta Recycling Management Authority (ARMA). (2013). The promise of responsible
environmental stewardship, 2012/13 annual report to the 2012-15 business plan. Available:
http://www.albertarecycling.ca/docs/annual-reports/2012-2013-alberta-recycling-annual-report-
--the-promise-of-responsible-environmental-stewardship.pdf?sfvrsn=0
[72] Alberta Recycling Management Authority (ARMA). (2014). 2014/15 - 2016/17 Business plan
Available: http://www.albertarecycling.ca/docs/business-plans/2014-2017-business-
plan.pdf?Status=Temp&sfvrsn=2
[73] Alberta Recycling Management Authority (ARMA). (2014). Quick fact sheets. Available:
http://www.albertarecycling.ca/about-recycling/quick-fact-sheets
[74] Government of Manitoba. (n.d.). Waste reduction and prevention. Available:
http://www.gov.mb.ca/conservation/pollutionprevention/waste/
103
[75] Electronic Products Recycling Association (EPRA) Manitoba. (May 2012) Manitoba
electronics stewardship - starts August 1, 2012 The Stewardship Gazette. Available:
http://recyclemyelectronics.ca/mb/wp-content/uploads/2012/05/Stew-Gazett_MAY2012.pdf
[76] Electronic Products Recycling Association (EPRA) Manitoba. (2013). Who is EPRA
Manitoba? Available: http://recyclemyelectronics.ca/mb/about-epra/who-is-epra-manitoba/
[77] Electronic Products Recycling Association (EPRA) Manitoba. (2013). What can I recycle?
Available: http://recyclemyelectronics.ca/mb/what-can-i-recycle/
[78] Government of Saskatchewan. (2010). The waste electronic equipment regulations.
Available: http://www.qp.gov.sk.ca/documents/english/regulations/regulations/E10-21R4.pdf
[79] Environment Canada. (2013). Electronic waste recycling program, region: Saskatchewan
Available: http://ec.gc.ca/gdd-mw/default.asp?lang=En&n=2F16758B-8380-4192-BDC4
[80] Saskatchewan Waste Reduction Council. (November 2012). Saskatchewan's waste
electronic equipment program. Available:
http://www.saskwastereduction.ca/recycle/resources/e-waste/sweep
[81] Electronic Products Recycling Association (EPRA) and the SWEEP Board of Directors and
Members. (January 2013). Product management program for Saskatchewan waste
electronic equipment program. Available: http://www.recyclemyelectronics.ca/sk/wp-
content/uploads/2013/05/SKPMP.pdf
[82] SWEEP. Annual report 2012-13. Available: http://www.recyclemyelectronics.ca/sk/wp-
content/uploads/2013/08/SWEEP_AnnualReport2012_WEB.pdf
[83] Electronic Products Recycling Association (EPRA) Saskatchewan. (2013). Recycle what?
Available: http://www.recyclemyelectronics.ca/sk/what-can-i-do/recycle-what/
[84] Government of Nova Scotia. (2014). Nova Scotia's new electronic waste regulations.
Available: http://www.novascotia.ca/nse/waste/ewaste.asp
[85] Nova Scotia Environment and Labour. (July 25, 2007). Policy on review of electronic waste
stewardship plans. Available: http://www.novascotia.ca/nse/dept/docs.policy/Policy-
Review.of.Electronic.Waste.Stewardship.Plans.pdf
[86] Province of Nova Scotia. (February 22, 2007). Solid waste-resource management
regulations made under Section 102 of the Environment Act, S.N.S. 1994-95, c. 1, O.I.C.
96-79 (February 6, 1996), N.S. Reg. 25/96, as amended up to O.I.C. 2007-102 (February
22, 2007), N.S. Reg. 61/2007. Available:
http://www.novascotia.ca/just/regulations/regs/envsolid.htm
[87] Environment Canada. (2013). Electronic waste recycling program, region: Nova Scotia
Available: http://ec.gc.ca/gdd-mw/default.asp?lang=En&n=1531A374-420D-45FA-84E9
[88] Electronic Products Recycling Association (EPRA) Nova Scotia. (2013). Recycle what?
Available: http://www.recyclemyelectronics.ca/ns/what-can-i-do/recycle-what/
[89] House of Assembly of Newfoundland and Labrador. (October 31, 2012). Newfoundland and
Labrador Regulation 85/12, waste management regulations, 2003 (Amendment), under
104
the Environmental Protection Act (O.C. 2012-288). Available:
http://www.assembly.nl.ca/legislation/sr/annualregs/2012/nr120085.htm
[90] Electronic Products Recycling Association (EPRA). (February 4, 2013). Product stewardship
plan, in response to Newfoundland and Labrador regulation 85/12, filed October 31,
2012, waste management regulations 2003, Environmental Protection Act (O.C. 2012-
288). Available: http://www.recyclemyelectronics.ca/nl/wp-
content/uploads/2013/06/EPRA_Stewardship_Plan_NL_2013.pdf
[91] Electronic Products Recycling Association (EPRA) Newfoundland and Labrador. (2013).
Drop-off centres. Available: http://www.recyclemyelectronics.ca/nl/what-can-i-do/drop-off-
centres/
[92] Electronic Products Recycling Association (EPRA) Newfoundland and Labrador. (2013).
Which items are accepted? Available: http://www.recyclemyelectronics.ca/nl/what-can-i-
do/recycle-what/
[93] Atlantic Canada Electronics Stewardship (ACES). (February 2012). Proposal for an end-of-
life electronics stewardship program for Prince Edward Island. Available:
http://www.recyclemyelectronics.ca/pei/wp-content/uploads/2013/07/pei_programplan.pdf
[94] Environment Canada. (2013). Electronic waste recycling program, region: Prince Edward
Island. Available: http://ec.gc.ca/gdd-mw/default.asp?lang=En&n=A56D5488-A7A6-4212-
B601
[95] Electronic Products Recycling Association (EPRA) Prince Edward Island. (2013). Drop-off
centres. Available: http://www.recyclemyelectronics.ca/pei/what-can-i-do/drop-off-centres/
[96] Electronic Products Recycling Association (EPRA) Prince Edward Island. (2013). Recycle
what? Available: http://www.recyclemyelectronics.ca/pei/what-can-i-do/recycle-what/
[97] Recycle New Brunswick (NB). (2014). About us. Available:
http://www.recyclenb.com/en/about_us/
[98] Environment Canada. (May 2014). Promoting sustainable materials management through
extended producer responsibility: Canadian Waste Electrical and Electronic Equipment
(WEEE) case study. Available:
http://www.oecd.org/environment/waste/Canadian%20WEEE%20EPR%20Case%20Study%2
0-%2012June2014.FINAL.pdf
[99] C. Elizabeth and W. Kyle. (February 29, 2012). See inside a Canadian e-waste recycling
facility. Available: http://www.treehugger.com/gadgets/see-inside-canadian-e-waste-recycling-
facility.html
[100] A. Atasu, L. N. Van Wassenhove, and M. Sarvary, "Efficient Take‐Back Legislation,"
Production and Operations Management, vol. 18, pp. 243-258, 2009.
[101] United States Environmental Protection Agency (U.S. EPA). (2013). History of RCRA.
Available: http://www.epa.gov/epawaste/laws-regs/rcrahistory.htm
[102] European Union., "Directive 2002/95/EC of the European Parliament and of the Council of 27
January 2003 on the restriction of the use of certain hazardous substances in electrical and
electronic equipment," Official Journal of the European Union, February 13, 2003.
105
[103] Environment Canada. (2010). Schedule 1 substances inherited from CEPA 1988. Available:
http://www.ec.gc.ca/lcpe-cepa/default.asp?lang=En&n=0DA2924D-1&wsdoc=57270C65-
EFD8-CC05-AEF7-B94DB47D6F92
[104] Eurostat. (March 2013). Waste Electrical and Electronic Equipment (WEEE). Available:
http://ec.europa.eu/eurostat/web/waste/key-waste-streams/weee
[105] Eurostat. (2013). Minimum rates for separate collection of WEEE. Available:
http://ec.europa.eu/eurostat/documents/342366/351758/WEEE-Table-1rev.pdf
[106] Environment Canada. (2013). Battery recycling program. Available: http://www.ec.gc.ca/gdd-
mw/default.asp?lang=En&n=4F700CB1-1
[107] CM Consulting Inc. (May 2012). Managing Canada's waste batteries. Available:
http://www.cmconsultinginc.com/wp-content/uploads/2012/05/Battery_high_res.pdf
[108] Commission for Environmental Cooperation (CEC). (April 2013). Hazardous trade? An
examination of US-generated spent lead-acid battery exports and secondary lead
recycling in Canada, Mexico, and the United States. Available:
http://www3.cec.org/islandora/en/item/11220-hazardous-trade-examination-us-generated-
spent-lead-acid-battery-exports-and-en.pdf
[109] Environment Canada. (2013). Battery recycling in Canada 2009 update - executive
summary. Available: http://www.ec.gc.ca/gdd-mw/default.asp?lang=En&n=52DF915F-
1&offset=4&toc=show
[110] E. Daniel C., K. Christine, S. Tanja, L. Marc A., d. S. Alex, and M. Valentina. (June 16,
2008). 2008 Environmental performance index. Available:
http://www.yale.edu/epi/files/2008EPI_Text.pdf
[111] E. Jay, E. Daniel C., K. Christine, S. Tanja, L. Marc A., M. Valentina, et al. (2010). 2010
Environmental performance index. Available:
http://www.ciesin.org/documents/EPI_2010_report.pdf
[112] E. John W., E. Daniel C., H. Angel, L. Marc A., d. S. Alex, M. Valentina, et al. (2012). 2012
EPI Environmental Performance Index and pilot trend environmental performance index.
Available: http://epi.yale.edu/files/2012_epi_report.pdf
[113] The Conference Board of Canada. (2014). Municipal waste generation. Available:
http://www.conferenceboard.ca/hcp/details/environment/municipal-waste-generation.aspx
[114] G. Laurie. (2014). State of waste management in Canada. Available:
http://www.ccme.ca/files/Resources/waste/State_Waste_Mgmt_in_Canada.pdf
[115] Minitab Inc. (2003-2005). Statistics. Available:
http://cms3.minitab.co.kr/board/minitab_data/5.%20StatisticsAllTopics.pdf
[116] T. R. Miller, J. Gregory, H. Duan, R. Kirchain, and J. Linnell, Characterizing transboundary
flows of used electronics: Summary report: Massachusetts Institute of Technology, Material
Systems Laboratory, 2012.
[117] S. Ruth, "Green it more than a three percent solution?," Internet Computing, IEEE, vol. 13,
pp. 74-78, 2009.
106
[118] Green Electronics Council. (2011). Environmental benefits of 2010 EPEAT purchasing.
Available: http://www.epeat.net/documents/EBReport2010_ExecSumm_final.pdf
[119] B. Bob and W. Clint. (2011). Materials footprint reduction televisions and computer
monitors: 2004-2010. Available: http://apps.ce.org/documents/PikeCEAFinal.pdf
[120] Electronic Product Stewardship Canada (EPSC). (2012). Design for environment report
2012. Available: http://www.epsc.ca/images/Katelyn%20Images/EPSC_DesignEnviro-
REPORT2012-SinglePG.pdf
[121] Accenture. (2010). Cloud computing and sustainability: the environmental benefits of
moving to the cloud. Available:
http://www.accenture.com/SiteCollectionDocuments/PDF/Accenture_Sustainability_Cloud_Co
mputing_TheEnvironmentalBenefitsofMovingtotheCloud.pdf
[122] J. John. (June 2013). Worldwide and U.S. mobile applications download and revenue
2013–2017 forecast: the app as the emerging face of the internet. Available:
http://www.idc.com/getdoc.jsp?containerId=241295
[123] M. Framingham. (December 13, 2010). IDC forecasts worldwide mobile applications
revenues to experience more than 60% compound annual growth through 2014. Available:
http://www.idc.com/about/viewpressrelease.jsp?containerId=prUS22617910
[124] S. Mathias, H. Christian, K. Ruediger, M. Federico, M. Claudia, M. Christina, et al. (July
2009). Recycling - from e-waste to resources. Available:
http://www.unep.org/pdf/Recycling_From_e-waste_to_resources.pdf
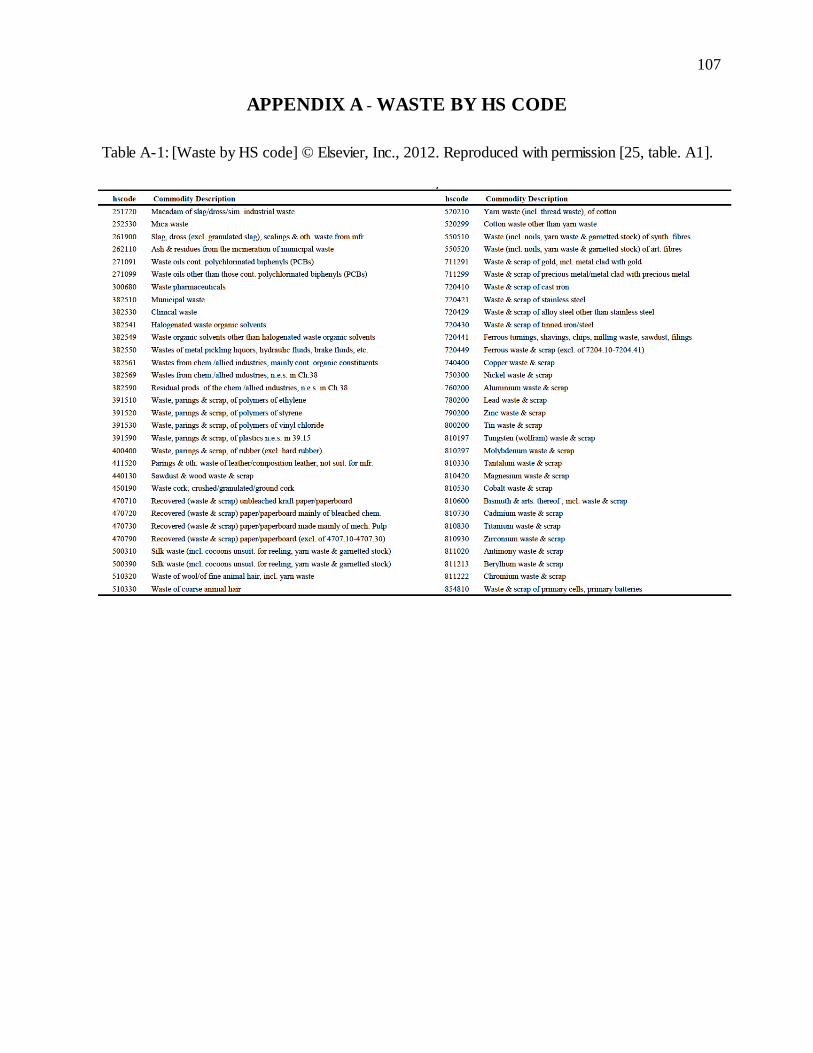
107
APPENDIX A - WASTE BY HS CODE
Table A-1: [Waste by HS code] © Elsevier, Inc., 2012. Reproduced with permission [25, table. A1].
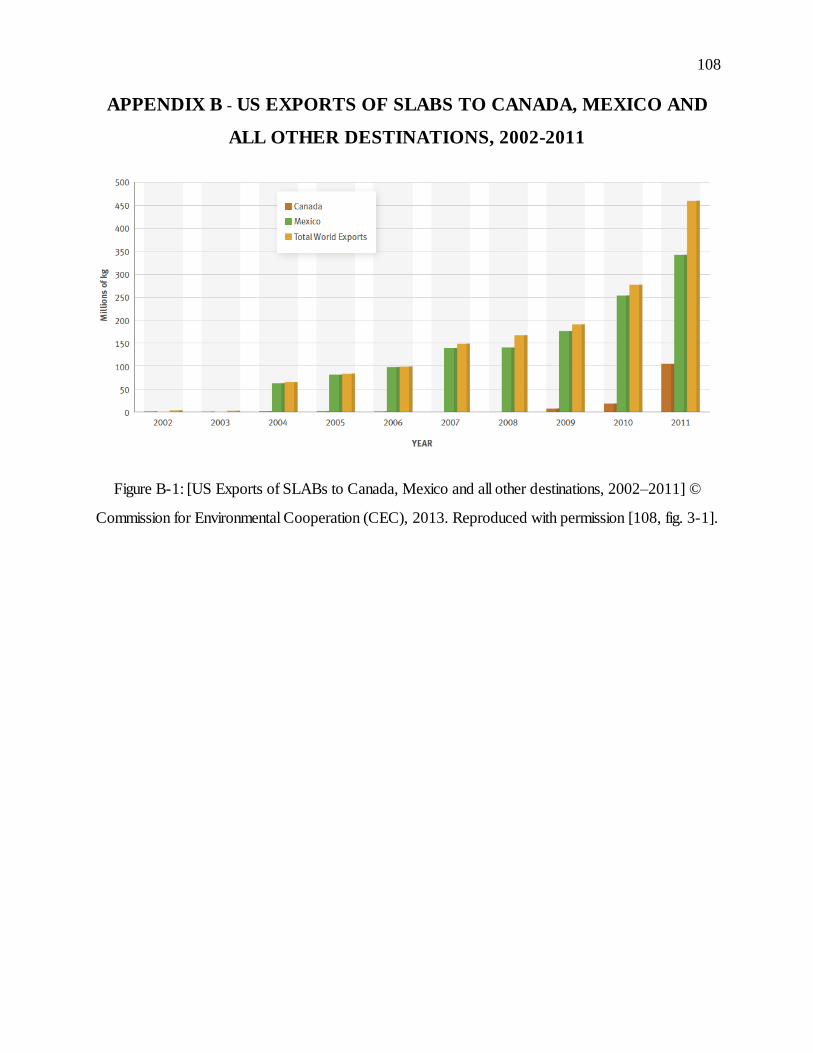
108
APPENDIX B - US EXPORTS OF SLABS TO CANADA, MEXICO AND
ALL OTHER DESTINATIONS, 2002-2011
Figure B-1: [US Exports of SLABs to Canada, Mexico and all other destinations, 2002–2011] ©
Commission for Environmental Cooperation (CEC), 2013. Reproduced with permission [108, fig. 3-1].
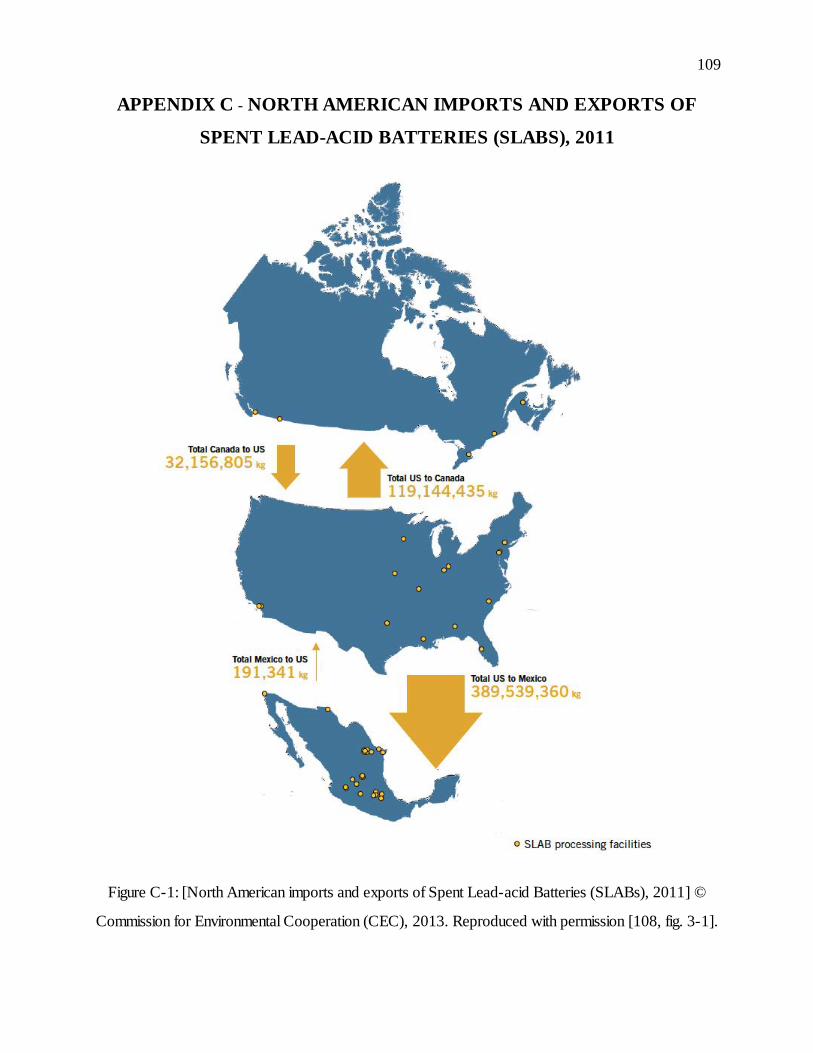
109
APPENDIX C - NORTH AMERICAN IMPORTS AND EXPORTS OF
SPENT LEAD-ACID BATTERIES (SLABS), 2011
Figure C-1: [North American imports and exports of Spent Lead-acid Batteries (SLABs), 2011] ©
Commission for Environmental Cooperation (CEC), 2013. Reproduced with permission [108, fig. 3-1].
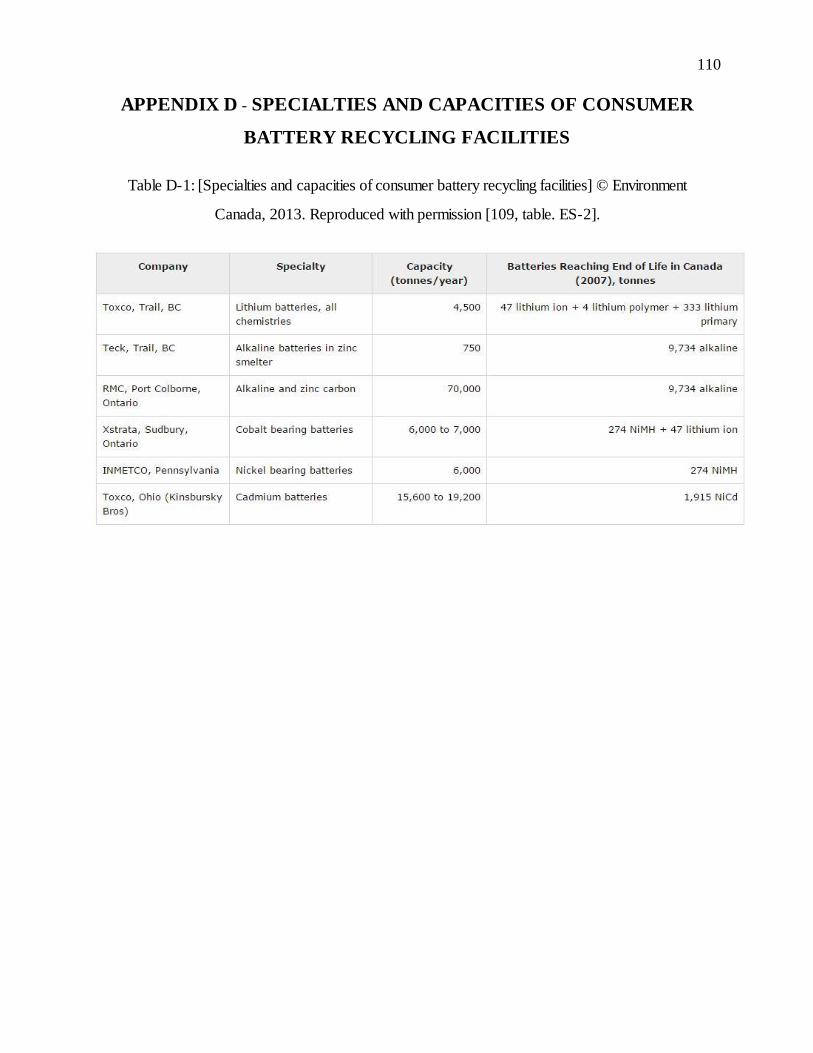
110
APPENDIX D - SPECIALTIES AND CAPACITIES OF CONSUMER
BATTERY RECYCLING FACILITIES
Table D-1: [Specialties and capacities of consumer battery recycling facilities] © Environment
Canada, 2013. Reproduced with permission [109, table. ES-2].
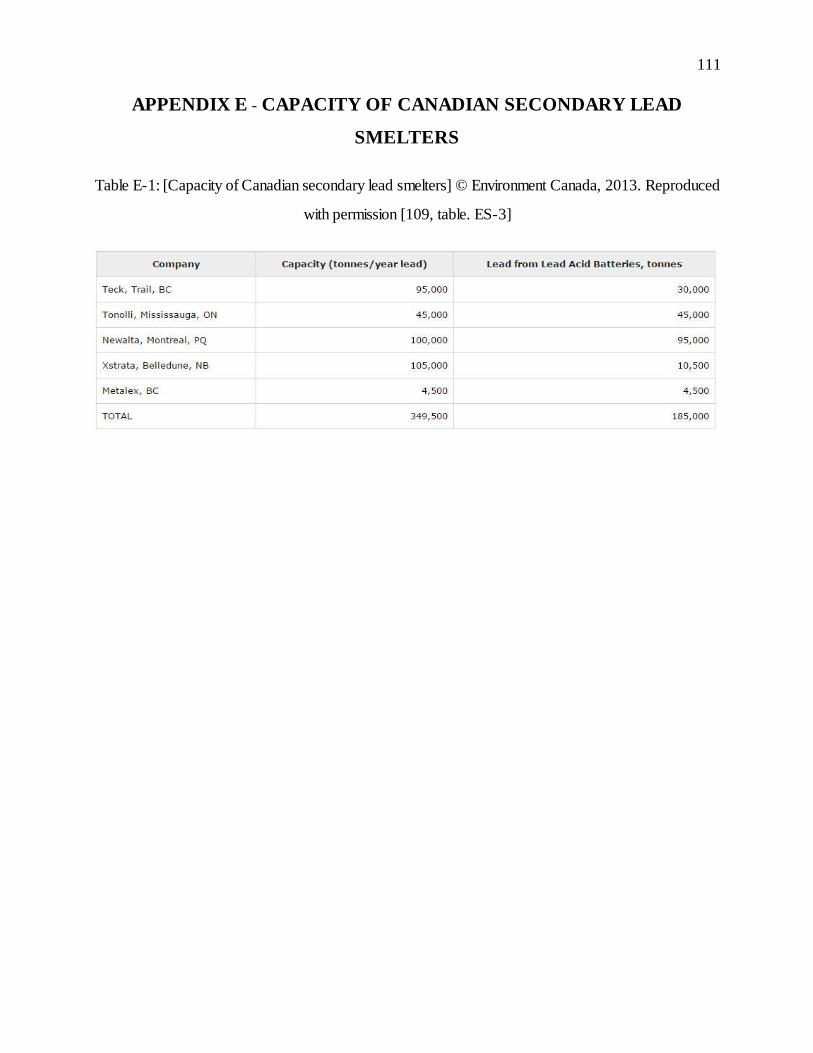
111
APPENDIX E - CAPACITY OF CANADIAN SECONDARY LEAD
SMELTERS
Table E-1: [Capacity of Canadian secondary lead smelters] © Environment Canada, 2013. Reproduced
with permission [109, table. ES-3]
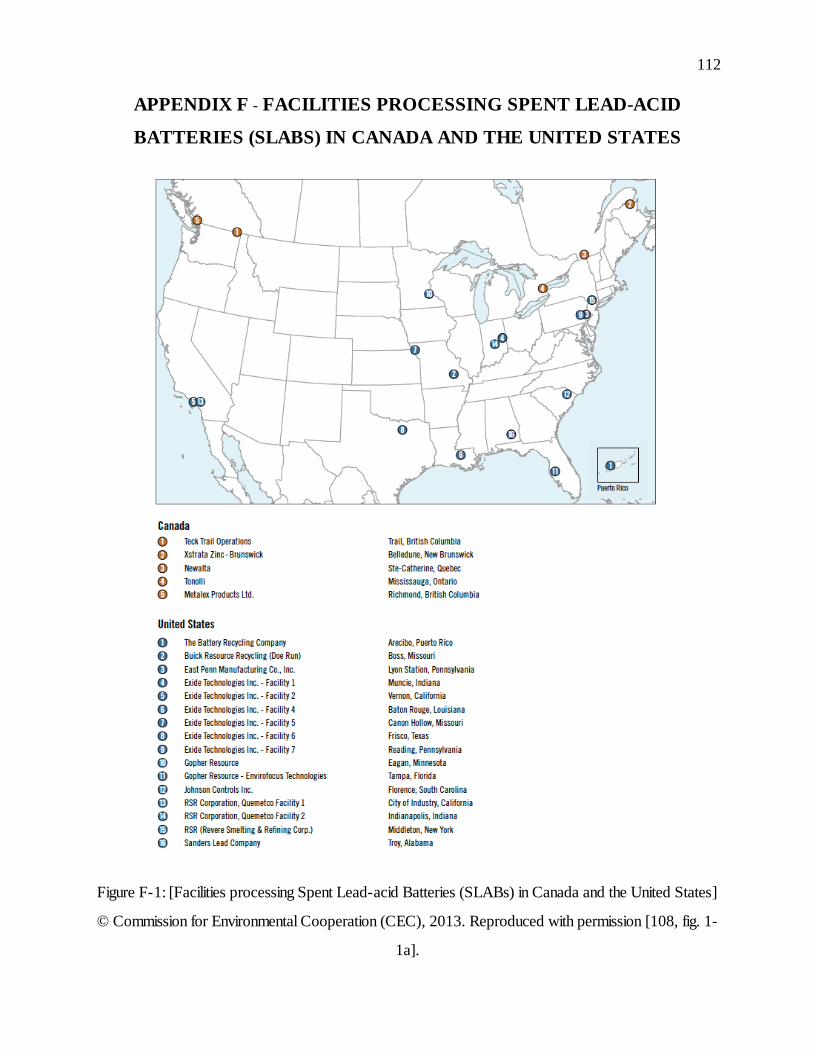
112
APPENDIX F - FACILITIES PROCESSING SPENT LEAD-ACID
BATTERIES (SLABS) IN CANADA AND THE UNITED STATES
Figure F-1: [Facilities processing Spent Lead-acid Batteries (SLABs) in Canada and the United States]
© Commission for Environmental Cooperation (CEC), 2013. Reproduced with permission [108, fig. 1-
1a].
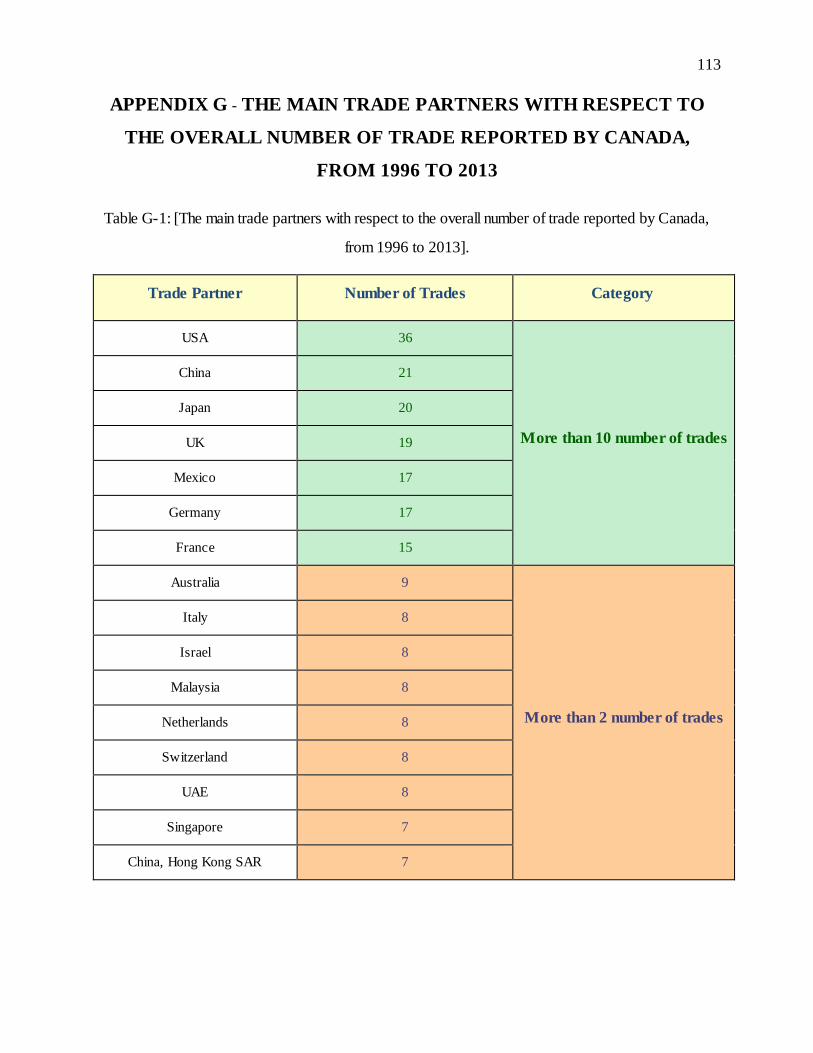
113
APPENDIX G - THE MAIN TRADE PARTNERS WITH RESPECT TO
THE OVERALL NUMBER OF TRADE REPORTED BY CANADA,
FROM 1996 TO 2013
Table G-1: [The main trade partners with respect to the overall number of trade reported by Canada,
from 1996 to 2013].
Trade Partner Number of Trades Category
USA 36
More than 10 number of trades
China 21
Japan 20
UK 19
Mexico 17
Germany 17
France 15
Australia 9
More than 2 number of trades
Italy 8
Israel 8
Malaysia 8
Netherlands 8
Switzerland 8
UAE 8
Singapore 7
China, Hong Kong SAR 7
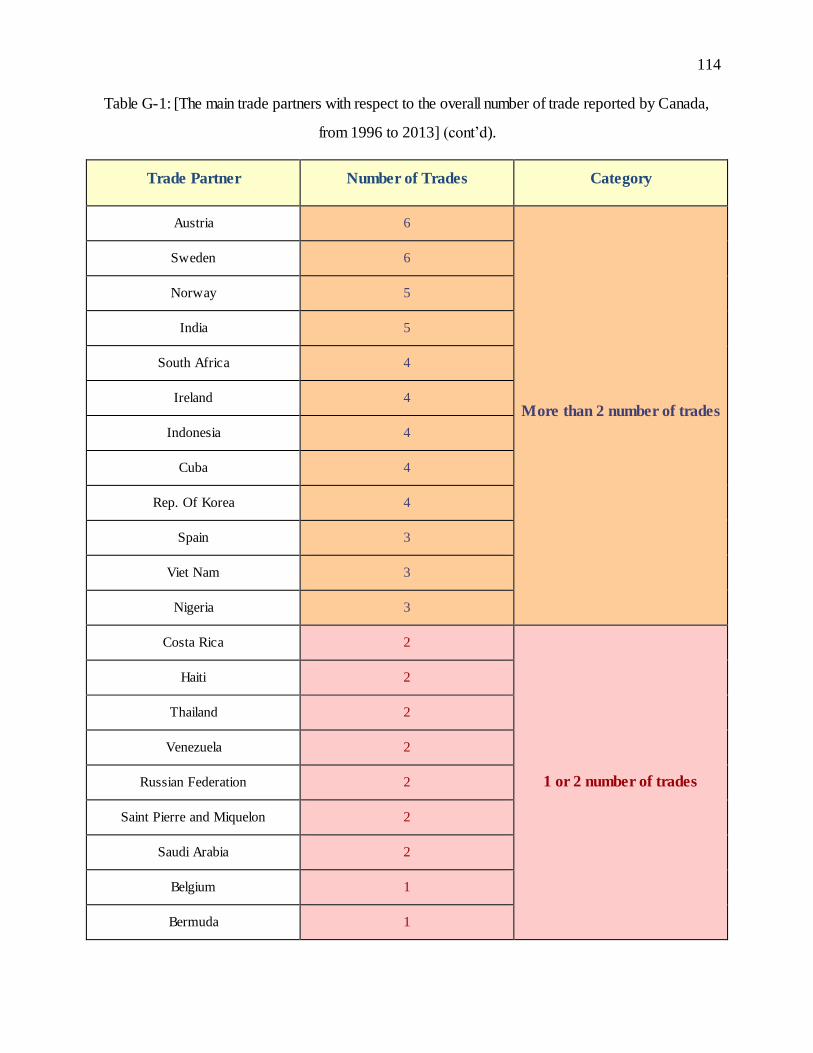
114
Table G-1: [The main trade partners with respect to the overall number of trade reported by Canada,
from 1996 to 2013] (cont’d).
Trade Partner Number of Trades Category
Austria 6
More than 2 number of trades
Sweden 6
Norway 5
India 5
South Africa 4
Ireland 4
Indonesia 4
Cuba 4
Rep. Of Korea 4
Spain 3
Viet Nam 3
Nigeria 3
Costa Rica 2
1 or 2 number of trades
Haiti 2
Thailand 2
Venezuela 2
Russian Federation 2
Saint Pierre and Miquelon 2
Saudi Arabia 2
Belgium 1
Bermuda 1
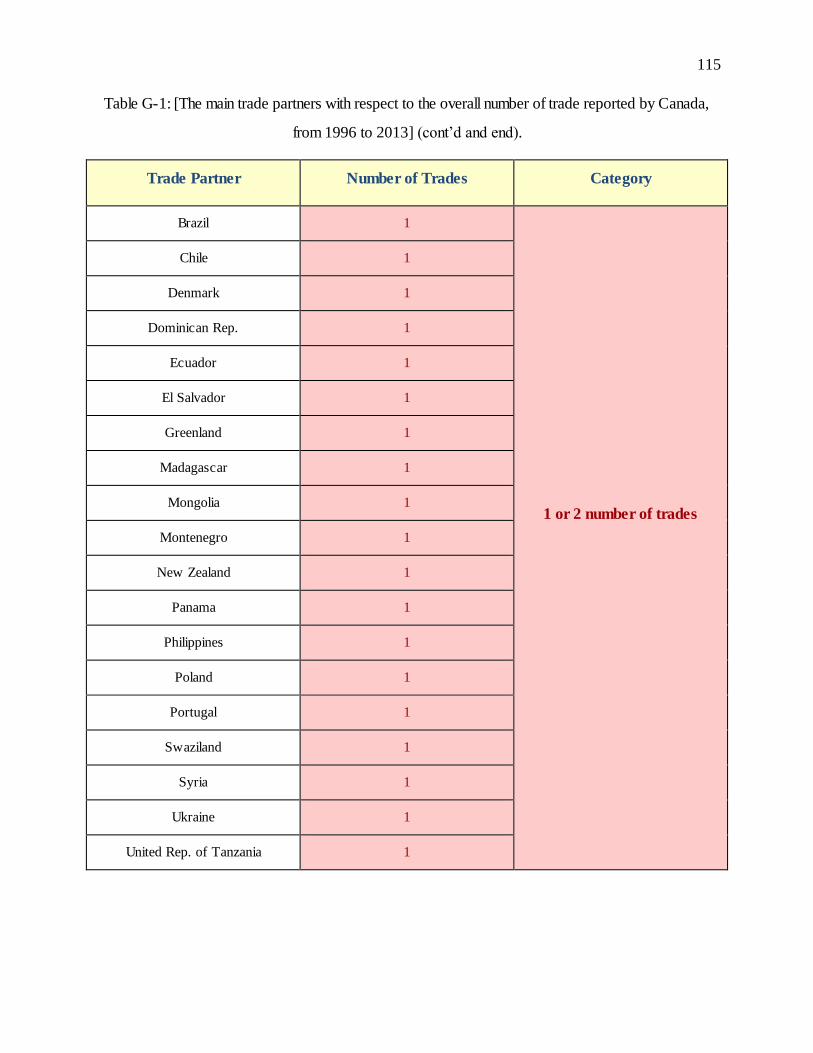
115
Table G-1: [The main trade partners with respect to the overall number of trade reported by Canada,
from 1996 to 2013] (cont’d and end).
Trade Partner Number of Trades Category
Brazil 1
1 or 2 number of trades
Chile 1
Denmark 1
Dominican Rep. 1
Ecuador 1
El Salvador 1
Greenland 1
Madagascar 1
Mongolia 1
Montenegro 1
New Zealand 1
Panama 1
Philippines 1
Poland 1
Portugal 1
Swaziland 1
Syria 1
Ukraine 1
United Rep. of Tanzania 1
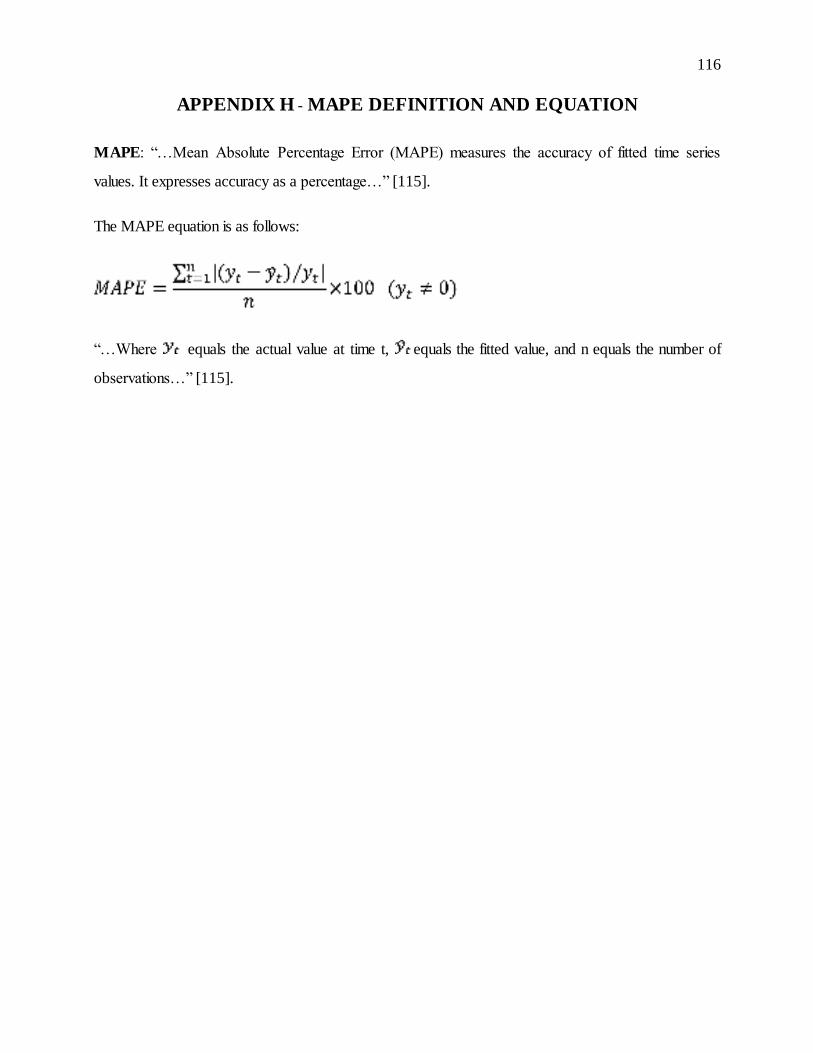
116
APPENDIX H - MAPE DEFINITION AND EQUATION
MAPE: “…Mean Absolute Percentage Error (MAPE) measures the accuracy of fitted time series
values. It expresses accuracy as a percentage…” [115].
The MAPE equation is as follows:
“…Where equals the actual value at time t, equals the fitted value, and n equals the number of
observations…” [115].
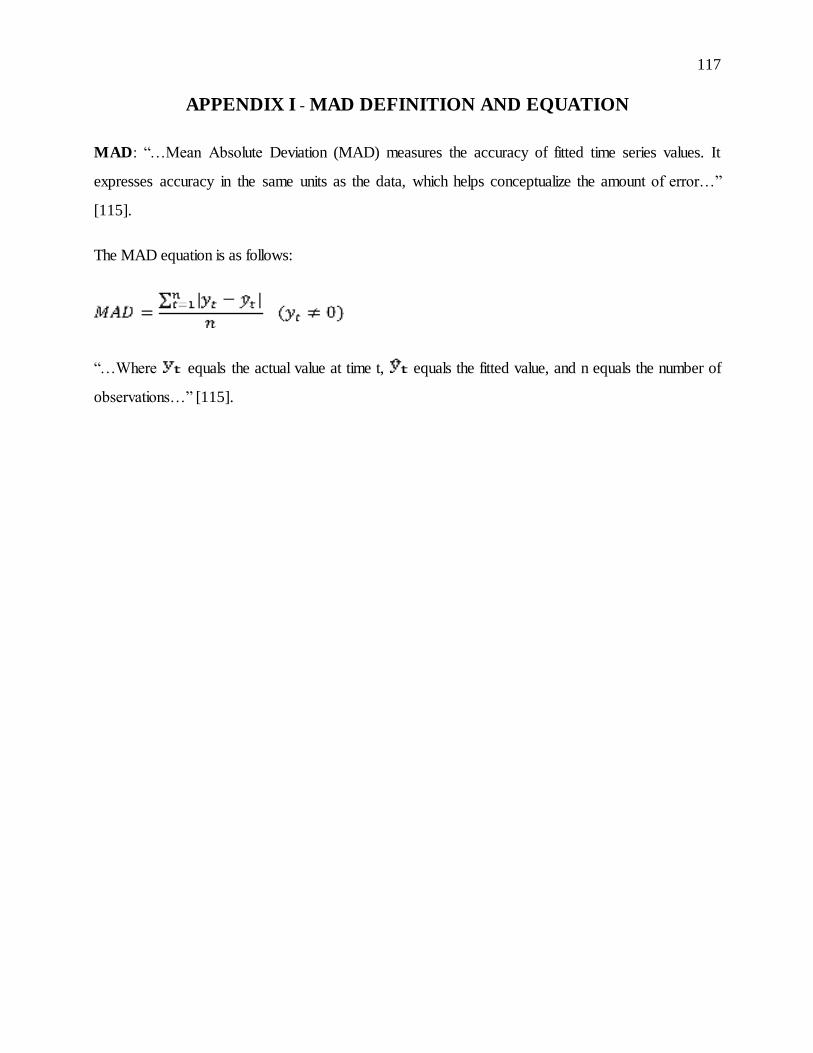
117
APPENDIX I - MAD DEFINITION AND EQUATION
MAD: “…Mean Absolute Deviation (MAD) measures the accuracy of fitted time series values. It
expresses accuracy in the same units as the data, which helps conceptualize the amount of error…”
[115].
The MAD equation is as follows:
“…Where equals the actual value at time t, equals the fitted value, and n equals the number of
observations…” [115].
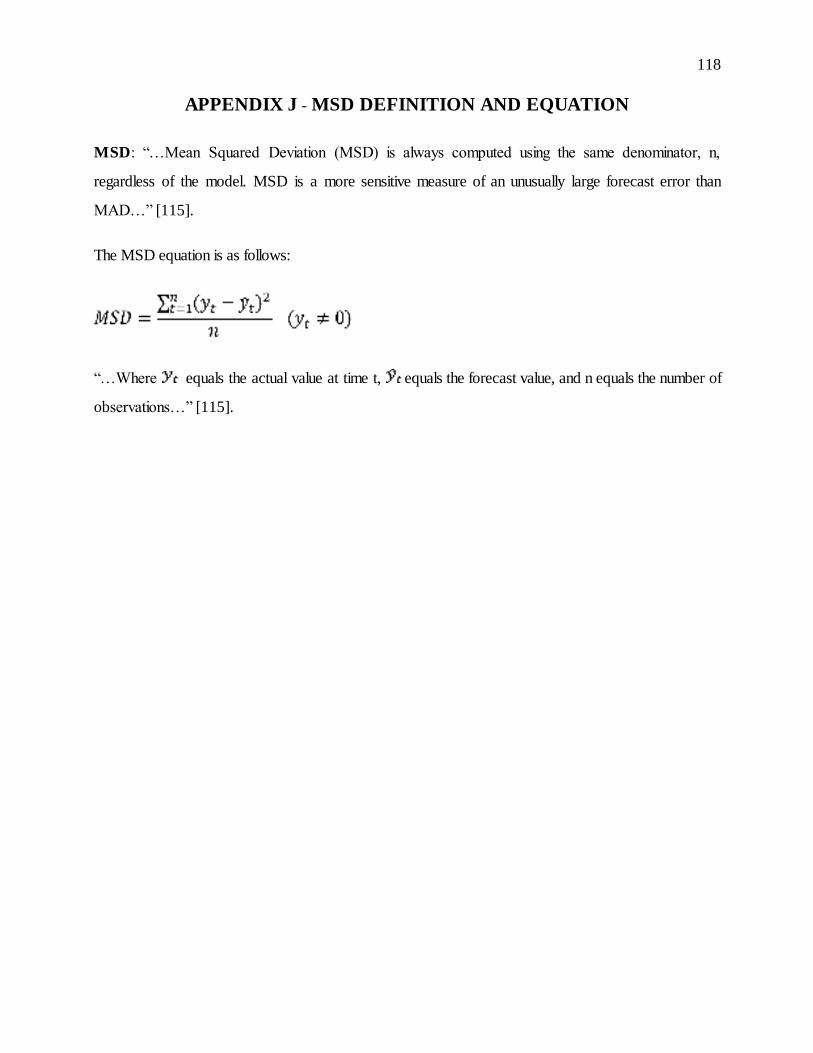
118
APPENDIX J - MSD DEFINITION AND EQUATION
MSD: “…Mean Squared Deviation (MSD) is always computed using the same denominator, n,
regardless of the model. MSD is a more sensitive measure of an unusually large forecast error than
MAD…” [115].
The MSD equation is as follows:
“…Where equals the actual value at time t, equals the forecast value, and n equals the number of
observations…” [115].


