
Bioinformatique 1 : Méthodes Bioinformatiques
pour génomique et la protéomique 1
Aix-Marseille Université - ENSBBAU3
Jacques van Helden
[email protected] Aix-Marseille Université (AMU), France
Lab. Technological Advances for Genomics and Clinics (TAGC, INSERM Unit U1090)
http://tagc.univ-mrs.fr/
FORMER ADDRESS (1999-2011) Université Libre de Bruxelles, Belgique
Bioinformatique des Génomes et des Réseaux (BiGRe lab) http://www.bigre.ulb.ac.be/
B!GRe Bioinformatique des
Génomes et Réseaux
Plan du cours
Rappel des concepts de base Matrices de substitutions BLAST
• Principe algorithmique • Statistique • Versions: BLAST (1990); gapped BLAST (1997) and PSI-BLAST (1997). • Statistiques: comment interpréter une E-valeur ?
Motifs Motifs d’ADN (construction, représentations, …) Motifs protéiques Découverte de motifs Recherche de motifs Modèles de séquences (« backgound ») PSI-BLAST
Cas d’étude: la glycosyl amylase
2

Matrices de substitution
UE AMU ENSBBAU3
A C G TA 2C -2 2G -2 -2 2T -1 -2 -2 2
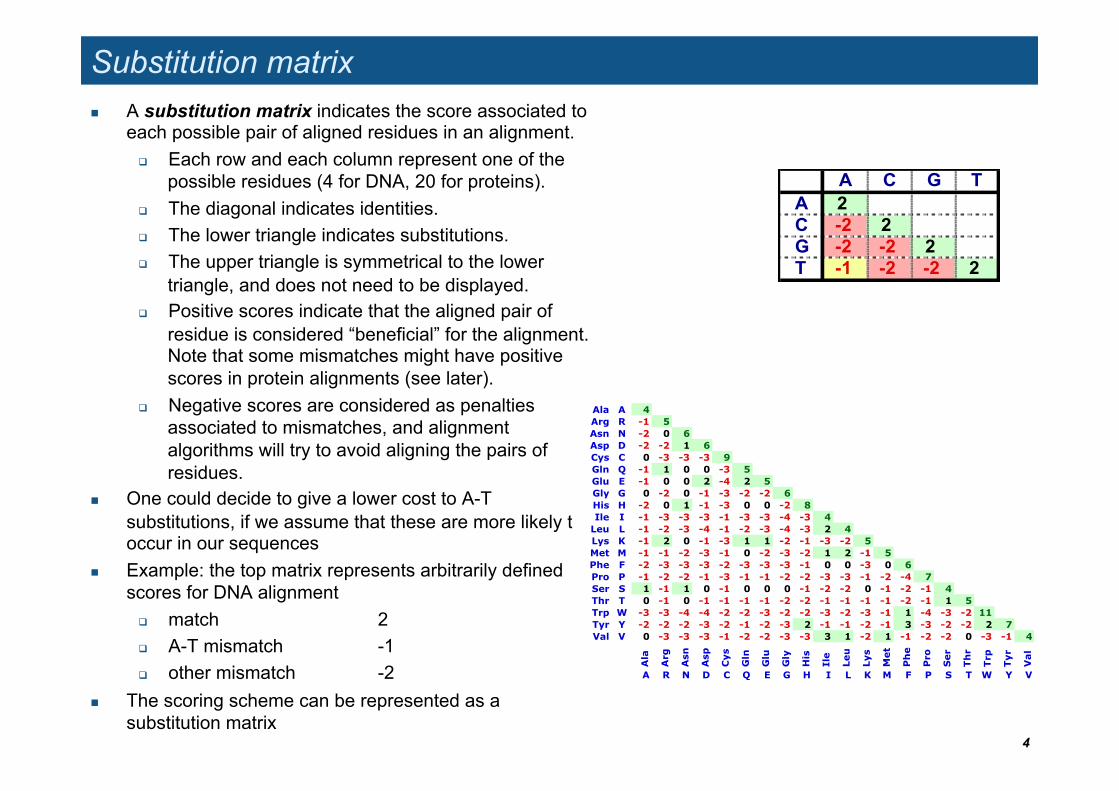
Substitution matrix A substitution matrix indicates the score associated to
each possible pair of aligned residues in an alignment. Each row and each column represent one of the
possible residues (4 for DNA, 20 for proteins). The diagonal indicates identities. The lower triangle indicates substitutions. The upper triangle is symmetrical to the lower
triangle, and does not need to be displayed. Positive scores indicate that the aligned pair of
residue is considered “beneficial” for the alignment. Note that some mismatches might have positive scores in protein alignments (see later).
Negative scores are considered as penalties associated to mismatches, and alignment algorithms will try to avoid aligning the pairs of residues.
One could decide to give a lower cost to A-T substitutions, if we assume that these are more likely to occur in our sequences
Example: the top matrix represents arbitrarily defined scores for DNA alignment
match 2 A-T mismatch -1 other mismatch -2
The scoring scheme can be represented as a substitution matrix
Ala A 4Arg R -1 5Asn N -2 0 6Asp D -2 -2 1 6Cys C 0 -3 -3 -3 9Gln Q -1 1 0 0 -3 5Glu E -1 0 0 2 -4 2 5Gly G 0 -2 0 -1 -3 -2 -2 6His H -2 0 1 -1 -3 0 0 -2 8Ile I -1 -3 -3 -3 -1 -3 -3 -4 -3 4Leu L -1 -2 -3 -4 -1 -2 -3 -4 -3 2 4Lys K -1 2 0 -1 -3 1 1 -2 -1 -3 -2 5Met M -1 -1 -2 -3 -1 0 -2 -3 -2 1 2 -1 5Phe F -2 -3 -3 -3 -2 -3 -3 -3 -1 0 0 -3 0 6Pro P -1 -2 -2 -1 -3 -1 -1 -2 -2 -3 -3 -1 -2 -4 7Ser S 1 -1 1 0 -1 0 0 0 -1 -2 -2 0 -1 -2 -1 4Thr T 0 -1 0 -1 -1 -1 -1 -2 -2 -1 -1 -1 -1 -2 -1 1 5Trp W -3 -3 -4 -4 -2 -2 -3 -2 -2 -3 -2 -3 -1 1 -4 -3 -2 11Tyr Y -2 -2 -2 -3 -2 -1 -2 -3 2 -1 -1 -2 -1 3 -3 -2 -2 2 7Val V 0 -3 -3 -3 -1 -2 -2 -3 -3 3 1 -2 1 -1 -2 -2 0 -3 -1 4
Ala
Arg
Asn
Asp
Cys
Gln
Glu
Gly
His
Ile
Leu
Lys
Met
Phe
Pro
Ser
Thr
Trp
Tyr
Val
A R N D C Q E G H I L K M F P S T W Y V
4
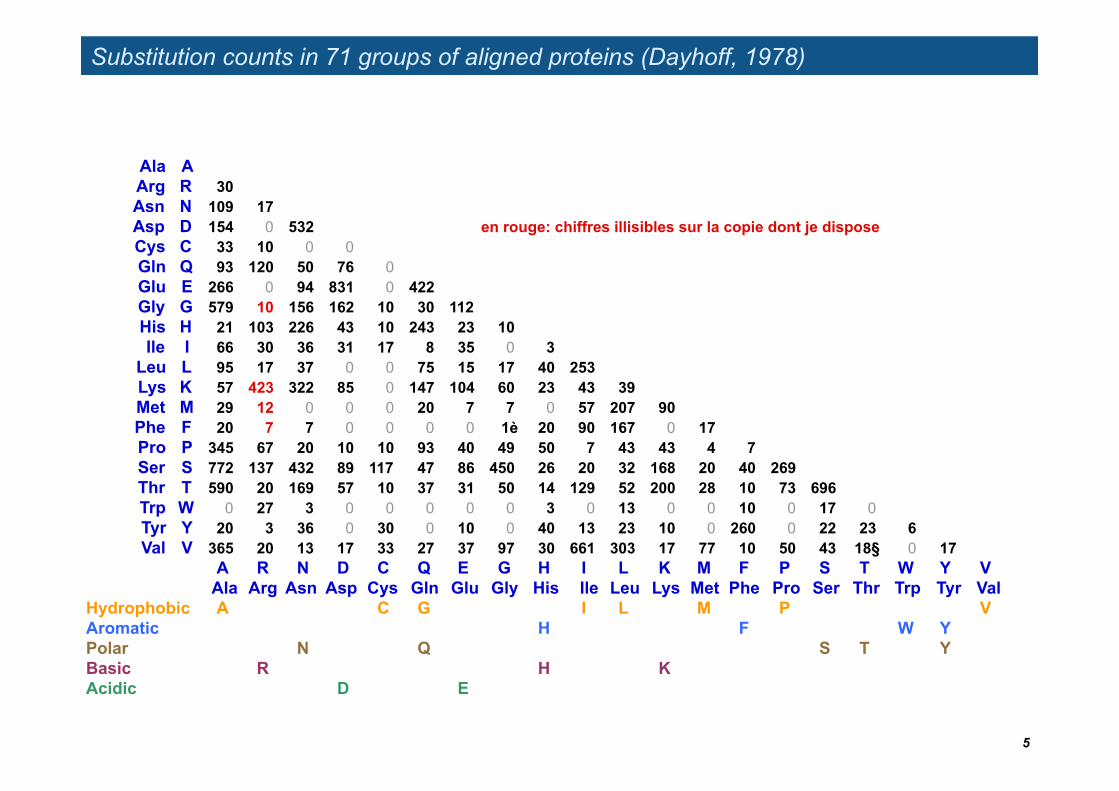
Substitution counts in 71 groups of aligned proteins (Dayhoff, 1978)
Ala AArg R 30Asn N 109 17Asp D 154 0 532 en rouge: chiffres illisibles sur la copie dont je disposeCys C 33 10 0 0Gln Q 93 120 50 76 0Glu E 266 0 94 831 0 422Gly G 579 10 156 162 10 30 112His H 21 103 226 43 10 243 23 10Ile I 66 30 36 31 17 8 35 0 3
Leu L 95 17 37 0 0 75 15 17 40 253Lys K 57 423 322 85 0 147 104 60 23 43 39Met M 29 12 0 0 0 20 7 7 0 57 207 90Phe F 20 7 7 0 0 0 0 1è 20 90 167 0 17Pro P 345 67 20 10 10 93 40 49 50 7 43 43 4 7Ser S 772 137 432 89 117 47 86 450 26 20 32 168 20 40 269Thr T 590 20 169 57 10 37 31 50 14 129 52 200 28 10 73 696Trp W 0 27 3 0 0 0 0 0 3 0 13 0 0 10 0 17 0Tyr Y 20 3 36 0 30 0 10 0 40 13 23 10 0 260 0 22 23 6Val V 365 20 13 17 33 27 37 97 30 661 303 17 77 10 50 43 18§ 0 17
A R N D C Q E G H I L K M F P S T W Y VAla Arg Asn Asp Cys Gln Glu Gly His Ile Leu Lys Met Phe Pro Ser Thr Trp Tyr Val
Hydrophobic A C G I L M P VAromatic H F W YPolar N Q S T YBasic R H KAcidic D E
5
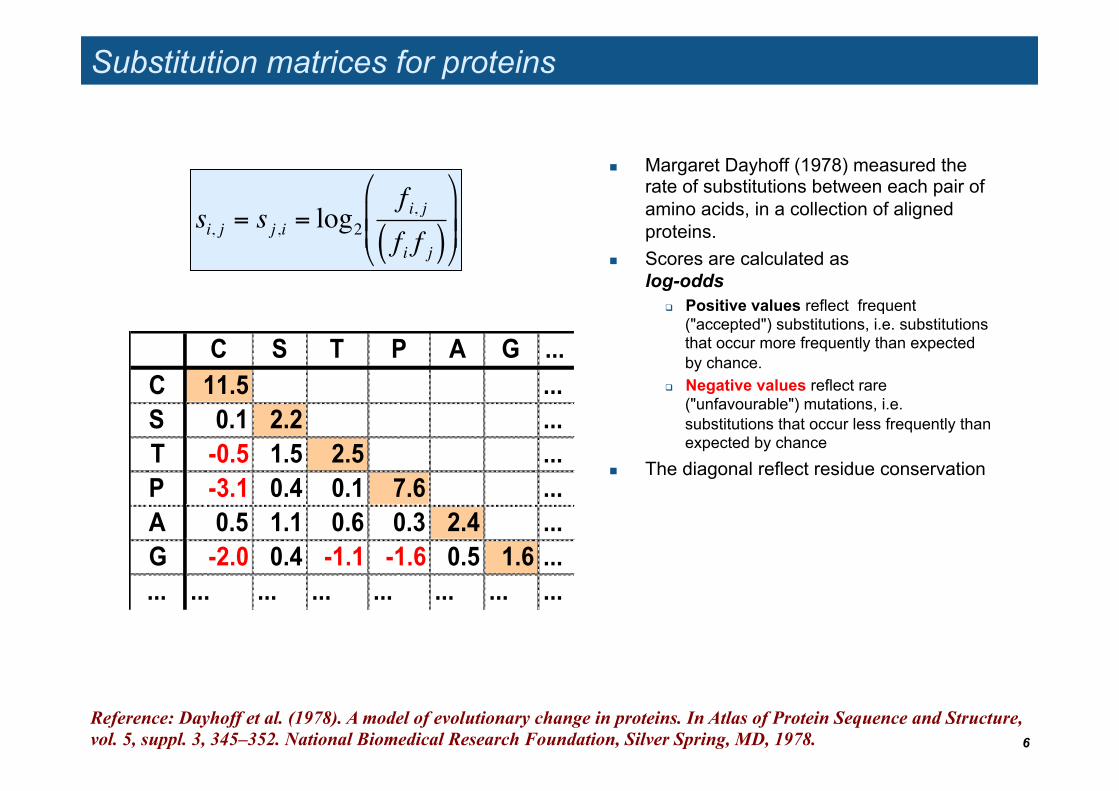
Substitution matrices for proteins
Margaret Dayhoff (1978) measured the rate of substitutions between each pair of amino acids, in a collection of aligned proteins.
Scores are calculated as log-odds
Positive values reflect frequent ("accepted") substitutions, i.e. substitutions that occur more frequently than expected by chance.
Negative values reflect rare ("unfavourable") mutations, i.e. substitutions that occur less frequently than expected by chance
The diagonal reflect residue conservation
C S T P A G ...C 11.5 ...S 0.1 2.2 ...T -0.5 1.5 2.5 ...P -3.1 0.4 0.1 7.6 ...A 0.5 1.1 0.6 0.3 2.4 ...G -2.0 0.4 -1.1 -1.6 0.5 1.6 ...... ... ... ... ... ... ... ...
Reference: Dayhoff et al. (1978). A model of evolutionary change in proteins. In Atlas of Protein Sequence and Structure, vol. 5, suppl. 3, 345–352. National Biomedical Research Foundation, Silver Spring, MD, 1978.
!
si, j = s j ,i = log2f i, jf i f j( )
"
# $ $
%
& ' '
6
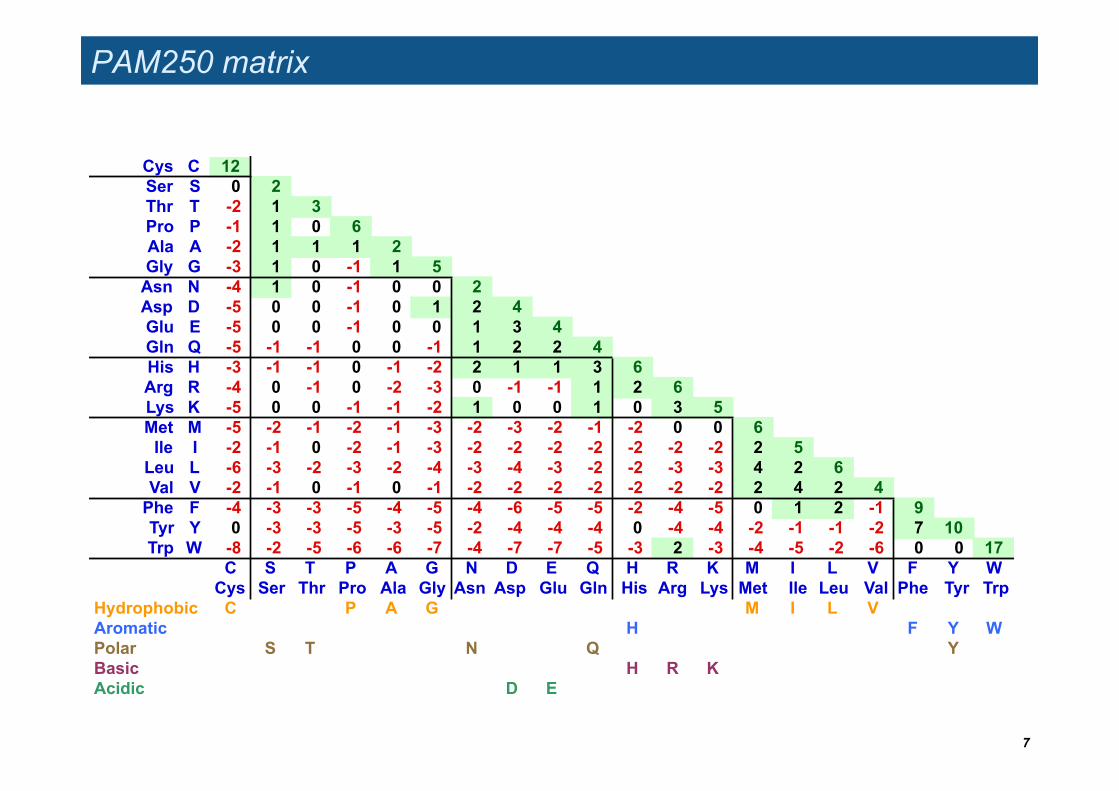
PAM250 matrix
Cys C 12Ser S 0 2Thr T -2 1 3Pro P -1 1 0 6Ala A -2 1 1 1 2Gly G -3 1 0 -1 1 5
Asn N -4 1 0 -1 0 0 2Asp D -5 0 0 -1 0 1 2 4Glu E -5 0 0 -1 0 0 1 3 4Gln Q -5 -1 -1 0 0 -1 1 2 2 4His H -3 -1 -1 0 -1 -2 2 1 1 3 6Arg R -4 0 -1 0 -2 -3 0 -1 -1 1 2 6Lys K -5 0 0 -1 -1 -2 1 0 0 1 0 3 5Met M -5 -2 -1 -2 -1 -3 -2 -3 -2 -1 -2 0 0 6
Ile I -2 -1 0 -2 -1 -3 -2 -2 -2 -2 -2 -2 -2 2 5Leu L -6 -3 -2 -3 -2 -4 -3 -4 -3 -2 -2 -3 -3 4 2 6Val V -2 -1 0 -1 0 -1 -2 -2 -2 -2 -2 -2 -2 2 4 2 4
Phe F -4 -3 -3 -5 -4 -5 -4 -6 -5 -5 -2 -4 -5 0 1 2 -1 9Tyr Y 0 -3 -3 -5 -3 -5 -2 -4 -4 -4 0 -4 -4 -2 -1 -1 -2 7 10Trp W -8 -2 -5 -6 -6 -7 -4 -7 -7 -5 -3 2 -3 -4 -5 -2 -6 0 0 17
C S T P A G N D E Q H R K M I L V F Y WCys Ser Thr Pro Ala Gly Asn Asp Glu Gln His Arg Lys Met Ile Leu Val Phe Tyr Trp
Hydrophobic C P A G M I L VAromatic H F Y WPolar S T N Q YBasic H R KAcidic D E
7

Hinton diagram of the PAM250 matrix
Yellow boxes indicate positive values (accepted mutations)
Red boxes indicate negative values (avoided mutations).
The area of each box is proportional to the absolute value of the log-odds score.
8
Reference: Henikoff, S. and Henikoff, J.G. (1992). Amino acid substitution matrices from protein blocks. PNAS 89:10915-10919.
BLOSUM scoring matrices
Henikoff and Henikoff (1992) analyzed substitution rates on the basis of aligned regions (blocks)
They calculated scoring matrices from blocks with different percentages of protein divergence
Example: BLOSUM62 calculated from blocks with ~62% identity BLOSUM80 calculated from blocks with ~80% identity
When these substitution matrices are used to score sequence alignments, one should always choose the matrix appropriate to the expected percentage of similarity.
9
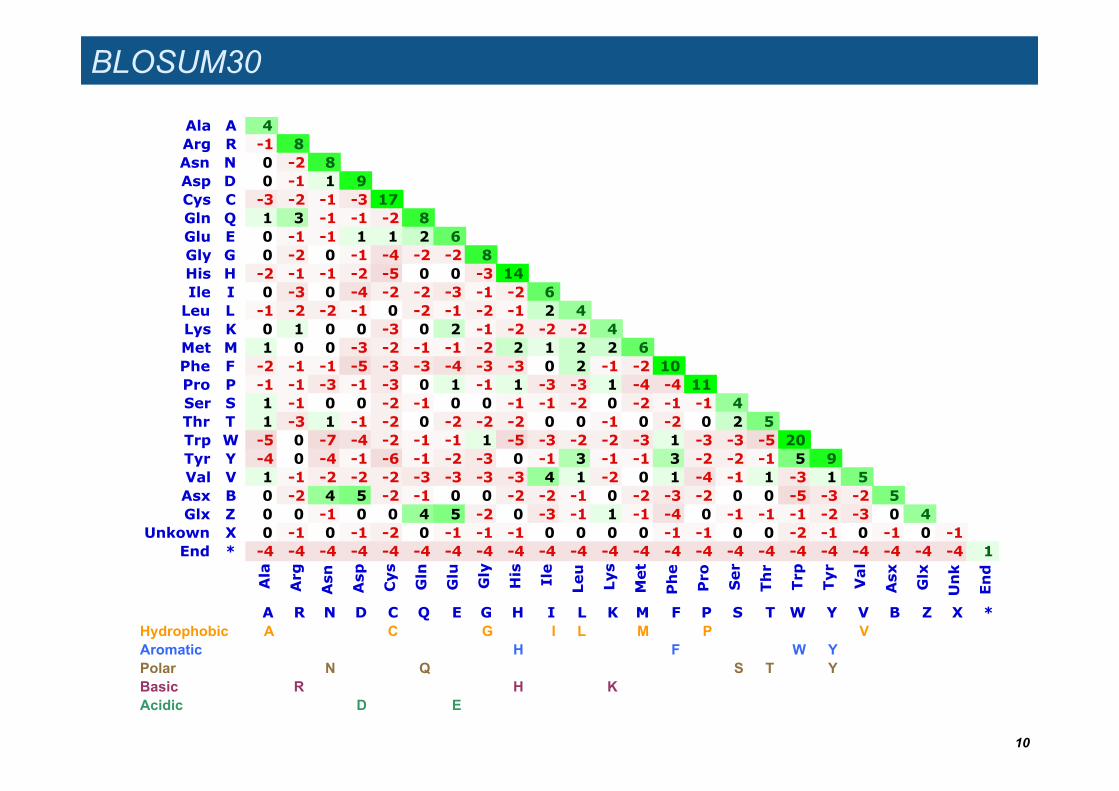
BLOSUM30
Ala A 4Arg R -1 8Asn N 0 -2 8Asp D 0 -1 1 9Cys C -3 -2 -1 -3 17Gln Q 1 3 -1 -1 -2 8Glu E 0 -1 -1 1 1 2 6Gly G 0 -2 0 -1 -4 -2 -2 8His H -2 -1 -1 -2 -5 0 0 -3 14Ile I 0 -3 0 -4 -2 -2 -3 -1 -2 6Leu L -1 -2 -2 -1 0 -2 -1 -2 -1 2 4Lys K 0 1 0 0 -3 0 2 -1 -2 -2 -2 4Met M 1 0 0 -3 -2 -1 -1 -2 2 1 2 2 6Phe F -2 -1 -1 -5 -3 -3 -4 -3 -3 0 2 -1 -2 10Pro P -1 -1 -3 -1 -3 0 1 -1 1 -3 -3 1 -4 -4 11Ser S 1 -1 0 0 -2 -1 0 0 -1 -1 -2 0 -2 -1 -1 4Thr T 1 -3 1 -1 -2 0 -2 -2 -2 0 0 -1 0 -2 0 2 5Trp W -5 0 -7 -4 -2 -1 -1 1 -5 -3 -2 -2 -3 1 -3 -3 -5 20Tyr Y -4 0 -4 -1 -6 -1 -2 -3 0 -1 3 -1 -1 3 -2 -2 -1 5 9Val V 1 -1 -2 -2 -2 -3 -3 -3 -3 4 1 -2 0 1 -4 -1 1 -3 1 5Asx B 0 -2 4 5 -2 -1 0 0 -2 -2 -1 0 -2 -3 -2 0 0 -5 -3 -2 5Glx Z 0 0 -1 0 0 4 5 -2 0 -3 -1 1 -1 -4 0 -1 -1 -1 -2 -3 0 4
Unkown X 0 -1 0 -1 -2 0 -1 -1 -1 0 0 0 0 -1 -1 0 0 -2 -1 0 -1 0 -1End * -4 -4 -4 -4 -4 -4 -4 -4 -4 -4 -4 -4 -4 -4 -4 -4 -4 -4 -4 -4 -4 -4 -4 1
Ala
Arg
Asn Asp Cys Gln
Glu
Gly
His Ile
Leu
Lys
Met
Phe
Pro Ser
Thr
Trp
Tyr
Val
Asx Glx
Unk
End
A R N D C Q E G H I L K M F P S T W Y V B Z X *Hydrophobic A C G I L M P VAromatic H F W YPolar N Q S T YBasic R H KAcidic D E
10
Scores d’alignements
UE AMU ENSBBAU3
Scores de BLAST
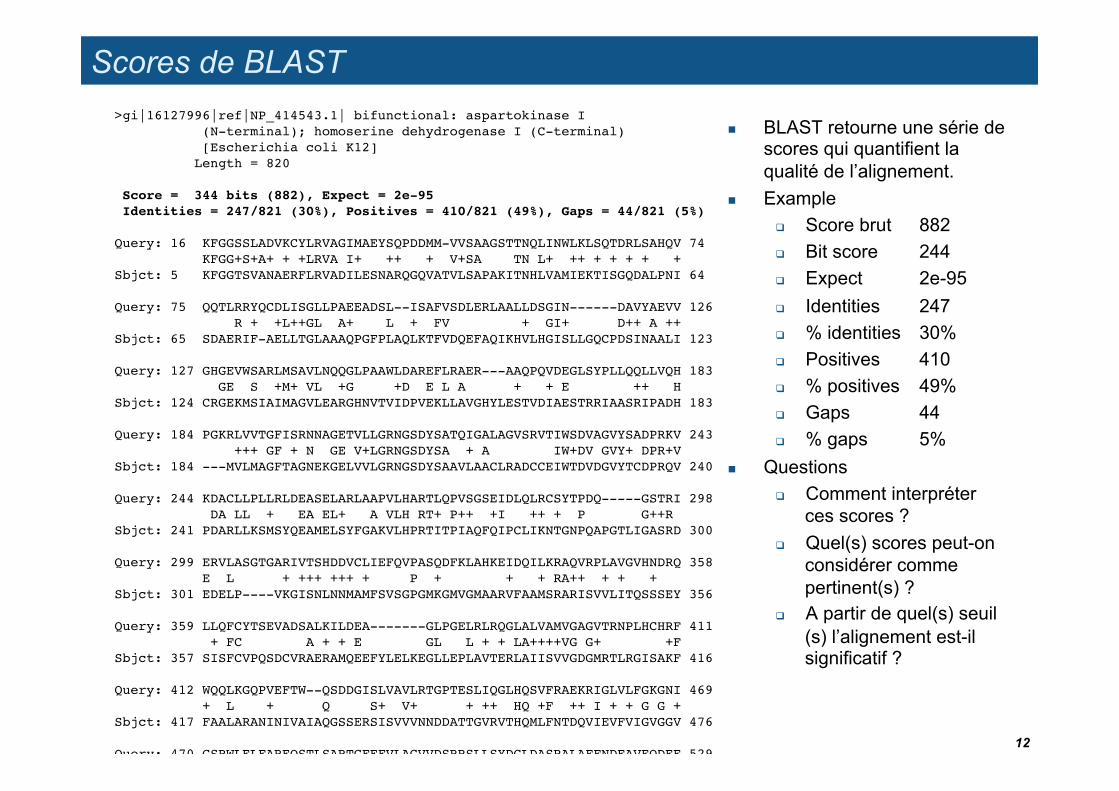
BLAST retourne une série de scores qui quantifient la qualité de l’alignement.
Example Score brut 882 Bit score 244 Expect 2e-95 Identities 247 % identities 30% Positives 410 % positives 49% Gaps 44 % gaps 5%
Questions Comment interpréter
ces scores ? Quel(s) scores peut-on
considérer comme pertinent(s) ?
A partir de quel(s) seuil(s) l’alignement est-il significatif ?
>gi|16127996|ref|NP_414543.1| bifunctional: aspartokinase I! (N-terminal); homoserine dehydrogenase I (C-terminal)! [Escherichia coli K12]! Length = 820!! Score = 344 bits (882), Expect = 2e-95! Identities = 247/821 (30%), Positives = 410/821 (49%), Gaps = 44/821 (5%)!!Query: 16 KFGGSSLADVKCYLRVAGIMAEYSQPDDMM-VVSAAGSTTNQLINWLKLSQTDRLSAHQV 74! KFGG+S+A+ + +LRVA I+ ++ + V+SA TN L+ ++ + + + + +!Sbjct: 5 KFGGTSVANAERFLRVADILESNARQGQVATVLSAPAKITNHLVAMIEKTISGQDALPNI 64!!Query: 75 QQTLRRYQCDLISGLLPAEEADSL--ISAFVSDLERLAALLDSGIN------DAVYAEVV 126! R + +L++GL A+ L + FV + GI+ D++ A ++!Sbjct: 65 SDAERIF-AELLTGLAAAQPGFPLAQLKTFVDQEFAQIKHVLHGISLLGQCPDSINAALI 123!!Query: 127 GHGEVWSARLMSAVLNQQGLPAAWLDAREFLRAER---AAQPQVDEGLSYPLLQQLLVQH 183! GE S +M+ VL +G +D E L A + + E ++ H!Sbjct: 124 CRGEKMSIAIMAGVLEARGHNVTVIDPVEKLLAVGHYLESTVDIAESTRRIAASRIPADH 183!!Query: 184 PGKRLVVTGFISRNNAGETVLLGRNGSDYSATQIGALAGVSRVTIWSDVAGVYSADPRKV 243! +++ GF + N GE V+LGRNGSDYSA + A IW+DV GVY+ DPR+V!Sbjct: 184 ---MVLMAGFTAGNEKGELVVLGRNGSDYSAAVLAACLRADCCEIWTDVDGVYTCDPRQV 240!!Query: 244 KDACLLPLLRLDEASELARLAAPVLHARTLQPVSGSEIDLQLRCSYTPDQ-----GSTRI 298! DA LL + EA EL+ A VLH RT+ P++ +I ++ + P G++R !Sbjct: 241 PDARLLKSMSYQEAMELSYFGAKVLHPRTITPIAQFQIPCLIKNTGNPQAPGTLIGASRD 300!!Query: 299 ERVLASGTGARIVTSHDDVCLIEFQVPASQDFKLAHKEIDQILKRAQVRPLAVGVHNDRQ 358! E L + +++ +++ + P + + + RA++ + + + !Sbjct: 301 EDELP----VKGISNLNNMAMFSVSGPGMKGMVGMAARVFAAMSRARISVVLITQSSSEY 356!!Query: 359 LLQFCYTSEVADSALKILDEA-------GLPGELRLRQGLALVAMVGAGVTRNPLHCHRF 411! + FC A + + E GL L + + LA++++VG G+ +F!Sbjct: 357 SISFCVPQSDCVRAERAMQEEFYLELKEGLLEPLAVTERLAIISVVGDGMRTLRGISAKF 416!!Query: 412 WQQLKGQPVEFTW--QSDDGISLVAVLRTGPTESLIQGLHQSVFRAEKRIGLVLFGKGNI 469! + L + Q S+ V+ + ++ HQ +F ++ I + + G G +!Sbjct: 417 FAALARANINIVAIAQGSSERSISVVVNNDDATTGVRVTHQMLFNTDQVIEVFVIGVGGV 476!!Query: 470 GSRWLELFAREQSTLSARTGFEFVLAGVVDSRRSLLSYDGLDASRALAFFNDEAVEQDEE 529! G LE R+QS L + + + GV +S+ L + GL+ L + +E + E !Sbjct: 477 GGALLEQLKRQQSWLKNKH-IDLRVCGVANSKALLTNVHGLN----LENWQEELAQAKEP 531!!Query: 530 ----SLFLWMRAHPYDDLVVLDVTASQQLADQYLDFASHGFHVISANKLAGASDSNKYRQ 585! L ++ + + V++D T+SQ +ADQY DF GFHV++ NK A S + Y Q!Sbjct: 532 FNLGRLIRLVKEYHLLNPVIVDCTSSQAVADQYADFLREGFHVVTPNKKANTSSMDYYHQ 591!!Query: 586 IHDAFEKTGRHWLYNATVGAGLPINHTVRDLIDSGDTILSISGIFSGTLSWLFLQFDGSV 645! + A EK+ R +LY+ VGAGLP+ +++L+++GD ++ SGI SG+LS++F + D +!Sbjct: 592 LRYAAEKSRRKFLYDTNVGAGLPVIENLQNLLNAGDELMKFSGILSGSLSYIFGKLDEGM 651!!Query: 646 PFTELVDQAWQQGLTEPDPRDDLSGKDVMRKLVILAREAGYNIEPDQVRVESLVPAHCEG 705! F+E A + G TEPDPRDDLSG DV RKL+ILARE G +E + +E ++PA !Sbjct: 652 SFSEATTLAREMGYTEPDPRDDLSGMDVARKLLILARETGRELELADIEIEPVLPAEFNA 711!!Query: 706 -GSIDHFFENGDELNEQMVQRLEAAREMGLVLRYVARFDANGKARVGVEAVREDHPLASL 764! G + F N +L++ R+ AR+ G VLRYV D +G RV + V + PL +!Sbjct: 712 EGDVAAFMANLSQLDDLFAARVAKARDEGKVLRYVGNIDEDGVCRVKIAEVDGNDPLFKV 771!!Query: 765 LPCDNVFAIESRWYRDNPLVIRGPGAGRDVTAGAIQSDINR 805! +N A S +Y+ PLV+RG GAG DVTA + +D+ R!Sbjct: 772 KNGENALAFYSHYYQPLPLVLRGYGAGNDVTAAGVFADLLR 812!!!>gi|16131850|ref|NP_418448.1| aspartokinase III, lysine sensitive;! aspartokinase III, lysine-sensitive [Escherichia coli! K12]! Length = 449!! Score = 122 bits (307), Expect = 7e-29! Identities = 121/452 (26%), Positives = 194/452 (42%), Gaps = 25/452 (5%)!!Query: 16 KFGGSSLADVKCYLRVAGIMAEYSQPDDMMVVSAAGSTTNQLINWLK-LSQTDRLSAHQV 74! KFGG+S+AD R A I+ + ++V+SA+ TN L+ + L +R + !Sbjct: 8 KFGGTSVADFDAMNRSADIVLSDANVR-LVVLSASAGITNLLVALAEGLEPGERF---EK 63!!Query: 75 QQTLRRYQCDLISGLLPAEEADSLISAFVSDLERLAALLDSGINDAVYAEVVGHGEVWSA 134! +R Q ++ L I + ++ LA + A+ E+V HGE+ S !Sbjct: 64 LDAIRNIQFAILERLRYPNVIREEIERLLENITVLAEAAALATSPALTDELVSHGELMST 123!!Query: 135 RLMSAVLNQQGLPAAWLDAREFLRA-ERAAQPQVDEGLSYPLLQQLLVQHPGKRLVVT-G 192! L +L ++ + A W D R+ +R +R + + D L L+ + LV+T G!Sbjct: 124 LLFVEILRERDVQAQWFDVRKVMRTNDRFGRAEPDIAALAELAALQLLPRLNEGLVITQG 183!!Query: 193 FISRNNAGETVLLGRNGSDYSATQIGALAGVSRVTIWSDVAGVYSADPRKVKDACLLPLL 252! FI N G T LGR GSDY+A + SRV IW+DV G+Y+ DPR V A + +!Sbjct: 184 FIGSENKGRTTTLGRGGSDYTAALLAEALHASRVDIWTDVPGIYTTDPRVVSAAKRIDEI 243!!Query: 253 RLDEASELARLAAPVLHARTLQPVSGSEIDLQLRCSYTPDQGSTRI---------ERVLA 303! EA+E+A A VLH TL P S+I + + S P G T + R LA!Sbjct: 244 AFAEAAEMATFGAKVLHPATLLPAVRSDIPVFVGSSKDPRAGGTLVCNKTENPPLFRALA 303!!Query: 304 SGTGARIVTSHDDVCLIEFQVPASQDFKLAHKEIDQILKRAQVRPLAVGVHNDRQLLQFC 363! ++T H L A LA I L +A+ L !Sbjct: 304 LRRNQTLLTLHSLNMLHSRGFLAEVFGILARHNISVDLITTSEVSVAL-------TLDTT 356!!Query: 364 YTSEVADSAL--KILDEAGLPGELRLRQGLALVAMVGAGVTRNPLHCHRFWQQLKGQPVE 421! ++ D+ L +L E + + +GLALVA++G +++ + L+ + !Sbjct: 357 GSTSTGDTLLTQSLLMELSALCRVEVEEGLALVALIGNDLSKACGVGKEVFGVLEPFNIR 416!!Query: 422 FTWQSDDGISLVAVLRTGPTESLIQGLHQSVF 453! +L ++ E ++Q LH ++F!Sbjct: 417 MICYGASSHNLCFLVPGEDAEQVVQKLHSNLF 448!!!>gi|16128228|ref|NP_414777.1| gamma-glutamate kinase [Escherichia! coli K12]! Length = 367!! Score = 31.2 bits (69), Expect = 0.28! Identities = 17/56 (30%), Positives = 29/56 (51%)!!Query: 194 ISRNNAGETVLLGRNGSDYSATQIGALAGVSRVTIWSDVAGVYSADPRKVKDACLL 249! I+ N+A T + +D + LAG ++ + +D G+Y+ADPR A L+!Sbjct: 133 INENDAVATAEIKVGDNDNLSALAAILAGADKLLLLTDQKGLYTADPRSNPQAELI 188!!! Database: /Users/jvanheld/rsa-! tools/data/genomes/Escherichia_coli_K12/genome/NC_000913.faa! Posted date: Sep 8, 2004 12:13 PM! Number of letters in database: 1,351,322! Number of sequences in database: 4242! !Lambda K H! 0.320 0.136 0.397 !!Gapped!Lambda K H! 0.267 0.0410 0.140 !!!Matrix: BLOSUM62!Gap Penalties: Existence: 11, Extension: 1!Number of Hits to DB: 2,199,628!Number of Sequences: 4242!Number of extensions: 96525!Number of successful extensions: 290!Number of sequences better than 1.0: 4!Number of HSP's better than 1.0 without gapping: 4!Number of HSP's successfully gapped in prelim test: 0!Number of HSP's that attempted gapping in prelim test: 279!Number of HSP's gapped (non-prelim): 5!length of query: 810!length of database: 1,351,322!effective HSP length: 92!effective length of query: 718!effective length of database: 961,058!effective search space: 690039644!effective search space used: 690039644!T: 11!A: 40!X1: 16 ( 7.4 bits)!X2: 38 (14.6 bits)!X3: 64 (24.7 bits)!S1: 41 (21.8 bits)!S2: 65 (29.6 bits)!
12
Scoring an alignment with a substitution matrix
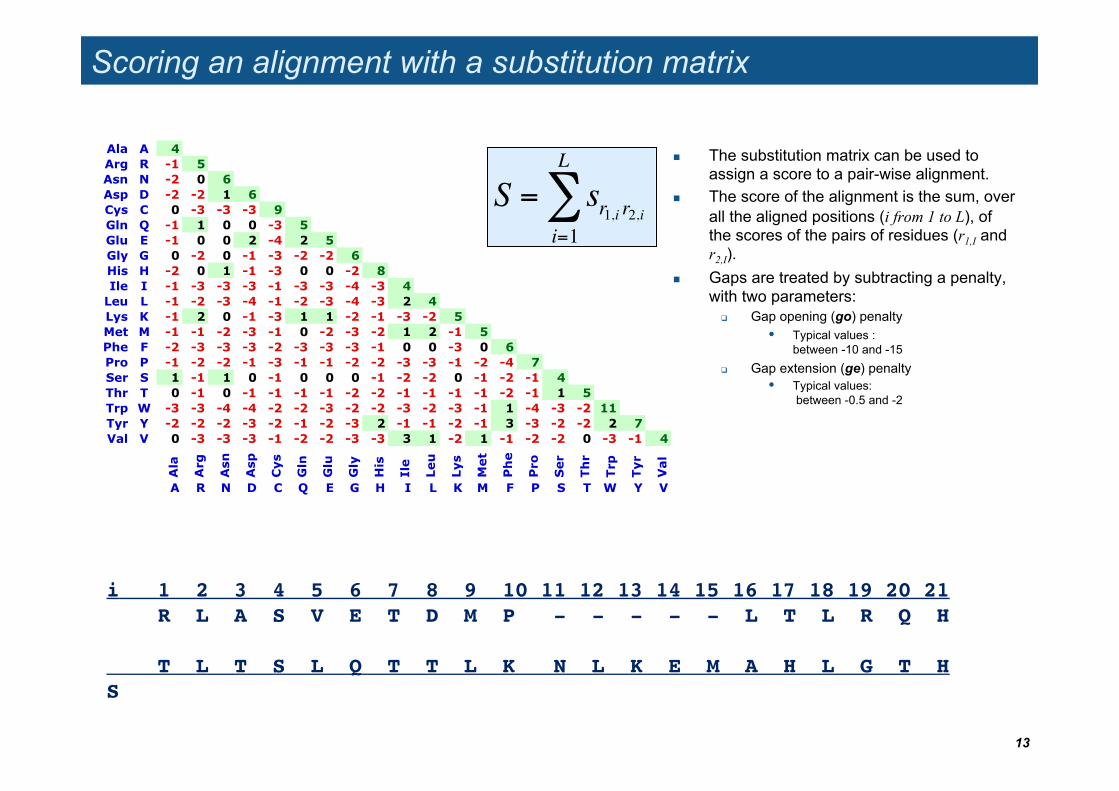
The substitution matrix can be used to assign a score to a pair-wise alignment.
The score of the alignment is the sum, over all the aligned positions (i from 1 to L), of the scores of the pairs of residues (r1,I and r2,I).
Gaps are treated by subtracting a penalty, with two parameters:
Gap opening (go) penalty • Typical values :
between -10 and -15 Gap extension (ge) penalty
• Typical values: between -0.5 and -2
Ala A 4Arg R -1 5Asn N -2 0 6Asp D -2 -2 1 6Cys C 0 -3 -3 -3 9Gln Q -1 1 0 0 -3 5Glu E -1 0 0 2 -4 2 5Gly G 0 -2 0 -1 -3 -2 -2 6His H -2 0 1 -1 -3 0 0 -2 8Ile I -1 -3 -3 -3 -1 -3 -3 -4 -3 4Leu L -1 -2 -3 -4 -1 -2 -3 -4 -3 2 4Lys K -1 2 0 -1 -3 1 1 -2 -1 -3 -2 5Met M -1 -1 -2 -3 -1 0 -2 -3 -2 1 2 -1 5Phe F -2 -3 -3 -3 -2 -3 -3 -3 -1 0 0 -3 0 6Pro P -1 -2 -2 -1 -3 -1 -1 -2 -2 -3 -3 -1 -2 -4 7Ser S 1 -1 1 0 -1 0 0 0 -1 -2 -2 0 -1 -2 -1 4Thr T 0 -1 0 -1 -1 -1 -1 -2 -2 -1 -1 -1 -1 -2 -1 1 5Trp W -3 -3 -4 -4 -2 -2 -3 -2 -2 -3 -2 -3 -1 1 -4 -3 -2 11Tyr Y -2 -2 -2 -3 -2 -1 -2 -3 2 -1 -1 -2 -1 3 -3 -2 -2 2 7Val V 0 -3 -3 -3 -1 -2 -2 -3 -3 3 1 -2 1 -1 -2 -2 0 -3 -1 4
Ala
Arg
Asn
Asp
Cys
Gln
Glu
Gly
His
Ile
Leu
Lys
Met
Phe
Pro
Ser
Thr
Trp
Tyr
Val
A R N D C Q E G H I L K M F P S T W Y V
i 1 2 3 4 5 6 7 8 9 10 11 12 13 14 15 16 17 18 19 20 21! R L A S V E T D M P - - - - - L T L R Q H!! T L T S L Q T T L K N L K E M A H L G T H!S!
!
S = sr1,i r2,ii=1
L
"
13
Scoring an alignment with a substitution matrix
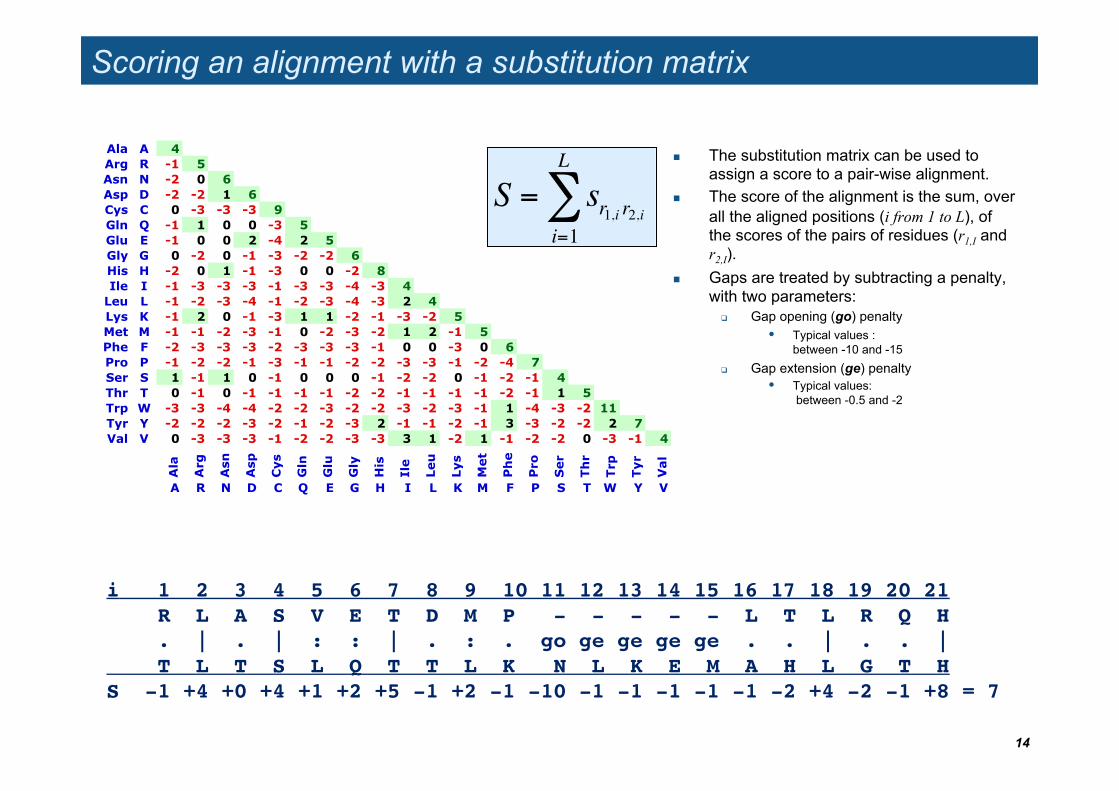
The substitution matrix can be used to assign a score to a pair-wise alignment.
The score of the alignment is the sum, over all the aligned positions (i from 1 to L), of the scores of the pairs of residues (r1,I and r2,I).
Gaps are treated by subtracting a penalty, with two parameters:
Gap opening (go) penalty • Typical values :
between -10 and -15 Gap extension (ge) penalty
• Typical values: between -0.5 and -2
Ala A 4Arg R -1 5Asn N -2 0 6Asp D -2 -2 1 6Cys C 0 -3 -3 -3 9Gln Q -1 1 0 0 -3 5Glu E -1 0 0 2 -4 2 5Gly G 0 -2 0 -1 -3 -2 -2 6His H -2 0 1 -1 -3 0 0 -2 8Ile I -1 -3 -3 -3 -1 -3 -3 -4 -3 4Leu L -1 -2 -3 -4 -1 -2 -3 -4 -3 2 4Lys K -1 2 0 -1 -3 1 1 -2 -1 -3 -2 5Met M -1 -1 -2 -3 -1 0 -2 -3 -2 1 2 -1 5Phe F -2 -3 -3 -3 -2 -3 -3 -3 -1 0 0 -3 0 6Pro P -1 -2 -2 -1 -3 -1 -1 -2 -2 -3 -3 -1 -2 -4 7Ser S 1 -1 1 0 -1 0 0 0 -1 -2 -2 0 -1 -2 -1 4Thr T 0 -1 0 -1 -1 -1 -1 -2 -2 -1 -1 -1 -1 -2 -1 1 5Trp W -3 -3 -4 -4 -2 -2 -3 -2 -2 -3 -2 -3 -1 1 -4 -3 -2 11Tyr Y -2 -2 -2 -3 -2 -1 -2 -3 2 -1 -1 -2 -1 3 -3 -2 -2 2 7Val V 0 -3 -3 -3 -1 -2 -2 -3 -3 3 1 -2 1 -1 -2 -2 0 -3 -1 4
Ala
Arg
Asn
Asp
Cys
Gln
Glu
Gly
His
Ile
Leu
Lys
Met
Phe
Pro
Ser
Thr
Trp
Tyr
Val
A R N D C Q E G H I L K M F P S T W Y V
i 1 2 3 4 5 6 7 8 9 10 11 12 13 14 15 16 17 18 19 20 21! R L A S V E T D M P - - - - - L T L R Q H! . | . | : : | . : . go ge ge ge ge . . | . . |! T L T S L Q T T L K N L K E M A H L G T H!S -1 +4 +0 +4 +1 +2 +5 -1 +2 -1 -10 -1 -1 -1 -1 -1 -2 +4 -2 -1 +8 = 7 !
!
S = sr1,i r2,ii=1
L
"
14
P-valeur d’un segment aligné (MSP) et score en bits
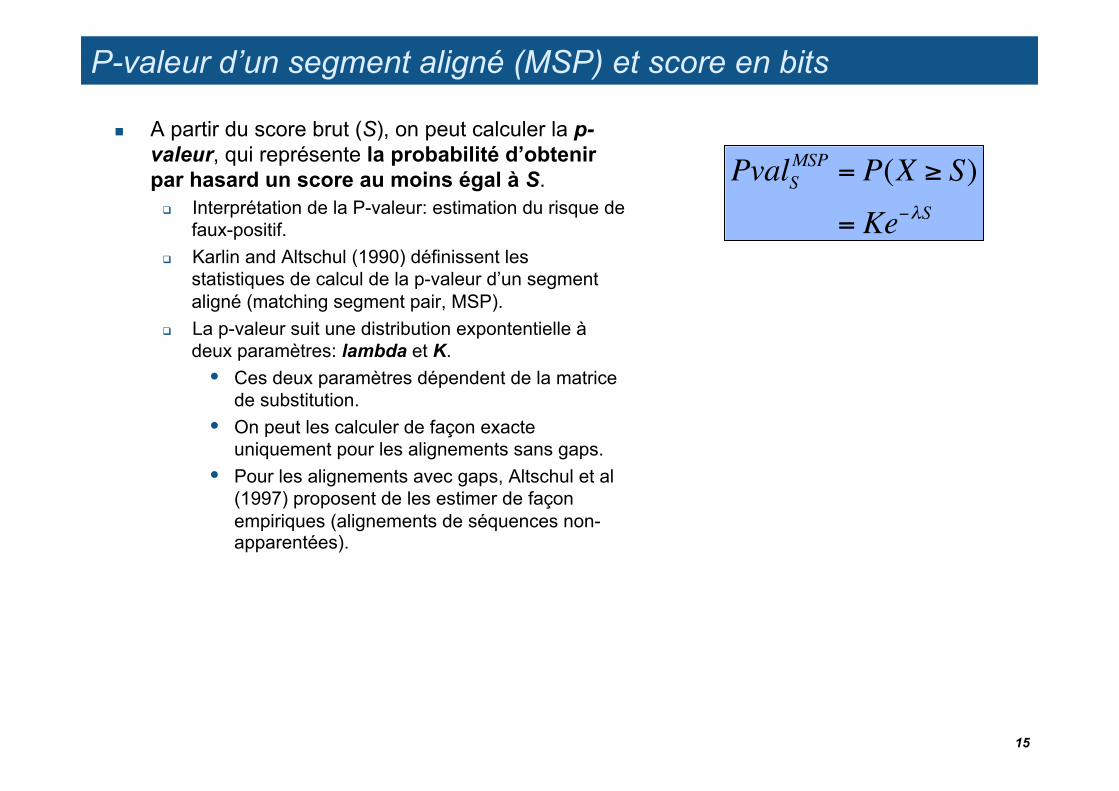
A partir du score brut (S), on peut calculer la p-valeur, qui représente la probabilité d’obtenir par hasard un score au moins égal à S.
Interprétation de la P-valeur: estimation du risque de faux-positif.
Karlin and Altschul (1990) définissent les statistiques de calcul de la p-valeur d’un segment aligné (matching segment pair, MSP).
La p-valeur suit une distribution expontentielle à deux paramètres: lambda et K. • Ces deux paramètres dépendent de la matrice
de substitution. • On peut les calculer de façon exacte
uniquement pour les alignements sans gaps. • Pour les alignements avec gaps, Altschul et al
(1997) proposent de les estimer de façon empiriques (alignements de séquences non-apparentées).
PvalSMSP = P(X ! S)
= Ke"!S
15
Score en bits
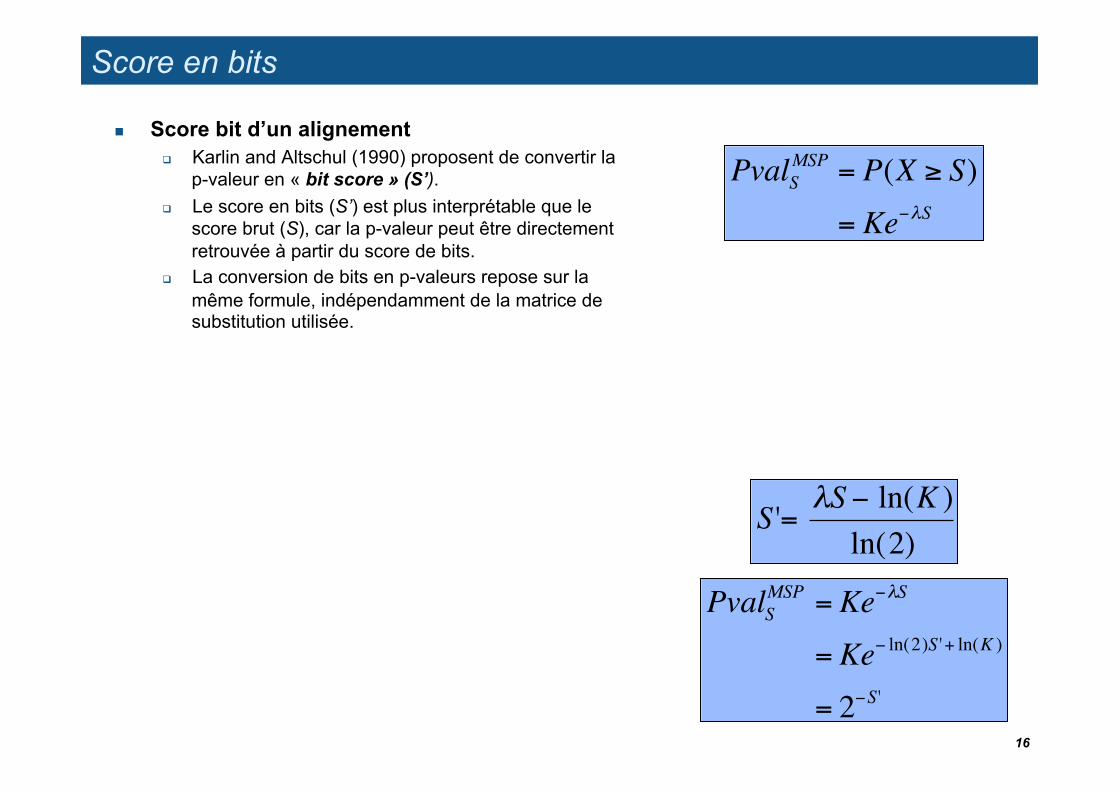
Score bit d’un alignement Karlin and Altschul (1990) proposent de convertir la
p-valeur en « bit score » (S’). Le score en bits (S’) est plus interprétable que le
score brut (S), car la p-valeur peut être directement retrouvée à partir du score de bits.
La conversion de bits en p-valeurs repose sur la même formule, indépendamment de la matrice de substitution utilisée.
PvalSMSP = P(X ! S)
= Ke"!S
!
S '= "S # ln(K )ln(2)
!
PvalSMSP = Ke"#S
= Ke" ln(2)S '+ ln(K )
= 2"S'16
Distribution of probability for matching scores
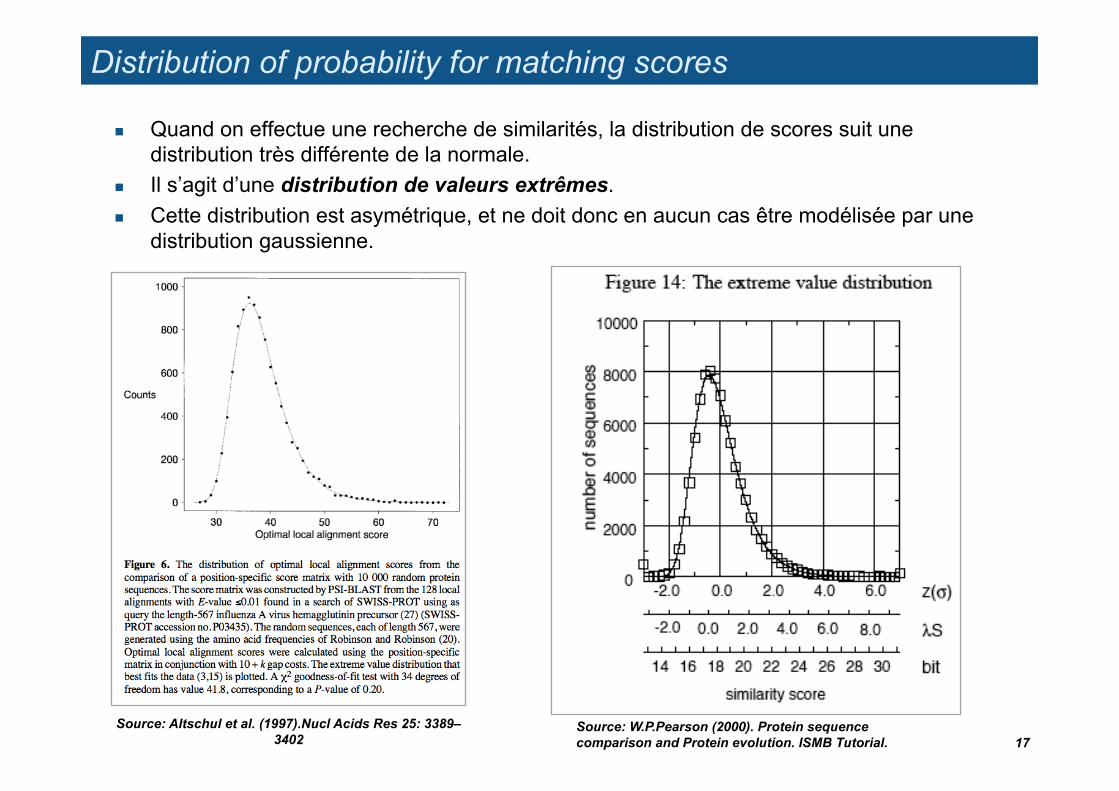
Quand on effectue une recherche de similarités, la distribution de scores suit une distribution très différente de la normale.
Il s’agit d’une distribution de valeurs extrêmes. Cette distribution est asymétrique, et ne doit donc en aucun cas être modélisée par une
distribution gaussienne.
17 Source: W.P.Pearson (2000). Protein sequence comparison and Protein evolution. ISMB Tutorial.
Source: Altschul et al. (1997).Nucl Acids Res 25: 3389–3402
Statistiques d’alignements – la e-valeur (expect)
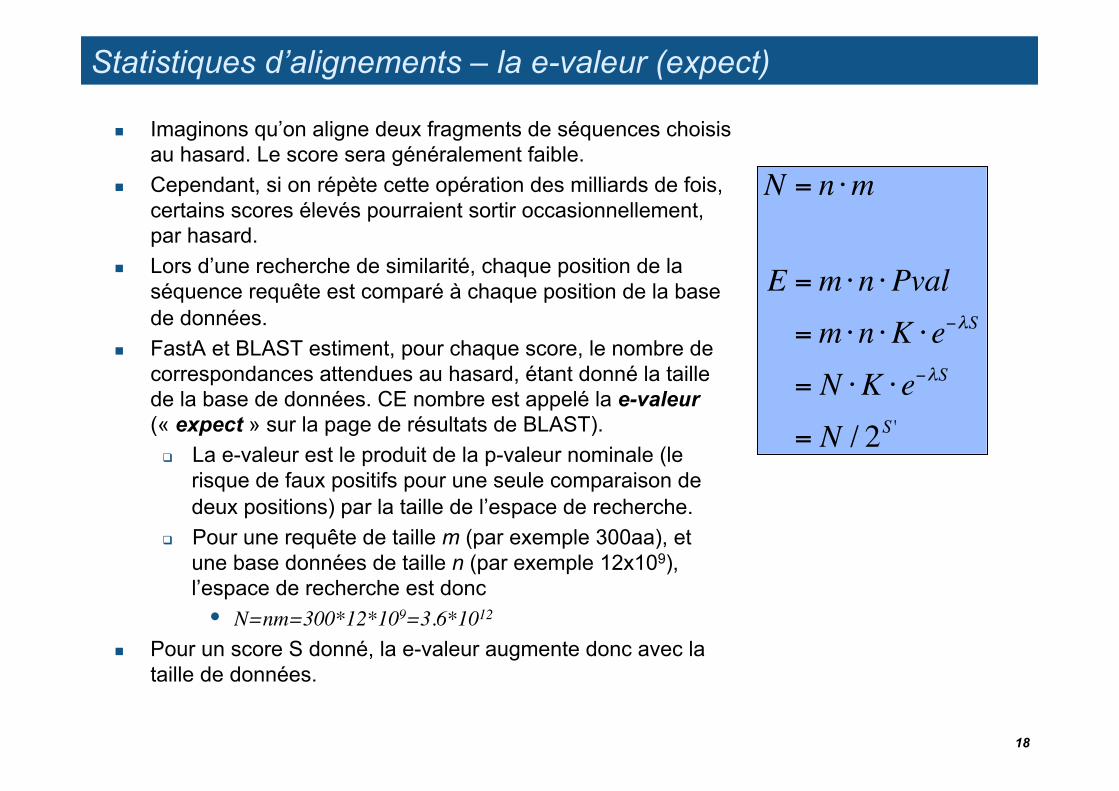
Imaginons qu’on aligne deux fragments de séquences choisis au hasard. Le score sera généralement faible.
Cependant, si on répète cette opération des milliards de fois, certains scores élevés pourraient sortir occasionnellement, par hasard.
Lors d’une recherche de similarité, chaque position de la séquence requête est comparé à chaque position de la base de données.
FastA et BLAST estiment, pour chaque score, le nombre de correspondances attendues au hasard, étant donné la taille de la base de données. CE nombre est appelé la e-valeur (« expect » sur la page de résultats de BLAST).
La e-valeur est le produit de la p-valeur nominale (le risque de faux positifs pour une seule comparaison de deux positions) par la taille de l’espace de recherche.
Pour une requête de taille m (par exemple 300aa), et une base données de taille n (par exemple 12x109), l’espace de recherche est donc • N=nm=300*12*109=3.6*1012
Pour un score S donné, la e-valeur augmente donc avec la taille de données.
N = n !m
E =m !n !Pval=m !n !K !e"!S
= N !K !e"!S
= N / 2S '
18
Choix du seuil sur la e-valeur
Plus la e-valeur est faible, plus l’alignement est significatif. Des e-valeurs élevées (>1)
indiquent donc qu’un alignement a de fortes chances de résulter du hasard, et ne devrait pas être considéré comme pertinent (il ne correspond vraisemblablement pas à une homologie).
Une e-valeur très basse (ex: 1e-21) indique que l’alignement n’a quasiment aucune chance de résulter du hasard. Il est
dès lors vraisemblable qu’il résulte d’une origine ancestrale commune entre les deux séquences alignées. Dans ce cas, on admet donc l’hypothèse d’homologie.
Un paramètre essentiel pour BLAST et FastA est le seuil sur la e-valeur (expect threshold).
Attention Sur le serveur BLAST du NCBI, la valeur seuil par défaut vaut 10. Ceci signifie que chaque requête pourrait retourner 10 alignements par hasard. Si on se fie à ce seuil, on doit s’attendre à ~10 faux positifs par requête. Il est donc recommandé de diminuer le seuil d’e-valeur (par exemple à 0.001), pour
obtenir des résultats significatifs.
19
Exercices
Interprétez les scores retournés par BLAST dans un alignement donné A partir du score en bits, calculez la p-valeur nominale de l’alignement A partir de la E-valeur, calculez la FWER de l’alignement
20
Motifs sur les séquences : matrices position-poids
22
23
Consensus representation
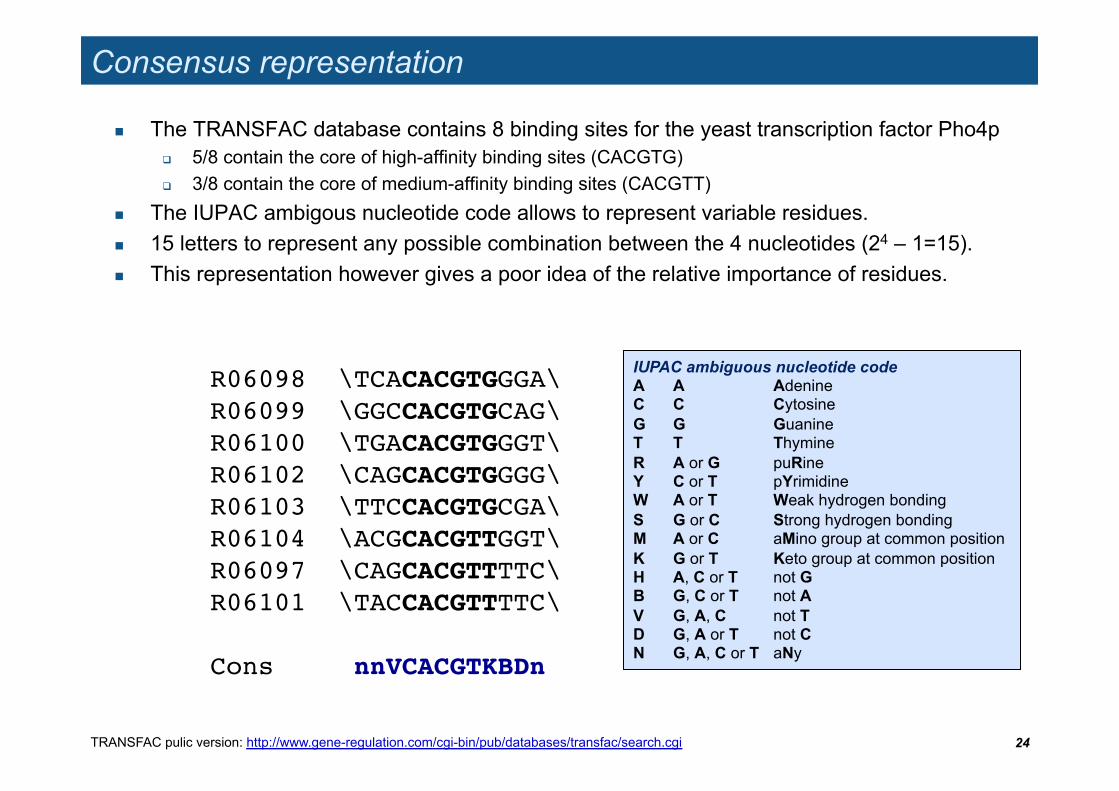
The TRANSFAC database contains 8 binding sites for the yeast transcription factor Pho4p 5/8 contain the core of high-affinity binding sites (CACGTG) 3/8 contain the core of medium-affinity binding sites (CACGTT)
The IUPAC ambigous nucleotide code allows to represent variable residues. 15 letters to represent any possible combination between the 4 nucleotides (24 – 1=15). This representation however gives a poor idea of the relative importance of residues.
24
R06098 \TCACACGTGGGA\!R06099 \GGCCACGTGCAG\!R06100 \TGACACGTGGGT\!R06102 \CAGCACGTGGGG\!R06103 \TTCCACGTGCGA\!R06104 \ACGCACGTTGGT\!R06097 \CAGCACGTTTTC\!R06101 \TACCACGTTTTC\!!Cons nnVCACGTKBDn!
TRANSFAC pulic version: http://www.gene-regulation.com/cgi-bin/pub/databases/transfac/search.cgi
IUPAC ambiguous nucleotide code A A Adenine C C Cytosine G G Guanine T T Thymine R A or G puRine Y C or T pYrimidine W A or T Weak hydrogen bonding S G or C Strong hydrogen bonding M A or C aMino group at common position K G or T Keto group at common position H A, C or T not G B G, C or T not A V G, A, C not T D G, A or T not C N G, A, C or T aNy
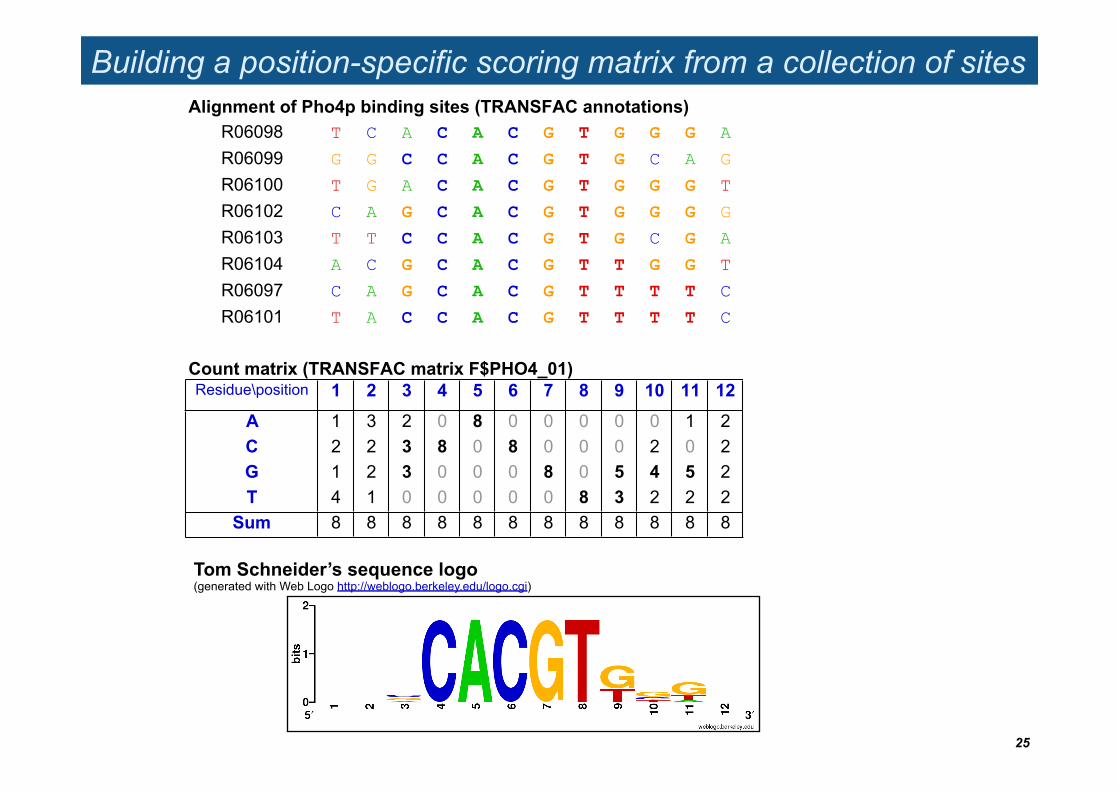
Building a position-specific scoring matrix from a collection of sites
25
Alignment of Pho4p binding sites (TRANSFAC annotations)R06098 T C A C A C G T G G G AR06099 G G C C A C G T G C A GR06100 T G A C A C G T G G G TR06102 C A G C A C G T G G G GR06103 T T C C A C G T G C G AR06104 A C G C A C G T T G G TR06097 C A G C A C G T T T T CR06101 T A C C A C G T T T T C
Count matrix (TRANSFAC matrix F$PHO4_01)Residue\position 1 2 3 4 5 6 7 8 9 10 11 12
A 1 3 2 0 8 0 0 0 0 0 1 2C 2 2 3 8 0 8 0 0 0 2 0 2G 1 2 3 0 0 0 8 0 5 4 5 2T 4 1 0 0 0 0 0 8 3 2 2 2
Sum 8 8 8 8 8 8 8 8 8 8 8 8
Tom Schneider’s sequence logo (generated with Web Logo http://weblogo.berkeley.edu/logo.cgi)
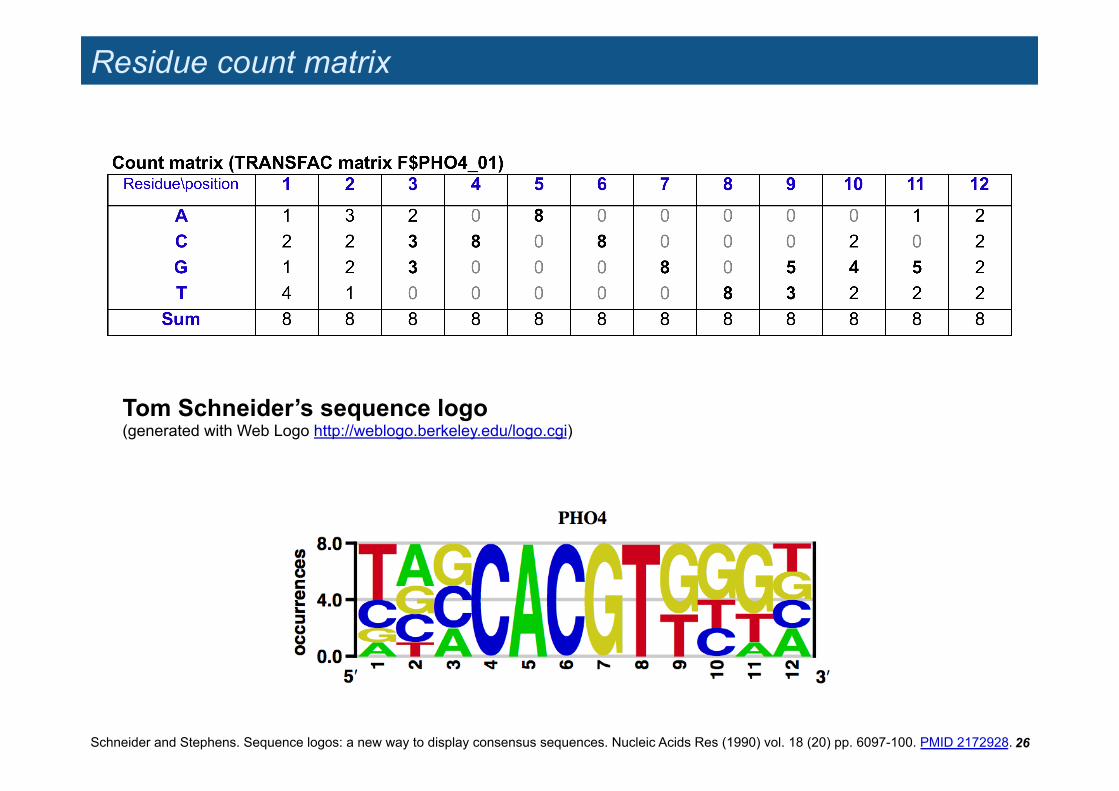
Residue count matrix
26
Tom Schneider’s sequence logo (generated with Web Logo http://weblogo.berkeley.edu/logo.cgi)
Schneider and Stephens. Sequence logos: a new way to display consensus sequences. Nucleic Acids Res (1990) vol. 18 (20) pp. 6097-100. PMID 2172928.
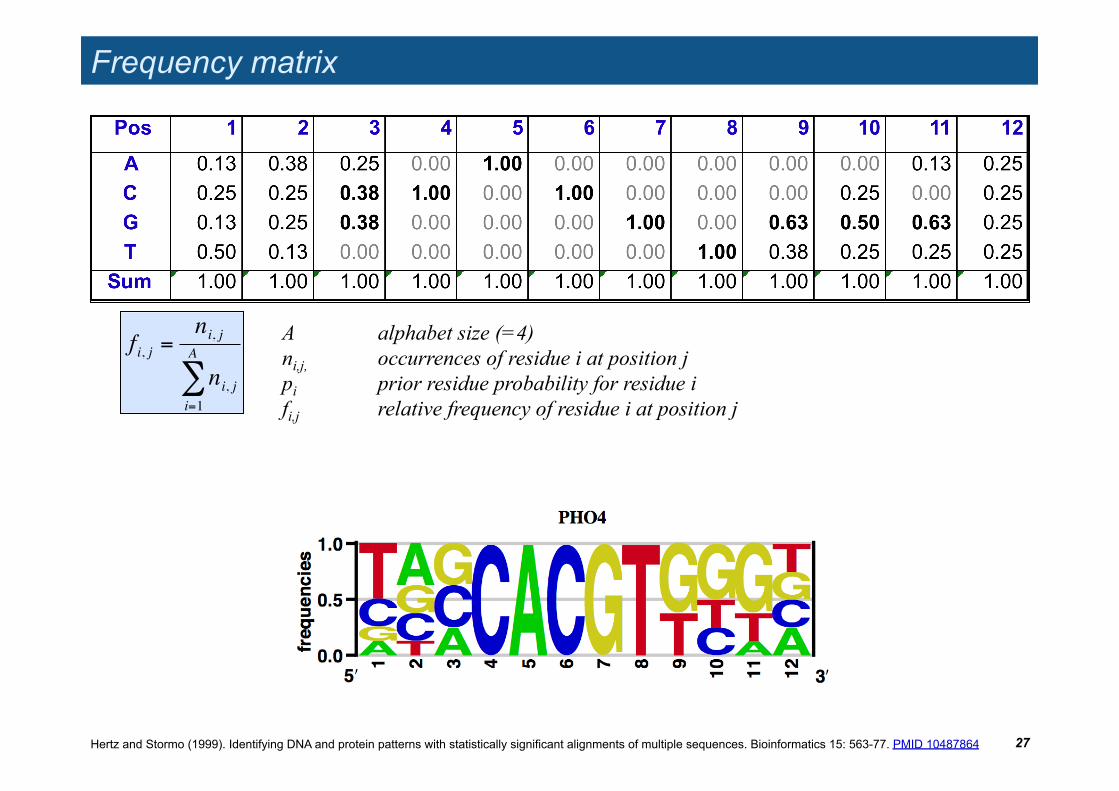
Frequency matrix
27
A alphabet size (=4) ni,j, occurrences of residue i at position j pi prior residue probability for residue i fi,j relative frequency of residue i at position j
!
fi, j =ni, j
ni, ji=1
A
"
Hertz and Stormo (1999). Identifying DNA and protein patterns with statistically significant alignments of multiple sequences. Bioinformatics 15: 563-77. PMID 10487864
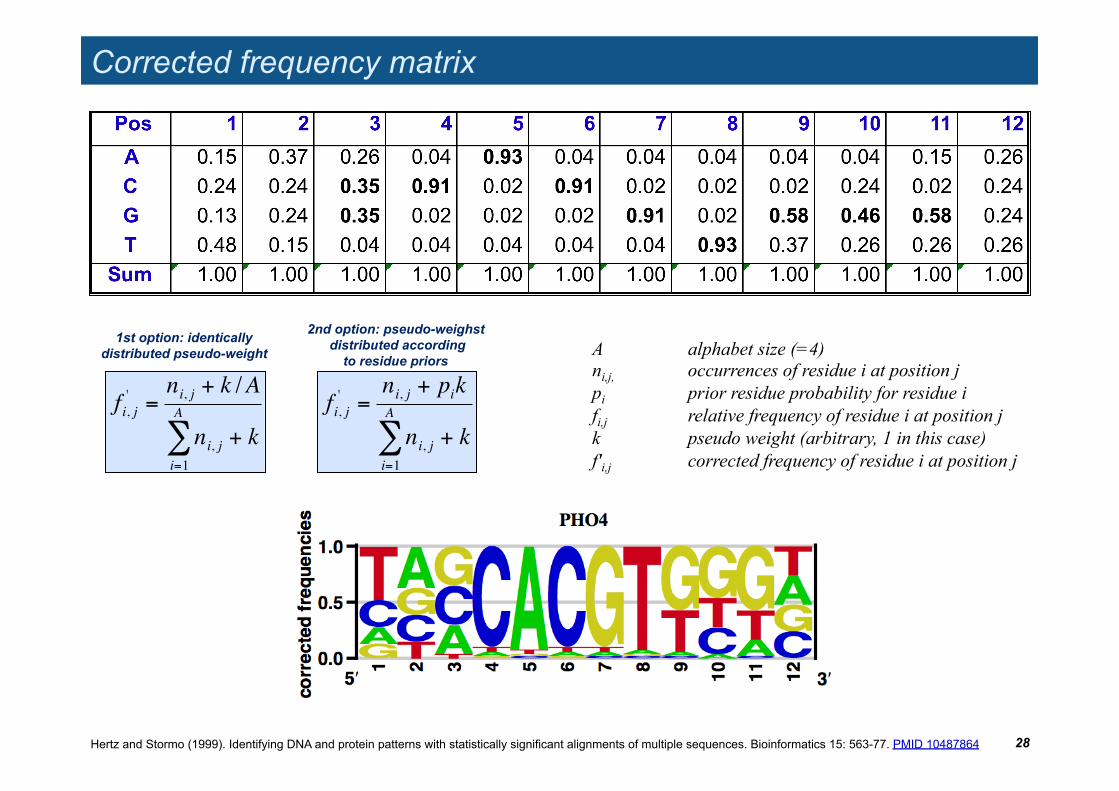
Corrected frequency matrix
28
A alphabet size (=4) ni,j, occurrences of residue i at position j pi prior residue probability for residue i fi,j relative frequency of residue i at position j k pseudo weight (arbitrary, 1 in this case) f'i,j corrected frequency of residue i at position j
!
fi, j' =
ni, j + k /A
ni, ji=1
A
" + k
1st option: identically distributed pseudo-weight
!
fi, j' =
ni, j + pik
ni, ji=1
A
" + k
2nd option: pseudo-weighst distributed according
to residue priors
Hertz and Stormo (1999). Identifying DNA and protein patterns with statistically significant alignments of multiple sequences. Bioinformatics 15: 563-77. PMID 10487864
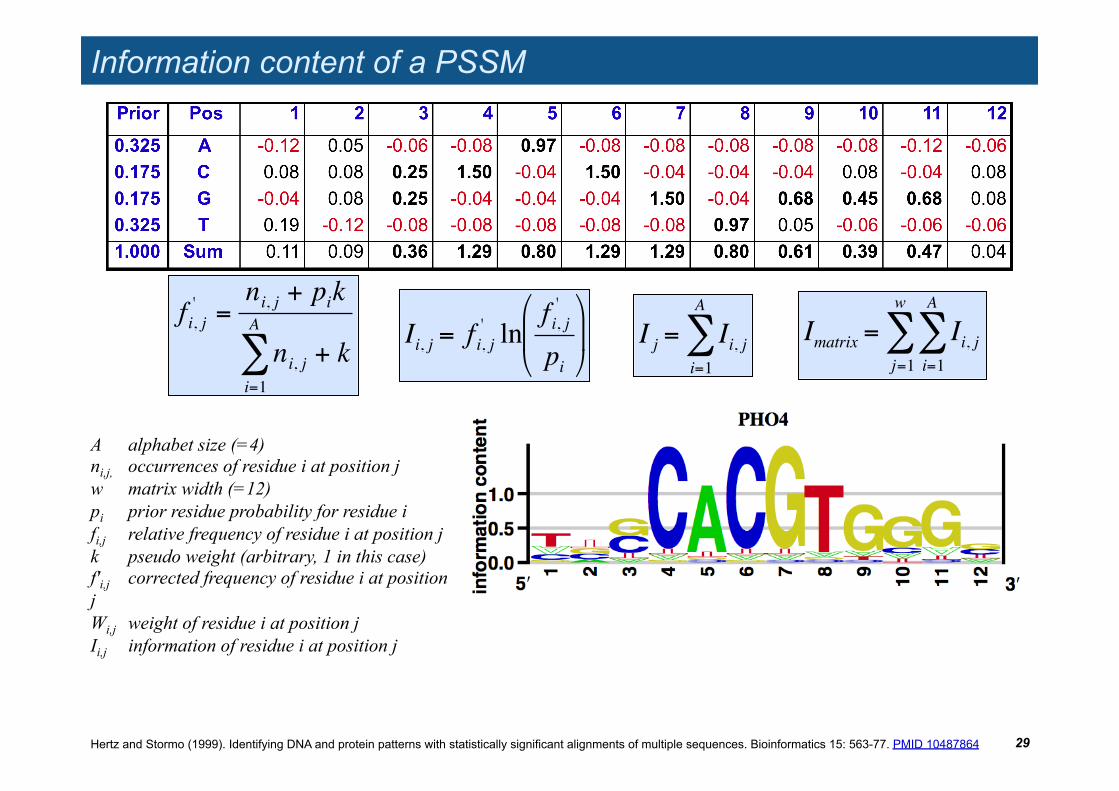
Information content of a PSSM
29
!
Imatrix = Ii, ji=1
A
"j=1
w
"
A alphabet size (=4) ni,j, occurrences of residue i at position j w matrix width (=12) pi prior residue probability for residue i fi,j relative frequency of residue i at position j k pseudo weight (arbitrary, 1 in this case) f'i,j corrected frequency of residue i at position j Wi,j weight of residue i at position j Ii,j information of residue i at position j
!
fi, j' =
ni, j + pik
ni, ji=1
A
" + k
!
Ii, j = f i, j' ln
f i, j'
pi
"
# $
%
& '
!
I j = Ii, ji=1
A
"
Hertz and Stormo (1999). Identifying DNA and protein patterns with statistically significant alignments of multiple sequences. Bioinformatics 15: 563-77. PMID 10487864
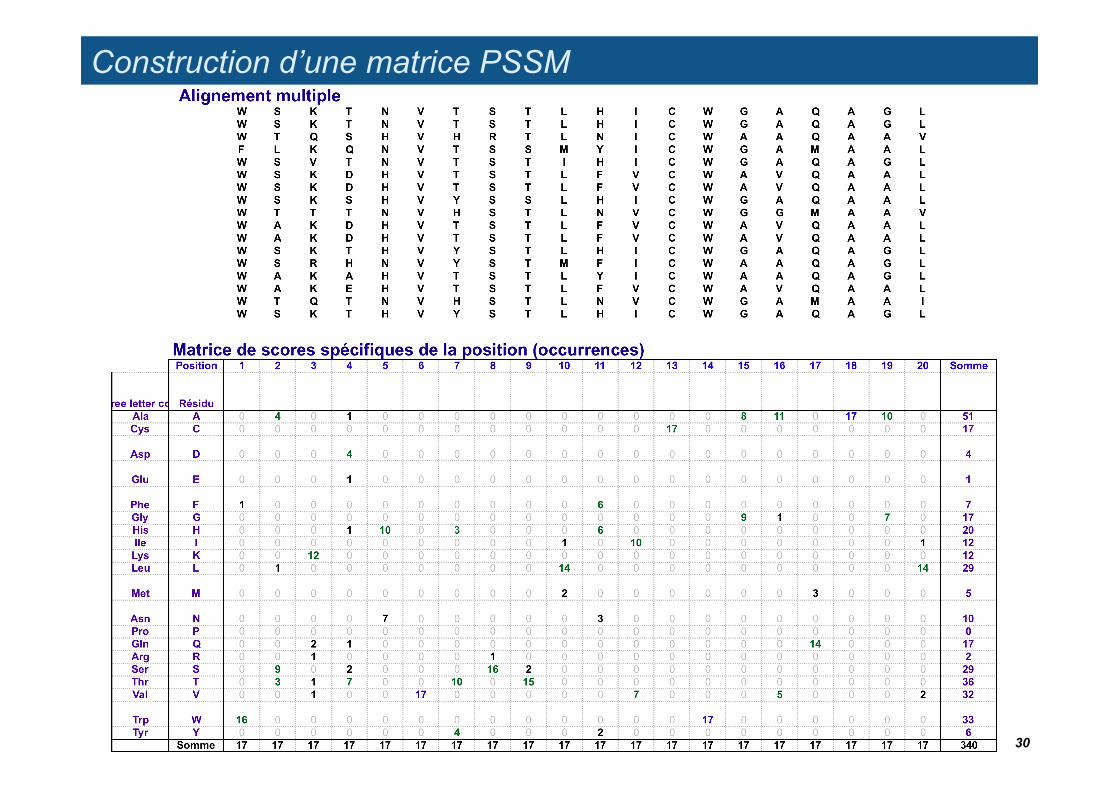
Construction d’une matrice PSSM
30
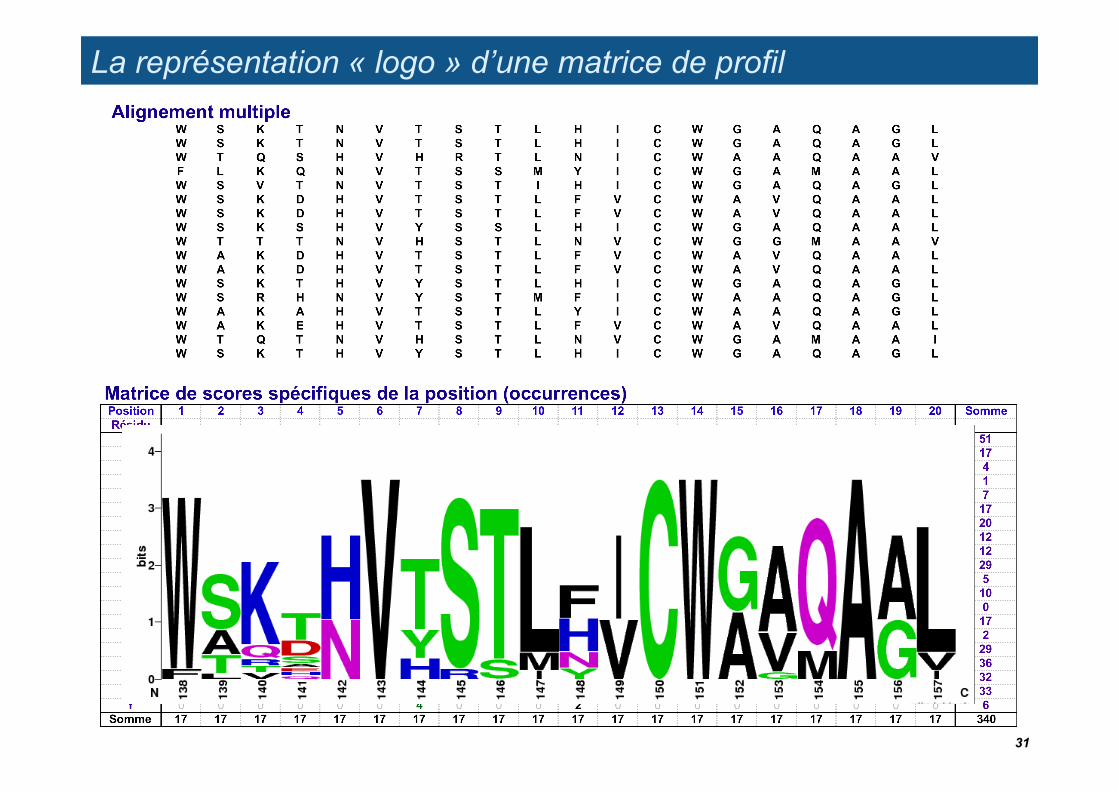
La représentation « logo » d’une matrice de profil
31
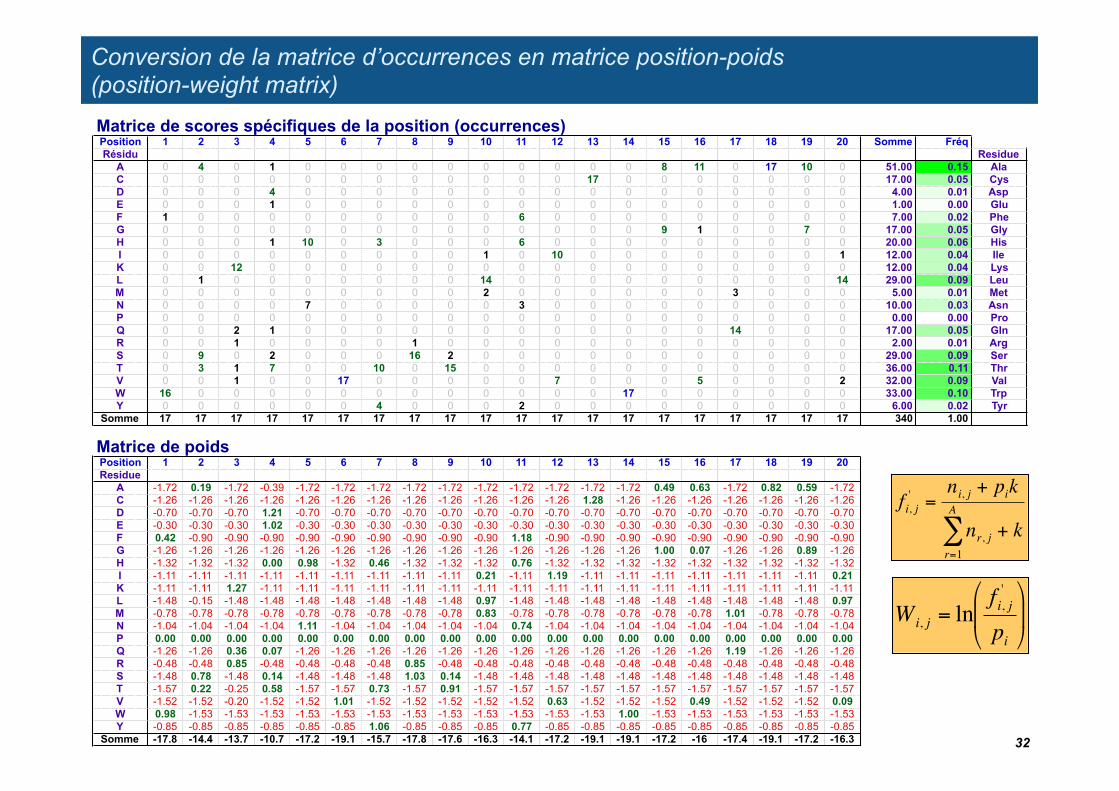
Conversion de la matrice d’occurrences en matrice position-poids (position-weight matrix)
!
Wi, j = lnfi, j'
pi
"
# $
%
& '
!
fi, j' =
ni, j + pik
nr, jr=1
A
" + k
32
Matrice de scores spécifiques de la position (occurrences)Position 1 2 3 4 5 6 7 8 9 10 11 12 13 14 15 16 17 18 19 20 Somme FréqRésidu Residue
A 0 4 0 1 0 0 0 0 0 0 0 0 0 0 8 11 0 17 10 0 51.00 0.15 AlaC 0 0 0 0 0 0 0 0 0 0 0 0 17 0 0 0 0 0 0 0 17.00 0.05 CysD 0 0 0 4 0 0 0 0 0 0 0 0 0 0 0 0 0 0 0 0 4.00 0.01 AspE 0 0 0 1 0 0 0 0 0 0 0 0 0 0 0 0 0 0 0 0 1.00 0.00 GluF 1 0 0 0 0 0 0 0 0 0 6 0 0 0 0 0 0 0 0 0 7.00 0.02 PheG 0 0 0 0 0 0 0 0 0 0 0 0 0 0 9 1 0 0 7 0 17.00 0.05 GlyH 0 0 0 1 10 0 3 0 0 0 6 0 0 0 0 0 0 0 0 0 20.00 0.06 HisI 0 0 0 0 0 0 0 0 0 1 0 10 0 0 0 0 0 0 0 1 12.00 0.04 IleK 0 0 12 0 0 0 0 0 0 0 0 0 0 0 0 0 0 0 0 0 12.00 0.04 LysL 0 1 0 0 0 0 0 0 0 14 0 0 0 0 0 0 0 0 0 14 29.00 0.09 LeuM 0 0 0 0 0 0 0 0 0 2 0 0 0 0 0 0 3 0 0 0 5.00 0.01 MetN 0 0 0 0 7 0 0 0 0 0 3 0 0 0 0 0 0 0 0 0 10.00 0.03 AsnP 0 0 0 0 0 0 0 0 0 0 0 0 0 0 0 0 0 0 0 0 0.00 0.00 ProQ 0 0 2 1 0 0 0 0 0 0 0 0 0 0 0 0 14 0 0 0 17.00 0.05 GlnR 0 0 1 0 0 0 0 1 0 0 0 0 0 0 0 0 0 0 0 0 2.00 0.01 ArgS 0 9 0 2 0 0 0 16 2 0 0 0 0 0 0 0 0 0 0 0 29.00 0.09 SerT 0 3 1 7 0 0 10 0 15 0 0 0 0 0 0 0 0 0 0 0 36.00 0.11 ThrV 0 0 1 0 0 17 0 0 0 0 0 7 0 0 0 5 0 0 0 2 32.00 0.09 ValW 16 0 0 0 0 0 0 0 0 0 0 0 0 17 0 0 0 0 0 0 33.00 0.10 TrpY 0 0 0 0 0 0 4 0 0 0 2 0 0 0 0 0 0 0 0 0 6.00 0.02 Tyr
Somme 17 17 17 17 17 17 17 17 17 17 17 17 17 17 17 17 17 17 17 17 340 1.00
Matrice de poidsPosition 1 2 3 4 5 6 7 8 9 10 11 12 13 14 15 16 17 18 19 20Residue
A -1.72 0.19 -1.72 -0.39 -1.72 -1.72 -1.72 -1.72 -1.72 -1.72 -1.72 -1.72 -1.72 -1.72 0.49 0.63 -1.72 0.82 0.59 -1.72C -1.26 -1.26 -1.26 -1.26 -1.26 -1.26 -1.26 -1.26 -1.26 -1.26 -1.26 -1.26 1.28 -1.26 -1.26 -1.26 -1.26 -1.26 -1.26 -1.26D -0.70 -0.70 -0.70 1.21 -0.70 -0.70 -0.70 -0.70 -0.70 -0.70 -0.70 -0.70 -0.70 -0.70 -0.70 -0.70 -0.70 -0.70 -0.70 -0.70E -0.30 -0.30 -0.30 1.02 -0.30 -0.30 -0.30 -0.30 -0.30 -0.30 -0.30 -0.30 -0.30 -0.30 -0.30 -0.30 -0.30 -0.30 -0.30 -0.30F 0.42 -0.90 -0.90 -0.90 -0.90 -0.90 -0.90 -0.90 -0.90 -0.90 1.18 -0.90 -0.90 -0.90 -0.90 -0.90 -0.90 -0.90 -0.90 -0.90G -1.26 -1.26 -1.26 -1.26 -1.26 -1.26 -1.26 -1.26 -1.26 -1.26 -1.26 -1.26 -1.26 -1.26 1.00 0.07 -1.26 -1.26 0.89 -1.26H -1.32 -1.32 -1.32 0.00 0.98 -1.32 0.46 -1.32 -1.32 -1.32 0.76 -1.32 -1.32 -1.32 -1.32 -1.32 -1.32 -1.32 -1.32 -1.32I -1.11 -1.11 -1.11 -1.11 -1.11 -1.11 -1.11 -1.11 -1.11 0.21 -1.11 1.19 -1.11 -1.11 -1.11 -1.11 -1.11 -1.11 -1.11 0.21K -1.11 -1.11 1.27 -1.11 -1.11 -1.11 -1.11 -1.11 -1.11 -1.11 -1.11 -1.11 -1.11 -1.11 -1.11 -1.11 -1.11 -1.11 -1.11 -1.11L -1.48 -0.15 -1.48 -1.48 -1.48 -1.48 -1.48 -1.48 -1.48 0.97 -1.48 -1.48 -1.48 -1.48 -1.48 -1.48 -1.48 -1.48 -1.48 0.97M -0.78 -0.78 -0.78 -0.78 -0.78 -0.78 -0.78 -0.78 -0.78 0.83 -0.78 -0.78 -0.78 -0.78 -0.78 -0.78 1.01 -0.78 -0.78 -0.78N -1.04 -1.04 -1.04 -1.04 1.11 -1.04 -1.04 -1.04 -1.04 -1.04 0.74 -1.04 -1.04 -1.04 -1.04 -1.04 -1.04 -1.04 -1.04 -1.04P 0.00 0.00 0.00 0.00 0.00 0.00 0.00 0.00 0.00 0.00 0.00 0.00 0.00 0.00 0.00 0.00 0.00 0.00 0.00 0.00Q -1.26 -1.26 0.36 0.07 -1.26 -1.26 -1.26 -1.26 -1.26 -1.26 -1.26 -1.26 -1.26 -1.26 -1.26 -1.26 1.19 -1.26 -1.26 -1.26R -0.48 -0.48 0.85 -0.48 -0.48 -0.48 -0.48 0.85 -0.48 -0.48 -0.48 -0.48 -0.48 -0.48 -0.48 -0.48 -0.48 -0.48 -0.48 -0.48S -1.48 0.78 -1.48 0.14 -1.48 -1.48 -1.48 1.03 0.14 -1.48 -1.48 -1.48 -1.48 -1.48 -1.48 -1.48 -1.48 -1.48 -1.48 -1.48T -1.57 0.22 -0.25 0.58 -1.57 -1.57 0.73 -1.57 0.91 -1.57 -1.57 -1.57 -1.57 -1.57 -1.57 -1.57 -1.57 -1.57 -1.57 -1.57V -1.52 -1.52 -0.20 -1.52 -1.52 1.01 -1.52 -1.52 -1.52 -1.52 -1.52 0.63 -1.52 -1.52 -1.52 0.49 -1.52 -1.52 -1.52 0.09W 0.98 -1.53 -1.53 -1.53 -1.53 -1.53 -1.53 -1.53 -1.53 -1.53 -1.53 -1.53 -1.53 1.00 -1.53 -1.53 -1.53 -1.53 -1.53 -1.53Y -0.85 -0.85 -0.85 -0.85 -0.85 -0.85 1.06 -0.85 -0.85 -0.85 0.77 -0.85 -0.85 -0.85 -0.85 -0.85 -0.85 -0.85 -0.85 -0.85
Somme -17.8 -14.4 -13.7 -10.7 -17.2 -19.1 -15.7 -17.8 -17.6 -16.3 -14.1 -17.2 -19.1 -19.1 -17.2 -16 -17.4 -19.1 -17.2 -16.3
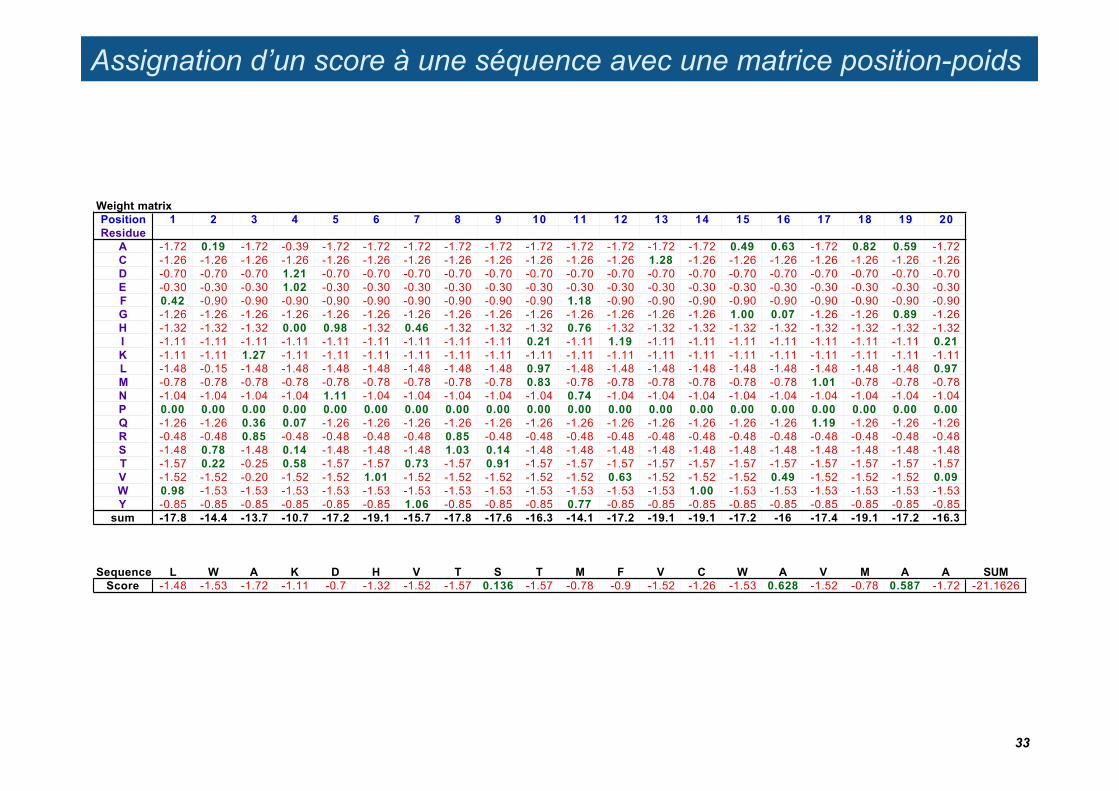
Assignation d’un score à une séquence avec une matrice position-poids
Weight matrixPosition 1 2 3 4 5 6 7 8 9 10 11 12 13 14 15 16 17 18 19 20Residue
A -1.72 0.19 -1.72 -0.39 -1.72 -1.72 -1.72 -1.72 -1.72 -1.72 -1.72 -1.72 -1.72 -1.72 0.49 0.63 -1.72 0.82 0.59 -1.72C -1.26 -1.26 -1.26 -1.26 -1.26 -1.26 -1.26 -1.26 -1.26 -1.26 -1.26 -1.26 1.28 -1.26 -1.26 -1.26 -1.26 -1.26 -1.26 -1.26D -0.70 -0.70 -0.70 1.21 -0.70 -0.70 -0.70 -0.70 -0.70 -0.70 -0.70 -0.70 -0.70 -0.70 -0.70 -0.70 -0.70 -0.70 -0.70 -0.70E -0.30 -0.30 -0.30 1.02 -0.30 -0.30 -0.30 -0.30 -0.30 -0.30 -0.30 -0.30 -0.30 -0.30 -0.30 -0.30 -0.30 -0.30 -0.30 -0.30F 0.42 -0.90 -0.90 -0.90 -0.90 -0.90 -0.90 -0.90 -0.90 -0.90 1.18 -0.90 -0.90 -0.90 -0.90 -0.90 -0.90 -0.90 -0.90 -0.90G -1.26 -1.26 -1.26 -1.26 -1.26 -1.26 -1.26 -1.26 -1.26 -1.26 -1.26 -1.26 -1.26 -1.26 1.00 0.07 -1.26 -1.26 0.89 -1.26H -1.32 -1.32 -1.32 0.00 0.98 -1.32 0.46 -1.32 -1.32 -1.32 0.76 -1.32 -1.32 -1.32 -1.32 -1.32 -1.32 -1.32 -1.32 -1.32I -1.11 -1.11 -1.11 -1.11 -1.11 -1.11 -1.11 -1.11 -1.11 0.21 -1.11 1.19 -1.11 -1.11 -1.11 -1.11 -1.11 -1.11 -1.11 0.21K -1.11 -1.11 1.27 -1.11 -1.11 -1.11 -1.11 -1.11 -1.11 -1.11 -1.11 -1.11 -1.11 -1.11 -1.11 -1.11 -1.11 -1.11 -1.11 -1.11L -1.48 -0.15 -1.48 -1.48 -1.48 -1.48 -1.48 -1.48 -1.48 0.97 -1.48 -1.48 -1.48 -1.48 -1.48 -1.48 -1.48 -1.48 -1.48 0.97M -0.78 -0.78 -0.78 -0.78 -0.78 -0.78 -0.78 -0.78 -0.78 0.83 -0.78 -0.78 -0.78 -0.78 -0.78 -0.78 1.01 -0.78 -0.78 -0.78N -1.04 -1.04 -1.04 -1.04 1.11 -1.04 -1.04 -1.04 -1.04 -1.04 0.74 -1.04 -1.04 -1.04 -1.04 -1.04 -1.04 -1.04 -1.04 -1.04P 0.00 0.00 0.00 0.00 0.00 0.00 0.00 0.00 0.00 0.00 0.00 0.00 0.00 0.00 0.00 0.00 0.00 0.00 0.00 0.00Q -1.26 -1.26 0.36 0.07 -1.26 -1.26 -1.26 -1.26 -1.26 -1.26 -1.26 -1.26 -1.26 -1.26 -1.26 -1.26 1.19 -1.26 -1.26 -1.26R -0.48 -0.48 0.85 -0.48 -0.48 -0.48 -0.48 0.85 -0.48 -0.48 -0.48 -0.48 -0.48 -0.48 -0.48 -0.48 -0.48 -0.48 -0.48 -0.48S -1.48 0.78 -1.48 0.14 -1.48 -1.48 -1.48 1.03 0.14 -1.48 -1.48 -1.48 -1.48 -1.48 -1.48 -1.48 -1.48 -1.48 -1.48 -1.48T -1.57 0.22 -0.25 0.58 -1.57 -1.57 0.73 -1.57 0.91 -1.57 -1.57 -1.57 -1.57 -1.57 -1.57 -1.57 -1.57 -1.57 -1.57 -1.57V -1.52 -1.52 -0.20 -1.52 -1.52 1.01 -1.52 -1.52 -1.52 -1.52 -1.52 0.63 -1.52 -1.52 -1.52 0.49 -1.52 -1.52 -1.52 0.09W 0.98 -1.53 -1.53 -1.53 -1.53 -1.53 -1.53 -1.53 -1.53 -1.53 -1.53 -1.53 -1.53 1.00 -1.53 -1.53 -1.53 -1.53 -1.53 -1.53Y -0.85 -0.85 -0.85 -0.85 -0.85 -0.85 1.06 -0.85 -0.85 -0.85 0.77 -0.85 -0.85 -0.85 -0.85 -0.85 -0.85 -0.85 -0.85 -0.85
sum -17.8 -14.4 -13.7 -10.7 -17.2 -19.1 -15.7 -17.8 -17.6 -16.3 -14.1 -17.2 -19.1 -19.1 -17.2 -16 -17.4 -19.1 -17.2 -16.3
Sequence L W A K D H V T S T M F V C W A V M A A SUMScore -1.48 -1.53 -1.72 -1.11 -0.7 -1.32 -1.52 -1.57 0.136 -1.57 -0.78 -0.9 -1.52 -1.26 -1.53 0.628 -1.52 -0.78 0.587 -1.72 -21.1626
33
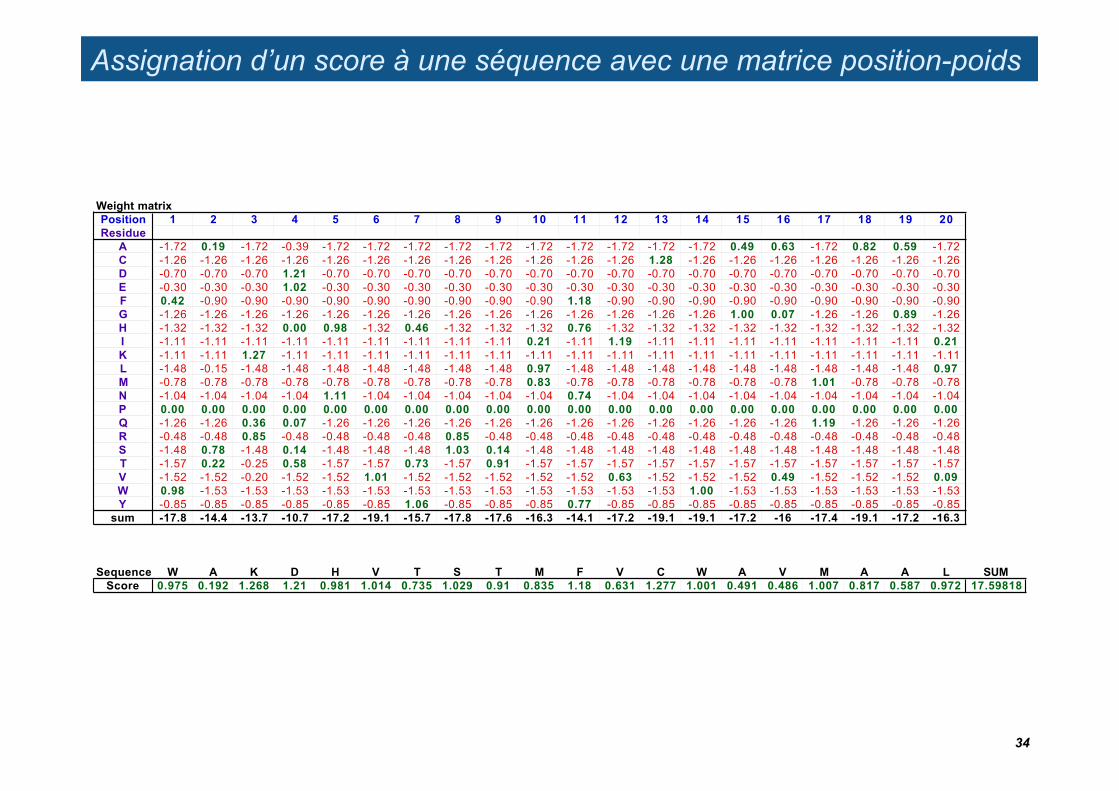
Assignation d’un score à une séquence avec une matrice position-poids
Weight matrixPosition 1 2 3 4 5 6 7 8 9 10 11 12 13 14 15 16 17 18 19 20Residue
A -1.72 0.19 -1.72 -0.39 -1.72 -1.72 -1.72 -1.72 -1.72 -1.72 -1.72 -1.72 -1.72 -1.72 0.49 0.63 -1.72 0.82 0.59 -1.72C -1.26 -1.26 -1.26 -1.26 -1.26 -1.26 -1.26 -1.26 -1.26 -1.26 -1.26 -1.26 1.28 -1.26 -1.26 -1.26 -1.26 -1.26 -1.26 -1.26D -0.70 -0.70 -0.70 1.21 -0.70 -0.70 -0.70 -0.70 -0.70 -0.70 -0.70 -0.70 -0.70 -0.70 -0.70 -0.70 -0.70 -0.70 -0.70 -0.70E -0.30 -0.30 -0.30 1.02 -0.30 -0.30 -0.30 -0.30 -0.30 -0.30 -0.30 -0.30 -0.30 -0.30 -0.30 -0.30 -0.30 -0.30 -0.30 -0.30F 0.42 -0.90 -0.90 -0.90 -0.90 -0.90 -0.90 -0.90 -0.90 -0.90 1.18 -0.90 -0.90 -0.90 -0.90 -0.90 -0.90 -0.90 -0.90 -0.90G -1.26 -1.26 -1.26 -1.26 -1.26 -1.26 -1.26 -1.26 -1.26 -1.26 -1.26 -1.26 -1.26 -1.26 1.00 0.07 -1.26 -1.26 0.89 -1.26H -1.32 -1.32 -1.32 0.00 0.98 -1.32 0.46 -1.32 -1.32 -1.32 0.76 -1.32 -1.32 -1.32 -1.32 -1.32 -1.32 -1.32 -1.32 -1.32I -1.11 -1.11 -1.11 -1.11 -1.11 -1.11 -1.11 -1.11 -1.11 0.21 -1.11 1.19 -1.11 -1.11 -1.11 -1.11 -1.11 -1.11 -1.11 0.21K -1.11 -1.11 1.27 -1.11 -1.11 -1.11 -1.11 -1.11 -1.11 -1.11 -1.11 -1.11 -1.11 -1.11 -1.11 -1.11 -1.11 -1.11 -1.11 -1.11L -1.48 -0.15 -1.48 -1.48 -1.48 -1.48 -1.48 -1.48 -1.48 0.97 -1.48 -1.48 -1.48 -1.48 -1.48 -1.48 -1.48 -1.48 -1.48 0.97M -0.78 -0.78 -0.78 -0.78 -0.78 -0.78 -0.78 -0.78 -0.78 0.83 -0.78 -0.78 -0.78 -0.78 -0.78 -0.78 1.01 -0.78 -0.78 -0.78N -1.04 -1.04 -1.04 -1.04 1.11 -1.04 -1.04 -1.04 -1.04 -1.04 0.74 -1.04 -1.04 -1.04 -1.04 -1.04 -1.04 -1.04 -1.04 -1.04P 0.00 0.00 0.00 0.00 0.00 0.00 0.00 0.00 0.00 0.00 0.00 0.00 0.00 0.00 0.00 0.00 0.00 0.00 0.00 0.00Q -1.26 -1.26 0.36 0.07 -1.26 -1.26 -1.26 -1.26 -1.26 -1.26 -1.26 -1.26 -1.26 -1.26 -1.26 -1.26 1.19 -1.26 -1.26 -1.26R -0.48 -0.48 0.85 -0.48 -0.48 -0.48 -0.48 0.85 -0.48 -0.48 -0.48 -0.48 -0.48 -0.48 -0.48 -0.48 -0.48 -0.48 -0.48 -0.48S -1.48 0.78 -1.48 0.14 -1.48 -1.48 -1.48 1.03 0.14 -1.48 -1.48 -1.48 -1.48 -1.48 -1.48 -1.48 -1.48 -1.48 -1.48 -1.48T -1.57 0.22 -0.25 0.58 -1.57 -1.57 0.73 -1.57 0.91 -1.57 -1.57 -1.57 -1.57 -1.57 -1.57 -1.57 -1.57 -1.57 -1.57 -1.57V -1.52 -1.52 -0.20 -1.52 -1.52 1.01 -1.52 -1.52 -1.52 -1.52 -1.52 0.63 -1.52 -1.52 -1.52 0.49 -1.52 -1.52 -1.52 0.09W 0.98 -1.53 -1.53 -1.53 -1.53 -1.53 -1.53 -1.53 -1.53 -1.53 -1.53 -1.53 -1.53 1.00 -1.53 -1.53 -1.53 -1.53 -1.53 -1.53Y -0.85 -0.85 -0.85 -0.85 -0.85 -0.85 1.06 -0.85 -0.85 -0.85 0.77 -0.85 -0.85 -0.85 -0.85 -0.85 -0.85 -0.85 -0.85 -0.85
sum -17.8 -14.4 -13.7 -10.7 -17.2 -19.1 -15.7 -17.8 -17.6 -16.3 -14.1 -17.2 -19.1 -19.1 -17.2 -16 -17.4 -19.1 -17.2 -16.3
Sequence W A K D H V T S T M F V C W A V M A A L SUMScore 0.975 0.192 1.268 1.21 0.981 1.014 0.735 1.029 0.91 0.835 1.18 0.631 1.277 1.001 0.491 0.486 1.007 0.817 0.587 0.972 17.59818
34

Assignation d’un score à une séquence avec une matrice position-poids
Weight matrixPosition 1 2 3 4 5 6 7 8 9 10 11 12 13 14 15 16 17 18 19 20Residue
A -1.72 0.19 -1.72 -0.39 -1.72 -1.72 -1.72 -1.72 -1.72 -1.72 -1.72 -1.72 -1.72 -1.72 0.49 0.63 -1.72 0.82 0.59 -1.72C -1.26 -1.26 -1.26 -1.26 -1.26 -1.26 -1.26 -1.26 -1.26 -1.26 -1.26 -1.26 1.28 -1.26 -1.26 -1.26 -1.26 -1.26 -1.26 -1.26D -0.70 -0.70 -0.70 1.21 -0.70 -0.70 -0.70 -0.70 -0.70 -0.70 -0.70 -0.70 -0.70 -0.70 -0.70 -0.70 -0.70 -0.70 -0.70 -0.70E -0.30 -0.30 -0.30 1.02 -0.30 -0.30 -0.30 -0.30 -0.30 -0.30 -0.30 -0.30 -0.30 -0.30 -0.30 -0.30 -0.30 -0.30 -0.30 -0.30F 0.42 -0.90 -0.90 -0.90 -0.90 -0.90 -0.90 -0.90 -0.90 -0.90 1.18 -0.90 -0.90 -0.90 -0.90 -0.90 -0.90 -0.90 -0.90 -0.90G -1.26 -1.26 -1.26 -1.26 -1.26 -1.26 -1.26 -1.26 -1.26 -1.26 -1.26 -1.26 -1.26 -1.26 1.00 0.07 -1.26 -1.26 0.89 -1.26H -1.32 -1.32 -1.32 0.00 0.98 -1.32 0.46 -1.32 -1.32 -1.32 0.76 -1.32 -1.32 -1.32 -1.32 -1.32 -1.32 -1.32 -1.32 -1.32I -1.11 -1.11 -1.11 -1.11 -1.11 -1.11 -1.11 -1.11 -1.11 0.21 -1.11 1.19 -1.11 -1.11 -1.11 -1.11 -1.11 -1.11 -1.11 0.21K -1.11 -1.11 1.27 -1.11 -1.11 -1.11 -1.11 -1.11 -1.11 -1.11 -1.11 -1.11 -1.11 -1.11 -1.11 -1.11 -1.11 -1.11 -1.11 -1.11L -1.48 -0.15 -1.48 -1.48 -1.48 -1.48 -1.48 -1.48 -1.48 0.97 -1.48 -1.48 -1.48 -1.48 -1.48 -1.48 -1.48 -1.48 -1.48 0.97M -0.78 -0.78 -0.78 -0.78 -0.78 -0.78 -0.78 -0.78 -0.78 0.83 -0.78 -0.78 -0.78 -0.78 -0.78 -0.78 1.01 -0.78 -0.78 -0.78N -1.04 -1.04 -1.04 -1.04 1.11 -1.04 -1.04 -1.04 -1.04 -1.04 0.74 -1.04 -1.04 -1.04 -1.04 -1.04 -1.04 -1.04 -1.04 -1.04P 0.00 0.00 0.00 0.00 0.00 0.00 0.00 0.00 0.00 0.00 0.00 0.00 0.00 0.00 0.00 0.00 0.00 0.00 0.00 0.00Q -1.26 -1.26 0.36 0.07 -1.26 -1.26 -1.26 -1.26 -1.26 -1.26 -1.26 -1.26 -1.26 -1.26 -1.26 -1.26 1.19 -1.26 -1.26 -1.26R -0.48 -0.48 0.85 -0.48 -0.48 -0.48 -0.48 0.85 -0.48 -0.48 -0.48 -0.48 -0.48 -0.48 -0.48 -0.48 -0.48 -0.48 -0.48 -0.48S -1.48 0.78 -1.48 0.14 -1.48 -1.48 -1.48 1.03 0.14 -1.48 -1.48 -1.48 -1.48 -1.48 -1.48 -1.48 -1.48 -1.48 -1.48 -1.48T -1.57 0.22 -0.25 0.58 -1.57 -1.57 0.73 -1.57 0.91 -1.57 -1.57 -1.57 -1.57 -1.57 -1.57 -1.57 -1.57 -1.57 -1.57 -1.57V -1.52 -1.52 -0.20 -1.52 -1.52 1.01 -1.52 -1.52 -1.52 -1.52 -1.52 0.63 -1.52 -1.52 -1.52 0.49 -1.52 -1.52 -1.52 0.09W 0.98 -1.53 -1.53 -1.53 -1.53 -1.53 -1.53 -1.53 -1.53 -1.53 -1.53 -1.53 -1.53 1.00 -1.53 -1.53 -1.53 -1.53 -1.53 -1.53Y -0.85 -0.85 -0.85 -0.85 -0.85 -0.85 1.06 -0.85 -0.85 -0.85 0.77 -0.85 -0.85 -0.85 -0.85 -0.85 -0.85 -0.85 -0.85 -0.85
sum -17.8 -14.4 -13.7 -10.7 -17.2 -19.1 -15.7 -17.8 -17.6 -16.3 -14.1 -17.2 -19.1 -19.1 -17.2 -16 -17.4 -19.1 -17.2 -16.3
Sequence A K D H V T S T M F V C W A V M A A L V SUMScore -1.72 -1.11 -0.7 1E-16 -1.52 -1.57 -1.48 -1.57 -0.78 -0.9 -1.52 -1.26 -1.53 -1.72 -1.52 -0.78 -1.72 0.817 -1.48 0.094 -21.9422
35
PSI-blast
PSI-BLAST
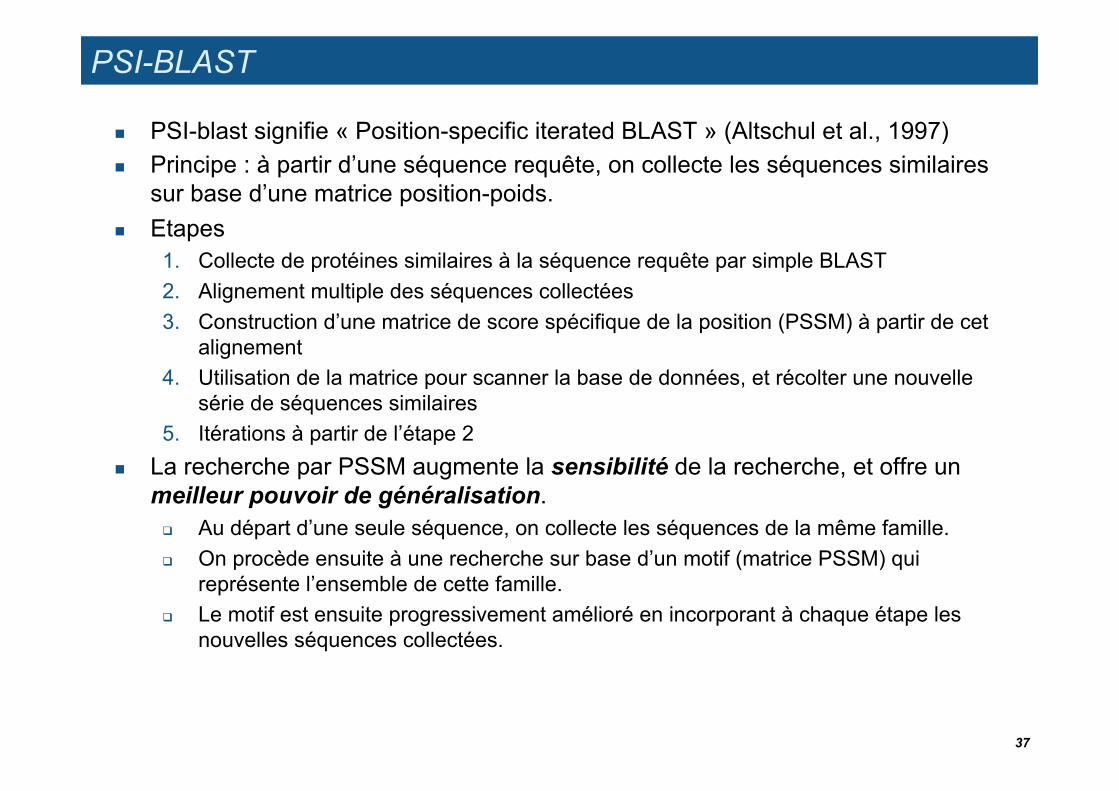
PSI-blast signifie « Position-specific iterated BLAST » (Altschul et al., 1997) Principe : à partir d’une séquence requête, on collecte les séquences similaires
sur base d’une matrice position-poids. Etapes
1. Collecte de protéines similaires à la séquence requête par simple BLAST 2. Alignement multiple des séquences collectées 3. Construction d’une matrice de score spécifique de la position (PSSM) à partir de cet
alignement 4. Utilisation de la matrice pour scanner la base de données, et récolter une nouvelle
série de séquences similaires 5. Itérations à partir de l’étape 2
La recherche par PSSM augmente la sensibilité de la recherche, et offre un meilleur pouvoir de généralisation.
Au départ d’une seule séquence, on collecte les séquences de la même famille. On procède ensuite à une recherche sur base d’un motif (matrice PSSM) qui
représente l’ensemble de cette famille. Le motif est ensuite progressivement amélioré en incorporant à chaque étape les
nouvelles séquences collectées.
37
Modèles de séquences (“background models”)
UE AMU ENSBBAU3
Introduction
Toute analyse de séquences repose sur des statistiques, et, implicitement ou explicitement, sur le choix d’un modèle pour représenter les probabilités de succession des résidus.
Modèle équiprobable: le plus simple, mais irréaliste Modèles de Bernoulli: fréquence spécifique pour chaque résidu, indépendance
entre résidus successifs Modèles de Markov: la probabilité d’un résidu dépend du ou des résidus qui le
précèdent.
39
Independent and equiprobable nucleotides
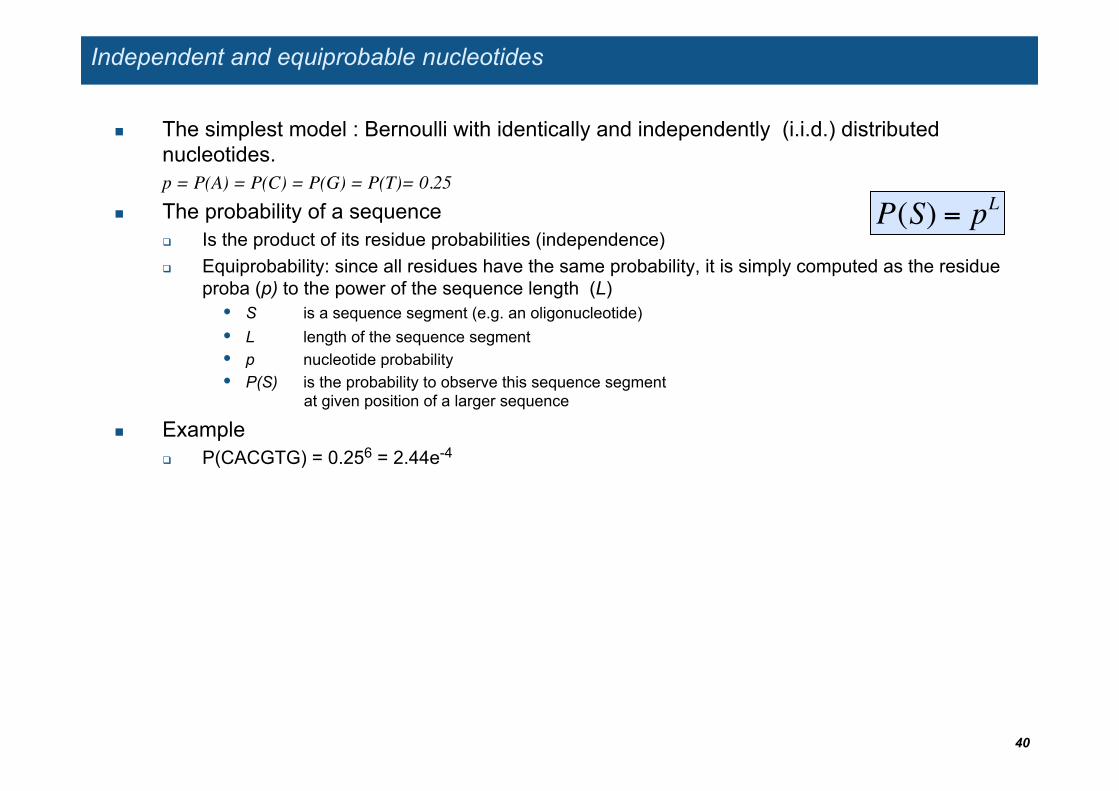
The simplest model : Bernoulli with identically and independently (i.i.d.) distributed nucleotides. p = P(A) = P(C) = P(G) = P(T)= 0.25!
The probability of a sequence Is the product of its residue probabilities (independence) Equiprobability: since all residues have the same probability, it is simply computed as the residue
proba (p) to the power of the sequence length (L) • S is a sequence segment (e.g. an oligonucleotide) • L length of the sequence segment • p nucleotide probability • P(S) is the probability to observe this sequence segment
at given position of a larger sequence
Example P(CACGTG) = 0.256 = 2.44e-4
40
!
P(S) = pL
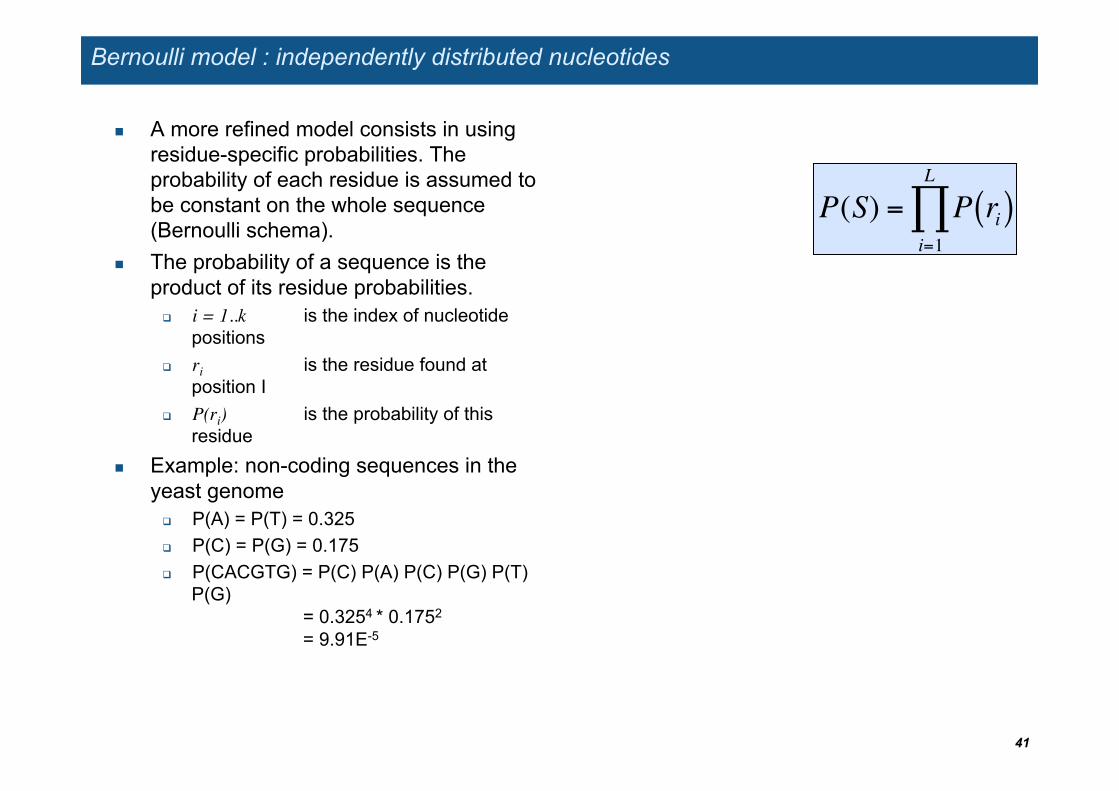
Bernoulli model : independently distributed nucleotides
A more refined model consists in using residue-specific probabilities. The probability of each residue is assumed to be constant on the whole sequence (Bernoulli schema).
The probability of a sequence is the product of its residue probabilities.
i = 1..k is the index of nucleotide positions
ri !is the residue found at position I
P(ri) !is the probability of this residue
Example: non-coding sequences in the yeast genome
P(A) = P(T) = 0.325 P(C) = P(G) = 0.175 P(CACGTG) = P(C) P(A) P(C) P(G) P(T)
P(G) = 0.3254 * 0.1752
= 9.91E-5
41
!
P(S) = P ri( )i=1
L
"
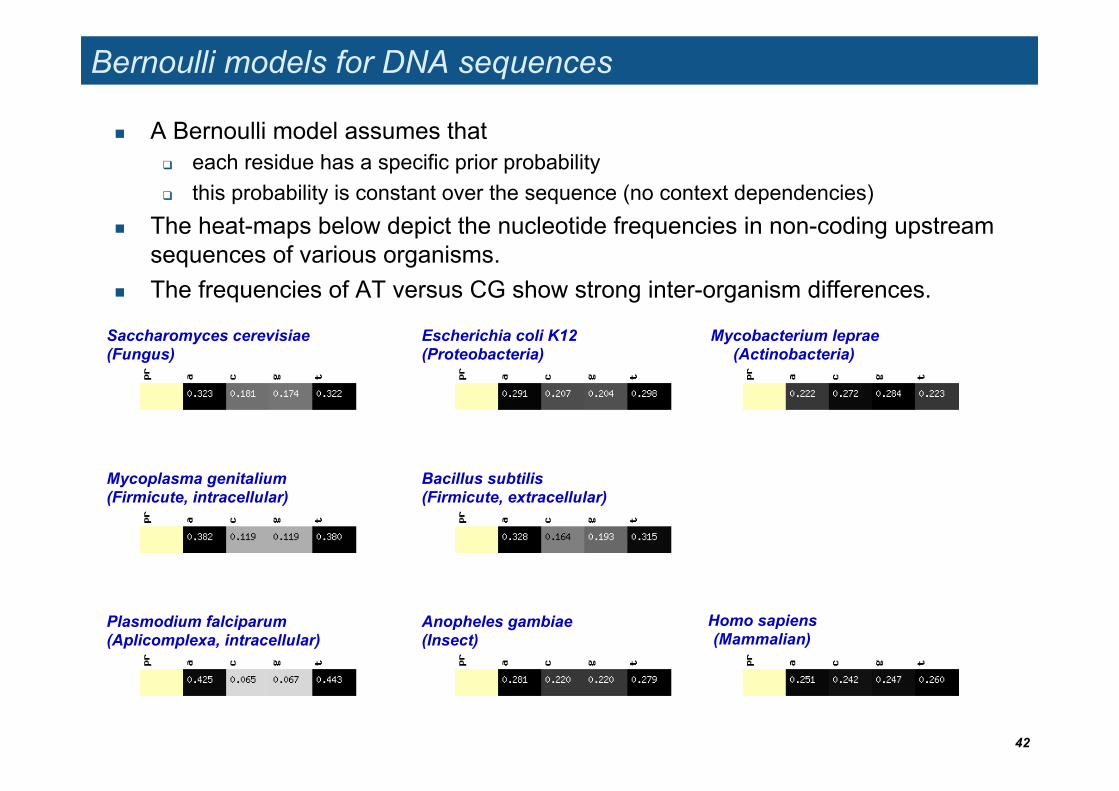
Bernoulli models for DNA sequences
A Bernoulli model assumes that each residue has a specific prior probability this probability is constant over the sequence (no context dependencies)
The heat-maps below depict the nucleotide frequencies in non-coding upstream sequences of various organisms.
The frequencies of AT versus CG show strong inter-organism differences.
42
Saccharomyces cerevisiae (Fungus)
Escherichia coli K12 (Proteobacteria)
Mycobacterium leprae (Actinobacteria)
Mycoplasma genitalium (Firmicute, intracellular)
Bacillus subtilis (Firmicute, extracellular)
Anopheles gambiae (Insect)
Homo sapiens (Mammalian)
Plasmodium falciparum (Aplicomplexa, intracellular)
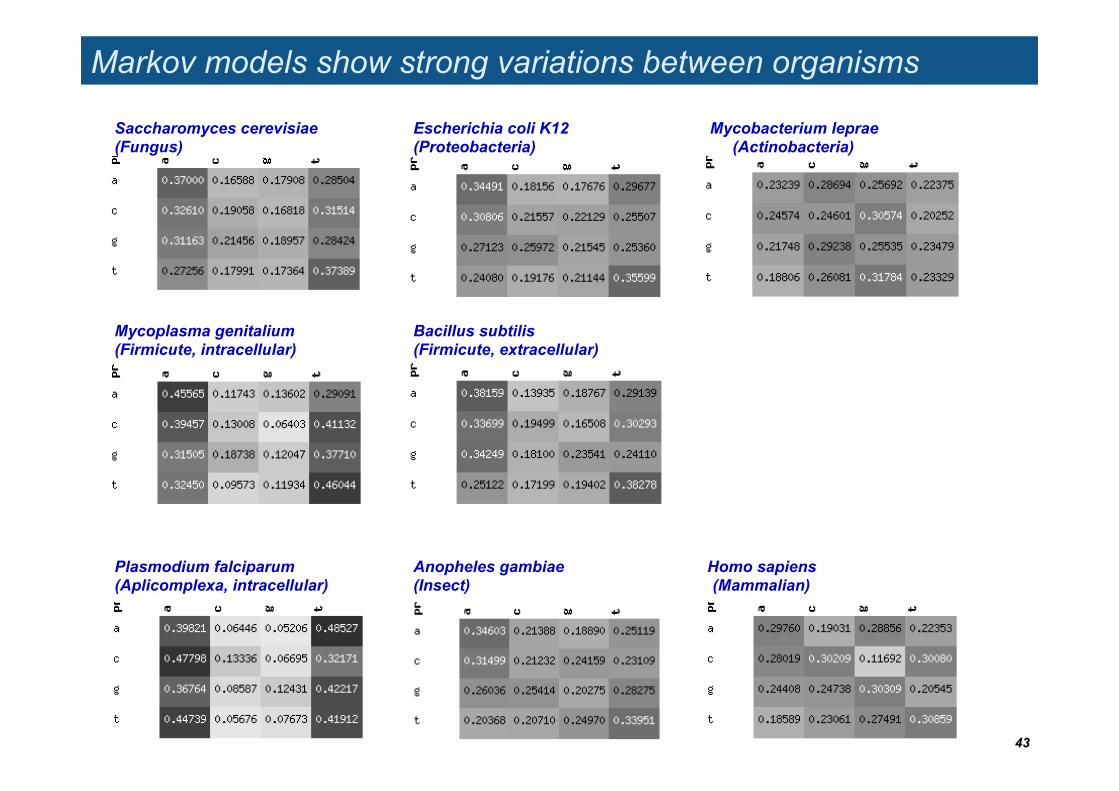
Markov models show strong variations between organisms
43
Saccharomyces cerevisiae (Fungus)
Escherichia coli K12 (Proteobacteria)
Mycobacterium leprae (Actinobacteria)
Anopheles gambiae (Insect)
Homo sapiens (Mammalian)
Mycoplasma genitalium (Firmicute, intracellular)
Bacillus subtilis (Firmicute, extracellular)
Plasmodium falciparum (Aplicomplexa, intracellular)
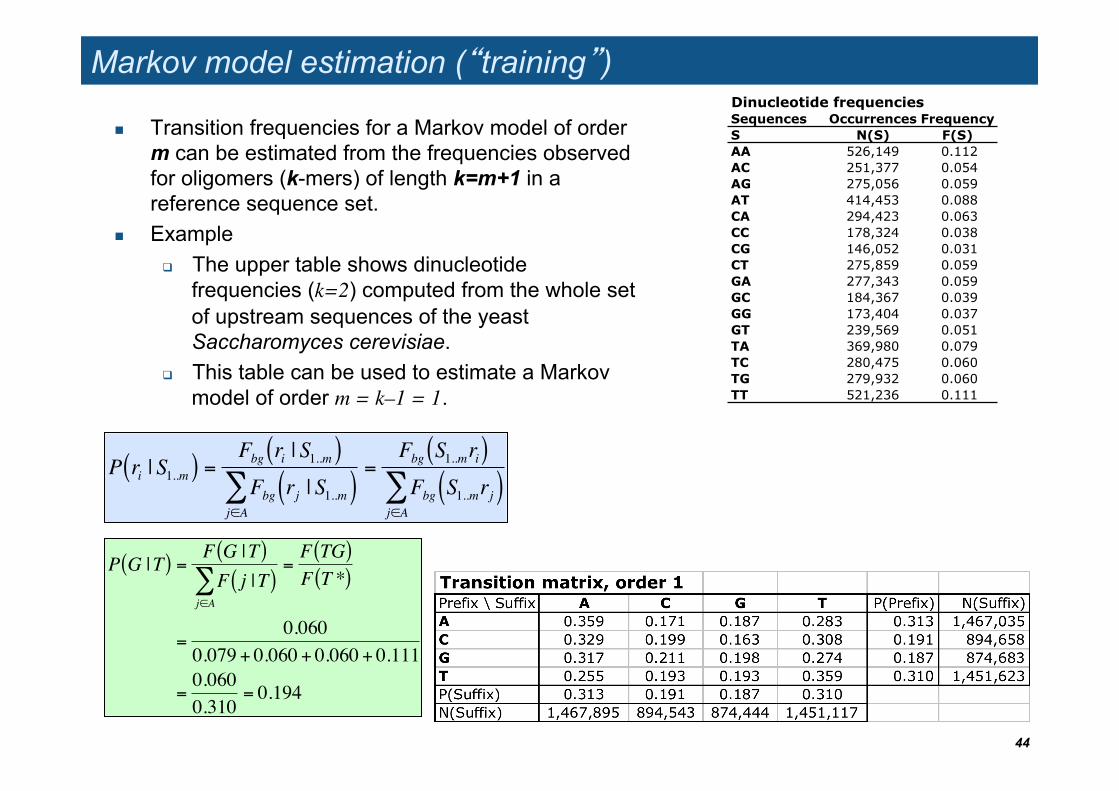
Markov model estimation (�training�)
Transition frequencies for a Markov model of order m can be estimated from the frequencies observed for oligomers (k-mers) of length k=m+1 in a reference sequence set.
Example The upper table shows dinucleotide
frequencies (k=2) computed from the whole set of upstream sequences of the yeast Saccharomyces cerevisiae.
This table can be used to estimate a Markov model of order m = k–1 = 1.
44
!
P ri | S1..m( ) =Fbg ri | S1..m( )Fbg rj | S1..m( )
j"A#
=Fbg S1..mri( )Fbg S1..mrj( )
j"A#
Dinucleotide frequenciesSequences Occurrences Frequency S N(S) F(S) AA 526,149 0.112AC 251,377 0.054AG 275,056 0.059AT 414,453 0.088CA 294,423 0.063CC 178,324 0.038CG 146,052 0.031CT 275,859 0.059GA 277,343 0.059GC 184,367 0.039GG 173,404 0.037GT 239,569 0.051TA 369,980 0.079TC 280,475 0.060TG 279,932 0.060TT 521,236 0.111
Exercise: estimate P(G|T) from the dinucleotide frequency table
!
P G |T( ) =F G |T( )F j |T( )
j"A#
=F TG( )F T *( )
=0.060
0.079 + 0.060 + 0.060 + 0.111
=0.0600.310
= 0.194
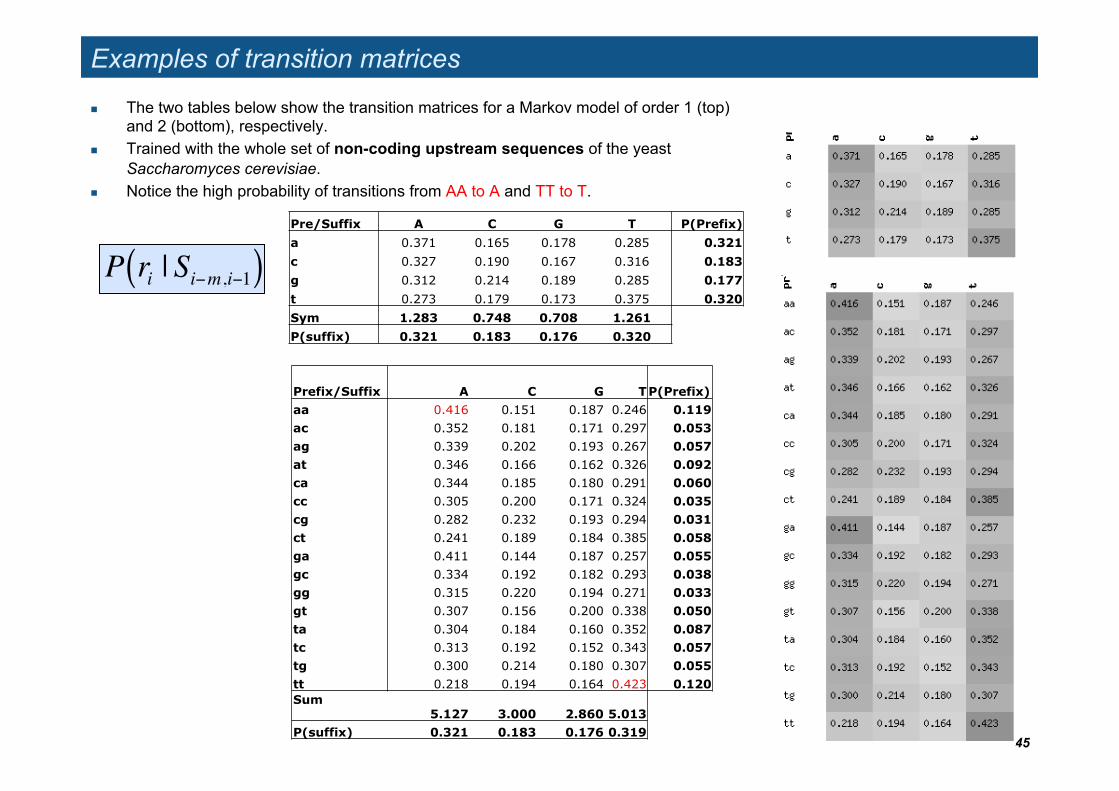
Examples of transition matrices
The two tables below show the transition matrices for a Markov model of order 1 (top) and 2 (bottom), respectively.
Trained with the whole set of non-coding upstream sequences of the yeast Saccharomyces cerevisiae.
Notice the high probability of transitions from AA to A and TT to T.
45
!
P ri | Si"m,i"1( )
Prefix/Suffix A C G T P(Prefix) aa 0.416 0.151 0.187 0.246 0.119 ac 0.352 0.181 0.171 0.297 0.053 ag 0.339 0.202 0.193 0.267 0.057 at 0.346 0.166 0.162 0.326 0.092 ca 0.344 0.185 0.180 0.291 0.060 cc 0.305 0.200 0.171 0.324 0.035 cg 0.282 0.232 0.193 0.294 0.031 ct 0.241 0.189 0.184 0.385 0.058 ga 0.411 0.144 0.187 0.257 0.055 gc 0.334 0.192 0.182 0.293 0.038 gg 0.315 0.220 0.194 0.271 0.033 gt 0.307 0.156 0.200 0.338 0.050 ta 0.304 0.184 0.160 0.352 0.087 tc 0.313 0.192 0.152 0.343 0.057 tg 0.300 0.214 0.180 0.307 0.055 tt 0.218 0.194 0.164 0.423 0.120 Sum 5.127 3.000 2.860 5.013 P(suffix) 0.321 0.183 0.176 0.319
Pre/Suffix A C G T P(Prefix) a 0.371 0.165 0.178 0.285 0.321 c 0.327 0.190 0.167 0.316 0.183 g 0.312 0.214 0.189 0.285 0.177 t 0.273 0.179 0.173 0.375 0.320 Sym 1.283 0.748 0.708 1.261 P(suffix) 0.321 0.183 0.176 0.320
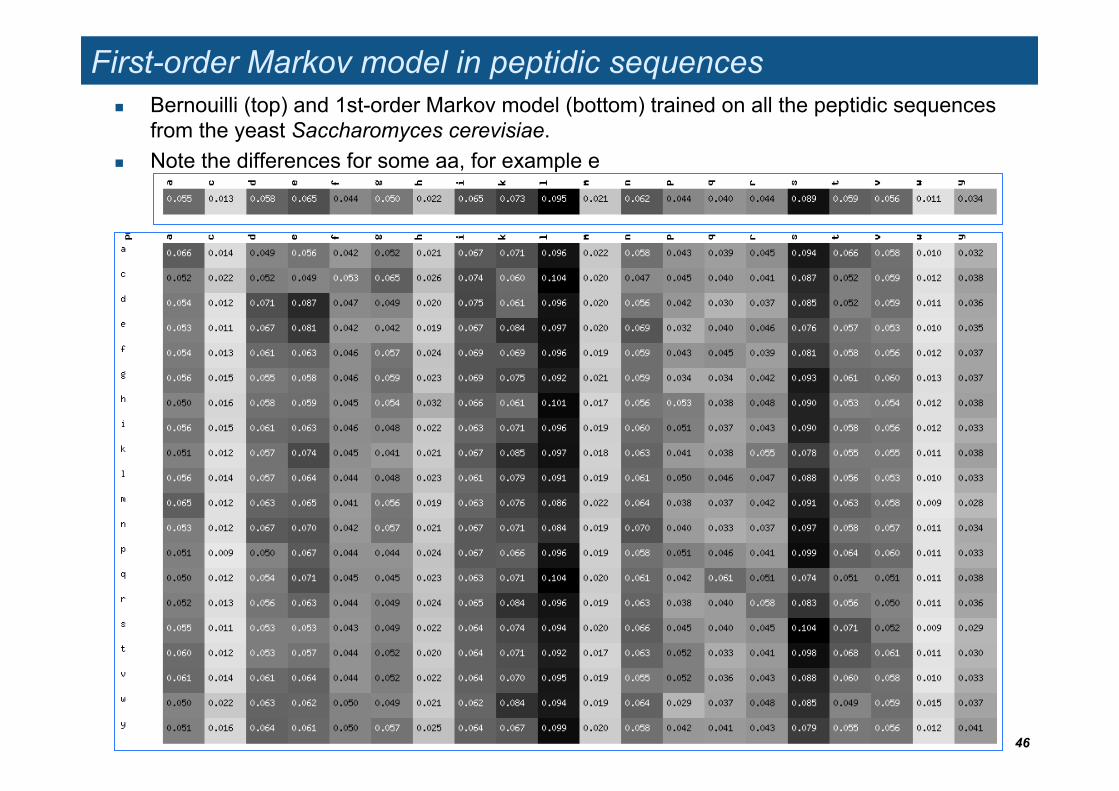
First-order Markov model in peptidic sequences Bernouilli (top) and 1st-order Markov model (bottom) trained on all the peptidic sequences
from the yeast Saccharomyces cerevisiae. Note the differences for some aa, for example e
46

Outils bioinformatiques
Outils bioinformatiques utilisés pour le TD « motifs »
Uniprot Base de données de protéines BLAST recherche de séquences dans les bases de données MEME découverte de motifs à partir d’une famille de séquences MAST recherche de motifs dans les séquences PSI-BLAST position-specific iterative BLAST RSAT Regulatory Sequence Analysis Tools
48
Références
Matrices de substitutions PAM series
• Dayhoff, M. O., Schwartz, R. M. & Orcutt, B. (1978). A model of evolutionary change in proteins. Atlas of Protein Sequence and Structure 5, 345--352.
BLOSUM substitution matrices • Henikoff, S. & Henikoff, J. G. (1992). Amino acid substitution matrices from protein blocks. Proc Natl Acad Sci U S A 89, 10915-9.
Gonnet matrices, built by an iterative procedure • Gonnet, G. H., Cohen, M. A. & Benner, S. A. (1992). Exhaustive matching of the entire protein sequence database. Science 256,
1443-5. 1.
Algorithmes d’alignement de séquences Needleman-Wunsch (pairwise, global)
• Needleman, S. B. & Wunsch, C. D. (1970). A general method applicable to the search for similarities in the amino acid sequence of two proteins. J Mol Biol 48, 443-53.
Smith-Waterman (pairwise, local) • Smith, T. F. & Waterman, M. S. (1981). Identification of common molecular subsequences. J Mol Biol 147, 195-7.
FastA (database searches, pairwise, local) • W. R. Pearson and D. J. Lipman. Improved tools for biological sequence comparison. Proc. Natl. Acad. Sci. USA, 85:2444–2448,
1988. BLAST (database searches, pairwise, local)
• S. F. Altschul, W. Gish, W. Miller, E. W. Myers, and D. J. Lipman. A basic local alignment search tool. J. Mol. Biol., 215:403–410, 1990.
• S. F. Altschul, T. L. Madden, A. A. Schaffer, J. Zhang, Z. Zhang, W. Miller, and D. J. Lipman. Gapped BLAST and PSI-BLAST: a new generation of protein database search programs Nucleic Acids Res., 25:3389–3402, 1997.
Clustal (multiple, global) • Higgins, D. G. & Sharp, P. M. (1988). CLUSTAL: a package for performing multiple sequence alignment on a microcomputer. Gene
73, 237-44. • Higgins, D. G., Thompson, J. D. & Gibson, T. J. (1996). Using CLUSTAL for multiple sequence alignments. Methods Enzymol 266,
383-402. Dialign (multiple, local)
• Morgenstern, B., Frech, K., Dress, A. & Werner, T. (1998). DIALIGN: finding local similarities by multiple sequence alignment. Bioinformatics 14, 290-4.
MUSCLE (multiple local)
49


