
DANIEL PAULybInternational Center for Living
Aquatic Resources ManagementMCPO Box 2631, 0718 Makati City
Philippines
PAULY, D. 1996. Biodiversity and the retrospective analysis of demersal trawl surveys: a programmatic approach {Keanekaragaman hayatidan telaah ke belakang survei trawl ikan-ikan demersal: suatu pendekatan programatik], p. 1-6. In D. Pauly and P. Martosubroto(eds.) Baseline studies of biodiversity: the fish resources of Western Indonesia. ICLARM Stud. Rev. 23, 312 p.
Abstract
Demersal trawl surveys of tropical shelves were conducted with increasing frequency and sophistication since the 1920s. Designedoriginally for the purposes of resources and national development, these surveys are now seen to be ideally suited for reinterpretation asbiodiversity baseline studies. The conceptual and practical steps required for this are outlined and illustrated with sample surveys conductedfrom the mid-1970s to the early 1980s in Western Indonesia.
Abstrak
Survei trawl ikan-ikan demersal di paparan daerah tropis semakin sering dilaksanakan dan bahkan dengan peralatan yang semakincanggih sejak tahun 1920-an. Pada awalnya survei tersebut dirancang dalam rangka pengembangan sumberdaya nasional, namun kemudiansurvei semacam ini dianggap ideal untuk penelaahan ke belakang sebagai studi dasar keanekaragaman hayati. Langkah-langkah praktisdan terencana yang dilaksanakan dalam survei ini dipaparkan dan digambarkan dengan beberapa survei contoh dalam periode 1970-ansampai 1980-an di perairan Indonesia bagian barat.
Introduction
About 90% of the world fisheries catches originate from for the AN Mutiara 4 surveys (see Pauly et al., this vol. andshelves, i.e., from the shallow waters -down to 200 m Venema, this vol.), the latter through the statistically moresurrounding continents and islands. Of this, the overwhelming powerful randomization of the position of hauls as for the RNbulk stems from softbottom, rather than rocky grounds, or reefs, Fridtjof Nansensurveys (see Bianchi, this vol.). The statistical
i.e., from trawlable areas (Gulland 1971; Pauly and Christensen power of random survey can be further increased through
1993). stratification, a topic that need not concern us here (but seeDemersal trawl surveys certainly represent the most contributions in Doubleday and Rivard 1981; Pauly 1984).
straightforward way of finding how much and what kind of fish Important here, rather, is that demersal trawl surveys,occur in a given softbottom area -not least because they use though affected by mesh selection and gear avoidance,a gear type (demersal trawls) -initially developed for represent an effective method for obtaining representativecommercial fishing. samples of a (bottom) fish community, covering a wide range
Depending on the distributions of their "stations" (or of sizes, far more so than for other gears deployed to catch"drags" or "hauls"), three types of surveys may be distinguished: coral reef fishes or pelagic fishes, not to speak of gears for
.opportunistic, catching terrestrial vertebrates..systematic and This evidently is the reason why trawl surveys are.(stratified) random. conducted to assess the potentia! of fisheries and to monitorThe first of these, mainly of historical interest, consists of them, once they have developed. Moreover, and this is the
a research vessel (e.g., the Beagle, or the Challenger) fishing theme of this contribution, trawl surveys, conducted severaloccasionally. but without aiming at representative coverage. decades ago to estimate demersal fish biomasses, i.e., toSystematic and random surveys differ from opportunistic provide the basis for the development of demersal fisheriessurveys in that both are planned to cover a given area, the can be turned, through appropriate retrospective analyses. intoformer through series of hauls placed along parallel lines as baseline studies for coastal biodiversity, and thus to help meet
a contemporary challenge.alCLARM Contribution No. 1314.bAnother contact address: Fisheries Centre, the University of British Columbia,2204 Main Mall, Vancouver. B.C. Canada V6T 1Z4; e-mail: [email protected]

Before presenting the elements required for thisreconceptualization, I shall recall, however, the key elements
of the "developmenf' approach prevailing two to three decadesago, when several major surveys were conducted, both in thetropics, e.g., the Guinean trawling survey in West Africa(Williams 1968), the Gulf of Thailand surveys (Ritragsa 1976),the AN Anton Bruun surveys along the Indian Ocean coast(Hida and Pereyra 1966), and in the cold waters of the North
Pacific (Alverson and Pereyra 1972).
small-scale fisheries and a need to reconceptualize the entirearea of fisheries research and development (Pauly 1979; Pope
1979; Beddington and May 1982; Pauly et al. 1989a; Christy1993; Pauly 1994, in press; Garcia and Newton, 1995).
The above-described trawl surveys did have positive
aspects, however, mainly derived from the nature of trawl haulsas representative samples of demersal fish communities. Thus,the efforts that went into items (2) and (3) led to these surveys
providing extremely detailed samples of then largely unfishedcommunities -just what is now needed to serve as baselinefor biodiversity studies.Demersal Surveys as Stepping Stones
for DevelopmentBiodiversity Studies and Their Shifting Baseline
Numerous studies attest to the tremendous impact ofdirect resource uses, and of habitat destruction on biodiversity-an impact that has accelerated recently, but which has
occurred everywhere humans were numerous enough, andhad the tools and/or the time to modify those parts of nature
surrounding them.Assessing this impact requires comparisons with some
baseline -usually, and almost by definition the oldest availablesurvey. This choice is justified by the fact that, given a continuedimpact, the more recent the baseline survey one uses, the moreit will have shifted toward the present, more impacted situation,
and the more human impacts will be underestimated (Pauly
1995).Conversely, the older the study or survey one uses as
baseline, the less the impacts will be underestimated, with allthat this implies for attributing value to conservation measures,rehabilitation programs, etc.
Therein lies the worth of old trawl surveys, if their agedoes not imply a loss of reliability: the theme of the next section.
Retrospective Analyses of Tra,wl Data:the Issue of Quality
Demersal surveys, in the 19605-19705, consisted of the
following major elements:1. Conduct survey (systematic, later random) in a given
area, with funds from development agencies.2. Have on board the best available field biologists, both
from the donor and the surveyed countries,complemented by experts on the taxonomy of the
groups covered (and publish fish identification guides
if deemed appropriate).3. Identity and measure the entire catch of each haul,
and collect additional data on length composition,maturity stages, stomach contents, etc.
4. Estimate total unexploited biomass (Bo) and estimate
"potential yield" (P y) using the so-called "Gullandequation" now known to generate overestimates
(Beddington and Cooke 1983), i.e.,
Py=O.5.M.Bo ...1)where M is the natural mortality (Gulland 1971);
5. Write a few papers on the biology of some of the fish,
based on the data in (3) and (4);6. Leave one of the data sets in a laboratory of the
surveyed country, and bring back the other set(s) to a
laboratory of the donor country.7. Disband the staff and forget all about (6).These steps may not have occurred in all surveys, but all
contained several of the elements in (1 )-(7). Together, they.illustrate all that was good, and that was wrong with these
surveys (see Pauly 1986 for a critique).Thus, two to three decades ago, tropical fisheries
development schemes were straightforward: fisheries scientistswere to locate the resources, and estimate the amounts that
could be extracted from them: hence the emphasis on potential
yields. Then a development bank, devoted to industrializingthe fisheries, would pick up that number, divide the annual catchof a typical commercial trawler into it, and out came the number
of trawlers which construction was to be funded.Fig. 1 documents this line of thought; it is based on a
graph I did as a graduate student to illustrate my version of the
then dominant thinking (or lack thereof) about the transition
from small-scale to large-scale fishing in tropical developingcountries, then perceived as both beneficial and unavoidable.
What this approach brought us is -now well known:
massive overcapitalization, collapsed stocks, impoverished
The results of demersal trawl surveys -contrary to the
results of other types of biological field studies -are fairlystandard in form, always consisting of the following elements:
i. a general description of the survey, involving detailson boat, gear, mesh sizes, trawling speed, etc. andapplying to all parts (stations) of the survey;
ii. trawling "stations", each defined, as for oceanographicstations, by a place (usually defined by a location on amap, i.e., a longitude and a latitude), a depth (that of
the sea bottom), and a time (hour, day, month, year);iii. a list of the fish and invertebrates caught, often by
species, sometimes by higher groups (e.g., genera or
families):iv. the catch taken of each taxon in (iii).Or in other words: trawl data are typically described by
"tables" that are easy-to-computerize (see Alverson andPereyra 1972 for an early approach to computerization, andStromme 1992 fo! a recent one), a theme to which we shall
return below.
2

Fig. 1. Historic sequence of Euro~ean fishing (andother) boat developments, from ca. 1750 to ca. 1970(based in part on Muus and Dahlstrom 1973),assumed to provide a model for the industrializationof fisheries in developing countries. The problemwith this "model" is the fact -now obvious -thatsmall-scale fishers cannot be recycled as crew ontrawlers nor will simply disappear, once an industrialfleet has been built (adapted from an overheadprepared in 1973 by the author, for presentation ata graduate seminar).[Gambar 1. Perubahan sejarah perkembangankapal ikan (dan kapallainnya) di £ropah dari kira-kira tahun 1750 hingga tahun 1970 (sebagianberdasarkan tulisan Muus dan Dahlstrom 1973),diasumsikan sebagai model proses industrialisasiperikanan di negara berkembang. Kesulitan dalammodel ini adalah kenyataan -yang sekarang jelas -
bahwa para nelayan perikanan skala kecil tidakdengan sendirinya menjadi awak kapal trawlataupun berhenti profesi dengan dibangunnyaarmada perikanan industri (diambil dari materi
presentasi transparansi penulis yang disampaikandalam seminar mahasiswa tingkat pasca sarjanatahun 1973 dengan sedikit perubahan).]
:'ii:
~:
are commonly grouped into larger categories (e.g., "squids";
"sponges", etc., for which translation from "old" to "new" is no
problem).Thus, because of the "tabular nature" of the results of
demersal trawl data (see Table 1 for an example), a greatamount of trawl survey data can be straightforwardly used,once the table legend (i.e... the general aspects of a survey)and the key column (i.e., the fish names) are verified.
The problem with old demersal surveys, it turns out, isthus not related to quality, but to quantity: it is expensive to
have old data computerized (this cannot be reliably done byscanning the original data sheets, as many think). However,modem database techniques can help here, e.g., throughpreprogrammed entries (e.g., of the species names, which neednot be reentered, but can be chosen from a choice list, as in
the system developed by Vakily 1992).
To ensure the quality of trawl data one must therefore:a. have access to the general description in (i) and be
able to verify its integrity;b. be able to duplicate the positions given in (ii) through
a reconstruction of the sailing tracks and vice versa,
and to check their conformity with modern ba~hymetric
and bottom structure maps;c. be able to assign current names to the taxa in (iii),
which may have outdated names.Item (c) is the only one that poses real problems; in fact
the difficulties involved here would be insuperable were it notfor the existence of FishBase, the electronic encyclopedia of
fish, which has special routines for the identification of valid(new) names, given (old) synonyms and countries of
occurrence (see Froese, this vol.).Fish generally contribute over 90% of the catch of
demersal trawls, and the invertebrates caught along with fish
3

Table 1. A typical trawler catch (45-minute haul) from Java Sea (06° 12'S, 108° 26'E, 34-35 m depth) made on5 September 1976 by RN Mutiara 4 in the Java Sea. (Asterisks refer to weight and number raised from asorted sample of one out of five boxes. Invertebrates not included; see Pauly et al., this vol., for details on the
gear used).[TabeI1. Hasil tangkapan khas dari trawl (45 menit tarikan) yang dioperasikan di Laut Jawa (06°12'LS, 108.26'87;pads kedalaman 34-35 m) tanggal5 September 1976 oleh kapal penelitianMutiara 4. Tanda bintang menandakansatuan berat dan angka, yang diperoleh dari proses pemilihan contoh (1 dari 5 boks). Tidak tennasuk hewanavertebrata; untuk perincian alar yang dipergunakan lihat Pauly et al., vol. ini.]
4
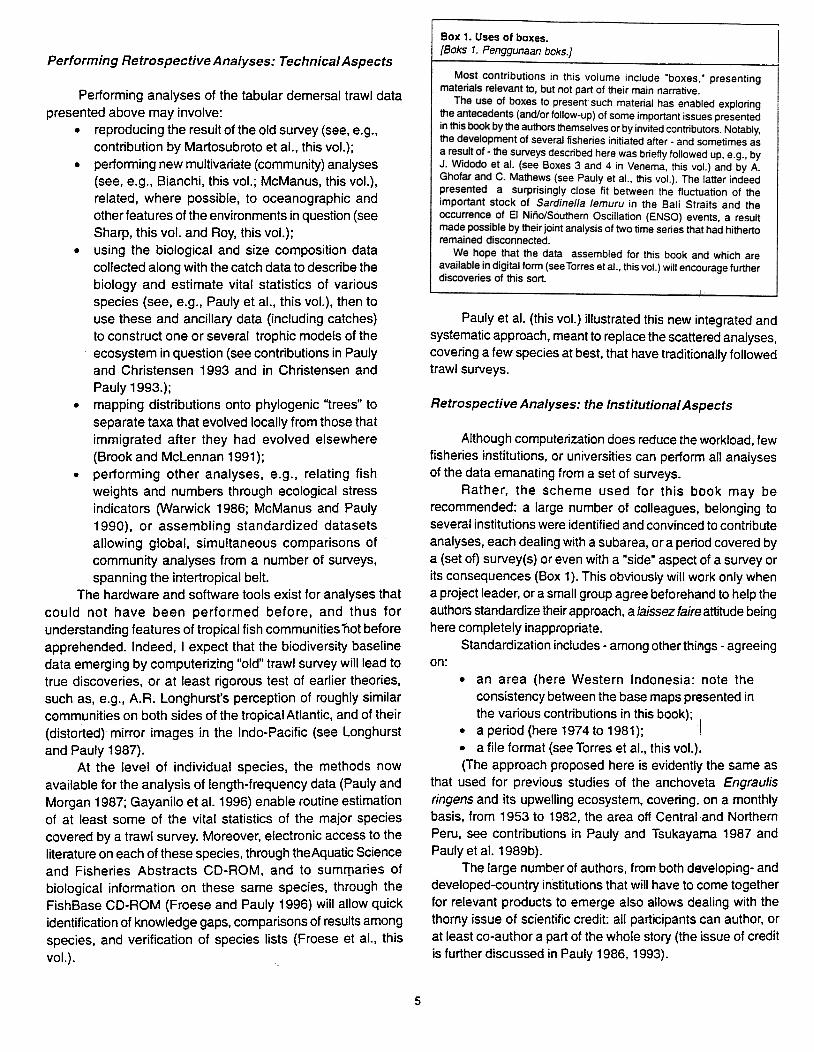
Box 1. Uses of boxes.[Baks 1. Penggunaan baks.]
Performing Retrospective Analyses: Technical AspectsMost contributions in this volume include "boxes," presenting
materials relevant to, but not part of their main narrative.The use of boxes to present such material has enabled exploring
the antecedents (and/or follow-up) of some important issues presentedin this book by the authors themselves or by invited contributors. Notably,the development of several fisheries initiated after. and sometimes asa result of -the surveys described here was briefly followed up, e,g., byJ. Widodo et al. (see Boxes 3 and 4 in Venema, this vol.) and by A,Ghofar and C. Mathews (see Pauly et al., this vol,). The latter indeedpresented a surprisingly close fit between the fluctuation of theimportant stock of Sardinefla lemuru in the Bali Straits and theoccurrence of EI Nino/Southern Oscillation (ENSO) events, a resultmade possible by their joint analysis of two time series that had hithertoremained disconnected,
We hope that the data assembled for this book and which areavailable in digital form (see Torres etal., this vol.) will encourage furtherdiscoveries of this sort.
Pauly et al. (this vol.) illustrated this new integrated and
systematic approach, meant to replace the scattered analyses,covering a few species at best, that have traditionally followedtrawl surveys.
Retrospective Analyses: the Institutional Aspects
Although computerization does reduce the workload, fewfisheries institutions, or universities can perform all analysesof the data emanating from a set of surveys.
Rather, the scheme used for this book may berecommended: a large number of colleagues, belonging toseveral institutions were identified and convinced to contribute
analyses, each dealing with a subarea, or a period covered bya (set of) survey(s) or even with a "side" aspect of a surveyorits consequences (Box 1). This obviously will work only whena project leader, or a small group agree beforehand to help the
authors standardize their approach, a laissezfaireattitude beinghere completely inappropriate.
Standardization includes -among other things -agreeingon:
Performing analyses of the tabular demersal trawl datapresented above may involve:
.reproducing the result of the old survey (see, e.g.,contribution by Martosubroto et al., this vol.);
.performing new multivariate (community) analyses(see, e.g., Bianchi, this vol.; McManus, this vol.),related, where possible, to oceanographic andother features of the environments in question (seeSharp, this vol. and Roy, this vol.);
.using the biological and size composition datacollected along with the catch data to describe thebiology and estimate vital statistics of variousspecies (see, e.g., Pauly et al., this vol.), then to
use these and ancillary data (including catches)to construct one or several trophic models of theecosystem in question (see contributions in Paulyand Christensen 1993 and in Christensen and
Pauly 1993.);.mapping distributions onto phylogenic "trees" to
separate taxa that evolved locally from those thatimmigrated after they had evolved elsewhere
(Brook and McLennan 1991);.performing other analyses, e.g., relating fish
weights and numbers through ecological stressindicators (Warwick 1986; McManus and Pauly1990), or assembling standardized datasetsallowing global, simultaneous comparisons of
community analyses from a number of surveys,
spanning the intertropical belt.The hardware and software tools exist for analyses that
could not have been performed before, and thus for
understanding features of tropical fish communities. not beforeapprehended. Indeed, I expect that the biodiversity baselinedata emerging by computerizing "old" trawl survey will lead to
true discoveries, or at least rigorous test of earlier theories,such as, e.g., A.R. Longhurst's perception of roughly similarcommunities on both sides of the tropical Atlantic, and of their
(distorted) mirror images in the Indo-Pacific (see Longhurst
and Pauly 1987).At the level of individual species, the methods now
available for the analysis of length-frequency data (Pauly andMorgan 1987; Gayanilo et al. 1996) enable routine estimation
of at least some of the vital statistics of the major speciescovered by a trawl survey. Moreover, electronic access to the
literature on each of these species, through theAquatic Scienceand Fisheries Abstracts CD-ROM, and to sumrparies ofbiological information on these same species, through the
FishBase CD-ROM (Froese and Pauly 1996) will allow quick
identification of knowledge gaps, comparisons of results amongspecies, and verification of species lists (Froese et al., this
vol.).
.an area (here Western Indonesia: note the
consistency between the base maps presented inthe various contributions in this book);
.a period (here 1974 to 1981); 1
.a file format (see Torres et al., this vol.).(The approach proposed here is evidently the same as
that used for previous studies of the anchoveta Engraulis
ringens and its upwelling ecosystem. covering. on a monthlybasis, from 1953 to 1982, the area off Central and NorthernPeru, see contributions in Pauly and Tsukayama 1987 andPauly et al. 1989b).
The large number of authors, from both developing- anddeveloped-country institutions that will have to come togetherfor relevant products to emerge also allows dealing with thethorny issue of scientific credit: all participants can author, or
at least co-author a part of the whole story (the issue of creditis further discussed in Pauly 1986, 1993).
5

, Moreover, the standardized databases that emerge from.an exercise such as proposed here will become available -in
a way that the older, original data were not -to the scientists ofthe countries in which the surveys were conducted and to the
international scientific community. The volume describing thedatabase will thus be a "data-rich book" sensu Pauly (1993,
1994), and contribute to solving the data loss problemaddressed, e.g., in Janzen 1986 or Mathews 1993, as well asin other disciplines (Levitus et al. 1994).
Readers interested in the application of the approachoutlined here to other tropical areas are welcome to contactICLARM and/or the author.
Acknowledgements
The programmatic approach presented here was inspiredby discussions with and the work of Dr. Gabriella Bianchi, Dr.Fridtjof Nansen Project, Bergen, Norway, and a seminar by Dr.Meryl Williams, in late 1993 in which she pointed out the needfor ICLARM staff to reinterpret their work in the context of
biodiversity.
References
Janzen, D. 1986. Science is forever. Oikos 46: 281-283.Levitus. S.R., D. Gelfeld. T. Boyer and D. Johnson. 1994. Results of the
NODC and 10C Oceanographic DataArcheology and Rescue Project.Rep. 1 NOAA, Key Oceanogr. Rec. Doc. No. 19.73 p. .
Longhurst, A.R. and D. Pauly. 1987. Ecology of tropical oceans. AcademicPress, San Diego, Califomia. 407 p.
Mathews. C.P. 1993. On preservation of data. Naga.ICLARM 0.16(2/3):39-41.
McManus. J. and D. Pauly. 1990. Measuring ecological stress -variations ona theme by R.M. Warwick. Mar. BioI. 106(2):305-308.
Muus. B.J. and P. Dahlstrom. 1973. Meeresfische. BLV Vertagsgesellschaft.MOnchen. 244 p.
Pauly. D. 1979. Theory and management of tropical multispecies stocks: a
review, with emphasis on the Southeast Asian demersal fisheries.ICLARM Stud. and Rev. 1, 35 p.
Pauly. D. 1984. Methods for assessing the marine stocks of Burma. with
emphasis on the demersal species. BURm1003. FAO Field Doc. 6,22 p. FAO. Rome.
Pauly. D. 1986. On identifying fish rather than assessing fish stocks: reviewof two books on the taxonomy of the neritic fishes of the WestemIndian Ocean. Naga. ICLARM O. 9(3):21.
Pauly. D. 1986. On using other people's data. Naga. ICLARM 0.11(1):6-7.Pauly, D. 1993. Qata-rich books. Bioscience 43(3):167-168.Pauly. D. 1994. On the sex of fish and the gender of scientists: a collection of
essays in fisheries science. Chapman and Hall. London. 250 p.Pauly. D. 1995a. Small-scale fisheries in the tropics: marginality.
marginalization and some implications for fisheries management. InProceedings of the Conference on Fisheries Management: GlobalTrends. 14-16 June 1994. Seattle. USA. 63 p.
Pauly, D. 1995b. Anecdotes and the shifting baseline syndrome of fisheries.Trends Ecol. Evol. 10(10): 430.
Pauly, D. and G.R. Morgan, Editors. 1987. Length-based methods in fi;Oheriesresearch. ICLARM Conf. Proc. 13. 468 p.
Pauly. D. and I. Tsukayama. Editors. 1987. The Peruvian anchoveta and its
upwelling ecosystem: three decades of change. ICCARM Stud. Rev.15,351 p.
Pauly. D. and V. Chri5tensen. 1993. Stratified models of large marineecosystems: a general approach and an application to the South ChinaSea. p. 148-174. In K. Sherman, L.M Alexander and B.D. Gold (eds.)Large marine ecosystems: stress. mitigation and sustainability. AAASPress, Washington. D.C.
Pauly. D.. G. Silvestre and I.R. Smith.. 1989a. On development. fisheries anddynamite: a brief review of tropical fisheries management. Nat. Resour.
Modelling 3(3):307-329.Pauly. D.. P. Muck. J. Mendo and I. Tsukayama, Editors. 1989b. The Peruvian
upwelling ecosystem: dynamics and interactions. ICLARM Conf. Proc.
18.438 p.Pope, J.G. 1979. Stock assessment in multispecies fisheries. with special
reference to.the trawl fishery in the Gulf of Thailand. SCS/DEV/79/19.
106p.Ritragsa. S. 1976. Results of the studies on the status of demersal fish
resources in the Gulf of Thailand from trawling surveys. 1963-1972. p.198-223. In K. Tiews (ed.) Fisheries resources management in
Southeast Asia. German Foundation for International Development.Bertin.
Stromme. T. 1992. NAN-SIS: software for fishery survey data logging andanalysis. User's manual. FAO Comput. Info. Ser. (Fish.) No.4. 103 p.
Vakily, J.M. 1992. Assessing and managing the marine fish resources of
Sierra Leone. West Africa. Naga. ICLARM 0.15(1):31-35.Warwick. R.M. 1986. A new method for detecting pollution effects on marine
macrobenthic communities. Mar. Bioi. 92: 557-562.Williams, F. 1968. Report on the Guinean trawling survey. Vols. I (601 p.). II
(529 p.) and III (551 p.). Publ. Sci. Tech. Res. Comm.. Organ. Afr.
Unity 99.
Alverson. D.L. and W.T. Pereyra. 1972. Demersal fi~h exploration in the
northeastern Pacific Ocean -an evaluation of exploratory fishingmethods and analytical approaches to stock size and yield forecasts,p. 224-254. In Proceedings of the Symposium on Demersal Fisheries,
Brisbane. Australia. Proc. Indo-Pac. Fish. Counc. 13(3).Beddington. J.R. and J.G. Cooke. 1983. The potential yield of fish stocks.
FAO Fish. Tech. Pap. 242. 47 p.Beddington. J.R. and R.M. May. 1982. The harvesting of interacting species
in a natural system. Sci. Am. 247(5):42-49.Brook. D.R. and D.A. McLennan. 1991. Phylogeny. ecology and behavior: a
research program in comparative biology. University of Chicago Press.
Chicago. 434 p.Christensen. V. and D. Pauly. 1992. ECOPATH II -a software for balancing
steady-state ecosystem models and calculating network
characteristics. Ecol. Modelling 61:169-185.Christensen, V. and D. Pauly, Editors. 1993. Trophic models.of aquatic
ecosystems. ICLARM Conf. Proc. 26, 390 p.Christy. F.T., Jr. 1993. Back to school. The world's fishery managers should
revise their basic economic textbooks: open access is a catastrophe.
CERES, FAO Rev. 26(142):32-36.Doubleday. W.G. and D. Rivard, Editors. 1981. Bottom trawl surveys. Can.
Spec. Pub!. Fish. Aquat. Sci. 58. 273 p.Froese. R. and D. Pauly, Editors. 1996. FishBase 96: concepts. design and
data sources. ICLARM, Manila. Philippines. 179 p.Garcia. S.M. and C. Newton. 1995. Current situation trends and prospects in
world capture fisheries. In Proceedings of the Conference on FisheriesManagement: Global Trends, 14-16 June 1994. Seattle. USA. 63 p.
Gayanilo. F.C., Jr.. P. Sparre and D. Pauly. 1996. The FAO-ICLARM StockAssessment Tools (FiSAT) user's manual. FAO Comput. Info. Ser.
(Fish.) 8. FAO. Rome. 126 p.Gulland. J.A., Editor. 1971. The fish resources of the ocean. Fishing News
Books. West Byfleet, England.Hida. T. and W. Pereyra. 1966. Results of bottom trawling in Indian Seas by
RV .'Anton Bruun" in 1963. Proc.lndo.-Pac. Fish. Counc. 11:156-171.
6


