ct quantification of pneumonia lesions in early days predicts … · ct quantification of pneumonia...
TRANSCRIPT
CT quantification of pneumonia lesions in early days predicts
progression to severe illness in a cohort of COVID-19 patients
Fengjun Liu1*, Qi Zhang2,3,4,5*, Chao Huang2,5*, Chunzi Shi6*, Lin Wang1*, Nannan Shi1,
Cong Fang2,5, Fei Shan1, Xue Mei7, Jing Shi2, Fengxiang Song1, Zhongcheng Yang2,
Zezhen Ding2, Xiaoming Su5, Hongzhou Lu8, Tongyu Zhu9, Zhiyong Zhang6¶, Lei
Shi2,5¶, Yuxin Shi1
*Joint first authors, contributed equally
¶Joint last authors, contributed equally
1 Department of Radiology, Shanghai Public Health Clinical Center, Fudan University,
Shanghai, China;
2 Shanghai Key Laboratory of Artificial Intelligence for Medical Image and Knowledge
Graph, Shanghai, China;
3 The SMART (Smart Medicine and AI-based Radiology Technology) Lab, Shanghai
Institute for Advanced Communication and Data Science, Shanghai University,
Shanghai, China;
4 School of Communication and Information Engineering, Shanghai University,
Shanghai, China;
5 Institute of Healthcare Research, Yizhi, Shanghai, China;
6 Shanghai Public Health Clinical Center, Fudan University, Shanghai, China;
7 Department of Severe Hepatology, Shanghai Public Health Clinical Center, Fudan
University, Shanghai, China;
8 Department of Infectious Disease, Shanghai Public Health Clinical Center, Fudan
University, Shanghai, China;
9 Department of Urology, Shanghai Public Health Clinical Center, Fudan University,
Shanghai, China.
Correspondence to:
Prof Yuxin Shi,
Department of Radiology, Shanghai Public Health Clinical Center, Fudan University,
Shanghai 201508, China
or

Abstract
Rationale
Some patients with coronavirus disease 2019 (COVID-19) rapidly develop
respiratory failure or even die, underscoring the need for early identification of patients
at elevated risk of severe illness. This study aims to quantify pneumonia lesions by
computed tomography (CT) in the early days to predict progression to severe illness in
a cohort of COVID-19 patients.
Methods
This retrospective cohort study included confirmed COVID-19 patients. Three
quantitative CT features of pneumonia lesions were automatically calculated using
artificial intelligence algorithms, representing the percentages of ground-glass opacity
volume (PGV), semi-consolidation volume (PSV), and consolidation volume (PCV) in
both lungs. CT features, acute physiology and chronic health evaluation II (APACHE-
II) score, neutrophil-to-lymphocyte ratio (NLR), and d-dimer, on day 0 (hospital
admission) and day 4, were collected to predict the occurrence of severe illness within
a 28-day follow-up using both logistic regression and Cox proportional hazard models.
Results
We included 134 patients, of whom 19 (14.2%) developed any severe illness. CT
features on day 0 and day 4, as well as their changes from day 0 to day 4, showed
predictive capability. Changes in CT features from day 0 to day 4 performed the best
in the prediction (area under the receiver operating characteristic curve = 0.93, 95%
confidence interval [CI] 0.87~0.99; C-index=0.88, 95% CI 0.81~0.95). The hazard
ratios of PGV and PCV were 1.39 (95% CI 1.05~1.84, P=0.023) and 1.67 (95% CI
1.17~2.38, P=0.005), respectively. CT features, adjusted for age and gender, on day 4
and in terms of changes from day 0 to day 4 outperformed APACHE-II, NLR, and d-
dimer.
Conclusions
CT quantification of pneumonia lesions can early and non-invasively predict the
progression to severe illness, providing a promising prognostic indicator for clinical
management of COVID-19.
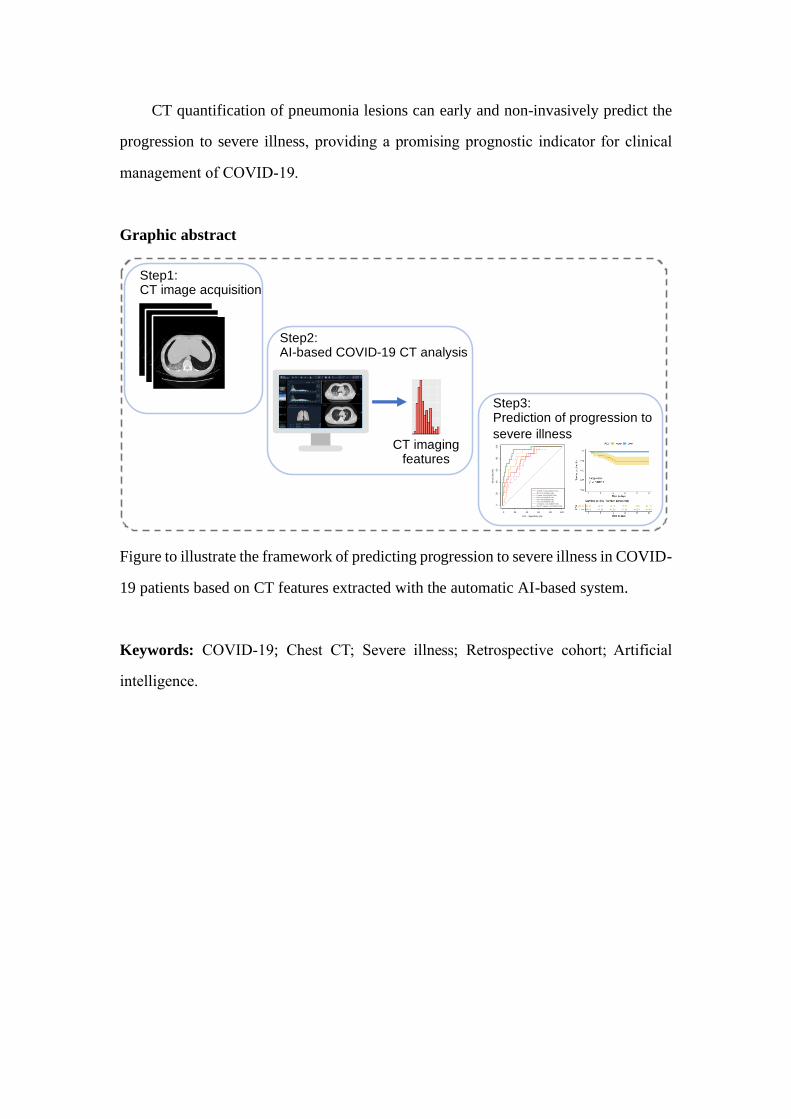
Graphic abstract
Figure to illustrate the framework of predicting progression to severe illness in COVID-
19 patients based on CT features extracted with the automatic AI-based system.
Keywords: COVID-19; Chest CT; Severe illness; Retrospective cohort; Artificial
intelligence.
Step1:CT image acquisition
Step2:AI-based COVID-19 CT analysis
CT imagingfeatures
100 − Specificity (%)
Se
nsit
ivity (
%)
0 20 40 60 80 100
0
20
40
60
80
10
0
APACHE −II: AUC=0.82(0.72~0.91)
NLR: A UC=0.78(0.67~0.88)
D−dimer : AUC=0.78(0.67~0.88)
PGV: AUC=0.84(0.74~0.93)
PSV: AUC=0.92(0.86~0.99)
PCV: AUC=0.91(0.85~0.98)
CT features: A UC=0.93(0.87~0.99)
NLR+CT f eatures: A UC=0.93(0.87~0.99)
Step3:Prediction of progression to
severe illness
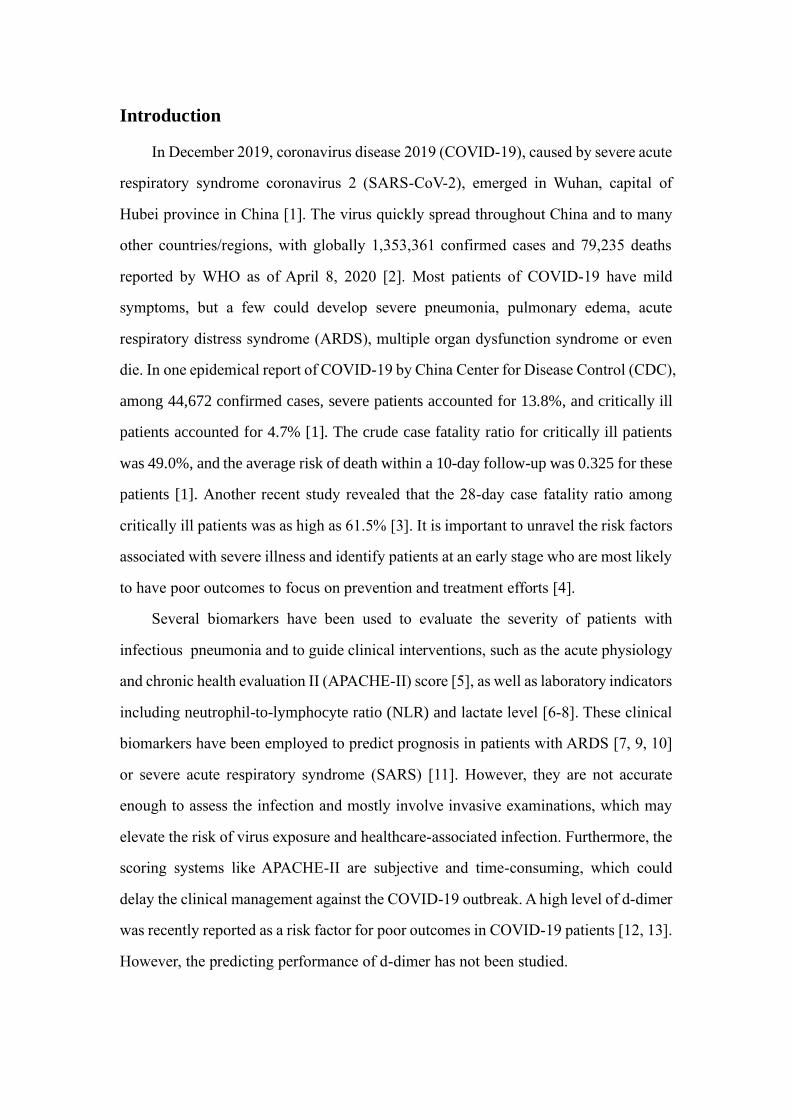
Introduction
In December 2019, coronavirus disease 2019 (COVID-19), caused by severe acute
respiratory syndrome coronavirus 2 (SARS-CoV-2), emerged in Wuhan, capital of
Hubei province in China [1]. The virus quickly spread throughout China and to many
other countries/regions, with globally 1,353,361 confirmed cases and 79,235 deaths
reported by WHO as of April 8, 2020 [2]. Most patients of COVID-19 have mild
symptoms, but a few could develop severe pneumonia, pulmonary edema, acute
respiratory distress syndrome (ARDS), multiple organ dysfunction syndrome or even
die. In one epidemical report of COVID-19 by China Center for Disease Control (CDC),
among 44,672 confirmed cases, severe patients accounted for 13.8%, and critically ill
patients accounted for 4.7% [1]. The crude case fatality ratio for critically ill patients
was 49.0%, and the average risk of death within a 10-day follow-up was 0.325 for these
patients [1]. Another recent study revealed that the 28-day case fatality ratio among
critically ill patients was as high as 61.5% [3]. It is important to unravel the risk factors
associated with severe illness and identify patients at an early stage who are most likely
to have poor outcomes to focus on prevention and treatment efforts [4].
Several biomarkers have been used to evaluate the severity of patients with
infectious pneumonia and to guide clinical interventions, such as the acute physiology
and chronic health evaluation II (APACHE-II) score [5], as well as laboratory indicators
including neutrophil-to-lymphocyte ratio (NLR) and lactate level [6-8]. These clinical
biomarkers have been employed to predict prognosis in patients with ARDS [7, 9, 10]
or severe acute respiratory syndrome (SARS) [11]. However, they are not accurate
enough to assess the infection and mostly involve invasive examinations, which may
elevate the risk of virus exposure and healthcare-associated infection. Furthermore, the
scoring systems like APACHE-II are subjective and time-consuming, which could
delay the clinical management against the COVID-19 outbreak. A high level of d-dimer
was recently reported as a risk factor for poor outcomes in COVID-19 patients [12, 13].
However, the predicting performance of d-dimer has not been studied.
Chest computed tomography (CT) holds great value in screening, diagnosing, and
following up COVID-19 patients [14-16]. CT assessment has been added as an
important criterion for COVID-19 diagnosis and subtyping to the 6th version of national
diagnosis and treatment protocols of COVID-19 in China [17]. However, currently, CT
of COVID-19 is often manually evaluated by radiologists, which is very subjective with
large inter- and intra-observer variability thus unable to accurately and quantitatively
evaluate the disease severity and is also time-consuming and inefficient. It is now
recognized that artificial intelligence (AI) holds promise for deriving quantitative CT
features and precisely predicting the risk of lung cancer and poor outcomes of ARDS
[10, 18-20]. However, to the best of our knowledge, associations between AI-derived
CT features quantifying pneumonia lesions and the risk of severe illness in patients with
the emerging COVID-19 have not yet been reported. If AI-derived features from CT at
an early stage of COVID-19 can be used to predict progression to severe illness, they
can be particularly beneficial because CT is noninvasive and easily accessible and AI
is time-efficient.
Therefore, this work aimed to investigate the capability of quantitative CT imaging
features compared with traditional clinical biomarkers in predicting progression to
severe illness in the early stages of COVID-19.
Materials and Methods
Patients
This retrospective cohort study was approved by the Ethics Committee of
Shanghai Public Health Clinical Center (YJ-2020-S035-01). Informed consent was
waived since the study is retrospective and is part of a public health outbreak
investigation. As a tertiary hospital for diagnosis and management of infectious diseases
and threats against public health for adults and youngsters (i.e., ages ≥14 years) and a
WHO designated training organization for new emerging infectious diseases, the
Shanghai Public Health Clinical Center is the only designated hospital for treating
COVID-19 in Shanghai.
In this study, 197 patients with laboratory-confirmed COVID-19 were admitted to
Shanghai Public Health Clinical Center between January 20, 2020 and February 3, 2020.
The inclusion criteria of our study were (a) confirmed positive SARS-CoV-2 nucleic
acid test by the Shanghai CDC and (b) thin-section CT examinations and laboratory
tests on day 0 (the day of admission) and day 4 (4±1 days after admission). Exclusion
criteria included (a) severe illness on day 0 or before (n=4), (b) no CT examinations on
or day 4 (n=52), and (c)incomplete physiologic tests to derive APACHE-II score on
day 4 (n=7). Finally, a total of 134 patients with COVID-19 were included in this study.
The procedure to enroll patients was conducted, as shown in Figure 1.
Clinical data collection and CT examinations
On day 0 and day 4, records of blood tests, including d-dimer level and NLR, were
reviewed for enrolled patients. Also, the APACHE-II score was calculated based on 12
physiologic criteria, age, and previous conditions for each patient.
Chest CT examinations were performed using a 64-slice CT scanner (Hitachi
Medical, Japan) without contrast agents on day 0 and day 4. Standard lung algorithm
settings were used as follows: 120 kV and automatic tube current (180 mA-400 mA);
iterative reconstruction technique; detector, 64 mm; rotation time, 0.35 second; section
thickness, 5 mm; collimation, 0.625 mm; pitch, 1.5; matrix, 512×512.
AI-based quantization of CT images
As shown in Figure 2, the Quantitative Evaluation System of CT for COVID-19
(YT-CT-Lung, YITU Healthcare Technology Co., Ltd., China) was employed as the CT
image quantization and analysis tool under supervision of two board-certified
radiologists with more than 10 years of experience. The system combined a fully
convolutional network with adaptive thresholding and morphological operations for
segmentation of lungs and pneumonia lesions [21, 22]. External validation with 383
axial CT images from 206 patients showed a Dice coefficient of 82.08% for COVID-
19 pneumonia lesion segmentation (unpublished data from our other study with a focus
on the development and validation of the AI system). By thresholding on CT values in
the pneumonia lesions, three quantitative features were computed, including the
percentages of lesion volume with ranges of -700~-500 Hounsfield units (HU), -500~-
200 HU, and -200~60 HU. The three AI-derived CT features corresponded to
percentages of ground glass opacity (GGO) volume (PGV), semi-consolidation volume
(PSV), and consolidation volume (PCV), where semi-consolidation was defined as the
area of intermediate homogeneous increase in density [23].
Endpoint Definition
The endpoint was the severe-event-free survival, which was defined as the time
from the date of admission to that of severe illness occurrence (i.e. any severe events).
All patients were followed up to the first onset of severe illness, or otherwise for 28
days. According to the guidelines of national diagnosis and treatment protocols for
COVID-19 [17] and the guidelines of American Thoracic Society [24], severe illness
was defined as a condition with any severe event based on one major criterion, two or
more minor criteria, or two criteria of additional organ dysfunction, as follows:
(a) Major criteria: respiratory failure requiring mechanical ventilation; shock with
the need for vasopressors; extracorporeal membrane oxygenation (ECMO) treatment;
(b) Minor criteria: multilobar infiltrates; respiratory rate ≥ 30 breaths/min; arterial
oxygen pressure (PaO2) < 60 mmHg; PaO2/FiO2 ratio ≤ 300 mmHg; oxygen saturation
≤ 93%; hemoptysis 24 h ≥ 100 mL;
(c) Criteria of additional organ dysfunction: multilobar infiltrates; other organ
damage. Here, other organ damage covers any one of the following: (c.1) damage to
the cardiovascular system: heart function graduation ≥ IV level by New York Heart
Association heart function rating; pulmonary arterial hypertension; lower limb
thrombosis; severe coma 3~8 points (Glasgow Score); (c.2) acute liver function damage:
alanine aminotransferase > 5 times upper limit of normal, according to the liver function
test guidelines released by American College of Gastroenterology; (c.3) acute kidney
injury: increase in serum creatinine (SCr) to ≥ 2 times baseline, according to Kidney
Disease Improving Global Outcomes SCr criteria.
None of the finally included patients had severe illness on day 0. The time when a
patient later developed severe illness during the follow up (i.e., the severe-event-free
survival) was recorded.
Statistical Analysis
Patients were divided into two groups according to the severity of illness (severe
vs. non-severe). Continuous variables were expressed as the median and interquartile
range (IQR) and were compared between groups using the Wilcoxon rank-sum test.
Categorical variables were expressed as number and percentage, and Chi-square or
Fisher’s exact tests were applied for appropriate comparisons between groups. We
conducted both binary logistic regression and survival analysis to explore the
association between the predictive features and the development of severe illness.
Multivariate logistic regression models were constructed to make binary
predictions for the adverse outcomes (i.e. severe or non-severe) using APACHE-II,
NLR, d-dimer, and NLR combined with all CT features (denoted as NLR+CT features).
The prediction performance was estimated and reported with the area under the receiver
operating characteristic (ROC) curve (AUC). All logistic models were adjusted for
traditional clinical variables including age and gender. ROC comparisons were
performed using DeLong’s method.
For survival analysis, Kaplan-Meier survival curves and log-rank analyses were
first used to analyze the individual effects of CT features, APACHE-II, NLR, and d-
dimer on the severe-event-free survival. In Kaplan-Meier survival analysis, each
variable was binarized by the median. Subsequently, multivariate Cox proportional
hazard models were built for APACHE-II, NLR, d-dimer, CT features, and NLR+CT
features, with age and gender considered as potential confounders. The performance of
the Cox proportional hazard model was evaluated with the concordance index (C-index).
All analyses were conducted with R software version 3.6.2 (R Foundation for
Statistical Computing, Vienna, Austria). A two-tailed P-value less than 0.05 was
considered as statistically significant.
Results
Basic characteristics of patients
Demographic and clinical characteristics of 134 patients with COVID-19 are
enumerated in Table 1. The median age was 51.5 years (IQR 37.0~65.0; range
15.0~80.0), and 63 (47.0%) patients were male. For epidemic exposure history to the
source of transmission, recent travel to Hubei, contact with people from Hubei, and
close contact with confirmed patients were documented in 64.2%, 11.2%, and 12.7%
of patients, respectively. Fever (81.3%) and cough (39.6%) were the most common
symptoms, and there were 4 (3.0%) asymptomatic patients.
No patients were lost to follow-up. A total of 19 (14.2%) patients progressed to
severe illness during the follow-up, among whom 6 (31.6%) met the major criteria of
severe illness, 10 (52.6%) met the minor criteria, and 3 (15.8%) met the criteria of
additional organ dysfunction. The median time from admission to the occurrence of
severe illness was 9 days (IQR 6.5~12.5; range 3.0~16.0). The median duration from
admission to the occurrence of severe illness that met the major criteria, the minor
criteria and the additional organ dysfunction were 9.5 days (range 5.0~14.0), 7.0 days
(range 3.0~16.0) and 10.0 days (range 4.0~11.0), respectively.
Severe (63.0 years, IQR 40.0~65.5) patients were older than the non-severe (50.0
years, IQR 36.0~64.0), but the difference was not of statistical significance (P=0.086).
There were significantly more males in the severe group than the non-severe group
(78.9% vs 41.7%, P=0.006). The highest temperature was significantly higher in the
severe group (38.5 ℃, IQR 38.0~38.8) than the non-severe group (38.0 ℃, IQR
37.4~38.4, P=0.015). Other demographic and clinical variables listed in Table 1
showed no significant differences between the two groups (all P>0.05). The median
time from symptom onset to admission was 4.0 days (IQR: 2.0~7.0; range:0~20.0) in
the severe group, while that was 6.0 days (IQR: 3.5~7.5; range:1.0~14.0) in the non-
severe group. Days from symptom onset to admission were not significantly different
between the two groups (P=0.176).
CT features, APACHE-II, NLR, and d-dimer in the severe and non-severe groups
Comparisons of CT features, APACHE-II, NLR and d-dimer between severe and
non-severe patients on day 0, day 4 and their changes from day 0 to day 4 are depicted
in Supplemental Table S1.
On day 0, significant differences were observed for all three CT features between
severe and non-severe patients (all P<0.01). NLR was significantly higher in the severe
group than in the non-severe group (P=0.010). D-dimer levels were also higher in the
sever group (P=0.011). However, APACHE-II exhibited no significant differences
between the two groups (P=0.518).
On day 4, all three CT features were significantly higher in severe patients than in
non-severe patients (all P<0.001). APACHE-II (P=0.019), NLR (P<0.001) and d-dimer
(P=0.003) were also significantly higher in the severe group than in the non-severe
group.
Regarding the changes from day 0 to day 4, all CT features showed a more distinct
increase in the severe patients (all P<0.001), while the clinical biomarkers (e.g.
APACHE-II, NLR, and d-dimer) showed no significant increase.
An example of the differences in CT manifestations between the severe and non-
severe groups is presented in Figure 3 displaying CT images of two male patients, who
were under 40 years old. One patient developed severe illness, while the other did not,
and got discharged meeting the following discharge criteria: two consecutive negative
COVID-19 nucleic acid detections at least 24 h apart, afebrile for more than 3 days, and
respiratory symptoms significantly relieved. The average PGV, PSV and PCV in the
non-severe patients decreased from 1.4, 1.3 and 0.5 on day 0 to 1.0, 0.5 and 0.1 on day
4. On the contrary, the average PGV, PSV, and PCV of the patients in the severe group
increased from 3.0, 2.7 and 1.1 on day 0 to 8.3, 11.8 and 5.4 on day 4. Detailed changes
in the volumes and the percentages were captured by the AI-derived CT features.
Relationships between CT features and severe illness
The prediction performance of COVID-19 severe illness using CT features,
APACHE II, NLR, d-dimer, and NLR+CT features were determined based on logistic
regression and ROC analysis. AUCs are shown in Table 2, and ROC curves are also
presented in Supplemental Figure S1.
On day 0, all models (i.e. APACHE-II, NLR, d-dimer, and CT features) achieved
AUCs slightly below 0.80, showing moderate ability in discriminating the severe from
the non-severe group, and the performances were close to each other (all P>0.05 when
compared to the model using CT features). By day 4, all models except for APACHE-
II showed improved performance, with the AUCs of NLR, d-dimer, and CT features
increasing to 0.84 (95% CI 0.75~0.93), 0.78 (95% CI 0.67~0.88) and 0.89 (95% CI
0.80~0.97), respectively. As for the changes from day 0 to day 4, CT features
demonstrated elevated discriminative capability (AUC=0.93, 95% CI 0.87~0.99),
which was significantly better than that for APACHE-II (AUC=0.82, 95% CI 0.72~0.91,
P=0.046), NLR (AUC=0.78, 95% CI 0.67~0.88, P=0.001), and d-dimer (AUC=0.78,
95% CI 0.67~0.88, P=0.001). As for day 4 and the changes from day 0 to day 4, the
models with PSV or PCV were comparable to that of all three CT features (both P>0.05)
while the model with PGV was inferior (both P<0.05). When NLR was added to CT
features, there was no significant improvement for all three data points (all P>0.1).
Relationship between CT features and severe-event-free survival
As displayed in Supplemental Figure S2-4, the Kaplan-Meier analyses showed
that for all CT features and APACHE-II, the values on day 4 and the changes from day
0 to day 4 were significantly and negatively associated with severe illness occurrence.
In contrast, NLR and d-dimer on day 0 and day 4 showed a significant and inverse
association with severe illness occurrence.
The results of the multivariate Cox models are presented in Table 3. On day 0, all
models showed a moderate performance to predict severe-event-free survival, with all
C-indices slightly lower than 0.80. Compared to day 0, by day 4, the C-index of the CT
features increased to 0.85 (95% CI 0.76~0.95), which was significantly (both P<0.001)
better than those of APACHE-II (0.76, 95% CI 0.64~0.87), NLR (0.77, 95% CI
0.67~0.86) and d-dimer (0.76, 95% CI 0.66~0.86). The model of changes from day 0
to day 4 yielded C-index of 0.88 (95% CI 0.81~0.95) in CT features, and significantly
outperformed those (all P<0.001) for APACHE-II (0.80, 95% CI 0.70~0.90), NLR
(0.76, 95% CI 0.66~0.85) and d-dimer (0.76, 95% CI 0.66~0.86). On day 4, the models
with PSV or PCV were comparable to that of all three CT features (both P>0.05), while
the model with PGV was inferior (both P<0.05). As for the changes from day 0 to day
4, all models with only one of the three CT features performed worse than the model
with all CT features (all P<0.05). Adding NLR to the CT features showed no
improvement for all three data points (all P>0.1).
Hazard ratio (HR) estimates for variables included in each multivariate Cox
regression model are displayed in Supplemental Figure S5-7. Specifically, after
considering the age and gender, significant inverse associations with severe-event-free
survival remained for the changes in PGV (HR=1.39, 95% CI 1.05~1.84, P=0.023)
from day 0 to day 4 as well as those in PCV (HR=1.67, 95% CI 1.17~2.38, P=0.005).
Discussion
To our knowledge, this is the first cohort study to predict outcomes in patients with
COVID-19 using noninvasive quantitative CT measurements. Three CT features
representing the lesion volume ratios of GGO, semi-consolidation, and consolidation
were automatically quantified with AI. Our results showed that CT features on day 0
and day 4, as well as their changes from day 0 to day 4, could predict risk of COVID-
19 patients progressing to severe illness. In particular, the changes in CT features from
day 0 to day 4 performed best in the prediction. Furthermore, CT features outperformed
the traditional clinical biomarkers including APACHE-II, NLR, and d-dimer levels on
day 4 and with the changes from day 0 to day 4 regardless of adjustment of age and
gender.
We chose to investigate the potential features in predicting severe illness from
three data points on day 0 (the date of hospital admission), day 4 (4 days later after
admission), and the changes from day 0 to day 4. Such research design was not applied
previously where only static measures of one time point were explored [12]. In this
study, we found that CT features on day 4 performed much better than that on day 0,
which is consistent with our previous report that some COVID patients present dramatic
changes on CT imaging on day 4 compared to day 0 [15]. Interestingly, the changes in
CT features from day 0 to day 4 showed the best performance in predicting severe
illness. This observation suggested that the dynamic trends in CT manifestation changes
are extremely valuable in predicting poor outcomes of COVID-19, an implication that
might also apply to other diseases.
Given the previously reported prognostic potential of NLR and d-dimer [6, 25]
and the feasibility for routine blood analysis, we adopted them as representative
laboratory biomarkers for comparison in this study. Though the lactate level might also
be a useful laboratory indicator, it was not widely available and thus was not
investigated here. Our findings showed that the NLR and d-dimer were inferior to CT
features in predicting the severity of COVID-19 and the combination of these markers
with CT features did not significantly outperform the model with CT features alone.
There are a few limitations of this study that identify areas for future work. First,
the study did not consider the treatment as a factor for prognostic prediction. However,
no specialized therapeutics have been identified for COVID-19 so far, and currently the
mainstay for its treatments are limited to supportive care. For the patients at our Center,
several treatments were adopted including oxygen therapy, mechanical ventilation,
ECMO, antiviral treatment, antibiotic treatment, glucocorticoids, and intravenous
immunoglobulin therapy. Since all patients were treated in the same hospital, it is
reasonable to assume that treatment variations might be negligible between the severe
and non-severe groups. In the future, the comparison of outcomes of various treatments
is needed for response prediction.
Second, radiomics, an AI technique that automatically extracts a large number of
quantitative features from medical images for diagnosis or prognosis, has emerged in
cancer research [26, 27]. It may also be applicable to CT images of COVID-19 and
holds future promise.
Third, the endpoint in this study was progression to severe illness, and until the
follow-up deadline, there were no deaths among the enrolled patients. In a recently
published work by Zhou et al, older age, higher SOFA score, and d-dimer greater than
1μg/mL were found to be associated with an elevated risk of death [12]. However, this
study did not explore the potential value of imaging in predicting the risk of poor
outcomes in COVID-19. Therefore, future studies would further enhance risk
stratification by incorporating dynamic monitoring of traditional clinical as well as
radiological measurements and using an endpoint of death.
Finally, all CT images studied in this work were acquired on the same CT scanner
(Hitachi Medical, Japan) in one clinical center. Extensive research with data from
multi-sites and various scanners is warranted to validate the findings of this study.
Conclusions
In this cohort study, by using AI algorithms, we have shown that three quantitative
volume ratios of COVID-19 lung lesions on CT scans are superior to previous clinical
biomarkers including APACHE-II, NLR, and d-dimer levels, and are a novel and
promising predictor of COVID-19 progression to severe illness. These CT features may
provide clinicians with useful early prognostic information to facilitate pretreatment
risk stratification for COVID-19, and guide the medical staff to conduct more intensive
surveillance and treatment to patients at high risk of severe illness to improve outcomes.
Future large-scale prospective studies are warranted to validate these CT features in
predicting severe illness development and other important outcomes in COVID-19.
Abbreviations
AI: artificial intelligence; APACHE-II: acute physiology and chronic health
evaluation II; ARDS: acute respiratory distress syndrome; AUC: area under the ROC
curve; CI: confidence interval; C-index: concordance index; COVID-19: coronavirus
disease 2019; CT: computed tomography; ECMO: extracorporeal membrane
oxygenation; GGO: ground-glass opacity; HR: hazard ratio; HU: Hounsfield units ;
IQR: interquartile range; NLR: neutrophil-to-lymphocyte ratio; PaO2: arterial oxygen
pressure; PCV: percentage of consolidation volume; PGV: percentage of GGO volume;
PSV: percentage of semi consolidation volume; ROC: receiver operating characteristic;
SARS: severe acute respiratory syndrome; SARS-CoV-2: severe acute respiratory
syndrome coronavirus 2;SCr: serum creatinine.
Supplementary Material
Supplemental figures and tables.
Author Contributions
FL, LW, NS, XM, CS, and FS collected the epidemiological, clinical, and
radiological data. CH, QZ, FL, NS, ZY, JS, CS, CF, XS, HL, FS, ZY, and ZD analyzed
all data. QZ, CH, FL, NS, JS, LS, YS, and ZZ drafted the manuscript. YS, LS, QZ, CH,
FL, FS, CS, and ZZ revised the final manuscript.
Competing Interests
The authors have no competing interests to disclose.
Acknowledgments
The work was funded by Shanghai Science and Technology Committee (No.
20441900600), and Shanghai Shenkang Hospital Development Center Funding
(SHDC12019128). The authors thank Jia Liu for helpful discussion.
References
1. Novel CPERE. The epidemiological characteristics of an outbreak of 2019 novel coronavirus
diseases (COVID-19) in China. Zhonghua liu xing bing xue za zhi= Zhonghua liuxingbingxue zazhi. 2020;
41: 145.
2. WHO. Coronavirus disease 2019 (COVID-19): situation report-79. 2020.
3. Yang X, Yu Y, Xu J, Shu H, Xia Ja, Liu H, et al. Clinical course and outcomes of critically ill
patients with SARS-CoV-2 pneumonia in Wuhan, China: a single-centered, retrospective, observational
study. Lancet Respir Med. 2020.
4. Lipsitch M, Swerdlow DL, Finelli L. Defining the Epidemiology of Covid-19 - Studies Needed. N
Engl J Med. 2020.
5. Wu WH, Niu YY, Zhang CR, Xiao LB, Ye HS, Pan DM, et al. Combined APACH II score and
arterial blood lactate clearance rate to predict the prognosis of ARDS patients. Asian Pac J Trop Med.
2012; 5: 656-60.
6. Wang Y, Ju M, Chen C, Yang D, Hou D, Tang X, et al. Neutrophil-to-lymphocyte ratio as a
prognostic marker in acute respiratory distress syndrome patients: a retrospective study. J Thorac Dis.
2018; 10: 273-82.
7. Kumarasamy C, Sabarimurugan S, Madurantakam RM, Lakhotiya K, Samiappan S, Baxi S, et al.
Prognostic significance of blood inflammatory biomarkers NLR, PLR, and LMR in cancer-A protocol for
systematic review and meta-analysis. Medicine (Baltimore). 2019; 98: e14834.
8. Jiang J, Liu R, Yu X, Yang R, Xu H, Mao Z, et al. The neutrophil-lymphocyte count ratio as a
diagnostic marker for bacteraemia: A systematic review and meta-analysis. Am J Emerg Med. 2019;
37: 1482-9.
9. Huang NC, Hung YM, Lin SL, Wann SR, Hsu CW, Ger LP, et al. Further evidence of the
usefulness of Acute Physiology and Chronic Health Evaluation II scoring system in acute paraquat
poisoning. Clin Toxicol (Phila). 2006; 44: 99-102.
10. Nishiyama A, Kawata N, Yokota H, Sugiura T, Matsumura Y, Higashide T, et al. A predictive
factor for patients with acute respiratory distress syndrome: CT lung volumetry of the well-aerated
region as an automated method. Eur J Radiol. 2020; 122: 108748.
11. Tai D, Lew T, Loo S, Earnest A, Chen M. Critically ill patients with severe acute respiratory
syndrome (SARS) in a designated national SARS ICU: clinical features and predictors for mortality.
Critical Care. 2004; 8: P38.
12. Zhou F, Yu T, Du R, Fan G, Liu Y, Liu Z, et al. Clinical course and risk factors for mortality of
adult inpatients with COVID-19 in Wuhan, China: a retrospective cohort study. The Lancet. 2020.
13. Wu C, Chen X, Cai Y, Xia J, Zhou X, Xu S, et al. Risk Factors Associated With Acute Respiratory
Distress Syndrome and Death in Patients With Coronavirus Disease 2019 Pneumonia in Wuhan, China.
JAMA Intern Med. 2020.
14. Pan F, Ye T, Sun P, Gui S, Liang B, Li L, et al. Time Course of Lung Changes On Chest CT During
Recovery From 2019 Novel Coronavirus (COVID-19) Pneumonia. Radiology. 2020: 200370.
15. Song F, Shi N, Shan F, Zhang Z, Shen J, Lu H, et al. Emerging Coronavirus 2019-nCoV
Pneumonia. Radiology. 2020: 200274.
16. Zhao W, Zhong Z, Xie X, Yu Q, Liu J. CT Scans of Patients with 2019 Novel Coronavirus (COVID-
19) Pneumonia. Theranostics. 2020; 10: 4606-13.
17. China NHC. Diagnosis and treatment protocols of pneumonia caused by novel coronavirus
(trial version 6). 2020.
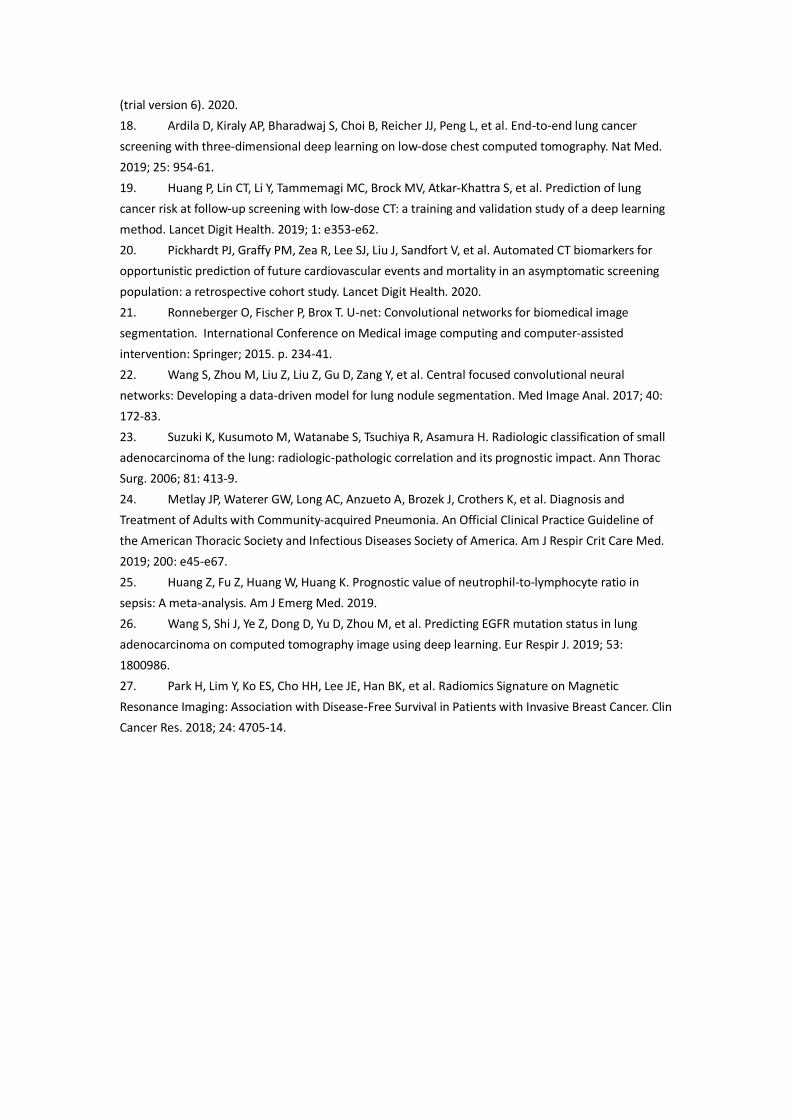
18. Ardila D, Kiraly AP, Bharadwaj S, Choi B, Reicher JJ, Peng L, et al. End-to-end lung cancer
screening with three-dimensional deep learning on low-dose chest computed tomography. Nat Med.
2019; 25: 954-61.
19. Huang P, Lin CT, Li Y, Tammemagi MC, Brock MV, Atkar-Khattra S, et al. Prediction of lung
cancer risk at follow-up screening with low-dose CT: a training and validation study of a deep learning
method. Lancet Digit Health. 2019; 1: e353-e62.
20. Pickhardt PJ, Graffy PM, Zea R, Lee SJ, Liu J, Sandfort V, et al. Automated CT biomarkers for
opportunistic prediction of future cardiovascular events and mortality in an asymptomatic screening
population: a retrospective cohort study. Lancet Digit Health. 2020.
21. Ronneberger O, Fischer P, Brox T. U-net: Convolutional networks for biomedical image
segmentation. International Conference on Medical image computing and computer-assisted
intervention: Springer; 2015. p. 234-41.
22. Wang S, Zhou M, Liu Z, Liu Z, Gu D, Zang Y, et al. Central focused convolutional neural
networks: Developing a data-driven model for lung nodule segmentation. Med Image Anal. 2017; 40:
172-83.
23. Suzuki K, Kusumoto M, Watanabe S, Tsuchiya R, Asamura H. Radiologic classification of small
adenocarcinoma of the lung: radiologic-pathologic correlation and its prognostic impact. Ann Thorac
Surg. 2006; 81: 413-9.
24. Metlay JP, Waterer GW, Long AC, Anzueto A, Brozek J, Crothers K, et al. Diagnosis and
Treatment of Adults with Community-acquired Pneumonia. An Official Clinical Practice Guideline of
the American Thoracic Society and Infectious Diseases Society of America. Am J Respir Crit Care Med.
2019; 200: e45-e67.
25. Huang Z, Fu Z, Huang W, Huang K. Prognostic value of neutrophil-to-lymphocyte ratio in
sepsis: A meta-analysis. Am J Emerg Med. 2019.
26. Wang S, Shi J, Ye Z, Dong D, Yu D, Zhou M, et al. Predicting EGFR mutation status in lung
adenocarcinoma on computed tomography image using deep learning. Eur Respir J. 2019; 53:
1800986.
27. Park H, Lim Y, Ko ES, Cho HH, Lee JE, Han BK, et al. Radiomics Signature on Magnetic
Resonance Imaging: Association with Disease-Free Survival in Patients with Invasive Breast Cancer. Clin
Cancer Res. 2018; 24: 4705-14.
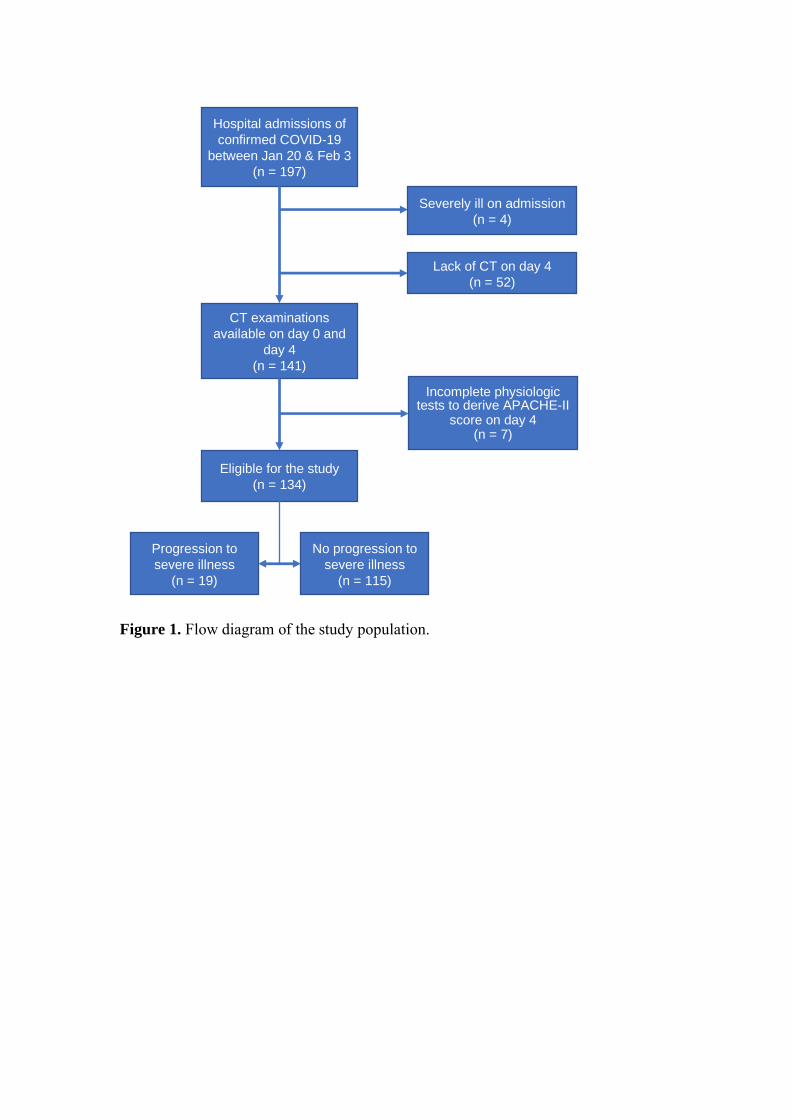
Figure 1. Flow diagram of the study population.
Hospital admissions of
confirmed COVID-19
between Jan 20 & Feb 3
(n = 197)
Lack of CT on day 4
(n = 52)
CT examinations
available on day 0 and
day 4
(n = 141)
Incomplete physiologic tests to derive APACHE-II
score on day 4 (n = 7)
Eligible for the study
(n = 134)
Progression to
severe illness
(n = 19)
No progression to
severe illness
(n = 115)
Severely ill on admission
(n = 4)
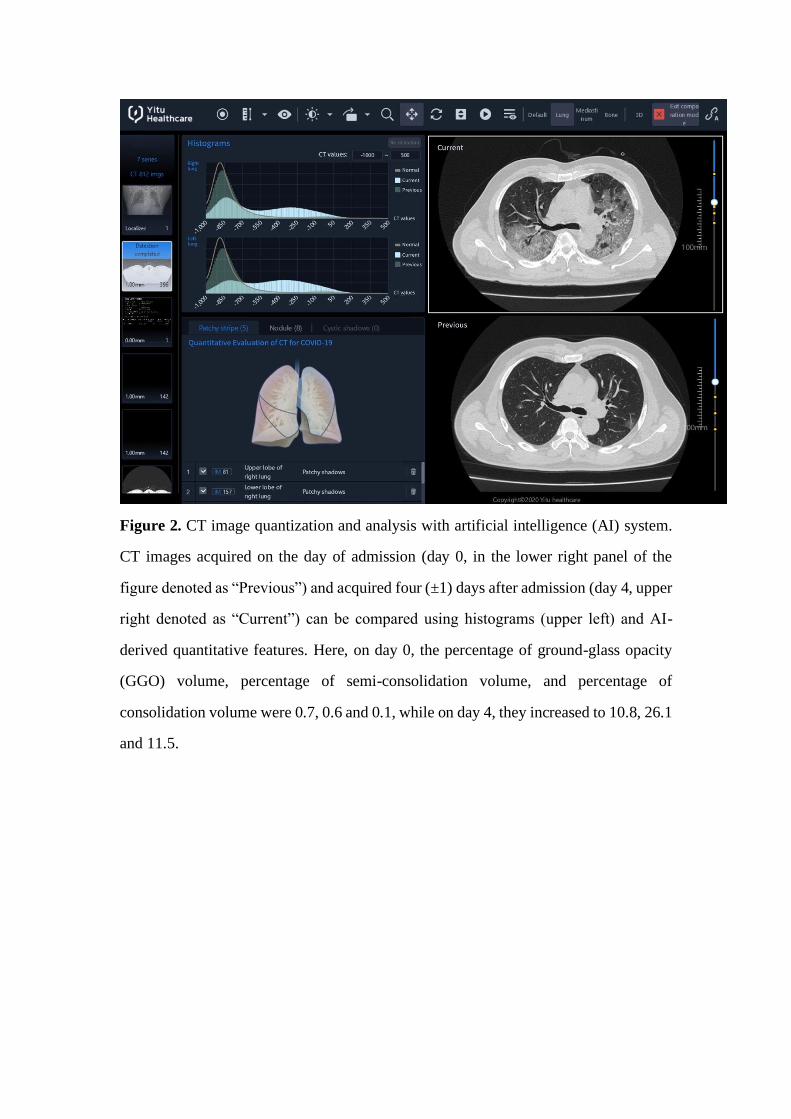
Figure 2. CT image quantization and analysis with artificial intelligence (AI) system.
CT images acquired on the day of admission (day 0, in the lower right panel of the
figure denoted as “Previous”) and acquired four (±1) days after admission (day 4, upper
right denoted as “Current”) can be compared using histograms (upper left) and AI-
derived quantitative features. Here, on day 0, the percentage of ground-glass opacity
(GGO) volume, percentage of semi-consolidation volume, and percentage of
consolidation volume were 0.7, 0.6 and 0.1, while on day 4, they increased to 10.8, 26.1
and 11.5.
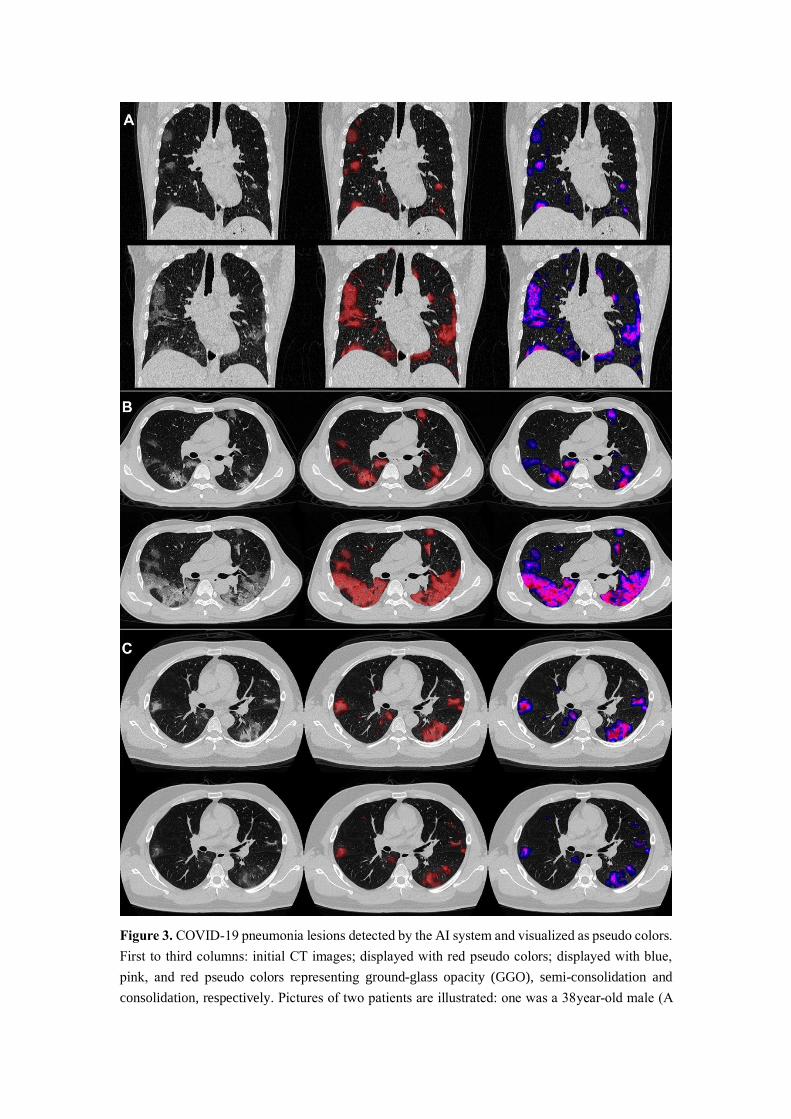
Figure 3. COVID-19 pneumonia lesions detected by the AI system and visualized as pseudo colors.
First to third columns: initial CT images; displayed with red pseudo colors; displayed with blue,
pink, and red pseudo colors representing ground-glass opacity (GGO), semi-consolidation and
consolidation, respectively. Pictures of two patients are illustrated: one was a 38year-old male (A

and B), who reached the endpoint of progression to severe illness after 7 days from admission, and
the other was a 31-year-old male (C), who did not meet the endpoint during the follow-up and was
discharged from the hospital after 13 days from admission. The upper halves of A, B, and C show
images on day 0, and the lower halves show images on day 4.
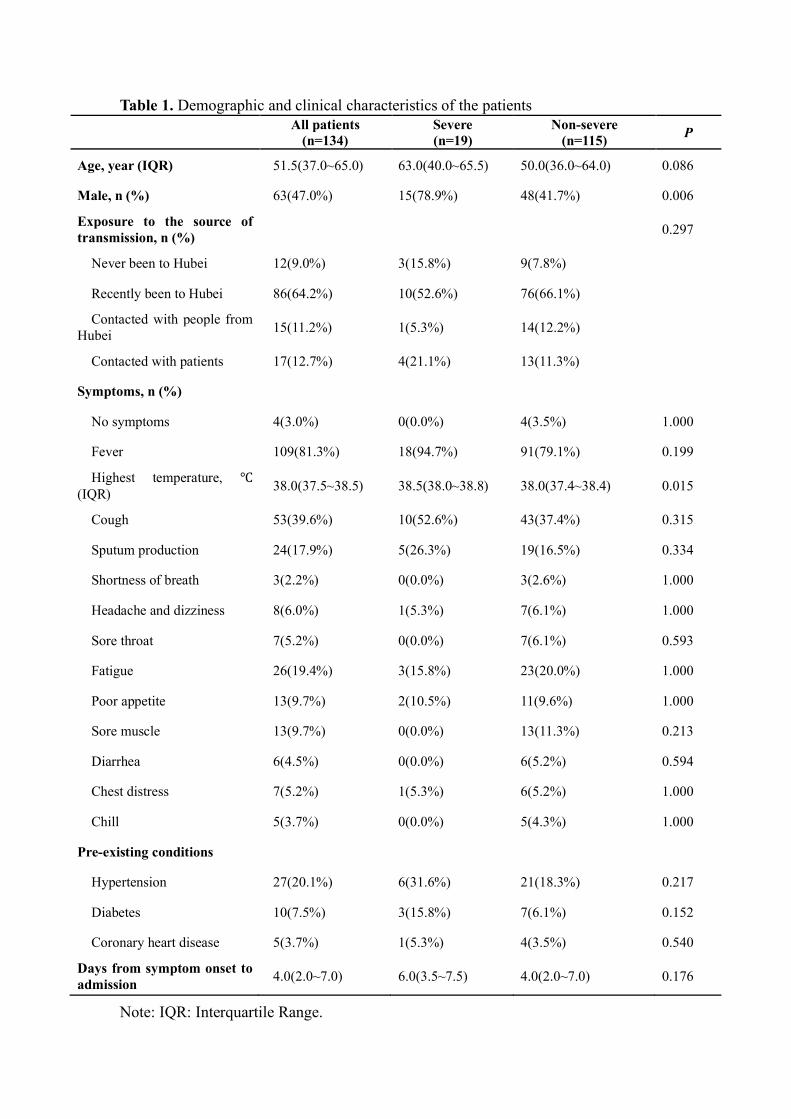
Table 1. Demographic and clinical characteristics of the patients
All patients
(n=134)
Severe
(n=19)
Non-severe
(n=115) P
Age, year (IQR) 51.5(37.0~65.0) 63.0(40.0~65.5) 50.0(36.0~64.0) 0.086
Male, n (%) 63(47.0%) 15(78.9%) 48(41.7%) 0.006
Exposure to the source of
transmission, n (%) 0.297
Never been to Hubei 12(9.0%) 3(15.8%) 9(7.8%)
Recently been to Hubei 86(64.2%) 10(52.6%) 76(66.1%)
Contacted with people from
Hubei 15(11.2%) 1(5.3%) 14(12.2%)
Contacted with patients 17(12.7%) 4(21.1%) 13(11.3%)
Symptoms, n (%)
No symptoms 4(3.0%) 0(0.0%) 4(3.5%) 1.000
Fever 109(81.3%) 18(94.7%) 91(79.1%) 0.199
Highest temperature, ℃
(IQR) 38.0(37.5~38.5) 38.5(38.0~38.8) 38.0(37.4~38.4) 0.015
Cough 53(39.6%) 10(52.6%) 43(37.4%) 0.315
Sputum production 24(17.9%) 5(26.3%) 19(16.5%) 0.334
Shortness of breath 3(2.2%) 0(0.0%) 3(2.6%) 1.000
Headache and dizziness 8(6.0%) 1(5.3%) 7(6.1%) 1.000
Sore throat 7(5.2%) 0(0.0%) 7(6.1%) 0.593
Fatigue 26(19.4%) 3(15.8%) 23(20.0%) 1.000
Poor appetite 13(9.7%) 2(10.5%) 11(9.6%) 1.000
Sore muscle 13(9.7%) 0(0.0%) 13(11.3%) 0.213
Diarrhea 6(4.5%) 0(0.0%) 6(5.2%) 0.594
Chest distress 7(5.2%) 1(5.3%) 6(5.2%) 1.000
Chill 5(3.7%) 0(0.0%) 5(4.3%) 1.000
Pre-existing conditions
Hypertension 27(20.1%) 6(31.6%) 21(18.3%) 0.217
Diabetes 10(7.5%) 3(15.8%) 7(6.1%) 0.152
Coronary heart disease 5(3.7%) 1(5.3%) 4(3.5%) 0.540
Days from symptom onset to
admission 4.0(2.0~7.0) 6.0(3.5~7.5) 4.0(2.0~7.0) 0.176
Note: IQR: Interquartile Range.
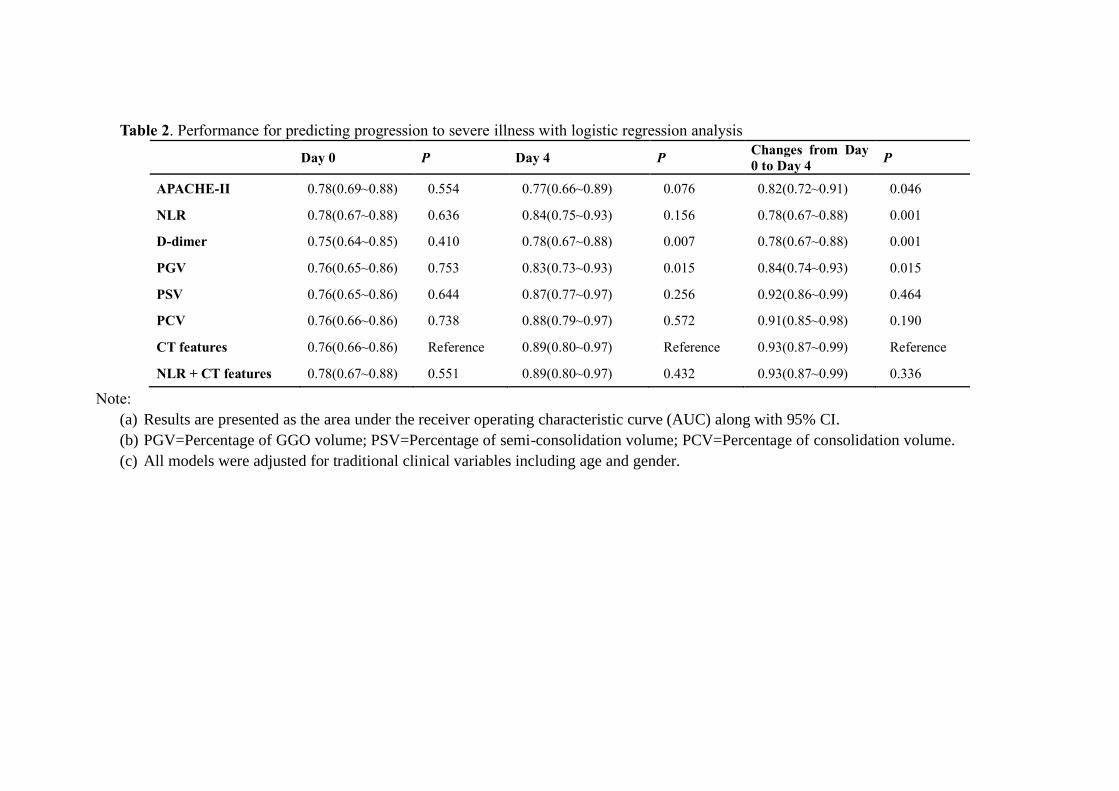
Table 2. Performance for predicting progression to severe illness with logistic regression analysis
Day 0 P Day 4 P Changes from Day
0 to Day 4 P
APACHE-II 0.78(0.69~0.88) 0.554 0.77(0.66~0.89) 0.076 0.82(0.72~0.91) 0.046
NLR 0.78(0.67~0.88) 0.636 0.84(0.75~0.93) 0.156 0.78(0.67~0.88) 0.001
D-dimer 0.75(0.64~0.85) 0.410 0.78(0.67~0.88) 0.007 0.78(0.67~0.88) 0.001
PGV 0.76(0.65~0.86) 0.753 0.83(0.73~0.93) 0.015 0.84(0.74~0.93) 0.015
PSV 0.76(0.65~0.86) 0.644 0.87(0.77~0.97) 0.256 0.92(0.86~0.99) 0.464
PCV 0.76(0.66~0.86) 0.738 0.88(0.79~0.97) 0.572 0.91(0.85~0.98) 0.190
CT features 0.76(0.66~0.86) Reference 0.89(0.80~0.97) Reference 0.93(0.87~0.99) Reference
NLR + CT features 0.78(0.67~0.88) 0.551 0.89(0.80~0.97) 0.432 0.93(0.87~0.99) 0.336
Note:
(a) Results are presented as the area under the receiver operating characteristic curve (AUC) along with 95% CI.
(b) PGV=Percentage of GGO volume; PSV=Percentage of semi-consolidation volume; PCV=Percentage of consolidation volume.
(c) All models were adjusted for traditional clinical variables including age and gender.
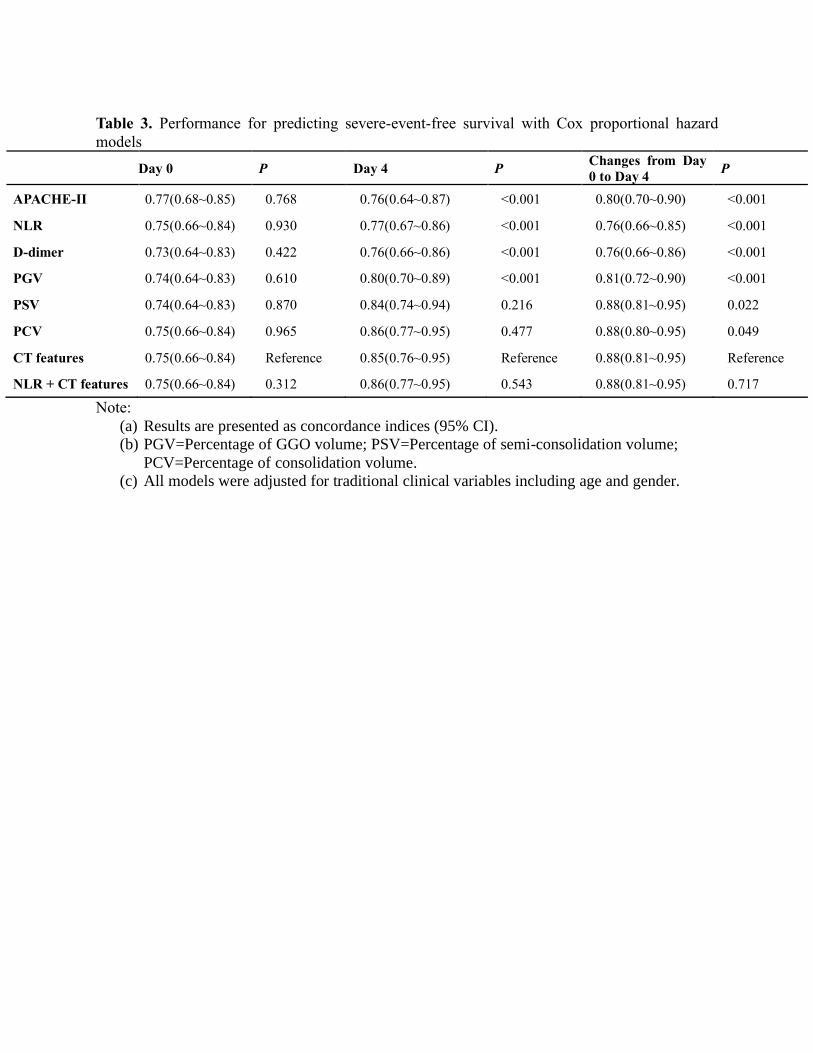
Table 3. Performance for predicting severe-event-free survival with Cox proportional hazard
models
Day 0 P Day 4 P Changes from Day
0 to Day 4 P
APACHE-II 0.77(0.68~0.85) 0.768 0.76(0.64~0.87) <0.001 0.80(0.70~0.90) <0.001
NLR 0.75(0.66~0.84) 0.930 0.77(0.67~0.86) <0.001 0.76(0.66~0.85) <0.001
D-dimer 0.73(0.64~0.83) 0.422 0.76(0.66~0.86) <0.001 0.76(0.66~0.86) <0.001
PGV 0.74(0.64~0.83) 0.610 0.80(0.70~0.89) <0.001 0.81(0.72~0.90) <0.001
PSV 0.74(0.64~0.83) 0.870 0.84(0.74~0.94) 0.216 0.88(0.81~0.95) 0.022
PCV 0.75(0.66~0.84) 0.965 0.86(0.77~0.95) 0.477 0.88(0.80~0.95) 0.049
CT features 0.75(0.66~0.84) Reference 0.85(0.76~0.95) Reference 0.88(0.81~0.95) Reference
NLR + CT features 0.75(0.66~0.84) 0.312 0.86(0.77~0.95) 0.543 0.88(0.81~0.95) 0.717
Note:
(a) Results are presented as concordance indices (95% CI).
(b) PGV=Percentage of GGO volume; PSV=Percentage of semi-consolidation volume;
PCV=Percentage of consolidation volume.
(c) All models were adjusted for traditional clinical variables including age and gender.