client satisfaction with service delivery in the health
TRANSCRIPT

http://ijba.sciedupress.com International Journal of Business Administration Vol. 6, No. 4; 2015
Published by Sciedu Press 64 ISSN 1923-4007 E-ISSN 1923-4015
Client Satisfaction with Service Delivery in the Health Sector: The Case of Agogo Presbyterian Hospital
Seth Nkrumah1, Francis Baah Yeboah2 & Ernest Adiwokor3 1 Institute of Distance Learning (IDL), KNUST, Kumasi, Ghana 2 Presbyterian Health Services, Agogo Ashanti-Akim, Ghana 3 Kwame Nkrumah University of Science and Technology (KNUST), Kumasi, Ghana
Correspondence: Ernest Adiwokor, Kwame Nkrumah University of Science and Technology (KNUST), Kumasi, Ghana. E-mail: [email protected]
Received: April 7, 2015 Accepted: May 15, 2015 Online Published: July 15, 2015
doi:10.5430/ijba.v6n4p64 URL: http://dx.doi.org/10.5430/ijba.v6n4p64
Abstract
The government had mainly provided health delivery in Ghana; this did not leave room for so much client (patient) specifications and demand. Recent times have however seen the emergence of some private entities delivering health care, bringing in some form of competition in the sector. The purpose of this study was to assess client satisfaction with service delivery in the health sector. The study specifically sought to determine the factors that are associated with satisfaction of the patients in the hospital, to find out patients’ knowledge of the right to demand and expect service quality or satisfaction, to determine the impact of some service dimensions on patients’ satisfaction and to identify the challenges that impact on satisfactory service delivery at the hospital. The population comprised both staff and patients of Agogo Presbyterian hospital. Through convenience sampling, 151 patients and 51 staff were sampled. Data was analyzed using basic descriptive statistics. Multiple regression analysis and correlation was also used to ascertain the effect of the independent variables (human relation of staff, communication from staff, staff performance, waiting time and physical evidence) and the dependent variable (patients’ satisfaction). It was concluded that, patients were satisfied with the health service delivery at Agogo Presbyterian hospital. Factors that led to satisfaction were effective human relation from staff (doctors, pharmacists, nurses and other staff), effective communication and general performance of staff. It has therefore been suggested that the facility must take keen interest in them, so as to enhance the satisfaction of their patients.
Keywords: client satisfaction, service delivery, health care, patients
1. Introduction
Good health for the people in countries is essential to the human development and improvement of their economies (Brundtland, 2001). Health care delivery has been explained as one of the service deliveries that demand high consumer involvement in the consumption process (Peprah, 2014). The whole process of the service delivery involves the client. A bad service delivery harms the client and to some extent could even lead to the loss of life. For this reason, checking and assessing client satisfaction with health care is an essential effort to improving the quality of the health system (Bara A. C., van den Heuvel, W. J. A., Maarse, J. A. M., and van Dijk J. P., 2002). To Karen (2010), good service and not merely good results, relates to patient satisfaction.
In Ghana medicine indisputably is the most revered profession and medical doctors are also treated with utmost reverence. This has been the case since the medical profession was introduced in the country and there is dire scarcity of medical doctors. Besides, admission to the medical school is the strictest in the country. The position most Ghanaians find these medical doctors and other staff of the hospital makes them take whatever service and treatment they get from them. Again, the poor state of infrastructure in the health sector is challenging to quality health care delivery to meet the needs and expectations of their clients. Education, enlightenment and globalization have however taught us that the patient is a client and therefore possesses all the rights any other client would possess. They provide the money used to pay the hospital staff and to run the hospital, and so they deserve to be treated satisfactorily in the hospitals. This paper therefore attempts to take a critical look into client (patient) satisfaction with regards to the service delivery at a private hospital, Agogo Presbyterian Hospital, in Ghana. The paper will
http://ijba.sciedupress.com International Journal of Business Administration Vol. 6, No. 4; 2015
Published by Sciedu Press 65 ISSN 1923-4007 E-ISSN 1923-4015
identify the factors that are associated with satisfaction in the hospital, find out the clients’ knowledge of their rights to demand and expect service quality or satisfaction from the health care facilities, assess the impact of some service dimensions on patients satisfaction, and finally identify the challenges that impact on satisfactory service delivery at the hospital.
2. Literature Review
2.1 Service Delivery in the Ghanaian Health Sector
Consumers especially in the developing countries are gradually becoming aware of their right to quality service delivery as far as their health is concerned (Abuosi & Atinga, 2013). As a result, the provision of quality services in the health sector is gaining strength and has made many stakeholders in the health industry, governmental institutions and consumers, to place much premium on unprecedented quality service delivery as a means to eradicate hostile treatment effects and to meet consumer’s numerous demands while fostering real value for money (Smith et al., 2006; Nketiah-Amponsah & Hiemenz, 2009). Abuosi & Atinga (2013), reveal that Ghana’s health system has undergone several developments over the years with the utmost target of creating outstanding improvements in healthcare delivery. They further added that one of the major developments was the implementation of medium term health strategy from 1997 to 2001 by the Ministry of Health that stressed two important healthcare quality dimensions, that is improving access to basic health services geographically and strengthening service delivery in health facilities. A report given by Dr Elias Sory, a former Director-General of the Ghana Health Service, indicated that the current record of health care delivery in the country was below expectation (Ghanaweb, 2010). Management of health institutions are urged to collaborate with the Ministry of Health to work out a performance agreement contract scheme at various levels of health care delivery to monitor their activities to enhance service delivery. Health workers are to change their attitudes to work for the reason that patients are more assertive now and are demanding value for money. It is believed that patients are relatively apprehensive of the services offered nevertheless it is evident that the media and the public are not going to forget the lapses of the service delivery (GhanaWeb, 2010). It is largely regarded by research that most healthcare services in Ghana are provided by the government and largely overseen by the Ministry of Health and Ghana Health Services. Canagarajah, Sudharshan, & Ye, Xiao. (2001) reports that the healthcare system in Ghana has five levels of providers: health posts which are first level primary care for rural areas, health centers and clinics, district hospitals, regional hospitals and tertiary hospitals. However, the government of Ghana, financial credits, Internally Generated Funds, and Donors-pooled Health Fund finances their programs. (Canagarajah, et al, 2001)
2.2 Perceived Service Quality and Customer Satisfaction in Healthcare Services
Aagja & Garg, (2010) defines Healthcare service quality as the difference between patient’s perceptions of services offered by a particular health center and their expectations about the health center offering such services. Explaining further, Kucukarslan & Nadkarni, (2008) commented that, patients’ expectations are dependent on their perception of the best care standards of their former experiences in the consumption of services. This means that satisfaction has a greater tendency to motivate satisfied customers to continue consumption, spread positive views or increase word of mouth recommendations to yield new customers without extra cost on marketing communication (Zeithaml & Bitner, 2000). The reverse is true; as unfulfilled expectations inevitably leads to dissatisfaction (Dawn & Lee, 2004). With regards to these discrepancies, Butt & de Run, (2010) remarked that it is highly crucial for healthcare providers to continuously observe and measure customer service expectations and perceptions. Suggestions to continuously monitor how well customers’ expectations have been met are very obligatory as a form of after-delivery activities (Zarei et al., 2012).
Various researchers have posited differing service quality theories (Gronroos, 1984; Garvin, 1988; Parasuraman, et al., 1985). Enough proof abounds to support the claim that quality service delivery leads to patient satisfaction (Taylor & Baker, 1994, Tucker & Adams, 2001; Atinga et al., 2011). Customer satisfaction can lead to high customer loyalty though it may differ from one industry to another as concluded by De Ruyter, et al., (1998). This means that in an industry where switching cost is heavy customers tend to be more loyal. However the issue of loyalty can be questioned since health is very vital to all societies that revolve around patients. Health care services are interesting by nature because they are services that most individuals do not want but need at a certain point in time (Berry & Beudapudi, 2007)
Andaleeb, (2001) showed a significant relationship between the five factors of service quality and patients’ satisfaction. The discipline factor, covering "tangible' and "assurance", had the greatest influence on patients’ satisfaction, while the gratuity factor had the lowest effect. Bakar, et al., (2008) also employed SERVQUAL instrument to measure patients' orientations in Turkey. Data accumulated from 472 patients showed that patients’ perceived scores were higher than their expected scores for average hospitals and lower than their expected scores
http://ijba.sciedupress.com International Journal of Business Administration Vol. 6, No. 4; 2015
Published by Sciedu Press 66 ISSN 1923-4007 E-ISSN 1923-4015
for superior hospitals. Relatively his study outcome indicated responsiveness and reliability dimensions as the lowest expected scores of all dimensions. Further, another study which used the SERVQUAL to assess patients’ satisfactions by measuring the discrepancy between patients’ expectations and perceptions established that patients are highly satisfied with all elements of service quality; precisely, satisfactory information about their operation and suitable friendliness and courtesy elements (Pakdil & Harwood, 2005). However, an investigation made into patients' satisfactions of service quality in Bangalore ascertained that expectations of patients surpassed their perceptions in 22 elements of service quality. The assurance element obtained the smallest negative mark in all hospitals (Robini & Mahadevappa, 2006). Frimpong, et al., (2010) explored patients' satisfaction with access to public and private healthcare centers. A significant outcome revealed that public patients, as opposed to private counterparts, were discontented with the service delivery. Comparatively, Irfan & Ijaz, (2011) observed that private hospitals in Pakistan were delivering better service quality as compared to public hospitals.
Conclusively it can be argued that several studies have been conducted on different scales, different places, different approaches and methodologies and on varying host of elements which have given varied results concerning issues revolving around this topical area. Though the varying outcomes indicated the overall satisfaction of patients, it is very needful that some specific service delivery dimensions are improved.
2.3 Quality Gap in Health Service Delivery and the SERVQUAL Model
Parasuraman, et al., (1985) originated a ground-breaking research on service quality which involved interviewing executives from retail banking, credit cards, securities brokerage, and product repair and maintenance sectors, from which SERVQUAL model was developed (Lages & Fernandes, 2005; McCabe et al, 2007). Zeithaml, et al., (2013) concluded that, possibly, five service quality gaps exist in service businesses. They named the first gap as the listening gap, which is the discrepancy between customer expectations of service and company understanding of those expectations. Service design and standards gap follows as the second and represents the discrepancy between a firm‘s empathy towards customer expectations and the creation of customer-driven service policies and values. The third gap, which is the service-performance gap, explains the discrepancy between the development of customer-driven service standards and real service performance. Service success suffers when service delivery is below the belt of the set standards, which occurs as a result of the people, systems or technology, involved. External communications gap, the fourth gap, is based on the firm‘s competence to deliver what is promised and absolutely ensure effective communication to consumers. Lastly, the fifth gap is the expected service-perceived service gap, which is explained by Akter, et al., (2008) as the variance between customers’ expectation and perception in service quality. Service firms that employ SERVQUAL to measure and manage service quality evaluates both the customer expectations with regards to these five dimensions, and their perceptions of the received service. The explanation given to this is that when customer expectations are greater than their perceptions of received delivery, service quality is considered low. This makes the SERVQUAL not just a measurement model, but also a good management model. (McCabe et al, 2007; Lages & Fernandes, 2005). The five dimensions includes; Tangibles (physical facilities, medical equipment and appearance of personnel), Reliability (capacity to deliver services accurately dependably and in line with promises), Responsiveness (disposition to help customers and provide prompt services), Empathy (Convenient opening hours and providing individualized care and attention, which includes both access to and understanding of the customers), and Assurance (patient safety and health provider demeanor, providers' knowledge, courtesy and ability to convey trust and confidence) (Purcarea et al, 2013; Ramez, 2012; Parasuraman et al, 1988).
Further, numerous studies shows that the SERVQUAL instrument has been widely applied by researchers in hospitals to measure customer perceptions of service quality (Irfan & Ijaz, 2011; Nekoei-Monghadam & Amiresmaili, 2011; Zarei, 2012). Robini & Mahadevappa, (2006) posits that it is the most appraised tool for assessing service quality in different settings, it is reliable and open for standard analysis that makes interpretation easy. However it has received many criticisms from the likes of Buttle (1996) who questions the theoretical and operational criteria of the SERVQUAL. One of the criticisms by McDougall & Levesque, (1994) argued that the five dimensions could be, in fact, limited to two dimensions, specifically, core services and augmented services, which parallels Gronroos, (1983) technical and functional dimensions. Carman (1990) criticized that SERVQUAL cannot be generally functional in all service industries and proposed that when employed; researchers should consider the type of service market. Other schools of thought have proposed alternative model, ServPref that takes its root from the SERVQUAL but has reliability and predictability ascertained to be more precise for service quality assessment (Cronin & Taylor , 1992). A study by Ramez, (2012) showed that ServPref instrument was more efficient than SERVQUAL instrument in clarifying the discrepancy in service quality in the health sector.
Relating all these criticisms and suggestions to the health service delivery, Piligrimiene & Buciuniene, (2005) concluded on the dimensions for assessing the quality of healthcare recommended by a number of researchers.

http://ijba.sciedupress.com International Journal of Business Administration Vol. 6, No. 4; 2015
Published by Sciedu Press 67 ISSN 1923-4007 E-ISSN 1923-4015
2.4 Elements of Satisfactory Health Service Delivery
Andaleeb, (1998) enumerated communication with patients, competence of staff, staff demeanor, quality of the facilities, and perceived costs as outstanding factors of health service satisfaction. This can be claimed in the contest of health service delivery because there are different services within the service industry. Therefore, in the instance of automobile and railway service sectors, availability and quality of refreshments, effectiveness of information systems, behavior of railway staff, basic amenities provided on platforms, and safety and security are important factors that define customer satisfaction. Delay in delivery is a crucial factor in dissatisfaction of customers (Rajnish et al, 2010; Sachdev & Verma, 2004). It is therefore necessary to note that service quality can be assessed in terms of customer perception, customer expectation, customer satisfaction, and customer attitude where as service quality may be identified as customer perception of how well a service meets or surpasses their expectations (Sachdev & Verma, 2004). Agreeing to Zeithaml & Bitner, (1996) and Herstein & Gamliel, (2006) the SERVQUAL model is relevant to the healthcare sector in the following satisfactory elements: appointments kept on schedule, accurate diagnoses covered under Reliability where as accessible services, no or less waiting, willingness to listen identified as Responsiveness. Knowledge, skills, credentials, reputation relate to Assurance. Empathy captures how a patient is acknowledged as a person, the awareness of patient’s previous problems, good listening and patience. Finally better waiting room, better examination room, and quality equipment, better written materials can all be captured under Tangibles. Effective information and communication at comprehensible degree are deemed satisfactory (De Jager & Du Plooy, 2007). Other studies on customer satisfaction in health care stress the significance of convenience, access, waiting time, choice, quality of information, range of services, nature of the patient’s medical problems, patients’ demographic background, a comfortable environment, and a courteous and caring medical staff (Bansal, 2004; Brown & Swartz , 1989).
2.5 Major Challenges to Effective Quality Service Delivery
One major reason for delivering poor quality services to patients is the overcrowding in the majority of public hospitals (Irfan et al, 2012). People living in the rural areas are lacking basic health facilities and so when the need arises, they only have opportunity to visit these public hospitals located in the cities. The excessive crowding in the public hospitals can be attributed to affordable healthcare services. Management is unable to manage the large number of patients (Irfan et al, 2012). This is the main reason that doctors and staff are unable to provide individual attentions to patients. Hygienic conditions, cleanliness in the hospital environment is very poor in the public hospitals. Andaleeb (2001) observed that the lower staff charged to maintain cleanliness is always waiting for tips from patients. Another key challenge is the failure to implement quality management systems in the healthcare sector.
Patients’ expectations and priorities with regards to health care vary among countries and are highly related to cultural background and the local health care system (Salomon, et al, 1999). There are various challenges that face government hospitals. Some of these challenges include; increase in patient load while hospital infrastructure remains the same, enormous financial constraints, negative utilization of resources, unsatisfactory administrative support from authorities, (De Jager & Du Plooy, 2007). Increasing costs in public healthcare spending has affected most governments in their effort to offer improved service (Manaf , 2005). Besides, hospitals that try to utilize modern technology are not able to deliver up to expectation all because of inadequate training (Mostafa, 2005).
3. Research Methodology
The study defines a client of the hospital as anyone who seeks health related service from any of the staff of the hospital. Though the scope is limited to clients and staff, the clients shall exclude patients on admission, very ill people at the Out-Patient Department and bedridden patients. The study defines staff of the hospital as all who take part in health delivery including medical doctors, health assistants, nurses, pharmacists, health assistants, midwives etc. The study used an explanatory approach to critically find clarification to the client satisfaction levels in Agogo Presby Hospital. The research sought to find explanations as to whether patients are actually aware of their rights as well as identifying the challenges in ensuring clients satisfaction in the hospital. The study followed the tenets of both qualitative and quantitative research. Questionnaires were the major tool for data collection. Secondary data in the form of Out Patient Department records and staff population were however obtained from the hospital. The study was carried out within a seven-day period and so; it was prudent to use a one-week Out Patient Department attendance. The hospital oversees an estimated 1500 attendance on weekly basis and this constituted the target population for clients. The hospital staff strength at the time of the study was almost 500.151 patients and 51 staff constituted the sample sizes. The results were collected and analysed using PASW, into graphs, tables, charts and Regression model.

http://ijba.sciedupress.com International Journal of Business Administration Vol. 6, No. 4; 2015
Published by Sciedu Press 68 ISSN 1923-4007 E-ISSN 1923-4015
4. Data Presentation, Analysis and Discussion of Findings
4.1 Background Information of Respondents
Table 1. Demographics (Staff)
Variables Responses Frequency (N) Percentages (%)Gender Male 33 64.7
Female 18 35.3Position Doctor 7 13.7
Nurse 19 37.3Pharmacist and Pharm. Tech. 10 19.6Biomedical scientist 3 5.9Physician assistant 4 7.8Dietician 2 3.9Health information officer 1 2.0Statistician 5 9.8
Source: Survey 2014
From the Table 1 above, male staff used for the study comprised 64.7% and the females 35.3%. For the positions, the nurses comprising 37.3%, followed by pharmacist and pharmacy technicians 19.6%. This is a true reflection of staff distribution at Agogo Presbyterian Hospital, as it is in every hospital. Nurses were always majority in hospitals. The doctors comprised 13.7%, statisticians 9.8%, physician assistant 7.8%, biomedical scientist 5.9%, dietician 3.9% and health information officer 2%.
Table 2. Demographics (Patients)
Variables Responses Frequency (N) Percentages (%)
Gender Male 64 42.4Female 87 57.6
Age
Below 20years 16 10.720 - 35years 56 37.335 - 50years 30 20.0Above 50years 48 32.0
Marital Status Married 69 49.3Single 72 50.7
Educational Level
No education 28 19.2Basic School 31 21.2Senior High 32 21.9Tertiary 55 37.7
Occupation/Profession
Commerce/Business 30 20.4Farming 33 22.4Artisan 5 3.4Teaching 22 15.0Professional 26 17.7Unemployed 31 21.1
Length of time service is sought from the hospital
First time 25 16.6Less than 1 year 9 6.01 year 15 9.92-5 years 35 23.26 - 10 years 18 11.9Above 10 years 49 32.5
How often do you visit this hospital
First time 23 16.6Yearly 7 4.6Monthly 34 22.5Weekly 2 1.3Daily 5 1.9When sick 80 53.0
Source: Survey 2014

http://ijba.sciedupress.com International Journal of Business Administration Vol. 6, No. 4; 2015
Published by Sciedu Press 69 ISSN 1923-4007 E-ISSN 1923-4015
Whereas the male gender formed majority in the staff distribution, females were majority in the patients’ distribution. From Table 2, females constituted 57.6% with males comprised 42.4%. The age distribution indicates that patients aged bellow 20 years represented 10.7%. Those aged 20-35 years constituted 37.3% and patients aged 35-50 years were 20%. Patients aged above 50 years comprised 32%. The distribution based on marital status indicates that 49.3% of the patients were married with 50.07% being single. 19.2% of the patients used as respondents had no formal education with 21.2% having basic education. Patients with Senior High School and its equivalent qualification were 21.9% and those with tertiary education constituted 20.4%. The distribution based on occupation indicated that patients in commerce comprised 20.4% with those into agriculture constituting 22,4%. The artisans were 3.4% with teachers representing 15%. The professionals constituted 17.7%. Some were also unemployed and represented 21.1%.
On length of patronizing the services of the hospital, the first timers constituted 16.6%, those who had accessed Agogo Presbyterian hospital for less than a year comprised 9.9% and those with 2-5 years’ experience with the hospital were 23.2%. For patients using the facility for the past 6-10 years, they comprised 11.9% and those using the facility for more than 10 years also represented 32.5%. Most patients (53%) visited the hospital only when sick. First timers were 16.6%, yearly attendants were 4.6%, those who attend monthly were 22.5% and those who go on a weekly basis were 1.3%. Some use the facility daily possibly due to the chronic nature of their ailment, and constituted 1.9%.
Table 3. Level of patients’ satisfaction
Frequency (Level Of Satisfaction)
Variable Satisfactory
/Yes Dissatisfactory
/ No Total Mean SD
1 Human relations of staff of the hospital
141 10 151 1.9139 0.51563
2 Communication by staff of the hospital
139 12 151 1.8808 0.51546
3 Performance of the hospital staff 144 7 151 1.8609 0.462454 General assessment of the services 140 7 147 1.9048 0.42737
5 Likelihood of repeat consumption of service
140 9 149 1.7383 0.56228
6 Likelihood of recommending service to others
139 9 148 1.7635 0.57572
7 Satisfaction with time spent at the hospital
52 97 149 1.6510 0.47826
8 Satisfaction with physical evidence of the hospital
134 12 146 1.0822 0.27560
Source: Survey 2014
Table 3 above indicates the level of patients’ satisfaction on some specific dimensions of the service. The mean (M) and standard deviation (SD) were used in the analysis. The M represents the average of the responses and the SD is a measure of dispersion of scores about the mean. For the first three items, respondents were asked to use a scale of 1=very satisfied, 2=satisfied, 3=dissatisfied and 4=very dissatisfied. The smaller the mean therefore, the higher the satisfaction. The mean for the human relation of staff (doctors, pharmacists, nurses and other staff) was 1.9, approximately 2. The mean for communication by staff was approximately 2 (satisfied). The general performance of the staff of the hospital was also satisfactory with a mean of 1.86, almost 2.
The clients were to respond to the items 5 and 6 using a scale of 1=very likely, 2=likely, 3=unlikely and 4=very unlikely. Their response indicated that they were likely to repeat purchase (loyal), as the mean was approximately 2 (likely). They were also likely to recommend service to others such as family and friends.
With the items 7 and 8, respondents were asked to indicate 1=yes or 2=no. The results presented in Table 3 above indicated that patients were dissatisfied with time spent at the hospital before being attended to. The mean was 1.65, approximately 2 (no). However, the patients were very satisfied with the physical evidence. Because services are generally intangible, the physical evidence adds to the service quality.

http://ijba.sc
Published by
Source: Su
Patients wcustomer sof supporti13%. The c
4.2 Patient
Table 4. Pa
Variables
Knowledgepatient
Knowledgeand unsatistaff
Knowledgein place misconduc
Source: Su
According responded hospital staput in place
ciedupress.com
y Sciedu Press
urvey 2014
ere asked to iervice is the ming facilities atcost of consum
ts’ Knowledge
atients’ knowle
(Patients)
e of right pro
e of right to resfactory servic
e of measures to ensure t
ct and dissatisfa
urvey 2014
to Table 4, mthat they were
aff, with 50.7%e to enable them
Low c10%
Quick servicedelivery13%
S
Int
Fi
indicate the famost influential
t the hospital rming the hospita
of the Right to
edge on their ri
otected by law
eport any miscce from any h
the hospital hthe report oaction
most of the pate aware they h
% not aware ofm report any o
cost%
e
Supporting faci17%
ernational Journ
70
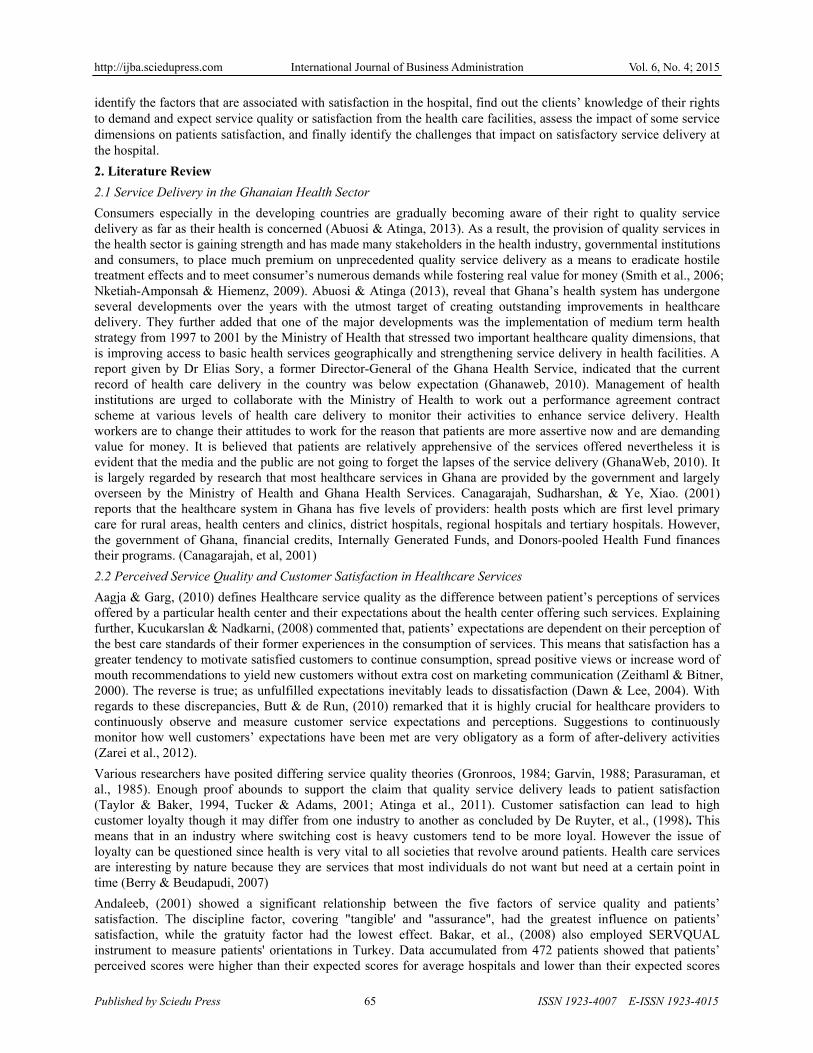
gure 1. Elemen
actors that inflfactor for cust
recorded 17% al service and t
Demand and E
ight
w as a
onduct hospital
has put of any
tients (62.6%)had the right tf that right. Onof their dissatis
ility
nal of Business A
nts of patients’
fluenced their tomer satisfactresponse distr
the complaints
Expect Service
Responses
Yes
No
Yes
No
Yes
No
) are aware of to report any mn whether patiefaction. Only 1
Administration
satisfaction
satisfaction, otion, comprisinribution, and ths handling by st
e Quality
Fr
f their right whmisconduct anents were awar19% indicated
Complaints ha10%
ISSN 1923-400
out of which tng 50% of resphe quick servictaff were both
requency
92
55
73
75
28
119
hereas 37.4% nd unsatisfactore of the measuyes, with 81%
andling
Custome50
Vol. 6, No. 4
07 E-ISSN 192
the study founondents. Availce delivery tim10%.
Percentag
62.6
37.4
49.3
50.7
19.0
81.0
are unaware. ory service froures the hospit
% saying no.
er service0%
4; 2015
23-4015
nd that lability
me was
ge %
49.3% om any tal had

http://ijba.sciedupress.com International Journal of Business Administration Vol. 6, No. 4; 2015
Published by Sciedu Press 71 ISSN 1923-4007 E-ISSN 1923-4015
Table 5. Patients’ knowledge on rights (staff perspective)
Variables (Staff) Responses Frequency Percentage % Education on patients' rights Yes 12 23.5
No 23 45.1 Maybe 11 21.6
Don't know 5 9.8 Availability of right to patients Yes 18 35.3
No 21 41.2 Maybe 11 21.6
Don't know 1 2.0 Availability of visible channels through which patients can report their dissatisfaction
Yes 20 39.2 No 25 49.0
Don't Know 6 11.8 Source: Survey 2014
Only 23% of the staff responded positive. 45.1% of the staff indicated no, that the hospital has not provided enough education on patient’s rights. 21.6% indicated maybe. 9.8% were however not aware at all as to whether there existed any such sensitization.
45.3% of the staff affirmed the availability of patients’ right. 41.2% indicated no and 21.6% indicated maybe. 2% were however not aware. 39.2% of the staff said there existed visible channels through which patients could report their dissatisfaction, 49% indicated no and 11.8% did not know.
4.3 Assessing the Impact of Some Service Dimensions on Patients Satisfaction
Table 6. Regression output on the impact of some service dimensions on patients satisfaction
Independent variable (service dimensions) Dependent variable (patients’ satisfaction)
R R2 B Sig. (Constant) (a)
0.801 0.641
0.236 0.074 Human relation of staff (X1) 0.480 0.001 Communication from staff (X2) 0.150 0.017 Staff performance (X3) 0.320 0.020 Waiting time (X4) 0.450 0.037 Physical evidence (X5) 0.271 0.042
Source: Survey 2014
R represents the correction or relationship between the dependent and the independent variables
R2 represents how much of the dependent variable could be explained by the independent variables.
B represents the coefficients of the independent variables.
Sig. represents the statistical significance level of the model (the acceptable level of significance for this research was 0.05).
The output in the Table 6 above represents the multiple regressions, which sought to establish the impact of some health service dimension on patients’ satisfaction.
The regression equation was therefore y = a + b1X1 + b2X2 + b3X3 + b4X4 + b5X5.
When the values from the table are computed, the equation becomes;
y = 0.236 + 0.480(X1) + 0.150(X2) + 0.320 (X3) + 0.450(X4) + 0.271(X5)

http://ijba.sciedupress.com International Journal of Business Administration Vol. 6, No. 4; 2015
Published by Sciedu Press 72 ISSN 1923-4007 E-ISSN 1923-4015
4.4 Challenges Affecting Satisfactory Service Delivery
Source: Survey 2014
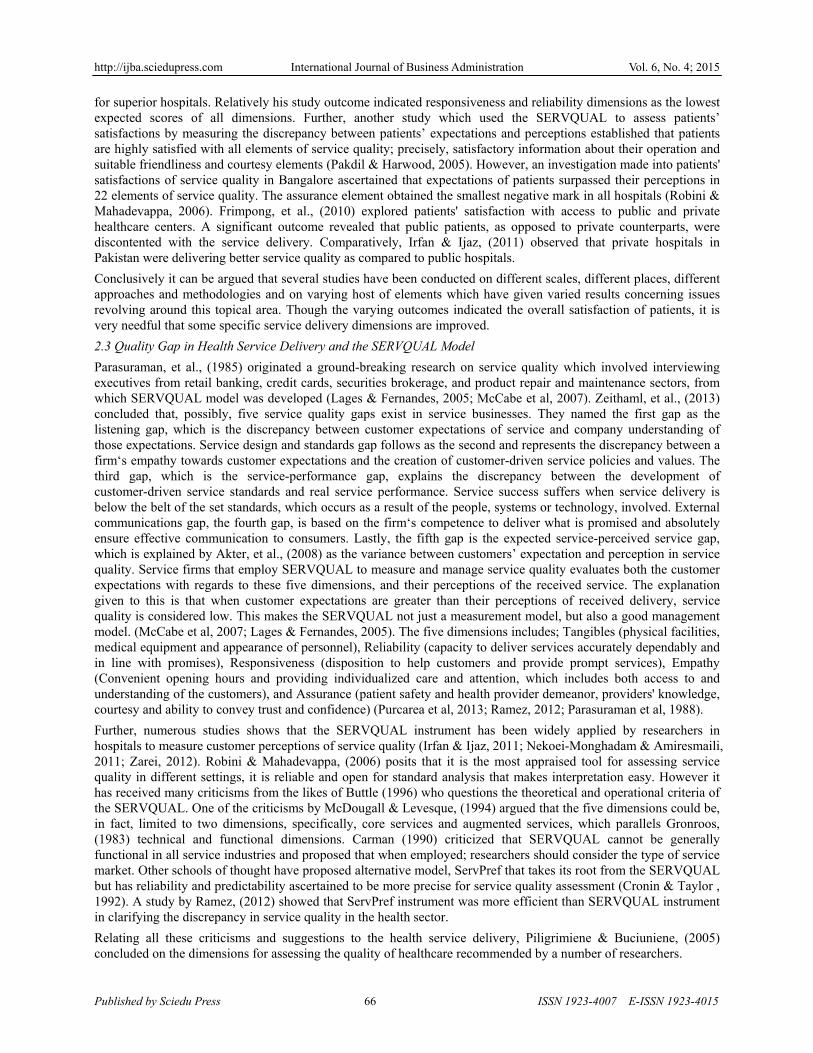
Figure 2. Challenges affecting satisfactory service delivery
Staff was asked to indicate the factors that affect the effective delivery of health service at Agogo Presbyterian hospital. The most influential factor identified was high patient to staff ratio (30.9%). Low level of motivation from management (25.8%) of the hospital came next with inadequate logistics constituting 19.6%. Others were communication problem, low remuneration and inadequate health facilities (equipment).
From the patients’ perspective, some of the challenges were, inadequate space for out-patients, length of queue, service delivery time, some attitude of staff towards patience, the cost of service delivery, the lack of public address systems, facility for escorts, inadequate toilet and urinal facility, staff to patient ratio, poor security service, payment of extra charge like the development levy.
5. Discussion of Findings
5.1 Background Information of Respondents
From the clients’ data presented, female respondents were in majority. This is possibly due to the fact that the female gender is quick to seek healthcare for the least feel of an infirmity. This agrees with the findings by Li (1996), which concluded that Bolivian women were more likely to make use of medical facilities than men. Some other studies however showed that men are in the majority in seeking healthcare, rather than women (WHO, 1997).
The fact that most respondents (37%) were within the ages of twenty (20) and thirty-five (35) depicts that the younger generation has a better health seeking behavior. This means that the younger generation is more conscious about the state of their health as well as efforts that could impact positively on their wellbeing. It could as well reveal an increasing trend in poor lifestyle of the younger generation – reflecting in poor eating and sleeping habits, lack of exercise as well as overindulgence in sex and alcohol. The next majority of respondents (32%) found within the above fifty year group also indicates that the population in this group are more likely to seek healthcare, due to the expected frailties and vulnerability associated with advanced age.
Case, et al (2005), identified in their study that an individual’s education level is a key determinant on his decision to seek healthcare, the type of health provider he calls on as well as his spending. They conclude that better educated people respond to their health needs by seeking modern allopathic medicine, in hospitals and clinics as against less educated people who stay home and rely on traditional medicines, drug peddlers and healers. The findings of this study shared similar views in its conclusion, as the majority of respondents (37.7%) were educated up to the tertiary level. This finding is not too surprising as Ashanti-Akim Agogo, the town in which the Presbyterian hospital used in the study is located, have three tertiary institutions. Therefore the town has a high number of tertiary level elites who
9.3
30.9
5.2
19.6
25.8
9.3
0.0
5.0
10.0
15.0
20.0
25.0
30.0
35.0
Communicationproblem
Highpatient/staff
ratio
Inadequatehealth facility
Inadequatelogistics
Low motivationfrom
management
Lowremuneartion

http://ijba.sciedupress.com International Journal of Business Administration Vol. 6, No. 4; 2015
Published by Sciedu Press 73 ISSN 1923-4007 E-ISSN 1923-4015
are potential clients of the hospital. However, a total of forty percent (40%) of respondents having no education at all or only up to the basic school level is of significance, as it reflects the local community as well as the farming villages in the Ashanti-Akim area.
A good percentage of respondents (16.6%) visiting the facility for the first time could be explained by the fact that it is a major referral center for the two Ghana Health Service hospitals in the municipality; Konongo Government Hospital and Juaso Government hospital, as well as First Class Hospital – a private hospital in Konongo and the various health centers and clinics in the catchment area. Its wide range of services and specialties endears it to many other health facilities and professionals as an ideal referral center for most medical conditions, in which many of the patients involved may be accessing these services for the first time.
As may be expected, it was not uncommon to find a good majority of respondents (53%) visiting the hospital only when they felt sick. The visits are made not just when they are sick, but also after many have sought relief from other traditional health providers such as spiritualists, herbalists, healers etc. Some also continue to patronize both modern medicine and traditional medicine (Tabi & Powell, 2006), and will report to the hospital only when their condition becomes very critical. This is very typical of most Ghanaians’ health seeking behavior.
5.2 Factors Associated with Patients’ Satisfaction
Clients were generally satisfied with the human relations of staff, communication by staff, their performance as well as general service delivery. It was not surprising to find that clients’ satisfaction with the attitude of staff translated to an overall satisfaction with the general service delivery. This is because, in service delivery, the people (provider) cannot be detached from the service. The performance of the staff is therefore deemed the quality of the service. This agrees with earlier findings by Andaleeb (1998) which identified staff communication with patients, competence of staff and their demeanor as most critical factors associated with clients satisfaction in service delivery. One possible reason for this feat by the hospital could be due to the relatively superior quality it offers as a mission hospital, owned and governed by the Presbyterian Church of Ghana. Although not a typical private hospital, its mission and vision statement, strategy, ethics, organizational structure and overall governance flows from that of the Presbyterian Mission, thereby aligning them to some strict scrutiny, monitoring and commitment. The hospital also enjoys some financial and logistical support from the Church as well as other humanitarian organizations. In related studies, Frimpong et al, (2010) concluded that private healthcare clients gained a level of satisfaction better than those calling on typical public facilities. Irfan & Ijaz (2011) also observed that private hospitals in Pakistan were delivering better service quality than public hospitals.
Respondents also demonstrated a high level of client loyalty as the mean of 1.74 (close to 2) depicts that they are likely to repeat purchase and also recommend service to others. This observation clearly underscores the strong relationship between client satisfaction and repeat of purchase. Zeithaml & Bitner, (2000) observed this same relationship in their study as they asserted that satisfaction has a greater tendency to motivate satisfied clients to continue consumption and increase word of mouth recommendations to raise new clients without extra cost on marketing communication.
Respondents displayed much dissatisfaction towards the time they spent in the hospital. As clients, they expect to receive prompt attention to their healthcare needs without any delay whatsoever. This is due to the fact that most clients report to the hospital when sick and in fact, when very sick. Therefore, any delay in attending to them often leaves them in abject pain and discomfort. Other studies have also identified delay in service delivery as a crucial factor in dissatisfaction of customers (Rajnish, et al, 2010; Sachdev & Verma, 2004). In the context of health service delivery, one major reason that could account for this delay in delivery is the many paper works, folder retrieval and filling of health insurance claim sheets for every patient.
From the perspective of the clients, the doctor outperforms every other staff of the hospital, as the majority of them (43%) rated the doctor as the best performed staff. This is possibly due to the fact that patients enjoy better contact with the doctor through processes such as consultation and surgical procedures. All other interventions by other clinical and paramedical staff either prepare the patient for the ultimate – meeting the doctor, or have to augment what the doctor had already initiated. This consequently heightens the need of the doctor, making him invaluable.
5.3 Patients’ Knowledge of the Right to Demand and Expect Service Quality
A good majority of respondents (62.6%) indicated that they were aware they had rights as patients, which are protected by law especially in demand for service quality. The right to healthcare has long been recognized as a fundamental human right must be exercised and respected (World Health Organization, 1946). Other research findings do not conform to this. For example Kagoya, et. al., (2013) observed in their work that patients consider

http://ijba.sciedupress.com International Journal of Business Administration Vol. 6, No. 4; 2015
Published by Sciedu Press 74 ISSN 1923-4007 E-ISSN 1923-4015
access to healthcare at Mulago Hospital as a favour rather than a right, and thus rarely demand their rights, for the fear of being discriminated against whilst accessing care. This level of awareness is more likely to be associated with the education level of respondents. With the majority of respondents having been educated up to a minimum of senior high level according to Table 2, it is expected that this same majority demonstrate a good level of knowledge, concerning the protection of their right to demand quality service. In spite of this knowledge, the vast majority of patients (81%) were not aware of practical measures and visible channels put in place by the hospital to demand quality. There is an agreement between this finding and that found in Uganda which reported how passive patients were, with regards to demanding their rights in a healthcare system they considered as doing them a favor, as they felt inadequately empowered by the existing system to make such demands (Uganda National Health Users’/Consumers’ Organization (UNHCO), 2003). The staff that gave their perspective on this particular variable affirmed this position. Almost half of the staff respondents (49%) affirmed the unavailability of visible channels through which clients could report their dissatisfaction, in their quest to demand service quality.
5.4 Assessing the Impact of Some Service Dimensions on Patients Satisfaction
From the regression analysis output in Table 6, it was realized that the independent variables (human relation of staff, communication from staff, staff performance, waiting time and physical evidence) have a strong relationship with patients’ satisfaction (dependent variable). The correlation value was 0.801 (when the correlation value falls between 0.70 and 1.00, it is considered a high correlation). The value is also positive which indicates that when the independent variables increase, employee satisfaction also increases and vice versa. The R2 value indicates that 64.1% (0.641) of patients’ satisfaction (dependent variable) could be explained using these independent variables. This significant statistical correlation depicts the strong impact that these practical service dimensions have on client satisfaction. Failure to maintain or improve these service dimensions would therefore translate to a very significant drop in client satisfaction, as these dimensions account for 64% of variations in client satisfaction.
The coefficients of the independent variables in the resultant regression equation as well as their signs also point out the individual impact of these dimensions on client satisfaction. From the same Table 6 and the resultant regression equation, it is realized that the coefficient value for staff human relation is 0.480. This means that ceteris Paramus, when the other independent variables are held constant, patients’ satisfaction would increase by 48% if there were a 100% improvement in the human relation of staff. This was statistically significant (0.001 < .05). A coefficient value of 0.320 for staff performance means that ceteris paribus, when the other independent variables are held constant, patients’ satisfaction would increase by 32% if there were a 100% improvement in staff performance. This was also statistically significant (0.020 < .05). With a coefficient value of 0.450 for waiting time, it means that ceteris Paramus, when the other independent variables are held constant, patients’ satisfaction would increase by 45% if there is a 100% improvement in patient waiting time, making this dimension also statistically significant (.037 < .05). With the analysis indicating a coefficient value of 0.271 for physical evidence, it also means that ceteris Paramus, when the other independent variables are held constant, patient’s satisfaction would increase by 27.1% if there is a 100% improvement in the physical evidence. This is also statistically significant (.042 < .05).
From the analysis above, human relation of staff comes out as the single most critical service dimension influencing patient satisfaction, since it has the major possible impact of 48%. This is very pertinent, taking into account the feminist nature of the Ghanaian culture which places much premium on relationships, cooperation, group decision at meetings, and qualitative life (Hofstede 1984). This means that much of the efforts meant at increasing client satisfaction with the service delivery of the hospital should be directed at improving the human relation of staff towards clients. This could be achieved through effective employee training, supervision and motivation. Ensuring the above-mentioned measures would reflect on staff performance, which was identified as another critical client satisfaction driver (with a regression coefficient of 0.320). There are enough findings that emphasize how satisfied employees are able to translate this satisfaction onto their clients, through enhanced service delivery. Rachel, et al (2008) in their study concluded that employees who are more satisfied and motivated in their organization are more committed and involved in ensuring client satisfaction, through high level of quality service delivery.
The next most critical service dimension impacting on client satisfaction was waiting time. With a coefficient of 0.450 and accounting for a possible 45% of client satisfaction, time taken to deliver health service in the hospital becomes very crucial in ensuring client satisfaction. With clients unequivocally stating their dissatisfaction with the time it takes them to access health service in the facility (Table 3), it is not out of expectation that waiting time exerts such impact on client satisfaction. Waiting time has been the headache of almost every hospital in Ghana because of obvious infrastructural and human resource constraints. Recognizing this strong correlation between waiting time

http://ijba.sciedupress.com International Journal of Business Administration Vol. 6, No. 4; 2015
Published by Sciedu Press 75 ISSN 1923-4007 E-ISSN 1923-4015
and client satisfaction will be the impetus to urge hospital authorities adopt and implement contemporary measures that reduce waiting time.
5.5 Challenges Affecting Satisfactory Service Delivery
When staff of the hospital were asked to indicate the factors that militate against effective delivery of health service at Agogo Presbyterian Hospital, the most influential factor they identified was high patient to staff ratio (30.9%). This in reality is one of the underlining reasons for clients’ dissatisfaction with the time they spend in the hospital. Due to the status of Agogo Presbyterian Hospital as the second biggest hospital in the Ashanti Region, it serves as a major referral center to other surrounding hospitals and health centers. This situation coupled with the already densely populated Ashanti-Akim North district (population of 170, 882) presents the hospital with such a large number of potential clients, thereby putting so much pressure on the inadequate facilities and staff. Since there is a limit to what one could do, it is not uncommon to find the Out Patient Department congested, with patients having to wait for quite some time before been attended to. This inability to manage the high patient load affects the quality of care, which translates to client dissatisfaction. Findings from other studies in similar contexts are not any different. Irfan et al. (2012) identified patient overcrowding in public hospitals as the major militating factor against satisfactory health service delivery.
The next major challenge identified was inadequate staff motivation and remuneration. (25.8%) of staff claimed that management had not done enough to motivate them to give off their best. Satisfied and well-motivated staff has been identified by other studies as key players in achieving satisfactory service delivery (Rachel, et al, 2008). The recent upward review of staff rural allowance across board was a positive action by management of the hospital, to improve staff remuneration. Again, the many sponsorship packages that are granted selected staff to pursue sought-after courses that empowers them with critical skills are also motivating enough. Moreover, the institution of the Annual Staff Performance Awards by management is also a step in the right direction, provided the packages attached to being selected and winning is improved. It is only unfortunate, that more often than not, staff perception of motivation is limited to monetary rewards, and so other well-crafted motivation packages fail to tickle their sensitive nerves to generate in them the expected responses. The challenge of inadequate logistics and health facilities was well captured by a good number of staff respondents (19.6%). Health service unlike other service industries thrives on essential logistics and facilities such as drugs and consumables, diagnostic instruments and materials, results analyzers etc. Any action or inaction that militates against the availability, functioning, efficiency or accuracy of these items possibly affects the technical or functional quality of the service (Gronroos, 1984). If management is able to put in place systems to forestall this challenge, it may go a long way to improve service delivery and client satisfaction.
From the patients’ perspective, the challenges were not too different from that identified by staff. While some may be peculiar to Agogo Presbyterian Hospital, the majority of what they enumerated epitomizes the state of most hospitals in Ghana. Among them are; inadequate space for out-patients, length of queue, service delivery time, the cost of service delivery, the lack of public address systems, facility for escorts, inadequate toilet and urinal facility, staff to patient ratio, poor security service, inadequate space at the out-patients department, payment of extra charge like the development levy.
6. Conclusions and Recommendations
6.1 Conclusions
It can be concluded that overall, patients were satisfied with the health service delivery at Agogo Presbyterian hospital. The factors that led to the satisfaction were effective human relation from staff (doctors, pharmacists, nurses and other staff), effective communication and general performance of staff. For this reason, patients were likely to recommend service to family and friends, as well as repeat the purchase of the health service. The study also concluded that most of the patients were aware of their rights, however they were not privy to how it could be accessed. The study indicated a high correlation between the independent variables (human relation of staff, communication from staff, staff performance, waiting time and physical evidence) and the dependent variable (patients’ satisfaction). For this reason, the facility must take keen interest in maintaining or improving on them, so as to enhance the satisfaction of their patients. Again, high patient to staff ratio as well as low staff remuneration and motivation were identified as key challenges to satisfactory service delivery in Agogo Presbyterian Hospital.
6.2 Recommendations
The study having produced some relevant findings, presents an opportunity for future use in the field of health service marketing. At the end of the study, the researcher presents the following recommendations; Management

http://ijba.sciedupress.com International Journal of Business Administration Vol. 6, No. 4; 2015
Published by Sciedu Press 76 ISSN 1923-4007 E-ISSN 1923-4015
should endeavor to hasten the implementation of the Health Information Management System to help reduce patient waiting time. Also, they should also make available, suggestion boxes and other visible channels to pick relevant feedback from clients. The study, indicating a high correlation between the independent variables (human relation of staff, communication from staff, staff performance, physical evidence and waiting time) and the dependent variable (patients’ satisfaction) means that the health facility must take keen interest in them, so as to enhance the satisfaction of her clients. It is also recommended that, to reduce the service delivery time, more staff should be employed by the hospital. This would reduce the high patient to staff ratio, which both patients and staff complained about. This would also help reduce queuing. Supporting facilities like toilet and urinal must be improved both in quality and quantity, so as to ensure higher satisfaction of patients. These facilities must also be available to those attending to patients. Other recommendations include the provision of a public address system, enhancement in security systems and the reduction or better still elimination of extra charges like the development levy (which increases the financial burden of the patients).
6.3 Areas for Further Studies
Other areas for further study could be in service waiting time at the hospital, and also the assessment of the causes and its effect of waiting on patients’ satisfaction.
References
Aagja, J., & Garg, R. (2010). Measuring perceived service quality for public hospitals (PubHosQual) in the Indian context. International Journal of Pharmaceutical and Healthcare Marketing, 4(1), 60-83. http://dx.doi.org/10.1108/17506121011036033
Abuosi, A.A., & Atinga, R.A. (2013). Service quality in healthcare institutions: estabilishing the gaps for policy action. International Journal of Health Care Quality Assurance, 26(5), 481-492. http://dx.doi.org/10.1108/IJHCQA-12-2011-0077
Akter, M.S., Upal, M., & Hani, U. (2008). Service quality perception and satisfaction: A Study over sub-urban public hospitals in Bangladesh. Journal of Services Research, Special Issue, 125-146.
Andaleeb, S.S. (2001). Service Quality Perceptions and Patient Satisfaction: a Study of Hospitals in a Developing Country. Social Science and Medicine, 52, 1359-1370. http://dx.doi.org/10.1016/S0277-9536(00)00235-5
Bakar, C., Akgun, S.H., & AL Assaf, F.A. (2008). The Role of Expectations in Patient Assessments of Hospital Care. International Journal of Health Care Quality Assurance, 21(4), 343-355. http://dx.doi.org/10.1108/09526860810880144
Bansal, M.K. (2004). Optimising value and quality in general practice within the primary health care sector through relationship marketing: a conceptual framework. International Journal of Health CareQuality Assurance, 17(4), 180-188. http://dx.doi.org/10.1108/09526860410541496
Bara A. C., van den Heuvel, W.J.A., Maarse, J.A.M., & van Dijk, J.P. (2002). Users’ satisfaction with the Romanian health care system: and evaluation of recent health care reforms. European Journal of Public Health (Supplement), 12(4), 39-40.
Berry, L., & Beudapudi, N. (2007). Health care. A fertile field for services research. Journal of Service Research, 10(2), 111-122. http://dx.doi.org/10.1177/1094670507306682
Brundtland G. H. (2001). Improving health systems’ performance, OECD.
Butt, M.M., & de Run, E.C. (2010). Private healthcare quality: applying a SERVQUAL model. International Journal Health Care Quality Assurance, 23, 658-673. http://dx.doi.org/10.1108/09526861011071580
Buttle, F. (1996). SERVQUAL: review, critique, research agenda. European Journal of Marketing, 30(1), 8–31. http://dx.doi.org/10.1108/03090569610105762
Canagarajah, S,, & Ye, X. (2001). Public Health and Education Spending in Ghana in 1992-98. World Bank Publication, 21.
Carman, J. (1990). Consumer perceptions of service quality: an assessment of the SERVQUAL dimensions. Journal of Retailing, 66(1), 33-55.
Cronin, J., & Taylor, S. (1992). Measuring service quality: a reexamination and extension. Journal of Marketing, 56(3), 55-68. http://dx.doi.org/10.2307/1252296

http://ijba.sciedupress.com International Journal of Business Administration Vol. 6, No. 4; 2015
Published by Sciedu Press 77 ISSN 1923-4007 E-ISSN 1923-4015
Dawn, A.G., & Lee, P.P. (2004). Patient expectations for medical and surgical care: a review of the literature and applications to ophthalmology. Survey of Ophthalmology, 49, 513-524. http://dx.doi.org/10.1016/S0039-6257(04)00111-0
De Jager, J., & Du Plooy, T. (2007). Assurance as Determinants of Service Quality for Public Health Care in South Africa. Department of Marketing, Tshwane University of Technology, Pretoria, 96-111.
De Ruyter, K., Wetzels, M., & Bloemer, J. (1998). On the relationship between perceived servicequality, service loyalty and switching costs. International Journal of Service Industry Management, 9(5), 436-453. http://dx.doi.org/10.1108/09564239810238848
Frimpong, O.N., Nwankwo, S., & Dason, B. (2010). Measuring Service Quality and Patient Satisfaction with Access to Public and Private Healthcare Delivery. International Journal of Public Sector Management, 23(3), 203-220. http://dx.doi.org/10.1108/09513551011032455
GhanaWeb. (2010). GhanaWeb News Artcles. Retrieved April 3, 2014, from http://www.ghanaweb.com/GhanaHomePage/NewsArchive/artikel.php?ID=18986
Gronroos, C. (1983). Strategic Management and Marketing in the Service Sector. Boston. Marketing Science Institute.
Gronroos, C. (1984). A service quality model and its marketing implications. European Journal of Marketing, 18, 36-44. http://dx.doi.org/10.1108/EUM0000000004784
Herstein, R., & Gamliel, E. (2006). The role of private branding in improving service quality. Managing Service Quality, 16(3), 306-319. http://dx.doi.org/10.1108/09604520610663516
Irfan, S.M., & Ijaz, A. (2011). Comparison of service quality between private and public hospitals: Empirical evidences from Pakistan. Journal of Quality and Technology Management, 7(1), 1-22.
Kagoya, H.R., Kibuule, D., Mitonga, K.H., Ekirapa-Kiracho, E., & Ssempebwa, J.C. (2013). Awareness of responsiveness to and practice of patients’ rights at Uganda’s national referral hospital. African Journal of Primary Health Care Family Medicine, 5(1), Art. #491, 7 pages.
Kucukarslan, S.N., & Nadkarni, A. (2008). valuating medication-related services in a hospital setting using the disconfirmation of expectations model of satisfaction. Research in Social and Administrative Pharmacy, 4, 12-22. http://dx.doi.org/10.1016/j.sapharm.2007.01.001
Lages, L.F., & Fernandes, J.C. (2005). he SERPVAL scale: A multi-item instrument for measuring service personal values. Journal of Business Research, 58(11), 1562–1572. http://dx.doi.org/10.1016/j.jbusres.2004.10.001
Manaf, N.H. (2005). Quality management in Malaysian public health care. International Journal of Health Care Quality Assurance, 18(3), 204-216. http://dx.doi.org/10.1108/09526860510594767
McCabe, D., Rosenbaum, M.S., & Yu, J. (2007). Perceived Service Quality and Shopping Motivations: A Dynamic Relationship. Services Marketing Quarterly, 29(1), 1-21. http://dx.doi.org/10.1300/J396v29n01_01
McDougall, G., & Levesque, T. (1994). A revised review of service quality dimension: an empirical investigation. Journal of Professional Service Marketing, 11(1), 189-210. http://dx.doi.org/10.1080/15332969.1994.9985149
Mostafa. (2005). An empirical study of patients’ expectations and satisfactions in Egyptian hospitals. International Journal of Health Care Quality Assurance, 18(7), 516-532. http://dx.doi.org/10.1108/09526860510627201
Nekoei-Monghadam, M., & Amiresmaili, M. (2011). Hospital services quality assessment. International Journal of Health Care Quality Assurance, 24(1), 57-66. http://dx.doi.org/10.1108/09526861111098247
Nketiah-Amponsah, E., & Hiemenz, U. (2009). Determinants of consumer satisfaction of healthcare in Ghana: does choice of health care provider matter?. Global Journal of HealthScience, 1(2), 50-61. http://dx.doi.org/10.5539/gjhs.v1n2p50
Pakdil, F., & Harwood, N.T. (2005). Patient Satisfaction in a Preoperative Assessment Clinic: An Analysis Using SERVQUAL Dimensions. Total Quality Management, 16(1), 15-30. http://dx.doi.org/10.1080/1478336042000255622
Parasuraman, A., Zeithaml, V., & Berry, L. (1988). SERVQUAL: a multiple-item scale for measuring consumer perceptions of service quality. Journal of Retailing, 64(1), 12-40.

http://ijba.sciedupress.com International Journal of Business Administration Vol. 6, No. 4; 2015
Published by Sciedu Press 78 ISSN 1923-4007 E-ISSN 1923-4015
Parasuraman, A., Zeithaml, V.A., & Berry, L.L. (1985). A conceptual model of service quality and its implications for future research. Journal of Marketing, 49(4), 41-50. http://dx.doi.org/10.2307/1251430
Peprah, A.A. (2014). Determinants of Patients’ Satisfaction at Sunyani Regional Hospital, Ghana.
Piligrimiene, Z., & Buciuniene, I. (2005). Health Care Quality Evaluation: Medical Marketing Approach. Organizaciju Vadyba Sisteminiai Tyrimal, 34, 127-140.
Purcarea, V.L., Gheorghea, I.R., & Petrescu, C.M. (2013). The Assessment of Perceived Service Quality of Public Health Care Services in Romania Using the SERVQUAL Scale. Procedia Economics and Finance, 6, 573-585. http://dx.doi.org/10.1016/S2212-5671(13)00175-5
Rajnish, K., Sharma, S., & Negi, J. (2010). Proceedings of the 2010 International Conference on Industrial Engineering and Operations Management. Dhaka, Bangladesh: s.n.
Ramez, W.S. (2012). Patients' Perception of Health Care Quality, Satisfaction and Behavioral Intention: An Empirical Study in Bahrain. International Journal of Business and Social Science, 3(18), 131-141.
Robini, R., & Mahadevappa, B. (2006). Service Quality in Bangalore Hospitals- An Empirical Study. Journal of Services Research, 6(1), 59-84.
Sachdev, S.B., & Verma, H.V. (2004). Relative importance of service quality. Journal of Services Research, 4(1), 93-116.
Salomon, L., Gasquet, I., Mounir, M., & Ravaud, P. (1999). Construction of a scale measuring inpatient’s opinion on quality of care. International Journal for Quality in Health Care, 11(6), 507-516. http://dx.doi.org/10.1093/intqhc/11.6.507
Smith, K.B., Humphrey, J.S., & Jones, J.A. (2006). Essential tips for measuring levels of consumer satisfaction with rural health service quality. Rural and Remote Health, 6(4), 594.
Uganda National Health Users’/Consumers’ Organisation (UNHCO) (2003). Study on Patient Feedback Mechanisms at Health Facilities in Uganda. Kampala: UNHCO.
World Health Organization. (1946, July). Constitution, Preamble, proceedings of the International Health Conference, 19-22, New York, p. 1-2.
Zarei, A., Arab, M., Froushani, A., & Rashidian, A. (2012). Service quality of private hospitals: The Iranian patients‘ perspective. Health Services Research, 12(31). http://dx.doi.org/10.1186/1472-6963-12-31
Zeithaml, V.A., & Bitner, M.J. (2000). Services Marketing: Integrating Customer Focus across the Firm. Boston, MA: McGraw-Hill, Inc.