capillary electrophoresis. and microchip.mass spectrometry ... · capillary electrophoresisŒ and...
TRANSCRIPT
Capillary Electrophoresis� and Microchip�Mass Spectrometry Interfaces
and Their Utilization in Bisphosphonate Analysis
Katri Huikko
Viikki Drug Discovery Technology Center Division of Pharmaceutical Chemistry
Department of Pharmacy Faculty of Science
University of Helsinki Finland
Dissertationes Biocentri Viikki Universitatis Helsingiensis
Viikki Drug Discovery Technology Center
Division of Pharmaceutical Chemistry Department of Pharmacy
Faculty of Science University of Helsinki
Finland
Laboratory of Analytical Chemistry Department of Chemistry
Faculty of Science University of Helsinki
Finland
Capillary Electrophoresis� and Microchip�Mass Spectrometry Interfaces
and Their Utilization in Bisphosphonate Analysis
Katri Huikko
Academic Dissertation
To be presented with the permission of the Faculty of Science of the University of Helsinki for public criticism in Auditorium XII (Aleksanterinkatu 5) on May 10th, 2003, at 10 AM.
Helsinki 2003
Supervisors: Prof. Risto Kostiainen Division of Pharmaceutical Chemistry Department of Pharmacy University of Helsinki Finland and Docent Tapio Kotiaho Viikki Drug Discovery Technology Center Department of Pharmacy University of Helsinki Finland Custos: Prof. Marja-Liisa Riekkola Laboratory of Analytical Chemistry Department of Chemistry University of Helsinki Finland Reviewers: Dr. Pierre Thibault Caprion Pharmaceuticals, Inc. Montreal, Quebec Canada and Prof. Pirjo Vainiotalo Department of Chemistry University of Joensuu Finland Opponent: Prof. Karin Markides Department of Analytical Chemistry Uppsala University Sweden © Katri Huikko 2003 ISBN 952-10-1031-2 (printed version) ISSN 1239-9469 ISBN 952-10-1032-0 (pdf) http://ethesis.helsinki.fi/
Yliopistopaino Helsinki 2003
2
CONTENTS�������������������������.������.. 3 LIST OF ORIGINAL PUBLICATIONS ��������.��������������.. 5
ABBREVIATIONS AND SYMBOLS�����������������������.... 6
ABSTRACT��������������������������������... 8 1 INTRODUCTION���������������������������...�.. 10 2 REVIEW OF THE LITERATURE ����������������������� 12
2.1 Capillary electrophoresis�electrospray ionization mass spectrometry (CE/ESI-MS)���. 12
2.1.1 Coaxial sheath liquid interface����������������.��.. 12
2.1.1.1 Interface construction�������������������� 12 2.1.1.2 Effect of sheath liquid on CE/ESI-MS performance���������� 13 2.1.1.3 Optimization of instrumental parameters in CE/ESI-MS��������.. 15
2.1.2 Liquid junction interface ��������������������.. 16
2.1.3 Sheathless nanospray interface������������������.. 17
2.1.3.1 Flow rate and sensitivity considerations�������������... 17 2.1.3.2 Sheathless nanospray construction���������������.. 18 2.1.3.3 Tip fabrication and conductive coatings�������������... 19 2.1.3.4 Characteristics of the sheathless nanospray interface���������.. 20
2.2 Microchips and mass spectrometric detection����������������.. 21
2.2.1 Background�������������������������. 21
2.2.2 Microchip materials and fabrication techniques������������... 24
2.2.2.1 Silicon and glass���������������������.. 24 2.2.2.2 Polymers������������������������ 26 2.2.3 Desorption/ionization on silicon mass spectrometry�����������.. 29
2.2.4 Coupling microchips with electrospray ionization mass spectrometry�����. 31 2.2.4.1 Materials for microchip�ESI-MS����������������. 31 2.2.4.2 Off-chip spraying microdevices����������������... 32 2.2.4.3 On-chip spraying microdevices����������������... 32
2.3 Analysis of bisphosphonates���������������������� 34
2.3.1 Bisphosphonate compounds�������������������... 34
2.3.2 Analytical methods for bisphosphonates���������������.. 35 3 AIMS OF THE STUDY���������������������������. 37 4 MATERIALS AND METHODS������������������������. 38
4.1 Chemicals, samples, and materials��������������������.. 38
4.2 Instruments����������������������������.. 40
4.3 Analytical methods and microfabrication processes��������������.. 41
4.3.1 Capillary electrophoresis�electrospray ionization mass spectrometry (I, III)��� 41
4.3.2 ESI-MSn behavior of bisphosphonate and phosphonate compounds (II)����.. 44
4.3.3 Capillary electrophoretic method for bisphosphonate drug purity analysis (IV)�... 44
4.3.4 Desorption/ionization on silicon mass spectrometry (V)����������. 45
4.3.5 Electrospray ionization from poly(dimethylsiloxane) microchip (VI)�����.. 45
3
5 RESULTS AND DISCUSSION������������������������.. 47 5.1 Examination of CE/ESI-MS interfaces: coaxial sheath liquid and sheathless nanospray
techniques����������������������������... 47
5.1.1 Operating parameters with coaxial sheath liquid interfaces (I, III)������. 47
5.1.2 Construction and evaluation of sheathless nanospray interfaces�������. 49
5.2 Desorption/ionization on silicon mass spectrometry (DIOS-MS)����������. 52
5.2.1 Properties of porous silicon for DIOS-MS (V)�������������.. 52
5.2.2 Applicability of DIOS-MS to low-molecular-weight compounds (V)������ 55
5.3 Poly(dimethylsiloxane) microchip for ESI-MS����������������.. 56
5.3.1 Fabrication of PDMS electrospray device (VI)��������.�����. 56
5.3.2 Performance of PDMS electrospray device (VI)������������� 58
5.4 Application of ESI-MS, DIOS-MS, CE/ESI-MS, and CE-UV to bisphosphonate studies�� 60 5.4.1 ESI-MSn and DIOS-MS behavior of bisphosphonate and phosphonate compounds
(II, V)���������������������������. 60 5.4.2 Analysis of bisphosphonate and phosphonate compounds by CE/ESI-MS and CE-UV (III, IV)������������������������ 64
5.5 Comparison of techniques and considerations for future research���������... 67
6 CONCLUSIONS�����������������������������.. 71 ACKNOWLEDGMENTS���������������������������. 73 REFERENCES�������������������������������... 75
APPENDIX: ORIGINAL PUBLICATIONS I-VI
4
LIST OF ORIGINAL PUBLICATIONS This doctoral thesis is based on the following six articles, hereafter referred to by their Roman numerals (I-VI):
I Huikko, K., Kotiaho, T., and Kostiainen, R. Effects of Nebulizing and Drying Gas Flow on Capillary Electrophoresis�Mass Spectrometry. Rapid Communications in Mass Spectrometry 16 (2002) 1562�1568. II Huikko, K., Kotiaho, T., Yli-Kauhaluoma, J., and Kostiainen, R. Electrospray Ionization Mass Spectrometry and Tandem Mass Spectrometry of Clodronate and Related Bisphosphonate and Phosphonate Compounds. Journal of Mass Spectrometry 37 (2002) 197�208. III Huikko, K. and Kostiainen, R. Analysis of Bisphosphonates by Capillary Electrophoresis�Electrospray Ionization Mass Spectrometry. Journal of Chromatography A 872 (2000) 289�298. IV Huikko, K. and Kostiainen, R. Development and Validation of a Capillary Zone Electrophoretic Method for the Determination of Bisphosphonate and Phosphonate Impurities in Clodronate. Journal of Chromatography A 893 (2000) 411�420. V Tuomikoski, S., Huikko, K., Grigoras, K., Östman, P., Kostiainen, R., Baumann, M., Abian, J., Kotiaho, T., and Franssila, S. Preparation of Porous n-type Silicon Sample Plates for Desorption/Ionization on Silicon Mass Spectrometry (DIOS-MS). Lab on a Chip 2 (2002) 247�253. VI Huikko, K., Östman, P., Grigoras, K., Tuomikoski, S., Tiainen, V.-M., Soininen, A., Puolanne, K., Franssila, S., Manz, A., Kostiainen, R., and Kotiaho, T. Poly(dimethylsiloxane) Electrospray Devices Fabricated by Diamond-like Carbon Poly(dimethylsiloxane)-Coated SU-8 Masters. Lab on a Chip, in press (published on the web: March 6th, 2003). Some unpublished data is included.
5
ABBREVIATIONS AND SYMBOLS AFM atomic force microscopy AP atmospheric pressure APCI atmospheric pressure chemical ionization AP-DIOS atmospheric pressure desorption/ionization on silicon API atmospheric pressure ionization ATP adenosine triphosphate BCQ [(acryloylamino)propyl]-trimethylammonium chloride BGE background electrolyte CE capillary electrophoresis CI chemical ionization CID collision induced dissociation CZE capillary zone electrophoresis CF-FAB continuous-flow fast atom bombardment CVD chemical vapor deposition DIOS desorption/ionization on silicon DLC diamond-like carbon DLC-PDMS-h diamond-like carbon�poly(dimethylsiloxane) hybrid DP declustering potential DRIE deep reactive ion etching EI electron ionization EOF electroosmotic flow ESI electrospray ionization FAB fast atom bombardment FTICR Fourier Transform ion cyclotron resonance GC gas chromatography HPLC high-performance liquid chromatography ICP inductively coupled plasma i.d. internal diameter IS ion spray ITP isotachophoresis LC liquid chromatography LDI laser desorption/ionization LIF laser-induced fluorescence LOD limit of detection LOQ limit of quantitation MALDI matrix assisted laser desorption/ionization MECC micellar electrokinetic capillary chromatography MEMS micro-electro mechanical systems MS mass spectrometry MSn multistage mass spectrometry MS/MS tandem mass spectrometry
6
[M+H]+ protonated molecule [M-H]- deprotonated molecule m/z mass-to-charge ratio N plate number o.d. outer diameter PC polycarbonate PDMS poly(dimethylsiloxane) PET poly(ethylene terephthalate) PGMEA propylene glycol methyl ether acetate PMMA poly(methyl methacrylate) PP polypropylene PS polystyrene pSi porous silicon RIE reactive ion etching RMS root-mean-square RP-HPLC reversed-phased high-performance liquid chromatography RSD relative standard deviation SCCE synchronized cyclic capillary electrophoresis SEM scanning electron microscopy SIM selected ion monitoring S/N signal-to-noise TOF time-of-flight µ-TAS micro-total analysis systems UV ultraviolet XPS X-ray photoelectron spectroscopy
7
ABSTRACT Miniaturization of analytical instruments is being driven by the growing demand for fast and automated analytical methods. Lower sample and reagent consumption, reduced chemical waste production, and low cost of the instruments are also highly relevant. Capillary electrophoresis (CE) is already a step toward decreasing the scale of analyses, providing efficient analytical separations with small sample and reagent volumes. A much more dramatic step is to apply microfabrication technology to analytical instruments, to manufacture "micro-total analysis systems (µ-TAS)" and "Lab-on-a-chip" devices. Mass spectrometry (MS) is a key technique for the highly specific and reliable detection of analytes in multicomponent samples. To couple CE and microfabricated devices with MS requires the use of efficient and robust interfacing methods. Miniaturized analytical techniques were developed utilizing CE, microchip technology, and MS. A series of forensic drugs and amino acids were used as test compounds in the construction and evaluation of the techniques and the techniques were applied for the analysis of bisphosphonate compounds. Bisphosphonates are an important class of drugs for the treatment of calcium metabolic disorders and of various bone diseases such as bone resorption and dissolution. Direct and specific methods are needed for their identification in bulk drug materials. Two coaxial sheath liquid interfaces were constructed and evaluated for the direct coupling of CE to electrospray ionization (ESI)-MS using triple quadrupole and ion trap mass analyzers. For the proper performance of the coaxial sheath liquid CE/ESI-MS system, various operation parameters were optimized; among these the sheath liquid composition and flow rate and the nebulizing and drying gas flows were found to be the most crucial. In addition, a sheathless nanospray CE/ESI-MS interface was constructed. Although higher sensitivity for CE/ESI-MS was provided by the sheathless nanospray technique, the sheath liquid interface was more robust and it worked in both positive and negative ion ESI-MS. Properties of porous silicon were optimized for a new, matrix-free laser desorption/ionization technique, desorption/ionization on silicon (DIOS). DIOS-MS provided fast and reliable identification of low-molecular-weight compounds. The sensitivity varied significantly for the various analytes examined (100 fmol�60 pmol). The highest response was obtained for the basic compounds analyzed in positive ion mode and lowest for the bisphosphonate and phosphonate compounds in negative ion mode. A microchip was also fabricated for ESI-MS. The electrospray was generated directly from a microchannel orifice. Use of poly(dimethylsiloxane) (PDMS) as microchip material aided the formation of a small Taylor cone in the ESI process. The fabrication process for the PDMS microchip was optimized to facilitate the ESI-MS coupling and to allow a straightforward and low-cost production of chips for ESI-MS. The performance of the PDMS microchip was demonstrated in direct-infusion ESI-MS analysis. Fragmentation pathways of bisphosphonates were examined using multistage ESI tandem mass spectrometry with multistage precursor selection (ESI-MSn, n=1�6). The DIOS-MS behavior of the bisphosphonates was also explored. The new CE/ESI-MS method was suitable for the selective identification and screening of bisphosphonates. Furthermore, a CE-
8

UV method was developed for the analysis of bisphosphonate drug purity, and it was found to be more suitable than the CE/ESI-MS method for the quantitative determination of impurity compounds present at 0.01% level in bisphosphonate drug substance. Among the techniques employed in this study, microchip-based systems offered the greatest potential in terms of high-speed analysis, low chemical consumption, and disposability of the devices. Despite the demonstrated feasibility of microchips in the analysis of low-molecular-weight standard compounds, the robustness of the methods and the suitability for a wide range of analytes and sample matrices will need to be explored in more detail before conclusions can be drawn about the potential of microchips in routine analyses.
9
1 INTRODUCTION Miniaturization of analytical instruments is attracting wide interest in analytical chemistry. The driving force for this is an increasing demand for low-cost instruments capable of rapidly analyzing compounds in very small sample volumes with a high level of automation. In the case of pharmaceutical analysis, fast screening methods are especially needed for characterizing new drug candidates. In combinatorial chemistry, thousands of compounds may be produced in a single synthesis and rapid screening methods are essential for identifying them. High sensitivity and selectivity, in turn, are required in drug metabolism studies, in which the small sample volumes make analyses challenging. The high cost of chemicals in many pharmaceutical and biochemical studies is another incentive toward miniaturization.
Capillary electrophoresis (CE) is already a step toward the miniaturization of analytical
separation methods. Highly efficient separation of analytes can be obtained with nanoliter-scale sample volumes and minimal consumption of the separation electrolyte. Coupling mass spectrometric (MS) detection with CE allows highly selective detection, along with structural information, of the analytes. Electrospray ionization (ESI) is the most frequently applied ionization method for the CE/MS combination. Various types of CE/ESI-MS interfaces have been constructed, such as coaxial sheath liquid, liquid junction, and sheathless nanospray. Each has its limitations, however. In a search for the optimal CE/MS interface, one important issue is how to maintain the separation efficiency of CE when it is interfaced with MS. Another issue to be considered is the concentration sensitivity of the CE/MS technique since the sample loading capacity of CE is limited.
A much more dramatic step in miniaturization is to utilize microfabrication technology for
analytical instruments. The terms "Micro-Total Analysis Systems (µ-TAS)" and "Lab-on-a-chip" refer to the integration of multiple functions such as filtering, sample pre-concentration, chemical reaction, analytical separation and detection on a single chip. The benefits to be expected are fast response, portability, and disposability of devices in addition to fast and parallel reactions and analyses of small sample volumes. MS is attracting increasing interest as a detection method in µ-TAS. Currently, the main focus in combining chip technology and MS is to integrate ionization methods on microchips and to interface on-chip sample preparation and separation systems with MS. In this study, coupling of CE (I, III) and microchips (V, VI) with MS detection via ESI and laser desorption/ionization methods was examined. Both sheath liquid and sheathless CE/MS interfaces were constructed. Microchip technology was used in further miniaturization of the analytical techniques. Properties of porous silicon chips were optimized for the new matrix-free laser desorption/ionization technique, desorption/ionization on silicon mass spectrometry (DIOS-MS) (V). In addition, a microchip for direct electrospray from a microchannel orifice was fabricated using poly(dimethylsiloxane) and its performance in ESI-MS was demonstrated (VI).
10
Applicability of the techniques was studied in pharmaceutical analysis. A series of forensic drugs and two amino acids were used as test compounds in construction and characterization of capillary electrophoretic and chip-based mass spectrometric techniques in positive ion mode. As a far more challenging application, methods were developed for bisphosphonate compounds. Bisphosphonates are an interesting group of compounds for CE analysis because they are very difficult to analyze by standard liquid chromatography (LC). They are highly polar and ionic in nature and their strong tendency to form complexes with metal ions leads to poor retention behavior, adsorption problems in reversed-phase LC, and precipitation where exposed to metal parts of LC instruments. Another problem associated with the analysis of bisphosphonates is the lack of strong UV chromophores in their structure. Previous methods for bisphosphonate analysis have generally been based on ion exchange or ion pair chromatographic separation with either indirect or direct UV detection, the latter involving time-consuming derivatization procedures. In addition to the long analysis times, these methods suffer from lack of specificity and separation efficiency. In this study, analytical methods utilizing CE separation with ESI-MS (III) and direct UV (IV) detection were developed for the bisphosphonate drug clodronate and its related bisphosphonate and phosphonate impurity compounds. DIOS-MS was utilized as well (V). For the CE separation of these compounds, several parameters affecting the separation were examined, including dimensions of the separation capillaries; capillary coatings; composition, pH, and ionic strength of electrolyte solutions; and various instrumental parameters (III, IV). To optimize the ESI-MS detection for the bisphosphonate and phosphonate compounds, the fragmentation pathways of these compounds were examined using triple quadrupole and ion trap instruments (II). Polyprotic acidity of the compounds allowed study of the correlation between the degree of deprotonation in the gas phase and dissociation in the liquid phase (II).
11
2 REVIEW OF THE LITERATURE 2.1 Capillary electrophoresis�electrospray ionization mass spectrometry (CE/ESI-MS) The high resolving power provided by capillary electrophoresis (CE) and the structural information provided by mass spectrometry (MS) make CE/MS an attractive combination. The first capillary electrophoresis�mass spectrometry (CE/MS) interface was demonstrated in 1987 (Olivares et al. 1987) with electrospray ionization (ESI). Since then, on-line interfacing of CE and MS has been realized with several other ionization methods as well, including continuous-flow fast atom bombardment (CF-FAB) (Moseley et al. 1990, Suter and Caprioli 1992), atmospheric pressure chemical ionization (APCI) (Takada et al. 1995, Isoo et al. 2001, Tanaka et al. 2003), and laser desorption/ionization (LDI) (Chang and Yeung 1997). Among these ionization methods, ESI has most often been employed owing to the relatively simple interface construction. The majority of capillary electrophoresis�electrospray ionization mass spectrometry (CE/ESI-MS) systems have been constructed with quadrupole instruments partly due to their wide availability but also to their versatile tandem mass spectrometry (MS/MS) capabilities. Time-of-flight (TOF) (Muddiman et al. 1995, Lazar et al. 1998) and quadrupole ion trap (Foret et al. 1994, Ingendoh et al. 1999) mass spectrometers have been used for faster full-mass-range scan rates to allow larger numbers of data points to be recorded across a CE peak. In addition, magnetic sector (Moseley et al. 1990) and Fourier Transform ion cyclotron resonance (FTICR) (Hofstadler et al. 1993) analyzers have been utilized. CE/ESI-MS has been applied to various analytical tasks, such as pharmaceutical, clinical, environmental, and agricultural studies, where it can be considered as a complementary technique to the more routinely used liquid chromatography�mass spectrometry (LC/MS). However, wider applicability of CE/ESI-MS in long-term routine use has been limited by the difficulties in obtaining a robust system. Interfacing of CE to MS without losing the separation efficiency of CE has been difficult. The separation efficiency may be limited due to the small number of CE separation electrolytes compatible with ESI, or to the interface construction itself. Another limiting factor is the low sample loading capacity of CE. Thus, various types of CE/ESI-MS interfaces have been constructed, such as coaxial sheath liquid, liquid junction, and sheathless nanospray interfaces. Several studies have aimed at improving the separation efficiency, concentration sensitivity, and robustness of the CE/ESI-MS technique. 2.1.1 Coaxial sheath liquid interface 2.1.1.1 Interface construction The coaxial sheath liquid interface was demonstrated in 1988 (Smith et al. 1988) and since then has become the most widely used technique for coupling capillary electrophoresis (CE) with electrospray ionization mass spectrometry (ESI-MS) (Moini 2002). Simpler fabrication, better stability, and more reproducible operation of the system than with the liquid junction or sheathless nanospray interfacing techniques have been reported (Pleasance et al. 1992, Smith et al. 1993, Tetler et al. 1995, Palmer et al. 2000, Moini 2002, Neususs et al. 2002). The main
12
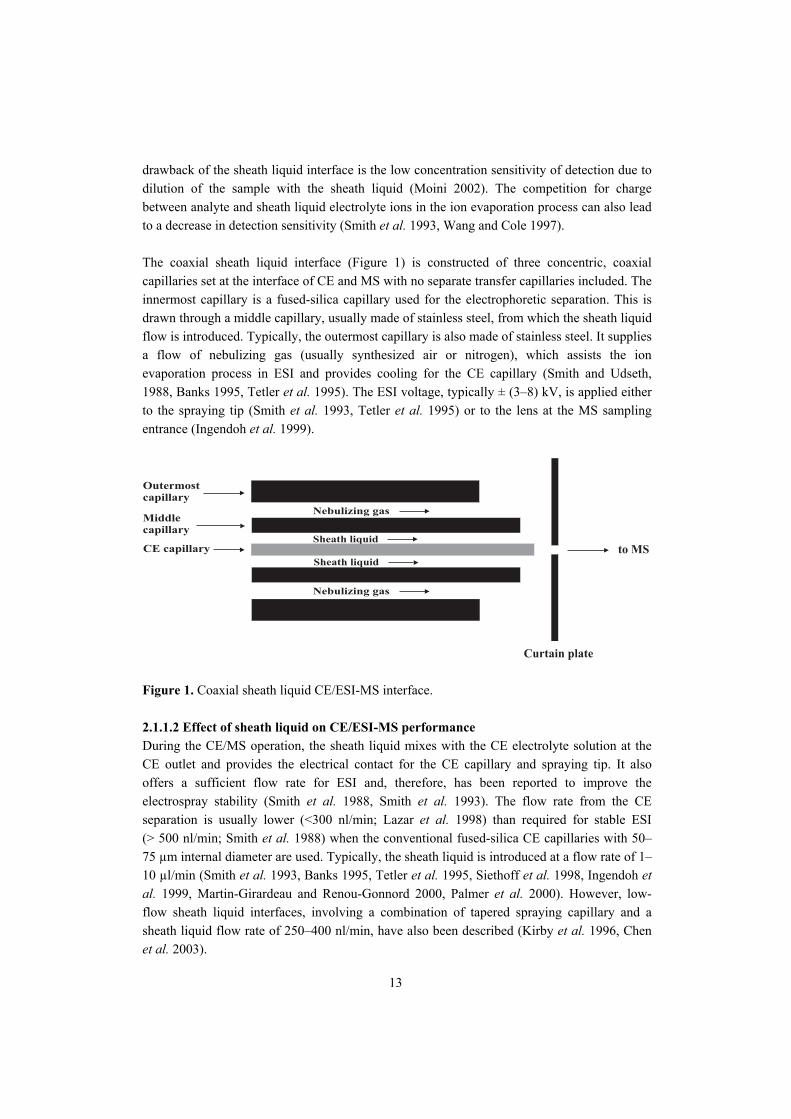
drawback of the sheath liquid interface is the low concentration sensitivity of detection due to dilution of the sample with the sheath liquid (Moini 2002). The competition for charge between analyte and sheath liquid electrolyte ions in the ion evaporation process can also lead to a decrease in detection sensitivity (Smith et al. 1993, Wang and Cole 1997). The coaxial sheath liquid interface (Figure 1) is constructed of three concentric, coaxial capillaries set at the interface of CE and MS with no separate transfer capillaries included. The innermost capillary is a fused-silica capillary used for the electrophoretic separation. This is drawn through a middle capillary, usually made of stainless steel, from which the sheath liquid flow is introduced. Typically, the outermost capillary is also made of stainless steel. It supplies a flow of nebulizing gas (usually synthesized air or nitrogen), which assists the ion evaporation process in ESI and provides cooling for the CE capillary (Smith and Udseth, 1988, Banks 1995, Tetler et al. 1995). The ESI voltage, typically ± (3�8) kV, is applied either to the spraying tip (Smith et al. 1993, Tetler et al. 1995) or to the lens at the MS sampling entrance (Ingendoh et al. 1999).
Sheath liquid
Nebulizing gas
Sheath liquid
Nebulizing gas
CE capillary
Middlecapillary
to MS
Curtain plate
Outermostcapillary
Figure 1. Coaxial sheath liquid CE/ESI-MS interface. 2.1.1.2 Effect of sheath liquid on CE/ESI-MS performance During the CE/MS operation, the sheath liquid mixes with the CE electrolyte solution at the CE outlet and provides the electrical contact for the CE capillary and spraying tip. It also offers a sufficient flow rate for ESI and, therefore, has been reported to improve the electrospray stability (Smith et al. 1988, Smith et al. 1993). The flow rate from the CE separation is usually lower (<300 nl/min; Lazar et al. 1998) than required for stable ESI (> 500 nl/min; Smith et al. 1988) when the conventional fused-silica CE capillaries with 50�75 µm internal diameter are used. Typically, the sheath liquid is introduced at a flow rate of 1�10 µl/min (Smith et al. 1993, Banks 1995, Tetler et al. 1995, Siethoff et al. 1998, Ingendoh et al. 1999, Martin-Girardeau and Renou-Gonnord 2000, Palmer et al. 2000). However, low-flow sheath liquid interfaces, involving a combination of tapered spraying capillary and a sheath liquid flow rate of 250�400 nl/min, have also been described (Kirby et al. 1996, Chen et al. 2003).
13
Both the CE electrolyte and the sheath liquid affect the transfer of analyte ions from liquid phase to gas phase. Since the sheath liquid represents the bulk of the liquid in the electrospray process it must be chosen to facilitate the ionization of the analytes. Achieving maximum ESI efficiency is not straighforward, however: in addition to the various analyte properties (e.g. pKa, hydrophobicity, surface activity, ion solvation energy) affecting the ionization (Wang and Cole 1997, Kebarle 2000), the nature of the solution affects the formation of gas-phase ions in multiple ways. For instance, the onset potential for ESI (i.e. the minimum voltage to form the Taylor cone, which emits a fine spray of charged droplets) has been reported to increase with solution surface tension (Cole 2000). Lower surface tension facilitates droplet break-up in the ion evaporation process and reduces the tendency to produce unwanted electric discharges. Conductivity of the solution is another critical parameter. The radius of generated charged droplets in the ESI process decreases with increasing conductivity (Cole 2000, Kebarle 2000), which means that the use of high conductivity solutions results in smaller droplets. These can improve the ion transfer ratio due to the high surface-to-volume ratio and, hence, the large proportion of analyte molecules available for desorption (Wilm and Mann 1996). At the same time, with high conductivity electrolytes, the competition between the analyte and electrolyte ions for charge may decrease the sensitivity (Wang and Cole 1997, Kebarle 2000) and since the spray current increases with solution conductivity (Kebarle 2000), the risk for electric discharges also increases. Lower solution viscosity allows the formation of smaller initial droplets (Cole 2000) improving the ion transfer efficiency. Solution pH determines the degree of protonation or deprotonation of bases and acids in liquid phase and influences the observation of charged ions in the gas phase. However, many different views exist regarding the relationship between the degree of charge associated with an ion in a neutral solution (as determined by liquid phase equilibria) and the distribution of charge states observed in the ESI mass spectrum (Gaskell 1997, Wang and Cole 1997, Cole 2000, Kebarle 2000). The charge state distribution is reported to be affected in part by the changes in droplet pH due to the solvent evaporation and electrochemical processes, and by the proton transfer and neutralization reactions in the gas phase (Wang and Cole 1997, Amad et al. 2000, Kebarle 2000, Zhou et al. 2002). Moreover, higher solvent polarity has been reported to shift the dissociation equilibria in favor of the formation of higher charge state ions in solution. In turn, more highly charged ions have been observed in the ESI mass spectra (Wang and Cole 1997, Cole 2000). The sheath liquid also acts as an outlet electrolyte for the CE and in that way can affect the separation (Foret et al. 1994, Wheat et al. 1997, Lazar et al. 1998). For instance, formation of moving ionic boundaries inside the capillary has been observed and linked to the migration of sheath liquid counterions into the CE capillary (Foret et al. 1994). This has led to delays, inversions in migration order, and loss of resolution. Several suggestions have been made for prevention of the entry of the sheath liquid into the capillary. These include the use of a common counterion or of counterions with similar pKa and electrophoretic mobility in the CE electrolyte and sheath liquid, and increasing the flow rate from the CE capillary (Foret et al. 1994, Lazar et al. 1998).
14
For the above reasons, it is clear that the sheath liquid must be compatible and adjusted in accordance with the CE running electrolyte. It should provide low surface tension, be volatile, and also be sufficiently conductive to complete the CE separation circuit and to permit ESI. However, it should not be as high in ionic strength as to create electric discharges or to suppress the ionization of analytes by the competing ions in the droplet. Typically, the sheath liquid has high content of non-aqueous solvent with low surface tension (such as alcohols, acetonitrile, acetone) and a volatile electrolyte (such as ammonium acetate or formate, acetic acid, formic acid, ammonium hydroxide) at lowest practical concentration (<25 mM) (Smith et al. 1991, Foret et al. 1994, Wheat et al. 1997, Hau and Roberts 1999, Huber et al. 1999, Schramel et al. 1999, Martin-Girardeau and Renou-Gonnord 2000, Larsson et al. 2001, NúŔez et al. 2002). 2.1.1.3 Optimization of instrumental parameters in CE/ESI-MS Achieving stable CE/ESI-MS operation with maximum separation efficiency and detection sensitivity involves adjusting of various instrumental parameters such as injection voltage/pressure, separation and ESI potentials, capillary dimensions, height levelling of the CE capillary inlet and electrospray outlet, and the distance of the CE capillary from the MS inlet lens (Smith et al. 1991, Smith et al. 1993, Kirby et al. 1996, Lu et al. 1996, Lazar et al. 1999, Martin-Girardeau and Renou-Gonnord 2000). Many authors also note the importance of correct placement of the CE capillary tip with respect to the sheath liquid capillary. Usually, the maximal signal response and stability of the system have been achieved when the CE capillary protrudes 0.05�0.3 mm from the sheath liquid capillary (Banks 1995, Lu et al. 1996, Hau and Roberts 1999, Jáurequi et al. 2000, Martin-Girardeau and Renou-Gonnord 2000, NúŔez et al. 2002) but the distance of 0.5�0.7 mm has also been employed (Schramel et al. 1999). In an attempt to improve the ESI stability, some authors have removed a small part of the polyimide coating from the end of the fused-silica capillary, so improving the wettability by the sheath liquid (Hau and Roberts 1999, NúŔez et al. 2002). The wettability is also reported to improve with thinner capillary walls (Siethoff et al. 1998). Moreover, Tetler et al. (1995) note that the dimensions of the coaxial capillaries, such as their internal and outer diameters and, hence, the wall thickness, influence the detection sensitivity and ion current stability. Likewise, gas flow parameters are of great importance for the sheath liquid CE/ESI-MS coupling. The nebulizing gas flow, for instance, has been reported to affect the signal response (NúŔez et al. 2002). A few studies have been made on the influence of the nebulizing gas on the CE separation. Henion et al. (1994) reported that the nebulizing gas only slightly affects the flow in CE capillaries with internal diameter (i.d.) of 50 µm or smaller but markedly increases the flow in large-bore capillaries (100 µm i.d.). Jáuregui et al. (2000), in turn, observed the effect of nebulizing gas flow on peak shape and migration with CE capillaries of 75 µm i.d.. Some authors (Martin-Girardeau and Renou-Gonnord 2000) have turned off the nebulizing and drying gas during hydrodynamic injection to prevent sample loss or to prevent creation of reverse flow by the altered capillary pressure. CE capillary pressure has been altered in a controlled way to overcome the extended analysis times associated with the long
15
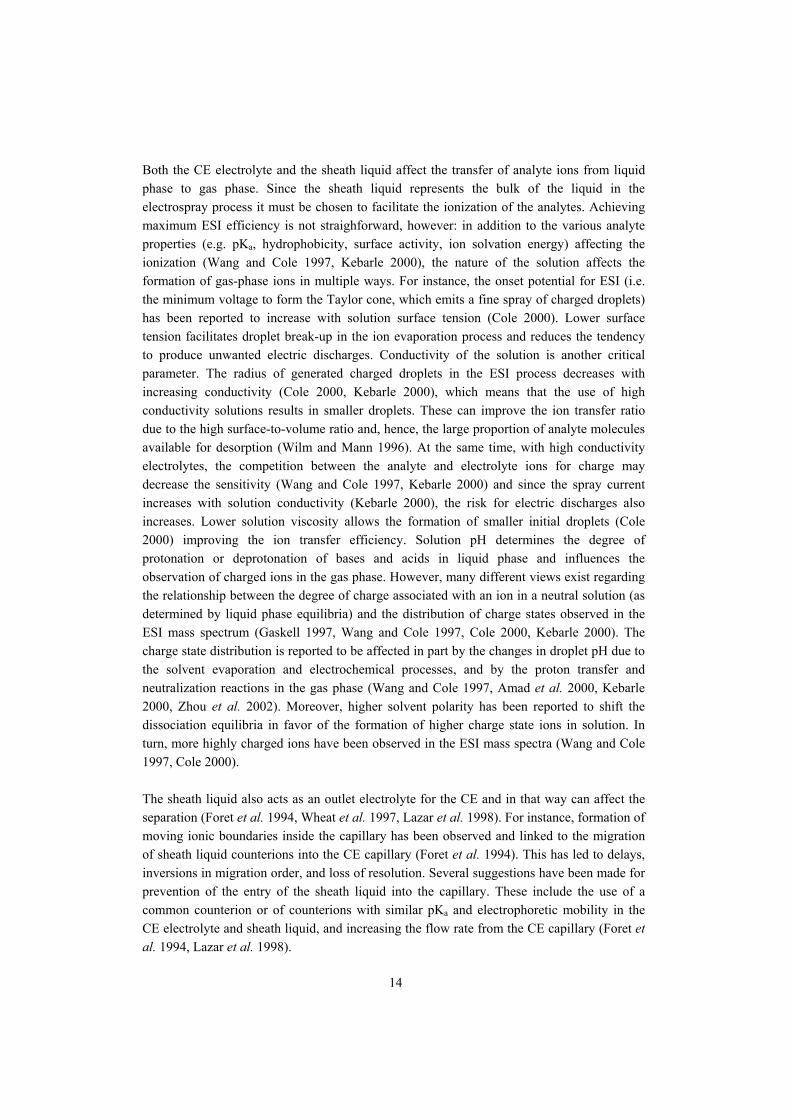
separation capillaries generally needed for CE/MS coupling. Pressure-assisted CE/MS involves simultaneous application of low hydrostatic pressure and voltage (Banks 1995, Lazar et al. 1998, Hau and Roberts 1999) or pressurizing of the CE buffer inlet after the separation for transferring the separated bands to the MS (Schramel et al. 1999). Some loss of resolution but reduced analysis times (Banks 1995, Schramel et al. 1999) and improved run-to-run repeatability (Hau and Roberts 1999) have been reported with pressure-assisted CE/MS. Increased separation efficiency has also been achieved (Lazar et al. 1998). 2.1.2 Liquid junction interface The first liquid junction interface for coupling CE to ESI-MS was demonstrated in the late 1980s (Lee et al. 1989). The interface utilizes the sheath liquid approach but differs from the coaxial sheath liquid interface in construction. For the liquid junction coupling (Figure 2), the CE separation capillary is interfaced with a transfer capillary, which reaches near to the MS inlet lens and is used for electrospraying (Lee et al. 1989). Electrical contact is applied through a sheath liquid reservoir surrounding a narrow gap between the CE and transfer capillaries. The gap is typically adjusted to 10�25 µm to allow a sufficient amount of sheath liquid to be drawn into the transfer capillary while at the same time avoiding analyte loss (Cai and Henion 1995, Severs and Smith 1997, Sheppard and Henion 1997).
CE capillary
to MS
Curtain plate
Spraying capillary
Nebulizing gas
Liquid junction
Figure 2. Liquid junction CE/ESI-MS interface. The same demands apply to the sheath liquid of the liquid junction interface as discussed above for the coaxial sheath liquid arrangement, that is, maintaining the electrical contact and sufficient flow rate for the CE/ESI-MS. With the liquid junction interface, the sheath liquid flow also assists in carrying the effluent from the CE capillary into the transfer capillary (Tomer et al. 1998). In the first liquid junction interface, the sheath liquid was delivered by gravity feed (Lee et al. 1989). In a subsequent improved design, the sheath liquid flow rate was controlled by an infusion pump, which ensured that most of the flow exited through the
16
sprayer capillary. Because of the low sheath liquid flow back into the CE capillary, the CE inlet was also pressurized (Wachs et al. 1996). Other modifications include changing the spraying capillary material from stainless steel to fused-silica to reduce the adsorption of compounds on capillary walls and changes in the capillary junction construction for an improved alignment (Johansson et al. 1991, Wachs et al. 1996). Liquid junction CE/MS is not as widely applied as coaxial sheath liquid CE/MS. One major drawback of the liquid junction interface is that it requires high precision in aligning the CE and sprayer capillaries (Pleasance et al. 1992, Wachs et al. 1996). Band broadening, contamination of the sheath liquid when the CE capillary is flushed with electrolyte or cleaning solution, and higher background noise level than with the coaxial sheath liquid interface have also been reported (Pleasance et al. 1992). Wachs et al. (1996) concluded, however, that, with the interface modifications described in the previous paragraph, liquid junction CE/ESI-MS provides good separation efficiency and higher signal-to-noise ratios than the coaxial interface. One notable feature of the liquid junction is the possibility it offers to combine capillaries of different diameter for separation and spraying through the junction (Severs and Smith 1997). The benefits of the coaxial interface nevertheless outweigh those of the liquid junction � benefits such as zero dead-volume, simpler fabrication, and better stability and robustness of the coaxial interface system (Pleasance et al. 1992, Smith et al. 1993, Tetler et al. 1995, Palmer et al. 2000, Moini 2002, Neususs et al. 2002). 2.1.3 Sheathless nanospray interface The first CE/MS interface, described in 1987, utilized the sheathless CE/ESI-MS principle, meaning that no sheath-flow is applied (Olivares et al. 1987). It was because of the problems in spray stability with this first interface that sheath liquid interfaces were subsequently introduced (Smith et al. 1988, Lee et al. 1989). Later, various sheathless CE/ESI-MS interfaces with a nanospray approach were developed to overcome the problem of poor concentration sensitivity with the sheath liquid interfaces. Constructing a sheathless nanospray interface for stable and robust long-term use seems to be difficult, however, and many groups have addressed this issue. In a typical sheathless nanospray interface, the electrospray is maintained from a narrow spraying tip (<50 µm i.d.) at a low flow rate (nl/min-scale) without addition of sheath liquid. In general, nebulizing gas is not applied either. The electrical connection to the capillary outlet is usually provided by a direct metal/liquid contact at or near the CE capillary end (Moini 2002). 2.1.3.1 Flow rate and sensitivity considerations The improvement of ESI sensitivity often requires decreasing the flow-rate of the electrolyte and miniaturizing the spraying emitters. At the beginning of the ESI process, the excess charges accumulate near the end of the ESI capillary and are electrically attracted to the counter-electrode, causing the emerging liquid to taper in the direction of the counter-electrode. The liquid forms a Taylor cone held together by the surface tension. The radius of the jet of liquid emerging from the Taylor cone and, hence, the initial radius of the formed droplets typically
17
increase in proportion to (flow rate)2/3 (Cole 2000). Thus, the radius of the initial droplet in the ESI process decreases with decreasing flow rate of the solution. The smaller the droplet, the higher is its surface-to-volume-area, which makes a larger proportion of analyte molecules available for desorption (Wilm and Mann 1996). The improved ion transfer ratio from small droplets leads to better sensitivity. In addition, the emitters with a smaller aperture give a narrower dispersion of sprayed droplets, leading to an enhanced sample transfer to the MS (Cole 2000). Droplet volumes are about 100�1000 smaller with the nanospray emitters and low solution flow-rates (20 nl/min) than when the droplets are generated by the conventional ESI (Wilm and Mann 1996). Thus, the droplets evaporate more rapidly and the nanoemitters can be placed 1�2 mm in front of the orifice of the vacuum system to improve ion transfer efficiency. Matching the internal diameter of the electrospray emitter and the flow rate is important for achieving stable ESI. In principle, lower flow rate results in smaller internal diameter (Waterval et al. 2001). For instance, an ESI flow rate as low as 0.1�0.5 nl/min has been indicated for pulled and tapered static nanospray needles of 5 µm i.d. with a tip of 2 µm i.d. (Valaskovic et al. 1995). A flow rate of 30 nl/min has been reported to give a stable spray in continuous-infusion with a tapered capillary of 25 µm i.d. (Barnidge et al. 1999a) and correspondingly a flow rate of 50 nl/min has given a stable spray with a capillary of 50 µm i.d. (Alexander et al. 1998, Bendahl et al. 2002). However, small-bore ESI emitters have also worked well at high flow rates without the need for nebulizing gas. For instance, upper flow rate limits of 1�3 µl/min applied with continuous-infusion have been reported for capillaries of 25 µm i.d. with sharpened ends (Barnidge et al. 1999a, Chang et al. 2001). Capillaries with internal diameters in the range of 10-50 µm and sharpened ends have usually been employed in sheathless nanospray CE/MS (Wahl et al. 1994, Kelly et al. 1997, Alexander et al. 1998, Petersson et al. 1999, Chang and Her 2000, Bendahl et al. 2002, Moini 2002, Vuorensola et al. 2002). In general, the electroosmotic flow (EOF) in fused-silica CE capillaries of 20�50 µm i.d. is in the range of 100�250 nl/min varying with the electrolyte composition and field strength (Kelly et al. 1997). 2.1.3.2 Sheathless nanospray construction A variety of sheathless nanospray interfaces exist, classifiable into three groups according to construction. The most common construction includes a sharpened fused-silica CE capillary with a conductive coating on the outlet tip (Figure 3) (Wahl et al. 1994, Kriger et al. 1995, Moini 2002). The second group includes interfaces in which a separate nanospray needle or a tapered capillary is attached to the CE separation capillary via a low dead-volume union, tubing, or some other type of junction with direct electrode. Examples of connecting junctions are teflon, fused-silica, and Supelco butt connectors (Bateman et al. 1997) and a teflon sleeve with a glass wool frit (Alexander et al. 1998). A somewhat different method is to attach a thin spraying capillary with a conductive coating to a tip inside the CE capillary via a liquid junction interface (Jussila et al. 2000). In addition, a pulled, non-coated tip has been connected with the CE capillary via a T-junction interface inside a small piece of transparent rubber (Waterval et al. 2001). The third group consists of tapered CE capillaries with a conductive wire inserted inside. The wire, typically made of platinum, is inserted from the outlet end of the CE capillary
18
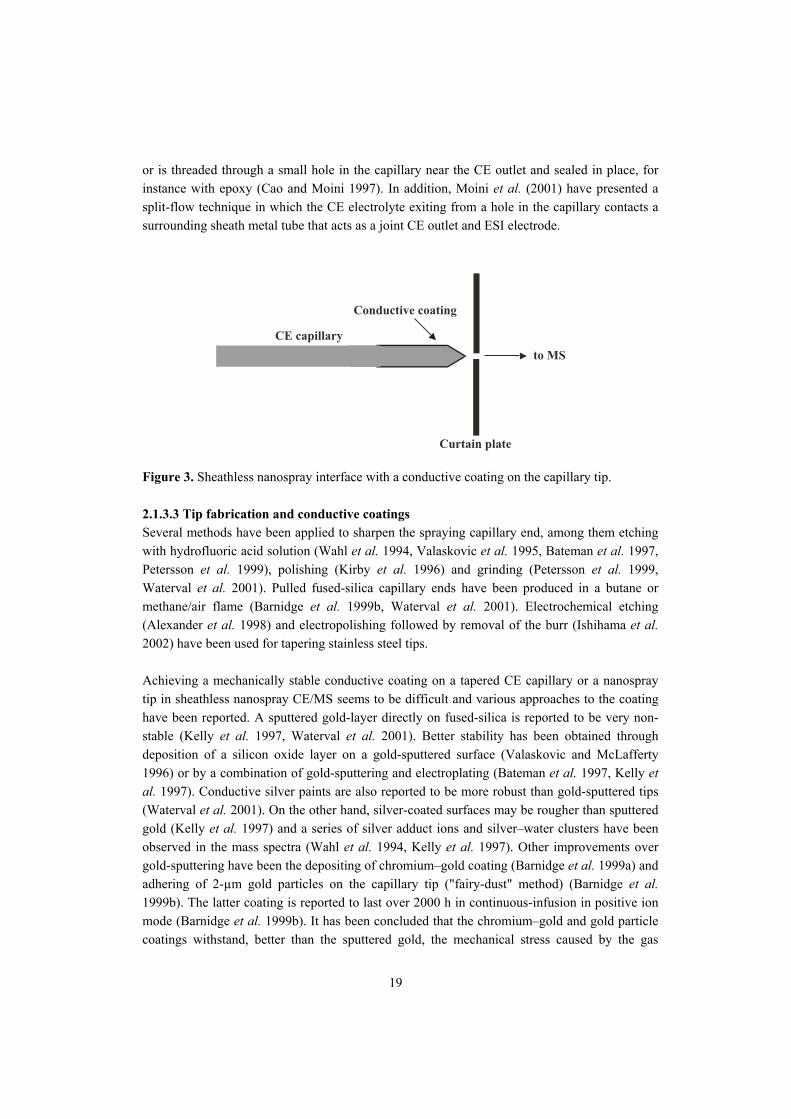
or is threaded through a small hole in the capillary near the CE outlet and sealed in place, for instance with epoxy (Cao and Moini 1997). In addition, Moini et al. (2001) have presented a split-flow technique in which the CE electrolyte exiting from a hole in the capillary contacts a surrounding sheath metal tube that acts as a joint CE outlet and ESI electrode.
CE capillary
to MS
Curtain plate
Conductive coating
Figure 3. Sheathless nanospray interface with a conductive coating on the capillary tip. 2.1.3.3 Tip fabrication and conductive coatings Several methods have been applied to sharpen the spraying capillary end, among them etching with hydrofluoric acid solution (Wahl et al. 1994, Valaskovic et al. 1995, Bateman et al. 1997, Petersson et al. 1999), polishing (Kirby et al. 1996) and grinding (Petersson et al. 1999, Waterval et al. 2001). Pulled fused-silica capillary ends have been produced in a butane or methane/air flame (Barnidge et al. 1999b, Waterval et al. 2001). Electrochemical etching (Alexander et al. 1998) and electropolishing followed by removal of the burr (Ishihama et al. 2002) have been used for tapering stainless steel tips. Achieving a mechanically stable conductive coating on a tapered CE capillary or a nanospray tip in sheathless nanospray CE/MS seems to be difficult and various approaches to the coating have been reported. A sputtered gold-layer directly on fused-silica is reported to be very non-stable (Kelly et al. 1997, Waterval et al. 2001). Better stability has been obtained through deposition of a silicon oxide layer on a gold-sputtered surface (Valaskovic and McLafferty 1996) or by a combination of gold-sputtering and electroplating (Bateman et al. 1997, Kelly et al. 1997). Conductive silver paints are also reported to be more robust than gold-sputtered tips (Waterval et al. 2001). On the other hand, silver-coated surfaces may be rougher than sputtered gold (Kelly et al. 1997) and a series of silver adduct ions and silver�water clusters have been observed in the mass spectra (Wahl et al. 1994, Kelly et al. 1997). Other improvements over gold-sputtering have been the depositing of chromium�gold coating (Barnidge et al. 1999a) and adhering of 2-µm gold particles on the capillary tip ("fairy-dust" method) (Barnidge et al. 1999b). The latter coating is reported to last over 2000 h in continuous-infusion in positive ion mode (Barnidge et al. 1999b). It has been concluded that the chromium�gold and gold particle coatings withstand, better than the sputtered gold, the mechanical stress caused by the gas
19
evolution associated with the electrochemical water redox reactions at the conductive tip (Nilsson et al. 2001). Still other materials have been employed: carbon coating produced by marker pen and pencil (Chang and Her 2000, Chang et al. 2001), a conductive colloidal graphite�coating (Zhu et al. 2002), and stainless steel tips (Ishihama et al. 2002), for instance. A nickel coating was fabricated by a simple electrodeless plating procedure; however, only eight hours electrospraying in positive ion mode was reported (Bendahl et al. 2002). Recently, plastics have been applied. For instance, Nilsson and Markides (2000) presented a somewhat modified method to "fairy-dust", fastening 2-µm gold particles on the capillary tip with a thin layer of silicone. The fabrication was done at room temperature and atmospheric pressure, conditions suitable for thermolabile capillaries. Maziarz et al. (2000) applied conductive polyaniline, which has mechanical stability and good adhering, anticorrosion, and antistatic properties. Wetterhall et al. (2002) introduced a conductive polypropylene/graphite mixture coating with the benefits reported as resistance to electrical discharges, mechanical stability, and flexibility. 2.1.3.4 Characteristics of the sheathless nanospray interface In principle, sheathless nanospray CE/ESI-MS can provide better detection sensitivity than the sheath liquid technique (Cao and Moini 1997, Moini 2002). This is because of the enhanced ion transfer efficiency, the elimination of sample dilution, and the reduced competition between the analyte and electrolyte ions for the charge. The compatibility with a wider range of solvents and better tolerance to salts has also been proposed (Wilm and Mann 1996). On the other hand, the absence of sheath liquid may prevent the use of high-concentration conductive electrolytes because of the risk of electrical discharges with them (Chang and Her 2000). Moreover, considerable variations in spray stability and sensitivity have been observed between solvents (Samskog et al. 2000). Of the three groups of sheathless nanospray interfaces, the first group (CE capillaries with conductive coating) and the third group (capillaries with a conductive wire or a small hole for electric contact) are dead-volume-free approaches. However, problems in spray stability and limited life-time of the conductive coating have been major drawbacks with the first group. Despite the demonstrated stability of the coating in continuous-infusion experiments, deterioration may occur relatively rapidly in CE/MS runs with CE potential through the enhanced arcing between the capillary tip and MS inlet lens. Droplets formed during flushing of the CE capillary with the electrolyte and conditioning solutions can also damage the coating (Waterval et al. 2001, Moini 2002). With the third group, assembling the set-up is cumbersome, especially with designs involving the fabrication of a small hole in the CE capillary. With the wire designs, the main disadvantage seems to be a high risk for formation of bubbles inside the capillary due to the electrochemical water redox reactions at the electrode (Moini 2001, 2002). The construction with a short, pulled, non-coated capillary attached to the CE capillary with a direct electrode has been reported to be more robust than the conductive-coated capillaries (Waterval et al. 2001). However, with this type of arrangement, dead-volume related to the capillary joining can lead to band broadening (Moini 2002). Finally, the results in the literature for sheathless nanospray CE/MS with any of the sheathless nanospray interface constructions described above were in general reported only in positive ion mode.
20
2.2 Microchips and mass spectrometric detection 2.2.1 Background The term "Micro-Total Analysis Systems (µ-TAS)", or "Lab-on-a-chip", was introduced in 1990 (Manz et al. 1990). In µ-TAS, microfabrication technology is utilized for miniaturizing analytical instruments. An important goal is to integrate multiple functions, such as filtering, sample pre-concentration, chemical reaction, analytical separation and detection, on the same microfabricated device (Manz et al. 1990, Reyes et al. 2002). The expected benefits of microfabricated devices, or microchips, are fast response, portability of instruments, fast and parallel reactions, and highly automated analyses of compounds in small sample volumes (Jakeway et al. 2000, Khandurina and Guttman 2002). Large-scale production of such integrated systems could provide disposability of devices to eliminate cross-contamination and carry-over in routine analysis (Xue et al. 1997, Figeys and Aebersold 1998). Typical analytical microfabricated devices are glass-, silicon- or polymer-based planar chips ranging in overall size from mm- to cm-scale with microchannel dimensions of µm-scale. Diverse fabrication processes, originally developed for Micro-Electro Mechanical Systems (MEMS) and for the microelectronics industry, are applied to the fabrication of components for µ-TAS (Manz and Becker, 1999, Reyes et al. 2002). Initially, glass and silicon were the most common materials in microfabrication of analytical devices (Manz et al. 1990, Manz and Becker 1999, de Mello 2002a), but polymers have recently become of interest, primarily because of the need for low-cost mass-production and for materials with a wider range of chemical and physical properties (Becker and Gärtner 2000, Becker and Locascio 2002, de Mello 2002a, Rossier et al. 2002). As well, the microfabrication technology for polymers has made progress. Since polymers are new materials in µ-TAS, however, the properties of polymeric devices and the feasibility of their use in analytical applications are not yet as well demonstrated as for silicon and glass (de Mello 2002a, Rossier et al. 2002). The first analytical microchip was introduced before the concept of µ-TAS, over two decades ago. This was a gas chromatograph (GC) etched on a 5-cm silicon wafer (Terry and Angell 1978). Despite the relatively good performance of the first miniaturized GC, analytical microdevices did not attract much interest until the introduction of the µ-TAS concept (Manz et al. 1990, de Mello 2002b, Reyes et al. 2002). High performance for on-chip GC has not been easy to realize because of the difficulties in fabricating the stationary phase in a homogeneous way. Only a few reports have been presented (Dziuban et al. 1999, Eijkel et al. 2000, de Mello 2002b). Similarly, on-chip pressure-driven LC separations have faced difficulties in the integration of stationary phases, frits, micropumps, and injection valves (Kutter 2000, Auroux et al. 2002, de Mello 2002b). Thus, most existing on-chip separations are based on electrophoresis where liquid controlling is simple since pumps and injectors do not need to be fabricated on chip (Bruin 2000, Kutter 2000, Auroux et al. 2002, de Mello 2002b).
21
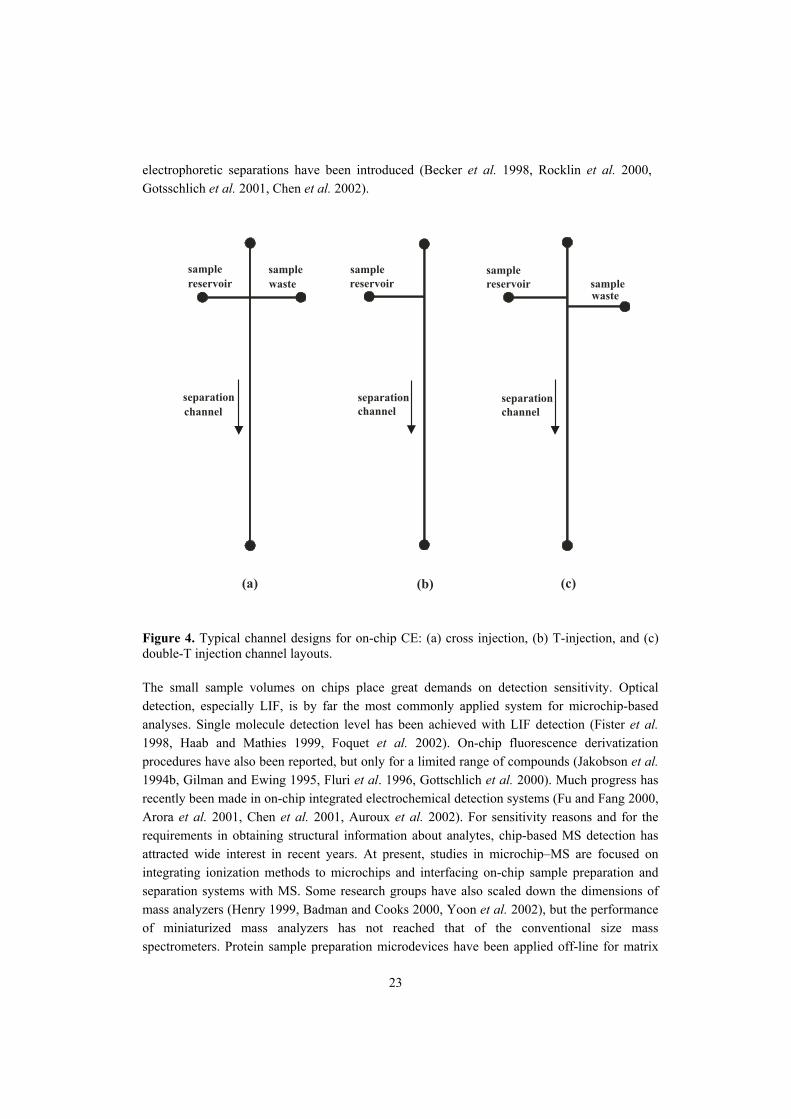
The first on-chip CE devices, with microchannels of 1�10 cm, 10 µm x 30 µm (channel length, depth x width) etched on a glass substrate, were described in 1992 (Harrison et al. 1992, Manz et al. 1992). Since then, a large number of on-chip CE devices have been described (Kutter 2000, Auroux et al. 2002, de Mello 2002b, Reyes et al. 2002). Most often, the principle of CZE has been applied, but on-chip isotachophoresis (ITP) (Walker et al. 1998) and on-chip micellar electrokinetic capillary chromatography (MECC) (Moore et al. 1995, Von Heeren et al. 1996, Culbertson et al. 2000) have also been presented. As well, a few reports have been presented on on-chip free-flow electrophoresis (Raymond et al 1994, Chartogne et al. 2000) and electrokinetic separations in a polymer sieving medium, such as polyacrylamide, agarose gel, or hydroxyethyl cellulose solution, filled into microchannels (Effenhauser et al. 1994, Woolley and Mathies 1995, Reyes et al. 2002). For on-chip CE, the smaller cross-section of the microchannels and larger thermal mass of the microchip provide more efficient heat dissipation than conventional CE capillaries (Manz et al. 1992, Dolnik et al. 2000). Thus, higher electric fields can be applied on microchips, for faster separations and enhanced separation efficiency (Jakeway et al. 2000). As an example of this, the separation of two compounds in 0.8 ms has been achieved in glass microchannels 200 µm in length with the electric field strength as high as 53 kV/cm (Jakobson et al. 1998). Typically, the channel layouts for on-chip CE feature one channel dimension for the injection of analytes (cross-, T-, and double-T injection channel layouts; Figure 4) and another channel, crossed to the injection channel, for the separation (Manz and Becker 1999, Dolnik et al. 2000, Kutter 2000, Zhang and Manz 2001). Sample injections are mainly electrokinetic with injection volumes of several picoliters (Harrison et al. 1992, Jakobson et al. 1994a, Zhang and Manz 2001). Only a few studies have appeared on pressure-assisted injections (Arora et al. 2001, Auroux et al. 2002). As a means of increasing the sample loading capacity, sample stacking pre-concentration has been employed (Kutter et al. 1998). Also more complex channel layouts have been fabricated to enhance the separation efficiency. For instance, a synchronized cyclic capillary electrophoresis (SCCE) based on repeated column switching in a cyclic CE design was presented to eliminate unwanted sample components (Burggraf et al. 1994, Von Heeren et al. 1996). However, controlling the system was difficult and sample loss occurred during repeated switching (Burggraf et al. 1994, Von Heeren et al. 1996). Another approach is to increase the length of the separation channel while maintaining small chip size by utilizing serpentine- and spiral-shaped channel formats (Jakobson et al. 1994a, Culbertson et al. 2000). A serpentine-shaped separation channel of 16.5 cm was fabricated in an area less than 1 cm2 (Jakobson et al. 1994a). However, analyte zone dispersion arose as the result of differences in the migration path at the inner and outer perimeters of the bends in the channel (Jakobson et al. 1994a, Culbertson et al. 1998, Dolnik et al. 2000). With a spiral-shaped channel, the large radii of curvature of the channel have been reported to minimize the analyte dispersion (Culbertson et al. 2000). For instance, in a spiral channel of 25 cm on a glass substrate of 5 cm x 5 cm (width x length), MECC separation was achieved for 19 amino acids in 165 s with average plate numbers (N) of 280 000 (Culbertson et al. 2000). Laser-induced fluorescence (LIF) detection was applied in the study. Recently, chips for two-dimensional
22
electrophoretic separations have been introduced (Becker et al. 1998, Rocklin et al. 2000, Gotsschlich et al. 2001, Chen et al. 2002).
sample
reservoir
separation
channel
(a) (b) (c)
sample
reservoir
sample
reservoir
separation
channel
separation
channel
sample
waste samplewaste
Figure 4. Typical channel designs for on-chip CE: (a) cross injection, (b) T-injection, and (c) double-T injection channel layouts. The small sample volumes on chips place great demands on detection sensitivity. Optical detection, especially LIF, is by far the most commonly applied system for microchip-based analyses. Single molecule detection level has been achieved with LIF detection (Fister et al. 1998, Haab and Mathies 1999, Foquet et al. 2002). On-chip fluorescence derivatization procedures have also been reported, but only for a limited range of compounds (Jakobson et al. 1994b, Gilman and Ewing 1995, Fluri et al. 1996, Gottschlich et al. 2000). Much progress has recently been made in on-chip integrated electrochemical detection systems (Fu and Fang 2000, Arora et al. 2001, Chen et al. 2001, Auroux et al. 2002). For sensitivity reasons and for the requirements in obtaining structural information about analytes, chip-based MS detection has attracted wide interest in recent years. At present, studies in microchip�MS are focused on integrating ionization methods to microchips and interfacing on-chip sample preparation and separation systems with MS. Some research groups have also scaled down the dimensions of mass analyzers (Henry 1999, Badman and Cooks 2000, Yoon et al. 2002), but the performance of miniaturized mass analyzers has not reached that of the conventional size mass spectrometers. Protein sample preparation microdevices have been applied off-line for matrix
23
assisted laser desorption/ionization (MALDI) (Ekström et al. 2001, Ehrnström et al. 2002). However, ESI is still the method of choice to interface microfluidic chips on-line to MS (Oleschuk and Harrison 2000, de Mello 2001, Limbach and Meng 2002, Reyes et al. 2002). 2.2.2 Microchip materials and fabrication techniques 2.2.2.1 Silicon and glass Silicon has been applied to a large number of microsystems (Fintschenko and van den Berg, 1998, Manz and Becker 1999, Reyes et al. 2002) and the first microfabricated analytical devices were fabricated on silicon substrates (Terry and Angell 1978, Manz et al. 1990). The use of silicon as a substrate material for on-chip CE has nevertheless been very limited (Harrison et al. 1993, Mogensen et al. 2001). Because of the semi-conductivity of silicon, thick insulating layers, for instance of thermal oxide or nitride, need to be fabricated for high-voltage applications (Harrison et al. 1993, Manz and Becker 1999, Mogensen et al. 2001). Breakthrough of silicon has also been reported with insulated silicon devices, which limits the voltage that can be applied (e.g. to 0.67 kV/cm for on-chip CE) (Harrison et al. 1993b, Mogensen et al. 2001). Another drawback with silicon is its optical opaqueness in the UV/visible regions (Fintschenko and van den Berg 1998). Advantages of silicon are the good mechanical rigidity of microdevices, versatility of the obtainable structure geometry, and well-developed surface micromachining technology (Fintschenko and van den Berg 1998). Two- and three-dimensional structures can be produced in crystalline silicon with high precision (Manz and Becker 1999). Patterning of microchannels of micrometer dimensions on silicon substrates typically involves standard photolithography (Figure 5) (Manz et al. 1992, Fintschenko and van den Berg 1998, Manz and Becker 1999). For submicron patterning, special lithography techniques have been applied, such as electron-beam and X-ray lithography (Reyes et al. 2002). In photolithography (Figure 5), a thin layer of positive or negative tone photoresist (photosensitive polymer) is spin-coated on a planar substrate (Manz and Becker 1999, Jakeway et al. 2000) and the resist-coated surface is usually exposed to UV radiation through a photomask. Typically, the photomask is a quartz substrate covered by a layer of an opaque material (such as chromium) with a patterned microchannel layout. Through the photoactivated reaction in positive photoresist, the exposed parts become more soluble to the organic developing solvent. With the negative resist, polymer cross-linking reaction under radiation leads to more stable resist in the exposed parts. Subsequent development yields the appropriate structure on the substrate (Figure 5). Etching procedures to form microchannels on silicon devices include wet or dry isotropic or anisotropic etching. Wet isotropic etching generally involves aqueous acidic solutions containing hydrofluoric acid (HF) and nitric acid, and wet anisotropic etching involves aqueous basic solutions containing, for instance, potassium hydroxide or tetramethyl ammonium hydroxide (Fintschenko and van den Berg 1998, Jakeway et al. 2000). Isotropic etching occurs at the same rate in all directions (Fintschenko and van den Berg 1998) yielding an elliptical
24
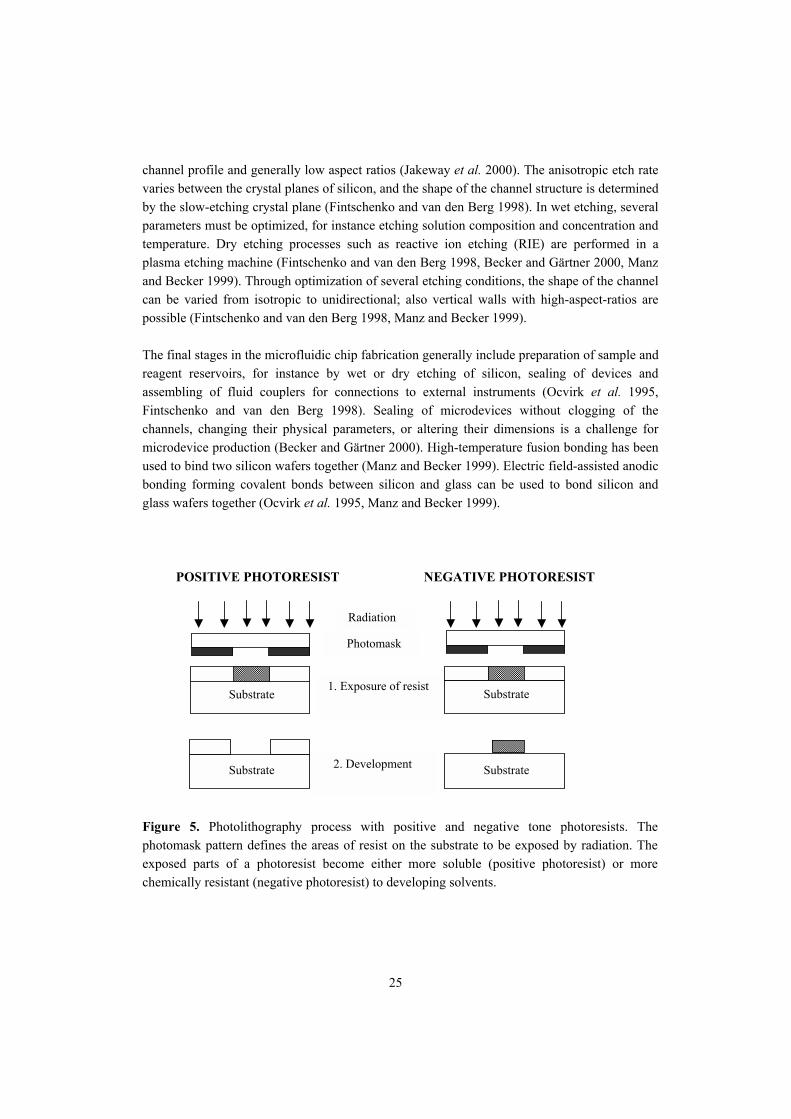
channel profile and generally low aspect ratios (Jakeway et al. 2000). The anisotropic etch rate varies between the crystal planes of silicon, and the shape of the channel structure is determined by the slow-etching crystal plane (Fintschenko and van den Berg 1998). In wet etching, several parameters must be optimized, for instance etching solution composition and concentration and temperature. Dry etching processes such as reactive ion etching (RIE) are performed in a plasma etching machine (Fintschenko and van den Berg 1998, Becker and Gärtner 2000, Manz and Becker 1999). Through optimization of several etching conditions, the shape of the channel can be varied from isotropic to unidirectional; also vertical walls with high-aspect-ratios are possible (Fintschenko and van den Berg 1998, Manz and Becker 1999). The final stages in the microfluidic chip fabrication generally include preparation of sample and reagent reservoirs, for instance by wet or dry etching of silicon, sealing of devices and assembling of fluid couplers for connections to external instruments (Ocvirk et al. 1995, Fintschenko and van den Berg 1998). Sealing of microdevices without clogging of the channels, changing their physical parameters, or altering their dimensions is a challenge for microdevice production (Becker and Gärtner 2000). High-temperature fusion bonding has been used to bind two silicon wafers together (Manz and Becker 1999). Electric field-assisted anodic bonding forming covalent bonds between silicon and glass can be used to bond silicon and glass wafers together (Ocvirk et al. 1995, Manz and Becker 1999).
POSITIVE PHOTORESIST NEGATIVE PHOTORESIST
Radiation
Photomask
Substrate 1. Exposure of resist Substrate
Substrate 2. Development Substrate
Figure 5. Photolithography process with positive and negative tone photoresists. The photomask pattern defines the areas of resist on the substrate to be exposed by radiation. The exposed parts of a photoresist become either more soluble (positive photoresist) or more chemically resistant (negative photoresist) to developing solvents.
25
Glasses are transparent in UV wavelengths (Fintschenko and van den Berg 1998, Manz and Becker 1999). They are also insulators with a high breakdown voltage. Thus, glass has been the most common material for on-chip CE, the substrate material varying from low-cost soda-lime glass to high quality quartz (Dolnik et al. 2000). The standard photolithography techniques used in silicon processing are also applied for glass devices (Manz and Becker 1999, Dolnik et al. 2000). The limitation in micromachining of glasses is that, owing to the isotropic character of the etching process, the shape of the channel cross-section is limited to elliptical geometry (Fintschenko and van den Berg 1998). Mechanical or electrical drilling is generally used to form the reservoir and sample holes in glass. Thermal bonding has often been applied in joining of glass wafers together (Manz and Becker 1999). Although low-temperature bonding methods have been introduced, the bonding methods for glasses tend to be complex and time-consuming (Jakeway et al. 2000, de Mello 2002a). The major benefit with glasses is well-defined electroosmotic flow (de Mello 2002a). They are also chemically stable toward both aqueous and non-aqueous solvents (Limbach and Meng 2002). On the negative side, glass products are mechanically fragile (Wen et al. 2000) and the biocompatibility is relatively poor. Large biomolecules, especially proteins, have hydrophobic, ionic, and electrostatic interactions with silica-based surfaces, which can result in the adsorption of compounds and degradation in the separation efficiency (Cobb et al. 1990, Limbach and Meng 2002). To prevent the adsorption of biomolecules on the glass surface, some authors have modified the microchannel surface covalently with [(acryloylamino)propyl]-trimethylammonium chloride (BCQ) (Li et al. 2000, 2001) or treated the surface with a cationic coating (Pinto et al. 2000) or poly(dimethylsiloxane) (PDMS) (Badal et al. 2002). 2
.2.2.2 Polymers
Polymers in µ-TAS Use of polymeric materials in µ-TAS has increased rapidly in the last few years. Driving forces for this are the need for low-cost materials and fabrication procedures and the limitations of silicon and glass. In particular, polymers have been found suitable for fast and low-cost prototyping of the devices. Various polymers have been applied to µ-TAS, including poly(dimethylsiloxane) (PDMS), poly(methyl methacrylate) (PMMA), polycarbonate (PC), polystyrene (PS), polypropylene (PP), poly(ethylene terephthalate) (PET), SU-8, parylene-C, cyclo-olefin (Zeonor), copolyester, acrylic copolymer resin and epoxy resins (Figeys et al. 1999, Anderson et al. 2000, Barker et al. 2000, Becker and Gärtner 2000, Jakeway et al. 2000, Licklider et al. 2000, Liu, H. et al. 2000, Jiang et al. 2001, Kameoka et al. 2001, Lee et al. 2001, Rohner et al. 2001, Becker and Locascio 2002, de Mello 2002a, Rossier et al. 2002). Many fabrication processes can be applied to polymers to produce channels with dimensions of micro-nanometer scale (Becker and Gärtner 2000, Becker and Locascio 2002, de Mello 2002a, McDonald and Whitesides 2002). The processes can be divided into direct fabrication and replication techniques. In direct fabrication techniques such as laser photoablation, reactive ion etching, X-ray lithography, and mechanical milling, polymer devices are
26
structured individually (de Mello 2002a). In replication methods such as injection molding, hot embossing, and polymer casting, several designs can be fabricated from one master or mold (de Mello 2002a). Sealing is simpler and faster with elastomeric polymers, such as PDMS, than with silicon, glass, or non-elastomeric polymers since an adhesive, liquid-tight sealing is provided by van der Waals interactions (Anderson et al. 2000, Fujii 2002, Mello 2002a, McDonald and Whitesides 2002). For non-elastomeric polymers, gluing the substrates together may result in a satisfactory seal, but there is always a high risk of channel blockage (de Mello 2002a). Thus, thermal lamination or plasma-assisted bonding has commonly been applied (Becker and Locascio 2002, de Mello 2002a, Rossier et al. 2002). Other techniques, including pressure-induced sealing and laser welding, have also been reported (Becker and Gärtner 2000, de Mello 2002a). The variety of polymers available provides a wide range of chemical and physical properties to be exploited in µ-TAS (Becker and Gärtner 2000, de Mello 2002a, Becker and Locascio 2002). However, since polymers have just recently been applied to µ-TAS, surface properties and the chemical and mechanical stability of the devices are not yet as well explored as for silicon and glass. Some studies have been done on EOF in polymeric microchannels and it seems to vary with the polymer material and also with the fabrication process (Becker and Locascio 2002, de Mello 2002a). For instance, laser ablated polymer channels have been reported to support higher EOF than the hot-embossed channels of similar material owing to the incorporation of reactive species into the channel surface during the ablation process (Becker and Locascio 2002). In addition, surface treatments such as alkaline hydrolysis for PET (Barker et al. 2000, Wang, S.-C. et al. 2000) and layering of poly(allylamine hydrochloride) and poly(styrene sulfonate) for PS and PET (Barker et al. 2000) have been employed to alter the surface charge and the magnitude and direction of EOF in a controlled manner in polymer microchannels. Poly(dimethylsiloxane) (PDMS) Elastomeric polymer PDMS is one of the most commonly utilized materials in fast and low-cost prototyping of microanalytical devices (Duffy et al. 1998, Jakeway et al. 2000, McDonald and Whitesides 2002, de Mello 2002a). PDMS has been shown suitable for the replication of patterns at a scale of tens of nm (Zhao et al. 1997). The replication is a simple process involving casting PDMS against a master with the desired structure. Besides one-dimensional microfluidic devices, PDMS has been used for two-dimensional CE devices (Chen et al. 2002) and three-dimensional microfluidic systems (Anderson et al. 2000, Jo et al. 2000, Hoffmann et al. 2001). PDMS has many favorable properties for microanalytical devices (Table 1). It is insulating, transparent, and non-toxic (McDonald and Whitesides 2002). It has good biocompatibility and, coated on glass, it has been observed to reduce large biomolecule adsorption on the surface in CE separations (Esch et al. 2001, Badal et al. 2002). However, highly hydrophobic proteins can adsorb on its surface (Badal et al. 2002). It is also stable towards polar organic solvents, including ethanol, methanol, and trifluoroethanol; but swelling of a thin PDMS slab
27
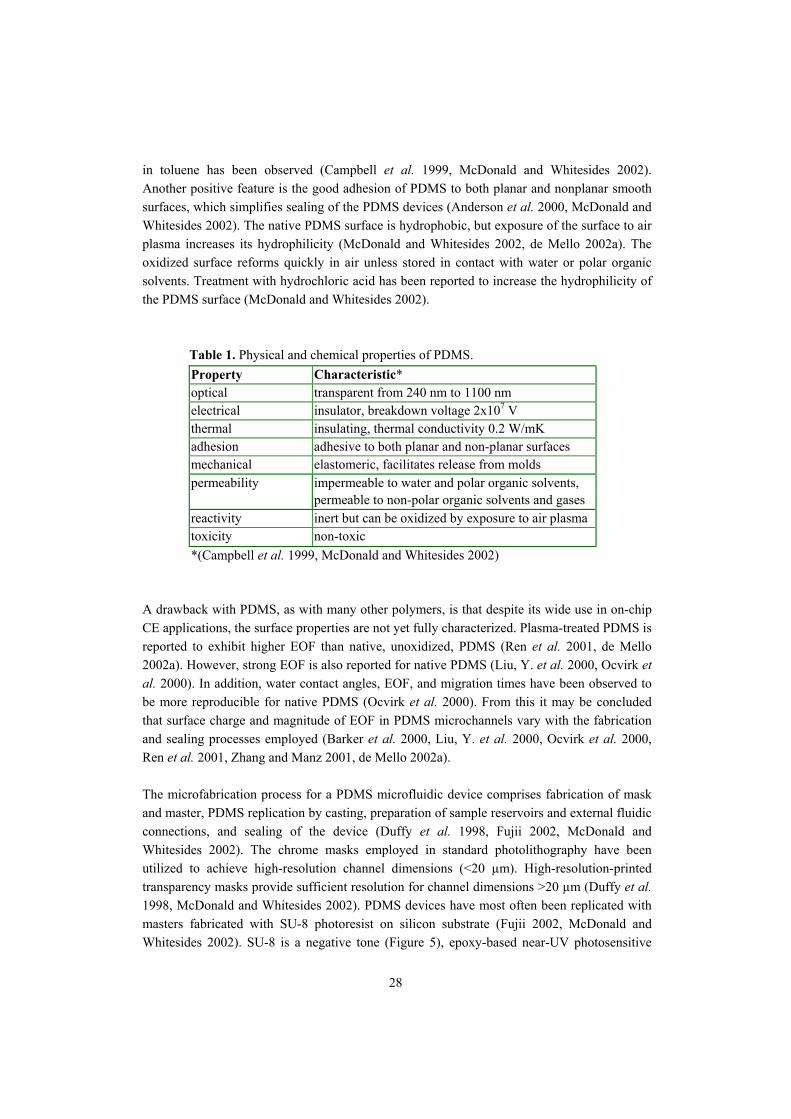
in toluene has been observed (Campbell et al. 1999, McDonald and Whitesides 2002). Another positive feature is the good adhesion of PDMS to both planar and nonplanar smooth surfaces, which simplifies sealing of the PDMS devices (Anderson et al. 2000, McDonald and Whitesides 2002). The native PDMS surface is hydrophobic, but exposure of the surface to air plasma increases its hydrophilicity (McDonald and Whitesides 2002, de Mello 2002a). The oxidized surface reforms quickly in air unless stored in contact with water or polar organic solvents. Treatment with hydrochloric acid has been reported to increase the hydrophilicity of the PDMS surface (McDonald and Whitesides 2002).
Table 1. Physical and chemical properties of PDMS. Property Characteristic* optical transparent from 240 nm to 1100 nm electrical insulator, breakdown voltage 2x10⁷ V thermal insulating, thermal conductivity 0.2 W/mK adhesion adhesive to both planar and non-planar surfaces mechanical elastomeric, facilitates release from molds permeability impermeable to water and polar organic solvents,
permeable to non-polar organic solvents and gases reactivity inert but can be oxidized by exposure to air plasma toxicity non-toxic *(Campbell et al. 1999, McDonald and Whitesides 2002)
A drawback with PDMS, as with many other polymers, is that despite its wide use in on-chip CE applications, the surface properties are not yet fully characterized. Plasma-treated PDMS is reported to exhibit higher EOF than native, unoxidized, PDMS (Ren et al. 2001, de Mello 2002a). However, strong EOF is also reported for native PDMS (Liu, Y. et al. 2000, Ocvirk et al. 2000). In addition, water contact angles, EOF, and migration times have been observed to be more reproducible for native PDMS (Ocvirk et al. 2000). From this it may be concluded that surface charge and magnitude of EOF in PDMS microchannels vary with the fabrication and sealing processes employed (Barker et al. 2000, Liu, Y. et al. 2000, Ocvirk et al. 2000, Ren et al. 2001, Zhang and Manz 2001, de Mello 2002a). The microfabrication process for a PDMS microfluidic device comprises fabrication of mask and master, PDMS replication by casting, preparation of sample reservoirs and external fluidic connections, and sealing of the device (Duffy et al. 1998, Fujii 2002, McDonald and Whitesides 2002). The chrome masks employed in standard photolithography have been utilized to achieve high-resolution channel dimensions (<20 µm). High-resolution-printed transparency masks provide sufficient resolution for channel dimensions >20 µm (Duffy et al. 1998, McDonald and Whitesides 2002). PDMS devices have most often been replicated with masters fabricated with SU-8 photoresist on silicon substrate (Fujii 2002, McDonald and Whitesides 2002). SU-8 is a negative tone (Figure 5), epoxy-based near-UV photosensitive
28
resist suitable for vertical sidewall and high-aspect-ratio channel structures in MEMS applications (Lorenz et al. 1998). For the PDMS used in microanalytical devices, curing occurs by the platinum-catalyzed organo-metallic cross-linking reaction (Campbell et al. 1999). The reaction occurs even at room temperature, but heating accelerates it. PDMS curing agent/elastomer base ratios from 1:5 to 1:15 (w/w) have been recommended (Campbell et al. 1999). With a higher ratio, a harder and more cross-linked elastomer is achieved. The curing time depends on the temperature employed and the thickness and purpose of the PDMS device. Typically, curing is performed for 1 h at 70ºC. However, curing times for PDMS microanalytical devices have varied between 30 min and several days, and the curing temperatures from room temperature to 200ºC (Duffy et al. 1998, Campbell et al. 1999, Gao et al. 2001, Jiang et al. 2001, Zhang and Manz 2001, McDonald and Whitesides 2002). Sealing of PDMS devices is faster and simpler than sealing of other materials used in µ-TAS. An adhesive sealing achieved with van der Waals interactions without pressure assistance provides reversible and liquid-tight sealing (McDonald and Whitesides 2002). A non-reversible seal of PDMS layers can be achieved by plasma oxidation, i.e. an exposure of the PDMS surface to air plasma (de Mello 2002a, McDonald and Whitesides 2002).
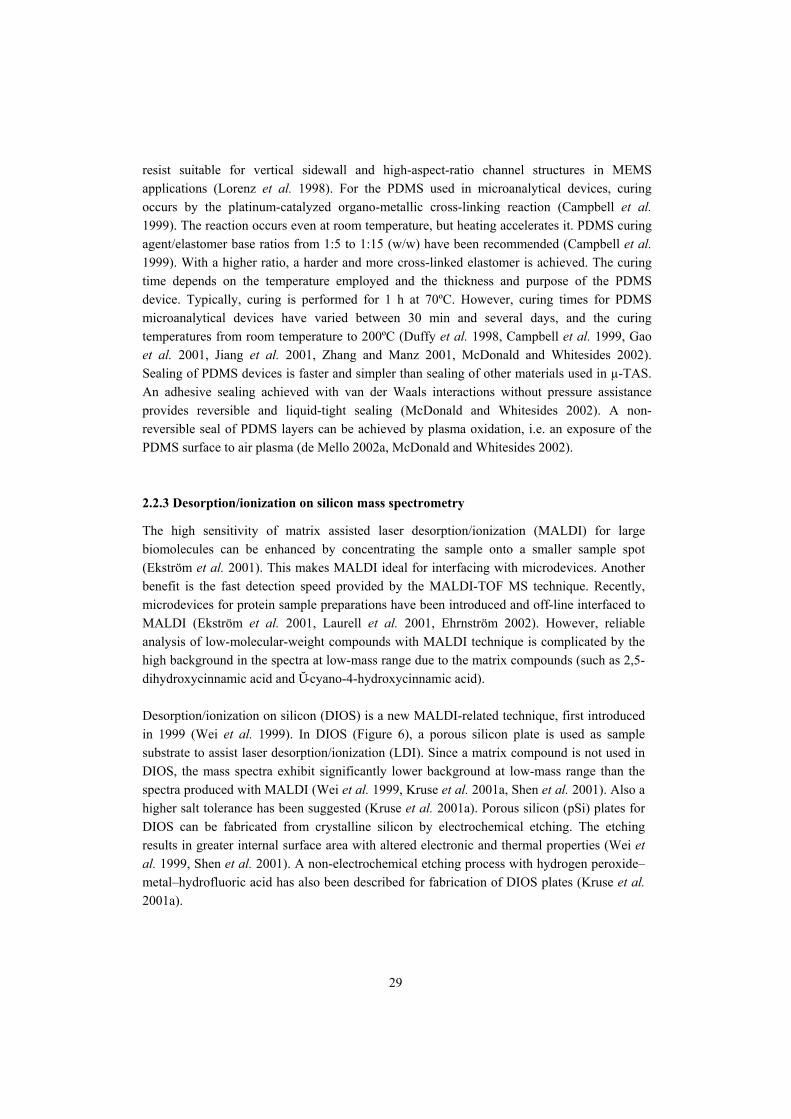
2.2.3 Desorption/ionization on silicon mass spectrometry The high sensitivity of matrix assisted laser desorption/ionization (MALDI) for large biomolecules can be enhanced by concentrating the sample onto a smaller sample spot (Ekström et al. 2001). This makes MALDI ideal for interfacing with microdevices. Another benefit is the fast detection speed provided by the MALDI-TOF MS technique. Recently, microdevices for protein sample preparations have been introduced and off-line interfaced to MALDI (Ekström et al. 2001, Laurell et al. 2001, Ehrnström 2002). However, reliable analysis of low-molecular-weight compounds with MALDI technique is complicated by the high background in the spectra at low-mass range due to the matrix compounds (such as 2,5-dihydroxycinnamic acid and Ŭ-cyano-4-hydroxycinnamic acid). Desorption/ionization on silicon (DIOS) is a new MALDI-related technique, first introduced in 1999 (Wei et al. 1999). In DIOS (Figure 6), a porous silicon plate is used as sample substrate to assist laser desorption/ionization (LDI). Since a matrix compound is not used in DIOS, the mass spectra exhibit significantly lower background at low-mass range than the spectra produced with MALDI (Wei et al. 1999, Kruse et al. 2001a, Shen et al. 2001). Also a higher salt tolerance has been suggested (Kruse et al. 2001a). Porous silicon (pSi) plates for DIOS can be fabricated from crystalline silicon by electrochemical etching. The etching results in greater internal surface area with altered electronic and thermal properties (Wei et al. 1999, Shen et al. 2001). A non-electrochemical etching process with hydrogen peroxide�metal�hydrofluoric acid has also been described for fabrication of DIOS plates (Kruse et al. 2001a).
29
MS analyzer
pSi area
laser
Figure 6. Desorption/ionization on silicon (DIOS). DIOS-MS has been applied to the analysis of small drug molecules (Wei et al. 1999, Kruse et al. 2001a, Shen et al. 2001), peptides (Wei et al. 1999, Kruse et al. 2001a, Shen et al. 2001, Bhattacharya et al. 2002), and polymers (Shen et al. 2001, Thomas et al. 2001). The ionization principle of DIOS has not yet been solved and somewhat inconsistent data have been presented on the structure�property relationships in pSi and their effects on ionization efficiency in DIOS (Wei et al. 1999, Alimpiev et al. 2001, Kruse et al. 2001a,b, Shen et al. 2001, Thomas et al. 2001, Bhattacharya et al. 2002). It is believed that the morphology of pSi has a great impact on the DIOS efficiency, providing a suitable structure for retention of analytes and solvent (Wei et al. 1999, Kruse et al. 2001a). The high internal surface area (up to 600 m2/cm3; Fintchenko and van den Berg 1998) allows sample incorporation and retention inside the pores. Moreover, the combination of high thermal conductivity and large optical absorption cross-section promotes efficient energy transfer from substrate to adsorbed analyte by which the desorption/ionization occurs with laser irradiation (Kruse et al. 2001a). Protonation has been the predominant ionization process, but deprotonation has been observed as well. Formation of radical ions has not been indicated. Initially, a pore size of <2 nm was said to provide a maximum UV DIOS efficiency (Wei et al. 1999). Later, pore sizes of 70�120 nm with pore depth up to 200 nm and pore spacing of about 100 nm were reported (Shen et al. 2001). In addition, Bhattacharya et al. (2002) claim that the performance of non-porous silicon surface infrared LDI is comparable to that of UV DIOS with the exception that the salt tolerance does not appear to be as great. It has further been reported that nanostructured silicon films deposited on glass or plastic substrate (Cuiffi et al. 2001) or porous silicon powder (Zhang, Q. et al. 2001) produce mass spectra with low background at low-mass range. Recently, DIOS in atmospheric pressure (AP) (Laiko et al. 2002, Huikko et al. 2003) carried out with AP-MALDI instrumentation (Laiko et al. 2000) has been described. The main difference of AP-DIOS relative to conventional vacuum-DIOS is that the laser desorption/ionization is done in atmospheric pressure. Since sample plates are not transferred to vacuum, both interfacing to existing API-MS instruments and sample handling are easier.
30
2.2.4 Coupling microchips with electrospray ionization mass spectrometry Efficient microchip�MS interfaces are now of considerable interest (de Mello 2001, Limbach and Meng 2002). The method of choice for connecting microfluidic chips with MS has been electrospray ionization mass spectrometry (ESI-MS). As discussed in connection with conventional sheathless nanospray CE/ESI-MS interfaces (section 2.1.3.1 Flow rate and sensitivity considerations), small spraying orifice dimensions and low flow-rates are ideal for good sensitivity. However, relative to sheathless nanospray CE/MS, on-chip separations are much faster and, in principle, several analytical steps are easily integrated on microchips (Bruin 2000). The techniques used to interface a microchip to ESI-MS can be divided into two types: an attachment of a conventional fused-silica capillary or a nanospray needle to a chip for electrospraying (off-chip spraying) and direct electrospraying from a chip (on-chip spraying) (Oleschuk and Harrison 2000, de Mello 2001, Auroux et al. 2002, Limbach and Meng 2002). 2.2.4.1 Materials for microchip�ESI-MS The majority of microchips interfaced to ESI-MS detection have been fabricated from silica-based substrates, glass and quartz, owing to the wide use of these materials in on-chip electrophoresis (Limbach and Meng 2002). Both direct spraying from a glass edge (Ramsey and Ramsey 1997, Xue et al. 1997, Zhang et al. 1999) and attachment of a nanospray needle or a fused silica capillary to a hole drilled into a glass chip have been utilized (Figeys et al. 1998, Lazar et al. 1999, 2000, 2001, Li et al. 1999, 2000, 2001, Zhang et al. 1999, 2000, Wang, C. et al. 2000, Deng et al. 2001a). Combination of silicon microdevices with ESI-MS detection has not been popular. Recently, however, Schultz et al. (2000) fabricated ESI emitters on the planar surface of monolithic silicon substrate using multi-step photolithography and anisotropic deep reactive ion etching (DRIE) processes. Very recently, Sjödahl et al. (2003) used DRIE for fabricating silicon dioxide emitters. Polymers have also been applied. A parylene ESI nozzle has been fabricated by a multi-step silicon micromachining process on the edge of a silicon substrate (Licklider et al. 2000). A parylene nozzle has also been fabricated on the edge of a cyclo-olefin polymer (Zeonor) substrate (Kameoka et al. 2002). In two approaches to couple PDMS chips with ESI-MS, a transfer capillary has been attached between the PDMS device and the ESI source (Gao et al. 2001, Jiang et al. 2001, Chiou et al. 2002) and an integrated ESI emitter has been fabricated on a PDMS chip for pressure-assisted continuous-infusion analysis (Kim and Knapp 2001a,b). Other polymers applied to microchip�ESI-MS include PMMA (Svedberg et al. 2001, Yuan and Shiea 2001), PC (Chartogne et al. 2000, Vrouwe et al. 2000, Wen et al. 2000, Svedberg et al. 2001, Tang et al. 2001), PET (Rohner et al. 2001), copolyester (Jiang et al. 2001), acrylic copolymer resin (Figeys et al. 1999), and epoxy resin (EpoFix) (Liu, H. et al. 2000).
31
2.2.4.2 Off-chip spraying microdevices Off-chip spraying has been the most common approach in microchip�ESI-MS interfacing. Many groups have glued or bonded a fused-silica capillary or a nanospray needle into a microchannel exit of a glass or polymer device (Figeys et al. 1998, 1999, Lazar et al. 1999, 2000, 2001, Li et al. 1999, 2000, 2001, Zhang et al. 1999, 2000, Chartogne et al. 2000, Wang, C. et al. 2000, Deng et al. 2001a, Jiang et al. 2001) or embedded a spraying capillary between two polymer layers (Liu, H. et al. 2000, Gao et al. 2001, Jiang et al. 2001, Chiou et al. 2002). H. Liu et al. (2000) describe an array of 96 fused-silica capillaries of 25 µm i.d., which were glued on a plastic microwell plate cast from epoxy resin. Each of the sample wells was connected by an independent microchannel to a separate sprayer capillary and the wells were pressurized by nitrogen gas for sample transport into an electrospray exit port. The system enabled direct-infusion analysis of 96 peptide samples in 480 s, which corresponds to a potential throughput of 720 samples/hour (Liu, H. et al. 2000). Li et al. (2000) attached a nanospray emitter on a glass chip for the chip-CE/ESI-MS of synthetic peptide mixtures. Both the chip and the nanospray emitter were covalently modified with BCQ to prevent analyte adsorption on the silica walls. Low-nanomolar detection limits were obtained for synthetic peptides and for in-gel digests of proteins. Although the peptide separations could be achieved in less than 90 s, the sample throughput was limited by the speed (~ 5 min) at which the samples could be loaded onto the chip. A throughput of 25 tryptic digest samples/hour was later obtained with the same type of chip-CE/ESI-MS device by an autosampler-assisted sample introduction (Li et al. 2001). Different chip designs with multiple solution reservoirs and microchannels would probably further enhance the sample throughput. Vrouwe et al. (2000) presented an electrodeless nanospray interface, which was coupled to the CE chip via a tapered capillary attached to the chip. The advantage of this set-up was that separate ESI voltage was not needed on the chip or the nanospray emitter since the voltage applied to the CE generated the electrospray. However, band broadening occurred due to transfer of the sample from the chip to the nanospray emitter. A method somewhat modified from earlier off-chip spraying designs is to attach a microsprayer with liquid junction interface directly at the chip outlet to the fused-silica capillary or nanospray needle used for electrospraying (Zhang et al. 1999, Deng et al. 2001a,b, Kameoka et al. 2001). With this kind of set-up for chip-CE/ESI-MS, separation efficiencies of N = 1650�18000 were achieved for carnitines (Deng et al. 2001b, Kameoka et al. 2001) and carnitines were determined in plasma and urine extracts at µg/ml concentration level (Deng et al. 2001a,b). 2.2.4.3 On-chip spraying microdevices
The first designs for chip-based ESI-MS, introduced by Karger�s (Xue et al. 1997) and Ramsey�s (Ramsey and Ramsey 1997) groups, were on-chip spraying devices. In both designs, microchannels were etched on glass, and spraying voltage was applied to the liquid reservoir on the chip. In the Karger group device, a pressure-assisted flow of 100�200 nl/min was used to deliver samples from the open microchannel for electrospraying. Fairly large spraying channel dimensions of 60 µm x 25 µm (width x depth) were employed. In the Ramsey group device, the fluids were delivered by electroosmotically-induced pressure.
32
A crossed channel design with channel dimensions of 60 µm x 10 µm (width x depth) was employed. Polyacrylamide coating was used to reduce the EOF in the side-arm channel. The mass spectrum was presented for tetrabutylammonium iodide (10 µM) obtained by continuous electrokinetic infusion (Ramsey and Ramsey 1997). Both these set-ups are ideal in terms of simplicity. They are also free from dead-volume since no external spraying capillary or needle is needed for spraying. Problems in spray stability arose, however, due to spreading of sample liquid on the hydrophilic glass surface at the microchannel exit. This led to attempts to minimize the droplet size on the spraying edge of the glass chip by integrating pneumatic nebulizers at the chip outlet end (Zhang et al. 1999) or by depositing hydrophobic coating on the spraying edge surface (Ramsey and Ramsey 1997, Xue et al. 1997). With a covalently attached hydrophobic (n-octyl) coating on the edge surface, the operational life-time of the monolayer for providing the stable electrospray was 5 min/channel with high content of organic solvent in the spraying solution (Xue et al. 1997). A thicker coating layer was obtained when the edge surface was coated with silicon grease and stable spraying for 30 min was achieved (Xue et al. 1997).
Recently, on-chip spraying devices have again attracted much interest. Instead of glass, use
has been made of silicon (Schultz et al. 2000, Sjödahl et al. 2003) and various polymers, including parylene (Licklider et al. 2000, Kameoka et al. 2002), PC (Svedberg et al. 2001, Tang et al. 2001) PC/PET (Wen et al. 2000), PMMA (Svedberg et al. 2001, Yuan and Shiea 2001), PET (Rohner et al. 2001), and PDMS (Kim and Knapp 2001a,b). Schultz et al. (2000) fabricated silicon nozzles (10 µm i.d.) and Sjödahl et al. (2003) silicon dioxide tips with the same internal diameter. In both studies, detection sensitivity was compared with that provided by conventional pulled capillaries. In the continuous-infusion (100 nl/min) analysis for peptides, Schultz et al. (2000) reported a ESI-MS sensitivity increase of 1.5�3 times and better signal stability for the silicon nozzle than the pulled capillary, and Sjödahl et al. (2003) found about the same detectability for the two emitters. Neither pressure-driven nor electrokinetic analytical separations have been reported for silicon-based ESI devices, in the latter case probably due to limitations on the voltage that can be applied with silicon (see section 2.2.2.1: Silicon and glass).
A multilayer polymer (PC/PET) ESI device with a serpentine separation channel of 30 µm x
50 µm; 16 cm (width x depth; length) on the PC layer has been succesfully used in isoelectric focusing for myoglobin and carbonic anhydrase (Wen et al. 2000). Other on-chip spraying devices have been presented in continuous-flow infusion ESI-MS and generally by means of pressure-assisted flow at low flow rates of 35�100 nl/min (Licklider et al. 2000, Rohner et al. 2001) or at flow rates in the range of 0.7�20 µl/min (Kim and Knapp 2001a,b, Svedberg et al. 2001, Tang et al. 2001). The detection limits have varied from pM (Rohner et al. 2001) to 1�10 µM (Licklider et al. 2000, Kim and Knapp 2001a,b) levels. In place of pressure-assisted sample infusion, Yuan and Shiea (2001) describe a PMMA device for electrokinetic direct-infusion ESI-MS analysis. The channels on the PMMA chip were prepared with a computer-controlled milling cutter. Electrokinetic sample infusion was obtained from spraying channels of 375 µm x 300 µm (width x depth). The spectra were obtained with
33
1 µM sample solutions of myoglobin, insulin, cytochrome c, and bradykinin in methanol�water (70/30, v/v). However, reduction in the microchannel diameter by utilizing more dedicated fabrication techniques is required before the design can be employed in on-chip CE applications (Yuan and Shiea 2001). Despite the demonstrated applicability of the designs based on the attachment of a nanospray needle on chip, gluing capillaries and needles onto chips is time-consuming and difficult to do as part of the micromachining process (Licklider et al. 2000, Oleschuk and Harrison 2000, de Mello 2001). Not only do on-chip spraying devices not require gluing, they are also free from external connections between the chip and the ESI source and thus are dead-volume-free devices (Vrouwe et al. 2000). So far, however, analytical separations have usually been demonstrated with off-chip spraying devices. Only a limited number of microdevices have yet been introduced to ESI, and many issues remain to be explored with both off-spraying and on-spraying devices. These include material choice, reproducibility and cost of the batchfabrication process, and robustness of the device. Another important issue is the feasibility of ESI microdevices for long-term or disposable use. 2.3 Analysis of bisphosphonates In the present work, study was made of the applicability of the developed CE- and microchip-based MS techniques to pharmaceutical analysis. A series of forensic compounds (buprenorphine, clenbuterol, morphine, and psilocin) and amino acids (histidine and arginine) were used as test compounds in the construction and characterization of techniques. As a more challenging application, methods were developed for the analysis of bisphosphonates. 2.3.1 Bisphosphonate compounds Bisphosphonates are analogues of pyrophosphate with the P-O-P bond of pyrophosphate replaced with a P-C-P bond (Chester et al. 1981). Pyrophosphate is an endogenous substance found in human urine and plasma and several calcium metabolic disorders have been attributed to abnormally low levels in biological fluids (Chester et al. 1981). Attempts to treat calcium metabolic disorders with exogenous pyrophosphate have not succeeded owing to the rapid chemical and enzymatic hydrolysis of the P-O-P bond, but success has been achieved with bisphosphonates with a stable P-C-P bond (Chester et al. 1981, Den Hartigh et al. 1993). Bisphosphonates are a wide and important group of therapeutic drugs currently used for the treatment of calcium metabolic disorders and various metabolic bone diseases (Elomaa et al. 1985, Kosonen 1992, Tsai et al. 1994, Auriola et al. 1997, Lovdahl and Pietrzyk 1999).
Dichloromethylene bisphosphonate as a disodium salt, termed clodronate or clodronic acid (Figure 7), is a member of the bisphosphonate drug family, used, for instance, in the treatment of Paget´s disease of bone, hypercalcaemia, and osteoporosis (Elomaa et al. 1985,
34
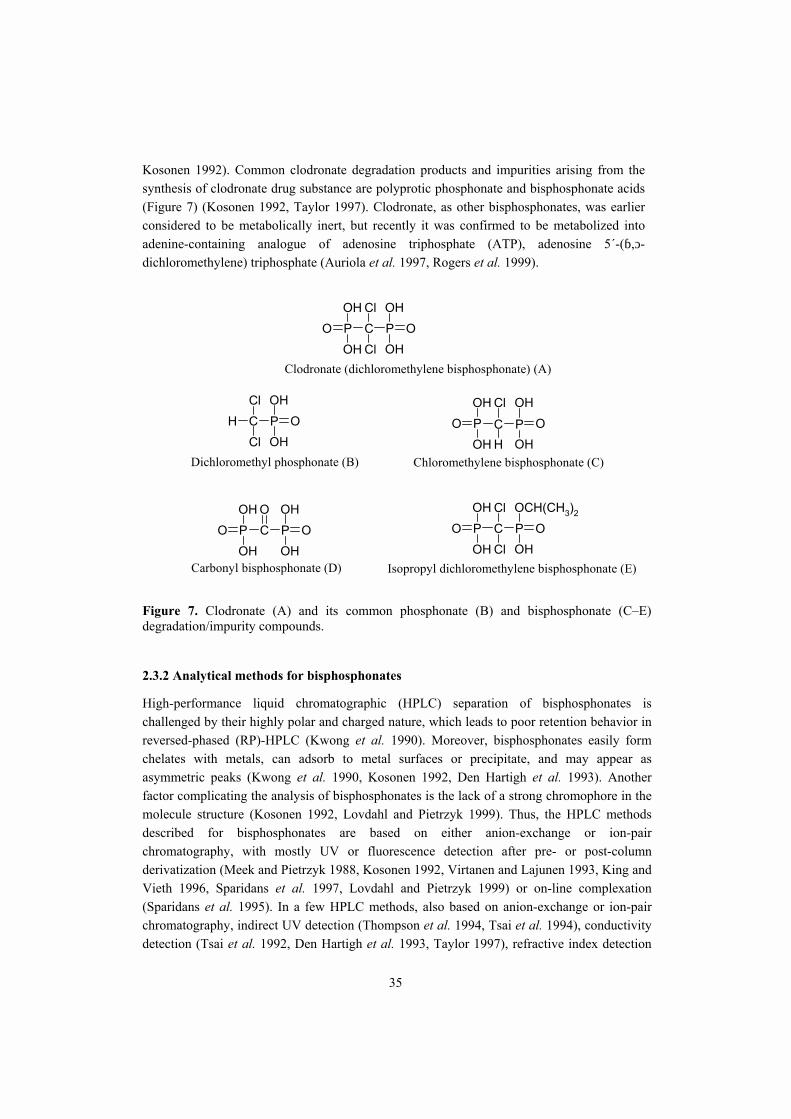
Kosonen 1992). Common clodronate degradation products and impurities arising from the synthesis of clodronate drug substance are polyprotic phosphonate and bisphosphonate acids (Figure 7) (Kosonen 1992, Taylor 1997). Clodronate, as other bisphosphonates, was earlier considered to be metabolically inert, but recently it was confirmed to be metabolized into adenine-containing analogue of adenosine triphosphate (ATP), adenosine 5´-(ɓ,ɔ-dichloromethylene) triphosphate (Auriola et al. 1997, Rogers et al. 1999).
COOH
OHPOH
OHOP
Cl
Cl
COOH
OHPOH
OHOP
O
COOH
OHP
OH
OHOP
Cl
HDichloromethyl phosphonate (B)
Clodronate (dichloromethylene bisphosphonate) (A)
Chloromethylene bisphosphonate (C)
Carbonyl bisphosphonate (D)
COOH
OHPOCH(CH3)2
OHOP
Cl
ClIsopropyl dichloromethylene bisphosphonate (E)
C POH
OHOH
Cl
Cl
Figure 7. Clodronate (A) and its common phosphonate (B) and bisphosphonate (C�E) degradation/impurity compounds. 2.3.2 Analytical methods for bisphosphonates High-performance liquid chromatographic (HPLC) separation of bisphosphonates is challenged by their highly polar and charged nature, which leads to poor retention behavior in reversed-phased (RP)-HPLC (Kwong et al. 1990). Moreover, bisphosphonates easily form chelates with metals, can adsorb to metal surfaces or precipitate, and may appear as asymmetric peaks (Kwong et al. 1990, Kosonen 1992, Den Hartigh et al. 1993). Another factor complicating the analysis of bisphosphonates is the lack of a strong chromophore in the molecule structure (Kosonen 1992, Lovdahl and Pietrzyk 1999). Thus, the HPLC methods described for bisphosphonates are based on either anion-exchange or ion-pair chromatography, with mostly UV or fluorescence detection after pre- or post-column derivatization (Meek and Pietrzyk 1988, Kosonen 1992, Virtanen and Lajunen 1993, King and Vieth 1996, Sparidans et al. 1997, Lovdahl and Pietrzyk 1999) or on-line complexation (Sparidans et al. 1995). In a few HPLC methods, also based on anion-exchange or ion-pair chromatography, indirect UV detection (Thompson et al. 1994, Tsai et al. 1994), conductivity detection (Tsai et al. 1992, Den Hartigh et al. 1993, Taylor 1997), refractive index detection
35
(Chester 1980), flame photometric phosphorus-selective detection (Chester 1980), evaporative light-scattering detection (Niemi et al. 1997) or electrochemical detection (Kline and Matuszewski 1992, Usui et al. 1992) has been applied. Other methods for bisphosphonates besides HPLC are inductively coupled plasma (ICP) spectrometry (Reed et al. 1995) and capillary isotachophoresis (Zeller et al. 1991). Also capillary zone electrophoresis (CZE) based on direct UV detection after complex formation (Tsai et al. 1992) or detection at low wavelength (185 nm) (Peng et al. 1998) has been reported for analyzing alendronate, or 2-thioethane-1,1-bisphosphonic acid. A CZE method relying on indirect UV detection has been presented for clodronate (Sirén et al. 1997), but separation of the bisphosphonate impurities of clodronate drug substance was not described. A limited number of studies have been reported on the MS analysis of bisphosphonates. Fast atom bombardment (FAB)-MS has been applied to the analysis of inorganic salts of dichlromethylene bisphosphonate and other analogues of pyrophosphoric acids (Hutchinson and Semple 1985). In that study, positive ionization FAB with glycerol matrix provided spectra of the analytes with less background than negative ion FAB. Fragmentation of the compounds was not reported. FAB-MS has also been used for the structural characterization of mono- and bisphosphonium halides derived from triphenylphosphine (Claereboudt et al. 1993). Gas chromatography�mass spectrometry (GC/MS) with negative ion chemical ionization (CI) has been applied for the determination of trimethylsilylated clodronate in urine samples (Auriola et al. 1989). Various tetra-alkyl methylene, halomethylene, and dichloromethylene bisphosphonates have been characterized using electron ionization (EI) at 70 eV and CI (Vepsäläinen et al. 1992a,b). Few studies with atmospheric pressure ionization (API) have been reported for bisphosphonates. Ion chromatography�ion spray (IS)-MS, CE/ESI-MS, and LC/ESI-MS/MS have been applied to amino-containing bisphosphonates, including alendronate and bisphosphonates CGP 42446 and 44393 (Qin et al. 1994, Anderson and Henion 1996, Bach and Henion 1996). In the study by Auriola et al. (1997), ion-pair LC�negative ion ESI-MS/MS was applied for adenine nucleotide-containing metabolites of bisphosphonates, including the metabolite of clodronate. Fragmentation of bisphosphonate metabolites was studied in the mass range of m/z 160�700. Major fragment ions were formed by the cleavage of the bisphosphonate moiety from the metabolite conjugate. Fragmentation patterns for clodronate and other bisphosphonate moieties were not reported. To our knowledge, API-MS methods have never been reported for clodronate (A) or the other bisphosphonate (C�E) and phosphonate compounds (B) studied in this work (Figure 7). Likewise, no methods based on MALDI or DIOS analysis have been reported for the bisphosphonates.
36
3 AIMS OF THE STUDY The overall aims of the study were to develop and evaluate capillary electrophoresis�mass spectrometry and microchip�mass spectrometry interfacing techniques and to apply capillary electrophoretic and microchip-based techniques to the analysis of bisphosphonates.
More specific aims of the research were - to construct and evaluate sheath liquid and sheathless interfaces for capillary electrophoresis�electrospray ionization mass spectrometry (CE/ESI-MS), and to study CE/ESI-MS method parameters (I, III), - to optimize porous silicon chips for desorption/ionization on silicon mass spectrometry (DIOS-MS), and to study the applicability of DIOS-MS for the determination of various low-molecular-weight compounds (V), - to develop a microchip for ESI-MS incorporating direct electrospraying from the chip, and to optimize its microfabrication process (VI), - to develop direct CE and microchip-based methods for the analysis of bisphosphonate and phosphonate compounds (III, IV, V), - to optimize ESI-MS detection for bisphosphonate and phosphonate compounds, to study the ESI-MS correlation between the degree of deprotonation in the gas phase and dissociation in the liquid phase, and to examine fragmentation pathways for bisphosphonate and phosphonate compounds (II), - to compare the feasibility of CE-UV and CE/ESI-MS techniques for quantitative analysis of clodronate and its bisphosphonate and phosphonate impurity compounds (III, IV).
37

4 MATERIALS AND METHODS Chemicals, samples, materials, instruments, analytical methods, and microfabrication processes are briefly described in this section. More detailed descriptions can be found in the original publications I-VI. 4.1 Chemicals, samples, and materials Standard compounds, chemicals, and materials used in the study are listed in Table 2. The purpose of each item is briefly noted. Table 2. Standard compounds, chemicals, and materials used in the study. Standard/chemical/material Manufacturer/supplier Comments Paper 1-Naphthalene methylamine Sigma-Aldrich (Germany) Reference standard V
2-Naphthylacetic acid Sigma-Aldrich Reference standard V
Arginine Sigma-Aldrich Reference standard VI
Buprenorphine Sigma-Aldrich Reference standard I, V, VI
Carbonyl bisphosphonate, tetrasodium salt Leiras Ltd (Finland) Reference standard II-IV
Chloromethylene bisphosphonate, tetrasodium salt Leiras Ltd Reference standard II-IV
Clenbuterol Sigma-Aldrich Reference standard I
Des-Arg1-Bradykinin Sigma-Aldrich Reference standard V
Dichloromethyl phosphonate, sodium salt Leiras Ltd Reference standard II-V
Dichloromethylene bisphosphonate, disodium salt Leiras Ltd Reference standard II-V
Histidine Sigma-Aldrich Reference standard VI
Isopropyl dichloromethylene bisphosphonate, disodium salt
Leiras Ltd Reference standard II-IV
Leu-Enkephalin-Arg Sigma-Aldrich Reference standard V
Midazolam Sigma-Aldrich Reference standard V
Morphine Sigma-Aldrich Reference standard I
Phenylphosphonic acid Fluka (Switzerland) Reference standard III, IV
Propranolol Sigma-Aldrich Reference standard V
Psilocin Sigma-Aldrich Reference standard I, V, VI
Substance P Sigma-Aldrich Reference standard V
10-Undecenoic acid Sigma-Aldrich Reagent V
2,5-Dihydroxybenzoic acid Fluka MALDI matrix reagent V
Acetic acid Merck/VWR Int. (Finland) Reagent I, III, VI
Acetonitrile Rathburn (UK) Solvent V
Alpha-cyano-4-hydroxycinnamic acid Sigma-Aldrich MALDI matrix reagent V
Ammonium acetate Merck/VWR Int. Reagent I, III, VI
38
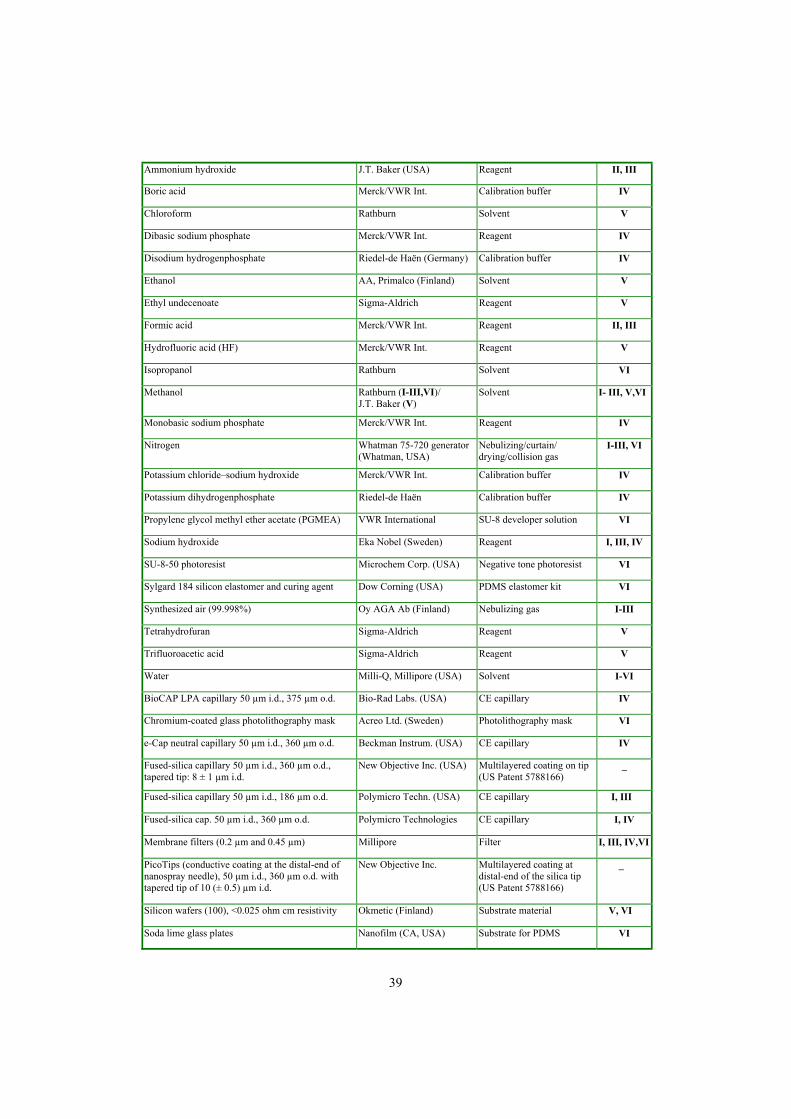
Ammonium hydroxide J.T. Baker (USA) Reagent II, III
Boric acid Merck/VWR Int. Calibration buffer IV
Chloroform Rathburn Solvent V
Dibasic sodium phosphate Merck/VWR Int. Reagent IV
Disodium hydrogenphosphate Riedel-de Haën (Germany) Calibration buffer IV
Ethanol AA, Primalco (Finland) Solvent V
Ethyl undecenoate Sigma-Aldrich Reagent V
Formic acid Merck/VWR Int. Reagent II, III
Hydrofluoric acid (HF) Merck/VWR Int. Reagent V
Isopropanol Rathburn Solvent VI
Methanol Rathburn (I-III,VI)/ J.T. Baker (V)
Solvent I- III, V,VI
Monobasic sodium phosphate Merck/VWR Int. Reagent IV
Nitrogen Whatman 75-720 generator (Whatman, USA)
Nebulizing/curtain/ drying/collision gas
I-III, VI
Potassium chloride�sodium hydroxide Merck/VWR Int. Calibration buffer IV
Potassium dihydrogenphosphate Riedel-de Haën Calibration buffer IV
Propylene glycol methyl ether acetate (PGMEA) VWR International SU-8 developer solution VI
Sodium hydroxide Eka Nobel (Sweden) Reagent I, III, IV
SU-8-50 photoresist Microchem Corp. (USA) Negative tone photoresist VI
Sylgard 184 silicon elastomer and curing agent Dow Corning (USA) PDMS elastomer kit VI
Synthesized air (99.998%) Oy AGA Ab (Finland) Nebulizing gas I-III
Tetrahydrofuran Sigma-Aldrich Reagent V
Trifluoroacetic acid Sigma-Aldrich Reagent V
Water Milli-Q, Millipore (USA) Solvent I-VI
BioCAP LPA capillary 50 µm i.d., 375 µm o.d. Bio-Rad Labs. (USA) CE capillary IV
Chromium-coated glass photolithography mask Acreo Ltd. (Sweden) Photolithography mask VI
e-Cap neutral capillary 50 µm i.d., 360 µm o.d. Beckman Instrum. (USA) CE capillary IV
Fused-silica capillary 50 µm i.d., 360 µm o.d., tapered tip: 8 ± 1 µm i.d.
New Objective Inc. (USA) Multilayered coating on tip (US Patent 5788166)
_
Fused-silica capillary 50 µm i.d., 186 µm o.d. Polymicro Techn. (USA) CE capillary I, III
Fused-silica cap. 50 µm i.d., 360 µm o.d.
Polymicro Technologies CE capillary I, IV
Membrane filters (0.2 µm and 0.45 µm) Millipore Filter I, III, IV,VI
PicoTips (conductive coating at the distal-end of nanospray needle), 50 µm i.d., 360 µm o.d. with tapered tip of 10 (± 0.5) µm i.d.
New Objective Inc. Multilayered coating at distal-end of the silica tip (US Patent 5788166)
_
Silicon wafers (100), <0.025 ohm cm resistivity Okmetic (Finland) Substrate material V, VI
Soda lime glass plates Nanofilm (CA, USA) Substrate for PDMS VI
39
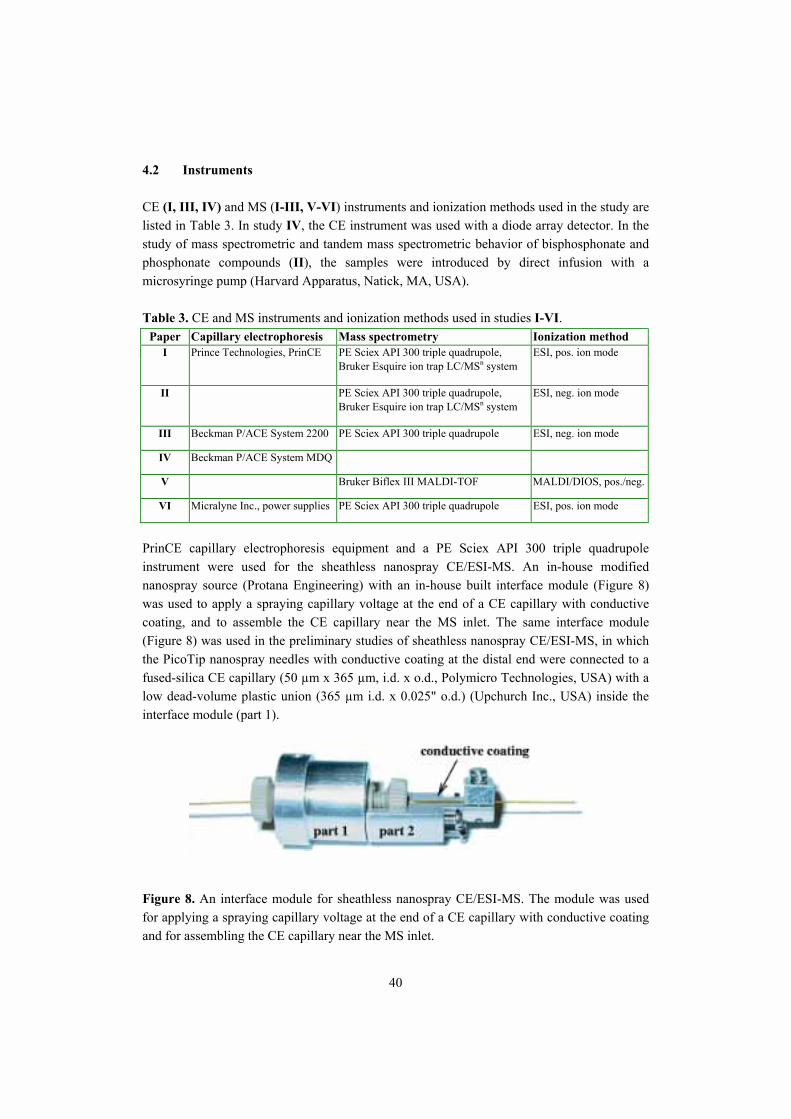
4.2 Instruments CE (I, III, IV) and MS (I-III, V-VI) instruments and ionization methods used in the study are listed in Table 3. In study IV, the CE instrument was used with a diode array detector. In the study of mass spectrometric and tandem mass spectrometric behavior of bisphosphonate and phosphonate compounds (II), the samples were introduced by direct infusion with a microsyringe pump (Harvard Apparatus, Natick, MA, USA). Table 3. CE and MS instruments and ionization methods used in studies I-VI.
Paper Capillary electrophoresis Mass spectrometry Ionization method I Prince Technologies, PrinCE PE Sciex API 300 triple quadrupole, ESI, pos. ion mode Bruker Esquire ion trap LC/MSn system
II PE Sciex API 300 triple quadrupole, ESI, neg. ion mode Bruker Esquire ion trap LC/MSn system
III Beckman P/ACE System 2200 PE Sciex API 300 triple quadrupole ESI, neg. ion mode
IV Beckman P/ACE System MDQ
V Bruker Biflex III MALDI-TOF MALDI/DIOS, pos./neg.
VI Micralyne Inc., power supplies PE Sciex API 300 triple quadrupole ESI, pos. ion mode
PrinCE capillary electrophoresis equipment and a PE Sciex API 300 triple quadrupole instrument were used for the sheathless nanospray CE/ESI-MS. An in-house modified nanospray source (Protana Engineering) with an in-house built interface module (Figure 8) was used to apply a spraying capillary voltage at the end of a CE capillary with conductive coating, and to assemble the CE capillary near the MS inlet. The same interface module (Figure 8) was used in the preliminary studies of sheathless nanospray CE/ESI-MS, in which the PicoTip nanospray needles with conductive coating at the distal end were connected to a fused-silica CE capillary (50 µm x 365 µm, i.d. x o.d., Polymicro Technologies, USA) with a low dead-volume plastic union (365 µm i.d. x 0.025" o.d.) (Upchurch Inc., USA) inside the interface module (part 1).
Figure 8. An interface module for sheathless nanospray CE/ESI-MS. The module was used for applying a spraying capillary voltage at the end of a CE capillary with conductive coating and for assembling the CE capillary near the MS inlet.
40
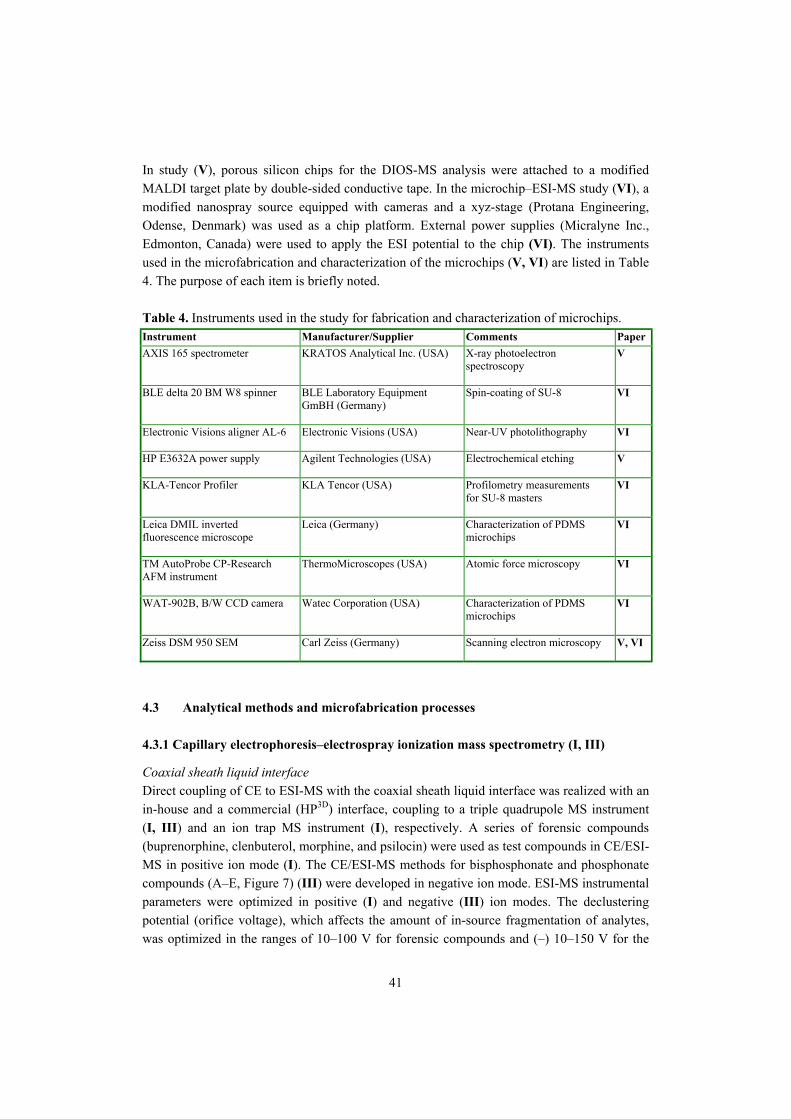
In study (V), porous silicon chips for the DIOS-MS analysis were attached to a modified MALDI target plate by double-sided conductive tape. In the microchip�ESI-MS study (VI), a modified nanospray source equipped with cameras and a xyz-stage (Protana Engineering, Odense, Denmark) was used as a chip platform. External power supplies (Micralyne Inc., Edmonton, Canada) were used to apply the ESI potential to the chip (VI). The instruments used in the microfabrication and characterization of the microchips (V, VI) are listed in Table 4. The purpose of each item is briefly noted.
Table 4. Instruments used in the study for fabrication and characterization of microchips. Instrument Manufacturer/Supplier Comments PaperAXIS 165 spectrometer KRATOS Analytical Inc. (USA) X-ray photoelectron
spectroscopy
V
BLE delta 20 BM W8 spinner BLE Laboratory Equipment GmBH (Germany)
Spin-coating of SU-8 VI
Electronic Visions aligner AL-6 Electronic Visions (USA) Near-UV photolithography VI
HP E3632A power supply Agilent Technologies (USA) Electrochemical etching V
KLA-Tencor Profiler KLA Tencor (USA) Profilometry measurements for SU-8 masters
VI
Leica DMIL inverted fluorescence microscope
Leica (Germany) Characterization of PDMS microchips
VI
TM AutoProbe CP-Research AFM instrument
ThermoMicroscopes (USA) Atomic force microscopy VI
WAT-902B, B/W CCD camera Watec Corporation (USA) Characterization of PDMS microchips
VI
Zeiss DSM 950 SEM Carl Zeiss (Germany) Scanning electron microscopy V, VI
4.3 Analytical methods and microfabrication processes 4.3.1 Capillary electrophoresis�electrospray ionization mass spectrometry (I, III) Coaxial sheath liquid interface Direct coupling of CE to ESI-MS with the coaxial sheath liquid interface was realized with an in-house and a commercial (HP3D) interface, coupling to a triple quadrupole MS instrument (I, III) and an ion trap MS instrument (I), respectively. A series of forensic compounds (buprenorphine, clenbuterol, morphine, and psilocin) were used as test compounds in CE/ESI-MS in positive ion mode (I). The CE/ESI-MS methods for bisphosphonate and phosphonate compounds (A�E, Figure 7) (III) were developed in negative ion mode. ESI-MS instrumental parameters were optimized in positive (I) and negative (III) ion modes. The declustering potential (orifice voltage), which affects the amount of in-source fragmentation of analytes, was optimized in the ranges of 10�100 V for forensic compounds and (�) 10�150 V for the
41
bisphosphonates with the triple quadrupole instrument. With the ion trap, capillary exit and skimmer voltages were set accordingly. Effects of nebulizing gas velocity on the CE/ESI-MS were studied in the pressure range of 4�30 psi with the ion trap and in the flow rate range of 1.04�1.55 l/min (corresponding to the arbitrary units 9�14 of the API 300 instrument) with the triple quadrupole instrument (I). Drying gas (ion trap) velocity and temperature effects were studied in the ranges of 2�10 l/min and 30�300°C. With the interface set-up with the triple quadrupole instrument, spray needle voltage was set to 5 kV in positive ion mode and (�) 4.5 kV in negative ion mode. With the ion trap, a sampling capillary entrance voltage of (�/+) 3.8 kV (pos./neg. ion mode) relative to the CE/MS sprayer was applied. The ESI-MS instrumental parameters are described in more detail in paper I for the analysis of forensic compounds and in paper III for the analysis of bisphosphonate and phosphonate compounds. Sheath liquid composition and flow rate were optimized in order to provide stable CE/ESI-MS and maximum ionization efficiency for the analyte ions of the study. For the forensic compounds (I), the optimal sheath liquid was 20 mM ammonium acetate in methanol�water, 3/1, v/v, pH 5.0 (adjusted with acetic acid). In the studies with the triple quadrupole, a sheath liquid flow rate of 5 µl/min was applied, and with the ion trap, a flow rate of 1.33 µl/min. For the bisphosphonate and phosphonate compounds (III), the sheath liquid was 20 mM ammonium acetate in methanol�water, 3/1, v/v, pH 5.0, delivered with a flow rate of 5 µl/min. CE separation of the analytes was optimized for different types and dimensions of separation capillaries (I, III, and Table 2) and for injection method and separation potential and the nature, pH, and ionic strength of the CE electrolyte solution (I, III). All samples were injected hydrodynamically, the injection pressure and time varying according to the method (I, III). Forensic compounds were separated with CZE of normal polarity [(+)=>(�)] in an acidic electrolyte (25 mM ammonium acetate, pH 5.0, adjusted with acetic acid) and bisphosphonate and phosphonate compounds with CZE of normal polarity in a basic electrolyte (20 mM ammonium acetate, pH 8.0, adjusted with ammonium hydroxide). Sheathless nanospray interface The sheathless nanospray CE/ESI-MS interface was constructed with two set-ups. In the first set-up, a tapered nanospray needle with conductive coating at the distal end (Table 2) was connected to the fused-silica separation capillary via a low dead-volume plastic union (Figure 8). In the second set-up, fused-silica capillaries with a conductive coating (Table 2) at the capillary tip were used. In both set-ups, the capillaries were attached to the MS inlet with an interface module (Figure 8), which was also used for applying the spraying capillary voltage at the conductive coating at the end of the nanospray needle or fused-silica capillary. The performance of the two set-ups for sheathless nanospray CE/ESI-MS was tested in positive and negative ion modes.
42
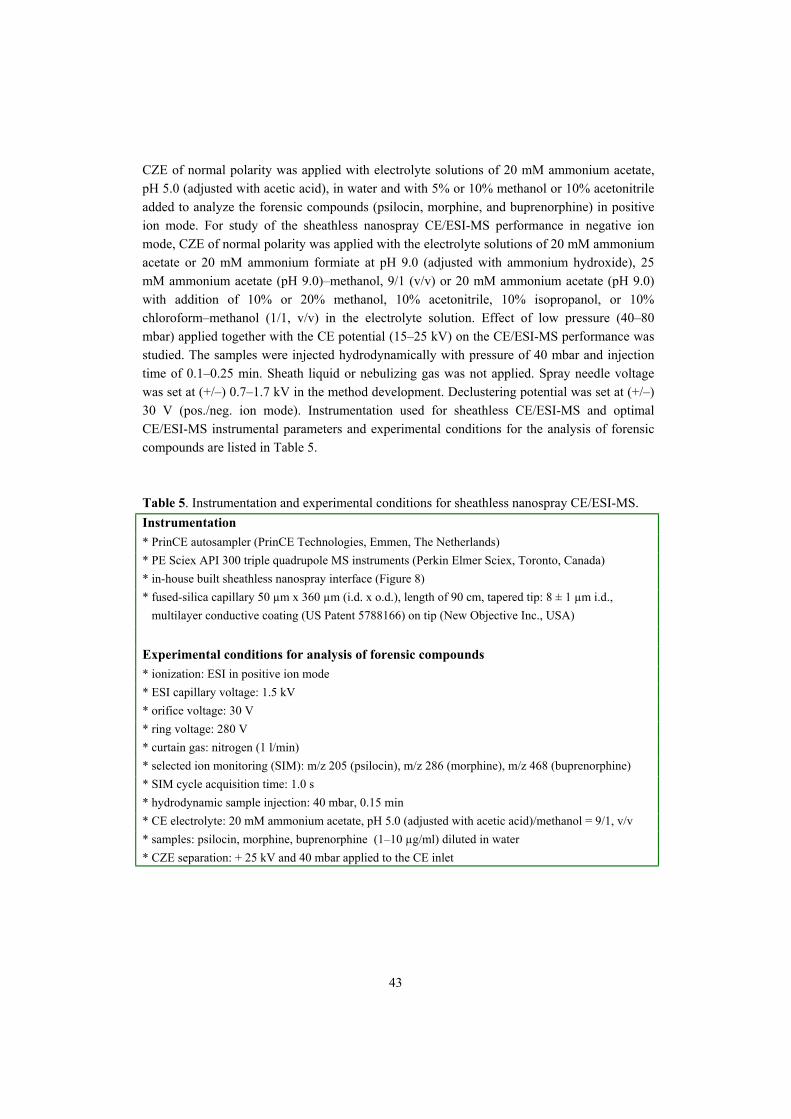
CZE of normal polarity was applied with electrolyte solutions of 20 mM ammonium acetate, pH 5.0 (adjusted with acetic acid), in water and with 5% or 10% methanol or 10% acetonitrile added to analyze the forensic compounds (psilocin, morphine, and buprenorphine) in positive ion mode. For study of the sheathless nanospray CE/ESI-MS performance in negative ion mode, CZE of normal polarity was applied with the electrolyte solutions of 20 mM ammonium acetate or 20 mM ammonium formiate at pH 9.0 (adjusted with ammonium hydroxide), 25 mM ammonium acetate (pH 9.0)�methanol, 9/1 (v/v) or 20 mM ammonium acetate (pH 9.0) with addition of 10% or 20% methanol, 10% acetonitrile, 10% isopropanol, or 10% chloroform�methanol (1/1, v/v) in the electrolyte solution. Effect of low pressure (40�80 mbar) applied together with the CE potential (15�25 kV) on the CE/ESI-MS performance was studied. The samples were injected hydrodynamically with pressure of 40 mbar and injection time of 0.1�0.25 min. Sheath liquid or nebulizing gas was not applied. Spray needle voltage was set at (+/�) 0.7�1.7 kV in the method development. Declustering potential was set at (+/�) 30 V (pos./neg. ion mode). Instrumentation used for sheathless CE/ESI-MS and optimal CE/ESI-MS instrumental parameters and experimental conditions for the analysis of forensic compounds are listed in Table 5. Table 5. Instrumentation and experimental conditions for sheathless nanospray CE/ESI-MS. Instrumentation * PrinCE autosampler (PrinCE Technologies, Emmen, The Netherlands) * PE Sciex API 300 triple quadrupole MS instruments (Perkin Elmer Sciex, Toronto, Canada) * in-house built sheathless nanospray interface (Figure 8) * fused-silica capillary 50 µm x 360 µm (i.d. x o.d.), length of 90 cm, tapered tip: 8 ± 1 µm i.d., multilayer conductive coating (US Patent 5788166) on tip (New Objective Inc., USA) Experimental conditions for analysis of forensic compounds * ionization: ESI in positive ion mode * ESI capillary voltage: 1.5 kV * orifice voltage: 30 V * ring voltage: 280 V * curtain gas: nitrogen (1 l/min) * selected ion monitoring (SIM): m/z 205 (psilocin), m/z 286 (morphine), m/z 468 (buprenorphine) * SIM cycle acquisition time: 1.0 s * hydrodynamic sample injection: 40 mbar, 0.15 min * CE electrolyte: 20 mM ammonium acetate, pH 5.0 (adjusted with acetic acid)/methanol = 9/1, v/v * samples: psilocin, morphine, buprenorphine (1�10 µg/ml) diluted in water * CZE separation: + 25 kV and 40 mbar applied to the CE inlet
43
4.3.2 ESI-MSn behavior of bisphosphonate and phosphonate compounds (II) MSn (n= 1�6) behavior for four bisphosphonates (A, C�E) and one phosphonate (B) (Figure 7) was examined with ESI (II). Negative ion mode was applied because of the polyprotic acidic nature of the compounds. The most important MS instrumental parameters studied were declustering potential (orifice voltage), optimized in the range of (�) 10�150 V; collision energy (5�60 eV in the laboratory frame studied with triple quadrupole), and excitation amplitude (0.4�1.2 studied with ion trap). All the instrumental parameters are presented in paper II in the section "Instrumentation". In exploring the ESI-MS behavior of the analytes, the sample solvent was optimized in the pH range 2.5�11.0. The pH of the sample solutions was adjusted using formic acid at pH 2.5�5.0 and ammonium hydroxide at pH 8.5�11.0. Sample solutions of 5�100 µg/ml were used in studying the dynamic range of the method, the final concentration being 20 µg/ml in the MS experiments and 10 µg/ml in the multistage tandem mass spectrometry (MSn, n=2�6) studies. Tandem mass spectrometric behavior and fragmentation pathways for compounds A�E were studied with triple quadrupole and ion trap instruments (II). All the fragmentation pathways were confirmed by MSn (n=2�6) studies with the ion trap and by MS/MS experiments on the fragment ions produced by in-source collisional activation with the triple quadrupole instrument. 4.3.3 Capillary electrophoretic method for bisphosphonate drug purity analysis (IV) Capillary electrophoresis (CE) with UV detection was applied to the quantitative determination of bisphosphonate and phosphonate impurities in clodronate bulk materials (IV). Indirect and direct UV detection techniques were compared. For indirect detection, phenylphosphonic acid (pH 7.5 adjusted with sodium hydroxide) as background electrolyte and the wavelength of 214 nm were applied. For the wavelength optimization in the direct detection, UV spectra of the compounds were recorded by using diode array detection in the wavelength region of 190�300 nm. Measured signal-to-noise (S/N) ratios for the compounds and the baseline stability affecting the reproducibility of the CE-UV method were the final criteria for the selection of the wavelength (200 nm) for the method. Two neutral-coated (polyacrylamide) capillaries of BioCAP LPA and e-Cap were compared with conventional fused-silica capillaries in the method development. Neutral-coated capillaries allowed the use of reversed polarity (cathode as injection end) in the separation of acidic compounds under the minimized EOF. Hydrodynamic injection (optimized in the range of 4�40 s with pressure 3.45 kPa) and electrokinetic injection (optimized in the range of 4�20 s with voltages (�) 5 kV and (�) 10 kV) were compared in the method development. Composition of the CE electrolyte solution was optimized in terms of electrolyte type, pH (in the range of 4�8), and ionic strength (20�50 mM). Suitability of the optimized method for quantitative determination of clodronate and related impurities in bulk materials was evaluated in validation studies in terms of specificity, within-day precision (repeatability), between-day precision (reproducibility), limits of detection (LODs) and quantitation (LOQs), accuracy, linearity, and range.
44
4.3.4 Desorption/ionization on silicon mass spectrometry (V) Porous silicon (pSi) chips for DIOS-MS (V) were fabricated by electrochemical etching of silicon in hydrofluoric acid (HF)�ethanol solution. Electronic holes in the silicon were created in n-type silicon by illumination of the sample (V: Figure 1). Porous areas were defined by a HF-tolerant stencil mask, which was placed in contact with the silicon wafer. Electrochemical etching conditions (V: Table 1), including etching voltage and time, current density, illumination set-up, and illumination parameters, were studied to achieve optimal pore formation for DIOS. By means of droplet evaporation tests and DIOS-MS measurements, the pSi sample area, pore size, and depth were optimized to minimize the droplet spreading and to achieve pore filling with the sample as measured by DIOS-MS efficiency. The DIOS-MS measurements were done in both positive and negative ion mode. The Bruker Biflex III MALDI-TOF instrument was operated with a pulsed nitrogen laser at 337 nm. DIOS-MS signal-to-noise (S/N) ratios for the analytes were maximized by optimizing various operation parameters of the MALDI-TOF instrument, including laser energy, laser pulse frequency, and pulse averaging. To explore whether the pSi surface is crucial for matrix-free laser desorption/ionization (LDI), a conventional MALDI steel plate and non-porous silicon were compared with the pSi surface as LDI sample targets. As well, the effect of chemical derivatization of the pSi surface on the DIOS-MS efficiency was examined. For these studies, organic monolayers of ethyl undecenoate or 10-undecenoic acid were covalently attached to the pSi surfaces by Si-C bonds. S/N ratios for the analytes were measured with DIOS-MS and compared with the ratios recorded with non-derivatized surfaces. Derivatized pSi surfaces were also characterized with X-ray photoelectron spectroscopy (XPS) measurements. As well, the storage conditions for the non-derivatized and derivatized pSi surfaces were examined. The pSi fabricated under the optimal reaction conditions (V: Table 1) was applied to the analysis of various low-molecular-weight compounds (buprenorphine, midazolam, psilocin, propranolol, 1-naphthalene methylamine, 2-naphthylacetic acid, dichloromethyl phosphonate, and dichloromethylene bisphosphonate, i.e. clodronate) and small peptides (Leu-Enkephalin-Arg, Des-Arg1-Bradykinin, and Substance P). The mass spectrometric behavior and detection limits were determined for the analytes. 4.3.5 Electrospray ionization from poly(dimethylsiloxane) microchip (VI) The work included optimization of the poly(dimethylsiloxane) (PDMS) microchip fabrication process and examination of the performance of PDMS chips in ESI-MS analysis (VI). Layouts for the microchip designs were done with the AUTOCAD LT 2002 drawing program. The CAD design patterns were transferred to high-resolution chromium-coated glass photolithography masks (Acreo Ltd., Sweden). The masters for PDMS chip replications were fabricated from negative tone epoxy-type photoresist, SU-8, on the silicon substrate. The fabrication process for the SU-8 channels was optimized in terms of the resist spinning method, the near-UV lithography method, and the SU-8 baking and development procedures.
45
To improve the life-time of the SU-8 masters in PDMS replications, a new coating material, diamond-like carbon�poly(dimethylsiloxane) hybrid (Anttila et al. 2003), was deposited on the masters by filtered pulsed plasma arc discharge technique (Anttila et al. 2003). The life-time of the coated masters was studied in PDMS casting and removal experiments (VI). Both the non-coated and coated SU-8 masters were characterized by optical microscopy and profilometry measurements. Scanning electron microscopy (SEM) and atomic force microscopy (AFM) measurements were done for part of the non-coated and coated SU-8 masters. The PDMS chip replication method was optimized for the ratio of PDMS elastomer to curing agent, curing time, and curing temperature to facilitate coupling of a PDMS chip with ESI-MS. PDMS channel shapes and dimensions and the flow profiles in microchannels were characterized by optical microscopy measurements. The surface roughness for some of the PDMS channels was measured by AFM. The performance of the PDMS electrospraying devices was studied in the electrokinetic direct-infusion ESI-MS of psilocin, buprenorphine, histidine, and arginine. PDMS channel dimensions, sample solvents, and operating parameters for the chip�ESI-MS interfacing such as the distance between a chip and the MS counter plate, the ESI potential, and the curtain gas flow were examined. Nebulizing gas was not applied. The total ion current and the ESI mass spectra were recorded in the scan range of m/z 50�500 with the scan speed of 1.0 s/scan.
46
5 RESULTS AND DISCUSSION The main results obtained in this study are now summarized. More detailed information about the experimental conditions, analytical and microfabrication procedures, and the results can be found in the original publications I-VI. For the unpublished results presented below, the chemicals, instrumentation, and experimental conditions are listed in Tables 2 and 5 and the analytical procedures are described in section 4.3.1. 5.1 Examination of CE/ESI-MS interfaces: coaxial sheath liquid and sheathless nanospray techniques 5.1.1 Operating parameters with coaxial sheath liquid interfaces (I, III) Two coaxial sheath liquid CE/ESI-MS interfaces were examined in this study. The first interface was constructed for coupling the CE to a PE Sciex API 300 triple quadrupole instrument. For transfer of the CE capillary out of the CE instrument, a small hole was drilled in the capillary cooling cassette and the electric shielding of the CE instrument was modified. The CE capillary was mounted inside the electrospray ion source with plastic coupling pieces, as with a conventional ESI spraying capillary. The other coaxial sheath liquid CE/ESI-MS set-up consisted of a commercial HP3D CE/MS interface with an orthogonal ESI source coupled to a Bruker Esquire ion trap instrument. With both set-ups, the CE capillary inlet and spraying capillary outlet were levelled to the same height to prevent siphoning, and the CE instrument was grounded with the MS instrument. The CE/ESI-MS instrumental parameters were systematically explored with both interfacing set-ups. The length of CE capillary protruding from the middle stainless steel capillary (I: Figure 1) was observed to be critical for proper CE/ESI-MS performance. With both interfaces, a protrusion of 1�2 mm for the CE capillary provided the maximum stability and sensitivity for CE/ESI-MS. Optimal sheath liquid flow rate varied with the two interface set-ups. With the in-house assembled interface and the triple quadrupole instrument, a sheath liquid flow rate of 5 µl/min provided maximum stability and sensitivity for the CE/ESI-MS methods (I, III), while a considerably lower flow rate of 1.33 µl/min was required for the HP3D CE/MS interface coupled to the ion trap (I). Also examined were the effects of nebulizing and drying gas flow on the CE/ESI-MS performance (I). With the HP3D CE/MS interface, nebulizing gas back-pressure was raised in small steps from 4 to 30 psi, while the other operation parameters (I) were kept constant. The maximum detection sensitivity (measured as peak area and S/N ratios for the analytes) was achieved with the highest back-pressure (30 psi) for the nebulizing gas (Figure 9). However, with increasing gas pressure in the range of 7�30 psi, migration times of the test compounds decreased considerably (Figure 9) and the resolution decreased. Migration times with a pressure of 20 psi were several minutes lower than those measured with a pressure of
47
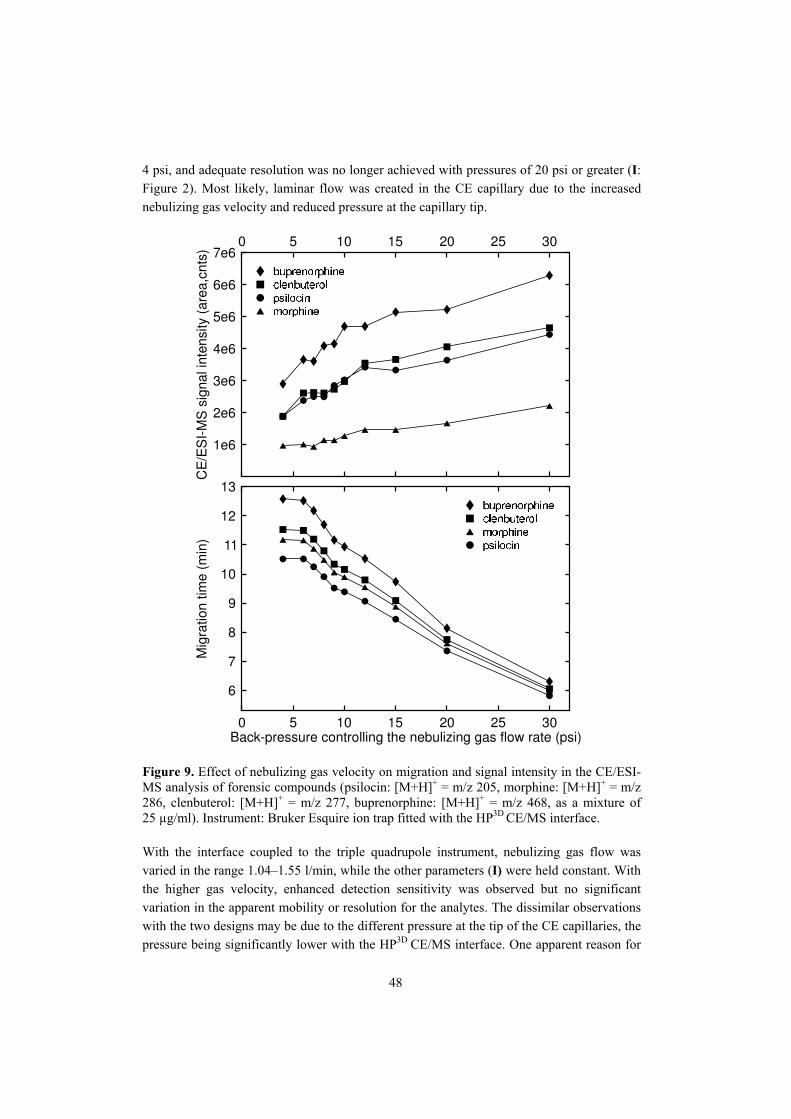
4 psi, and adequate resolution was no longer achieved with pressures of 20 psi or greater (I: Figure 2). Most likely, laminar flow was created in the CE capillary due to the increased nebulizing gas velocity and reduced pressure at the capillary tip.
Figure 9. Effect of nebulizing gas velocity on migration and signal intensity in the CE/ESI-MS analysis of forensic compounds (psilocin: [M+H]+ = m/z 205, morphine: [M+H]+ = m/z 286, clenbuterol: [M+H]+ = m/z 277, buprenorphine: [M+H]+ = m/z 468, as a mixture of 25 µg/ml). Instrument: Bruker Esquire ion trap fitted with the HP3D CE/MS interface. With the interface coupled to the triple quadrupole instrument, nebulizing gas flow was varied in the range 1.04�1.55 l/min, while the other parameters (I) were held constant. With the higher gas velocity, enhanced detection sensitivity was observed but no significant variation in the apparent mobility or resolution for the analytes. The dissimilar observations with the two designs may be due to the different pressure at the tip of the CE capillaries, the pressure being significantly lower with the HP3D CE/MS interface. One apparent reason for
48
such a pressure difference is the different cross-sectional dimensions of the outer wall of the CE capillary and the inner wall of the stainless steel capillary in the two CE/MS interfaces. Small-bore capillaries of 50 µm i.d. were used in both interfaces, but, owing to the different sizes of the middle steel capillaries, CE capillaries with different outer diameters had to be employed. Different wall thicknesses of the capillaries can result in different closenesses of the CE capillary and nebulizing gas streamline and affect the pressure at the capillary tip. Study was also made of the effects of ion trap drying gas flow velocity (2�10 l/min) and temperature (30�300°C) (I). The drying gas flow velocity mostly affected the stability and slightly the intensity of the CE/MS signal, the optimal flow rate being 6�10 l/min. The drying gas temperature effects were studied to determine whether a temperature gradient is formed in the CE capillary due to the heated drying gas inside the HP3D CE/MS interface. No variation in migration times with altered drying gas temperature was observed, however. The temperature could therefore be set at 300°C, which provided 10-fold or more increase in signal intensity and S/N ratios for the compounds (I: Figure 4). The effect was evidently due to the enhanced solvent evaporation at elevated temperature. Examination of the CE/ESI-MS parameters thus showed the most critical instrumental parameter in terms of the separation efficiency to be the nebulizing gas flow. This result indicates the importance of optimizing the cross-sectional dimensions of fused-silica and steel capillaries in addition to the gas streamlines when constructing coaxial sheath liquid interfaces and of exploring gas flow parameters in the development of sheath liquid CE/ESI-MS methods. 5.1.2 Construction and evaluation of sheathless nanospray interfaces Two approaches for a sheathless nanospray CE/ESI-MS interface were investigated in this work. In the first, a nanospray needle with a tapered tip of 10 µm i.d. (Table 2) and conductive coating at the distal end was applied for spraying. The aim was to overcome the problems of coating stability reported in the literature by applying the coating at the distal-end of the needle instead of the spraying tip. The nanospray needle was connected to a CE separation capillary of the same internal (50 µm) and outer diameter (365 µm) via a low dead-volume plastic union inside the interface module (part 1), which was made of aluminum (Figure 8). The spraying capillary voltage was applied to part 2 of the interface module, which was in contact with the conductive coating of the needle (Figure 8). The interface module was attached to the modified nanospray source with the xyz-stage for aligning the spraying needle at the MS inlet. The set-up was tested in positive and negative ion modes. In the end, however, this interface proved unsuitable owing to the formation of gas bubbles at the capillary junction with the applied separation and spraying capillary potentials. Probably the gas bubbles originated in electrochemical redox reactions of water at the capillary junction. As discussed in section 2.1.3, the same problem has been observed with the sheathless interfaces with conductive wire applied inside the CE capillary (Moini 2001, 2002).
49
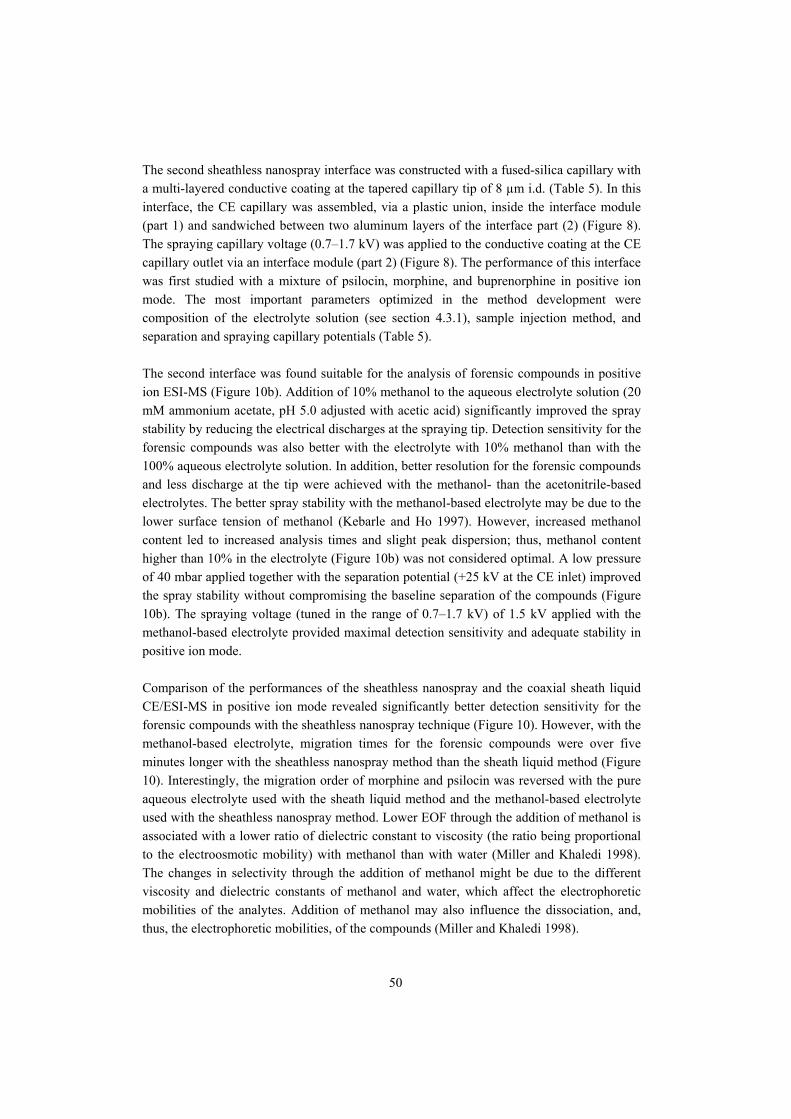
The second sheathless nanospray interface was constructed with a fused-silica capillary with a multi-layered conductive coating at the tapered capillary tip of 8 µm i.d. (Table 5). In this interface, the CE capillary was assembled, via a plastic union, inside the interface module (part 1) and sandwiched between two aluminum layers of the interface part (2) (Figure 8). The spraying capillary voltage (0.7�1.7 kV) was applied to the conductive coating at the CE capillary outlet via an interface module (part 2) (Figure 8). The performance of this interface was first studied with a mixture of psilocin, morphine, and buprenorphine in positive ion mode. The most important parameters optimized in the method development were composition of the electrolyte solution (see section 4.3.1), sample injection method, and separation and spraying capillary potentials (Table 5). The second interface was found suitable for the analysis of forensic compounds in positive ion ESI-MS (Figure 10b). Addition of 10% methanol to the aqueous electrolyte solution (20 mM ammonium acetate, pH 5.0 adjusted with acetic acid) significantly improved the spray stability by reducing the electrical discharges at the spraying tip. Detection sensitivity for the forensic compounds was also better with the electrolyte with 10% methanol than with the 100% aqueous electrolyte solution. In addition, better resolution for the forensic compounds and less discharge at the tip were achieved with the methanol- than the acetonitrile-based electrolytes. The better spray stability with the methanol-based electrolyte may be due to the lower surface tension of methanol (Kebarle and Ho 1997). However, increased methanol content led to increased analysis times and slight peak dispersion; thus, methanol content higher than 10% in the electrolyte (Figure 10b) was not considered optimal. A low pressure of 40 mbar applied together with the separation potential (+25 kV at the CE inlet) improved the spray stability without compromising the baseline separation of the compounds (Figure 10b). The spraying voltage (tuned in the range of 0.7�1.7 kV) of 1.5 kV applied with the methanol-based electrolyte provided maximal detection sensitivity and adequate stability in positive ion mode. Comparison of the performances of the sheathless nanospray and the coaxial sheath liquid CE/ESI-MS in positive ion mode revealed significantly better detection sensitivity for the forensic compounds with the sheathless nanospray technique (Figure 10). However, with the methanol-based electrolyte, migration times for the forensic compounds were over five minutes longer with the sheathless nanospray method than the sheath liquid method (Figure 10). Interestingly, the migration order of morphine and psilocin was reversed with the pure aqueous electrolyte used with the sheath liquid method and the methanol-based electrolyte used with the sheathless nanospray method. Lower EOF through the addition of methanol is associated with a lower ratio of dielectric constant to viscosity (the ratio being proportional to the electroosmotic mobility) with methanol than with water (Miller and Khaledi 1998). The changes in selectivity through the addition of methanol might be due to the different viscosity and dielectric constants of methanol and water, which affect the electrophoretic mobilities of the analytes. Addition of methanol may also influence the dissociation, and, thus, the electrophoretic mobilities, of the compounds (Miller and Khaledi 1998).
50
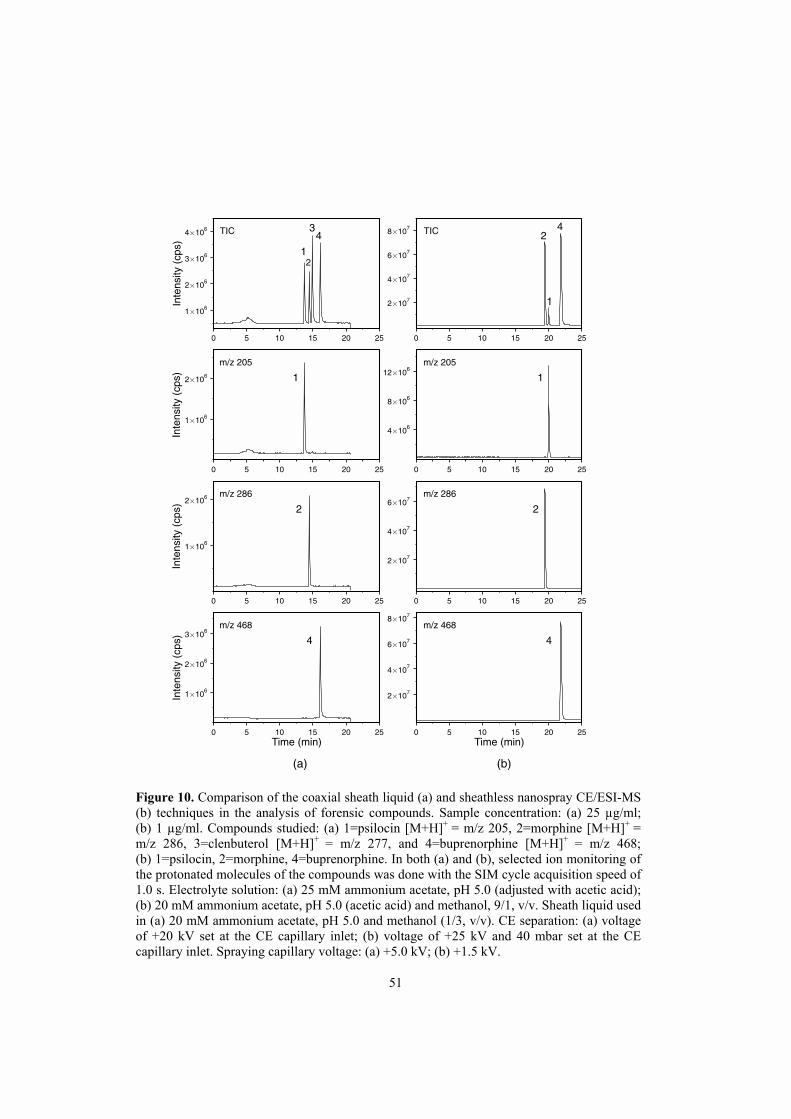
0 5 10 15 20 25Time (min)
1 106
2 106
3 106
Inte
nsity
(cps
) 4
m/z 468
0 5 10 15 20 25
1 106
2 106
Inte
nsity
(cps
) 2
m/z 286
0 5 10 15 20 25
1 106
2 106
Inte
nsity
(cps
) 1
m/z 205
0 5 10 15 20 25
1 106
2 106
3 106
4 106
Inte
nsity
(cps
)
12
34TIC
0 5 10 15 20 25Time (min)
2 107
4 107
6 107
8 107
4
m/z 468
0 5 10 15 20 25
2 107
4 107
6 107
2
m/z 286
0 5 10 15 20 25
4 106
8 106
12 106
1
m/z 205
0 5 10 15 20 25
2 107
4 107
6 107
8 107
1
24TIC
(a) (b) Figure 10. Comparison of the coaxial sheath liquid (a) and sheathless nanospray CE/ESI-MS (b) techniques in the analysis of forensic compounds. Sample concentration: (a) 25 µg/ml; (b) 1 µg/ml. Compounds studied: (a) 1=psilocin [M+H]+ = m/z 205, 2=morphine [M+H]+ = m/z 286, 3=clenbuterol [M+H]+ = m/z 277, and 4=buprenorphine [M+H]+ = m/z 468; (b) 1=psilocin, 2=morphine, 4=buprenorphine. In both (a) and (b), selected ion monitoring of the protonated molecules of the compounds was done with the SIM cycle acquisition speed of 1.0 s. Electrolyte solution: (a) 25 mM ammonium acetate, pH 5.0 (adjusted with acetic acid); (b) 20 mM ammonium acetate, pH 5.0 (acetic acid) and methanol, 9/1, v/v. Sheath liquid used in (a) 20 mM ammonium acetate, pH 5.0 and methanol (1/3, v/v). CE separation: (a) voltage of +20 kV set at the CE capillary inlet; (b) voltage of +25 kV and 40 mbar set at the CE capillary inlet. Spraying capillary voltage: (a) +5.0 kV; (b) +1.5 kV.
51
The limitation of the sheathless nanospray technique was that, after several hours of continuous CE/MS operation and several rinsings of the capillary with the electrolyte solution, the conductive coating gradually deteriorated leading to arcing at the capillary tip and reduced spray stability. Thus, although the conductive coating consisted of multiple coating layers, the coated capillaries could not be used for more than one day. Moreover, in some of the capillaries, the coating was rough and did not totally cover the capillary tip. This led to arcing and unstable spray even during tuning of the system with the electrolyte solution. In negative ion mode, strong arcing at the capillary tip was observed in tuning of the instrument with the separation electrolyte solutions (see section 4.3.1). The tuning was done by applying a spraying capillary voltage (tested range of (�) 0.7�1.7 kV) at the capillary tip and a voltage of (+) 10�25 kV at the CE capillary inlet. Application of a low pressure of 40�80 mbar at the CE capillary inlet together with the separation potential was also tested. Electric discharge was observed under all operating conditions and with the water-, methanol-, acetonitrile-, isopropanol-, and chloroform�methanol-based electrolytes (section 4.3.1). Since stable electrospray was not obtained in negative ion mode, the analysis of bisphosphonate compounds could not be realized with the sheathless nanospray CE/ESI-MS. The much stronger arcing observed in negative than in positive ion mode most likely is explained by a lower discharge onset potential in negative ion mode, although the spraying onset potential should be the same in the two modes (Kebarle and Ho 1997). 5.2 Desorption/ionization on silicon mass spectrometry (DIOS-MS) 5.2.1 Properties of porous silicon for DIOS-MS (V) In the next stage of the work, the properties of porous silicon (pSi) chips were optimized for DIOS-MS. The pSi was prepared by electrochemical etching of n-type silicon in HF�ethanol solution (V). Electronic holes, being crucial for electrochemical etching, were created in n-type silicon by illumination of the sample. A novel dual illumination method (V) was used in the front-side patterning of pSi (V: Figure 1). Porous areas were defined with a stencil mask. The significant benefit of this method was that standard photolithography consisting of a number of process steps and surface treatments was not needed. Backside illumination was used for the backside ohmic contact, and it also improved the homogeneity of the porosified areas. By means of droplet evaporation tests and DIOS-MS measurements, the pSi sample area, pore size, and depth were optimized to minimize the droplet spreading and to achieve filling of the pores with the sample, as measured by DIOS-MS efficiency. Round, rectangular, and various star-shaped pSi areas were studied for the DIOS-MS. Optimal shape and size of the pSi were concluded to be a planar, round area 0.5�1 mm in diameter, which provided sample concentration at the center of the pSi without bordering of the sample spot, and thus maximum S/N ratios in the subsequent DIOS-MS analyses. Optimal pore size was measured to be in the range 50�200 nm (Figure 11), a size that facilitated the
52
entry of the sample liquid to the pores as measured by DIOS-MS efficiency. Interestingly, the optimal pore size determined in this study is considerably greater than that obtained in the first DIOS study carried out by Wei et al. (1999) and also somewhat larger than more recently reported by Shen et al. (2001).
100 nm
Figure 11. Scanning electron microscopy picture of the cross-section of porous silicon. To determine whether the pSi surface is crucial for matrix-free laser desorption/ionization (LDI), the pSi surfaces were compared with non-porous silicon and a conventional MALDI steel plate as LDI sample targets (Figure 12). No analyte signal was detected from the non-porous silicon without matrix addition. For the steel plate, the matrix-free LDI detection limit was 30 pmol, which was obtained for midazolam (Figure 12a). Addition of the matrix compound (Ŭ-cyano-4-hydroxy cinnamic acid) significantly strengthened the signal but resulted in heavy background noise, and a S/N ratio of about 50 was obtained for midazolam at 300 pmol level (Figure 12b). In contrast, strong analyte signal with low background noise (S/N about 200 for midazolam at 300 pmol level) was obtained with pSi fabricated under the conditions optimized in this study (Figure 12c). Note that the 150 fmol level was successfully measured for the same analyte with pSi (V: Figure 5). These results support earlier observations about the critical role of the porosity of the Si surface for the UV LDI without matrix addition (Wei et al. 1999, Shen et al. 2001, Thomas et al. 2001). The chemical nature of the pSi surface and the ionization efficiency need to be clarified in order to achieve the best performance of DIOS-MS. In this study, interesting differences among non-modified pSi surfaces stored in air and in ethanol and chemically derivatized pSi surfaces (see section 4.3.4) were observed in terms of the analyte signal efficiency and stability. The S/N ratios were greater with ethanol-stored non-derivatized pSi and with derivatized pSi than with air-stored non-derivatized pSi. Ethanol storage apparently helps to prevent native oxide growth on the pSi, improving the DIOS efficiency by aiding sample confinement inside the pores. The same effect was concluded for the chemically derivatized pSi surfaces. In addition, with ethanol-stored non-derivatized surfaces and with derivatized surfaces, the analyte signal sustained over 200 laser shots on one spot, in comparison with
53
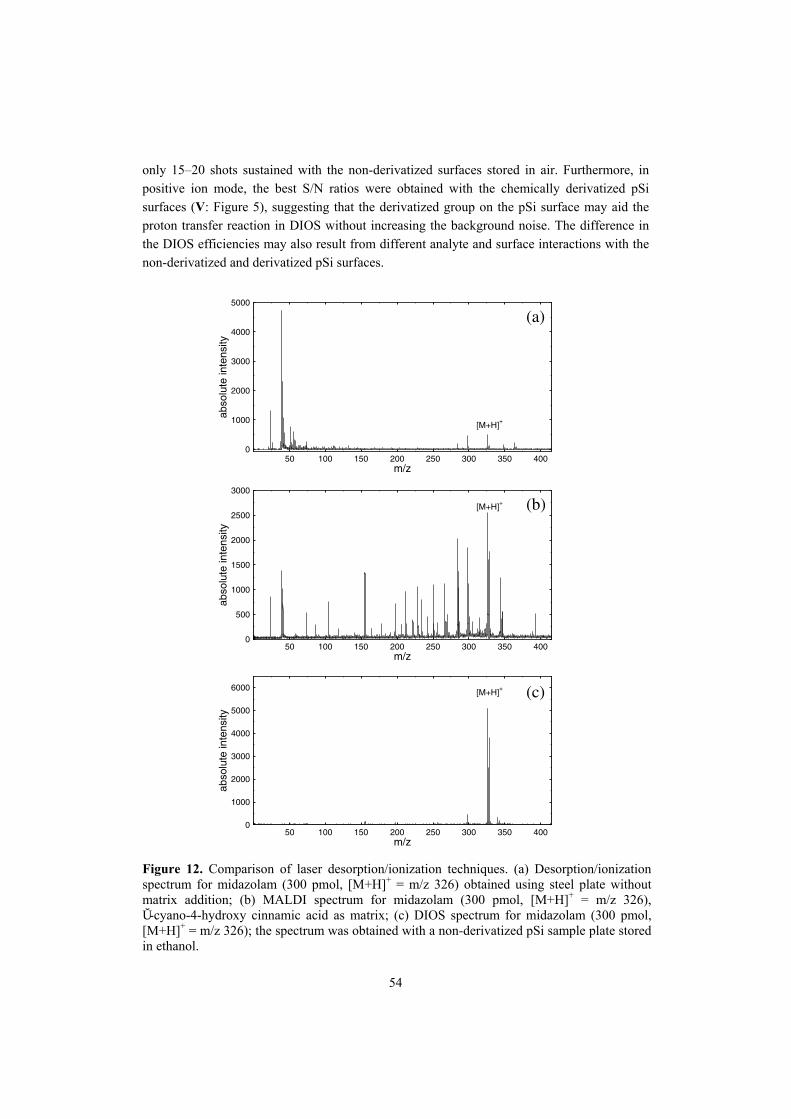
only 15�20 shots sustained with the non-derivatized surfaces stored in air. Furthermore, in positive ion mode, the best S/N ratios were obtained with the chemically derivatized pSi surfaces (V: Figure 5), suggesting that the derivatized group on the pSi surface may aid the proton transfer reaction in DIOS without increasing the background noise. The difference in the DIOS efficiencies may also result from different analyte and surface interactions with the non-derivatized and derivatized pSi surfaces.
50 100 150 200 250 300 350 400m/z
0
1000
2000
3000
4000
5000
6000
abso
lute
inte
nsity
[M+H]+
50 100 150 200 250 300 350 400m/z
0
500
1000
1500
2000
2500
3000
abso
lute
inte
nsity
[M+H]+
50 100 150 200 250 300 350 400m/z
0
1000
2000
3000
4000
5000
abso
lute
inte
nsity
[M+H]+
(c)
(b)
(a)
Figure 12. Comparison of laser desorption/ionization techniques. (a) Desorption/ionization spectrum for midazolam (300 pmol, [M+H]+ = m/z 326) obtained using steel plate without matrix addition; (b) MALDI spectrum for midazolam (300 pmol, [M+H]+ = m/z 326), Ŭ-cyano-4-hydroxy cinnamic acid as matrix; (c) DIOS spectrum for midazolam (300 pmol, [M+H]+ = m/z 326); the spectrum was obtained with a non-derivatized pSi sample plate stored in ethanol.
54
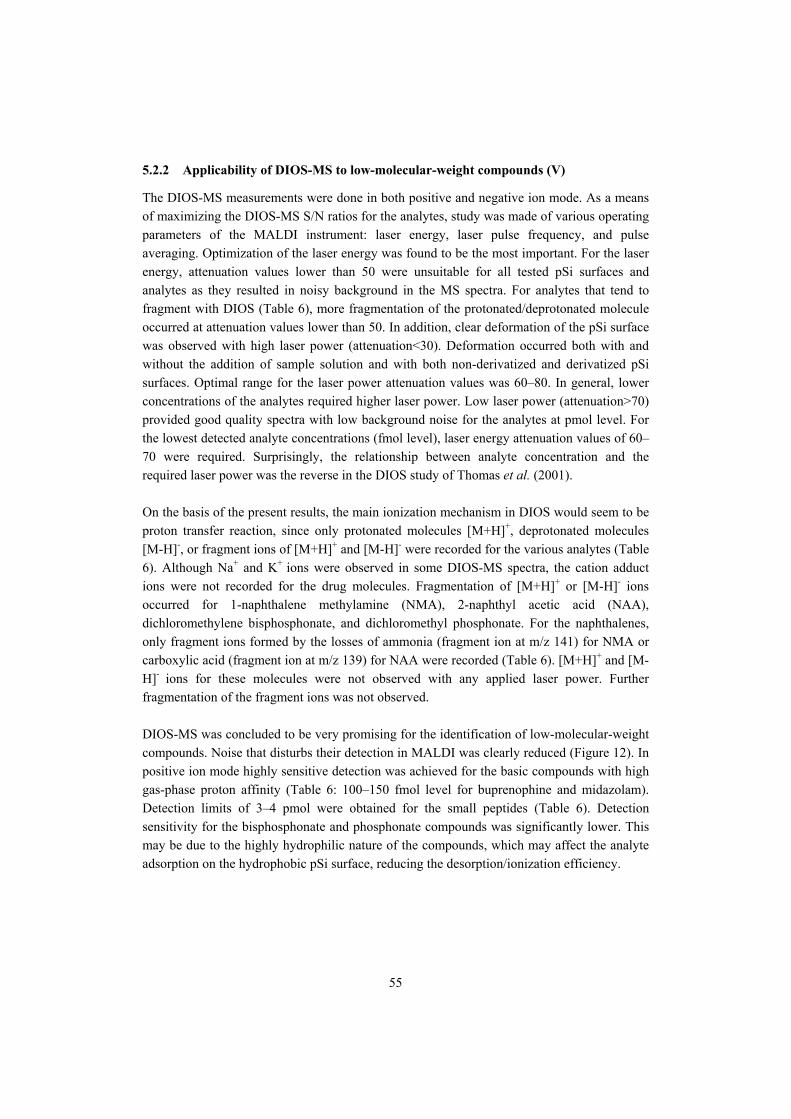
5.2.2 Applicability of DIOS-MS to low-molecular-weight compounds (V) The DIOS-MS measurements were done in both positive and negative ion mode. As a means of maximizing the DIOS-MS S/N ratios for the analytes, study was made of various operating parameters of the MALDI instrument: laser energy, laser pulse frequency, and pulse averaging. Optimization of the laser energy was found to be the most important. For the laser energy, attenuation values lower than 50 were unsuitable for all tested pSi surfaces and analytes as they resulted in noisy background in the MS spectra. For analytes that tend to fragment with DIOS (Table 6), more fragmentation of the protonated/deprotonated molecule occurred at attenuation values lower than 50. In addition, clear deformation of the pSi surface was observed with high laser power (attenuation<30). Deformation occurred both with and without the addition of sample solution and with both non-derivatized and derivatized pSi surfaces. Optimal range for the laser power attenuation values was 60�80. In general, lower concentrations of the analytes required higher laser power. Low laser power (attenuation>70) provided good quality spectra with low background noise for the analytes at pmol level. For the lowest detected analyte concentrations (fmol level), laser energy attenuation values of 60�70 were required. Surprisingly, the relationship between analyte concentration and the required laser power was the reverse in the DIOS study of Thomas et al. (2001). On the basis of the present results, the main ionization mechanism in DIOS would seem to be proton transfer reaction, since only protonated molecules [M+H]+, deprotonated molecules [M-H]-, or fragment ions of [M+H]+ and [M-H]- were recorded for the various analytes (Table 6). Although Na+ and K+ ions were observed in some DIOS-MS spectra, the cation adduct ions were not recorded for the drug molecules. Fragmentation of [M+H]+ or [M-H]- ions occurred for 1-naphthalene methylamine (NMA), 2-naphthyl acetic acid (NAA), dichloromethylene bisphosphonate, and dichloromethyl phosphonate. For the naphthalenes, only fragment ions formed by the losses of ammonia (fragment ion at m/z 141) for NMA or carboxylic acid (fragment ion at m/z 139) for NAA were recorded (Table 6). [M+H]+ and [M-H]- ions for these molecules were not observed with any applied laser power. Further fragmentation of the fragment ions was not observed. DIOS-MS was concluded to be very promising for the identification of low-molecular-weight compounds. Noise that disturbs their detection in MALDI was clearly reduced (Figure 12). In positive ion mode highly sensitive detection was achieved for the basic compounds with high gas-phase proton affinity (Table 6: 100�150 fmol level for buprenophine and midazolam). Detection limits of 3�4 pmol were obtained for the small peptides (Table 6). Detection sensitivity for the bisphosphonate and phosphonate compounds was significantly lower. This may be due to the highly hydrophilic nature of the compounds, which may affect the analyte adsorption on the hydrophobic pSi surface, reducing the desorption/ionization efficiency.
55
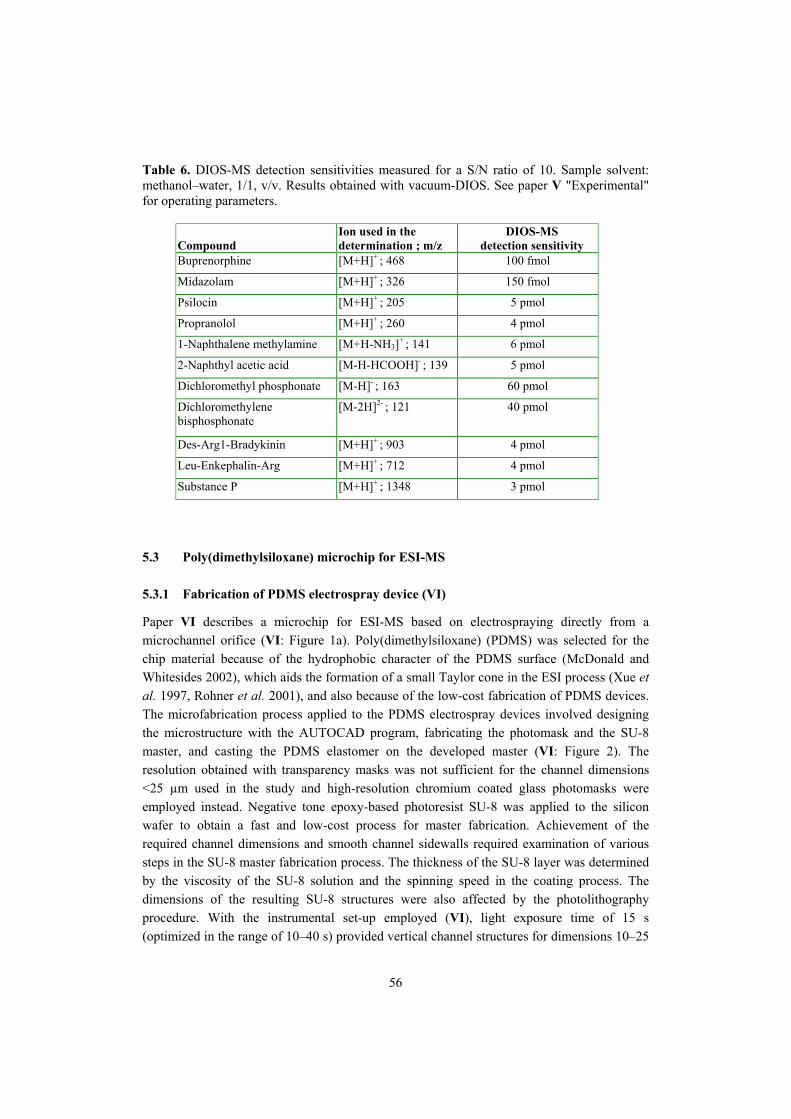
Table 6. DIOS-MS detection sensitivities measured for a S/N ratio of 10. Sample solvent: methanol�water, 1/1, v/v. Results obtained with vacuum-DIOS. See paper V "Experimental" for operating parameters.
Compound
Ion used in the determination ; m/z
DIOS-MS detection sensitivity
Buprenorphine [M+H]+ ; 468 100 fmol
Midazolam [M+H]+ ; 326 150 fmol
Psilocin [M+H]+ ; 205 5 pmol
Propranolol [M+H]+ ; 260 4 pmol
1-Naphthalene methylamine [M+H-NH3]+ ; 141 6 pmol
2-Naphthyl acetic acid [M-H-HCOOH]- ; 139 5 pmol
Dichloromethyl phosphonate [M-H]- ; 163 60 pmol
Dichloromethylene bisphosphonate
[M-2H]2- ; 121 40 pmol
Des-Arg1-Bradykinin [M+H]+ ; 903 4 pmol
Leu-Enkephalin-Arg [M+H]+ ; 712 4 pmol
Substance P [M+H]+ ; 1348 3 pmol
5.3 Poly(dimethylsiloxane) microchip for ESI-MS 5.3.1 Fabrication of PDMS electrospray device (VI) Paper VI describes a microchip for ESI-MS based on electrospraying directly from a microchannel orifice (VI: Figure 1a). Poly(dimethylsiloxane) (PDMS) was selected for the chip material because of the hydrophobic character of the PDMS surface (McDonald and Whitesides 2002), which aids the formation of a small Taylor cone in the ESI process (Xue et al. 1997, Rohner et al. 2001), and also because of the low-cost fabrication of PDMS devices. The microfabrication process applied to the PDMS electrospray devices involved designing the microstructure with the AUTOCAD program, fabricating the photomask and the SU-8 master, and casting the PDMS elastomer on the developed master (VI: Figure 2). The resolution obtained with transparency masks was not sufficient for the channel dimensions <25 µm used in the study and high-resolution chromium coated glass photomasks were employed instead. Negative tone epoxy-based photoresist SU-8 was applied to the silicon wafer to obtain a fast and low-cost process for master fabrication. Achievement of the required channel dimensions and smooth channel sidewalls required examination of various steps in the SU-8 master fabrication process. The thickness of the SU-8 layer was determined by the viscosity of the SU-8 solution and the spinning speed in the coating process. The dimensions of the resulting SU-8 structures were also affected by the photolithography procedure. With the instrumental set-up employed (VI), light exposure time of 15 s (optimized in the range of 10�40 s) provided vertical channel structures for dimensions 10�25
56
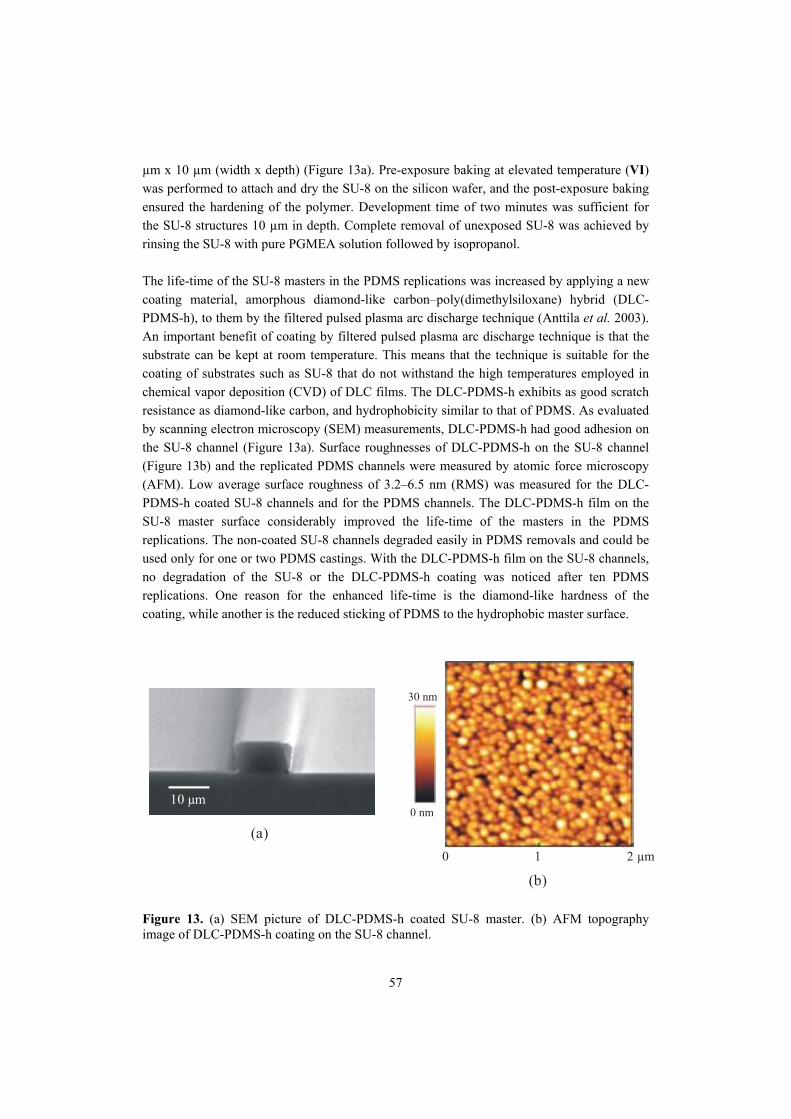
µm x 10 µm (width x depth) (Figure 13a). Pre-exposure baking at elevated temperature (VI) was performed to attach and dry the SU-8 on the silicon wafer, and the post-exposure baking ensured the hardening of the polymer. Development time of two minutes was sufficient for the SU-8 structures 10 µm in depth. Complete removal of unexposed SU-8 was achieved by rinsing the SU-8 with pure PGMEA solution followed by isopropanol. The life-time of the SU-8 masters in the PDMS replications was increased by applying a new coating material, amorphous diamond-like carbon�poly(dimethylsiloxane) hybrid (DLC-PDMS-h), to them by the filtered pulsed plasma arc discharge technique (Anttila et al. 2003). An important benefit of coating by filtered pulsed plasma arc discharge technique is that the substrate can be kept at room temperature. This means that the technique is suitable for the coating of substrates such as SU-8 that do not withstand the high temperatures employed in chemical vapor deposition (CVD) of DLC films. The DLC-PDMS-h exhibits as good scratch resistance as diamond-like carbon, and hydrophobicity similar to that of PDMS. As evaluated by scanning electron microscopy (SEM) measurements, DLC-PDMS-h had good adhesion on the SU-8 channel (Figure 13a). Surface roughnesses of DLC-PDMS-h on the SU-8 channel (Figure 13b) and the replicated PDMS channels were measured by atomic force microscopy (AFM). Low average surface roughness of 3.2�6.5 nm (RMS) was measured for the DLC-PDMS-h coated SU-8 channels and for the PDMS channels. The DLC-PDMS-h film on the SU-8 master surface considerably improved the life-time of the masters in the PDMS replications. The non-coated SU-8 channels degraded easily in PDMS removals and could be used only for one or two PDMS castings. With the DLC-PDMS-h film on the SU-8 channels, no degradation of the SU-8 or the DLC-PDMS-h coating was noticed after ten PDMS replications. One reason for the enhanced life-time is the diamond-like hardness of the coating, while another is the reduced sticking of PDMS to the hydrophobic master surface.
0 1
0 nm
2 µm
30 nm
10 µm
(a)
(b) Figure 13. (a) SEM picture of DLC-PDMS-h coated SU-8 master. (b) AFM topography image of DLC-PDMS-h coating on the SU-8 channel.
57
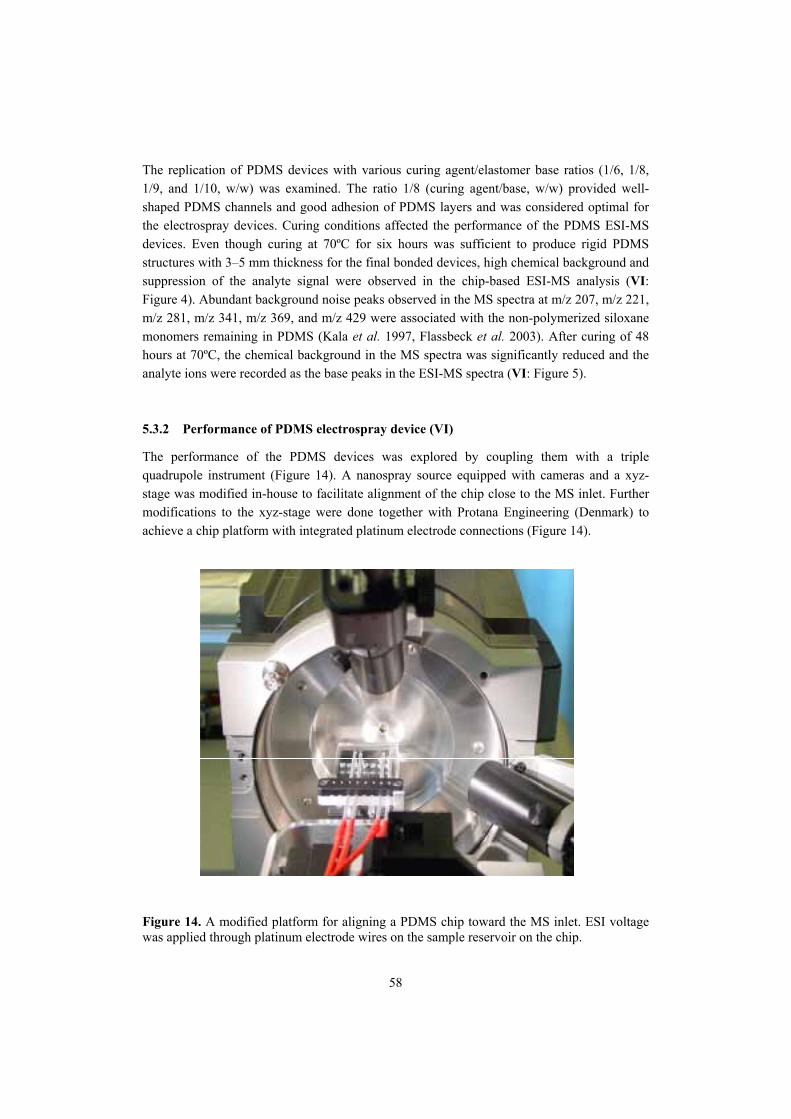
The replication of PDMS devices with various curing agent/elastomer base ratios (1/6, 1/8, 1/9, and 1/10, w/w) was examined. The ratio 1/8 (curing agent/base, w/w) provided well-shaped PDMS channels and good adhesion of PDMS layers and was considered optimal for the electrospray devices. Curing conditions affected the performance of the PDMS ESI-MS devices. Even though curing at 70ºC for six hours was sufficient to produce rigid PDMS structures with 3�5 mm thickness for the final bonded devices, high chemical background and suppression of the analyte signal were observed in the chip-based ESI-MS analysis (VI: Figure 4). Abundant background noise peaks observed in the MS spectra at m/z 207, m/z 221, m/z 281, m/z 341, m/z 369, and m/z 429 were associated with the non-polymerized siloxane monomers remaining in PDMS (Kala et al. 1997, Flassbeck et al. 2003). After curing of 48 hours at 70ºC, the chemical background in the MS spectra was significantly reduced and the analyte ions were recorded as the base peaks in the ESI-MS spectra (VI: Figure 5). 5.3.2 Performance of PDMS electrospray device (VI) The performance of the PDMS devices was explored by coupling them with a triple quadrupole instrument (Figure 14). A nanospray source equipped with cameras and a xyz-stage was modified in-house to facilitate alignment of the chip close to the MS inlet. Further modifications to the xyz-stage were done together with Protana Engineering (Denmark) to achieve a chip platform with integrated platinum electrode connections (Figure 14).
Figure 14. A modified platform for aligning a PDMS chip toward the MS inlet. ESI voltage was applied through platinum electrode wires on the sample reservoir on the chip.
58
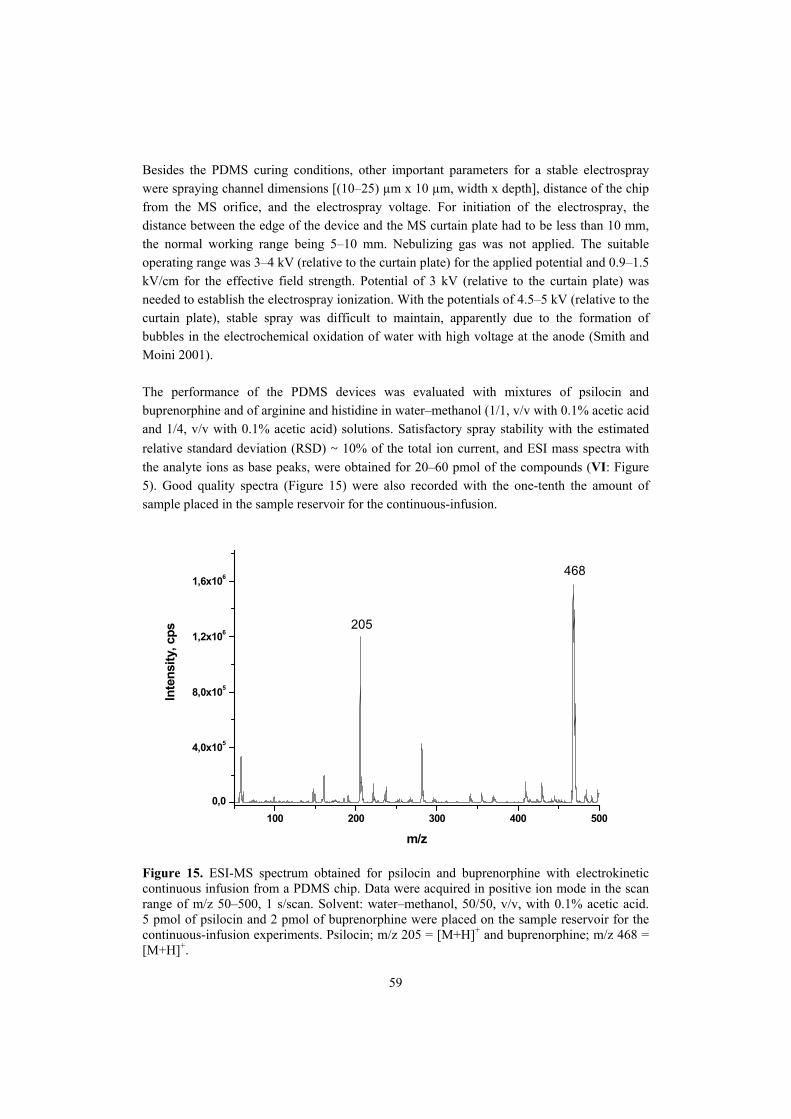
Besides the PDMS curing conditions, other important parameters for a stable electrospray were spraying channel dimensions [(10�25) µm x 10 µm, width x depth], distance of the chip from the MS orifice, and the electrospray voltage. For initiation of the electrospray, the distance between the edge of the device and the MS curtain plate had to be less than 10 mm, the normal working range being 5�10 mm. Nebulizing gas was not applied. The suitable operating range was 3�4 kV (relative to the curtain plate) for the applied potential and 0.9�1.5 kV/cm for the effective field strength. Potential of 3 kV (relative to the curtain plate) was needed to establish the electrospray ionization. With the potentials of 4.5�5 kV (relative to the curtain plate), stable spray was difficult to maintain, apparently due to the formation of bubbles in the electrochemical oxidation of water with high voltage at the anode (Smith and Moini 2001). The performance of the PDMS devices was evaluated with mixtures of psilocin and buprenorphine and of arginine and histidine in water�methanol (1/1, v/v with 0.1% acetic acid and 1/4, v/v with 0.1% acetic acid) solutions. Satisfactory spray stability with the estimated relative standard deviation (RSD) ~ 10% of the total ion current, and ESI mass spectra with the analyte ions as base peaks, were obtained for 20�60 pmol of the compounds (VI: Figure 5). Good quality spectra (Figure 15) were also recorded with the one-tenth the amount of sample placed in the sample reservoir for the continuous-infusion.
100 200 300 400 5000,0
4,0x10⁵
8,0x10⁵
1,2x10⁶
1,6x10⁶ 468
205
Inte
nsity
, cps
m/z
Figure 15. ESI-MS spectrum obtained for psilocin and buprenorphine with electrokinetic continuous infusion from a PDMS chip. Data were acquired in positive ion mode in the scan range of m/z 50�500, 1 s/scan. Solvent: water�methanol, 50/50, v/v, with 0.1% acetic acid. 5 pmol of psilocin and 2 pmol of buprenorphine were placed on the sample reservoir for the continuous-infusion experiments. Psilocin; m/z 205 = [M+H]+ and buprenorphine; m/z 468 = [M+H]+.
59
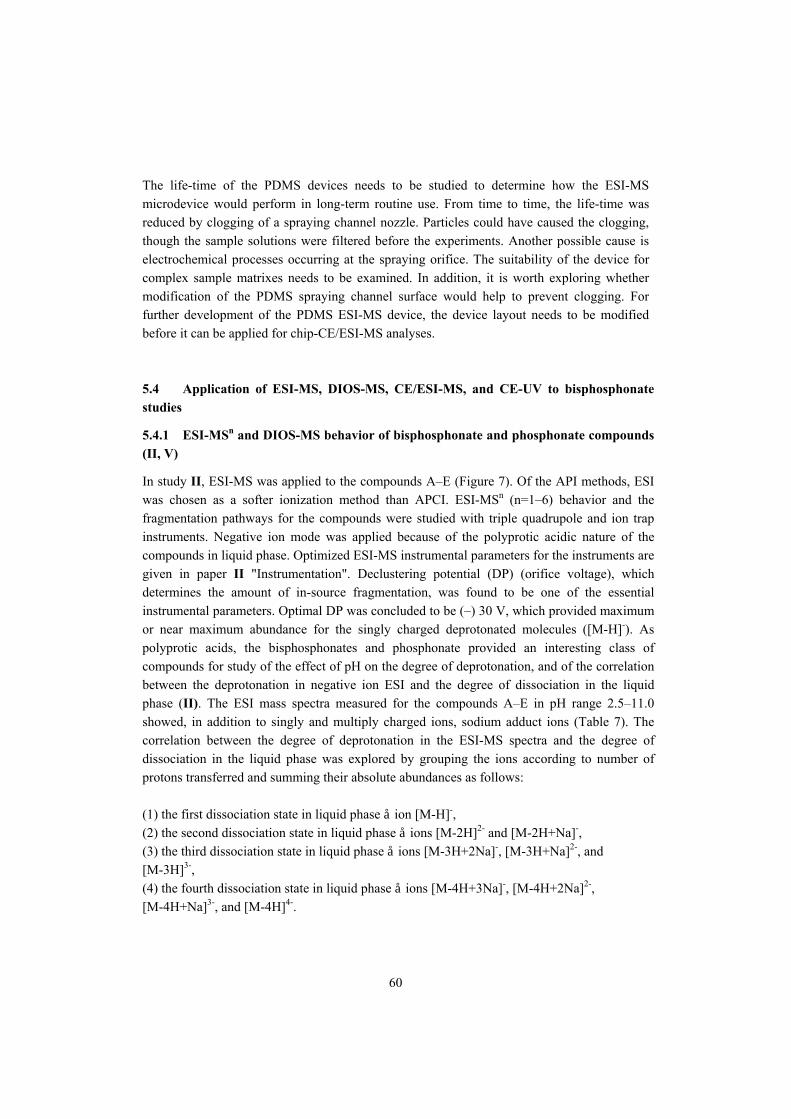
The life-time of the PDMS devices needs to be studied to determine how the ESI-MS microdevice would perform in long-term routine use. From time to time, the life-time was reduced by clogging of a spraying channel nozzle. Particles could have caused the clogging, though the sample solutions were filtered before the experiments. Another possible cause is electrochemical processes occurring at the spraying orifice. The suitability of the device for complex sample matrixes needs to be examined. In addition, it is worth exploring whether modification of the PDMS spraying channel surface would help to prevent clogging. For further development of the PDMS ESI-MS device, the device layout needs to be modified before it can be applied for chip-CE/ESI-MS analyses. 5.4 Application of ESI-MS, DIOS-MS, CE/ESI-MS, and CE-UV to bisphosphonate studies
5.4.1 ESI-MSn and DIOS-MS behavior of bisphosphonate and phosphonate compounds (II, V) In study II, ESI-MS was applied to the compounds A�E (Figure 7). Of the API methods, ESI was chosen as a softer ionization method than APCI. ESI-MSn (n=1�6) behavior and the fragmentation pathways for the compounds were studied with triple quadrupole and ion trap instruments. Negative ion mode was applied because of the polyprotic acidic nature of the compounds in liquid phase. Optimized ESI-MS instrumental parameters for the instruments are given in paper II "Instrumentation". Declustering potential (DP) (orifice voltage), which determines the amount of in-source fragmentation, was found to be one of the essential instrumental parameters. Optimal DP was concluded to be (�) 30 V, which provided maximum or near maximum abundance for the singly charged deprotonated molecules ([M-H]-). As polyprotic acids, the bisphosphonates and phosphonate provided an interesting class of compounds for study of the effect of pH on the degree of deprotonation, and of the correlation between the deprotonation in negative ion ESI and the degree of dissociation in the liquid phase (II). The ESI mass spectra measured for the compounds A�E in pH range 2.5�11.0 showed, in addition to singly and multiply charged ions, sodium adduct ions (Table 7). The correlation between the degree of deprotonation in the ESI-MS spectra and the degree of dissociation in the liquid phase was explored by grouping the ions according to number of protons transferred and summing their absolute abundances as follows: (1) the first dissociation state in liquid phase å ion [M-H]-, (2) the second dissociation state in liquid phase å ions [M-2H]2- and [M-2H+Na]-, (3) the third dissociation state in liquid phase å ions [M-3H+2Na]-, [M-3H+Na]2-, and [M-3H]3-, (4) the fourth dissociation state in liquid phase å ions [M-4H+3Na]-, [M-4H+2Na]2-, [M-4H+Na]3-, and [M-4H]4-.
60
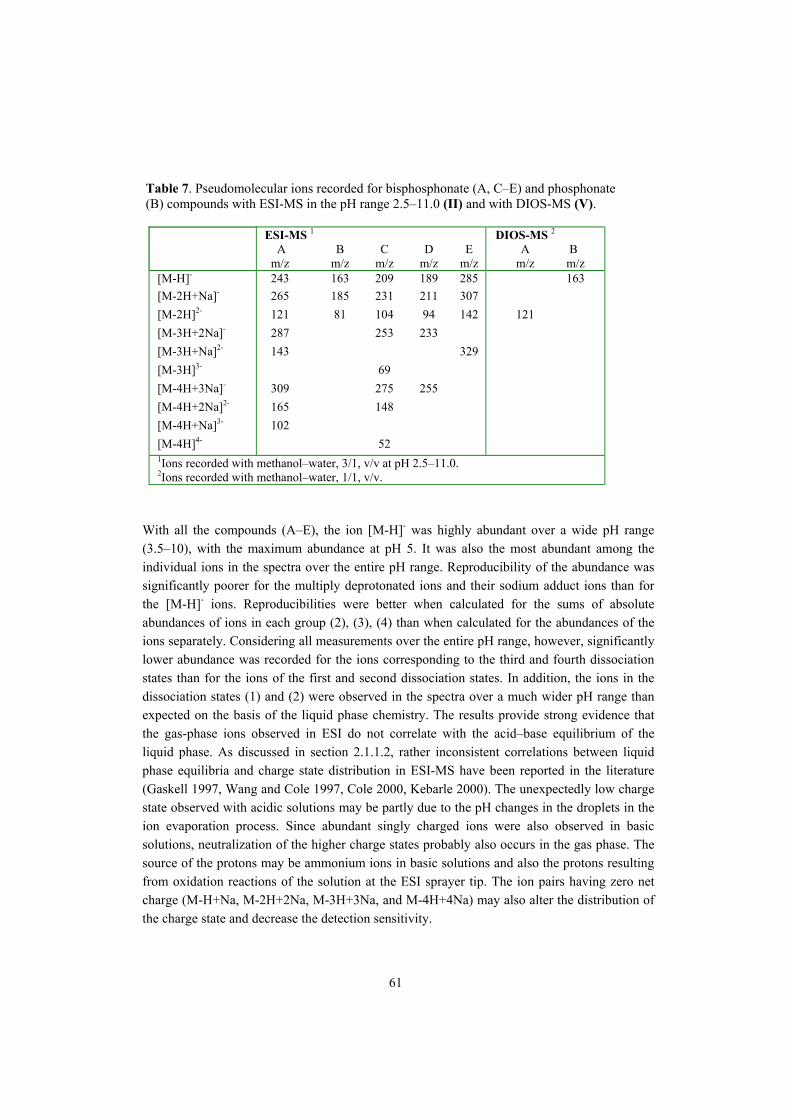
Table 7. Pseudomolecular ions recorded for bisphosphonate (A, C�E) and phosphonate (B) compounds with ESI-MS in the pH range 2.5�11.0 (II) and with DIOS-MS (V).
ESI-MS 1
A m/z
B
m/z
C
m/z
D
m/z
E
m/z
DIOS-MS 2 A
m/z
B m/z
[M-H]- 243 163 209 189 285 163 [M-2H+Na]- 265 185 231 211 307 [M-2H]2- 121 81 104 94 142 121 [M-3H+2Na]- 287 253 233 [M-3H+Na]2- 143 329 [M-3H]3- 69 [M-4H+3Na]- 309 275 255 [M-4H+2Na]2- 165 148 [M-4H+Na]3- 102 [M-4H]4- 52 1Ions recorded with methanol�water, 3/1, v/v at pH 2.5�11.0. 2Ions recorded with methanol�water, 1/1, v/v.
With all the compounds (A�E), the ion [M-H]- was highly abundant over a wide pH range (3.5�10), with the maximum abundance at pH 5. It was also the most abundant among the individual ions in the spectra over the entire pH range. Reproducibility of the abundance was significantly poorer for the multiply deprotonated ions and their sodium adduct ions than for the [M-H]- ions. Reproducibilities were better when calculated for the sums of absolute abundances of ions in each group (2), (3), (4) than when calculated for the abundances of the ions separately. Considering all measurements over the entire pH range, however, significantly lower abundance was recorded for the ions corresponding to the third and fourth dissociation states than for the ions of the first and second dissociation states. In addition, the ions in the dissociation states (1) and (2) were observed in the spectra over a much wider pH range than expected on the basis of the liquid phase chemistry. The results provide strong evidence that the gas-phase ions observed in ESI do not correlate with the acid�base equilibrium of the liquid phase. As discussed in section 2.1.1.2, rather inconsistent correlations between liquid phase equilibria and charge state distribution in ESI-MS have been reported in the literature (Gaskell 1997, Wang and Cole 1997, Cole 2000, Kebarle 2000). The unexpectedly low charge state observed with acidic solutions may be partly due to the pH changes in the droplets in the ion evaporation process. Since abundant singly charged ions were also observed in basic solutions, neutralization of the higher charge states probably also occurs in the gas phase. The source of the protons may be ammonium ions in basic solutions and also the protons resulting from oxidation reactions of the solution at the ESI sprayer tip. The ion pairs having zero net charge (M-H+Na, M-2H+2Na, M-3H+3Na, and M-4H+4Na) may also alter the distribution of the charge state and decrease the detection sensitivity.
61
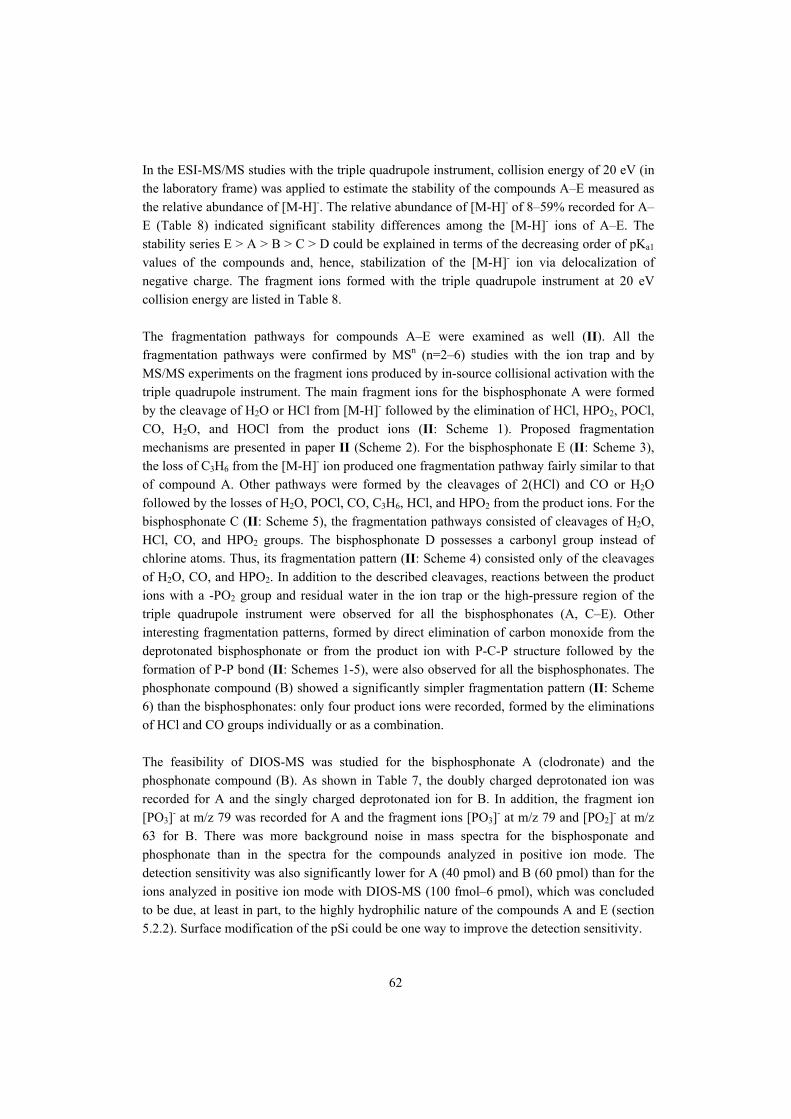
In the ESI-MS/MS studies with the triple quadrupole instrument, collision energy of 20 eV (in the laboratory frame) was applied to estimate the stability of the compounds A�E measured as the relative abundance of [M-H]-. The relative abundance of [M-H]- of 8�59% recorded for A�E (Table 8) indicated significant stability differences among the [M-H]- ions of A�E. The stability series E > A > B > C > D could be explained in terms of the decreasing order of pKa1 values of the compounds and, hence, stabilization of the [M-H]- ion via delocalization of negative charge. The fragment ions formed with the triple quadrupole instrument at 20 eV collision energy are listed in Table 8. The fragmentation pathways for compounds A�E were examined as well (II). All the fragmentation pathways were confirmed by MSn (n=2�6) studies with the ion trap and by MS/MS experiments on the fragment ions produced by in-source collisional activation with the triple quadrupole instrument. The main fragment ions for the bisphosphonate A were formed by the cleavage of H2O or HCl from [M-H]- followed by the elimination of HCl, HPO2, POCl, CO, H2O, and HOCl from the product ions (II: Scheme 1). Proposed fragmentation mechanisms are presented in paper II (Scheme 2). For the bisphosphonate E (II: Scheme 3), the loss of C3H6 from the [M-H]- ion produced one fragmentation pathway fairly similar to that of compound A. Other pathways were formed by the cleavages of 2(HCl) and CO or H2O followed by the losses of H2O, POCl, CO, C3H6, HCl, and HPO2 from the product ions. For the bisphosphonate C (II: Scheme 5), the fragmentation pathways consisted of cleavages of H2O, HCl, CO, and HPO2 groups. The bisphosphonate D possesses a carbonyl group instead of chlorine atoms. Thus, its fragmentation pattern (II: Scheme 4) consisted only of the cleavages of H2O, CO, and HPO2. In addition to the described cleavages, reactions between the product ions with a -PO2 group and residual water in the ion trap or the high-pressure region of the triple quadrupole instrument were observed for all the bisphosphonates (A, C�E). Other interesting fragmentation patterns, formed by direct elimination of carbon monoxide from the deprotonated bisphosphonate or from the product ion with P-C-P structure followed by the formation of P-P bond (II: Schemes 1-5), were also observed for all the bisphosphonates. The phosphonate compound (B) showed a significantly simpler fragmentation pattern (II: Scheme 6) than the bisphosphonates: only four product ions were recorded, formed by the eliminations of HCl and CO groups individually or as a combination. The feasibility of DIOS-MS was studied for the bisphosphonate A (clodronate) and the phosphonate compound (B). As shown in Table 7, the doubly charged deprotonated ion was recorded for A and the singly charged deprotonated ion for B. In addition, the fragment ion [PO3]- at m/z 79 was recorded for A and the fragment ions [PO3]- at m/z 79 and [PO2]- at m/z 63 for B. There was more background noise in mass spectra for the bisphosponate and phosphonate than in the spectra for the compounds analyzed in positive ion mode. The detection sensitivity was also significantly lower for A (40 pmol) and B (60 pmol) than for the ions analyzed in positive ion mode with DIOS-MS (100 fmol�6 pmol), which was concluded to be due, at least in part, to the highly hydrophilic nature of the compounds A and E (section 5.2.2). Surface modification of the pSi could be one way to improve the detection sensitivity.
62
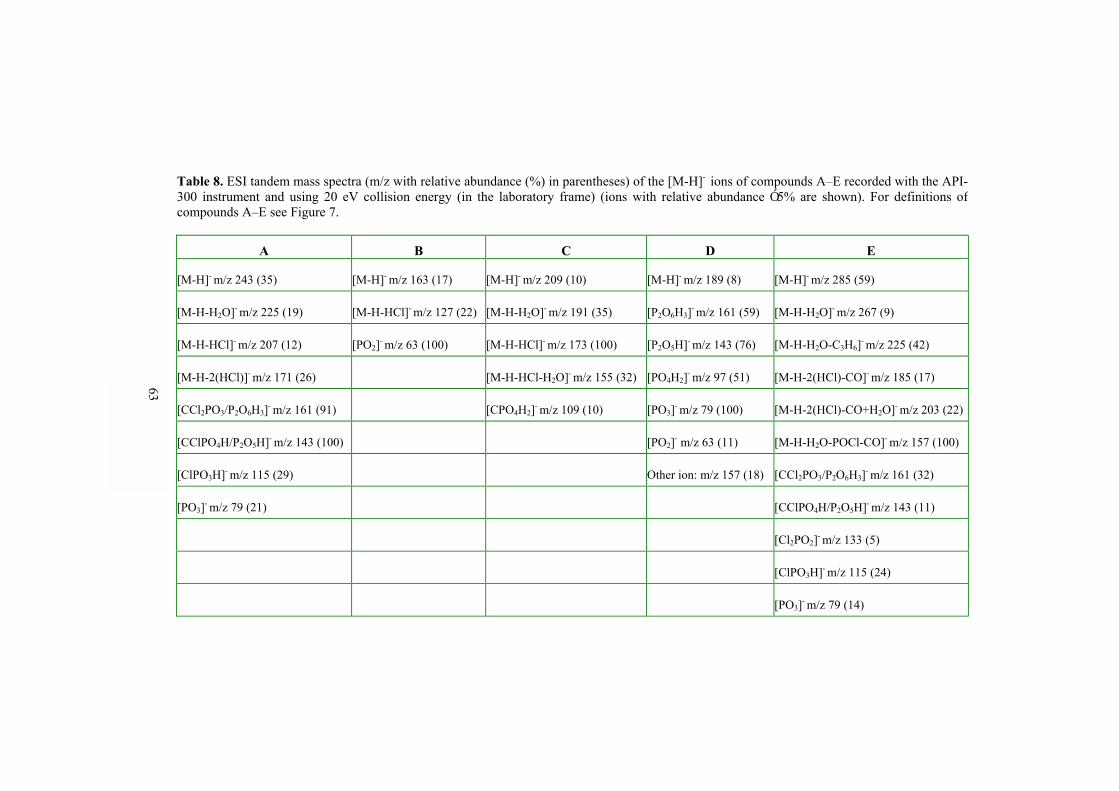
Table 8. ESI tandem mass spectra (m/z with relative abundance (%) in parentheses) of the [M-H]- ions of compounds A�E recorded with the API-300 instrument and using 20 eV collision energy (in the laboratory frame) (ions with relative abundance Ó5% are shown). For definitions of compounds A�E see Figure 7.
A B C D E
[M-H]- m/z 243 (35) [M-H]- m/z 163 (17) [M-H]- m/z 209 (10) [M-H]- m/z 189 (8) [M-H]- m/z 285 (59)
[M-H-H2O]- m/z 225 (19) [M-H-HCl]- m/z 127 (22) [M-H-H2O]- m/z 191 (35) [P2O6H3]- m/z 161 (59) [M-H-H2O]- m/z 267 (9)
[M-H-HCl]- m/z 207 (12) [PO2]- m/z 63 (100) [M-H-HCl]- m/z 173 (100) [P2O5H]- m/z 143 (76) [M-H-H2O-C3H6]- m/z 225 (42)
[M-H-2(HCl)]- m/z 171 (26) [M-H-HCl-H2O]- m/z 155 (32) [PO4H2]- m/z 97 (51) [M-H-2(HCl)-CO]- m/z 185 (17)
[CCl2PO3/P2O6H3]- m/z 161 (91) [CPO4H2]- m/z 109 (10) [PO3]- m/z 79 (100) [M-H-2(HCl)-CO+H2O]- m/z 203 (22)
[CClPO4H/P2O5H]- m/z 143 (100) [PO2]- m/z 63 (11) [M-H-H2O-POCl-CO]- m/z 157 (100)
[ClPO3H]- m/z 115 (29) Other ion: m/z 157 (18) [CCl2PO3/P2O6H3]- m/z 161 (32)
[PO3]- m/z 79 (21) [CClPO4H/P2O5H]- m/z 143 (11)
[Cl2PO2]- m/z 133 (5)
[ClPO3H]- m/z 115 (24)
[PO3]- m/z 79 (14)
63
5.4.2 Analysis of bisphosphonate and phosphonate compounds by CE/ESI-MS and CE-UV (III, IV) CE methods were developed for quantitative analysis of clodronate and its bisphosphonate and phosphonate impurity compounds, utilizing both ESI-MS (III) and UV detection (IV). CE/ESI-MS method with coaxial sheath liquid coupling and negative ion mode was developed for bisphosphonates and phosphonate compounds (A�E) (Figure 7). The most important parameters optimized in the method development were the operating parameters of the CE and mass spectrometer and the compositions of the sheath liquid and CE electrolyte solutions. From the ions recorded for A�E in the ESI mass spectra in the pH range 2.5�11.0 (Table 7), the [M-H]- ions were chosen for the selected ion monitoring (SIM) owing to their high abundance and also because they are observed in higher m/z region, where the chemical noise is reduced. Sodium adduct ions were not chosen because the reproducibility of the abundance of multiply charged ions and their sodium adduct ions was lower than the reproducibility of the abundance of the [M-H]- ions. The most important MS parameter, the declustering potential (optimized in the range (�) 10�150 V), provided the maximum or nearly maximum abundance of the [M-H]- ions of the compounds when set at (�) 30 V. The value of pH 5.0 was employed in the sheath liquid (20 mM ammonium acetate in water�methanol, 1/3, v/v, pH 5) as providing the maximum abundance of [M-H]- ions for all compounds studied (III: Figure 2).
For the CE separation of the negatively charged compounds A�E, neutral-coated capillaries (e-Cap capillary with polyacrylamide coating) and CE in reversed polarity were studied. Stable CE/ESI-MS was not achieved, however, even though pressure-assisted flow (40�80 mbar) was applied together with the electrolyte (20 mM ammonium acetate, pH 7�7.5) and separation potential. In addition, the phosphate electrolyte used in the CE-UV method (IV) was tested with the orthogonal ESI sprayer with the ion trap and with the sheath liquid composition described above. Despite the reported suitability (Ingendoh et al. 1999) of the orthogonal ion source set-up for non-volatile buffers in sheath-liquid CE/ESI-MS, suppression of the analyte signal and non-stable ion current were observed. Better results were obtained with the CE separation in cathodal EOF [(+) =>(�)] with standard fused-silica CE capillaries employed with the sheath liquid interface and the triple quadrupole instrument (III). Volatile electrolytes of acetic acid and of ammonium acetate and ammonium hydroxide were assessed. No separation of the compounds was obtained with acetic acid as electrolyte at pH 5 or lower. In ammonium acetate-based electrolytes in pH range 6.9�10 (III: Figure 4), compound E with the largest radius migrated first. Compound B is the smallest in radius, but as a phosphonate it has a lower degree of dissociation than the bisphosphonates and it migrated in second place. At pH 6.9 compounds A and C and at pH 10 the last migrating compounds C and D were not separated from each other. The pH 8.0 (ammonium acetate adjusted to pH 8 with ammonium hydroxide) provided the best resolution for all of the adjacent compounds A-E (III: Figure 4) and this was selected for the method. As well, the effect of ionic strength of the electrolyte (20�30 mM ammonium acetate) on the CE separation was studied (III: Figure 5). Shorter migration times were observed with increased ionic
64
strength. Both EOF and the electrophoretic mobility of the ions were expected to decrease with the increased ionic strength, but the electrophoretic mobility of the compounds apparently decreased more than the EOF. However, satisfactory resolution between all the compounds was achieved only with 20 mM ammonium acetate (pH 8.0). Moreover, adequate separation of compounds A�E was achieved with a hydrodynamic injection of samples diluted in water with the injection time of 6 s or shorter with 3.45 kPa. Thus, sample loading could not be increased through large-volume hydrodynamic injection as a means of improving the detection sensitivity of the CE/ESI-MS method. Direct and indirect UV detection techniques were compared in the development of the CE-UV method for the determination of bisphosphonate and phosphonate impurities (B�E) in clodronate (A) bulk materials (IV). Direct UV detection was concluded to be more suitable for clodronate drug purity analysis in face of the large baseline drifts and co-migration of compounds observed with the various electrolyte systems applied with indirect UV detection. Moreover, the dynamic range of the indirect UV method was too low for the purity analysis. With the direct UV detection at low wavelength (200 nm) and the reversed polarity employed for anionic analytes, comparison was made of two neutral capillaries (LPA and e-Cap) coated with polyacrylamide. The e-Cap capillary provided slightly better resolution for the compounds. Neutralization of the capillary surface minimized the EOF, so that the total velocities of the analytes were almost solely affected by their electroosmotic mobilities. Because of the polyprotic acidic nature of the analytes, their electrophoretic mobility was strongly affected by pH. The usable pH range for the e-Cap capillary was pH 4�8, limited by the stability of the coating. Resolution obtained in the pH range 7.30�7.60 was sufficient for all the compounds (IV: Figure 3). pH 7.40 was selected for the final method since it provided good resolution for the most closely migrating compounds, clodronate (A) and the bisphosphonate impurity (C). The ionic strength of the phosphate electrolyte was optimized in the range of 20�50 mM (IV: Figure 4). With increasing ionic strength in the range of 20�40 mM, resolution slightly improved for the compounds A and C. At the same time the sensitivity increased considerably, probably owing to the sample stacking effect for analytes introduced in water. Since no notable effect on resolution was observed with 50 mM ionic strength, and, unexpectedly, some loss of sensitivity occurred, 40 mM was selected for the method. Hydrodynamic (3.45 kPa for 4�40 s) and electrokinetic sample injection (�5 kV and �10 kV for 4�20 s) were compared in the method development. Sufficient sensitivity and the dynamic range for the purity method were only achieved with the electrokinetic injection. Injection for 8 s with (�) 5 kV was optimal providing good resolution, signal response, and repeatability for the method.
65
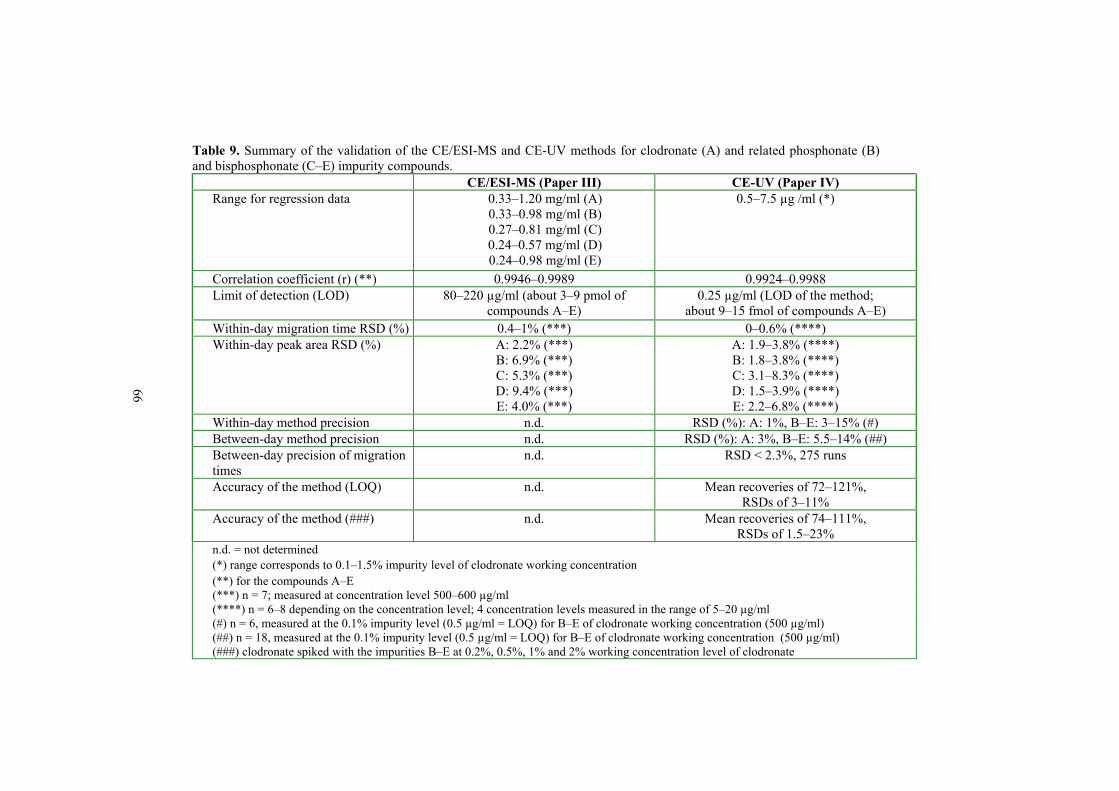
Table 9. Summary of the validation of the CE/ESI-MS and CE-UV methods for clodronate (A) and related phosphonate (B) and bisphosphonate (C�E) impurity compounds.
CE/ESI-MS (Paper III) CE-UV (Paper IV) Range for regression data 0.33�1.20 mg/ml (A)
0.33�0.98 mg/ml (B) 0.27�0.81 mg/ml (C) 0.24�0.57 mg/ml (D) 0.24�0.98 mg/ml (E)
0.5�7.5 µg /ml (*)
Correlation coefficient (r) (**) 0.9946�0.9989 0.9924�0.9988 Limit of detection (LOD) 80�220 µg/ml (about 3�9 pmol of
compounds A�E) 0.25 µg/ml (LOD of the method;
about 9�15 fmol of compounds A�E) Within-day migration time RSD (%) 0.4�1% (***) 0�0.6% (****) Within-day peak area RSD (%) A: 2.2% (***)
B: 6.9% (***) C: 5.3% (***) D: 9.4% (***) E: 4.0% (***)
A: 1.9�3.8% (****) B: 1.8�3.8% (****) C: 3.1�8.3% (****) D: 1.5�3.9% (****) E: 2.2�6.8% (****)
Within-day method precision n.d. RSD (%): A: 1%, B�E: 3�15% (#) Between-day method precision n.d. RSD (%): A: 3%, B�E: 5.5�14% (##) Between-day precision of migration times
n.d. RSD < 2.3%, 275 runs
Accuracy of the method (LOQ) n.d. Mean recoveries of 72�121%, RSDs of 3�11%
Accuracy of the method (###) n.d. Mean recoveries of 74�111%, RSDs of 1.5�23%
n.d. = not determined (*) range corresponds to 0.1�1.5% impurity level of clodronate working concentration (**) for the compounds A�E (***) n = 7; measured at concentration level 500�600 µg/ml (****) n = 6�8 depending on the concentration level; 4 concentration levels measured in the range of 5�20 µg/ml (#) n = 6, measured at the 0.1% impurity level (0.5 µg/ml = LOQ) for B�E of clodronate working concentration (500 µg/ml) (##) n = 18, measured at the 0.1% impurity level (0.5 µg/ml = LOQ) for B�E of clodronate working concentration (500 µg/ml) (###) clodronate spiked with the impurities B�E at 0.2%, 0.5%, 1% and 2% working concentration level of clodronate
66
The method validation data for the CE/ESI-MS and CE-UV methods are summarized in Table 9 and presented in more detail in the original papers III and IV. The CE/ESI-MS method was validated in terms of linearity, repeatability of the method, and range and limits of detection (LODs) (Table 9 and III). Since only the CE-UV method provided the sensitivity and dynamic range suitable for quantitative determination of clodronate and related impurities in bulk materials at the 0.01% impurity level, the suitability of this method for clodronate purity studies in the drug industry was evaluated by validation studies. Specificity, within-day precision (repeatability), between-day precision (reproducibility), limits of detection (LODs) and quantitation (LOQs), accuracy, linearity and range were examined (Table 9 and IV). The CE/ESI-MS method provided good separation and highly specific identification for the compounds studied. Linearity was good (r=0.9946�0.9989) and repeatability adequate (migration time variation: RSD%=0.4�1.0%, peak area variation: RSD%=2.2�9.4%). However, the sensitivity was much lower (80�220 µg/ml corresponding to about 3�9 pmol of the analytes) than with the CE-UV method (0.25 µg/ml; 9�15 fmol of the analytes), probably owing to the highly hydrophilic nature of the analytes. The sensitivity and dynamic range of the CE/ESI-MS method were insufficient to apply the technique for clodronate purity studies at the 0.01% impurity level, but the method could be useful in the direct identification and screening of bisphosphonates in bulk drug materials. The validity of the CE-UV method was acceptable in the impurity quantitation range of 0.1�1.5% of clodronate drug working concentration (corresponding to 0.5�7.5 µg/ml for impurities and 500 µg/ml for clodronate), being suitable, therefore, for quantitation of bisphosphonate and phosphonate impurities in clodronate drug. The neutral-coated capillaries were concluded to be suitable for long-term use, and good between-day reproducibility (Table 9 and IV: Table 2) and between-day precision of migration times (RSD values < 2.3% for 275 runs) were measured for the method. 5.5 Comparison of techniques and considerations for future research Both coaxial sheath-liquid and sheathless CE/ESI-MS interfaces were constructed in this study. In positive ion mode, significantly better sensitivity for the forensic compounds was obtained with the sheathless nanospray than with the coaxial sheath liquid CE/ESI-MS. Fewer operating parameters needed to be optimized in the method development with the sheathless nanospray interface since sheath liquid and nebulizing gas were not employed. However, owing to the methanol-based electrolyte needed with the sheathless nanospray method, more than five-minutes longer migration times were obtained for the forensic compounds than with the sheath liquid method. The robustness of the sheathless nanospray technique is also of concern since one-day use was concluded to be maximum for the commercial conductive-coated capillaries and variation in the quality of the conductive coatings was observed among the capillaries. For operation in negative ion mode ESI-MS, the sheathless nanospray CE/ESI-MS could not be applied at all owing to the strong arcing at the capillary tip under all experimental conditions
67
employed. A solution to these problems could be the development of new conductive coating materials for the capillary tip. Indeed, some promising coating materials, for instance polymer-based coatings, have recently been demonstrated (Maziarz et al. 2000, Wetterhall et al. 2002), but, to our knowledge, the feasibility of the coatings in negative ion ESI has not yet been reported. As a conclusion, the sheath-liquid CE/ESI-MS was found to be more robust and a more suitable technique for quantitative analysis than the sheathless nanospray. However, the sheathless nanospray CE/ESI-MS could be useful in cases where quantification is not required but where the identification of analytes is needed from limited sample volumes. On the other hand, microchips combined with MS are expected to provide identification of analytes with high specificity and sensitivity from small sample volumes much faster than conventional CE techniques. CE-UV and CE-ESI/MS methods were developed for the quantitative determination of clodronate and its bisphosphonate and phosphonate impurities. Although the bisphosphonate compounds do not have strong UV chromophores, use of aqueous electrolytes with CE allowed their direct optical detection at low-UV-wavelength region. The CE-UV method provided acceptable dynamic range and validity for the clodronate drug purity analysis at 0.01% bisphosphonate and phosphonate impurity level. CE/ESI-MS provided highly selective identification and structural information for the compounds studied. However, sensitivity and dynamic range were not sufficient for the purity analysis. Adapting on-line sample pre-concentration techniques for CE/ESI-MS could be one way to improve the sensitivity for clodronate and related compounds. In this study, peak broadening for the analytes was observed in large-volume hydrodynamic injection, but the sample stacking method combined with removal of the sample matrix (Chien 1998) is worth examining in future. Another option for enhanced sensitivity could be the removal of sodium salts from the samples before the analysis. There are, however, several other sources for sodium ions, such as sample preparation glassware and the sample vials used with CE. As a next step, the applicability of microchip�ESI-MS to the analysis of bisphosphonates would be particularly interesting to explore. Comparison of the microchip-based methods and the CE methods showed the main advantages of the microchips to be lower consumption of samples and chemicals and disposability of the devices. Both microchip-based methods provided fast and reliable identification of the compounds studied, but analytical separation was not yet included. Direct infusion from the PDMS chip was generated electrokinetically, but the chip layout must be modified before the device can be applied for on-chip electrophoresis before ESI-MS. Integration of electrodes, for instance by sputtering of thin layers of platinum on the chip, could simplify operation in on-chip electrophoresis applications. Automated sample and reagent dispensers would be useful to achieve even faster and simpler chip�ESI-MS operation. Also with DIOS, automated sample dosing instruments would further increase the speed of analyses. For future research with DIOS, development of new surface modifications for the pSi surface is recommended in order to obtain good detection sensitivity for a wider range of compounds. In general, employing new materials and surface modifications should be of great importance in the development of lab-on-a-chip devices. In this study, for instance, considerable improvement in the PDMS chip fabrication
68
method was obtained by applying a new coating material, amorphous DLC-PDMS-h, on the SU-8 masters for enhancing their life-time in the PDMS replications. Whether surface modifications to the PDMS channels could prevent the clogging problems would be worth examining in future. Usefulness of the PDMS ESI-MS devices in the analysis of complex samples should be studied as well. Integration of sample pre-treatment procedures, such as filtering and extraction, on microchips for ESI-MS is a challenge for the future. So far, most of the studies of lab-on-a-chip devices have focused on miniaturizing single analytical principles instead of the whole analytical procedure, including the sample pre-treatment steps (de Mello and Beard 2003). An interesting area for future study is the potential application of DIOS with atmospheric pressure (AP) ionization. In preliminary studies carried out with AP-DIOS and low-molecular-weight compounds (Huikko et al. 2003), the detection sensitivities were about the same in AP as in vacuum-DIOS in the MS mode. The MS/MS possibility of the ion trap used with AP-DIOS, however, provided slight improvement in the detection sensitivity (LOD of 10 fmol for midazolam; Huikko et al. 2003). Apparently because of easier desorption of analytes to the gas-phase in vacuum than in AP, the signal lasted much longer with AP-DIOS, allowing long accumulation times for the spectra and sequential operation in various modes, including MSn measurements. The main ionization mechanism in AP-DIOS seems to be proton transfer, as in vacuum-DIOS. However, the fundamentals of the ionization process with DIOS have not yet been fully explored. To better understand the ionization principle, studies with a wider range of analytes, with different lasers and with different derivatized groups on the pSi surface, need to be carried out. Effects of additives in the sample solutions need further examination as well. In this study, spreading of samples over the hydrophobic porous silicon surface was observed with non-polar and purely aqueous solvents, and the DIOS efficiency was accordingly poor. On the other hand, such spreading might be useful in the separation of compounds on the porous silicon surface (Shen et al. 2001). Continuous-flow analysis with DIOS should be considered as a possible means of widening the applicability of DIOS to analytical separations.
A comparison of the main advantages and disadvantages of the various techniques employed in the study is presented in Table 10. Recommendations for further development of the techniques are included.
69

Table 10. Comparison of techniques employed in the study and recommendations for further development.
Technique Advantages Disadvantages Future issuesCoaxial sheath liquid * better robustness than with sheathless nanospray CE/ESI-MS * poor concentration sensitivity and low dynamic range * on-line sample pre-concentrationCE/ESI-MS * suitable for both positive and negative ion ESI for bisphosphonate and phosphonate compounds techniques
* many operation parameters to be optimizedSheathless CE/ESI-MS * good sensitivity * non-stable spray in negative ion mode due to * development of conductive coating
the electrical discharges at the spraying tip materials* limited life-time of the conductive coating on the CE * adaptation in microchip format capillary tip* organic solvent (methanol) needed for stable spray => extended analysis times for forensic compounds * clogging problems
CE-UV * very suitable for quantitative analysis * no structural information for the analytes * clodronate drug purity studies for * for bisphosphonate and phosphonate compounds, better various batches of bulk materials sensitivity and wider dynamic range than with CE/ESI-MS70
DIOS-MS * very fast and simple * poor detection sensitivity for bisphosphonate and * ionization principle* easily automated phosphonate compounds * new type of surface modifications for pSi* highly sensitive detection for basic analytes * no analytical separation * sample solution chemistry
* studies with a wider range of analytes* long-term reproducibility studies* automated nanodispensers for sampling* continuous-flow DIOS-MS* AP-DIOS-MS
Direct-infusion ESI-MS * fast * clogging problems * studies on reproducibility, linearity,from PDMS microchip * disposal of analytical devices possible detection limits
* integration of electrodes on chip* on-chip separations* biological samples* autosamplers, robotic workstations
6 CONCLUSIONS In the research for this thesis, interfacing techniques were developed and evaluated for the coupling of CE and microchips to MS (Table 10). Direct coupling of CE to ESI-MS was achieved for a triple quadrupole instrument with an in-house modified coaxial sheath liquid interface and for an ion trap instrument with a commercial coaxial sheath liquid interface. For efficient performance of the coaxial sheath liquid CE/ESI-MS, the most important operation parameters were the composition and flow rate of the sheath liquid and the flows of the nebulizing and drying gas. Optimal sheath liquid flow rate was dependent on the interface. Likewise, the effect of the nebulizing gas velocity on the CE/ESI-MS performance was different for the two sheath liquid interfaces. The results point out the importance of optimizing gas and CE capillary tubings in constructing coaxial sheath liquid interfaces. Two set-ups were constructed for sheathless nanospray CE/ESI-MS, but only the interface with the CE capillaries with conductive coating at the capillary tip was effective. The sheathless nanospray CE/ESI-MS provided more sensitive analysis than the sheath liquid CE/ESI-MS for forensic compounds, but the latter was concluded to be more robust and suitable for both positive and negative ion ESI-MS analyses.
Miniaturized analytical techniques for MS were developed through the application of microfabrication technology. Properties of porous silicon were optimized for a new MALDI-related technique, DIOS-MS. Interestingly, the best pore size found for DIOS was larger than reported in earlier studies. DIOS would appear to be a promising technique for the fast and reliable identification of basic drugs. Noise that interferes with the detection of low molecular-weight compounds in MALDI was significantly reduced with DIOS. Highly sensitive detection (100�150 fmol) was obtained for the analytes with high proton affinity, but the detection sensitivity varied widely with the analyte, being worst (40�60 pmol) for bisphosphonate and phosphonate compounds.
A microchip was fabricated for ESI-MS incorporating direct spraying from the chip. Use of hydrophobic PDMS as a chip material aids the formation of a small Taylor cone in the ESI process. The fabrication process for PDMS chips was optimized to facilitate the ESI-MS and to provide a straightforward and low-cost production of the chips. For the first time, the electrospray was generated electrokinetically without pressure assistance, directly from a PDMS microchannel orifice. The performance of the device was demonstrated in the ESI-MS analysis of psilocin, buprenorphine, histidine, and arginine. The device is free of dead-volume and can be disposed after use. Further developments are required in the chip layout before the device can be applied for chip-CE/ESI-MS.
The feasibility of the developed techniques was studied in bisphosphonate analysis. The DIOS-MS and ESI-MSn (n=1�6) behavior and fragmentation pathways were explored for bisphosphonate and phosphonate compounds. Interesting fragmentation patterns such as elimination of carbon monoxide from the P-C-P structure of the bisphosphonate followed by the formation of P-P bond were observed with ESI-MSn. The reactions between some product ions
71
and water gave rise to other unexpected fragmentation pathways for the compounds. The polyprotic acidic nature of the compounds allowed study of the correlation between the degree of deprotonation in the ESI mass spectra and the dissociation in liquid phase. The results indicated that the correlation between the recorded ESI mass spectra and the liquid-phase chemistry is poor, apparently owing to the decrease in the pH of the solvent droplets in the ion evaporation process and the charge state neutralization in the gas phase.
CE/ESI-MS provided low sensitivity and dynamic range for clodronate purity analysis, but it was concluded to be suitable for the selective and reliable screening of various bisphosphonates in bulk drug materials. For the clodronate drug purity studies, better sensitivity and sufficient dynamic range were obtained with the CE-UV method; this provided acceptable validity for quantitation of bisphosphonate and phosphonate impurities in clodronate at the 0.01% impurity level. The benefits of the CE-UV method in comparison with earlier methods reported for clodronate drug purity studies are higher separation efficiency and direct detection obtained with simple and fast sample preparation and standard low-cost reagents and detection system.
Of the techniques tested and developed in the study, the greatest potential is proposed for the microchip-based techniques because of the benefits, such as fast analysis and low consumption of samples and chemicals, provided by the miniaturization. As low-cost devices, the microchips can be used as disposable analytical instruments and so help in minimizing sample carryover and contamination problems. Despite the demonstrated feasibility of microchip-based systems in the analysis of low-molecular-weight standard compounds, the suitability for a wide range of compounds and sample matrixes, the feasibility for analytical separations, and the robustness of the techniques will need to be explored in more detail before we can draw conclusions about the potential of the microchips in routine analysis.
72
ACKNOWLEDGMENTS This study was carried out in the Division of Pharmaceutical Chemistry and in Viikki Drug Discovery Technology Center (DDTC), Department of Pharmacy, University of Helsinki, during the years 1998�2003. The work was part of two projects: "Drug Metabolism and Miniaturization of Analytical Methods", funded by the National Technology Agency of Finland (TEKES), and "Microfabricated Sample Handling and Preparation Units for Pharmaceutical Chemistry", supported by the Academy of Finland (Research grant no. 51615). Financial support was also provided by the Jenny and Antti Wihuri Foundation. I am most grateful to my supervisor Professor Risto Kostiainen, who gave me the opportunity to carry out this work at the Department of Pharmacy. I thank him for introducing me to the wonders of mass spectrometry and for the guidance, trust, and encouragement he provided throughout my work. Without him this would not have been possible. I am deeply grateful as well to Docent Tapio Kotiaho, who has advised me from my fourth post-graduate year on. His enormous enthusiasm for research is contagious. I thank him for being an inspiring supervisor, for the valuable daily discussions we shared, and for his constant support. Warm thanks go as well to Professor Marja-Liisa Riekkola for introducing me to the field of capillary electrophoresis and for her support during the final hard months. I am indebted to many people in the Microelectronics Centre (Helsinki University of Technology), the Protein Chemistry Unit (Helsinki Biomedicum, University of Helsinki), and the Accelerator Laboratory (Department of Physical Sciences, University of Helsinki), for providing instrumental and cleanroom facilities and for collaborating in the microchip part of this work. I am especially grateful to Dr. Sami Franssila, Dr. Kestutis Grigoras, Mr. Santeri Tuomikoski, Dr. Marc Baumann, Professor Asko Anttila, Mr. Veli-Matti Tiainen, and Mr. Antti Soininen. The skillful assistance of Mr. Pekka Östman and Ms. Karoliina Puolanne in the microchip project was much appreciated. Dr. Joaquin Abian from the Structural and Biological Mass Spectrometry Unit (Department of Medical Bioanalysis, IDIBAPS, Spain) must be mentioned for generously sharing his expertise in peptide analysis. I want to thank reviewers Professor Pirjo Vainiotalo and Dr. Pierre Thibault for their expertise and comments, which led to considerable improvement of the text. Many thanks as well to Dr. Kathleen Ahonen for her careful revision of the language of this thesis. The staff at the Division of Pharmaceutical Chemistry is gratefully acknowledged for creating a splendid and inspiring working environment. In particular, I remember the innumerable cheerful conversations shared with Dr. Tiia Kuuranne. Special thanks are also due to Dr. Helena Keski-Hynnilä, Ms. Päivi Lehtonen, and Dr. Katariina Vuorensola for any number of enlightening discussions about capillary electrophoresis and mass spectrometry as well as about matters not so scientific.
73

I express my warm thanks to Professor Andreas Manz for opening my eyes to the world of microfluidics at Imperial College (London, UK). I am also much indebted to the staff at the Centre of Analytical Chemistry in Imperial College for never hesitating to answer my questions and for making my half-year visit to the college enjoyable as well as profitable. Finally, I wish to thank my parents, Eila and Pekka, for their continuing trust and support. I am also grateful to Timo�s parents, Paula and Kari, for their interest and encouragement. My sister Helena and brother Petteri and dear friends provided great moments together that kept frustration at bay. My warmest thanks go, of course, to Timo for his love, understanding, and unending patience during these years. Helsinki, April 2003 K.H.
74
REFERENCES
Alexander, J.N., Schultz, G.A., and Poli J.B. Development of a nano-electrospray mass spectrometry source for nanoscale liquid chromatography and sheathless capillary electrophoresis. Rapid Commun. Mass Spectrom. 12 (1998) 1187-1191.
Alimpiev, S., Nikiforov, S., Karavanskii, V., Minton, T., and Sunner, J. On the mechanism of laser-induced desorption-ionization of organic compounds from etched silicon and carbon surfaces. J. Chem. Phys. 115 (2001) 1891-1901. Amad, M.H., Cech, N.B., Jackson, G.S., and Enke, C.G. Importance of gas-phase proton affinities in determining the electrospray ionization response for analytes and solvents. J. Mass Spectrom. 35 (2000) 784-789.
Anderson, M. and Henion, J. LC/MS/MS determination of bisphosphonates. Proceedings of the 44th ASMS Conference on MS and Allied Topics, Portland, OR, 1996, p. 618. Anderson, J.R., Chiu, D.T., Jackman, R.J., Cherniavskaya, O., McDonald, J.C., Wu, H., Whitesides, S.H., and Whitesides, G.M. Fabrication of topologically complex three-dimensional microfluidic systems in PDMS by rapid prototyping. Anal. Chem. 72 (2000) 3158-3164.
Anttila, A., Tiainen, V.-M., Kiuru, M., Alakoski, E., and Arstila, K. Preparation of diamond-like carbon�polymer hybrid films with filtered pulsed arc discharge method. Adv. Mater. (2003) submitted.
Arora, A., Eijkel, J.C.T., Morf, W.E., and Manz, A. A wireless electrochemiluminescence detector applied to direct and indirect detection for electrophoresis on a microfabricated glass device. Anal. Chem. 73 (2001) 3282-3288.
Auriola, S., Kostiainen, R., Ylinen, M., Mönkkönen, J., and Ylitalo, P. Analysis of (dichloromethylene)bisphosphonate in urine by capillary gas chromatography�mass spectrometry. J. Pharm. Biomed. Anal. 7 (1989) 1623-1629. Auriola, S., Frith, J., Rogers, M.J., Koivuniemi, A., and Mönkkönen, J. Identification of adenine nucleotide-containing metabolites of bisphosphonate drugs using ion-pair liquid chromatography�electrospray mass spectrometry. J. Chromatogr. B 704 (1997) 187-195.
Auroux, P.-A., Iossifidis, D., Reyes, D.R., and Manz, A. Micro total analysis system. 2. Analytical standard operations and applications. Anal. Chem. 74 (2002) 2637-2652.
Bach, G.A. and Henion, J. CE/MS�ion trap determination of bisphosphonates. Proceedings of the 44th ASMS Conference on MS and Allied Topics, Portland, OR, 1996, p. 619.
Badal, M.Y., Wong, M., Chiem, N., Salimi-Moosavi, H., and Harrison, D.J. Protein separation and surfactant control of electroosmotic flow in poly(dimethylsiloxane)-coated capillaries and microchips. J. Chromatogr. A 947 (2002) 277-286. Badman, E.R. and Cooks, R.G. Miniature mass analyzers. J. Mass Spectrom. 35 (2000) 659-671.
Banks, J.F., Jr. Optimization of conditions for the analysis of a peptide mixture and a tryptic digest of cytochrome c by capillary electrophoresis�electrospray-ionization mass spectrometry with an improved liquid-sheath probe. J. Chromatogr. A 712 (1995) 245-252. Barker, S.L.R., Tarlov, M.J., Canavan, H., Hickman, J.J., and Locascio, L.E. Plastic microfluidic devices modified with polyelectrolyte multilayers. Anal. Chem. 72 (2000) 4899-4903. Barnidge, D.R., Nilsson, S., Markides, K.E., Rapp, H., and Hjort, K. Metallized sheathless electrospray emitters for use in capillary electrophoresis orthogonal time-of-flight mass spectrometry. Rapid Commun. Mass Spectrom. 13 (1999a) 994-1002. Barnidge, D.R., Nilsson, S., and Markides, K.E. A design for low-flow sheathless electrospray emitters. Anal. Chem. 71 (1999b) 4115-4118.
75
Bateman, K.P., White, R.L., and Thibault, P. Disposable emitters for on-line capillary zone electrophoresis/nanoelectrospray mass spectrometry. Rapid Commun. Mass Spectrom. 11 (1997) 307-315.
Becker, H., Lowack, K., and Manz, A. Planar quartz chips with submicron channels for two-dimensional capillary electrophoresis applications. J. Micromech. Microeng. 8 (1998) 24-28. Becker, H. and Gärtner, C. Polymer microfabrication methods for microfluidic analytical applications. Electrophoresis 21 (2000) 12-26. Becker, H. and Locascio, L.E. Polymer microfluidic devices. Talanta 56 (2002) 267-287.
Bendahl, L., Hansen, S.H., and Olsen, J. A new sheathless electrospray interface for coupling of capillary electrophoresis to ion-trap mass spectrometry. Rapid Commun. Mass Spectrom. 16 (2002) 2333-2340. Bhattacharya, S.H., Raifor, T.J., and Murray, K.K. Infrared laser desorption/ionization on silicon. Anal. Chem. 74 (2002) 2228-2231.
Bruin, G.J. Recent developments in electrokinetically driven analysis on microfabricated devices. Electrophoresis 21 (2000) 3931-3951. Burggraf, N., Manz, A., Verpoorte, E., Effenhauser, C.S., Widmer, H.M., and de Rooij, N.F. A novel approach to ion separations in solution: Synchronized cyclic capillary electrophoresis. Sens. Actuators B 20 (1994) 103-110.
Campbell, D.J., Beckman, K.J., Calderon, C.E., Doolan, P. W., Ottosen, R.M., Ellis, A.B., and Lisensky, G.C. Replication and compression of bulk and surface structures with polydimethylsiloxane elastomer. J. Chem. Soc. Educ. 75 (1999) 537-541.
Cai, J. and Henion, J. Capillary electrophoresis�mass spectrometry. J. Chromatogr. A 703 (1995) 667-692. Cao, P. and Moini, M. A novel sheathless interface for capillary electrophoresis/electrospray ionization mass spectrometry using an in-capillary electrode. J. Am. Soc. Mass Spectrom. 8 (1997) 561-564. Chang, S.Y. and Yeung, E.S. Laser vaporization/ionization interface for capillary electrophoresis�time-of-flight mass spectrometry. Anal. Chem. 69 (1997) 2251-2257. Chang, Y.Z. and Her, G.R. Sheathless capillary electrophoresis/electrospray mass spectrometry using a carbon-coated fused-silica capillary. Anal. Chem. 72 (2000) 626-630. Chang, Y.Z., Yet, R., and Her, G.R. Sheathless capillary electrophoresis/electrospray mass spectrometry using a carbon-coated tapered fused-silica capillary with a beveled edge. Anal. Chem. 73 (2001) 5083-5087. Chartogne, A., Tjaden, U.R., and van der Greef, J. A free-flow electrophoresis chip device for interfacing capillary isoelectric focusing on-line with electrospray mass spectrometry. Rapid Commun. Mass Spectrom. 14 (2000) 1269-1274. Chen, D.C., Hsu, F.L., Zhan, D.Z., and Chen, C.H. Palladium film decoupler for amperometric detection in electrophoresis chips. Anal. Chem. 73 (2001) 758-762.
Chen, X., Wu, H., Mao, C., and Whitesides, G.M. A prototype two-dimensional capillary electrophoresis system fabricated in poly(dimethylsiloxane). Anal. Chem. 74 (2002) 1772-1778. Chen, Y.R., Tseng, M.C., Chang, Y.Z., and Her, G.R. A low-flow CE/electrospray ionization MS interface for capillary zone electrophoresis, large-volume sample stacking, and micellar electrokinetic chromatography. Anal. Chem. 75 (2003) 503-508. Chester, T.L. Dual flame photometric phosphorus-selective detector for high-performance liquid chromatography. Anal. Chem. 52 (1980) 1621-1624. Chester, T.L., Lewis, E.C., Benedict, J.J., Sunberg, R.J., and Tettenhorst, W.C. Determination of (dichloromethylene) diphosphonate in physiological fluids by ion-exchange chromatography with phosphorus-selective detection. J. Chromatogr. 225 (1981) 17-25.
76
Chien, R.-L. in High-Performance Capillary Electrophoresis. Theory, Techniques and Applications, Khaledi, M.G. (Ed.). John Wiley and Sons Inc., New York, U.S.A., 1998, p. 456-471. Chiou, C.-H., Lee, G.-B., Hsu, H.-T., Chen, P.-W., and Liao, P.-C. Micro devices integrated with microchannels and electrospray nozzles using PDMS casting techniques. Sens. Actuators B 86 (2002) 280-286. Claereboudt, J., Baeten, W., Geise, H.M., and Claeys, M. Structural characterization of mono- and bisphosphonium salts by fast atom bombardment mass spectrometry and tandem mass spectrometry. Org. Mass Spectrom. 28 (1993) 71-82. Cobb, K.A., Dolnik, V., and Novotny, M. Electrophoretic separations of proteins in capillaries with hydrolytically stable surface structures. Anal. Chem. 62 (1990) 2478-2483.
Cole, R.B. Some tenets pertaining to electrospray ionization mass spectrometry. J. Mass Spectrom. 35 (2000) 763-772.
Cuiffi, J.D., Hayes, D.J., Fonash, S.J., Brown, K.N., and Jones, A.D. Desorption�ionization mass spectrometry using deposited nanostructured silicon films. Anal. Chem. 73 (2001) 1292-1295. Culbertson, C.T., Jakobson, S.C., and Ramsey, J.M. Dispersion sources for compact geometries on microchips. Anal. Chem. 70 (1998) 3781-3789. Culbertson, C.T., Jacobson, S.C., and Ramsey, J.M. Microchip devices for high-efficiency separations. Anal. Chem. 72 (2000) 5814-5819.
Den Hartigh, J., Langebroek, R., and Vermeij, P. Ion-exchange liquid chromatographic analysis of bisphosphonates in pharmaceutical preparations. J. Pharm. Biomed. Anal. 11 (1993) 977-983. Deng, Y., Henion, J., Li, J., Thibault, P., Wang, C., and Harrison, D.J. Chip-based capillary electrophoresis/mass spectrometry determination of carnitines in human urine. Anal. Chem. 73 (2001a) 639-646.
Deng, Y., Zhang, H., and Henion, J. Chip-based quantitative capillary electrophoresis/mass spectrometry determination of drugs in human plasma. Anal. Chem. 73 (2001b) 1432-1439.
Dolnik, V., Liu, S., and Jovanovich, S. Capillary electrophoresis on microchip. Electrophoresis 21 (2000) 41-54. Duffy, D.C., McDonald, J.C., Schueller, O.J.A., and Whitesides, G.M. Rapid prototyping of microfluidic systems in poly(dimethylsiloxane). Anal. Chem. 70 (1998) 4974-4984. Dziuban, J., Górecka-Drzazga, A., Nieradko, L., and Malecki, K. Silicon-glass micromachined chromatographic microcolumn. J. Cap. Elec. Microchip Tech. 6 (1999) 37-41.
Effenhauser, C.S., Paulus, A., Manz, A., and Widmer, H.M. High-speed separation of antisense oligonucleotides on a micromachined capillary electrophoresis device. Anal. Chem. 66 (1994) 2949-2953.
Ehrnström, R. Miniaturization and integration: Challenges and breakthroughs in micro-fluidics. Lab Chip 2 (2002) 26N-30N.
Eijkel, J.C.T., Stoeri, H., and Manz, A. A dc microplasma on a chip employed as an optical emission detector for gas chromatography. Anal. Chem. 72 (2000) 2547-2552. Ekström, S., Ericsson, D., Önnerfjord, P., Bengtsson, M., Nilsson, J., Marko-Varga, G., and Laurell, T. Signal amplification using �spot-on-a-chip� technology for the identification of proteins via MALDI-TOF MS. Anal. Chem. 73 (2001) 214-219. Elomaa, I., Blomqvist, C., Porkka, L., Holmström, T., Taube, T., Lamberg-Allardt, C., and Borgström, G.H. Diphosphonates for osteolytic metastases. Lancet 1 (1985) 1155-1156.
Esch, M.B., Locascio, L.E., Tarlov, M.J., and Durst, R.A. Detection of viable Cryptosporidium parvum using DNA-modified liposomes in a microfluidic chip. Anal. Chem. 73 (2001) 2952-2958.
77
Figeys, D. and Aebersold, R. High sensitivity analysis of proteins and peptides by capillary electrophoresis�tandem mass spectrometry: Recent developments in technology and applications. Electrophoresis 19 (1998) 885-892. Figeys, D., Gygi, S., McKinnon, G., and Aebersold, R. An integrated microfluidics tandem mass spectrometry system for automated protein analysis. Anal. Chem. 70 (1998) 3728-3734. Figeys, D., Aebersold, R., and Lock, C. Injection-molded, polymeric microfluidic devices coupled to electrospray ionization tandem mass spectrometers for protein identification. J. Cap. Elec. Microchip Tech. 6 (1999) 1-6.
Fintschenko, Y. and van den Berg, A. Silicon microtechnology and microstructures in separation science. J. Chromatogr. A 819 (1998) 3-12. Fister, J.C., Jakobson, S.C., Davis, L.M., and Ramsey, J.M. Counting single chromophore molecules for ultrasensitive analysis and separations on microchip devices. Anal. Chem. 70 (1998) 431-437.
Flassbeck, D., Pfleiderer, B., Klemens, P., Heumann, K.G., Eltze, E., and Hirner, A.V. Determination of siloxanes, silicon, and platinum in tissues of women with silicone gel-filled implants. Anal. Bioanal. Chem. 375 (2003) 356-362. Fluri, K., Fitzpatrick, G., Chiem, N., and Harrison, D.J. Integrated capillary electrophoresis devices with an efficient post-column reactor in planar quartz and glass chips. Anal. Chem. 68 (1996) 4285-4290.
Foquet, M., Korlach, J., Zipfel, W., Webb, W.W., and Craighead, H.G. DNA fragment sizing by single molecule detection in submicrometer-sized closed fluidic channels. Anal. Chem. 74 (2002) 1415-1422.
Foret, F., Thompson, T.J., Vouros, P., Karger, B.L, Gebauer, P., and Bocek, P. Liquid sheath effects on the separation of proteins in capillary electrophoresis/electrospray mass spectrometry. Anal. Chem. 66 (1994) 4450-4458. Fu, C.-G. and Fang, Z.-L. Combination of flow injection with capillary electrophoresis: Part 7. Microchip capillary electrophoresis system with flow injection sample introduction and amperometric detection. Anal. Chim. Acta 422 (2000) 71-79. Fujii, T. PDMS-based microfluidic devices for biomedical applications. Microelectr. Eng. 61-62 (2002) 907-914.
Gao, J., Xu, J., Locascio, L.E., and Lee, C.S. Integrated microfluidic system enabling protein digestion, peptide separation, and protein identification. Anal. Chem. 73 (2001) 2648-2655. Gaskell, S.J. Electrospray: Principles and practice. J. Mass Spectrom. 32 (1997) 677-688. Gilman, S.D. and Ewing, A.G. Analysis of single cells by capillary electrophoresis with on-column derivatization and laser induced fluorescence detection. Anal. Chem. 67 (1995) 58-64.
Gottschlich, N., Culbertson, C.T., McKnight, T.E., Jacobson, S.C., and Ramsey, J.M. Integrated microchip-device for the digestion, separation and post-column labelling of proteins and peptides. J. Chromatogr. B 745 (2000) 243-249. Gottschlich, N., Jacobson, S.C., Culbertson, C.T., and Ramsey, J.M. Two dimensional electrochromatography/capillary electrophoresis on a microchip. Anal. Chem. 73 (2001) 2669-2674.
Haab, B.B. and Mathies, R.A. Single-molecule detection of DNA separations in microfabricated capillary electrophoresis chips employing focused molecular streams. Anal. Chem. 71 (1999) 5137-5145.
Harrison, D.J., Manz, A., Fan, Z., Lüdi, H., and Widmer, H.M. Capillary electrophoresis and sample injection systems integrated on a planar glass chip. Anal. Chem. 64 (1992) 1908-1919.
Harrison, D.J., Glavina, P.G., and Manz, A. Towards miniaturized electrophoresis and chemical analysis systems on silicon: An alternative to chemical sensors. Sens. Actuators B 10 (1993) 107-116.
78
Hau, J. and Roberts, M. Advantages of pressurization in capillary electrophoresis/electrospray ionization mass spectrometry. Anal. Chem. 71 (1999) 3977-3984. Henion, J.D., Mordehai, A.V., and Cai, J. Quantitative capillary electrophoresis�ion spray mass spectrometry on a benchtop ion trap for the determination of isoquinoline alkalides. Anal. Chem. 66 (1994) 2103-2109. Henry, C.M. The incredible shrinking mass spectrometers. Anal. Chem. News Features April 1 (1999) 264A-268A. Hoffmann, O., Niedermann, P., and Manz, A. Modular approach to fabrication of three-dimensional microchannel systems in PDMS � application to sheath flow microchips. Lab Chip 1 (2001) 108-114. Hofstadler, S.A., Wahl, J.H., Bruce, J.E., and Smith, R.D. On-line capillary electrophoresis with Fourier Transform ion cyclotron resonance mass spectrometry. J. Am. Chem. Soc. 15 (1993) 6983-6984. Huber, C.G., Premstaller, A., and Kleindienst, G. Evaluation of volatile eluents and electrolytes for high-performance liquid chromatography�electrospray ionization mass spectrometry and capillary electrophoresis�electrospray ionization mass spectrometry of proteins. II. Capillary electrophoresis. J. Chromatogr. A 849 (1999) 175-189. Huikko, K., Östman, P., Sauber, C., Mandel, F., Grigoras, K., Franssila, S., Kotiaho, T., and Kostiainen, R. Feasibility of atmospheric pressure desorption/ionization on silicon mass spectrometry in analysis of drugs. Rapid Commun. Mass Spectrom. (2003) in press. Hutchinson, D.W. and Semple, G. Fast atom bombardment mass spectrometry of salts of substituted methylene bisphosphonic acids and other analogues of pyrophosphoric acid. Org. Mass Spectrom. 20 (1985) 143-145. Ingendoh, A., Kiehne, A., and Greiner, M. CE�MS-MS of peptides using a novel orthogonal CE ESI sprayer and ion trap MS. Chromatographia 49 (1999) 1-5. Ishihama, Y., Katayama, H., Asakawa, N., and Oda, Y. Highly robust stainless steel tips as microelectrospray emitters. Rapid Commun. Mass Spectrom. 16 (2002) 913-918. Isoo, K., Otsuka, K., and Terabe, S. Application of sweeping to micellar electrokinetic chromatography�atmospheric pressure chemical ionization-mass spectrometric analysis of environmental pollutants. Electrophoresis 22 (2001) 3426-3432. Jakeway, S.C., de Mello, A.J., and Russell, E.L. Miniaturized total analysis systems for biological analysis. Fresenius J. Anal. Chem. 366 (2000) 525-539. Jakobson, S.C., Hergenröder, R., Koutny, L.B., Warmack, R.J., and Ramsey, J.M. Effects of injection schemes and column geometry on the performance of microchip electrophoresis devices. Anal. Chem. 66 (1994a) 1107-1113. Jakobson, S.C., Koutny, L.B., Hergenröder, R., Moore, A.V., and Ramsey, J.M. Microchip capillary electrophoresis with an integrated postcolumn reactor. Anal. Chem. 66 (1994b) 3472-3476. Jakobson, S.C., Culbertson, C.T., Daler, J.E., and Ramsey, J.M. Microchip structures for submillisecond electrophoresis. Anal. Chem. 70 (1998) 3476-3480. Jáuregui, O., Moyano, E., and Galceran, M.T. Capillary electrophoresis�electrospray ion-trap mass spectrometry for the separation of chlorophenols. J. Chromatogr. A 896 (2000) 125-133. Jiang, Y., Wang, P.-C., Locascio, L.E., and Lee, C.S. Integrated plastic microfluidic devices with ESI-MS for drug screening and residue analysis. Anal. Chem. 73 (2001) 2048-2053. Jo, B.-H., van Lerberghe, L.M., Motsegood, K.M., and Beebe, D.J. Three-dimensional micro-channel fabrication in polydimethylsiloxane (PDMS) elastomer. J. Micromech. Systems 9 (2000) 76-81. Johansson, I.M., Pavelka, R., and Henion, J.D. Determination of small drug molecules by capillary electrophoresis�atmospheric pressure ionization mass spectrometry. J. Chromatogr. 559 (1991) 515-528.
79
Jussila, M., Sinervo, K., Porras, S.P., and Riekkola, M.-L. Modified liquid junction interface for nonaqueous capillary electrophoresis�mass spectrometry. Electrophoresis 21 (2000) 3311-3317. Kameoka, J., Craighead, H.G., Zhang, H., and Henion, J. A polymeric microfluidic chip for CE/MS determination of small molecules. Anal. Chem. 73 (2001) 1935-1941. Kameoka, J., Orth, R., Ilic, B., Czaplewski, D., Wachs, T., and Craighead, H.G. An electrospray ionization source for integration with microfluidics. Anal. Chem. 74 (2002) 5897-5901. Kala, S.V., Lykissa, E.D., and Lebovitz, R.M. Detection and characterization of poly(dimethylsiloxane)s in biological tissues by GC/AED and GC/MS. Anal. Chem. 69 (1997) 1267-1272. Kebarle, P. A brief overview of the present status of the mechanisms involved in electrospray mass spectrometry. J. Mass Spectrom. 35 (2000) 804-817. Kebarle, P. and Ho, Y. in Electrospray Ionization Mass Spectrometry. Fundamentals, Instrumentation and Applications, Cole, R.B (Ed.). John Wiley and Sons, Inc., New York, U.S.A., 1997, p. 13-19.
Kelly, J.F., Ramaley, L., and Thibault, P. Capillary zone electrophoresis�electrospray mass spectrometry at submicroliter flow rates: Practical considerations and analytical performance. Anal. Chem. 69 (1997) 51-60.
Kim, J.-S. and Knapp, D.R. Microfabricated PDMS multichannel emitter for electrospray ionization mass spectrometry. J. Am. Soc. Mass Spectrom. 12 (2001a) 463-469. Kim, J.-S. and Knapp, D.R. Microfabrication of polydimethylsiloxane electrospray ionization emitters. J. Chromatogr. A 924 (2001b) 137-145. King, L.E. and Vieth, R. Extraction and measurement of pamidronate from bone samples using automated pre-column derivatization, high-performance liquid chromatography and fluorescence detection. J. Chromatogr. B 678 (1996) 325-330. Kirby, D.B., Thorne, J.M., Götzinger, W.K., and Karger, B.L. A CE/ESI-MS interface for stable, low-flow operation. Anal. Chem. 68 (1996) 4451-4457. Khandurina, J. and Guttman, A. Bioanalysis in microfluidic devices. J. Chromatogr. A 943 (2002) 159-183.
Kline, W.F. and Matuszewski, B.K. Improved determination of the bisphosphonate alendronate in human plasma and urine by automated precolumn derivatization and high-performance liquid chromatography with fluorescence and electrochemical detection. J. Chromatogr. 583 (1992) 183-193. Kosonen, J.P. Determination of disodium clodronate in bulk material and pharmaceuticals by ion chromatography with post-column derivatization. J. Pharm. Biomed. Anal. 10 (1992) 881-887.
Kriger, M.S., Cook, K.D., and Ramsey, R.S. Durable gold-coated fused silica capillaries for use in electrospray mass spectrometry. Anal. Chem. 67 (1995) 385-389. Kruse, R.A., Li, X., Bohn, P.W., and Sweedler, J.V. Experimental factors controlling analyte ion generation in laser desorption/ionization mass spectrometry on porous silicon. Anal. Chem. 73 (2001a) 3639-3645. Kruse, R.A., Rubakhin, S.S., Romanova, E.V., Bohn, P.W., and Sweedler, J.V. Direct assay of Aplysia tissues and cells with laser desorption/ionization mass spectrometry on porous silicon. J. Mass Spectrom. 36 (2001b) 1317-1322. Kutter, J.P., Ramsey, R.S., Jakobson, S.C., and Ramsey, J.M. Determination of metal cations in microchip electrophoresis using on-chip complexation and sample stacking. J. Microcolumn Sep. 10 (1998) 313-318. Kutter, J.P. Current developments in electrophoretic and chromatographic separation methods on microfabricated devices. Trends Anal. Chem. 19 (2000) 352-363. Kwong, E., Chiu, A.M.Y., McClintock, S.A., and Cotton, M.L. HPLC analysis of an amino bisphosphonate in pharmaceutical formulations using postcolumn derivatization and fluorescence detection. J. Chromatogr. Sci. 28 (1990) 563-566.
80
Laiko, V.V., Baldwin, M.A., and Burlingame, A.L. Atmospheric pressure matrix-assisted laser desorption/ionization mass spectrometry. Anal. Chem. 72 (2000) 652-657. Laiko, V.V., Taranenko, N.I., Berkout, V.D., Musselman, B.D., and Doroshenko, V.M. Atmospheric pressure laser desorption/ionization on porous silicon. Rapid Commun. Mass Spectrom. 16 (2002) 1737-1742.
Larsson, M., Sundberg, R., and Folestad, S. On-line capillary electrophoresis with mass spectrometry detection for the analysis of carbohydrates after derivatization with 8-aminonaphthalene-1,3,6-trisulfonic acid. J. Chromatogr. A 934 (2001) 75-85. Laurell, T., Nilsson, J., and Marko-Varga, G. Silicon microstructures for high-speed and high-sensitivity protein identifications. J. Chromatogr. B 752 (2001) 217-232. Lazar, I.M., Lee, E.D., Rockwood, A.L., and Lee, M.L. General considerations for optimizing a capillary electrophoresis�electrospray ionization time-of-flight mass spectrometry system. J. Chromatogr. A 829 (1998) 279-288. Lazar, I.M., Ramsey, R.S., Sundberg, S., and Ramsey, J.M. Subattomole-sensitivity microchip nanoelectrospray source with time-of-flight mass spectrometry detection. Anal. Chem. 71 (1999) 3627-3631. Lazar, I.M., Ramsey, R.S., Jakobson, S.C., Foote, R.S., and Ramsey, J.M. Novel microfabricated device for electrokinetically induced pressure flow and electrospray ionization mass spectrometry. J. Chromatogr. A 892 (2000) 195-201. Lazar, I.M., Ramsey, R.S., and Ramsey, J.M. On-chip proteolytic digestion and analysis using "wrong-way-round" electrospray time-of-flight mass spectrometry. Anal. Chem. 73 (2001) 1733-1739. Lee, E.D., Mück, W., Henion, J.D., and Covey, T.R. Liquid junction coupling for capillary zone electrophoresis/ion spray mass spectrometry. Biomed. Environ. Mass Spectrom. 18 (1989) 844-850. Lee, G.B., Chen, S.H., Huang, G.R., Sung, W.C., and Lin, Y.H. Microfabricated plastic chips by hot embossing methods and their applications for DNA separation and detection. Sens. Actuators B 75 (2001) 142-148.
Li, J., Thibault, P., Bings, N.H., Skinner, C.D., Wang, C., Colyer, C., and Harrison, J. Integration of microfabricated devices to capillary electrophoresis�electrospray mass spectrometry using a low dead volume connection: Application to rapid analyses of proteolytic digests. Anal. Chem. 71 (1999) 3036-3045. Li, J., Kelly, J.F., Chernushevich, I., Harrison, D.J., and Thibault, P. Microfabricated device for combined capillary electrophoresis/nanoelectrospray mass spectrometry. Anal. Chem. 72 (2000) 599-609. Li, J., Tremblay, T.-L., Thibault, P., Wang, C., Attiya, S., and Harrison, D.J. Integrated system for high-throughput protein identification using a microfabricated device coupled to capillary electrophoresis/ nanoelectrospray mass spectrometry. Eur. J. Mass. Spectrom. 7 (2001) 143-155.
Licklider, L., Wang, X.-Q., Desai, A., Tai, Y.-C., and Lee, T.D. A micromachined chip-based electrospray source for mass spectrometry. Anal. Chem. 72 (2000) 367-375. Limbach, P.A. and Meng, Z. Integrating micromachined devices with modern mass spectrometry. Analyst 127 (2002) 693-700. Liu, Y., Fanguy, J.C., Bledsoe, J.M., and Henry, C.S. Dynamic coating using polyelectrolyte multilayers for chemical control of electroosmotic flow in capillary electrophoresis microchips. Anal. Chem. 72 (2000) 5939-5944. Liu, H., Felten, C., Xue, Q., Zhang, B., Jedrzejewski, P., Karger, B.L., and Foret, F. Development of multichannel devices with an array of electrospray tips for high-throughput mass spectrometry. Anal. Chem. 72 (2000) 3303-3310. Lorenz, H., Despont, M., Fahrni, N., Brugger, J., Vettiger, P., and Renaud, P. High-aspect-ratio, ultrathick, negative-tone near-UV photoresist and its applications in MEMS. Sens. Actuators. 64 (1998) 33-39.
81
Lovdahl, M.J. and Pietrzyk, D.J. Anion-exchange separation and determination of bisphosphonates and related analytes by post-column indirect fluorescence detection. J. Chromatogr. A 850 (1999) 143-152. Lu, W., Poon, G.K., Carmichael, P.L., and Cole, R.B. Analysis of tamoxifen and its metabolites by on-line capillary electrophoresis�electrospray ionization mass spectrometry employing nonaqueous media containing surfactants. Anal. Chem. 68 (1996) 668-674. Manz, A., Graber, N., and Widmer, H.M. Miniaturized total chemical-analysis systems � a novel concept for chemical sensing. Sens. Actuators B (1990) 244-248. Manz, A., Harrison, D.J., Verpoorte, E.M.J., Fettinger, J.C., Paulus, A., Lüdi, H., and Widmer, H.M. Planar chips technology for miniaturization and integration of separation techniques into monitoring systems: Capillary electrophoresis on a chip. J. Chromatogr. 593 (1992) 253-258. Manz, A. and Becker, H. Micro-system Technology in Chemistry and Life Sciences, Springer Verlag, Berlin, Germany, 1999. Martin-Girardeau, A. and Renou-Gonnord, M.F. Optimization of capillary electrophoresis�electrospray mass spectrometry method for the quantitation of the 20 natural amino acids in children's blood. J. Chromatogr. B 742 (2000) 163-171. Maziarz, E.P., III, Lorenz, S.A., White, T.P., and Wood, T.D. Polyaniline: A conductive polymer coating for durable nanospray emitters. J. Am. Soc. Mass Spectrom. 11 (2000) 659-663. McDonald, J.C., Chabinyc, M.L., Metallo, S.J., Anderson, J.R., Stroock, A.D., and Whitesides, G.M. Prototyping of microfluidic devices in poly(dimethylsiloxane) using solid-object printing. Anal. Chem. 74 (2002) 1537-1545. McDonald, J.C. and Whitesides, G.M. Poly(dimethylsiloxane) as a material for fabricating microfluidic devices. Acc. Chem. Res. 35 (2002) 491-499. Meek, S.E. and Pietrzyk, D.J. Liquid chromatographic separation of phosphorus oxo acids and other anions with postcolumn indirect fluorescence detection by aluminum�morin. Anal. Chem. 60 (1988) 1397-1400. de Mello, A.J. Chip-MS: Coupling the large with the small. Lab Chip 1 (2001) 7N-12N. de Mello, A.J. Focus: Plastic fantastic? Lab Chip 2 (2002a) 31N-36N. de Mello, A.J. On-chip chromatography: The last twenty years. Lab Chip 2 (2002b) 48N-54N. de Mello, A.J. and Beard, N. Dealing with 'real' samples: Sample pre-treatment in microfluidic systems. Lab Chip 3 (2003) 11N-19N. Miller, J.L. and Khaledi, M.G. in High-Performance Capillary Electrophoresis. Theory, Techniques and Applications, Khaledi, M.G. (Ed.). John Wiley and Sons Inc., New York, U.S.A., 1998, p. 525-538. Mogensen, K.B., Petersen, N.J., Hübner, J. and Kutter, J.P. Monolithic integration of optical waveguides for absorbance detection in microfabricated electrophoresis devices. Electrophoresis 22 (2001) 3930-3938. Moini, M. Design and performance of a universal sheathless capillary electrophoresis to mass spectrometry interface using a split-flow technique. Anal. Chem. 73 (2001) 3497-3501. Moini, M. Capillary electrophoresis mass spectrometry and its application to the analysis of biological mixtures. Anal. Bioanal. Chem. 373 (2002) 466-480. Moore, A.W., Jakobson, S.C., and Ramsey, J.M. Microchip separations of neutral species via micellar electrokinetic capillary chromatography. Anal. Chem. 67 (1995) 4184-4189. Moseley, M.A., Deterding, L.J., Tomer, K.B., and Jorgenson, J.W. Capillary zone electrophoresis�mass spectrometry using a coaxial continuous-flow fast atom bombardment interface. J. Chromatogr. 516 (1990) 167-173.
82
Muddiman, D.C., Rockwood, A.L., Gao, Q., Severs, J.C., Udseth, H.R., Smith, R.D., and Proctor, A. Application of sequential paired covariance to capillary electrophoresis electrospray ionization time-of-flight mass spectrometry: Unraveling the signal from the noise in the electropherogram. Anal. Chem. 67 (1995) 4371-4375. Neususs, C., Pelzing, M., and Macht, M. A robust approach for the analysis of peptides in the low femtomole range by capillary electrophoresis-tandem mass spectrometry. Electrophoresis 23 (2002) 3149-3159. Niemi, R., Taipale, H., Ahlmark, M., Vepsäläinen, J., and Järvinen, T. Simultaneous determination of clodronate and its partial ester derivatives by ion-pair reversed-phase high-performance liquid chromatography coupled with light-scattering detection. J. Chromatogr. B 701 (1997) 97-102. Nilsson, S. and Markides, K.E. On-column conductive coating for thermolabile columns used in capillary zone electrophoresis sheathless electrospray ionisation mass spectrometry. Rapid Commun. Mass Spectrom. 14 (2000) 6-11. Nilsson, S., Svedberg, M., Pettersson, J., Björefors, F., Markides, K., and Nyholm, L. Evaluations of the stability of sheathless electrospray ionization mass spectrometry emitters using electrochemical techniques. Anal. Chem. 73 (2001) 4607-4616. NúŔez, O., Moyano, E., and Galceran, M.T. Capillary electrophoresis�mass spectrometry for the analysis of quaternary ammonium herbicides. J. Chromatogr. A 974 (2002) 243-255. Ocvirk, G., Verpoorte, E., Manz, A., Grasserbauer, M., and Widmer, H.M. High performance liquid chromatography partially integrated on silicon chip. Anal. Methods Instrum. 2 (1995) 74-82. Ocvirk, G., Munroe, M., Tang, T., Oleschuk, R., Westra, K., and Harrison, D.J. Electrokinetic control of fluid flow in native poly(dimethylsiloxane) capillary electrophoresis devices. Electrophoresis 21 (2000) 107-115. Oleschuk, R.D. and Harrison, D.J. Analytical microdevices for mass spectrometry. Trends Anal. Chem. 19 (2000) 379-388. Olivares, J.A., Nguyen, N.T., Yonker, C.R., and Smith, R.D. On-line mass spectrometric detection for capillary zone electrophoresis. Anal. Chem. 59 (1987) 1230-1232. Palmer, M.E., Tetler, L.W., and Wilson, I.D. Hydrogen/deuterium exchange using a coaxial sheath-flow interface for capillary electrophoresis/mass spectrometry. Rapid Commun. Mass Spectrom. 14 (2000) 808-817.
Peng, S.X., Takigiku, R., Burton, D.E., and Powell, L.L. Direct pharmaceutical analysis of bisphosphonates by capillary electrophoresis. J. Chromatogr. B 709 (1998) 157-160. Pinto, D.M., Ning, Y., and Figeys, D. An enhanced microfluidic chip coupled to an electrospray QStar mass spectrometer for protein identification. Electrophoresis 21 (2000) 181-190. Pleasance, S., Thibault, P., and Kelly, J. Comparison of liquid-junction and coaxial interfaces for capillary electrophoresis�mass spectrometry with application to compounds of concern to the aquaculture industry. J. Chromatogr. 591 (1992) 325-339.
Qin, X.-Z., Tsai, E.W., Sakuma, T., and Ip, D.P. Pharmaceutical application of liquid chromatography�mass spectrometry. II. Ion chromatography�ion spray mass spectrometric characterization of alendronate. J. Chromatogr. A 686 (1994) 205-212. Ramsey, R.S. and Ramsey, J.M. Generating electrospray from microchip devices using electroosmotic pumping. Anal. Chem. 69 (1997) 1174-1178.
Raymond D.E., Manz, A., and Widmer, H.M. Continuous sample pretreatment using a free-flow electrophoresis device integrated onto a silicon chip. Anal. Chem. 66 (1994) 2858-2865.
Reed, D.G., Martin, G.P., Konieczny, J.M., and Brooks, M.A. The determination of alendronate sodium in tablets by inductively coupled plasma (ICP). J. Pharm. Biomed. Anal. 13 (1995) 1055-1058.
Ren, X., Bachman, M., Sims, C., Li, G.P., and Allbritton, N. Electroosmotic properties of microfluidic channels composed of poly(dimethylsiloxane). J. Chromatogr. B 762 (2001) 117-125.
83
Reyes, D.R., Iossifidis, D., Auroux, P.-A., and Manz, A. Micro total analysis systems. 1. Introduction, theory and technology. Anal. Chem. 74 (2002) 2623-2636. Rocklin, R.D., Ramsey, R.S., and Ramsey, J.M. A microfabricated fluidic device for performing two-dimensional liquid-phase separations. Anal. Chem. 72 (2000) 5244-5249.
Rogers, M.J., Frith, J.C., Luckman S.P., Coxon, F.P., Benford, H.L., Mönkkönen, J., Auriola, S., Chilton, K.M., and Russell, R.G.G. Molecular mechanisms of action of bisphosphonates. Bone 24 (1999) 73S-79S. Rohner, T.C., Rossier, J.S., and Girault, H.H. Polymer microspray with an integrated thick-film microelectrode. Anal. Chem. 73 (2001) 5353-5357. Rossier, J., Reymond, F., and Michel, P.E. Polymer microfluidic chips for electrochemical and biochemical analyses. Electrophoresis 23 (2002) 858-867. Samskog, J., Wetterhall, M., Jakobsson, S., and Markides, K. Optimization of capillary electrophoresis conditions for coupling to a mass spectrometer via a sheathless interface. J. Mass Spectrom. 35 (2000) 919-924. Schultz, G.A., Corso, T.N., Prosser S.J., and Zhang, S. A fully integrated monolithic microchip electrospray device for mass spectrometry. Anal. Chem. 72 (2000) 4058-4063. Schramel, O., Michalke, B., and Kettrup, A. Capillary electrophoresis/electrospray ionization mass spectrometry (CE/ESI-MS) as a powerful tool for trace element speciation. Fresenius J. Anal. Chem. 363 (1999) 452-455. Severs, J.C. and Smith, R.D. in Electrospray Ionization Mass Spectrometry. Fundamentals, Instrumentation and Applications, Cole, R.B. (Ed.), John Wiley and Sons, Inc., New York, U.S.A., 1997, p. 354. Shen, Z., Thomas, J.J., Averbuj, C., Broo, K.M., Engelhard, M., Crowell, J.E., Finn, M.G., and Siuzdak, G. Porous silicon as a versatile platform for laser desorption/ionization mass spectrometry. Anal. Chem. 73 (2001) 612-619.
Sheppard, R.L. and Henion, J. Quantitative capillary electrophoresis/ion spray tandem mass spectrometry determination of EDTA in human plasma and urine. Anal. Chem. 69 (1997) 2901-2907.
Siethoff, C., Nigge, W., and Linscheid, M. Characterization of a capillary zone electrophoresis/electrospray-mass spectrometry interface. Anal. Chem. 70 (1998) 1357-1361. Sirén, H., Määttänen, A., and Riekkola, M.-L. Determination of small anions by capillary electrophoresis using indirect UV detection with sulphonated nitrosonaphthol dyes. J. Chromatogr. A 767 (1997) 293-301. Sjödahl, J., Melin, J., Griss, P., Emmer, Å., Stemme, G., and Roeraade, J. Characterization of micromachined hollow tips for two-dimensional nanoelectrospray mass spectrometry. Rapid Commun. Mass Spectrom. 17 (2003) 337-341. Smith, A.D. and Moini, M. Control of electrochemical reactions at the capillary electrophoresis outlet/electrospray emitter electrode under CE/ESI-MS through the application of redox buffers. Anal. Chem. 73 (2001) 240-246. Smith, R.D. and Udseth, H.R. Capillary zone electrophoresis�MS. Nature 331 (1988) 639-640. Smith, R.D., Barinaga, C.J., and Udseth, H.R. Improved electrospray ionization interface for capillary zone electrophoresis�mass spectrometry. Anal. Chem. 60 (1988) 1948-1952. Smith, R.D., Udseth, H.R., Barinaga, C.J., and Edmonds, C.G. Instrumentation for high-performance capillary electrophoresis�mass spectrometry. J. Chromatogr. 559 (1991) 197-208. Smith, R.D., Wahl, J.H., Goodlett, D.R., and Hofstadler, S.A. Capillary electrophoresis/mass spectrometry. Anal. Chem. 65 (1993) 574-584. Sparidans, R.W., Den Hartigh, J., and Vermeij, P. High-performance ion-exchange chromatography with in-line complexation of bisphosphonates and their quality control in pharmaceutical preparations. J. Pharm. Biomed. Anal. 13 (1995) 1545-1550.
84
Sparidans, R.W., Den Hartigh, J., Ramp-Koopmanschap, W.M., Langebroek, R.H., and Vermeij, P.J. The determination of pamidronate in pharmaceutical preparations by ion-pair liquid chromatography after derivatization with phenylisothiocyanate. J. Pharm. Biomed. Anal. 16 (1997) 491-497. Suter, M.J.F. and Caprioli, R.M. An integral probe for capillary zone electrophoresis/continuous-flow fast atom bombardment mass spectrometry. J. Am. Soc. Mass Spectrom. 3 (1992) 198-206. Svedberg, M., Pettersson, A., Nikolajeff, F., and Markides, K. Electrospray from a plastic chip. Proceedings of µ-TAS 2001 Symposium in Monterey, U.S.A., p. 335-336. Takada, Y., Sakairi, M., and Koizumi, H. On-line combination of micellar electrokinetic chromatography and mass spectrometry using an electrospray�chemical ionization interface. Rapid Commun. Mass Spectrom. 9 (1995) 488-490. Tanaka, Y., Otsuka, K., and Terabe, S. Evaluation of an atmospheric pressure chemical ionization interface for capillary electrophoresis�mass spectrometry. J. Pharm. Biomed. Anal. 30 (2003) 1889-1895. Tang, K., Lin, Y., Matson, D.W., Kim, T., and Smith, R.D. Generation of multiple electrosprays using microfabricated emitter arrays for improved mass spectrometric sensitivity. Anal. Chem. 73 (2001) 1658-1663.
Taylor, G.E. Determination of impurities in clodronic acid by anion-exchange chromatography. J. Chromatogr. A 720 (1997) 261-271. Terry, S.C. and Angell, J.B. A column gas chromatography system on a single wafer of silicon. Theory, Des. Biomed. Appl. Solid State Chem. Sens., Workshop (1978), Meeting date 1977, p. 207-218.
Tetler, L.W., Cooper, P.A., and Powell, B. Influence of capillary dimensions on the performance of a coaxial capillary electrophoresis�electrospray mass spectrometry interface. J. Chromatogr. A 700 (1995) 21-26. Thomas, J.J., Shen, Z., Blackledge, R., and Siuzdak, G. Desorption�ionization on silicon mass spectrometry: An application in forensics. Anal. Chim. Acta 442 (2001) 183-190. Thompson, R., Grinberg, N., Perpall, H., Bicker, G., and Tway, P. Separation of organophosphonates by ion chromatography with indirect photometric detection. J. Liq. Chromatogr. 17 (1994) 2511-2531. Tomer, K.B., Deterding, L.J., and Parker, C.E. in High-Performance Capillary Electrophoresis. Theory, Techniques and Applications, Khaledi, M.G. (Ed.). John Wiley and Sons Inc., New York, U.S.A., 1998, p. 409-415.
Tsai, E.W., Ip, D.P., and Brooks, M.A. Determination of alendronate in pharmaceutical dosage formulations by ion chromatography with conductivity detection. J. Chromatogr. 596 (1992) 217-224. Tsai, E.W., Chamberlin, S.D., Forsyth, R.J., Bell, C., Ip, D.P., and Brooks, M.A. Determination of bisphosphonate drugs in pharmaceutical dosage formulations by ion chromatography with indirect UV detection. J. Pharm. Biomed. Anal. 8 (1994) 983-991. Usui, T., Watanabe, T., and Higuchi, S. Determination of a new bisphosphonate, YM175, in plasma, urine and bone by high-performance liquid chromatography with electrochemical detection. J. Chromatogr. 584 (1992) 213-220. Valaskovic, G.A., Kelleher, N.L., Little, D.P., Aaserud, D.J., and McLafferty, F.W. Attomole-sensitivity electrospray source for large-molecule mass spectrometry. Anal. Chem. 67 (1995) 3802-3805. Valaskovic, G.A. and McLafferty, F.W. Long-lived metallized tips for nanoliter electrospray electrospray mass spectrometry. J. Am. Soc. Mass Spectrom. 7 (1996) 1270-1272. Vepsäläinen, J., Nupponen, H., Pohjala, E., Ahlgren, M., and Vainiotalo, P. Bisphosphonic compounds. Part 3. Preparation and identification of tetraalkyl methylene- and (Ŭ-halomethylene)bisphosphonates by mass spectrometry, NMR spectroscopy and X-ray crystallography. J. Chem. Soc. Perkin Trans. 2 (1992a) 835-842.
Vepsäläinen, J., Pohjala, E., Nupponen, H., Vainiotalo, P., and Ahlgren, M. Bisphosphonic compounds. IV. Preparation and identification of mixed tetraalkyl methylene- and (dichloromethylene)bisphosphonates by NMR
85
spectroscopic, mass spectrometric and X-ray crystallographic studies. Phosphorus Sulfur Silicon 70 (1992b) 183-203.
Virtanen, V. and Lajunen, L.H.J. High-performance liquid chromatographic method for simultaneous determination of clodronate and some clodronate esters. J. Chromatogr. 617 (1993) 291-298. Von Heeren, F., Verpoorte, E., Manz, A., and Thormann, W. Micellar electrokinetic chromatography separations and analyses of biological samples on a cyclic planar microstructure. Anal. Chem. 68 (1996) 2044-2053. Vrouwe, E.X., Gysler, J., Tjaden, U.R., and van der Greef, J. Chip-based capillary electrophoresis with an electrodeless nanospray interface. Rapid Commun. Mass Spectrom. 14 (2000) 1682-1688. Vuorensola, K., Sirén, H., Kostiainen, R., and Kotiaho, T. Analysis of catecholamines by capillary electrophoresis and capillary electrophoresis�nanospray mass spectrometry. Use of aqueous and non-aqueous solutions compared with physical parameters. J. Chromatogr. A 979 (2002) 179-189. Wachs, T., Sheppard, R.L., and Henion, J. Design and applications of a self-aligning liquid junction-electrospray interface for capillary electrophoresis�mass spectrometry. J. Chromatogr. B 685 (1996) 335-342. Wahl, J.H., Gale, D.C., and Smith, R.D. Sheathless capillary electrophoresis�electrospray ionization mass spectrometry using 10 µm I.D. capillaries: Analyses of tryptic digests of cytochrome c. J. Chromatogr. A 659 (1994) 217-222. Walker, P.A., Morris, M.D., Burns, M.A., and Johnson, B.N. Isotachophoretic separations on a microchip. Normal Raman spectroscopy detection. Anal. Chem. 70 (1998) 3766-3769. Wang, G. and Cole, R.B. in Electrospray Ionization Mass Spectrometry. Fundamentals, Instrumentation and Applications, Cole, R.B (Ed.). John Wiley and Sons, Inc., New York, U.S.A., 1997, p. 138-172. Wang, C., Oleschuk, R., Ouchen, F., Li, J., Thibault, P., and Harrison, D.J. Integration of immobilized trypsin bead beds for protein digestion within a microfluidic chip incorporating capillary electrophoresis separations and an electrospray mass spectrometry interface. Rapid Commun. Mass Spectrom. 14 (2000) 1377-1383. Wang, S.-C., Perso, C.E., and Morris, M.D. Effects of alkaline hydrolysis and dynamic coating on the electroosmotic flow in polymeric microfabricated channels. Anal. Chem. 72 (2000) 1704-1706.
Waterwal, J.C.M., Bestebreurtje, P., Lingeman, H., Versluis, C., Heck, A.J.R., Bult, A., and Underberg, W.J.M. Robust and cost-effective capillary electrophoresis�mass spectrometry interfaces suitable for combination with on-line analysis preconcentration. Electrophoresis 22 (2001) 2701-2708. Wei, J., Buriak, J.M., and Siuzdak, G. Desorption�ionization mass spectrometry on porous silicon. Nature 399 (1999) 243-246. Wen, J., Lin, Y., Xiang, F., Matson, D.W., Udseth, H.R., and Smith, R.D. Microfabricated isoelectric focusing device for direct electrospray ionization�mass spectrometry. Electrophoresis 21 (2000) 191-197. Wetterhall, M., Nilsson, S., Markides, K.E., and Bergquist, J. A conductive polymeric material used for nanospray needle and low-flow sheathless electrospray ionization applications. Anal. Chem. 74 (2002) 239-245.
Wheat, T.E., Lilley, K.A., and Banks, J.F. Capillary electrophoresis with electrospray mass spectrometry for low-molecular-mass compounds. J. Chromatogr. A 781 (1997) 99-105. Wilm, M. and Mann, M. Analytical properties of the nanoelectrospray ion source. Anal. Chem. 68 (1996) 1-8. Woolley, A.T. and Mathies, R.D. Ultra-high speed DNA sequencing using capillary electrophoresis chips. Anal. Chem. 67 (1995) 3676-3680. Wu, X., Hosaka, A., and Hobo, T. An on-line electrophoretic concentration method for capillary electrophoresis of proteins. Anal. Chem. 70 (1998) 2081-2084. Xue, Q., Foret, F., Dunayevskiy, Y.M., Zavracky, P.M., McGruer, N.E., and Karger, B.L. Multichannel microchip electrospray mass spectrometry. Anal. Chem. 69 (1997) 426-430.
86
87
Yoon, H.J., Kim, J.H., Choi, E.S., Yang, S.S., and Jung, K.W. Fabrication of a novel micro time-of-flight mass spectrometer. Sens. Actuators A 97-98 (2002) 441-447. Yuan, C.-H. and Shiea, J. Sequential electrospray analysis using sharp-tip channels fabricated on a plastic chip. Anal. Chem. 73 (2001) 1080-1083. Zeller, M., Kessler, R., Manz, H.J., and Székely, G. Determination of disodium 3-amino-1-hydroxypropylidene-1,1-bisphosphonate pentahydrate. J. Chromatogr. 545 (1991) 421-425. Zhang, B., Liu, H., Karger, B.L., and Foret, F. Microfabricated devices for capillary electrophoresis�electrospray mass spectrometry. Anal. Chem. 71 (1999) 3258-3264. Zhang, B., Foret, F., and Karger, B.L. A microdevice with integrated liquid junction for facile peptide and protein analysis by capillary electrophoresis/electrospray mass spectrometry. Anal. Chem. 72 (2000) 1015-1022.
Zhang, C.-X. and Manz, A. Narrow sample channel injectors for capillary electrophoresis on microchips. Anal. Chem. 73 (2001) 2656-2662. Zhang, Q., Zou, H., Guo, Z., Zhang, Q., Chen, X., and Ni, J. Matrix-assisted laser desorption/ionization mass spectrometry using porous silicon and silica gel as matrix. Rapid Commun. Mass Spectrom. 15 (2001) 217-223. Zhao, X.-M., Xia, Y., and Whitesides, G.M. Soft lithographic methods for nano-fabrication. J. Mater. Chem. 7 (1997) 1069-1074. Zhou, S., Prebyl, B.S., and Cook, K.D. Profiling pH changes in the electrospray plume. Anal. Chem. 74 (2002) 4885-4888. Zhu, X., Thiam, S., Valle, B.C., and Warner, I.M. A colloidal graphite-coated emitter for sheathless capillary electrophoresis/nanoelectrospray ionization mass spectrometry. Anal. Chem. 74 (2002) 5405-5409.