backday xebia - chercher la performance efficacement
TRANSCRIPT
#backdaybyxebia
William Montaz - Jean-Pascal Thiery
Construire le SI de demain
Chercher la performance efficace
#backdaybyxebia#perfEfficace @willymontaz @jpthiery
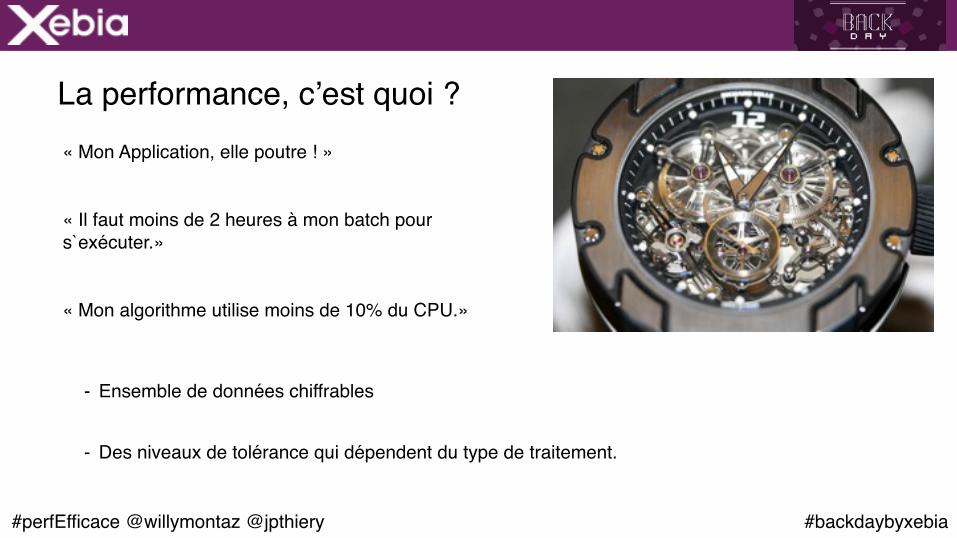
La performance, c’est quoi ?« Mon Application, elle poutre ! »
« Il faut moins de 2 heures à mon batch pour s`exécuter.»
« Mon algorithme utilise moins de 10% du CPU.»
- Ensemble de données chiffrables
- Des niveaux de tolérance qui dépendent du type de traitement.
#backdaybyxebia#perfEfficace @willymontaz @jpthiery
La performance, pourquoi ?
Make it work
Make it right
Make it fast
#backdaybyxebia#perfEfficace @willymontaz @jpthiery
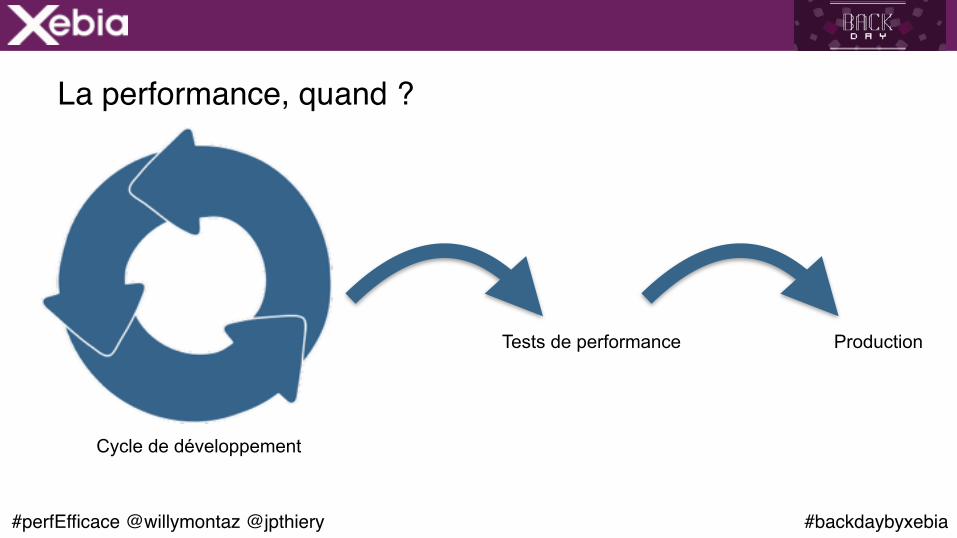
La performance, quand ?
Tests de performance Production
Cycle de développement
#backdaybyxebia#perfEfficace @willymontaz @jpthiery
La performance, comment ? L’environnement :
#backdaybyxebia#perfEfficace @willymontaz @jpthiery
La performance, comment ? L’environnement, les extras :
JMX
#backdaybyxebia#perfEfficace @willymontaz @jpthiery
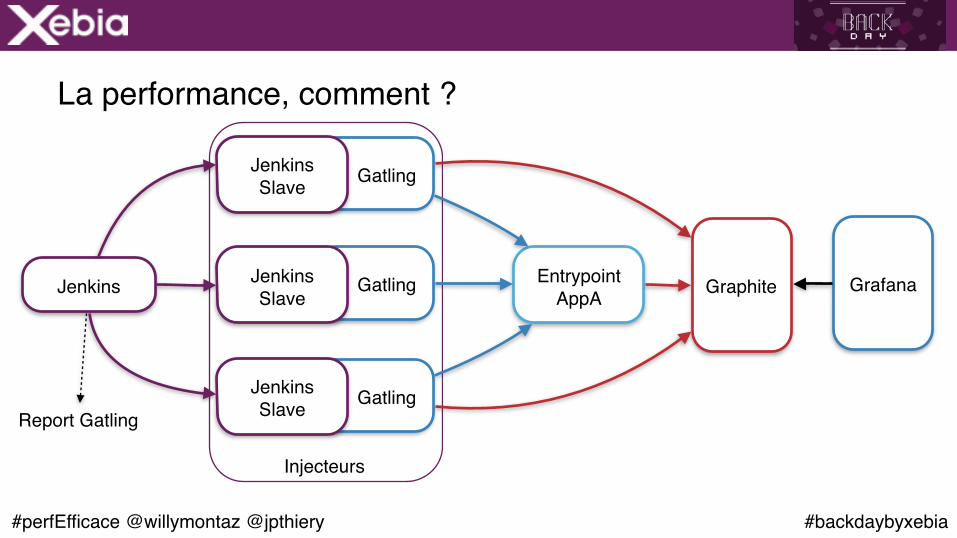
Injecteurs
Graphite
Gatling
Gatling
Gatling
La performance, comment ?
Jenkins
JenkinsSlave
JenkinsSlave
JenkinsSlave
EntrypointAppA
Grafana
Report Gatling

#backdaybyxebia
Une démarche, quelques idées
#backdaybyxebia
BIG THANKSKodewerk, Kirk Pepperdine
Java Performance Tuning
#backdaybyxebia
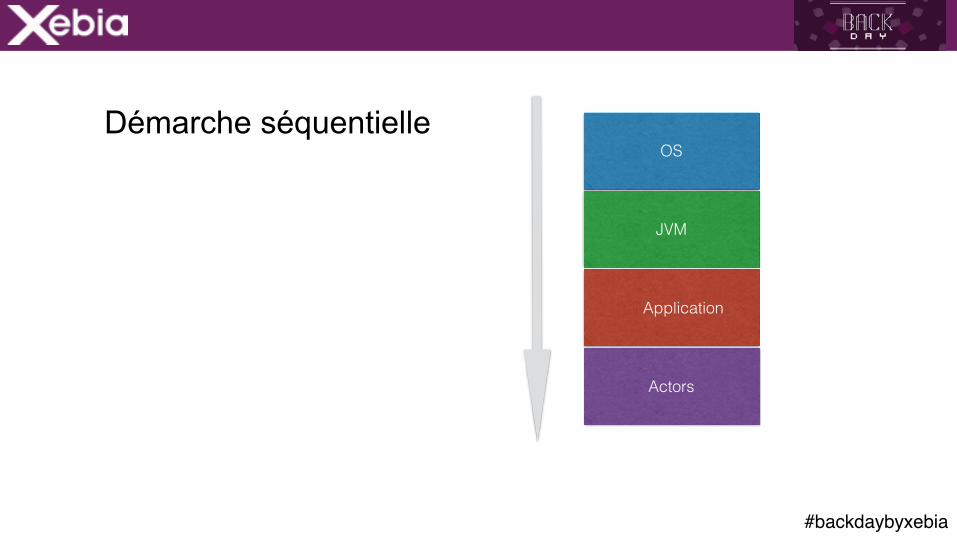
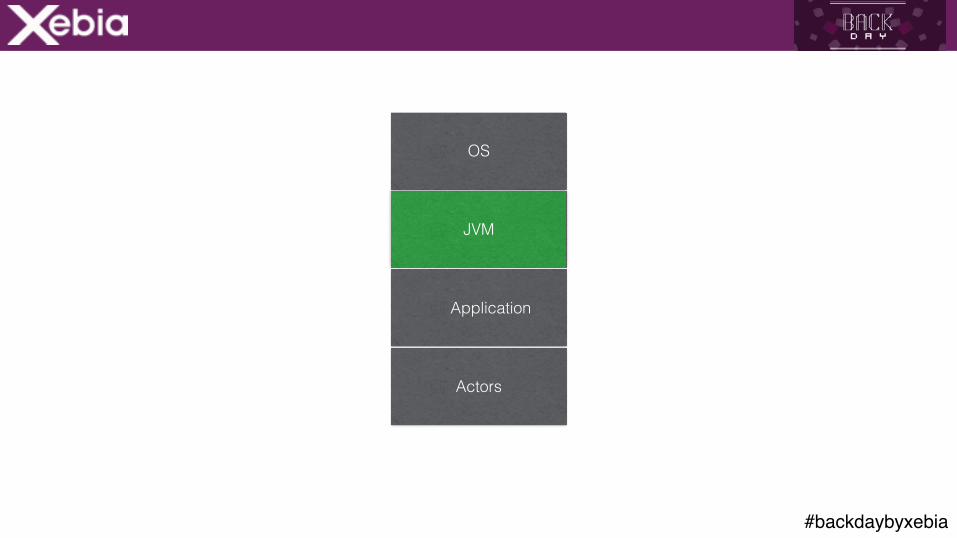
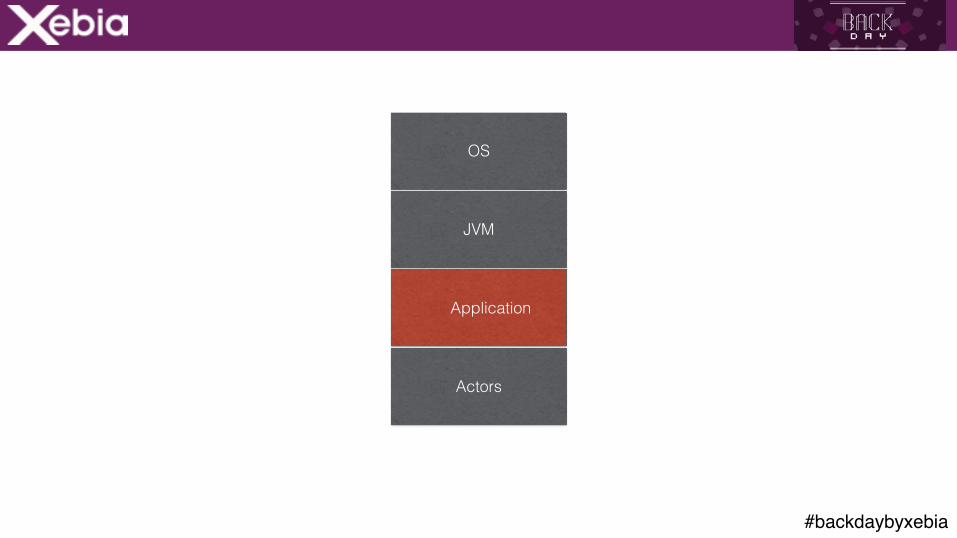
OS
JVM
Application
Actors
Démarche séquentielle
#backdaybyxebia
OS
JVM
Application
Actors
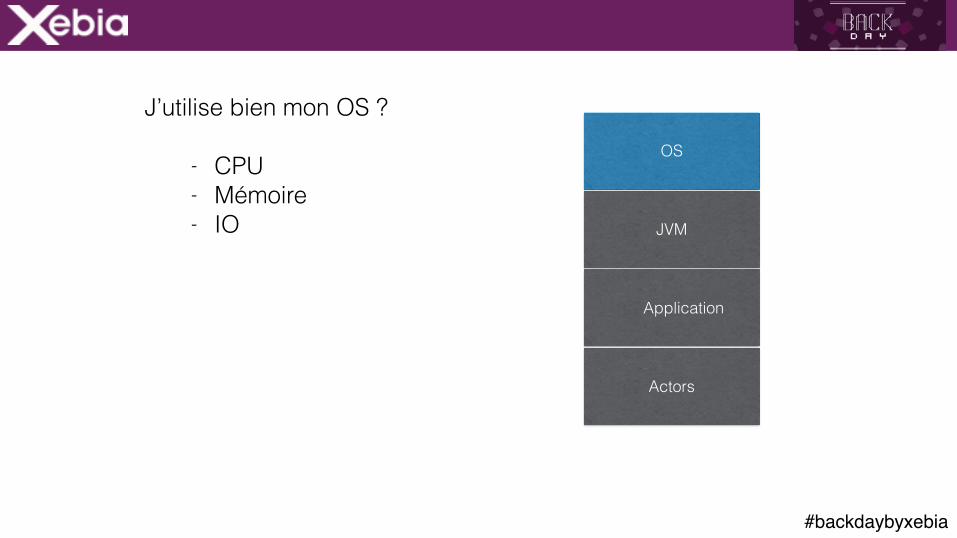
J’utilise bien mon OS ?
- CPU - Mémoire - IO
#backdaybyxebia
OS
JVM
Application
Actors
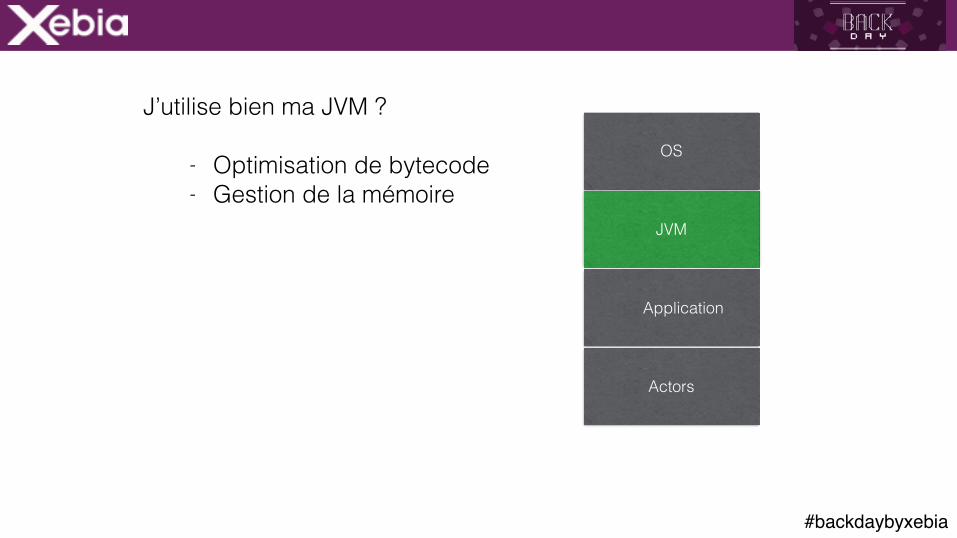
J’utilise bien ma JVM ?
- Optimisation de bytecode - Gestion de la mémoire
#backdaybyxebia
OS
JVM
Application
Actors
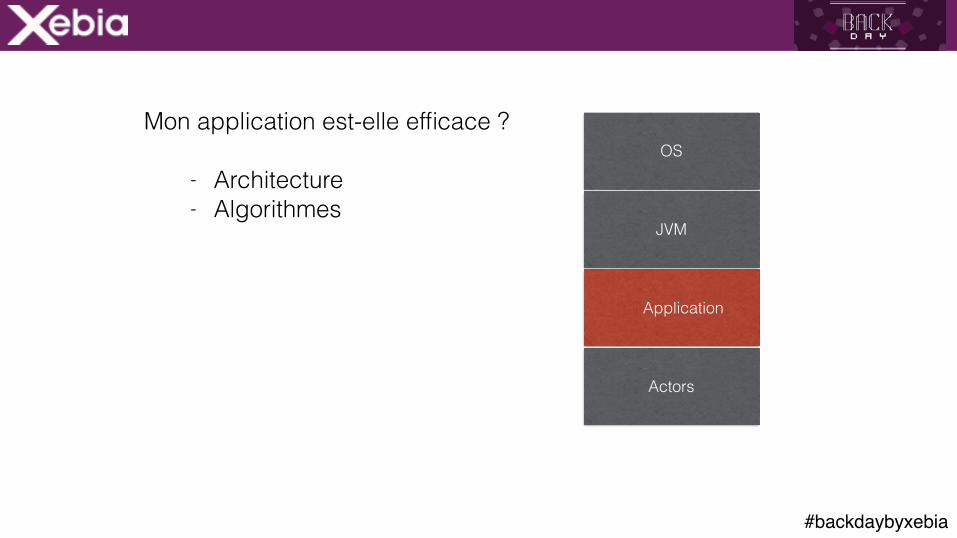
Mon application est-elle efficace ?
- Architecture - Algorithmes
#backdaybyxebia
OS
JVM
Application
Actors
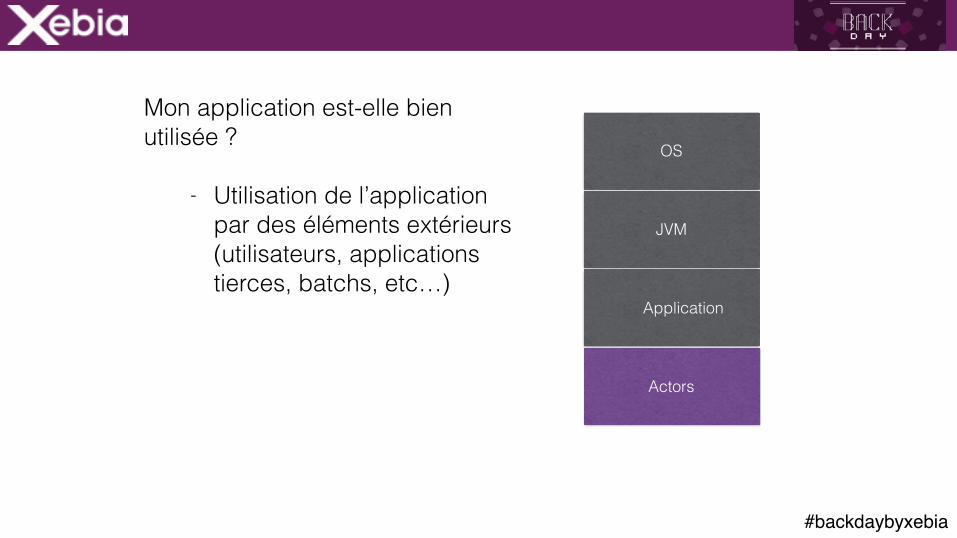
Mon application est-elle bien utilisée ?
- Utilisation de l’application par des éléments extérieurs (utilisateurs, applications tierces, batchs, etc…)
#backdaybyxebia
OS
JVM
Application
Actors

#backdaybyxebia
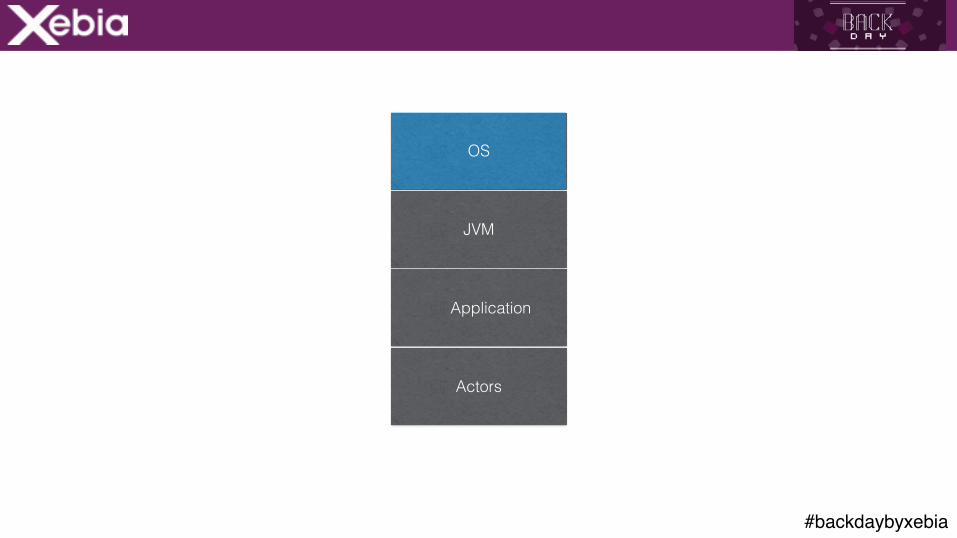
OS
2 questions

#backdaybyxebia
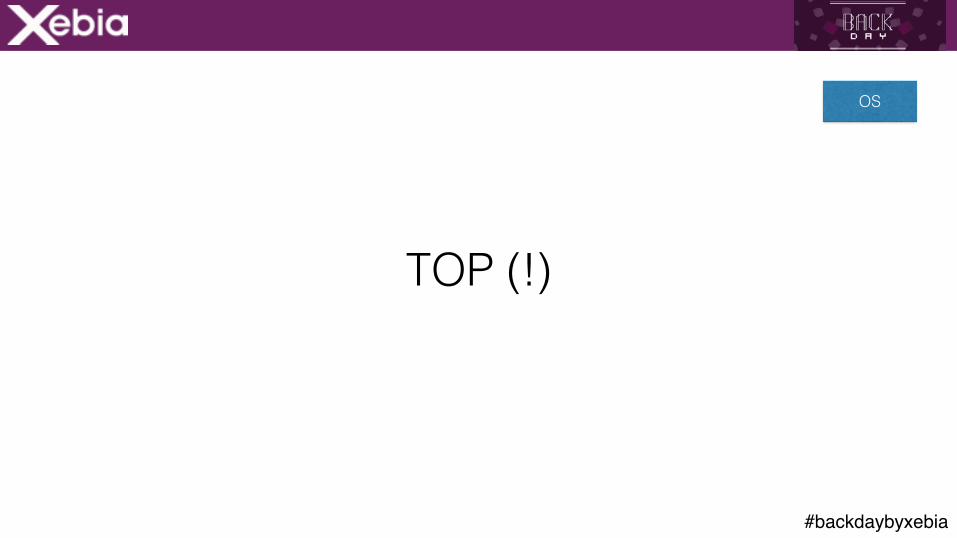
Suis-je seul ?
OS
#backdaybyxebia
TOP (!)
OS
#backdaybyxebia
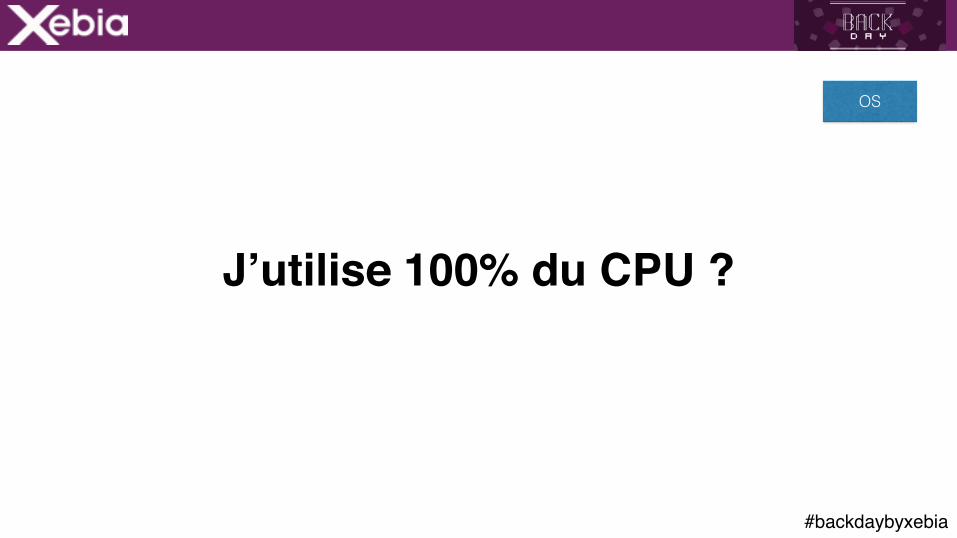
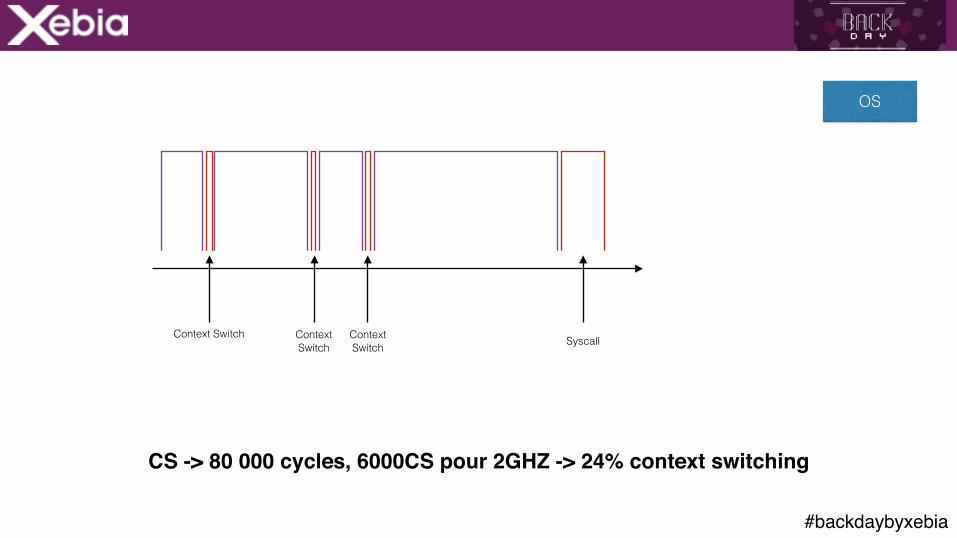
J’utilise 100% du CPU ?
OS
#backdaybyxebia
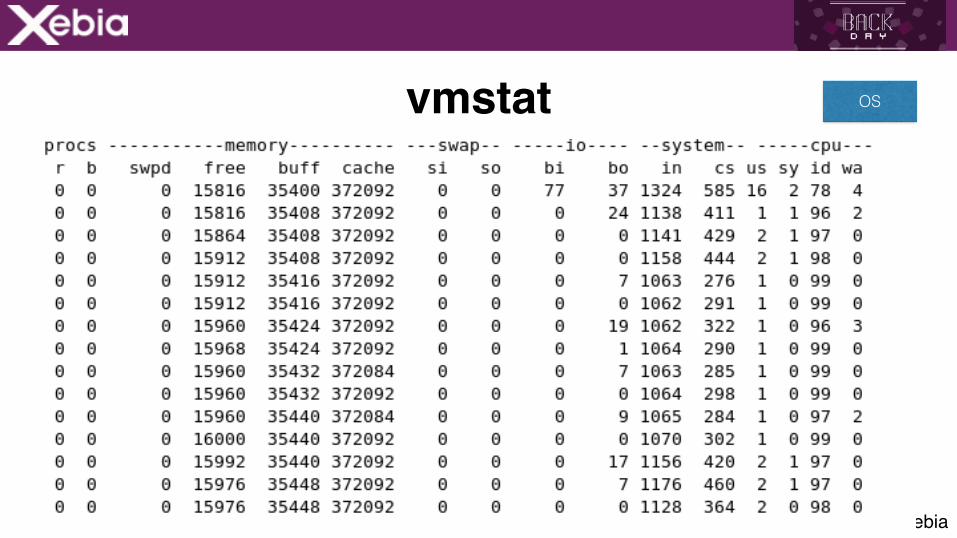
CS -> 80 000 cycles, 6000CS pour 2GHZ -> 24% context switching
Context Switch Context Switch
Context Switch
OS
Syscall
#backdaybyxebia
context switch ?SchedulingLockingI/OSyscall
OS
#backdaybyxebia
context switch ?SchedulingLockingI/OSyscall
OS
+10% CPU Kernel space -> Problème
#backdaybyxebia
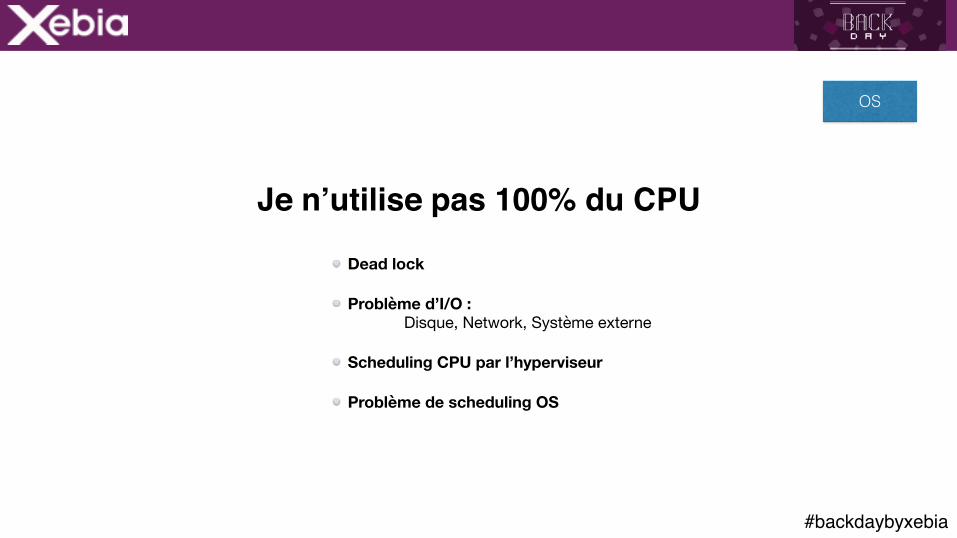
Dead lock
Problème d’I/O : Disque, Network, Système externe
Scheduling CPU par l’hyperviseur
Problème de scheduling OS
Je n’utilise pas 100% du CPU
OS
#backdaybyxebia
vmstat OS
#backdaybyxebia
OS
JVM
Application
Actors
#backdaybyxebia
HotSpot
JVM
#backdaybyxebia
JIT Compiler
JVM
#backdaybyxebia
JIT Compiler => 10 000 appels (CompileThreshold)
JVM
#backdaybyxebia
Huge Methods
JVM
#backdaybyxebia
Huge Methods => 8k bytecode, pas de compilation !
JVM
#backdaybyxebia
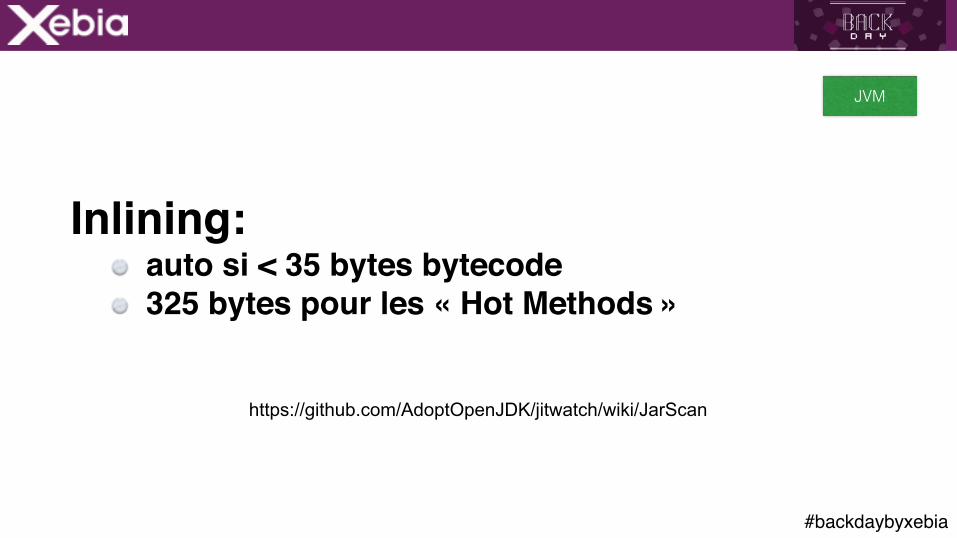
Inlining
JVM
#backdaybyxebia
Inlining: auto si < 35 bytes bytecode325 bytes pour les « Hot Methods »
JVM
https://github.com/AdoptOpenJDK/jitwatch/wiki/JarScan
#backdaybyxebia
Call Stack & Récursivité
JVM
#backdaybyxebia
Chargement/Déchargement de classloader
JVM

#backdaybyxebia
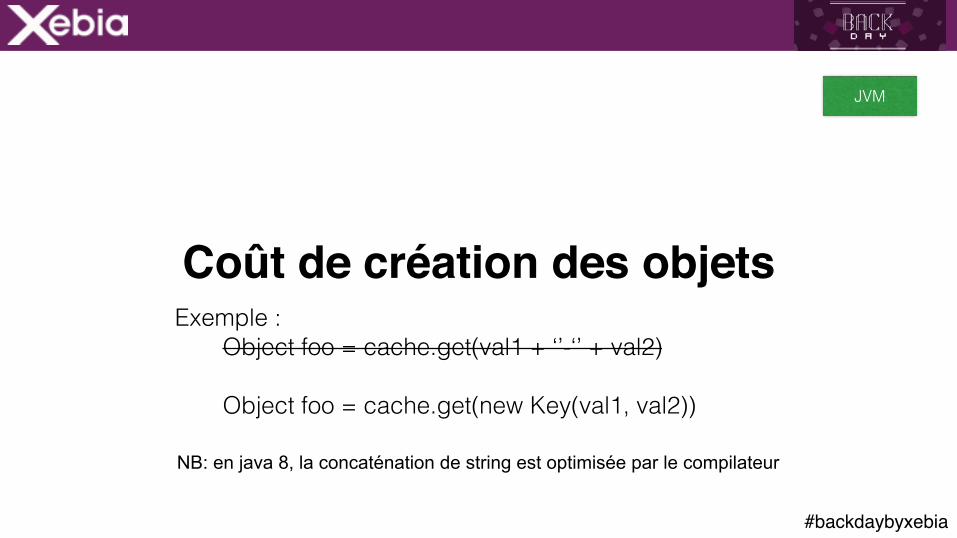
Coût de création des objets
JVM

#backdaybyxebia
Coût de création des objetsExemple :
Object foo = cache.get(val1 + ‘’-‘’ + val2)
JVM
#backdaybyxebia
Coût de création des objetsExemple :
Object foo = cache.get(val1 + ‘’-‘’ + val2)
Object foo = cache.get(new Key(val1, val2))
JVM
NB: en java 8, la concaténation de string est optimisée par le compilateur
#backdaybyxebia
Garbage Collection
JVM
#backdaybyxebia
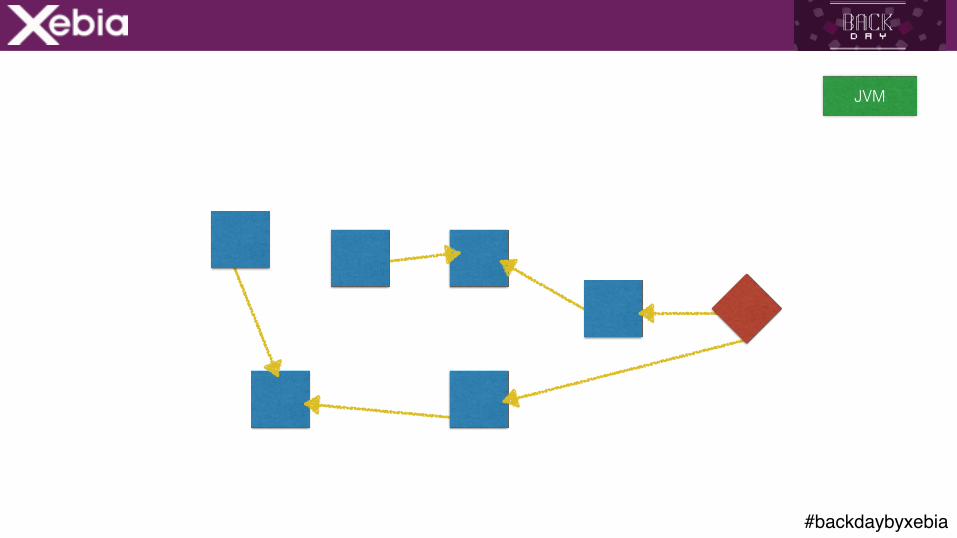
Mark & Sweep
JVM
#backdaybyxebia
JVM
#backdaybyxebia
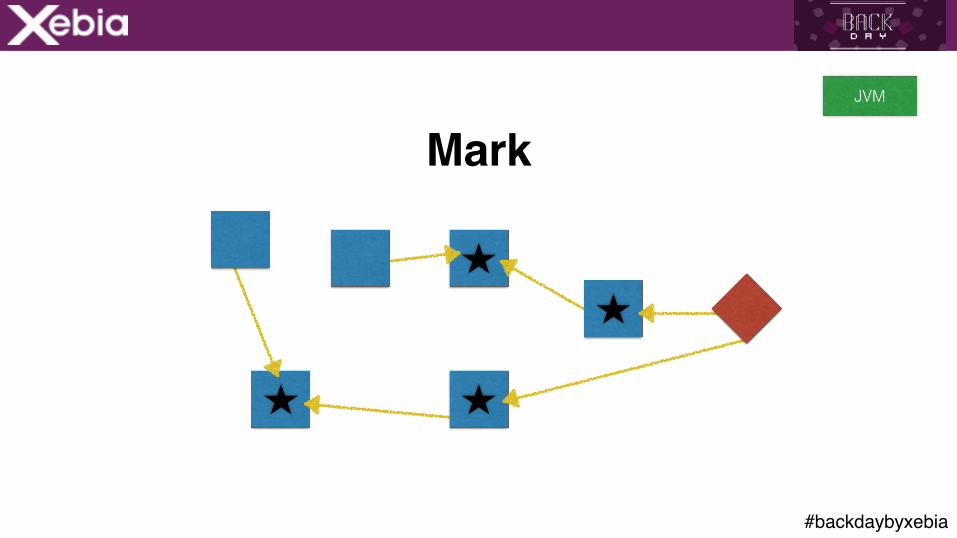
MarkJVM

#backdaybyxebia
SweepJVM

#backdaybyxebia
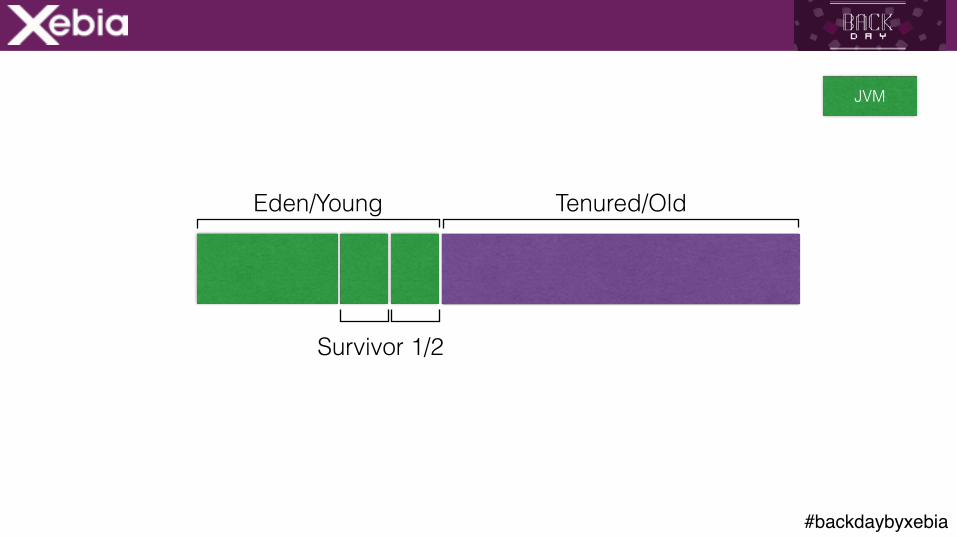
Hypothèse générationnelle
Beaucoup d’objets sont transients Seulement quelques objets ont une longue durée de vie
JVM
#backdaybyxebia
Eden/Young Tenured/Old
Survivor 1/2
JVM

#backdaybyxebia
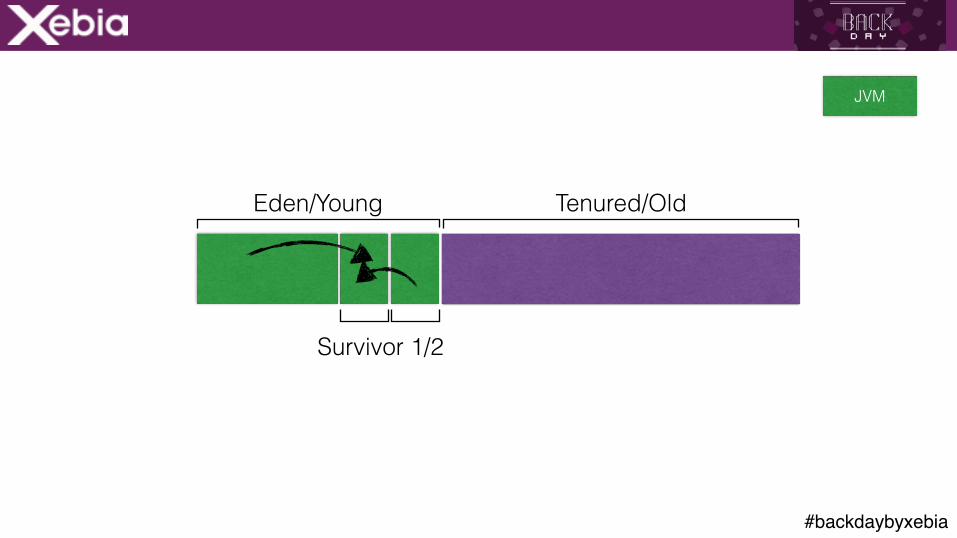
Eden/Young Tenured/Old
Survivor 1/2
JVM
#backdaybyxebia
Eden/Young Tenured/Old
Survivor 1/2
JVM
#backdaybyxebia
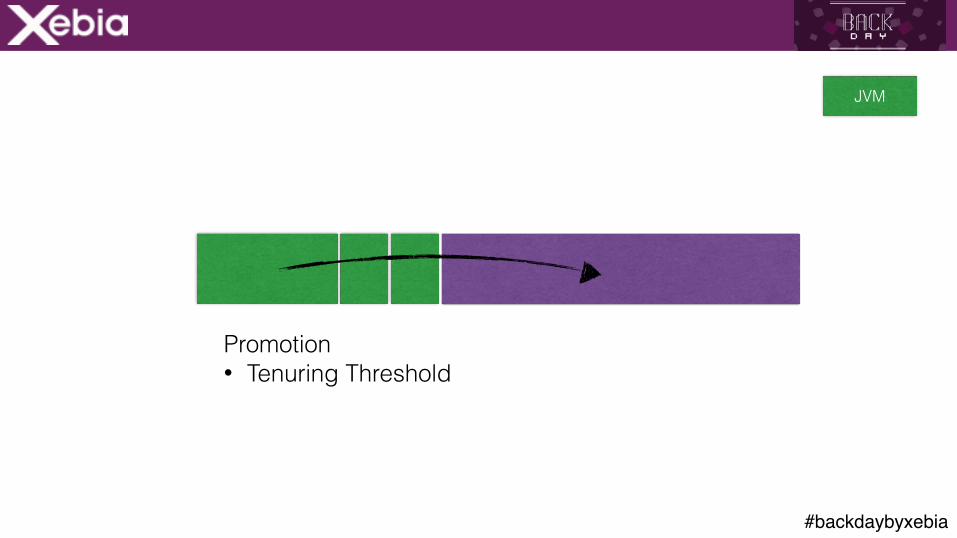
Promotion • Tenuring Threshold
JVM
#backdaybyxebia
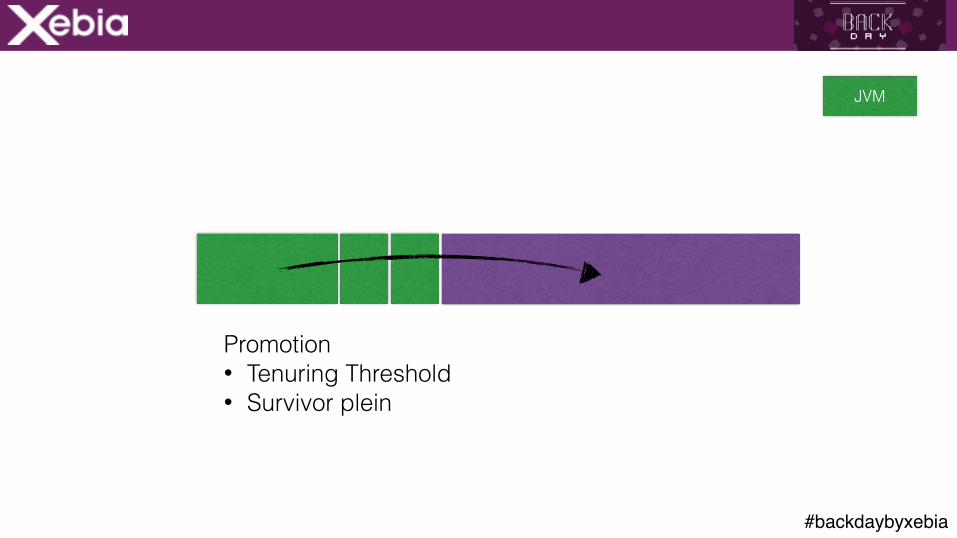
Promotion • Tenuring Threshold • Survivor plein
JVM

#backdaybyxebia
GC Roots ?
JVM
#backdaybyxebia
GC Roots ?stack frames
JVM

#backdaybyxebia
GC Roots ?stack frames References JNI
JVM
#backdaybyxebia
GC Roots ?stack frames References JNI Class loaders
JVM
#backdaybyxebia
GC Roots ?stack frames References JNI Class loaders Objets dans le Tenured Space !
JVM
#backdaybyxebia
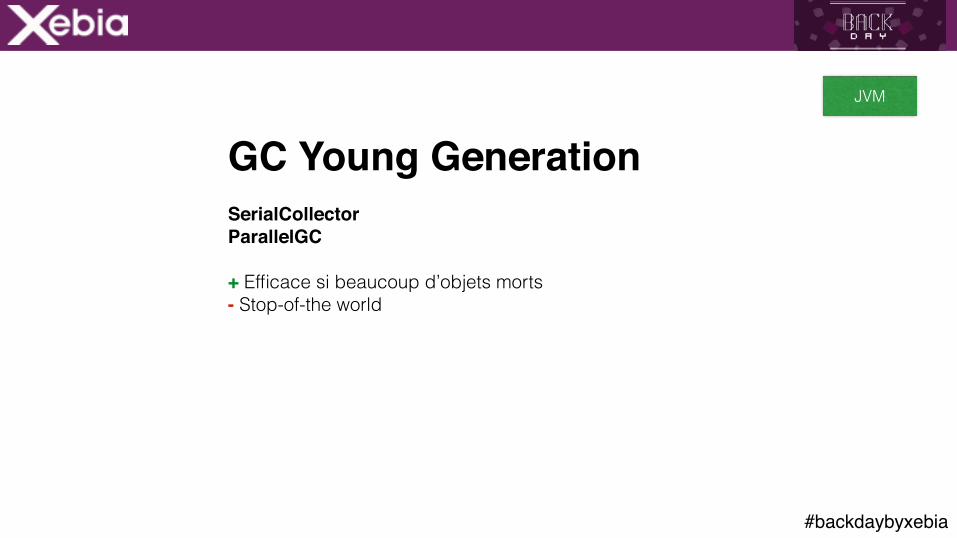
GC Young GenerationSerialCollectorParallelGC
+ Efficace si beaucoup d’objets morts - Stop-of-the world
JVM
#backdaybyxebia
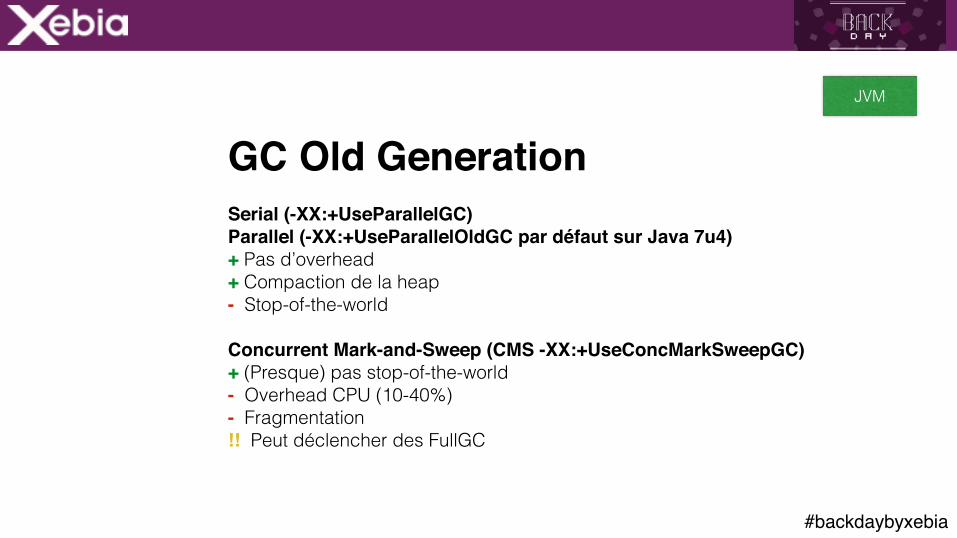
GC Old GenerationSerial (-XX:+UseParallelGC)Parallel (-XX:+UseParallelOldGC par défaut sur Java 7u4) + Pas d’overhead + Compaction de la heap - Stop-of-the-world
Concurrent Mark-and-Sweep (CMS -XX:+UseConcMarkSweepGC)+ (Presque) pas stop-of-the-world - Overhead CPU (10-40%) - Fragmentation !! Peut déclencher des FullGC
JVM
#backdaybyxebia
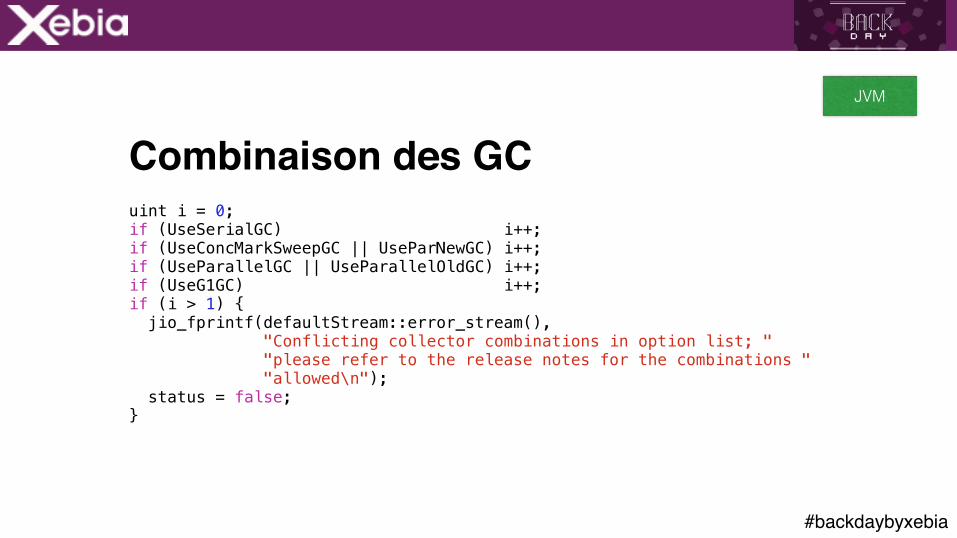
Combinaison des GCuint i = 0; if (UseSerialGC) i++; if (UseConcMarkSweepGC || UseParNewGC) i++; if (UseParallelGC || UseParallelOldGC) i++; if (UseG1GC) i++; if (i > 1) { jio_fprintf(defaultStream::error_stream(), "Conflicting collector combinations in option list; " "please refer to the release notes for the combinations " "allowed\n"); status = false; }
JVM
#backdaybyxebia
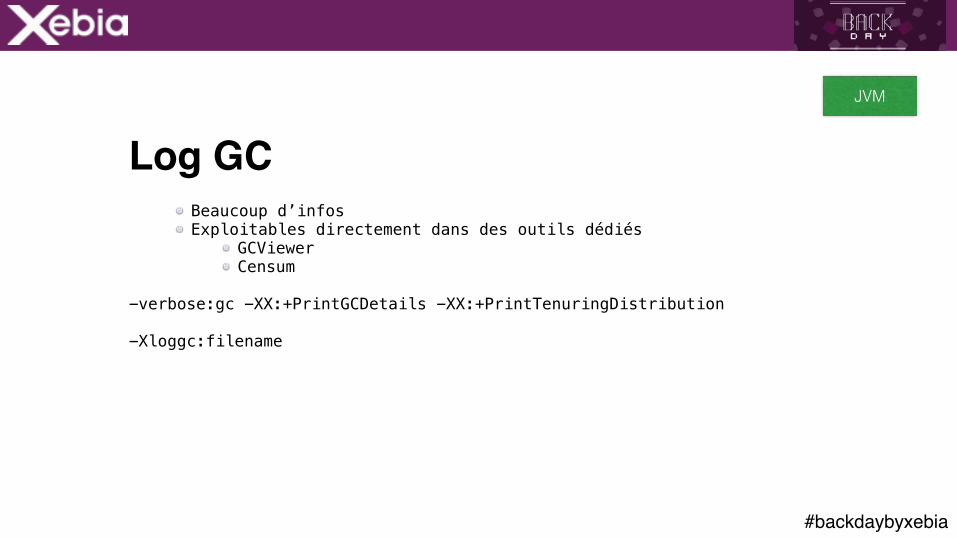
Log GCBeaucoup d’infos Exploitables directement dans des outils dédiés
GCViewer Censum
-verbose:gc -XX:+PrintGCDetails -XX:+PrintTenuringDistribution
-Xloggc:filename
JVM

#backdaybyxebia
Memory LeakJVM
#backdaybyxebia
Memory LeakHEAP DUMP -> Memory Analysis Tool
JVM
#backdaybyxebia
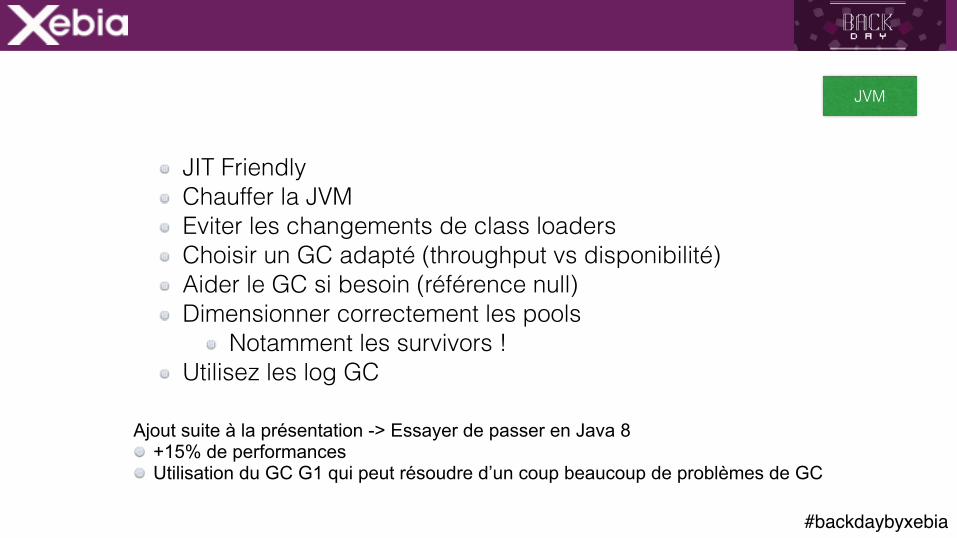
JIT Friendly Chauffer la JVM Eviter les changements de class loaders Choisir un GC adapté (throughput vs disponibilité) Aider le GC si besoin (référence null) Dimensionner correctement les pools
Notamment les survivors ! Utilisez les log GC
JVM
Ajout suite à la présentation -> Essayer de passer en Java 8 +15% de performances Utilisation du GC G1 qui peut résoudre d’un coup beaucoup de problèmes de GC
#backdaybyxebia
OS
JVM
Application
Actors
#backdaybyxebia
APP
Detecter les problèmes de lock
#backdaybyxebia
Detecter les problèmes de lock
THREAD DUMP !
APP
#backdaybyxebia
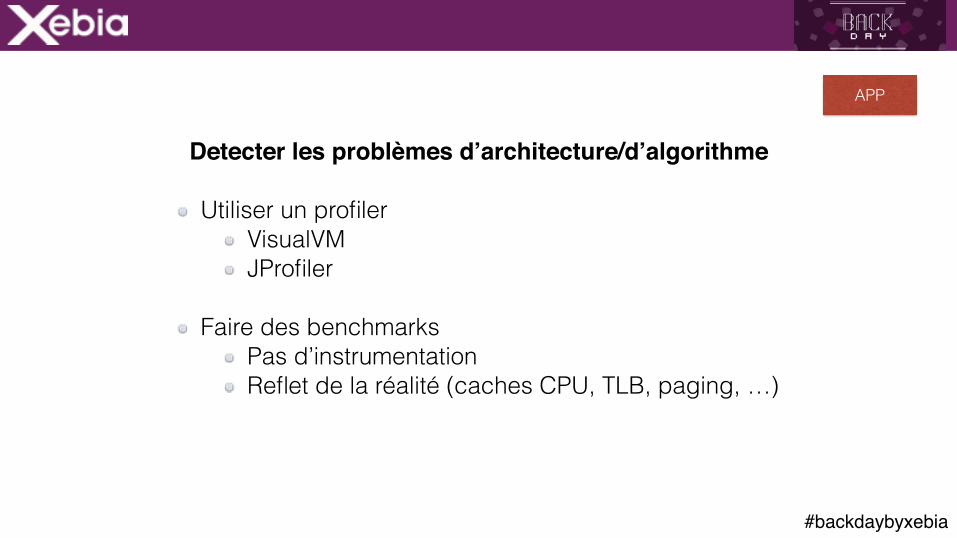
Detecter les problèmes d’architecture/d’algorithme
Utiliser un profiler VisualVM JProfiler
Faire des benchmarks Pas d’instrumentation Reflet de la réalité (caches CPU, TLB, paging, …)
APP
#backdaybyxebia
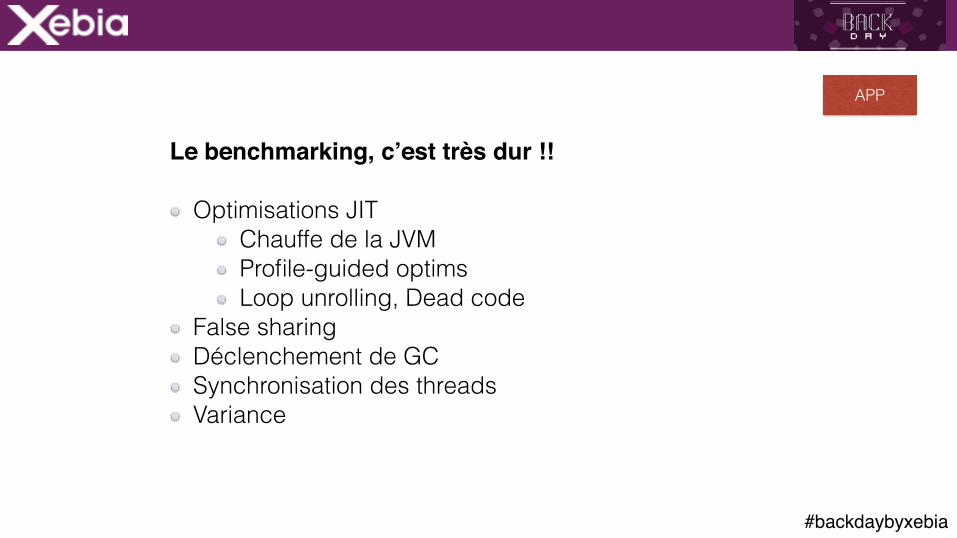
Le benchmarking, c’est très dur !!
Optimisations JIT Chauffe de la JVM Profile-guided optims Loop unrolling, Dead code
False sharing Déclenchement de GC Synchronisation des threads Variance
APP
#backdaybyxebia
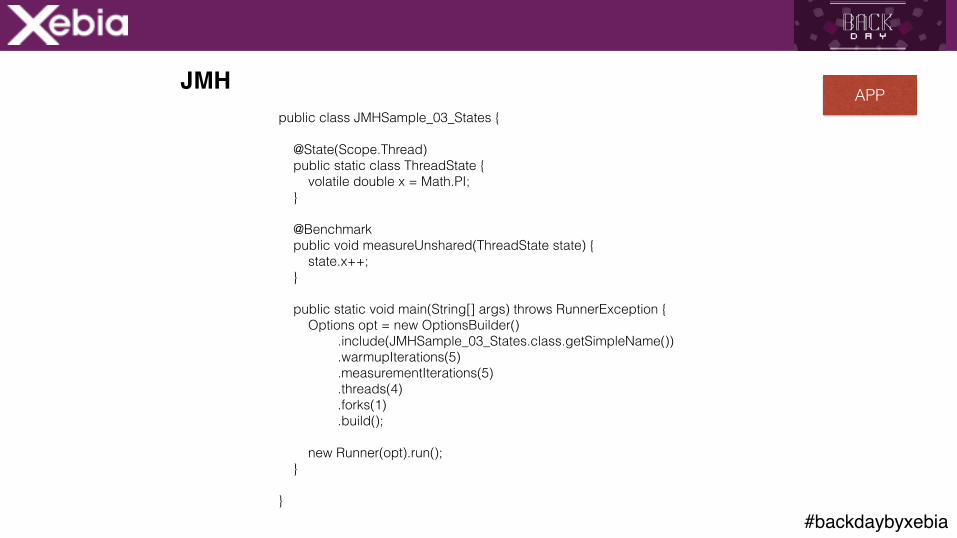
JMH
public class JMHSample_03_States {
@State(Scope.Thread) public static class ThreadState { volatile double x = Math.PI; }
@Benchmark public void measureUnshared(ThreadState state) { state.x++; }
public static void main(String[] args) throws RunnerException { Options opt = new OptionsBuilder() .include(JMHSample_03_States.class.getSimpleName()) .warmupIterations(5) .measurementIterations(5) .threads(4) .forks(1) .build();
new Runner(opt).run(); }
}
APP

#backdaybyxebia
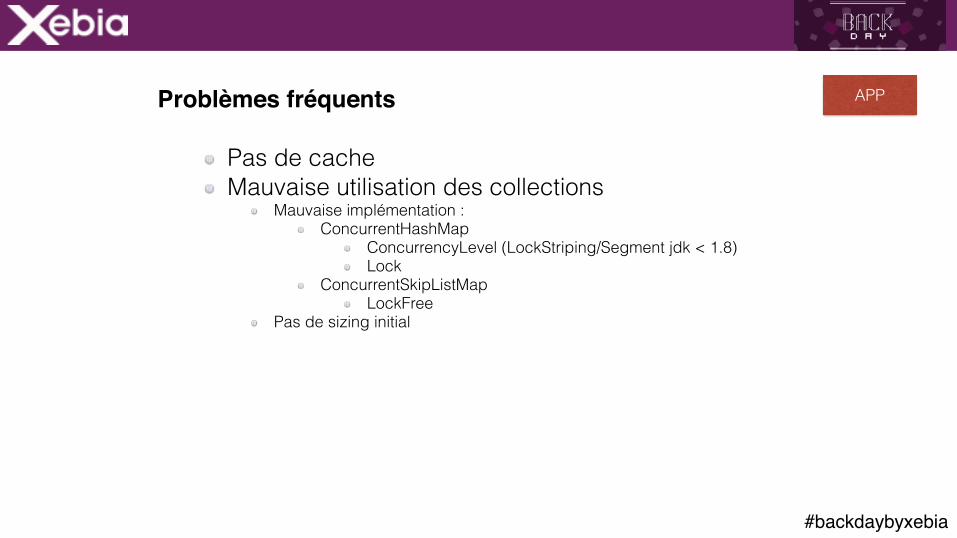
Problèmes fréquents
Pas de cache
APP
#backdaybyxebia
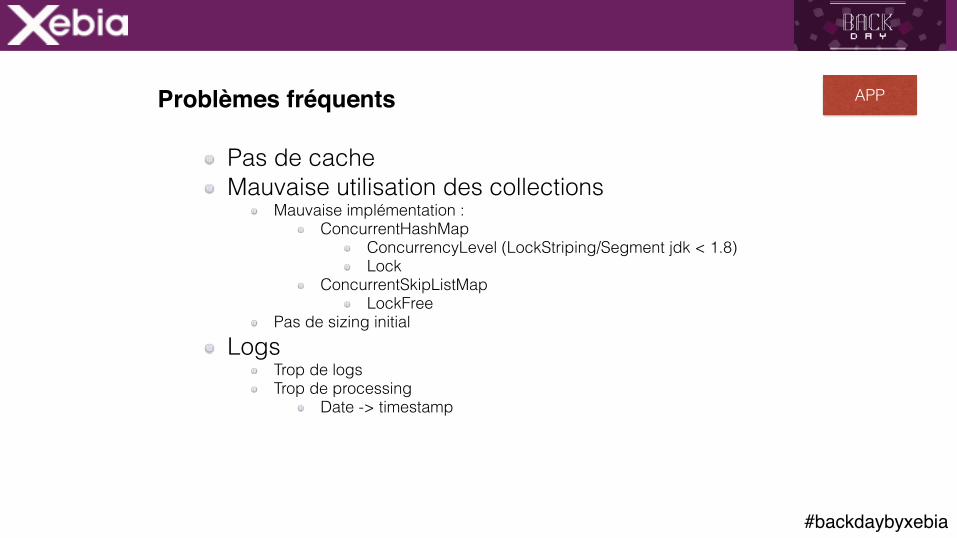
Problèmes fréquents
Pas de cache Mauvaise utilisation des collections
Mauvaise implémentation : ConcurrentHashMap
ConcurrencyLevel (LockStriping/Segment jdk < 1.8) Lock
ConcurrentSkipListMap LockFree
Pas de sizing initial
APP
#backdaybyxebia
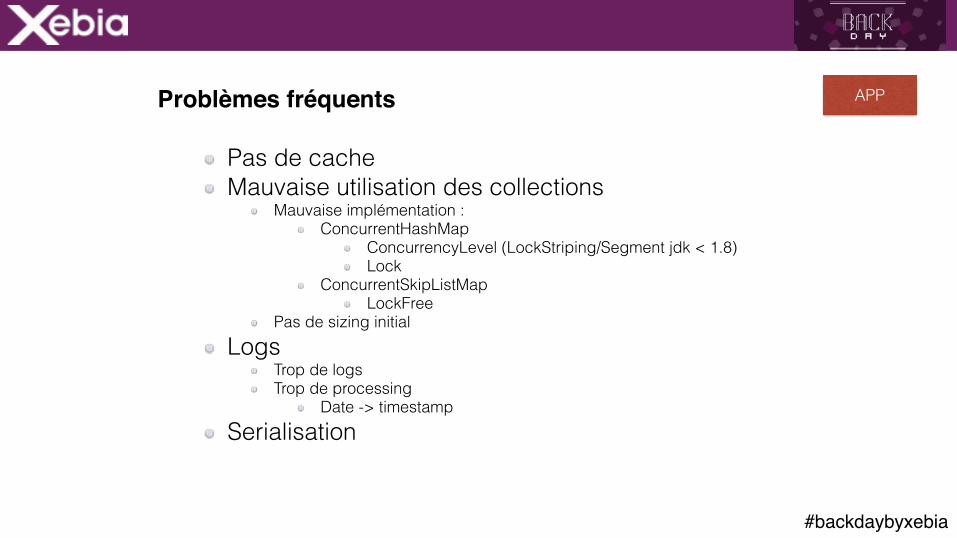
Problèmes fréquents
Pas de cache Mauvaise utilisation des collections
Mauvaise implémentation : ConcurrentHashMap
ConcurrencyLevel (LockStriping/Segment jdk < 1.8) Lock
ConcurrentSkipListMap LockFree
Pas de sizing initial Logs
Trop de logs Trop de processing
Date -> timestamp
APP
#backdaybyxebia
Problèmes fréquents
Pas de cache Mauvaise utilisation des collections
Mauvaise implémentation : ConcurrentHashMap
ConcurrencyLevel (LockStriping/Segment jdk < 1.8) Lock
ConcurrentSkipListMap LockFree
Pas de sizing initial Logs
Trop de logs Trop de processing
Date -> timestamp Serialisation
APP
#backdaybyxebia
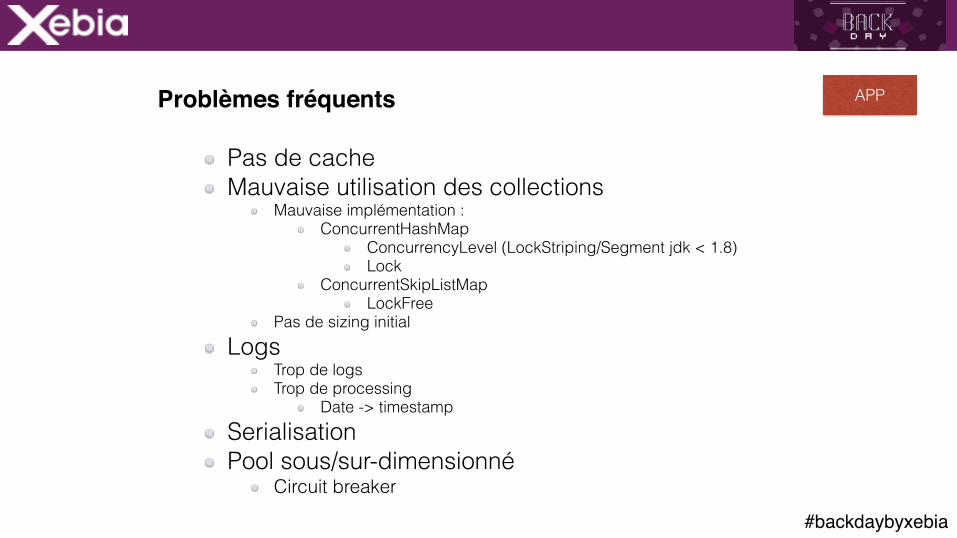
Problèmes fréquents
Pas de cache Mauvaise utilisation des collections
Mauvaise implémentation : ConcurrentHashMap
ConcurrencyLevel (LockStriping/Segment jdk < 1.8) Lock
ConcurrentSkipListMap LockFree
Pas de sizing initial Logs
Trop de logs Trop de processing
Date -> timestamp Serialisation Pool sous/sur-dimensionné
Circuit breaker
APP
#backdaybyxebia
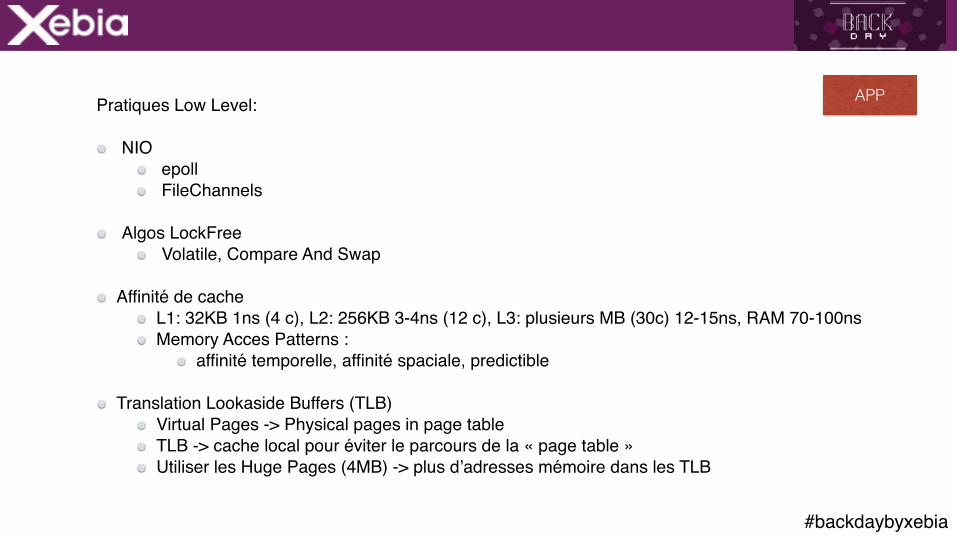
Pratiques Low Level:
NIOepollFileChannels
Algos LockFreeVolatile, Compare And Swap
Affinité de cacheL1: 32KB 1ns (4 c), L2: 256KB 3-4ns (12 c), L3: plusieurs MB (30c) 12-15ns, RAM 70-100nsMemory Acces Patterns :
affinité temporelle, affinité spaciale, predictible
Translation Lookaside Buffers (TLB)Virtual Pages -> Physical pages in page tableTLB -> cache local pour éviter le parcours de la « page table »Utiliser les Huge Pages (4MB) -> plus d’adresses mémoire dans les TLB
APP
#backdaybyxebia
http://openjdk.java.net/projects/code-tools/jmh/
http://www.7-cpu.com/cpu/SandyBridge.html
http://mechanical-sympathy.blogspot.fr/2013/07/java-garbage-collection-distilled.html
Dmitry Vyazelenko
http://martinfowler.com/articles/lmax.html
http://mechanical-sympathy.blogspot.fr/2012/08/memory-access-patterns-are-important.html
JDK (!)
Martin Thompson
Martin Fowler
Lecture