arc gis 92
TRANSCRIPT
8/8/2019 arc gis 92
http://slidepdf.com/reader/full/arc-gis-92 1/25
01-Introduction To GIS Mapping And Arcgis 9.2 Software.Doc Page 1 of 25
The Yale Map Collection
At Sterling Memorial Library130 Wall Street, Room 707
Stacey Maples – GIS Assistant
203-432-8269 / [email protected]/maps
Introduction to GIS Mapping and ESRI’s ArcGIS Software
n this exercise you are introduced to the ArcMap interface and some of the basic skills necessary to begin exploring geospatiaata and create simple maps. Once you have successfully completed this part of the tutorial, you should know:
• How to open ArcMap and a Map Document (.mxd)• How to examine your spatial data using ArcCatalog
• How to add spatial data to your Map Document
• How to add tabular data to a Map Document andturn it into spatial data
• How to join tabular data to geographic boundary files
• The difference between Data View and Layout View
• How to label Map Features
• How to alter Map Feature Symbology• How to add essential Map Elements (North Arrow
Legend, etc…) for effective map creation
• How to modify the properties of a data frame.
• How to set relative pathnames to allow you to moand share your Map Projects
• How to export your map to PDF and JPG
The Yale University GIS-L Listserv is an internal Universitymessage system, devoted to GIS use and issues at Yale.The list is the primary source for updates on software andcense server issues, data acquisitions and workshopnnouncements. All GIS users are encourages to sign upor the list. The GIS-L list is very lightly used, so that you
will not be overwhelmed with messages that are notelevant to you.
1. In your Web Browser, Go To the Map CollectionWebsite, at www.library.yale.edu/maps
2. Under the Quick Links section on the right,, Click on the “Sign up for the Yale GIS-L Mailing List”link to go to the GIS-L registration page.
3. Enter your Email Address and Choose aPassword.
Note: We suggest that you not select the Daily Digest feature.
4. Click on the Subscribe Button to finish.
You should receive a confirmation email shortly afterward, with instruction on how to use the GIS-L list.
The datasets used in this tutorial are available for download on the Map Collection Website. Feel free to download and use thutorial materials, as you wish, and to pass them along to interested colleagues.
1. Return to the Map Collection Homepage, in your Web Browser.
8/8/2019 arc gis 92
http://slidepdf.com/reader/full/arc-gis-92 2/25
01-Introduction To GIS Mapping And Arcgis 9.2 Software.Doc Page 2 of 25
The Yale Map Collection
At Sterling Memorial Library130 Wall Street, Room 707
Stacey Maples – GIS Assistant
203-432-8269 / [email protected]/maps
2. Under the Quick Links Section on the right, Click on the“Download Gis Workshop Materials” link.
3. Find the “Data” Link for the ArcGIS 9.2 “Introduction ToGIS Mapping And ESRI’s Arcgis Software” and Right- Click on the Link.
4. In Firefox, Select “Save Link As,” in Internet Explorer,
Select “Save Target As…”
5. Depending on your browser and setup, you may be offereda Browse Window, to select the folder into which you wantthe downloaded file placed. If so, Browse to a Folder onyour hard drive that you have write permission for. For thistutorial, we will assume that you are using the C:\tempfolder of the machine you are working on.
6. Clicking on the Create New Folder Button, Create a New Folder, using your initials as the name of the folder, so that you end up with a full path something like:C:\temp\ your_initials \
7. Save the Downloaded File to this New Folder.
You should now have a file called “01-Introduction to ArGIS_92.zip” in your new folder. It is nowecessary to decompress, or unzip, the tutorial data for use. Note that in Microsoft Windows XP and
Vista, it is possible to “Explore” a compressed file, as if it were a folder. ArcMap does not support thisype of browsing, so it is necessary to actually unzip the file for use. This part of the tutorial assumes thatou are using Windows’ built in Compressed File support.
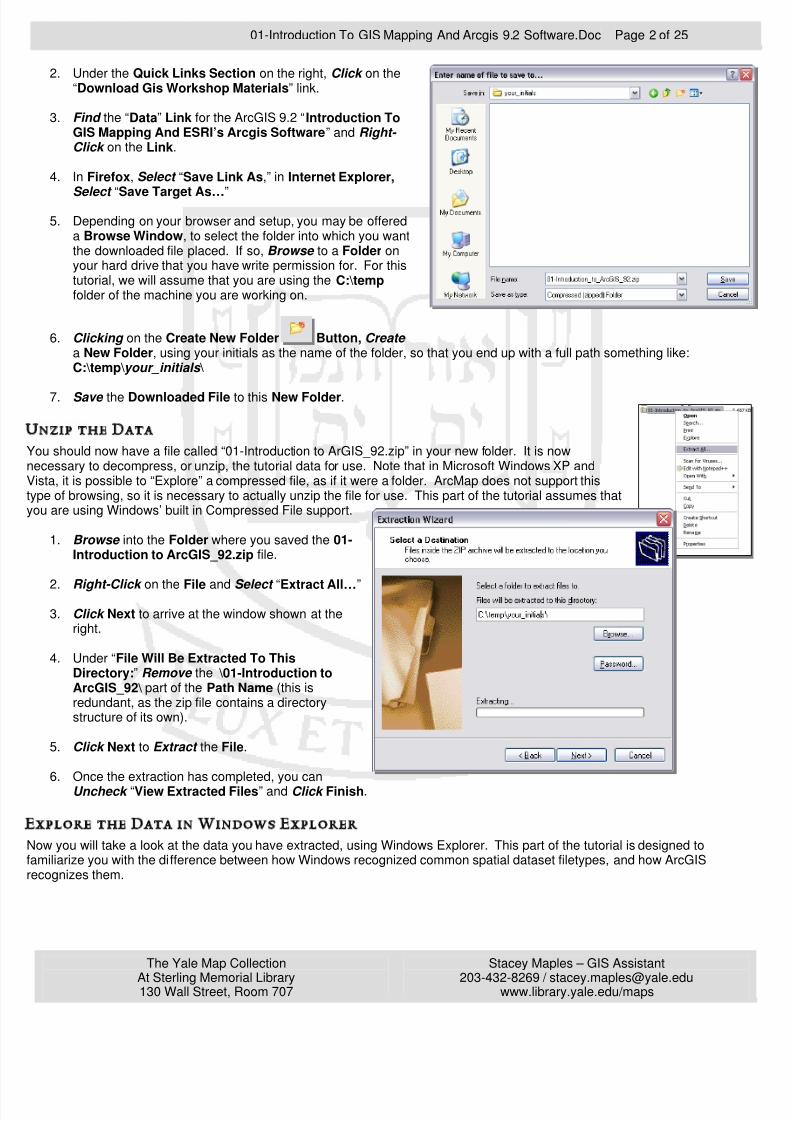
1. Browse into the Folder where you saved the 01-Introduction to ArcGIS_92.zip file.
2. Right-Click on the File and Select “Extract All…”
3. Click Next to arrive at the window shown at theright.
4. Under “File Will Be Extracted To ThisDirectory:” Remove the \01-Introduction toArcGIS_92\ part of the Path Name (this isredundant, as the zip file contains a directorystructure of its own).
5. Click Next to Extract the File.
6. Once the extraction has completed, you canUncheck “View Extracted Files” and Click Finish.
Now you will take a look at the data you have extracted, using Windows Explorer. This part of the tutorial is designed toamiliarize you with the difference between how Windows recognized common spatial dataset filetypes, and how ArcGISecognizes them.
8/8/2019 arc gis 92
http://slidepdf.com/reader/full/arc-gis-92 3/25
01-Introduction To GIS Mapping And Arcgis 9.2 Software.Doc Page 3 of 25
The Yale Map Collection
At Sterling Memorial Library130 Wall Street, Room 707
Stacey Maples – GIS Assistant
203-432-8269 / [email protected]/maps
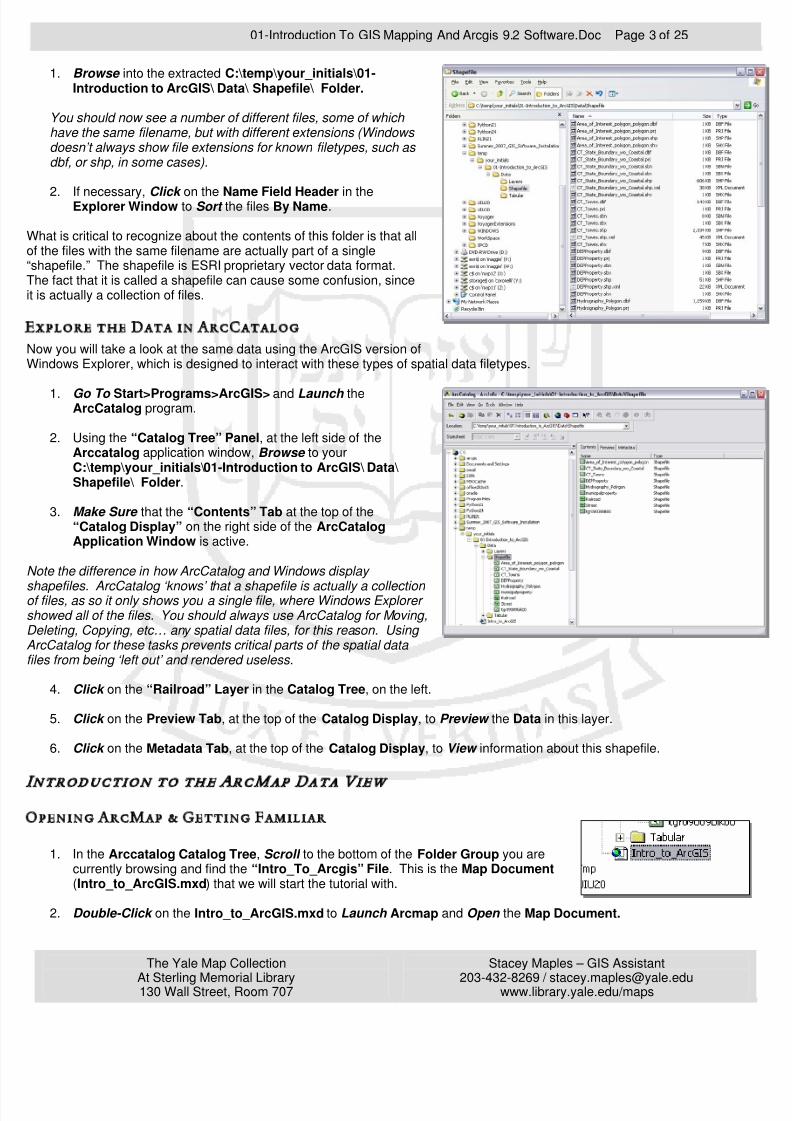
1. Browse into the extracted C:\temp\your_initials\01-Introduction to ArcGIS\ Data\ Shapefile\ Folder.
You should now see a number of different files, some of which have the same filename, but with different extensions (Windows doesn’t always show file extensions for known filetypes, such as dbf, or shp, in some cases).
2. If necessary, Click on the Name Field Header in theExplorer Window to Sort the files By Name.
What is critical to recognize about the contents of this folder is that allf the files with the same filename are actually part of a singleshapefile.” The shapefile is ESRI proprietary vector data format.
The fact that it is called a shapefile can cause some confusion, sinceis actually a collection of files.
Now you will take a look at the same data using the ArcGIS version ofWindows Explorer, which is designed to interact with these types of spatial data filetypes.
1. Go To Start>Programs>ArcGIS> and Launch theArcCatalog program.
2. Using the “Catalog Tree” Panel, at the left side of theArccatalog application window, Browse to yourC:\temp\your_initials\01-Introduction to ArcGIS\ Data\ Shapefile\ Folder.
3. Make Sure that the “Contents” Tab at the top of the“Catalog Display” on the right side of the ArcCatalogApplication Window is active.
Note the difference in how ArcCatalog and Windows display
hapefiles. ArcCatalog ‘knows’ that a shapefile is actually a collection of files, as so it only shows you a single file, where Windows Explorer howed all of the files. You should always use ArcCatalog for Moving,
Deleting, Copying, etc… any spatial data files, for this reason. Using ArcCatalog for these tasks prevents critical parts of the spatial data iles from being ‘left out’ and rendered useless.
4. Click on the “Railroad” Layer in the Catalog Tree, on the left.
5. Click on the Preview Tab, at the top of the Catalog Display, to Preview the Data in this layer.
6. Click on the Metadata Tab, at the top of the Catalog Display, to View information about this shapefile.
ap Data View
1. In the Arccatalog Catalog Tree, Scroll to the bottom of the Folder Group you arecurrently browsing and find the “Intro_To_Arcgis” File. This is the Map Document(Intro_to_ArcGIS.mxd) that we will start the tutorial with.
2. Double-Click on the Intro_to_ArcGIS.mxd to Launch Arcmap and Open the Map Document.
8/8/2019 arc gis 92
http://slidepdf.com/reader/full/arc-gis-92 4/25
01-Introduction To GIS Mapping And Arcgis 9.2 Software.Doc Page 4 of 25
The Yale Map Collection
At Sterling Memorial Library130 Wall Street, Room 707
Stacey Maples – GIS Assistant
203-432-8269 / [email protected]/maps
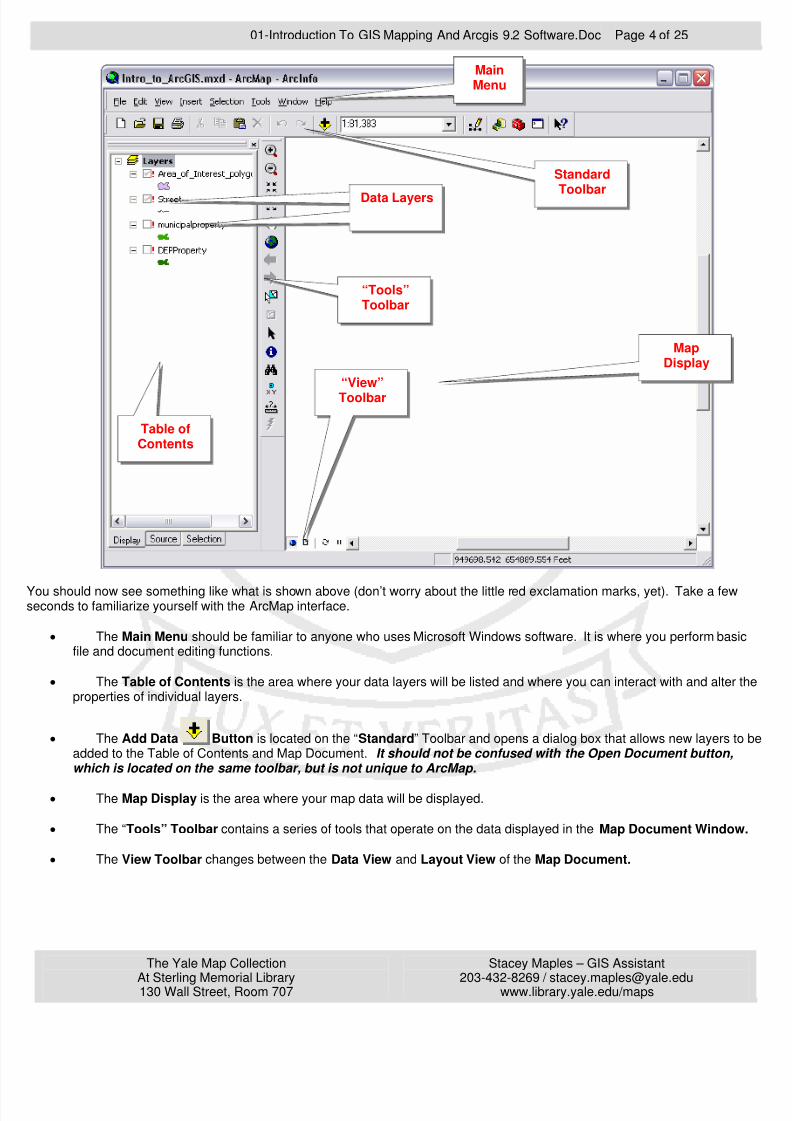
You should now see something like what is shown above (don’t worry about the little red exclamation marks, yet). Take a feweconds to familiarize yourself with the ArcMap interface.
• The Main Menu should be familiar to anyone who uses Microsoft Windows software. It is where you perform basfile and document editing functions.
• The Table of Contents is the area where your data layers will be listed and where you can interact with and alter properties of individual layers.
• The Add Data Button is located on the “Standard” Toolbar and opens a dialog box that allows new layers toadded to the Table of Contents and Map Document. It should not be confused with the Open Document button,which is located on the same toolbar, but is not unique to ArcMap.
• The Map Display is the area where your map data will be displayed.
• The “Tools” Toolbar contains a series of tools that operate on the data displayed in the Map Document Window
• The View Toolbar changes between the Data View and Layout View of the Map Document.
Table ofContents
MapDisplay
MainMenu
Standard
Toolbar
“Tools”Toolbar
“View”Toolbar
MapDisplay
Data Layers
8/8/2019 arc gis 92
http://slidepdf.com/reader/full/arc-gis-92 5/25
01-Introduction To GIS Mapping And Arcgis 9.2 Software.Doc Page 5 of 25
The Yale Map Collection
At Sterling Memorial Library130 Wall Street, Room 707
Stacey Maples – GIS Assistant
203-432-8269 / [email protected]/maps
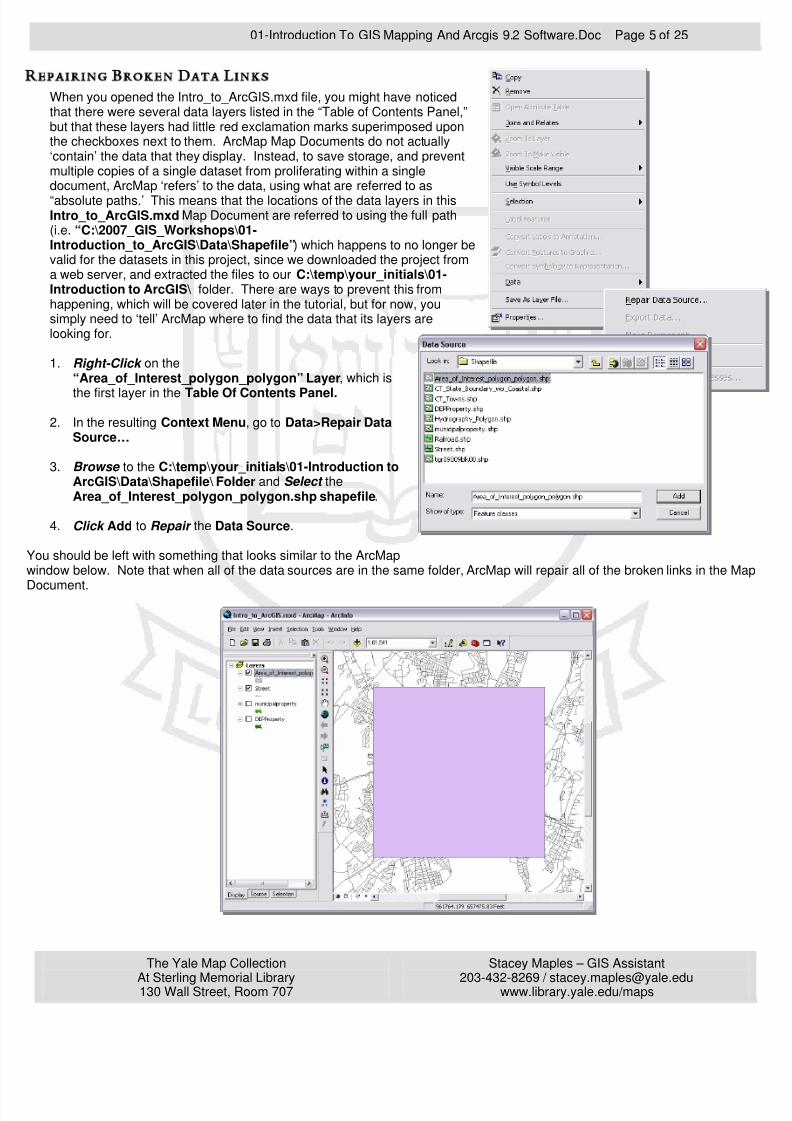
When you opened the Intro_to_ArcGIS.mxd file, you might have noticedthat there were several data layers listed in the “Table of Contents Panel,”but that these layers had little red exclamation marks superimposed uponthe checkboxes next to them. ArcMap Map Documents do not actually‘contain’ the data that they display. Instead, to save storage, and preventmultiple copies of a single dataset from proliferating within a singledocument, ArcMap ‘refers’ to the data, using what are referred to as
“absolute paths.’ This means that the locations of the data layers in thisIntro_to_ArcGIS.mxd Map Document are referred to using the full path(i.e. “C:\2007_GIS_Workshops\01-Introduction_to_ArcGIS\Data\Shapefile”) which happens to no longer bevalid for the datasets in this project, since we downloaded the project froma web server, and extracted the files to our C:\temp\your_initials\01-Introduction to ArcGIS\ folder. There are ways to prevent this fromhappening, which will be covered later in the tutorial, but for now, yousimply need to ‘tell’ ArcMap where to find the data that its layers arelooking for.
1. Right-Click on the“Area_of_Interest_polygon_polygon” Layer, which is
the first layer in the Table Of Contents Panel.
2. In the resulting Context Menu, go to Data>Repair DataSource…
3. Browse to the C:\temp\your_initials\01-Introduction toArcGIS\Data\Shapefile\ Folder and Select theArea_of_Interest_polygon_polygon.shp shapefile.
4. Click Add to Repair the Data Source.
You should be left with something that looks similar to the ArcMapwindow below. Note that when all of the data sources are in the same folder, ArcMap will repair all of the broken links in the M
Document.
8/8/2019 arc gis 92
http://slidepdf.com/reader/full/arc-gis-92 6/25
01-Introduction To GIS Mapping And Arcgis 9.2 Software.Doc Page 6 of 25
The Yale Map Collection
At Sterling Memorial Library130 Wall Street, Room 707
Stacey Maples – GIS Assistant
203-432-8269 / [email protected]/maps
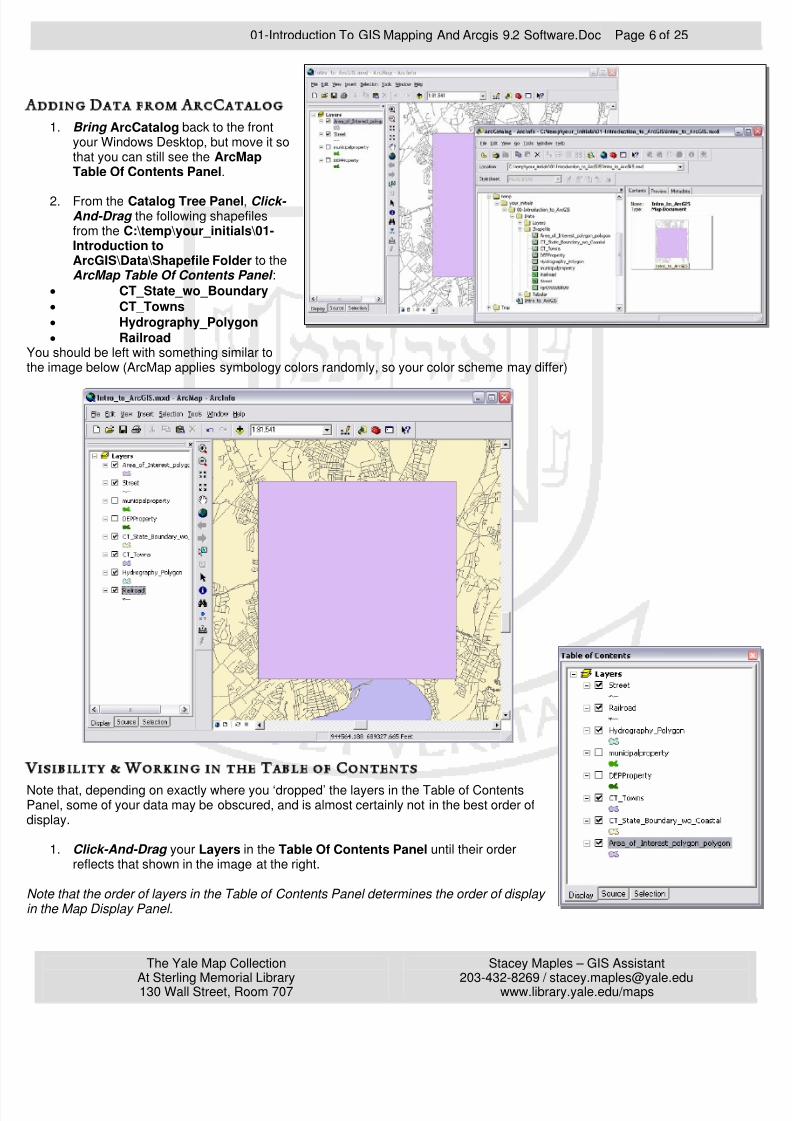
1. Bring ArcCatalog back to the frontyour Windows Desktop, but move it sothat you can still see the ArcMap Table Of Contents Panel.
2. From the Catalog Tree Panel, Click- And-Drag the following shapefilesfrom the C:\temp\your_initials\01-Introduction toArcGIS\Data\Shapefile Folder to theArcMap Table Of Contents Panel :
• CT_State_wo_Boundary• CT_Towns• Hydrography_Polygon• Railroad
You should be left with something similar tohe image below (ArcMap applies symbology colors randomly, so your color scheme may differ)
Note that, depending on exactly where you ‘dropped’ the layers in the Table of ContentsPanel, some of your data may be obscured, and is almost certainly not in the best order ofisplay.
1. Click-And-Drag your Layers in the Table Of Contents Panel until their orderreflects that shown in the image at the right.
Note that the order of layers in the Table of Contents Panel determines the order of display n the Map Display Panel.

8/8/2019 arc gis 92
http://slidepdf.com/reader/full/arc-gis-92 7/25
01-Introduction To GIS Mapping And Arcgis 9.2 Software.Doc Page 7 of 25
The Yale Map Collection
At Sterling Memorial Library130 Wall Street, Room 707
Stacey Maples – GIS Assistant
203-432-8269 / [email protected]/maps
2. Check the Checkboxes next to the Two Layers (municipalproperty and DEPProperty) that are Unchecked.
Note that the checkboxes determine whether the layer is visible, or not.
1. Select the Zoom In Tool from the Tools Toolbar.
2. Drag a Box across the Central Part of the Map Display Panel to Zoom Into the Data View.
3. Click on the Back To Previous Extent Button to Return to the Previous Map DisplayView.
4. Click on the Fixed Zoom Out Button to Zoom Out of your Map Display at fixed
intervals.
5. Select the Pan Tool from the Tools Toolbar and use it to Move your Map Display.
6. Click on the Full Extent Button to Zoom Out to the extent of the Layer in your MapDocument with the largest extent.
8/8/2019 arc gis 92
http://slidepdf.com/reader/full/arc-gis-92 8/25
01-Introduction To GIS Mapping And Arcgis 9.2 Software.Doc Page 8 of 25
The Yale Map Collection
At Sterling Memorial Library130 Wall Street, Room 707
Stacey Maples – GIS Assistant
203-432-8269 / [email protected]/maps
7. Right-Click on the Area_of_Interest_polygon_polygonLayer and Select “Zoom To Layer” from the ContextMenu.
8. Finally, on the Main Menu, Go To View>Bookmarks>Create to Create a Bookmark, calledMain View, of the current extent of your Map Display.
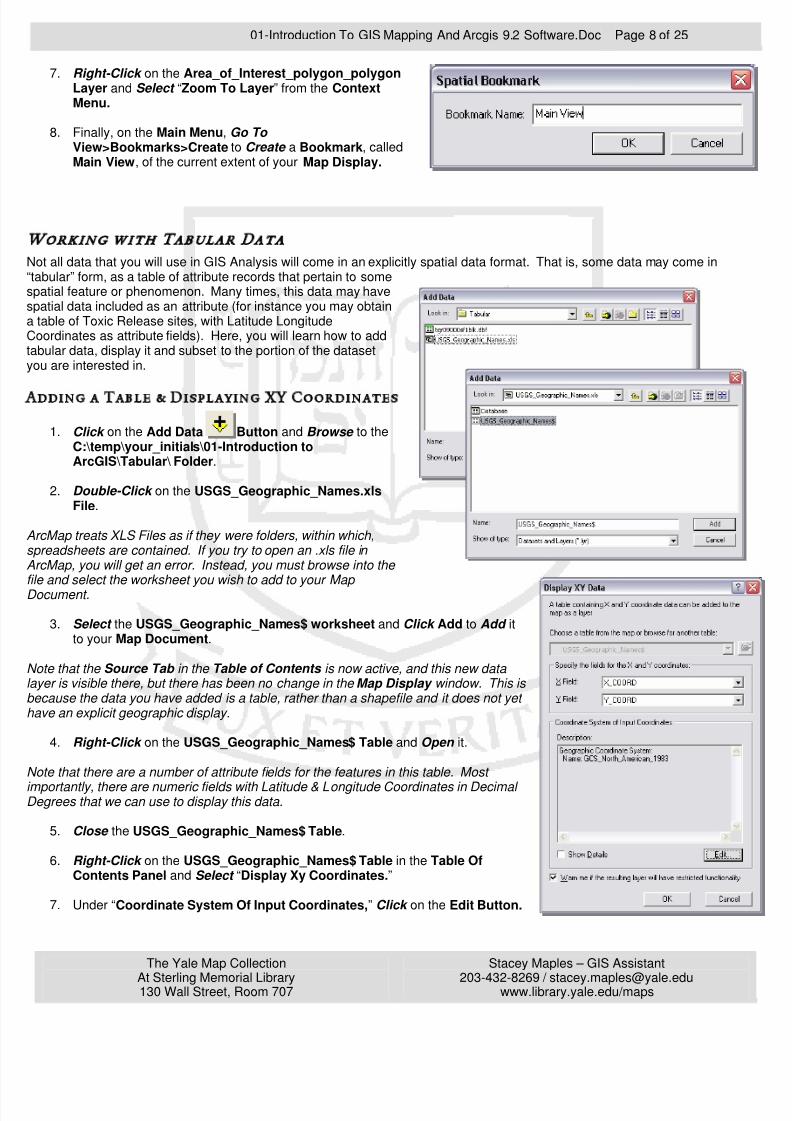
Not all data that you will use in GIS Analysis will come in an explicitly spatial data format. That is, some data may come intabular” form, as a table of attribute records that pertain to somepatial feature or phenomenon. Many times, this data may havepatial data included as an attribute (for instance you may obtain table of Toxic Release sites, with Latitude Longitude
Coordinates as attribute fields). Here, you will learn how to addabular data, display it and subset to the portion of the datasetou are interested in.
1. Click on the Add Data Button and Browse to theC:\temp\your_initials\01-Introduction toArcGIS\Tabular\ Folder.
2. Double-Click on the USGS_Geographic_Names.xls File.
ArcMap treats XLS Files as if they were folders, within which,preadsheets are contained. If you try to open an .xls file in
ArcMap, you will get an error. Instead, you must browse into the ile and select the worksheet you wish to add to your Map
Document.
3. Select the USGS_Geographic_Names$ worksheet and Click Add to Add itto your Map Document.
Note that the Source Tab in the Table of Contents is now active, and this new data ayer is visible there, but there has been no change in the Map Display window. This is because the data you have added is a table, rather than a shapefile and it does not yet have an explicit geographic display.
4. Right-Click on the USGS_Geographic_Names$ Table and Open it.
Note that there are a number of attribute fields for the features in this table. Most
mportantly, there are numeric fields with Latitude & Longitude Coordinates in Decimal Degrees that we can use to display this data.
5. Close the USGS_Geographic_Names$ Table.
6. Right-Click on the USGS_Geographic_Names$ Table in the Table OfContents Panel and Select “Display Xy Coordinates.”
7. Under “Coordinate System Of Input Coordinates,” Click on the Edit Button.
8/8/2019 arc gis 92
http://slidepdf.com/reader/full/arc-gis-92 9/25
01-Introduction To GIS Mapping And Arcgis 9.2 Software.Doc Page 9 of 25
The Yale Map Collection
At Sterling Memorial Library130 Wall Street, Room 707
Stacey Maples – GIS Assistant
203-432-8269 / [email protected]/maps
8. In the resulting ”Spatial Reference Properties” Dialog, Click on the Select Button.
9. Browse to Geographic Coordinate Systems>North America>North American Datum 1983.prj, Select it and ClicAdd.
10. Click Ok Twice to Display the Coordinates.
You will be warned that the resulting layer does not contain Object-ID’s and you will be restricted in what you can do with it.
11. Click Ok, since we will remedy this problem, next.
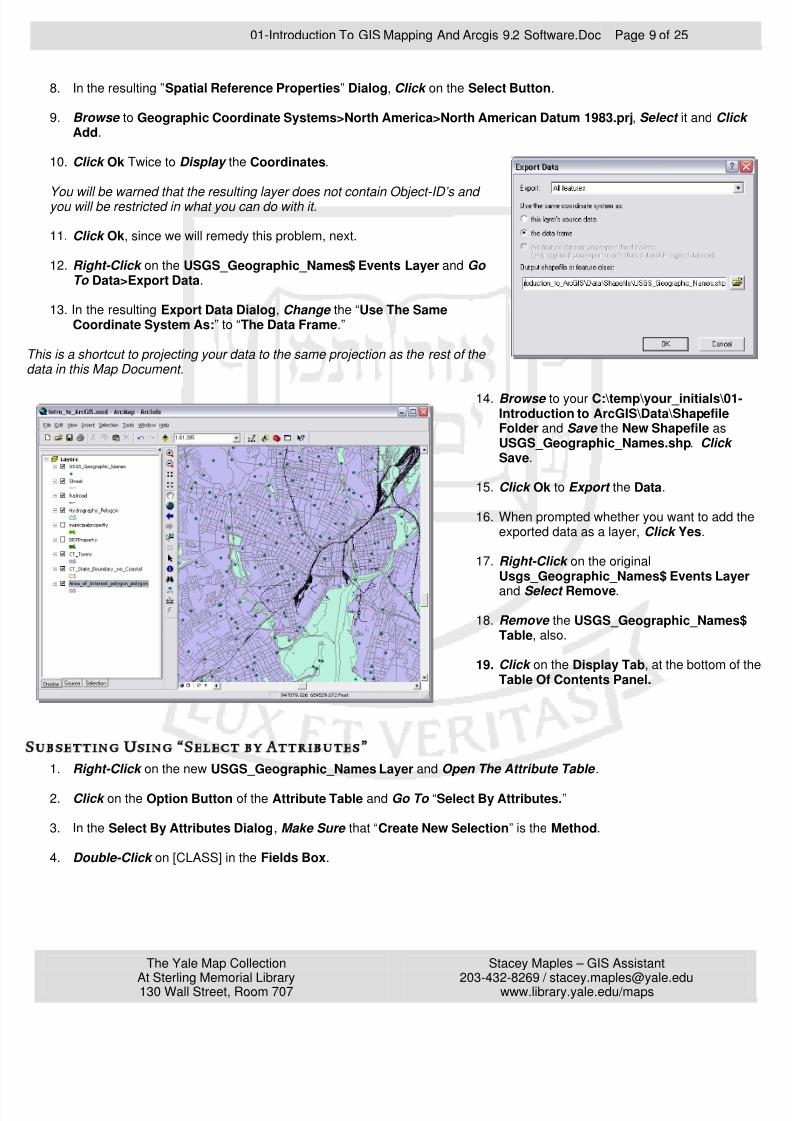
12. Right-Click on the USGS_Geographic_Names$ Events Layer and Go To Data>Export Data.
13. In the resulting Export Data Dialog, Change the “Use The SameCoordinate System As:” to “The Data Frame.”
This is a shortcut to projecting your data to the same projection as the rest of the data in this Map Document.
14. Browse to your C:\temp\your_initials\01-Introduction to ArcGIS\Data\Shapefile Folder and Save the New Shapefile asUSGS_Geographic_Names.shp. Click Save.
15. Click Ok to Export the Data.
16. When prompted whether you want to add texported data as a layer, Click Yes.
17. Right-Click on the originalUsgs_Geographic_Names$ Events Laye
and Select Remove.
18. Remove the USGS_Geographic_Names$Table, also.
19. Click on the Display Tab, at the bottom ofTable Of Contents Panel.
1. Right-Click on the new USGS_Geographic_Names Layer and Open The Attribute Table .
2. Click on the Option Button of the Attribute Table and Go To “Select By Attributes.”
3. In the Select By Attributes Dialog, Make Sure that “Create New Selection” is the Method.
4. Double-Click on [CLASS] in the Fields Box.
8/8/2019 arc gis 92
http://slidepdf.com/reader/full/arc-gis-92 10/25
01-Introduction To GIS Mapping And Arcgis 9.2 Software.Doc Page 10 of 25
The Yale Map Collection
At Sterling Memorial Library130 Wall Street, Room 707
Stacey Maples – GIS Assistant
203-432-8269 / [email protected]/maps
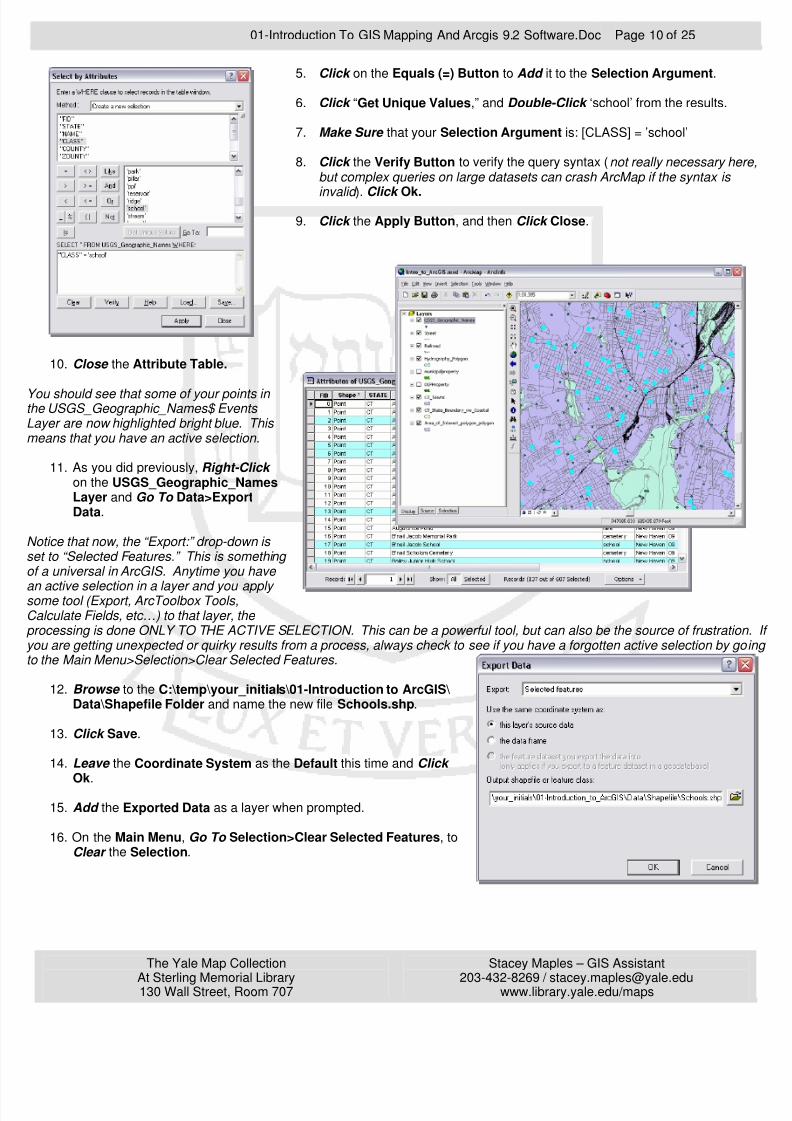
5. Click on the Equals (=) Button to Add it to the Selection Argument.
6. Click “Get Unique Values,” and Double-Click ‘school’ from the results.
7. Make Sure that your Selection Argument is: [CLASS] = ’school’
8. Click the Verify Button to verify the query syntax (not really necessary hebut complex queries on large datasets can crash ArcMap if the syntax is
invalid ). Click Ok.
9. Click the Apply Button, and then Click Close.
10. Close the Attribute Table.
You should see that some of your points in he USGS_Geographic_Names$ Events
Layer are now highlighted bright blue. This means that you have an active selection.
11. As you did previously, Right-Click on the USGS_Geographic_NamesLayer and Go To Data>ExportData.
Notice that now, the “Export:” drop-down is et to “Selected Features.” This is something
of a universal in ArcGIS. Anytime you have
an active selection in a layer and you apply ome tool (Export, ArcToolbox Tools,Calculate Fields, etc…) to that layer, the processing is done ONLY TO THE ACTIVE SELECTION. This can be a powerful tool, but can also be the source of frustratioyou are getting unexpected or quirky results from a process, always check to see if you have a forgotten active selection by goo the Main Menu>Selection>Clear Selected Features.
12. Browse to the C:\temp\your_initials\01-Introduction to ArcGIS\ Data\Shapefile Folder and name the new file Schools.shp.
13. Click Save.
14. Leave the Coordinate System as the Default this time and Click Ok.
15. Add the Exported Data as a layer when prompted.
16. On the Main Menu, Go To Selection>Clear Selected Features, toClear the Selection.
8/8/2019 arc gis 92
http://slidepdf.com/reader/full/arc-gis-92 11/25
01-Introduction To GIS Mapping And Arcgis 9.2 Software.Doc Page 11 of 25
The Yale Map Collection
At Sterling Memorial Library130 Wall Street, Room 707
Stacey Maples – GIS Assistant
203-432-8269 / [email protected]/maps
ith Spatial Data
Many times, attribute data is contained in tabular form, separate from the Geographic boundary files that are used by GISoftware. This is particularly the case with Census Data. This is because the number of attributes available for some GIS dato large that including the files together creates prohibitively large layer files. In most cases, a researcher only needs a limited
umber of attributes for analysis. ArcMap allows you to “Join” a tabular attribute file to its corresponding Geographic File. Hewe will use a “key field,” present in both the attribute table and the geographic boundary file for the Census data for New Havo “Join” those two files.
1. Use the Add Data Button to Add the tgr09000sf1blk.dbf Table from the C:\temp\your_initials\01-IntroductioArcGIS\Data\Tabular Folder.
2. Use the Add Data Button to Add the tgr09009blk00.shp shapefile from the C:\temp\your_initials\01-Introduction to ArcGIS\Data\Shapefiles Folder.
You will be warned that one of your datasets is missing its “spatial reference.” Your table of Contents view will also change bao the Source Tab, since you have just added a table of data, as well as a shapefile.
Note that you probably cannot see the Census Block Group files we just added, tgr09009blk00.shp (If you can see the file, youkely using ArcGIS version 9.1 or before). This is because the dataset does not have a *.prj file, which contains information abow the numeric values that record the point, line and polygons in the dataset, relate to geographic location on the face of the
Earth. This means that you need to ‘define’ the coordinate or projection system.
Prior to ArcGIS 9.2, the software would examine the numeric values that recorded the geometry of the boundaries and, if thealues fell within the normal Lat/Lon values (-90 to 90 & -180 to 180), it applied an “assumed geographic coordinate system” uhe North American Datum from 1927. This worked, sometimes. But what if your data was located in India? The NAD 1927
Datum is not nearly as accurate as current datums, and is wildly inaccurate for any dataset falling outside North America. Alsomuch of the data you work with in GIS is now created on the NAD 1983 datum, a far more accurate reference system.
So, ESRI dropped the assumed geographic feature, so that you must now explicitly assign the correct coordinate system.
Unfortunately, ESRI has not updated much of its available data to reflect this new lack of automation, and much of the base dahey provide (not to mention that included with the last 20 years of software releases) still has no defined coordinate system / rojection. Here, we will learn to remedy that, and familiarize you with the
ArcToolbox.
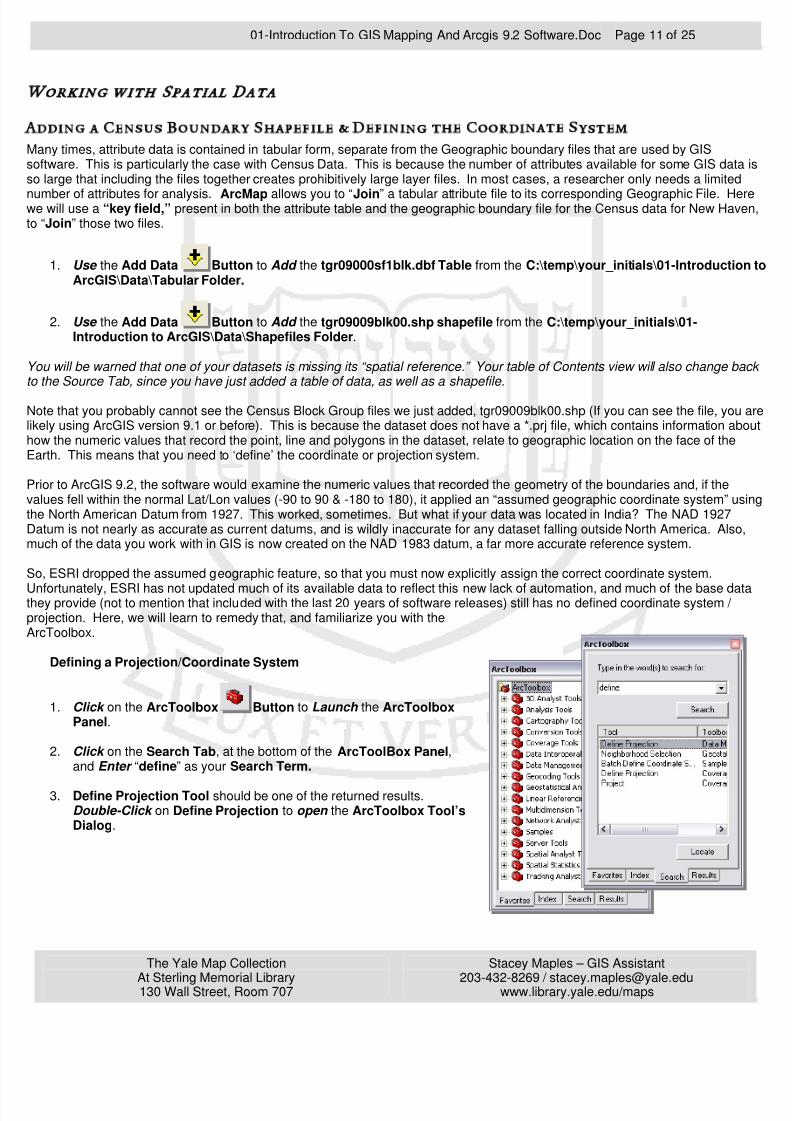
Defining a Projection/Coordinate System
1. Click on the ArcToolbox Button to Launch the ArcToolboxPanel.
2. Click on the Search Tab, at the bottom of the ArcToolBox Panel,and Enter “define” as your Search Term.
3. Define Projection Tool should be one of the returned results.Double-Click on Define Projection to open the ArcToolbox Tool’sDialog.
8/8/2019 arc gis 92
http://slidepdf.com/reader/full/arc-gis-92 12/25
01-Introduction To GIS Mapping And Arcgis 9.2 Software.Doc Page 12 of 25
The Yale Map Collection
At Sterling Memorial Library130 Wall Street, Room 707
Stacey Maples – GIS Assistant
203-432-8269 / [email protected]/maps
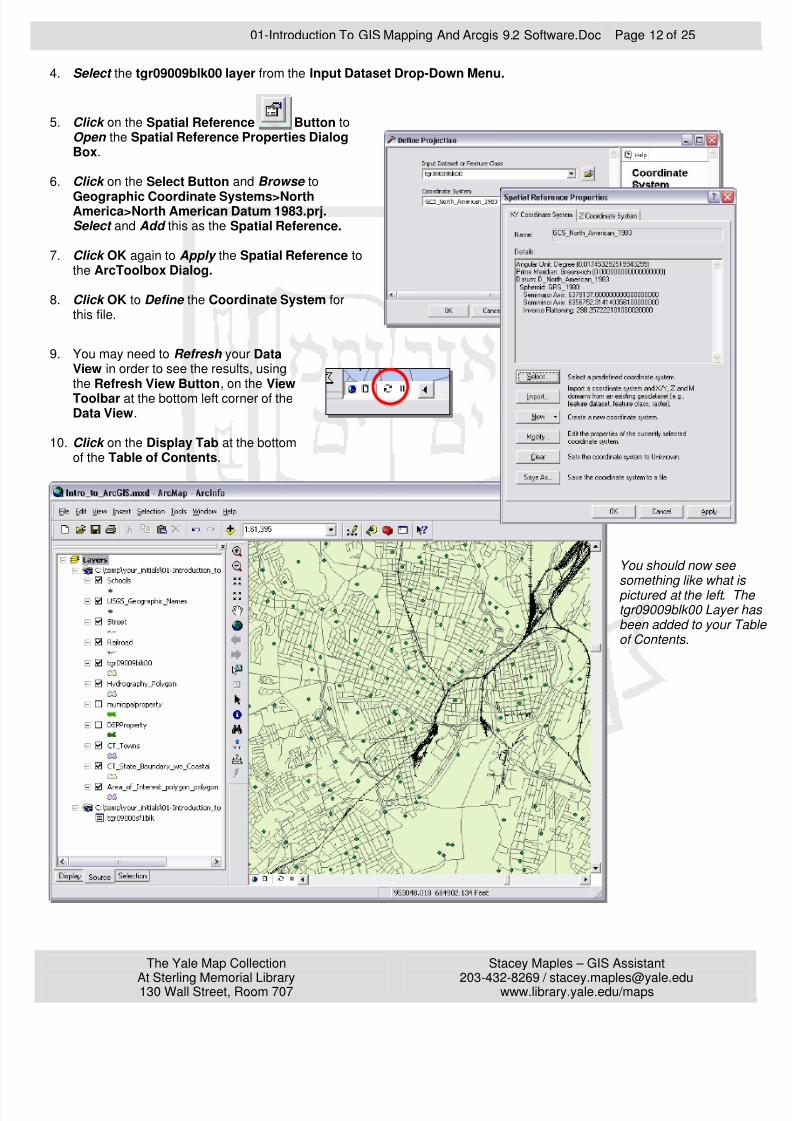
4. Select the tgr09009blk00 layer from the Input Dataset Drop-Down Menu.
5. Click on the Spatial Reference Button toOpen the Spatial Reference Properties DialogBox.
6. Click on the Select Button and Browse to
Geographic Coordinate Systems>NorthAmerica>North American Datum 1983.prj. Select and Add this as the Spatial Reference.
7. Click OK again to Apply the Spatial Reference tothe ArcToolbox Dialog.
8. Click OK to Define the Coordinate System forthis file.
9. You may need to Refresh your DataView in order to see the results, usingthe Refresh View Button, on the ViewToolbar at the bottom left corner of theData View.
10. Click on the Display Tab at the bottomof the Table of Contents.
You should now see something like what ispictured at the left. Ttgr09009blk00 Layer been added to your Tof Contents.
8/8/2019 arc gis 92
http://slidepdf.com/reader/full/arc-gis-92 13/25
01-Introduction To GIS Mapping And Arcgis 9.2 Software.Doc Page 13 of 25
The Yale Map Collection
At Sterling Memorial Library130 Wall Street, Room 707
Stacey Maples – GIS Assistant
203-432-8269 / [email protected]/maps
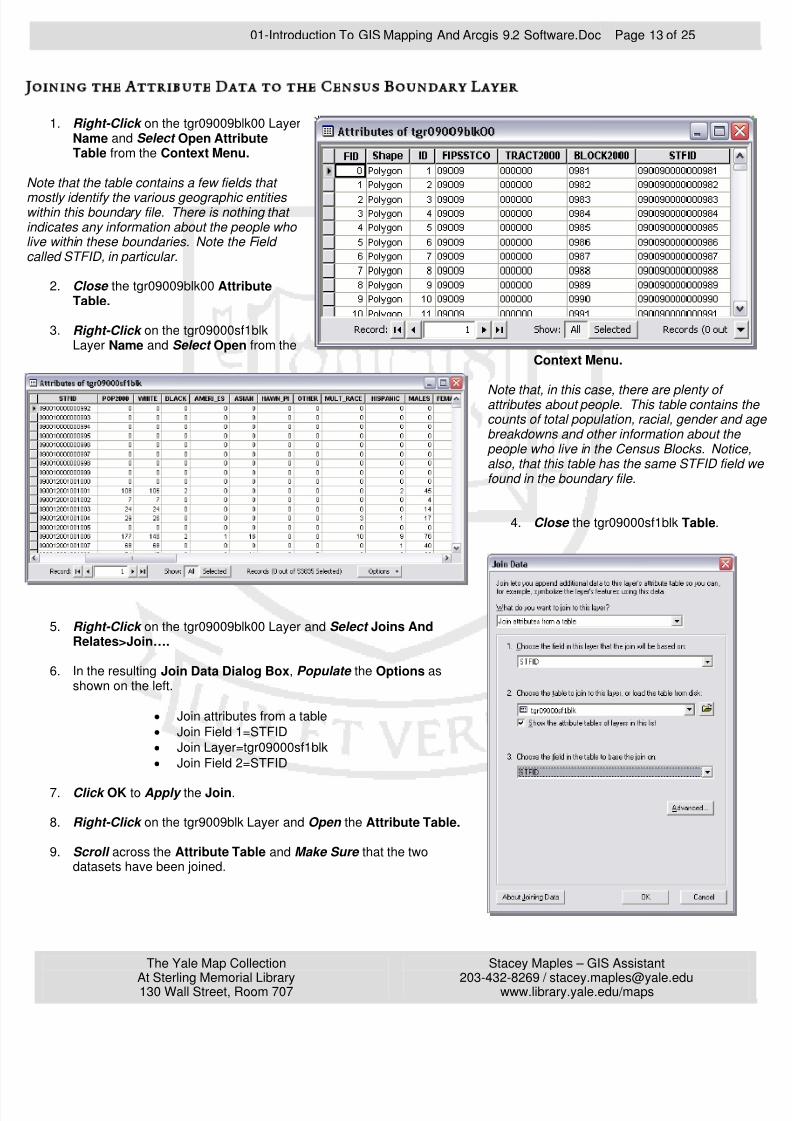
1. Right-Click on the tgr09009blk00 Layer Name and Select Open AttributeTable from the Context Menu.
Note that the table contains a few fields that
mostly identify the various geographic entities within this boundary file. There is nothing that ndicates any information about the people who ive within these boundaries. Note the Field called STFID, in particular.
2. Close the tgr09009blk00 AttributeTable.
3. Right-Click on the tgr09000sf1blkLayer Name and Select Open from the
Context Menu.
Note that, in this case, there are plenty of attributes about people. This table contains counts of total population, racial, gender andbreakdowns and other information about the people who live in the Census Blocks. Noticalso, that this table has the same STFID fieldfound in the boundary file.
4. Close the tgr09000sf1blk Table.
5. Right-Click on the tgr09009blk00 Layer and Select Joins AndRelates>Join….
6. In the resulting Join Data Dialog Box, Populate the Options asshown on the left.
• Join attributes from a table
• Join Field 1=STFID
• Join Layer=tgr09000sf1blk
• Join Field 2=STFID
7. Click OK to Apply the Join.
8. Right-Click on the tgr9009blk Layer and Open the Attribute Table.
9. Scroll across the Attribute Table and Make Sure that the twodatasets have been joined.
8/8/2019 arc gis 92
http://slidepdf.com/reader/full/arc-gis-92 14/25
01-Introduction To GIS Mapping And Arcgis 9.2 Software.Doc Page 14 of 25
The Yale Map Collection
At Sterling Memorial Library130 Wall Street, Room 707
Stacey Maples – GIS Assistant
203-432-8269 / [email protected]/maps
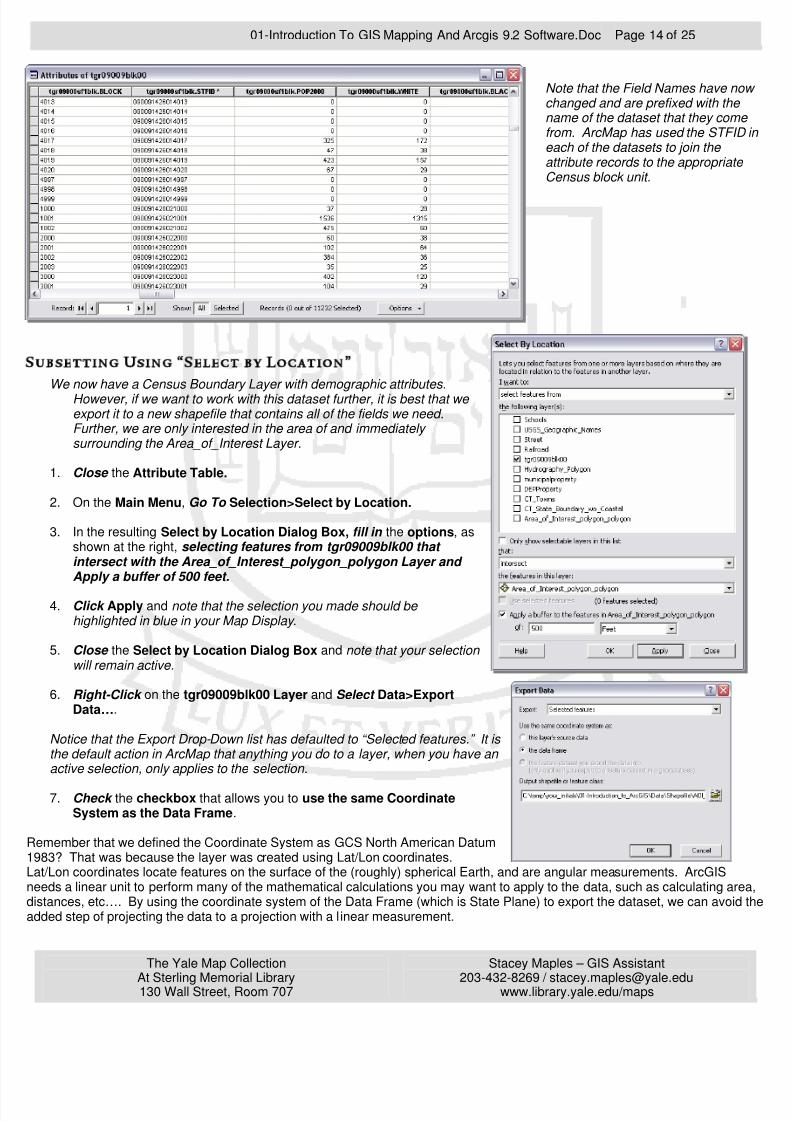
Note that the Field Names have nochanged and are prefixed with the name of the dataset that they comfrom. ArcMap has used the STFIDeach of the datasets to join the attribute records to the appropriateCensus block unit.
We now have a Census Boundary Layer with demographic attributes.However, if we want to work with this dataset further, it is best that we export it to a new shapefile that contains all of the fields we need.Further, we are only interested in the area of and immediately surrounding the Area_of_Interest Layer.
1. Close the Attribute Table.
2. On the Main Menu, Go To Selection>Select by Location.
3. In the resulting Select by Location Dialog Box, fill in the options, asshown at the right, selecting features from tgr09009blk00 that intersect with the Area_of_Interest_polygon_polygon Layer and Apply a buffer of 500 feet.
4. Click Apply and note that the selection you made should be highlighted in blue in your Map Display .
5. Close the Select by Location Dialog Box and note that your selection will remain active.
6. Right-Click on the tgr09009blk00 Layer and Select Data>ExportData….
Notice that the Export Drop-Down list has defaulted to “Selected features.” It is the default action in ArcMap that anything you do to a layer, when you have an active selection, only applies to the selection.
7. Check the checkbox that allows you to use the same CoordinateSystem as the Data Frame.
Remember that we defined the Coordinate System as GCS North American Datum983? That was because the layer was created using Lat/Lon coordinates.at/Lon coordinates locate features on the surface of the (roughly) spherical Earth, and are angular measurements. ArcGISeeds a linear unit to perform many of the mathematical calculations you may want to apply to the data, such as calculating aristances, etc…. By using the coordinate system of the Data Frame (which is State Plane) to export the dataset, we can avoiddded step of projecting the data to a projection with a linear measurement.
8/8/2019 arc gis 92
http://slidepdf.com/reader/full/arc-gis-92 15/25
01-Introduction To GIS Mapping And Arcgis 9.2 Software.Doc Page 15 of 25
The Yale Map Collection
At Sterling Memorial Library130 Wall Street, Room 707
Stacey Maples – GIS Assistant
203-432-8269 / [email protected]/maps
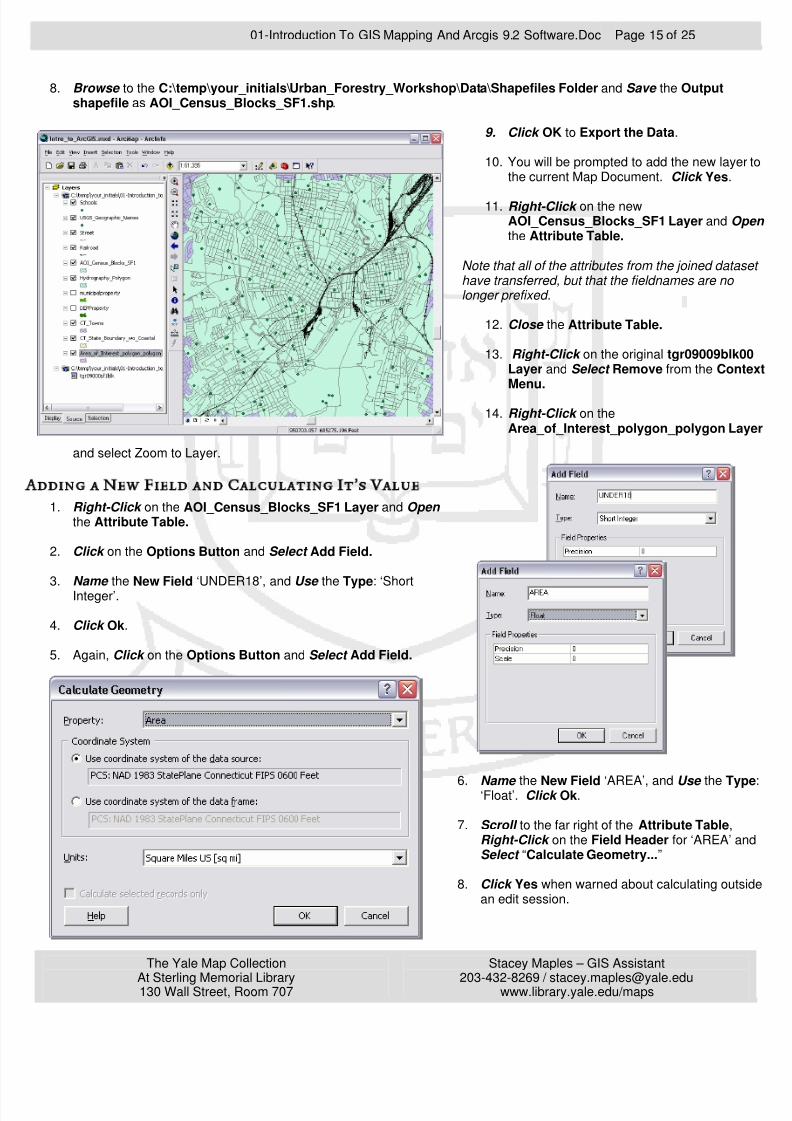
8. Browse to the C:\temp\your_initials\Urban_Forestry_Workshop\Data\Shapefiles Folder and Save the Outputshapefile as AOI_Census_Blocks_SF1.shp.
9. Click OK to Export the Data.
10. You will be prompted to add the new layethe current Map Document. Click Yes.
11. Right-Click on the newAOI_Census_Blocks_SF1 Layer and Othe Attribute Table.
Note that all of the attributes from the joined datahave transferred, but that the fieldnames are no longer prefixed.
12. Close the Attribute Table.
13. Right-Click on the original tgr09009blk0Layer and Select Remove from the ConMenu.
14. Right-Click on theArea_of_Interest_polygon_polygon La
and select Zoom to Layer.
1. Right-Click on the AOI_Census_Blocks_SF1 Layer and Open the Attribute Table.
2. Click on the Options Button and Select Add Field.
3. Name the New Field ‘UNDER18’, and Use the Type: ‘ShortInteger’.
4. Click Ok.
5. Again, Click on the Options Button and Select Add Field.
6. Name the New Field ‘AREA’, and Use the Ty‘Float’. Click Ok.
7. Scroll to the far right of the Attribute Table,Right-Click on the Field Header for ‘AREA’ aSelect “Calculate Geometry...”
8. Click Yes when warned about calculating outsan edit session.
8/8/2019 arc gis 92
http://slidepdf.com/reader/full/arc-gis-92 16/25
01-Introduction To GIS Mapping And Arcgis 9.2 Software.Doc Page 16 of 25
The Yale Map Collection
At Sterling Memorial Library130 Wall Street, Room 707
Stacey Maples – GIS Assistant
203-432-8269 / [email protected]/maps
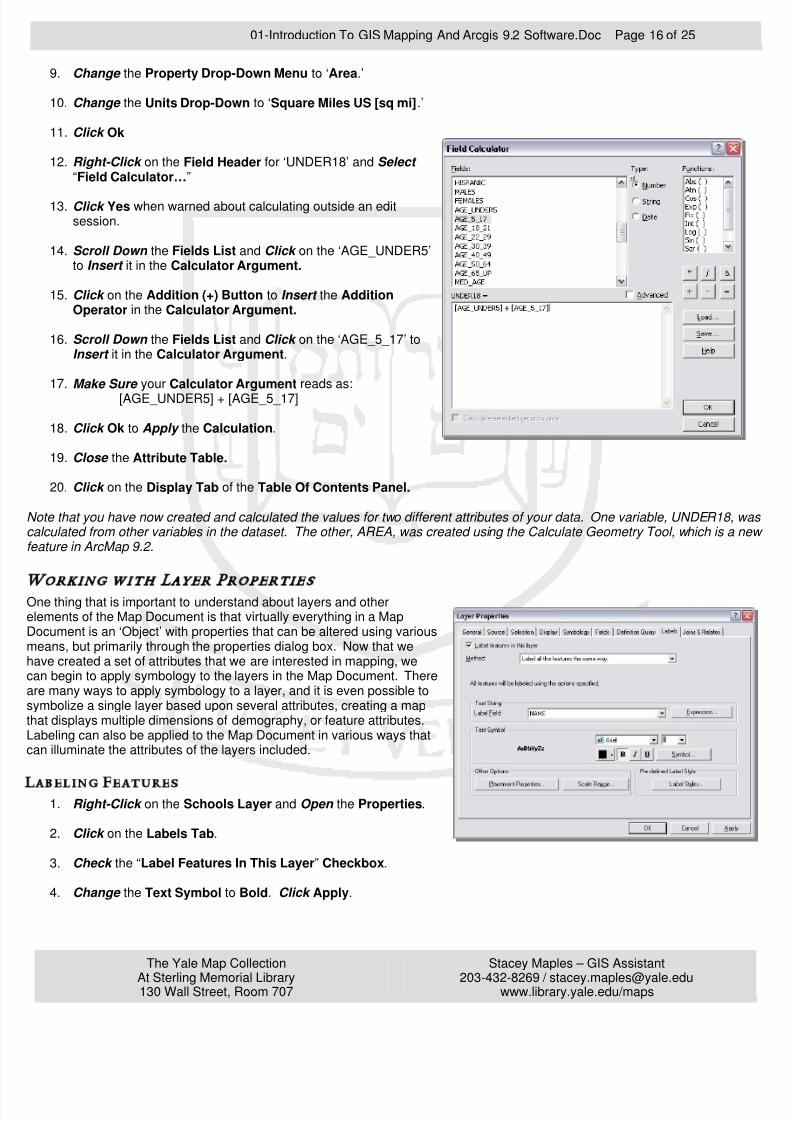
9. Change the Property Drop-Down Menu to ‘Area.’
10. Change the Units Drop-Down to ‘Square Miles US [sq mi].’
11. Click Ok
12. Right-Click on the Field Header for ‘UNDER18’ and Select “Field Calculator…”
13. Click Yes when warned about calculating outside an editsession.
14. Scroll Down the Fields List and Click on the ‘AGE_UNDER5’to Insert it in the Calculator Argument.
15. Click on the Addition (+) Button to Insert the AdditionOperator in the Calculator Argument.
16. Scroll Down the Fields List and Click on the ‘AGE_5_17’ toInsert it in the Calculator Argument.
17. Make Sure your Calculator Argument reads as:[AGE_UNDER5] + [AGE_5_17]
18. Click Ok to Apply the Calculation.
19. Close the Attribute Table.
20. Click on the Display Tab of the Table Of Contents Panel.
Note that you have now created and calculated the values for two different attributes of your data. One variable, UNDER18, wcalculated from other variables in the dataset. The other, AREA, was created using the Calculate Geometry Tool, which is a neature in ArcMap 9.2.
ith Layer Properties
One thing that is important to understand about layers and otherlements of the Map Document is that virtually everything in a Map
Document is an ‘Object’ with properties that can be altered using variousmeans, but primarily through the properties dialog box. Now that weave created a set of attributes that we are interested in mapping, wean begin to apply symbology to the layers in the Map Document. Therere many ways to apply symbology to a layer, and it is even possible toymbolize a single layer based upon several attributes, creating a maphat displays multiple dimensions of demography, or feature attributes.abeling can also be applied to the Map Document in various ways thatan illuminate the attributes of the layers included.
1. Right-Click on the Schools Layer and Open the Properties.
2. Click on the Labels Tab.
3. Check the “Label Features In This Layer” Checkbox.
4. Change the Text Symbol to Bold. Click Apply.
8/8/2019 arc gis 92
http://slidepdf.com/reader/full/arc-gis-92 17/25
01-Introduction To GIS Mapping And Arcgis 9.2 Software.Doc Page 17 of 25
The Yale Map Collection
At Sterling Memorial Library130 Wall Street, Room 707
Stacey Maples – GIS Assistant
203-432-8269 / [email protected]/maps
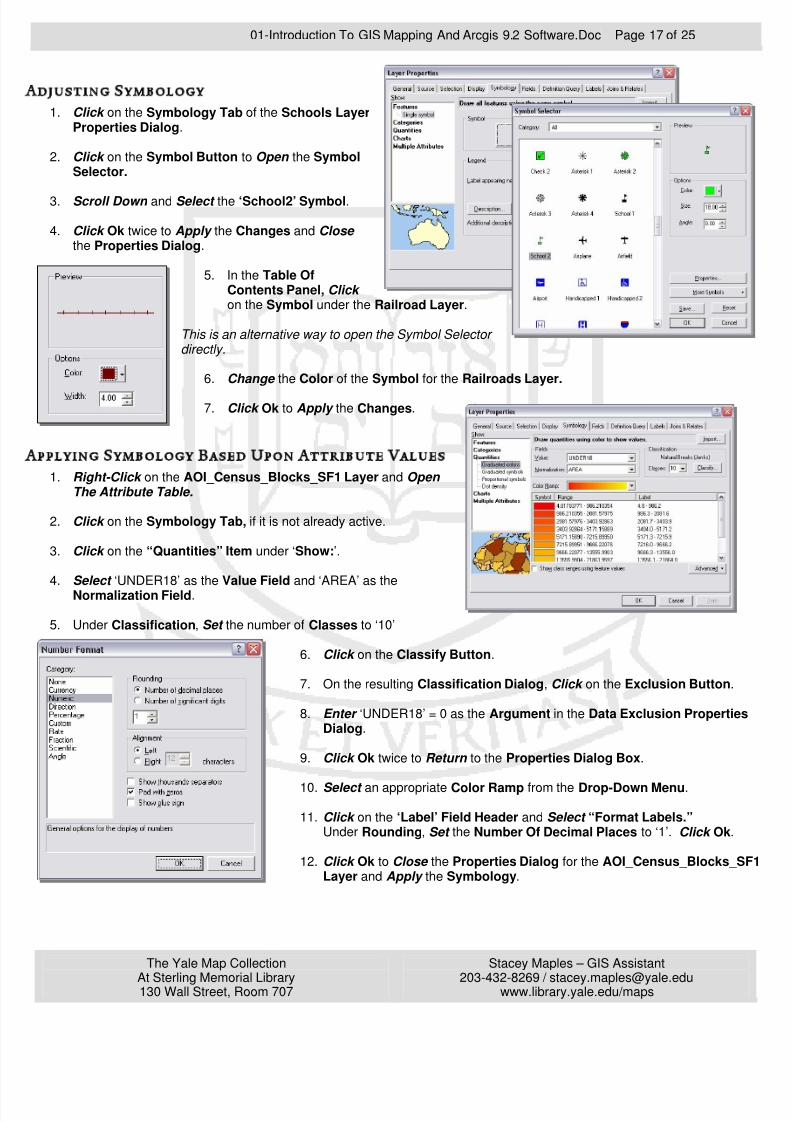
1. Click on the Symbology Tab of the Schools LayerProperties Dialog.
2. Click on the Symbol Button to Open the SymbolSelector.
3. Scroll Down and Select the ‘School2’ Symbol.
4. Click Ok twice to Apply the Changes and Close the Properties Dialog.
5. In the Table OfContents Panel, Click on the Symbol under the Railroad Layer.
This is an alternative way to open the Symbol Selector directly.
6. Change the Color of the Symbol for the Railroads Layer.
7. Click Ok to Apply the Changes.
1. Right-Click on the AOI_Census_Blocks_SF1 Layer and Open The Attribute Table.
2. Click on the Symbology Tab, if it is not already active.
3. Click on the “Quantities” Item under ‘Show:’.
4. Select ‘UNDER18’ as the Value Field and ‘AREA’ as theNormalization Field.
5. Under Classification, Set the number of Classes to ‘10’
6. Click on the Classify Button.
7. On the resulting Classification Dialog, Click on the Exclusion Button.
8. Enter ‘UNDER18’ = 0 as the Argument in the Data Exclusion PropertieDialog.
9. Click Ok twice to Return to the Properties Dialog Box.
10. Select an appropriate Color Ramp from the Drop-Down Menu.
11. Click on the ‘Label’ Field Header and Select “Format Labels.” Under Rounding, Set the Number Of Decimal Places to ‘1’. Click Ok.
12. Click Ok to Close the Properties Dialog for the AOI_Census_Blocks_SLayer and Apply the Symbology.
8/8/2019 arc gis 92
http://slidepdf.com/reader/full/arc-gis-92 18/25
01-Introduction To GIS Mapping And Arcgis 9.2 Software.Doc Page 18 of 25
The Yale Map Collection
At Sterling Memorial Library130 Wall Street, Room 707
Stacey Maples – GIS Assistant
203-432-8269 / [email protected]/maps
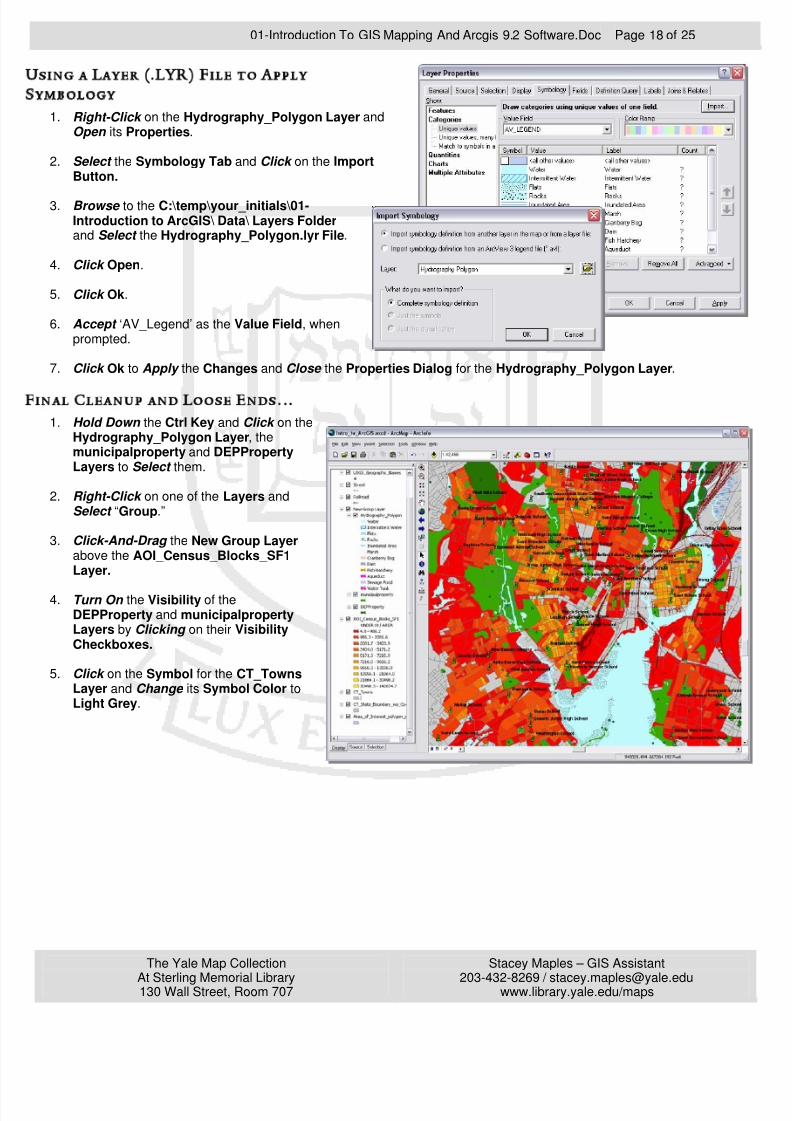
1. Right-Click on the Hydrography_Polygon Layer andOpen its Properties.
2. Select the Symbology Tab and Click on the ImportButton.
3. Browse to the C:\temp\your_initials\01-Introduction to ArcGIS\ Data\ Layers Folder and Select the Hydrography_Polygon.lyr File.
4. Click Open.
5. Click Ok.
6. Accept ‘AV_Legend’ as the Value Field, whenprompted.
7. Click Ok to Apply the Changes and Close the Properties Dialog for the Hydrography_Polygon Layer.
1. Hold Down the Ctrl Key and Click on theHydrography_Polygon Layer, themunicipalproperty and DEPPropertyLayers to Select them.
2. Right-Click on one of the Layers andSelect “Group.”
3. Click-And-Drag the New Group Layerabove the AOI_Census_Blocks_SF1Layer.
4. Turn On the Visibility of theDEPProperty and municipalproperty Layers by Clicking on their VisibilityCheckboxes.
5. Click on the Symbol for the CT_TownsLayer and Change its Symbol Color toLight Grey.
8/8/2019 arc gis 92
http://slidepdf.com/reader/full/arc-gis-92 19/25
01-Introduction To GIS Mapping And Arcgis 9.2 Software.Doc Page 19 of 25
The Yale Map Collection
At Sterling Memorial Library130 Wall Street, Room 707
Stacey Maples – GIS Assistant
203-432-8269 / [email protected]/maps
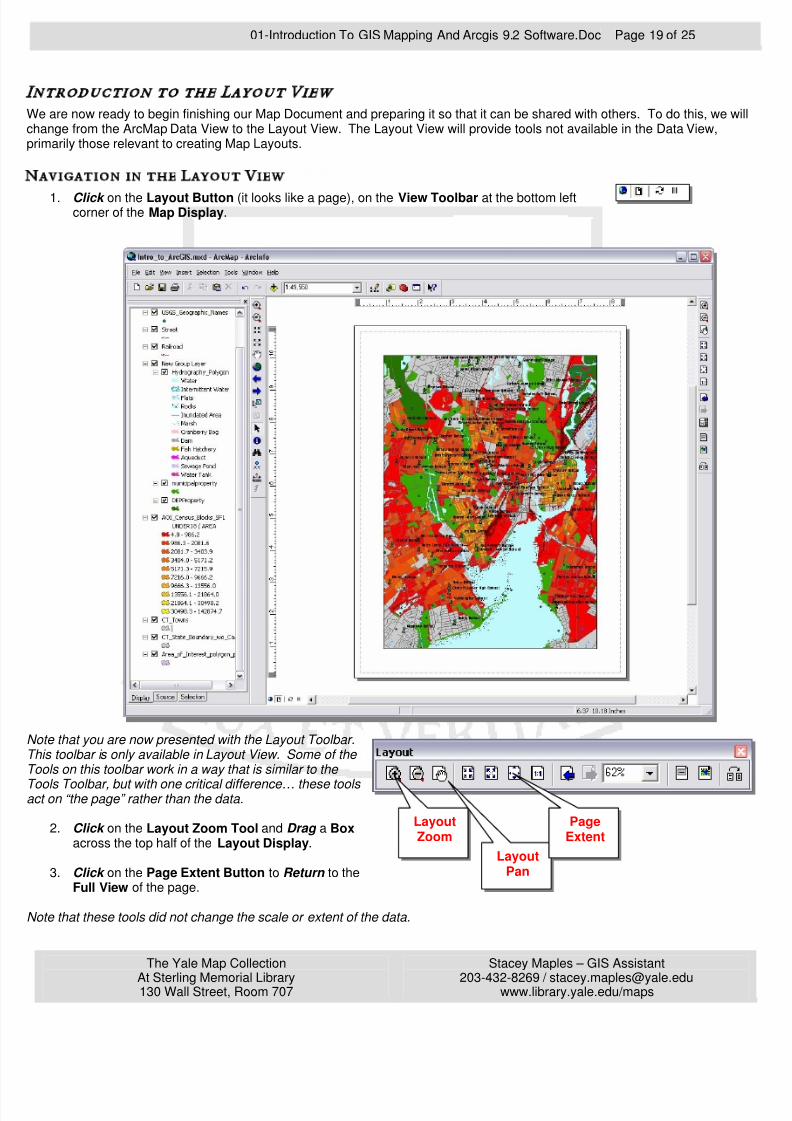
We are now ready to begin finishing our Map Document and preparing it so that it can be shared with others. To do this, we whange from the ArcMap Data View to the Layout View. The Layout View will provide tools not available in the Data View,rimarily those relevant to creating Map Layouts.
1. Click on the Layout Button (it looks like a page), on the View Toolbar at the bottom leftcorner of the Map Display.
Note that you are now presented with the Layout Toolbar.This toolbar is only available in Layout View. Some of the Tools on this toolbar work in a way that is similar to the
Tools Toolbar, but with one critical difference… these tools act on “the page” rather than the data.
2. Click on the Layout Zoom Tool and Drag a Box across the top half of the Layout Display.
3. Click on the Page Extent Button to Return to theFull View of the page.
Note that these tools did not change the scale or extent of the data.
LayoutZoom
LayoutPan
PageExtent
8/8/2019 arc gis 92
http://slidepdf.com/reader/full/arc-gis-92 20/25
01-Introduction To GIS Mapping And Arcgis 9.2 Software.Doc Page 20 of 25
The Yale Map Collection
At Sterling Memorial Library130 Wall Street, Room 707
Stacey Maples – GIS Assistant
203-432-8269 / [email protected]/maps
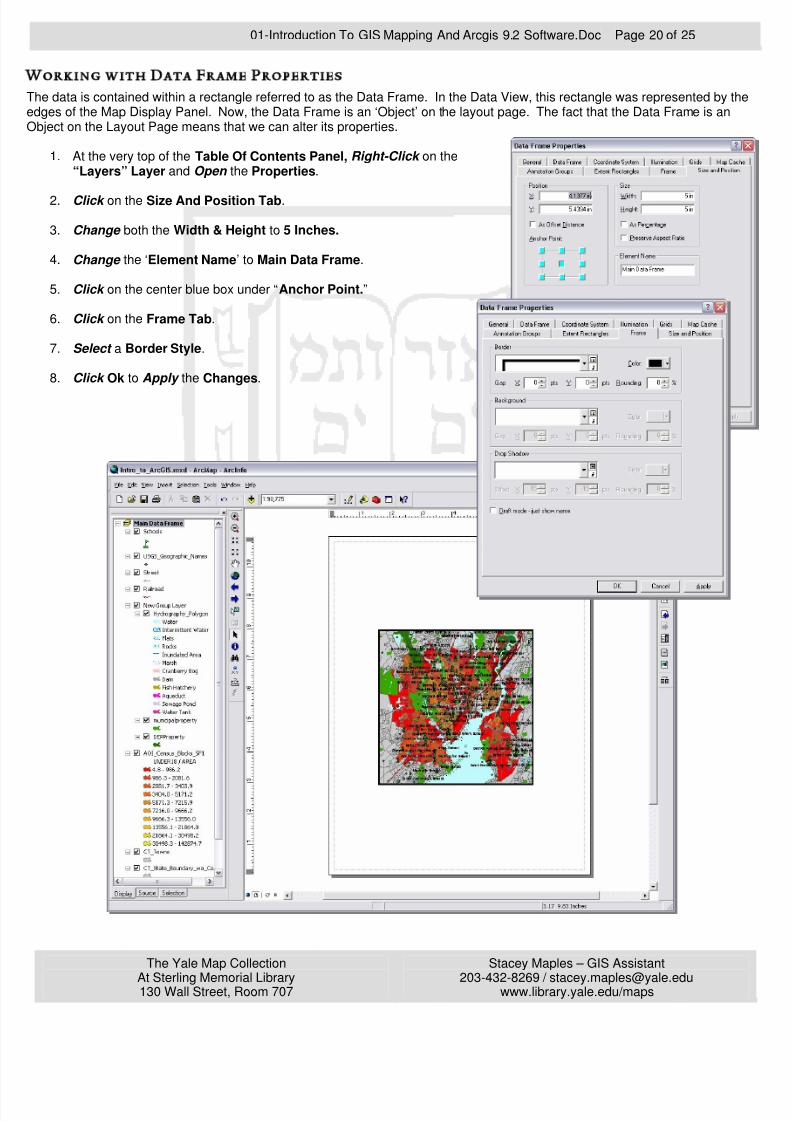
The data is contained within a rectangle referred to as the Data Frame. In the Data View, this rectangle was represented by thdges of the Map Display Panel. Now, the Data Frame is an ‘Object’ on the layout page. The fact that the Data Frame is an
Object on the Layout Page means that we can alter its properties.
1. At the very top of the Table Of Contents Panel, Right-Click on the“Layers” Layer and Open the Properties.
2. Click on the Size And Position Tab.
3. Change both the Width & Height to 5 Inches.
4. Change the ‘Element Name’ to Main Data Frame.
5. Click on the center blue box under “Anchor Point.”
6. Click on the Frame Tab.
7. Select a Border Style.
8. Click Ok to Apply the Changes.
8/8/2019 arc gis 92
http://slidepdf.com/reader/full/arc-gis-92 21/25
01-Introduction To GIS Mapping And Arcgis 9.2 Software.Doc Page 21 of 25
The Yale Map Collection
At Sterling Memorial Library130 Wall Street, Room 707
Stacey Maples – GIS Assistant
203-432-8269 / [email protected]/maps
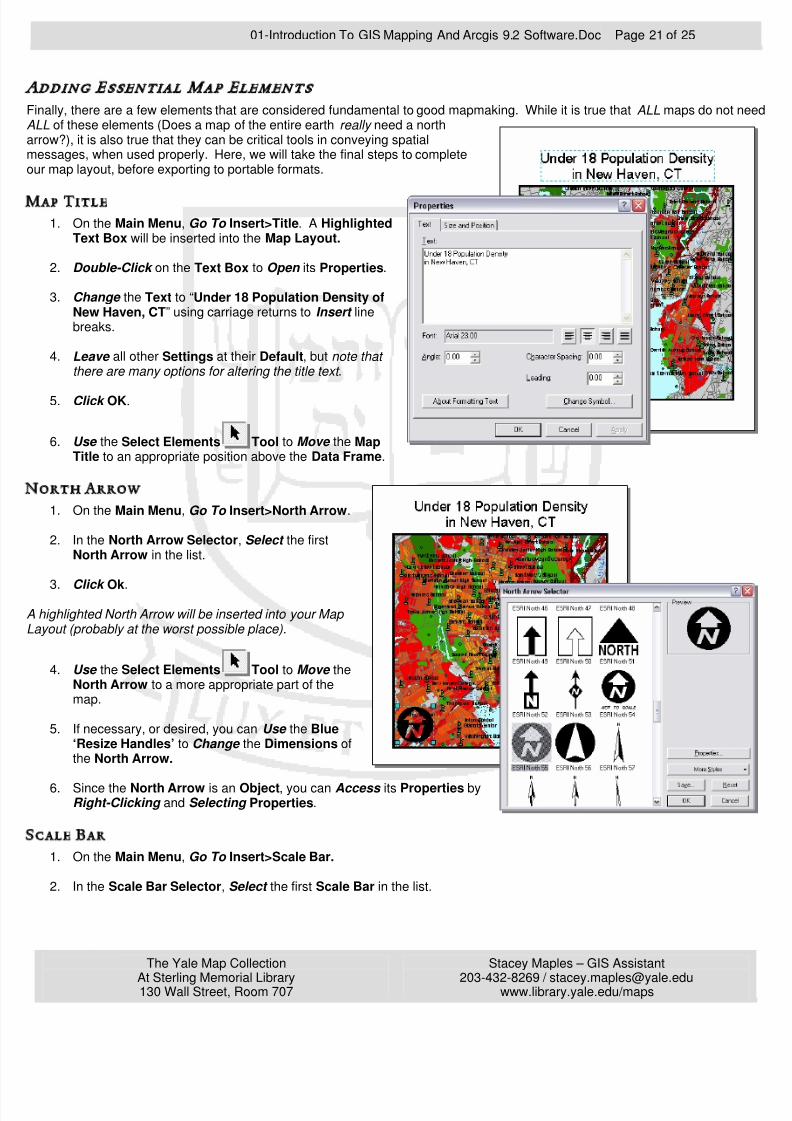
Finally, there are a few elements that are considered fundamental to good mapmaking. While it is true that ALL maps do not nALL of these elements (Does a map of the entire earth really need a northrrow?), it is also true that they can be critical tools in conveying spatial
messages, when used properly. Here, we will take the final steps to completeur map layout, before exporting to portable formats.
1. On the Main Menu, Go To Insert>Title. A HighlightedText Box will be inserted into the Map Layout.
2. Double-Click on the Text Box to Open its Properties.
3. Change the Text to “Under 18 Population Density ofNew Haven, CT” using carriage returns to Insert linebreaks.
4. Leave all other Settings at their Default, but note that there are many options for altering the title text .
5. Click OK.
6. Use the Select Elements Tool to Move the MapTitle to an appropriate position above the Data Frame.
1. On the Main Menu, Go To Insert>North Arrow.
2. In the North Arrow Selector, Select the firstNorth Arrow in the list.
3. Click Ok.
A highlighted North Arrow will be inserted into your Map Layout (probably at the worst possible place).
4. Use the Select Elements Tool to Move theNorth Arrow to a more appropriate part of themap.
5. If necessary, or desired, you can Use the Blue‘Resize Handles’ to Change the Dimensions ofthe North Arrow.
6. Since the North Arrow is an Object, you can Access its Properties byRight-Clicking and Selecting Properties.
1. On the Main Menu, Go To Insert>Scale Bar.
2. In the Scale Bar Selector, Select the first Scale Bar in the list.
8/8/2019 arc gis 92
http://slidepdf.com/reader/full/arc-gis-92 22/25
01-Introduction To GIS Mapping And Arcgis 9.2 Software.Doc Page 22 of 25
The Yale Map Collection
At Sterling Memorial Library130 Wall Street, Room 707
Stacey Maples – GIS Assistant
203-432-8269 / [email protected]/maps
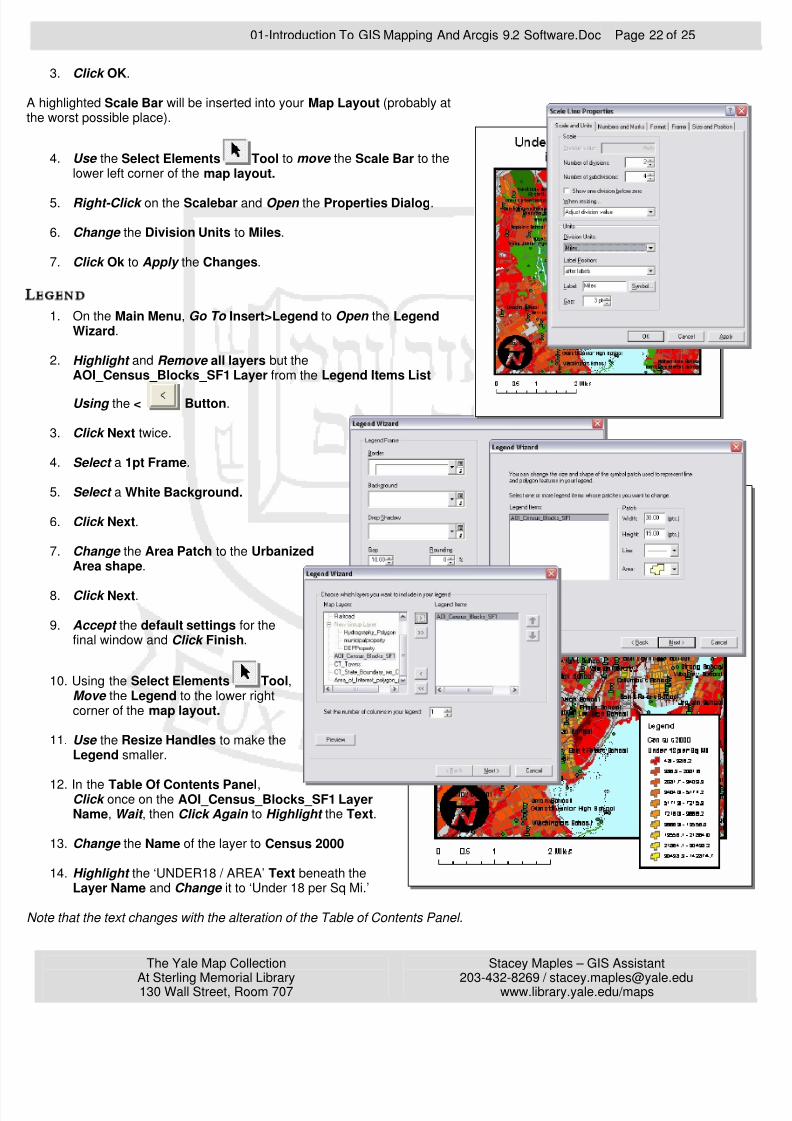
3. Click OK.
A highlighted Scale Bar will be inserted into your Map Layout (probably athe worst possible place).
4. Use the Select Elements Tool to move the Scale Bar to thelower left corner of the map layout.
5. Right-Click on the Scalebar and Open the Properties Dialog.
6. Change the Division Units to Miles.
7. Click Ok to Apply the Changes.
1. On the Main Menu, Go To Insert>Legend to Open the LegendWizard.
2. Highlight and Remove all layers but theAOI_Census_Blocks_SF1 Layer from the Legend Items List
Using the < Button.
3. Click Next twice.
4. Select a 1pt Frame.
5. Select a White Background.
6. Click Next.
7. Change the Area Patch to the UrbanizedArea shape.
8. Click Next.
9. Accept the default settings for thefinal window and Click Finish.
10. Using the Select Elements Tool,Move the Legend to the lower rightcorner of the map layout.
11. Use the Resize Handles to make theLegend smaller.
12. In the Table Of Contents Panel,Click once on the AOI_Census_Blocks_SF1 LayerName, Wait , then Click Again to Highlight the Text.
13. Change the Name of the layer to Census 2000
14. Highlight the ‘UNDER18 / AREA’ Text beneath theLayer Name and Change it to ‘Under 18 per Sq Mi.’
Note that the text changes with the alteration of the Table of Contents Panel.
8/8/2019 arc gis 92
http://slidepdf.com/reader/full/arc-gis-92 23/25
01-Introduction To GIS Mapping And Arcgis 9.2 Software.Doc Page 23 of 25
The Yale Map Collection
At Sterling Memorial Library130 Wall Street, Room 707
Stacey Maples – GIS Assistant
203-432-8269 / [email protected]/maps
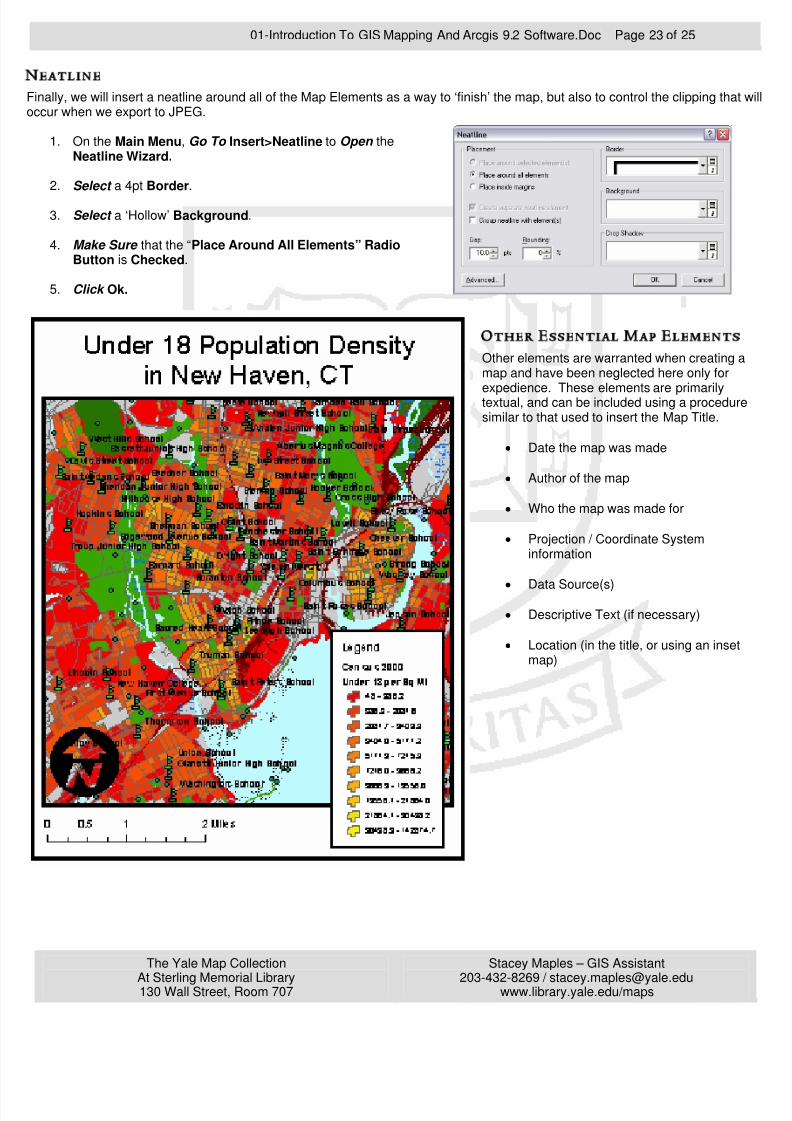
Finally, we will insert a neatline around all of the Map Elements as a way to ‘finish’ the map, but also to control the clipping thaccur when we export to JPEG.
1. On the Main Menu, Go To Insert>Neatline to Open theNeatline Wizard.
2. Select a 4pt Border.
3. Select a ‘Hollow’ Background.
4. Make Sure that the “Place Around All Elements” RadioButton is Checked.
5. Click Ok.
Other Essential Map Elements
Other elements are warranted when creating amap and have been neglected here only for
expedience. These elements are primarilytextual, and can be included using a procedursimilar to that used to insert the Map Title.
• Date the map was made
• Author of the map
• Who the map was made for
• Projection / Coordinate Systeminformation
•
Data Source(s)
• Descriptive Text (if necessary)
• Location (in the title, or using an insetmap)
8/8/2019 arc gis 92
http://slidepdf.com/reader/full/arc-gis-92 24/25
01-Introduction To GIS Mapping And Arcgis 9.2 Software.Doc Page 24 of 25
The Yale Map Collection
At Sterling Memorial Library130 Wall Street, Room 707
Stacey Maples – GIS Assistant
203-432-8269 / [email protected]/maps
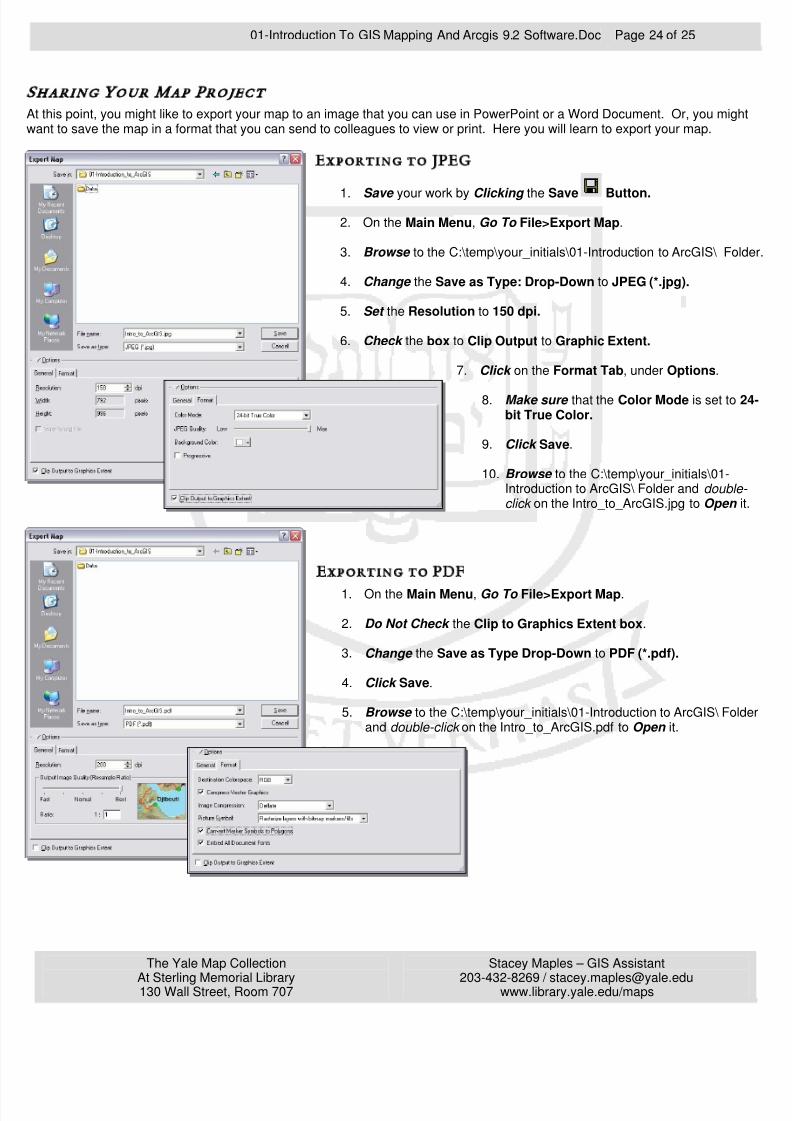
At this point, you might like to export your map to an image that you can use in PowerPoint or a Word Document. Or, you migwant to save the map in a format that you can send to colleagues to view or print. Here you will learn to export your map.
Exporting to JPEG
1. Save your work by Clicking the Save Button.
2. On the Main Menu, Go To File>Export Map.
3. Browse to the C:\temp\your_initials\01-Introduction to ArcGIS\ Fo
4. Change the Save as Type: Drop-Down to JPEG (*.jpg).
5. Set the Resolution to 150 dpi.
6. Check the box to Clip Output to Graphic Extent.
7. Click on the Format Tab, under Options.
8. Make sure that the Color Mode is set tobit True Color.
9. Click Save.
10. Browse to the C:\temp\your_initials\01-Introduction to ArcGIS\ Folder and doubleclick on the Intro_to_ArcGIS.jpg to Open
Exporting to PDF
1. On the Main Menu, Go To File>Export Map.
2. Do Not Check the Clip to Graphics Extent box.
3. Change the Save as Type Drop-Down to PDF (*.pdf).
4. Click Save.
5. Browse to the C:\temp\your_initials\01-Introduction to ArcGIS\ Foland double-click on the Intro_to_ArcGIS.pdf to Open it.
8/8/2019 arc gis 92
http://slidepdf.com/reader/full/arc-gis-92 25/25
01-Introduction To GIS Mapping And Arcgis 9.2 Software.Doc Page 25 of 25
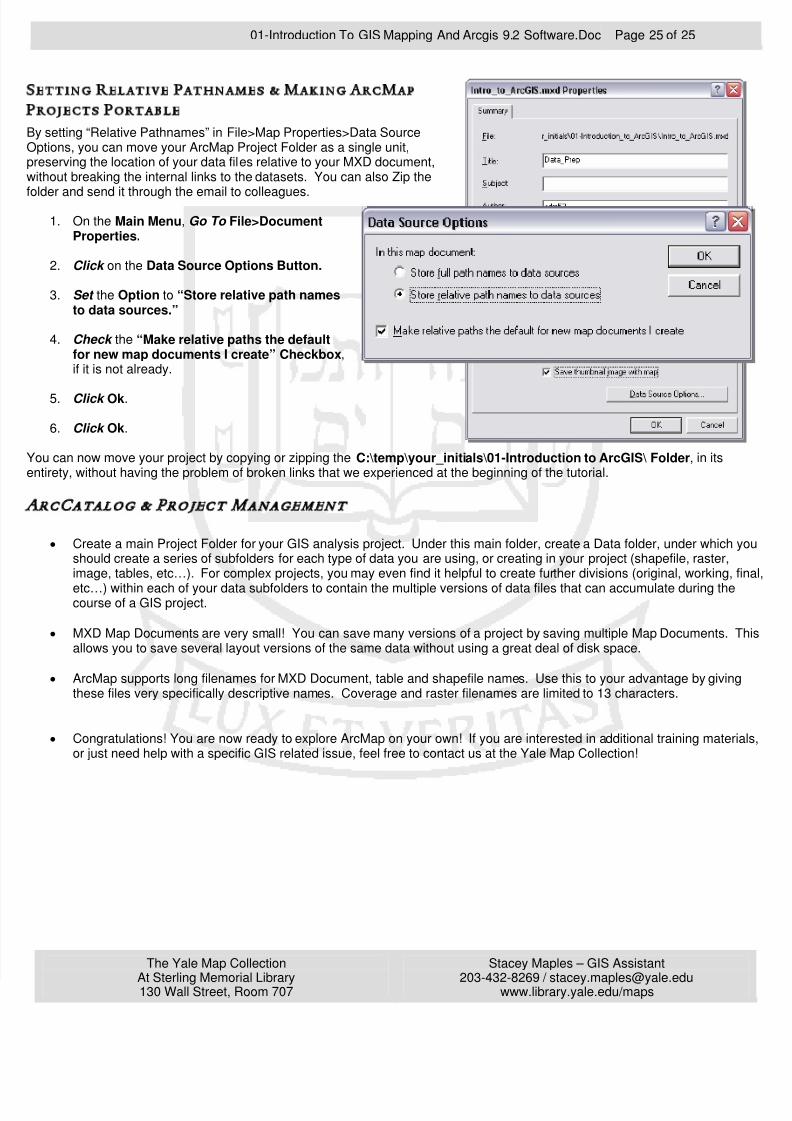
By setting “Relative Pathnames” in File>Map Properties>Data SourceOptions, you can move your ArcMap Project Folder as a single unit,reserving the location of your data files relative to your MXD document,
without breaking the internal links to the datasets. You can also Zip the
older and send it through the email to colleagues.
1. On the Main Menu, Go To File>DocumentProperties.
2. Click on the Data Source Options Button.
3. Set the Option to “Store relative path namesto data sources.”
4. Check the “Make relative paths the defaultfor new map documents I create” Checkbox,if it is not already.
5. Click Ok.
6. Click Ok.
You can now move your project by copying or zipping the C:\temp\your_initials\01-Introduction to ArcGIS\ Folder, in itsntirety, without having the problem of broken links that we experienced at the beginning of the tutorial.
• Create a main Project Folder for your GIS analysis project. Under this main folder, create a Data folder, under which yshould create a series of subfolders for each type of data you are using, or creating in your project (shapefile, raster,image, tables, etc…). For complex projects, you may even find it helpful to create further divisions (original, working, f
etc…) within each of your data subfolders to contain the multiple versions of data files that can accumulate during thecourse of a GIS project.
• MXD Map Documents are very small! You can save many versions of a project by saving multiple Map Documents. Tallows you to save several layout versions of the same data without using a great deal of disk space.
• ArcMap supports long filenames for MXD Document, table and shapefile names. Use this to your advantage by givingthese files very specifically descriptive names. Coverage and raster filenames are limited to 13 characters.
• Congratulations! You are now ready to explore ArcMap on your own! If you are interested in additional training materior just need help with a specific GIS related issue, feel free to contact us at the Yale Map Collection!