adaptation to climate change in bangladesh - ferdi · 1 introduction adaptation to climate change...
TRANSCRIPT
fondation pour les études et recherches sur le développement international
LA F
ERD
I EST
UN
E FO
ND
ATIO
N R
ECO
NN
UE
D’U
TILI
TÉ P
UBL
IQU
E.
ELLE
MET
EN
ŒU
VRE
AVEC
L’ID
DRI
L’IN
ITIA
TIVE
PO
UR
LE D
ÉVEL
OPP
EMEN
T ET
LA
GO
UVE
RNA
NC
E M
ON
DIA
LE (I
DG
M).
ELLE
CO
ORD
ON
NE
LE L
ABE
X ID
GM
+ Q
UI L
’ASS
OC
IE A
U C
ERD
I ET
À L
’IDD
RI.
CET
TE P
UBL
ICAT
ION
A B
ÉNÉF
ICIÉ
D’U
NE
AID
E D
E L’
ÉTAT
FRA
NC
AIS
GÉR
ÉE P
AR
L’AN
R A
U T
ITRE
DU
PRO
GRA
MM
E «I
NVE
STIS
SEM
ENTS
D’A
VEN
IR»
PORT
AN
T LA
RÉF
ÉREN
CE
«AN
R-10
-LA
BX-1
4-01
»
Do not quote without authors ‘ permission
AbstractClimate change is expected to disproportionately affect agriculture; however, thereis limited information on smallholder farmers ‘ overall vulnerability and adaptationneeds. This paper estimates the impact of climatic shocks on the household agriculturalincome and subsequently, on farmers ‘ adaptation strategies. Relying on data from asurvey conducted in several communities in Bangladesh in 2011 and based on an IVprobit approach, the results show that a one percentage point climate induced declinein agricultural income pushes households to adapt by almost 3 percentage points.However, certain strategies are too costly and cannot be afforded in bad times. Forthose strategies, we provide evidence of barriers that constrain the development anddeployment of adaptive measures, noticeably access to electricity and wealth.
Keywords: Adaptation, Climate Change, Vulnerability, Farmers, Bangladesh
JEL classification : D10, Q12, Q54, Q56, O13
This paper benefited from the financial support of the FERDI (Fondation pour les Etudes et Recherchessur le Developpement International) and of the program “Investissement d’Avenir” (reference ANR-10-LABX-14-01) of the French government.It has been presented at the Workshop on International Migration, CERDI, November 19-20, 2015.We are grateful to Jaime de Melo for his helpful comments on an earlier version of this paper.
Isaure Delaporte is a PhD student, University of Kent
Mathilde Maurel is Research Director at CNRS (CES-Paris 1) and Senior Fellow at Ferdi.
Adaptation to Climate Change in BangladeshIsaure Delaporte
Mathilde Maurel
• W
orking Paper •
Development Polici esJanuary
2016145

1 Introduction
Adaptation to climate change did not receive much attention in the first years of the in-ternational climate change studies, where there was more focus on mitigation and impacts[Kates, 2000], but adaptation has recently been covered more extensively due to the in-creasing vulnerability of some countries. In fact, it has been shown that some countrieswill be increasingly exposed to frequent and extreme climatic events. Long-term changesobserved by scientists in recent years include widespread shifts in rainfall amounts, oceansalinity, wind patterns and extreme weather, including droughts, heavy rain/ snow, heatwaves and the intensity of tropical cyclones [Smithers and Smit, 1997]. The effects of cli-mate change pose risks for agriculture, food and water supplies. All societies consequentlyneed to learn to cope with the changes that are predicted, especially developing countries.
The objective of this paper is to investigate the extent to which rural households engagein different strategies to cope with risks in agricultural production due to weather-relatedshocks in Bangladesh. A better understanding of the existing risk coping strategies mayinform us about households ’ ability to adapt to weather-related risk, and, potentially,inform the design of policy in the context of increasing climatic stress on the smallholderfarmers in developing countries.
The Intergovernmental Panel on Climate Change has found that the impacts of cli-mate change are not evenly distributed : the people who will be exposed to the worst ofthe impacts are the ones least able to cope with the associated risks [Smit et al., 2000].But evidence suggests that inhabitant of developing nations are not passive victims[Adger et al., 2003]. Indeed, pastoralists in the West African Sahel have adapted to copewith rainfall decreases of 25-33 % in the twentieth century [Mortimore and Adams, 2001,Cross and Barker, 1991], while resilience in the face of changing climate has been doc-umented for smallholder farmers in Bangladesh [Huq et al., 1999, Huq, 2001] and Viet-nam [Adger et al., 2012], and indigenous hunting communities in the Canadian Arctic[Berkes and Jolly, 2002]. Since the Fifth IPCC report published in 2014, the framing ofadaptation has moved further to the wider social and economic drivers of vulnerability andpeople ’ s ability to respond. There is disagreement about what developing countries shoulddo to protect themselves [Millner and Dietz, 2015]. Categories of adaptation options havebeen provided. Engineered and technological adaptation options are still the most commonadaptive responses, although there is growing experience of the value for ecosystem-based,institutional, and social measures for those who are most vulnerable.
However, much work still remains to fully understand the drivers of past adaptationefforts, the need for future adaptation, and how to mainstream climate into general de-velopment policies. Considering the existing literature, the challenge lies in identifyingcorrectly the impacts of climate change on the outcome variable [Dell et al., 2013]. The
2
more pressing econometric challenge for estimating the effects of climate change is the po-tential omitted variable bias. To the extent that all possible explanatory variables are notadequately captured in the control variables, the estimates will be biased. Besides, we haveto understand what are the adaptation strategies adopted today by rural households. Theymay take the form of reducing dependence such as diversifying food production, seeking offfarm employment or migrating, of decreasing sensitivity by avoiding building settlementsand infrastructure in high-risk locations, or by strengthening existing systems so that theyare less likely to be damaged by unusual events. Finally, there is a lack of evidence consid-ering the factors influencing people ’ s ability to adapt and the kind of adaptive strategythey opt for.
Therefore, this paper seeks to improve upon the literature on adaptation from climatechange in different ways: it focuses on Bangladesh, a country where vulnerability to cli-mate is very high and where the vast majority of people are exposed to it. It providesevidence at the household level of reactive private adaptation. In the vein of Kubik andMaurel (2015), we propose a modeling strategy in two steps, which assumes that climateimpacts individuals through only agricultural income. Moreover, we consider several cli-matic shocks. We are able to analyze the impact of climatic shocks on many adaptationoptions. This allows us to draw some conclusions on the type of adaptation strategy thatfarmers are more likely to adopt or not. Finally, we are able to distinguish the adaptationstrategies according to the constraints that individuals face, which are wealth, education,household ’ s size, and access to electricity.
Bangladesh appears to be a pertinent case study for this issue. During 1991-2010,Bangladesh was one of the four countries along with Myanmar, Honduras and Nicaraguamost affected by extreme weather events [IPCC, 2007] - 60% of the worldwide deaths causedby cyclones in the last 20 years occurred in Bangladesh [World Bank]. With an averageelevation of 4 to 5 meters above mean sea level, nearly a third of the country is susceptibleto tidal inundation and nearly 70% gets flooded during heavy monsoons. About 10% ofthe country is only 1 meter above the mean sea level, and one-third is under tidal excur-sions. Besides, the Bangladeshi economy is based predominantly on agriculture, forestry,and fishing. As a result, climate change is expected to decrease agricultural GDP by 3.1% each year, a cumulative 36 billion dollars in lost value-added for the period 2005-2050[World Bank].
To estimate the impact of climatic shocks on farmers’ adaptation strategies, we relyupon the Bangladesh Climate Change Adaptation Survey of 2011, which has been speciallytargeted to understand how individuals react to natural disasters, by providing a full rangeof possible disasters and adaptations to them. The survey covers agricultural data fromthe previous production year. It is cross-sectional and conducts, at one point of time fromDecember 2010 to February 2011, household and community-level surveys, which report
3
the incidence of climatic shocks at the community level over the last 5 years as well asadaptation options considered by households.
In order to estimate the impact of climatic shocks on the household agricultural incomeand subsequently, on farmers ’ adaptation strategies, we rely on a two-stage least-squaresapproach. First, we proceed with an analysis of the first-stage regression estimating theimpact of climatic shocks on agricultural income. This analysis reveals that climatic shockshave a negative effect on agricultural income. In the second-stage regression of the two-stage least-squares, we estimate the impact of agricultural income instrumented by climaticshocks on the adaptation options. We expect agricultural income to be negatively corre-lated with the adaptation options: the less agricultural income the households get due toclimatic shocks, the more they will change their strategy. Our results confirm that climaticshocks are an important determinant of agricultural income and that Bangladeshi farmersundertake a variety of adaptation options. However, the probability of resorting to certainoptions is found to decrease when agricultural income decreases: opting for changing cropvariety or crop type, for irrigating or irrigating more is conditional upon wealth, education,size of the household, access to electricity.
The rest of the paper is organised as follows. Section 2 reviews the literature, whilesection 3 introduces the database. Empirical strategy and results are presented in sections4 and 5. In section 6, we investigate the reasons why the probability of choosing certainoptions is positively correlated with agricultural income. We argue that it is due to nonlinearities, like the discriminatory effect of wealth, which implies that only rich, educated,or endowed with an access to electricity, individuals can afford certain adaptation strategies.Finally, Section 7 summarizes the results as well as highlights their policy implications.
2 Related literature
In the first years of the international climate change studies, there was more focus onimpacts and mitigation [Kates, 2000]. The common view was to find any action thatwould allow to permanently eliminate or reduce the long-term risk and hazards of climatechange to human life. However, starting in the late 1990s, a new topic for the social scienceshas gained importance in climate change research: adaptation [Smithers and Smit, 1997].It refers to the ability of natural or human systems to adjust to climate change (includingclimate variability and extremes) in order to cope with the inevitable consequences.
Impacts of climate change
Many studies attempt to assess the overall impacts of climate change on one or severaldeveloping countries. Some researches have examined the exposure of households of devel-oping countries to natural hazards and have argued that it can affect the flow of people
4
into poverty [Carter et al., 2007]. For instance, it has been shown that a household af-fected by drought in the past was 15 times more likely to fall into poverty [Krishna, 2006].Indeed, in Andhra Pradesh, drought is a major factor leading to an increase of poverty.Another study [Rodriguez-Oreggia et al., 2013] finds that climatic shocks lead to a signifi-cant rise in poverty by between 1.5% and 3.7% from 2000 to 2005 at the municipal level inMexico. Also, Baez et al (2014) investigates the causal consequences of rainfall shocks inGuatemala and the study reveals substantial negative effects raising poverty by 18 percent.
Other studies look specifically at sectoral impacts of climate change. Climate change isexpected to impact agricultural and land productivity. Stage (2010) provide a useful liter-ature review on this subject. Apart from the studies analysing the impact on agriculture,the literature on this topic is limited. Spalding-Fecher and Moodley (2002) focus on thehealth impacts in South Africa. Velarde et al (2005) investigate the impacts on protectedareas in Africa by incorporating the effect of increasing income on the willingness to payfor a protected nature.
Due to the fact that developing countries rely mostly on agriculture, many studies havefocused on the impacts on agriculture and on production values. Mendelsohn and Di-nar (1999) provide a useful subdivision by methodology: agronomic/agronomic-economicstudies, agro-ecological zone studies, and Ricardian studies. The agronomic and agronomic-economic approaches examine what the implications of anticipated climate change will beon the yields of various crops currently being grown. Studies in this literature includeRosenzweig and Parry (1994), who assess the potential impact of climate change on worldfood supply. Another study by Matthews et al (1997) looks at the impacts on rice yieldsin several Asian countries. Njie et al (2006) study yield effects in the Gambia. Lobell etal (2008) estimate crop yield impacts in 12 food-insecure regions and Reid et al (2008)use agricultural yield estimates for simulating economy-wide effects in Namibia. Thesestudies reveal that developing countries are impacted negatively. More precisely, resultsindicate South Asia and Southern Africa as two regions that, without sufficient adaptationmeasures, will likely suffer negative impacts on several crops.
Agro-ecological zone studies, on the other hand, suppose that when climate changeleads to shifts in agro-ecological zones, this will lead farmers to adapt by switching fromthe crops that they currently grow to those crops that are currently grown in the zonethat they are shifting into. This method appears not to have been widely applied in de-veloping countries, although a recent set of World Bank studies of climate change impactson African agriculture [Seo et al., 2008b, Seo et al., 2008a, Seo et al., 2008c] can be seenas examples. The results indicate that farmers carefully consider the climate and otherconditions of their farm when making their crop and irrigation decisions.
5
Finally, the Ricardian method was introduced by Mendelsohn et al (1994). The as-sumption is that all farms choose their production portfolio so as to maximize their profits,given their characteristics including the local climate. If climate change leads to a switchfrom climate state A to climate state B for farms in a particular region, farms in the regionwill adapt by switching to the production portfolio chosen by farms elsewhere that arecurrently in climate state B. The economic impact of the switch from A to B can thenbe estimated either by studying the change in net revenue that the switch in productionwill entail, or by studying the difference in land values between the farms in the area andthe farms that are currently experiencing climate state B. Applications of this method indeveloping countries include Mendelsohn and Dinar (1999), for Brazil and India; Timmins(2006), who studies a range of land uses in Brazil; Deressa et al (2005) and Gbetibouo andHassan (2005), who study South African agriculture as well as Seo and Mendelsohn (2007a,2007b, 2008b); and Seo et al (2008a), who study crop choice and livestock management inAfrican countries; Kurukulasuriya and Mendelsohn (2006, 2007, 2008) and Kurukulasuriyaet al (2006), who study crop patterns and irrigation in African countries; Lotsch (2007) andMaddison et al (2007), who also study African agriculture; Mendelsohn and Seo (2007) andSeo and Mendelsohn (2008), who study livestock management and crop choice in SouthAmerican farms. These studies find that even though the agricultural sector is sensitive toclimate, individual farmers do take local climates into account, and their ability to do sowill help mitigate the impacts of global warming.
Adaptation
Given the potential risks associated with climate change, a serious effort on charac-terizing and understanding adaptation is therefore now underway. Tol (2005) argues thatincreasing developing countries ’ adaptive capacity through development aid is more fruit-ful than climate change mitigation. Researchers have proposed numerous dimensions toadaptation. Two of these dimensions have been useful for thinking about individual be-havior: proactive versus reactive adaptation, and public versus private adaptation. Theformer dimension refers to the form, or more specifically, to the timing of the adaptation(ex ante / ex post)1. The latter dimension refers to the actors, and therefore to the ques-tion of who adapts (public agencies, or residents at risk). The type of adaptation matters: whether it is a public or private initiative influences the efficiency of the adaptive strategy.
The empirical literature has two main purposes. One is to inform mitigation policy byquantifying impacts of climate change or adaptation potentials. The other purpose is toexplore quantitatively who adapts, how and why. The article by Eriksen and Lind (2009)on conflict and insecurity in two areas in Kenya argues that adaptation must take place
1Reactive adaptation is the immediate and ex post response to climate change. It is used to regainstability. Proactive adaptation is ex ante, it aims at reducing the long-term damage, risk and vulnerabilitydue to climate change since it involves long-term decision making.
6
at the local level to be effective and that it is more a matter of facilitating adaptationof current practices rather than imposing nationally decided adaptation options. Severalarticles, also, address adaptation to climate change in specific rural settings. Barbier et al(2009) compare different responses of households in northern Burkina Faso to drought byanalyzing farm decisions after years with poor and good harvests. It concludes that thehouseholds have developed strategies for income diversification as a way of reducing depen-dence on climate, but vulnerability is still considerable. A similar conclusion is reached byRoncoli et al (2001) who analyze the responses enacted by families of the Central Plateauin Burkina Faso during the year that followed a severe drought in 1997. Mertz et al (2009)attempt to determine the drivers of agricultural change in Senegal and estimates the rel-ative importance of climate in various adaptive strategies. Households identify wind andoccasional excess rainfall as the most destructive climate factors. However, they assigneconomic, political, and social rather than climate factors as the main reasons for change.
Moreover, several studies also empirically examine which factors influence adaptation.For instance, in a study taking place in the Morogoro Region of Tanzania, Below et al(2012) develop an activity-based adaptation index (AAI) and explore the relationship be-tween socio-economic variables and farmers ’ adaptation behavior. They find that publicinvestment in rural infrastructure, the availability and technically efficient use of inputs, thequality of the educational system that provides equal chances for women, the strengtheningof social capital, agricultural extension, microcredit services tend to improve the adapta-tion of the farmers. In a similar study taking place in South Africa and Ethiopia, Bryan etal (2009) found that the most common adaptation strategies include: use of different cropsor crop varieties, planting trees, soil conservation, changing planting dates, and irrigation.However, despite having experienced changes in temperature and rainfall, a large percent-age of farmers did not make any adjustments to their farming practices. The main barriersto adaptation cited by farmers were the lack of access to credit in South Africa and the lackof access to land, information, and credit in Ethiopia. Similarly, in a case study of Ghana,Fosu-Mensah et al (2012) highlighted the importance of several determinants of adaptivecapacity such as land tenure, soil fertility, and access to extension service and credit. Otherregions of the world are impacted as shown by Jones and Boyd (2011). They explored someof the underlying features of social barriers to adaptation and drew on insights from twocase studies in the Western Nepal. Other studies provide evidence of such barriers to adap-tation more generally in the case of African countries [Hassan et al., 2008], or focusing onone localization: the Nile basin of Ethiopia [Deressa et al., 2009] for instance. Therefore,realizing that inevitable changes in climate condition have a strong impact on vulnerabil-ity, action is required to enhance the adaptive capacity of the most vulnerable societiesand groups. This is an emerging research agenda that aims at identifying determinants ofresilience.
7
3 Data
As mentioned previously, the purpose of this research study is to estimate the impact ofclimatic shocks on household agricultural income and subsequently on farmers ’ adaptationoptions in Bangladesh. To address this issue, we use the first round of the BangladeshClimate Change Adaptation Survey. The BCCAS I2 contains cross-sectional data on 800farming households in Bangladesh. It provides information on demographic characteristics,agricultural production and income, incidence of climatic shocks in the last five years andadaptation options. A detailed list of the climatic shocks and adaptation options is availablein Table 1. The survey was conducted at one point of time between December 2010 andFebruary 2011, covering agricultural data from the previous production year. The unitof analysis is the rural household, which operates as the ultimate decision making unit infarming and livelihood processes.
Demographic characteristics
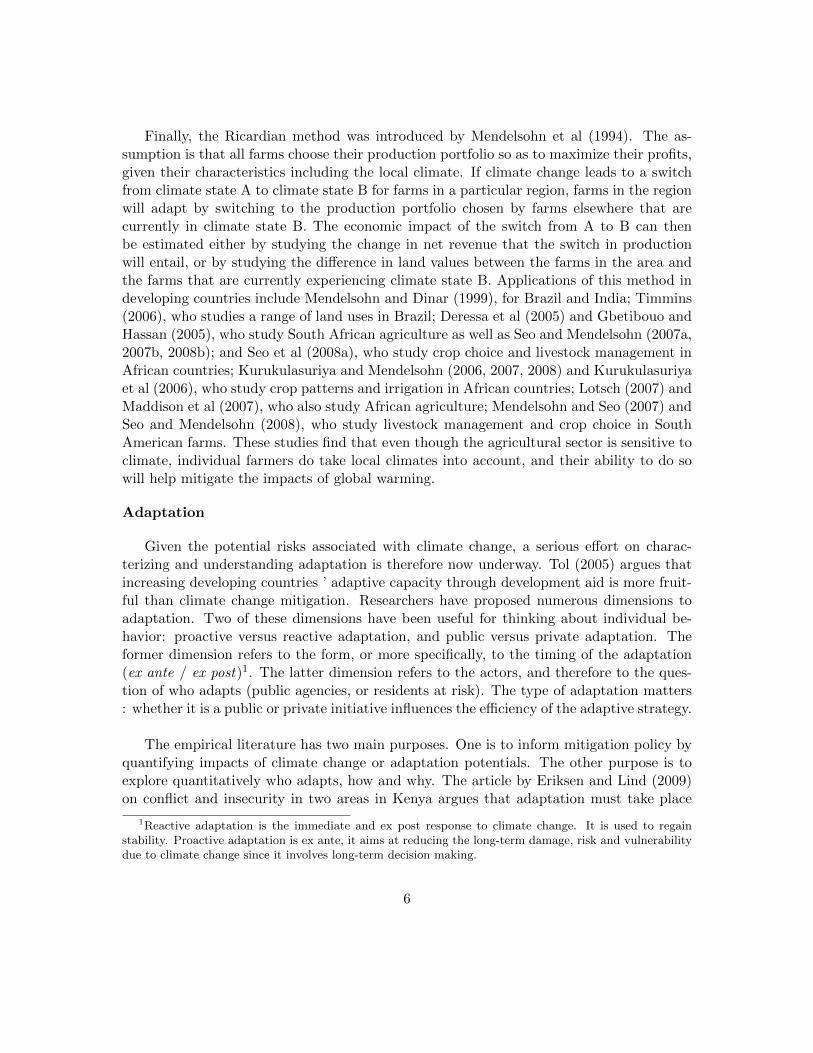
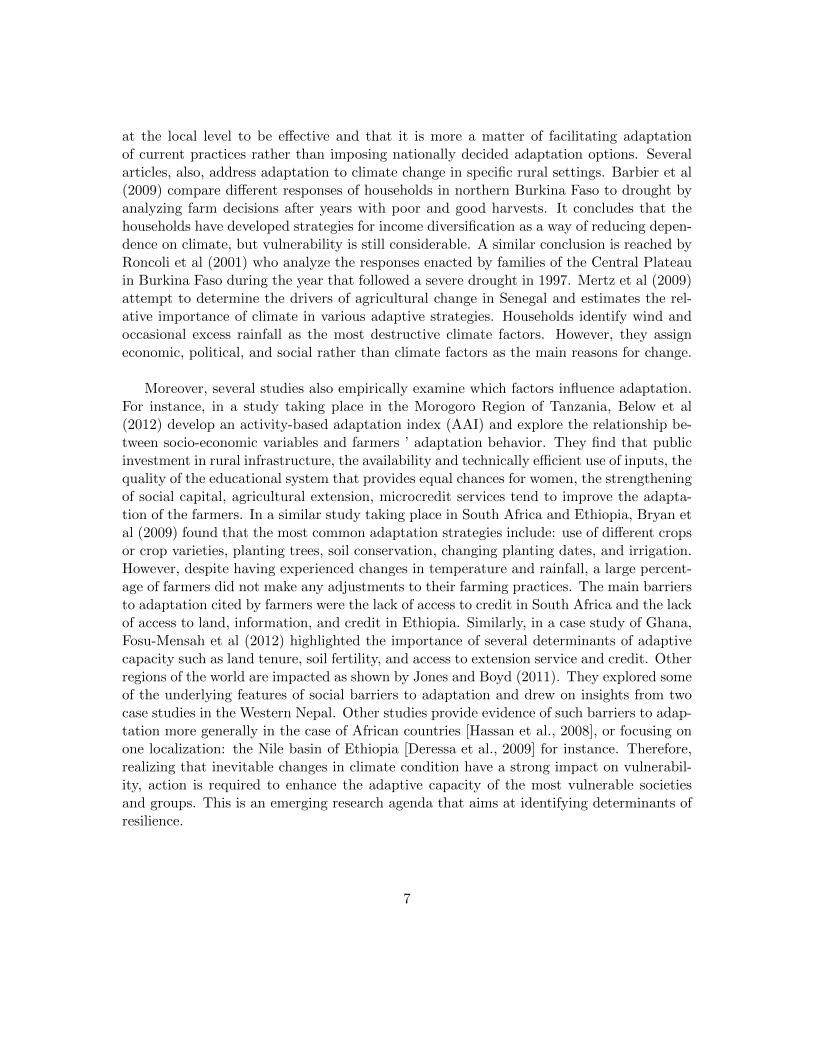
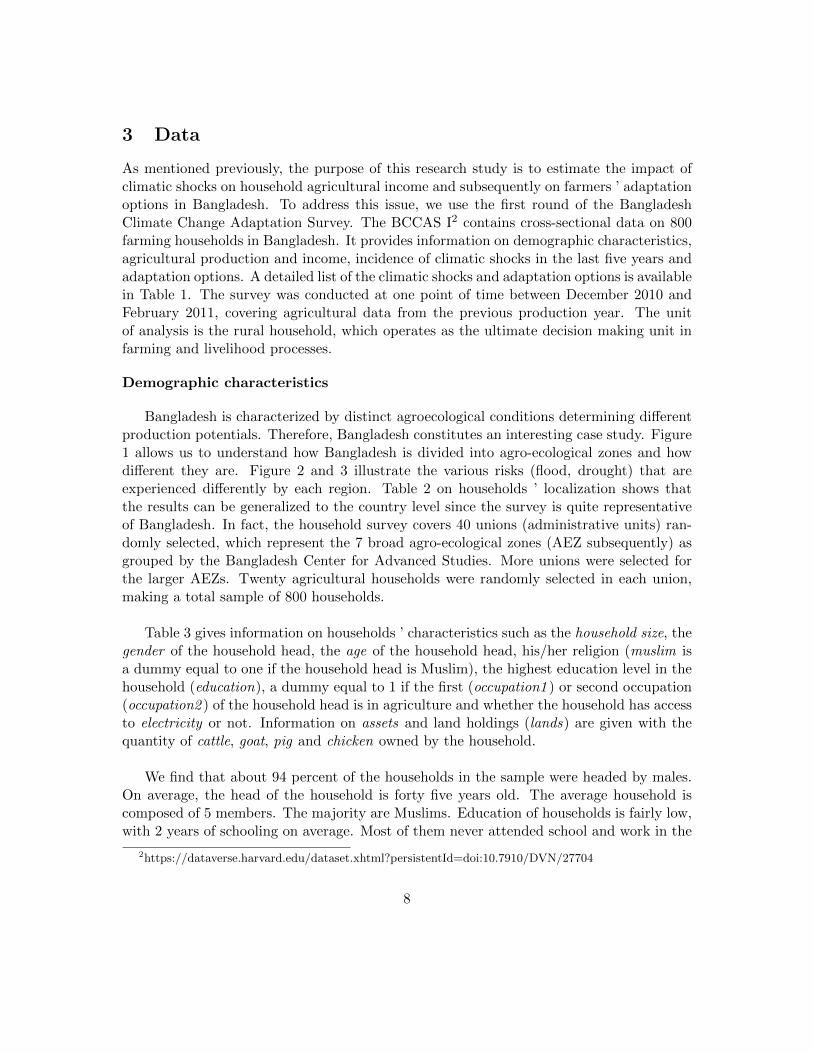
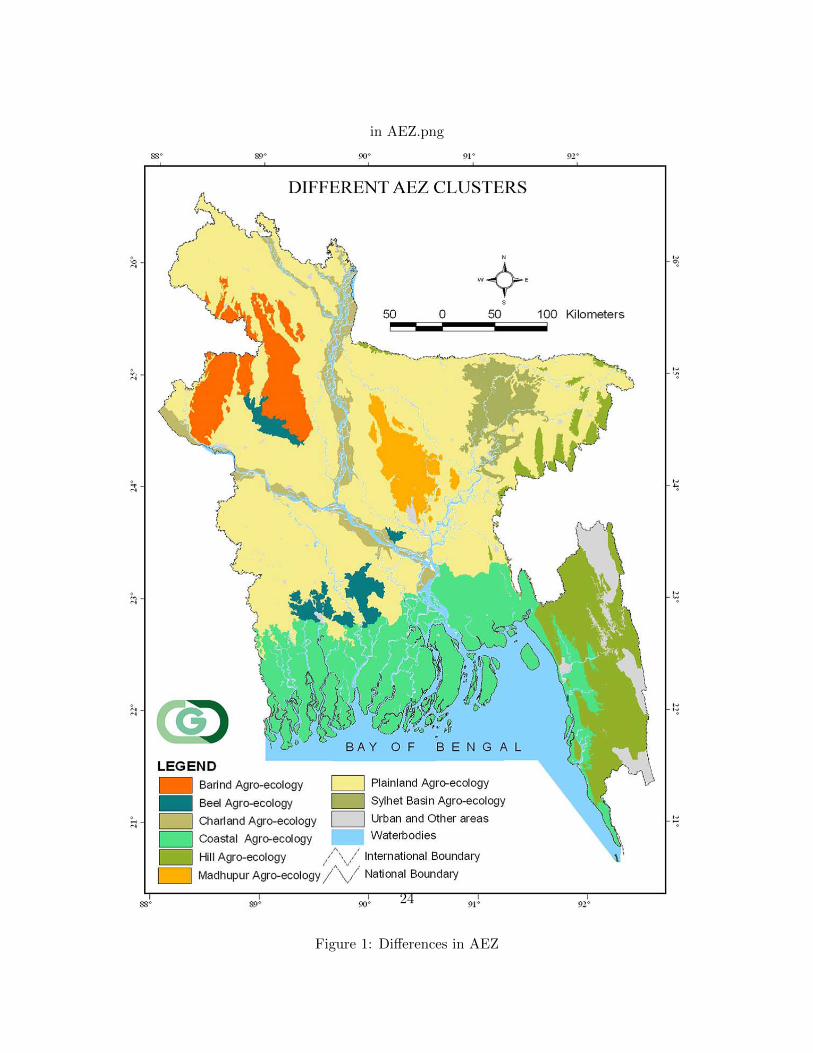
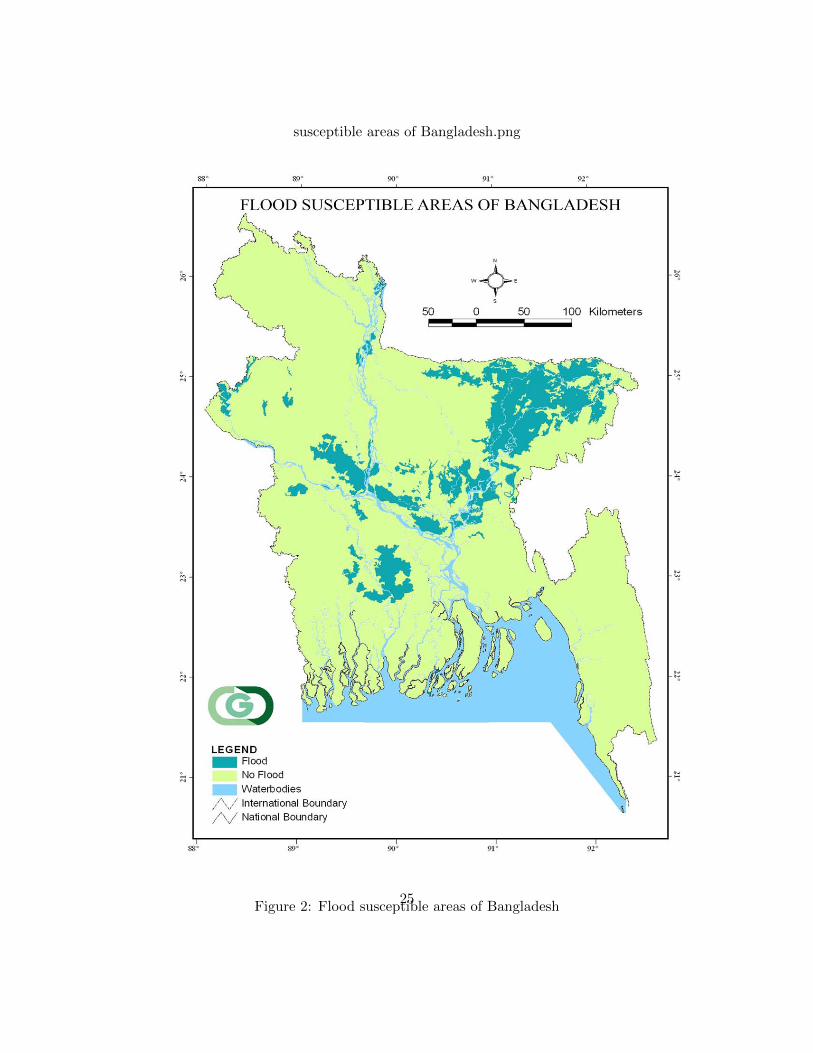
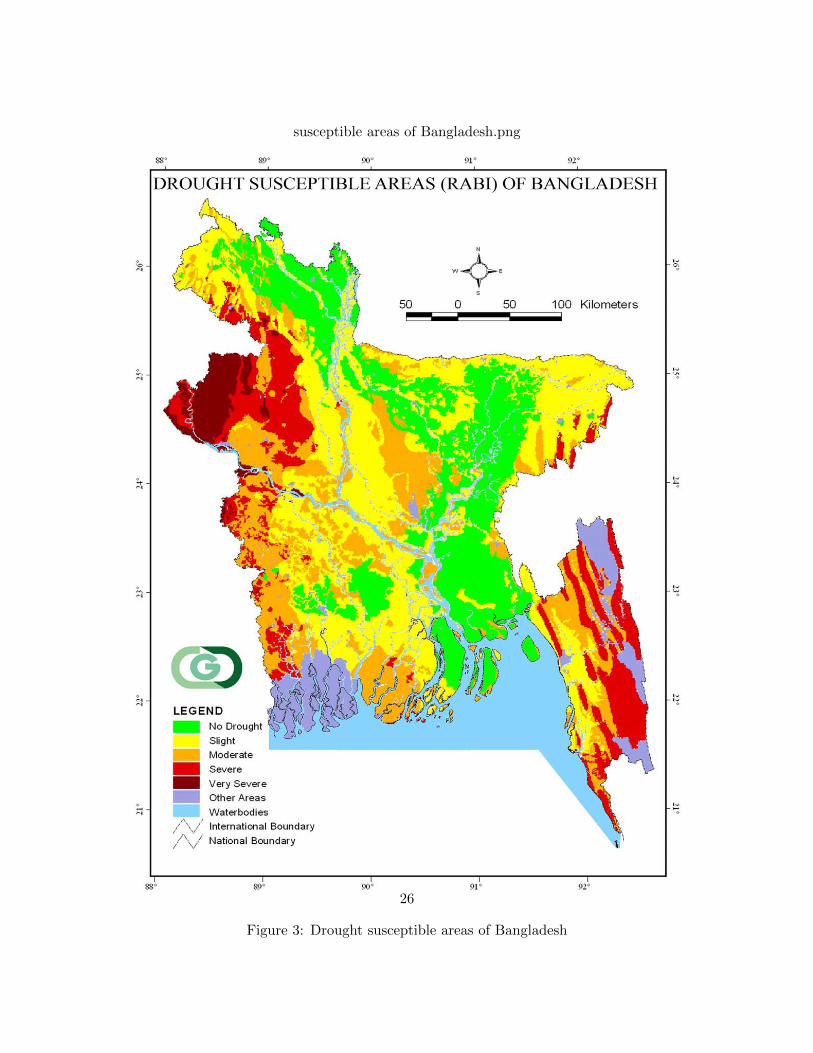
Bangladesh is characterized by distinct agroecological conditions determining differentproduction potentials. Therefore, Bangladesh constitutes an interesting case study. Figure1 allows us to understand how Bangladesh is divided into agro-ecological zones and howdifferent they are. Figure 2 and 3 illustrate the various risks (flood, drought) that areexperienced differently by each region. Table 2 on households ’ localization shows thatthe results can be generalized to the country level since the survey is quite representativeof Bangladesh. In fact, the household survey covers 40 unions (administrative units) ran-domly selected, which represent the 7 broad agro-ecological zones (AEZ subsequently) asgrouped by the Bangladesh Center for Advanced Studies. More unions were selected forthe larger AEZs. Twenty agricultural households were randomly selected in each union,making a total sample of 800 households.
Table 3 gives information on households ’ characteristics such as the household size, thegender of the household head, the age of the household head, his/her religion (muslim isa dummy equal to one if the household head is Muslim), the highest education level in thehousehold (education), a dummy equal to 1 if the first (occupation1 ) or second occupation(occupation2 ) of the household head is in agriculture and whether the household has accessto electricity or not. Information on assets and land holdings (lands) are given with thequantity of cattle, goat, pig and chicken owned by the household.
We find that about 94 percent of the households in the sample were headed by males.On average, the head of the household is forty five years old. The average household iscomposed of 5 members. The majority are Muslims. Education of households is fairly low,with 2 years of schooling on average. Most of them never attended school and work in the
2https://dataverse.harvard.edu/dataset.xhtml?persistentId=doi:10.7910/DVN/27704
8
agricultural sector, which constitutes the first occupation for 77%. The majority of thehouseholds don’t have access to electricity (54%). Finally, they are holding on average 3.47lands and 6.61 assets with 1.17 cattle and 9.67 chickens.
Agricultural production
Table 4 provides information on the soil type, the crop type and the agricultural incomeof the households. The average household produces 6.33 different crops with more plotproductions (3.73) than non plot productions (2.60). They have, in majority, cultivablelands with a clay-loam type of soil. The mean of the agricultural income is 31 426 BDT(domestic currency in Bangladesh) which is equivalent to 404 USD. According to the WorldBank, the GDP per capita in Bangladesh is 841.5 USD in 2011 (65 158 BDT). The meanagricultural income of the sample is, therefore, lower than the GDP per capita measurewhich reflects that the agricultural sector provides employment and income to the poorestand most vulnerable members of the bangladeshi society.
Climatic shocks
The surveyed households were asked about natural hazards that adversely affected theiragricultural harvest or their agricultural land. More than half of the respondents (54.65%) reported that their agricultural plot had been affected by a natural hazard in the lastfive years. We construct dummy variables taking the value 1 if at least two (up to five)individuals in the community responded yes to the following question: “Did this naturaldisaster occur in the community in the past 5 years ?” and 0 otherwise (Table 5). Theseindividuals were chosen according to their functions : the administrative leader of the com-munity, the traditional leader of the community, a teacher/local elite or finally, workingin farming. These dummies represent hazards that happen at the community level and nomore at the household level as reported in the survey. The most commonly cited hazardswere pestilence stricken (60 %), floods (55 %) and droughts (52.50 %).
From now on, we also make the distinction between two types of hazards: the firsttype refers to weather shocks like drought, flood, while the second refers to diseases, likepestilence stricken or livestock epidemic. In fact, weather shocks have a direct impact onthe household agricultural income whereas diseases that concern livestock have an indirectimpact on the household agricultural income through a reduced livestock ’s productivityfor instance. Due to this difference, we separate the two kinds of shocks.
Adaptation options
Households are asked whether they had made any adjustments in their farming prac-tices. Twenty adaptation options are considered in the dataset, and they can happensimultaneously. We compute a dummy taking the value 1 if the household made at least
9
one change (more than one) out of the twenty and 0 if not. Then, we consider twentydummies - i varying from 1 to 20 - taking the value 1 if the household engages in the adap-tation strategy i and 0 otherwise. Results (Table 6) show that a very high percentage ofthe households (86.25 percent) changed their farming practices due to climate change. Theresults also highlight the respective importance of each adaptation option : changing cropvariety (64.14 %), irrigating fields (62.48 %) or intensifying irrigation (63.59 %), buildinga water harvesting system (23.31 %), changing crop type (19.59 %), increasing the amountof land under production (16.69 %) and seeking off farm employment (16.69 %) being theoptions most frequently cited.
Certain options are less frequently mentioned, which may reflect the fact that theadaptive capacities within agriculture remain low, and also that the nature of the datasetis cross-sectional, which does not allow us to make an analysis of the adaptation of theproductive technology over the long run. The observed level of potential adjustments toclimate change is negligible for change and implement soil and water management tech-niques (5% in both cases), mix crop and livestock production, mix crop and fish farmingproduction (respectively 4 and 3%), change from crop to livestock production and from live-stock to crop production (1 and 2%). Not surprisingly, households have a limited access tofinance: only 1 per cent of households in our sample declare resorting to formal insurance.Another 1% can afford setting up communal seed banks/food storage. Some strategies aremore expensive and proactive than others: change crop variety, change crop type, changesoil and water management techniques, implement soil and water management techniques,build water harvesting scheme for domestic consumption, build water harvesting schemefor crops, irrigate and irrigate more, change from livestock to crop production, and changefrom crop to livestock production. However, changing the amount of land under produc-tion, changing the pattern of crop consumption, mixing crop and livestock production andmixing crop and fish farming production, seeking off farm employment and migrating tothis place from another can be implemented ex post, once the natural hazard occurred(reactive adaptations). They correspond to a more passive way of adaptation to climatechange, requiring less budgetary resources.
4 Empirical strategy
Following Maurel and Tuccio (2015) and Kublik and Maurel (2015) , we assume that cli-mate impacts agricultural income (equation 2), which in turn obliges farmers to adapt(equation 1). Households adopt economic strategies not only to maximize household earn-ings but also to cope with the risk, which is mainly due to natural hazards. The latter donot impact the farmers decision directly, for example through an amenity value or throughthe households preferences for a given climatic setting. Natural hazards affect rural behav-iors solely through the decline in agricultural yields.
10
In our empirical strategy, weather serves as an instrument for agricultural income whichappears as the main explanatory variable in the decision for a farmer i in a village j toadopt an adaptation strategy Aij as expressed in equation 1:
Aij = f(Yij , Xij) + uij (1)
where Y is the logarithm of agricultural income, and the vector of controls X refers tohousehold characteristics such as the gender of household head (gender), the age of thehousehold head (age), the highest level of education in the household (education), mus-lim taking the value one if is Muslim, occupation1 (occupation2 ) if the first (or secondoccupation) of the household head is in agriculture, electricity taking the value one if thehousehold has access to electricity and holdings (assets and lands).
Agricultural income is determined as a function of natural hazards Hazardj in a villagej, of land units Lij , soil type Sij , and production type Pij :
Yij = f(Lij , Sij , Pij , Hazardj) + vij (2)
As mentioned earlier, we distinguish two types of hazards: the first type refers toweather shocks like drought, flood, while the second refers to diseases, such as pestilencestricken or livestock epidemic (see section 3).
5 Results
The agricultural equation
First, we estimate the impact of weather shocks and diseases on agricultural income asin eq. (2) in order to assess the viability of the instrument in the IV probit model. Unlikeprevious studies, that use temperature and rainfalls in levels (Mendelsohn et al., 1994), tem-perature and rainfalls shocks ([Maurel et al., 2015, Maurel et al., 2013], Feng et al (2012),Kelly et al (2005) amongst others), or temperature and temperature squared in the grow-ing season 2008 [Schlenker and Roberts, 2008], we rely on natural hazards: drought, tidalwave, river erosion, pestilence stricken, livestock epidemic, flood and cyclone, which arerelated to climate change. Climatic and diseases variables display a certain level of multi-collinearity, implying that we cannot consider them simultaneously in a single model. Weconsider therefore diseases related to livestock and plague on the one hand, and hazardsrelated to the weather on the other hand. The diseases will allow estimating the likelihoodof adopting one of the following options: mix crop and livestock production, change fromcrop to livestock production, and change from livestock to crop production. Those strate-gies are more likely to result from animal diseases than weather anomalies.
11
Table 7 displays the results for agricultural income. In columns 1 to 3, we take intoaccount only the natural hazards related to the weather as predictors of the agriculturalincome whereas in columns 4 to 6, we take into account only the diseases. The moreland household has, the more the agricultural income it gets. The plot type matters sincehomestead, cultivable lands, pasture, bush, cultivable pond and derelict pond have all asignificant impact on agricultural income. The soil type considered here by clay, loam,sandy, clay-loam and sandy-loam decreases the agricultural income. The bigger the size ofthe land, the higher the agricultural income, as expected. Natural hazards have an impacton agricultural income, which is significant at the usual level. Floods, drought, and tidalwaves on one hand (column 1), and pestilence and livestock epidemic (column 4) on theother hand, lower agricultural income. In order to account for the fact that natural hazardsare aggregated at the community level, while the estimation is done at the household level,we correct standard errors by clustering (columns 2 and 5) and by applying the Moultonprocedure (columns 3 and 6).
The adaptation equation
We turn now to the adaptation equation which consists in estimating the impact ofagricultural income instrumented by natural hazards on farmers ’ adaptation options. Weconsider first the farmers ’ decision to adapt independently from any specific adaptation.Then, we consider each adaptation option separately. Table 8 reports the results. TheWald test confirms the validity of the instruments. Marginal effects are reported for easeof interpretation. For the average household, a one percentage point decrease in agri-cultural income increases the probability to adapt by almost 3 percentage points. Thisresult is highly significant. The number of assets significantly influences the decision toadapt : richer households are more likely to change their strategy as a response to climaticshocks. However, it is noteworthy that the gender of the household head, the age, educa-tion, religion and occupation dummies as well as having access to electricity does not affectsignificantly the likelihood of adaptation.
We estimate subsequently the impact of agricultural income instrumented by naturalhazards on each specific adaptation option. The results are given in Table 9 panels Aand B. We distinguish options that address negative shocks in a passive way, as they donot require any resource to be invested (Panel A) from proactive options that are adoptedfollowing an increase in income (Panel B). In order to adapt to climate change and es-pecially to a decrease in the agricultural income due to climatic shocks, rural householdsof Bangladesh adopt the following strategies: they change the amount of land under pro-duction, change the pattern of crop consumption, change the field location, they seek offfarm employment, they migrate to this place from another. The following strategies aremore resource demanding and correspond to a more proactive behavior. They are chosenif they can be afforded, thanks to an increase in the agricultural income: change crop
12
variety, change crop type, irrigate, irrigate more, change from livestock to crop produc-tion (Panel B). We do not find any significant impact of a variation of the agriculturalincome due to climatic shocks on the probability that the households opt for the follow-ing strategies : implement or change soil and water management techniques, build waterharvesting scheme for domestic consumption, build water harvesting scheme for crops andchange from crop to livestock production. In certain cases the procedure does not lead toconvergence, which might be due to the too small number of observations: mix crop andlivestock production, build water harvesting scheme for livestock, buy insurance, set upcommunal seed banks/food storage.
Panel A displays the estimates. A 1 percentage point decrease in the agricultural incomeincreases the probability that the households change the amount of land under productionby 2.46 pp, change field location by 1.98 pp, change crop consumption by 1.71 pp, migrateto this place from another by 1.43 pp and finally, seek off farm employment by 1.10 pp.As recorded in Panel B, a 1 percentage point increase in the agricultural income increasesthe probability that the households opt for a change of crop type by 2.93 pp, intensifyirrigation by 2.66 pp, irrigate by 2.56 pp, change from livestock to crop production by 2.17pp and change crop variety by 1.50 pp. Panel B options are more expensive as comparedwith the options displayed in Panel A. We argue that our results reflect the existence ofconstraints that restrict the access to the most resource-demanding options. We examinefour candidates: wealth, education, size of the household, and finally access to electricity,that may determine the farmers ’ adaptive capacity.
6 Adaptive capacity
The idea that adaptive capacity may depend on certain conditions is not out of line withthe existing literature on the climate change adaptation. Whether it is expressed in termsof assets, capital resources, financial means, wealth, or poverty, the economic condition ofnations and groups is a strong determinant of adaptive capacity [Kates, 2000]. It is widelyaccepted that wealthy nations are better prepared to bear the costs of adaptation to climatechange impacts and risks than poorer nations [Goklany, 2007, Burton et al., 2002]. In thissection, we add to this literature by focusing on panel B strategies. We provide supportto the view that opting for those strategies is constrained by the availability of certainresources: economic wealth, education, the size of the household and finally, whetherthe household has access to electricity or not. Access to electricity is considered in theliterature as a proxy for poverty and socio-economic status, and as a way to escape frompoverty [Chaurey et al., 2004, Kanagawa and Nakata, 2007] traps through a saving of time,which can be invested in educational and health spending, or in infrastructure such aspumps for irrigating. Wealthier households might be expected to show up more flexibilityin adapting to climate change due to the fact that they are more able to afford even
13
slightly more expensive strategies [Reardon and Taylor, 1996]. Educated farmers are moreable to treat the information about climate hazards and they will be more likely to optfor certain adaptation options, as compared to the least educated [Deressa et al., 2009,Bryan et al., 2009]. Bigger households have more (labor) resources, that can be investedin order to diversify the sources of income. Beyond the fact that it represents also a proxyfor poverty, access to electricity is needed to resort to options, such as irrigate, irrigatemore, as they require pumping water.
Testing the results for the richest of the sample
Some adaptation options cannot be afforded by the poorest households if the agri-cultural income diminishes because they are expensive: change crop type, change cropvariety, irrigate, irrigate more and change from livestock to crop production. We generatea dummy variable “rich” equal to 1 if the household holds more assets and lands than theaverage (which is respectively 6 assets, 3 lands) and 0 if not. The results are providedin Table 10. In order to simplify the comparison, Panel A displays the results for theentire sample whereas Panel B incorporates only the richest of the sample. We find thatricher households, as opposed to the entire sample, are able to react to a decrease in agri-cultural income by changing crop variety and crop type, also by changing from livestockto crop production, although the sign of the income variable is not significant. Finally,richer household do invest significantly more in order to irrigate and irrigate more whentheir revenue increases, as estimates in Panel B are bigger than in Panel A. Those resultsprovide evidence that wealth matters as relatively richer households are able to react to adecline in their revenue by adopting two more farming strategies. They also invest morein improving the irrigating capacities.
Testing the results for the most educated
We turn now to the second hypothesis, namely that certain adaptation options are onlyconsidered by the most educated households because of an unequal access to information.Since the majority of the households never attended school, we generate a dummy variable“educated” equal to 1 if the highest level of education in the household is equal to oneyear of schooling or more and 0 if not. We pay a particular attention to the followingoptions as before: change crop type, change crop variety, irrigate, irrigate more and changefrom livestock to crop production. As for wealth, Panel A displays the results for theentire sample whereas Panel C show the estimates obtained when taking into accountonly the most educated households. We do not find any significant difference, but forchanging crop variety : farmers with at least one year of schooling invest more in the latterstrategy than the entire sample. This can be explained by the fact that households areprovided with information from other sources: the extension agents who visit/contact thehouseholds, coming from various organizations such as Government Agencies, agricultureresearch stations, NGOs, Community-based organizations and finally, the private sector.
14
Of course, households can also receive information through television, radio, newsletter,neighbors or friends, shopkeepers or traders, field days, agricultural shows, etc...
Testing the results for larger households
A natural hypothesis is that the adoption of adaptation options are easier for largehouseholds that can send their members away for instance in order to diversify their in-come. Since the average household is composed of 5 members, we generate a dummyvariable“largehh” equal to 1 if the size of the household is higher than 5 and 0 if not. Theestimates of Panel D are slightly lower, suggesting that having additional household labor,such as extended family members and older children, relaxes the constraint and mightfacilitate changing strategy and increase the decision to adapt.
Testing the results for households that have access to electricity
Does access to electricity facilitate adaptation to a reduced agricultural income due toclimate change ? We generate a dummy variable “electricity” equal to 1 if the householdbenefits from an electricity connection (national grid or solar system) and 0 if not. Re-sults show that households that experience a decrease in their income and have access toelectricity are coping to this decrease by changing crop variety and crop type, while thosewho do not have access cannot resort to those strategies. Besides, estimates of the incomevariable for irrigation and intensifying irrigation are much lower in Panel E compared toPanel A. Those results support the view that households that have access to electricity areless discriminated as the income matters less to cope with climate.
7 Conclusion
We estimate the impact of climatic shocks on household agricultural income and sub-sequently, on adaptation options in Bangladesh. The first stage least square approachconsists in estimating the impact of climatic shocks reported at the community level onhousehold agricultural income. Then, we turn to the second stage least square and esti-mate the impact of a decrease in the agricultural income instrumented by climatic shockson households adaptation options. We find that a one percentage point climate induceddecrease in agricultural income increases the probability to adapt by almost 3 percentagepoints.
This result highlights the fact that households are not passive victims of climatic shocks.They react and adjust their farming practices to cope with climate change. More specif-ically, they opt for risk coping mechanisms such as changing the amount of land underproduction, changing the pattern of crop consumption, changing the field location, seekingoff farm employment and/or migrating to this place from another.
15
We also disentangle the existence of non linearities, that make several strategies notaccessible to everybody, according to his (her) wealth and access to electricity: changecrop variety, change crop type, irrigate, irrigate more and change from livestock to cropproduction. These options are more demanding, as they require a fixed cost to be paid.Our results show that the positive association between the most demanding options andagricultural income diminishes with wealth, size of the household, and to a lesser extenteducation. Noticeably, access to electricity is a powerful way of reducing the discriminatoryeffect of agricultural income, as agricultural income correlate with adaptive capacity butto a much lower extent. Farmers provided with such an access face therefore a wider rangeof options.
Poor households have a more limited access to strategies for coping with climate haz-ards. A proper wealth distribution along with access to electricity and education willprovide poor households the capacity to adapt to climate change.
16
References
[ref, a] International Food Policy Research Institute (IFPRI). 2014. Bangladesh ClimateChange Adaptation Survey (BCCAS), Round I. Washington, DC; Dhaka, Bangladesh;Bonn, Germany: International Food Policy Research Institute (IFPRI); Data Analysisand Technical Assistance (DATA); Center for Development Research (ZEF).
[ref, b] World Bank, Country Adaptation Profile. http://sdwebx.worldbank.org/
climateportalb/home.cfm?page=country_profile&CCode=BGD.
[Adger et al., 2012] Adger, W., Kelly, P., and Ninh, N. (2012). Living with environmentalchange: social vulnerability, adaptation and resilience in Vietnam. Routledge.
[Adger et al., 2003] Adger, W. N., Huq, S., Brown, K., Conway, D., and Hulme, M. (2003).Adaptation to climate change in the developing world. Progress in development studies,3(3):179–195.
[Baez et al., 2015] Baez, J. E., Lucchetti, L., Genoni, M. E., and Salazar, M. (2015). Gonewith the storm: rainfall shocks and household well-being in guatemala. World BankPolicy Research Working Paper, (7177).
[Barbier et al., 2009] Barbier, B., Yacouba, H., Karambiri, H., Zorome, M., and Some, B.(2009). Human vulnerability to climate variability in the Sahel: farmers adaptationstrategies in northern Burkina Faso. Environmental management, 43(5):790–803.
[Below et al., 2012] Below, T. B., Mutabazi, K. D., Kirschke, D., Franke, C., Sieber, S.,Siebert, R., and Tscherning, K. (2012). Can farmers adaptation to climate change beexplained by socio-economic household-level variables? Global Environmental Change,22(1):223–235.
[Berkes and Jolly, 2002] Berkes, F. and Jolly, D. (2002). Adapting to climate change:social-ecological resilience in a Canadian western Arctic community. Conservation ecol-ogy, 5(2):18.
[Bryan et al., 2009] Bryan, E., Deressa, T. T., Gbetibouo, G. A., and Ringler, C. (2009).Adaptation to climate change in Ethiopia and South Africa: options and constraints.environmental science & policy, 12(4):413–426.
[Burton et al., 2002] Burton, I., Huq, S., Lim, B., Pilifosova, O., and Schipper, E. L.(2002). From impacts assessment to adaptation priorities: the shaping of adaptationpolicy. Climate policy, 2(2-3):145–159.
[Carter et al., 2007] Carter, M. R., Little, P. D., Mogues, T., and Negatu, W. (2007).Poverty traps and natural disasters in ethiopia and honduras. World development,35(5):835–856.
17
[Chaurey et al., 2004] Chaurey, A., Ranganathan, M., and Mohanty, P. (2004). Electric-ity access for geographically disadvantaged rural communities : technology and policyinsights. Energy policy, 32(15):1693–1705.
[Cross and Barker, 1991] Cross, N. and Barker, R. (1991). At the Deserts Edge: OralHistories from the Sahel.
[Dell et al., 2013] Dell, M., Jones, B. F., and Olken, B. A. (2013). What do we learn fromthe weather? the new climate-economy literature. Technical report, National Bureau ofEconomic Research.
[Deressa et al., 2005] Deressa, T., Hassan, R., and Poonyth, D. (2005). Measuring theimpact of climate change on South African agriculture: the case of sugarcane growingregions. Agrekon, 44(4):524–542.
[Deressa et al., 2009] Deressa, T. T., Hassan, R. M., Ringler, C., Alemu, T., and Yesuf,M. (2009). Determinants of farmers choice of adaptation methods to climate change inthe Nile Basin of Ethiopia. Global environmental change, 19(2):248–255.
[Edenhofer et al., 2014] Edenhofer, O., Pichs-Madrug, R., Sokona, Y., et al. (2014). Ipcc2014: Summary for policymakers. clim. chang, pages 1–32.
[Eriksen and Lind, 2009] Eriksen, S. and Lind, J. (2009). Adaptation as a political process:Adjusting to drought and conflict in Kenyas drylands. Environmental management,43(5):817–835.
[Fosu-Mensah et al., 2012] Fosu-Mensah, B. Y., Vlek, P. L., and MacCarthy, D. S. (2012).Farmers perception and adaptation to climate change: a case study of Sekyedumasedistrict in Ghana. Environment, Development and Sustainability, 14(4):495–505.
[Gbetibouo and Hassan, 2005] Gbetibouo, G. A. and Hassan, R. (2005). Measuring theeconomic impact of climate change on major South African field crops: a Ricardianapproach. Global and Planetary Change, 47(2):143–152.
[Goklany, 2007] Goklany, I. M. (2007). Integrated strategies to reduce vulnerability andadvance adaptation, mitigation, and sustainable development. Mitigation and Adapta-tion Strategies for Global Change, 12(5):755–786.
[Hassan et al., 2008] Hassan, R., Nhemachena, C., et al. (2008). Determinants of Africanfarmers strategies for adapting to climate change: Multinomial choice analysis. AfricanJournal of Agricultural and Resource Economics, 2(1):83–104.
[Huq, 2001] Huq, S. (2001). Climate change and Bangladesh. Science 294, 1617.
[Huq et al., 1999] Huq, S., Karim, Z., Asaduzzaman, M., Mahtab, F., et al. (1999). Vul-nerability and adaptation to climate change in Bangladesh. Springer.
18
[IPCC, 2007] IPCC (2007). Climate Change 2007: Impacts, Adaptation and Vulnerability.Contribution of Working Group II to the Fourth Assessment Report of the Intergovern-mental Panel on Climate Change. Cambridge University Press, Cambridge.
[Jones and Boyd, 2011] Jones, L. and Boyd, E. (2011). Exploring social barriers to adap-tation: insights from Western Nepal. Global Environmental Change, 21(4):1262–1274.
[Kanagawa and Nakata, 2007] Kanagawa, M. and Nakata, T. (2007). Analysis of the en-ergy access improvement and its socio-economic impacts in rural areas of developingcountries. Ecological Economics, 62(2):319–329.
[Kates, 2000] Kates, R. W. (2000). Cautionary tales: adaptation and the global poor. InSocietal Adaptation to Climate Variability and Change, pages 5–17. Springer.
[Krishna, 2006] Krishna, A. (2006). Pathways out of and into poverty in 36 villages ofandhra pradesh, india. World development, 34(2):271–288.
[Kurukulasuriya and Mendelsohn, 2006] Kurukulasuriya, P. and Mendelsohn, R. (2006).Crop Selection: Adapting Climate Change in Africa. CEEPA Publication 26.
[Kurukulasuriya et al., 2008] Kurukulasuriya, P., Mendelsohn, R., et al. (2008). A Ricar-dian analysis of the impact of climate change on African cropland. African Journal ofAgricultural and Resource Economics, 2(1):1–23.
[Kurukulasuriya et al., 2006] Kurukulasuriya, P., Mendelsohn, R., Hassan, R., Benhin, J.,Deressa, T., Diop, M., Eid, H. M., Fosu, K. Y., Gbetibouo, G., Jain, S., et al. (2006).Will African agriculture survive climate change? The World Bank Economic Review,20(3):367–388.
[Kurukulasuriya and Mendelsohn, 2007] Kurukulasuriya, P. and Mendelsohn, R. O.(2007). Endogenous irrigation: The impact of climate change on farmers in Africa.World Bank Policy Research Working Paper, (4278).
[Lobell et al., 2008] Lobell, D. B., Burke, M. B., Tebaldi, C., Mastrandrea, M. D., Falcon,W. P., and Naylor, R. L. (2008). Prioritizing climate change adaptation needs for foodsecurity in 2030. Science, 319(5863):607–610.
[Lotsch, 2007] Lotsch, A. (2007). Sensitivity of cropping patterns in Africa to transientclimate change. World Bank Policy Research Working Paper, (4289).
[Maddison et al., 2007] Maddison, D., Manley, M., and Kurukulasuriya, P. (2007). Theimpact of climate change on African agriculture: a Ricardian approach.
[Matthews et al., 1997] Matthews, R., Kropff, M., Horie, T., and Bachelet, D. (1997).Simulating the impact of climate change on rice production in Asia and evaluatingoptions for adaptation. Agricultural systems, 54(3):399–425.
19
[Maurel et al., 2015] Maurel, M., Kubik, Z., et al. (2015). Climate variability and Migra-tion: Evidence from Tanzania. Technical report.
[Maurel et al., 2013] Maurel, M., Tuccio, M., et al. (2013). Climate instability and inter-national migration. Technical report.
[Mendelsohn and Dinar, 1999] Mendelsohn, R. and Dinar, A. (1999). Climate change, agri-culture, and developing countries: does adaptation matter? The World Bank ResearchObserver, 14(2):277–293.
[Mendelsohn et al., 1994] Mendelsohn, R., Nordhaus, W. D., and Shaw, D. (1994). Theimpact of global warming on agriculture: a Ricardian analysis. The American economicreview, pages 753–771.
[Mendelsohn and Seo, 2007] Mendelsohn, R. O. and Seo, S. N. (2007). Changing farmtypes and irrigation as an adaptation to climate change in Latin American agriculture.World bank policy research working paper, (4161).
[Mertz et al., 2009] Mertz, O., Mbow, C., Reenberg, A., and Diouf, A. (2009). Farm-ers perceptions of climate change and agricultural adaptation strategies in rural Sahel.Environmental management, 43(5):804–816.
[Millner and Dietz, 2015] Millner, A. and Dietz, S. (2015). Adaptation to climate changeand economic growth in developing countries. Environment and Development Economics,20(03):380–406.
[Mortimore and Adams, 2001] Mortimore, M. J. and Adams, W. M. (2001). Farmer adap-tation, change and crisis in the Sahel. Global environmental change, 11(1):49–57.
[Njie et al., 2006] Njie, M., Gomez, B. E., Hellmuth, M. E., Callaway, J. M., Jallow, B. P.,and Droogers, P. (2006). Making economic sense of adaptation in upland cereal produc-tion systems in The Gambia.
[Reardon and Taylor, 1996] Reardon, T. and Taylor, J. E. (1996). Agroclimatic shock,income inequality, and poverty: Evidence from Burkina Faso. World Development,24(5):901–914.
[Reid et al., 2008] Reid, H., Sahlen, L., Stage, J., and MacGregor, J. (2008). Climatechange impacts on Namibia’s natural resources and economy. Climate Policy, 8(5):452–466.
[Rodriguez-Oreggia et al., 2013] Rodriguez-Oreggia, E., De La Fuente, A., De La Torre,R., and Moreno, H. A. (2013). Natural disasters, human development and poverty atthe municipal level in mexico. The Journal of Development Studies, 49(3):442–455.
20
[Roncoli et al., 2001] Roncoli, C., Ingram, K., and Kirshen, P. (2001). The costs and risksof coping with drought: livelihood impacts and farmers’ responses in Burkina Faso.Climate Research, 19(2):119–132.
[Rosenzweig and Parry, 1994] Rosenzweig, C. and Parry, M. L. (1994). Potential impactof climate change on world food supply. Nature, 367(6459):133–138.
[Schlenker and Roberts, 2008] Schlenker, W. and Roberts, M. J. (2008). Estimating theimpact of climate change on crop yields: The importance of nonlinear temperatureeffects. Technical report, National Bureau of Economic Research.
[Seo et al., 2008a] Seo, N., Mendelsohn, R. O., Kurukulasuriya, P., Dinar, A., and Hassan,R. M. (2008a). Differential adaptation strategies to climate change in African croplandby agro-ecological zones. World Bank Policy Research Working Paper Series, Vol.
[Seo et al., 2008b] Seo, S. N., Dinar, A., Kurukulasuriya, P., Mendelsohn, R., et al.(2008b). Differential adaptation strategies by agro-ecological zones in African livestockmanagement, volume 4601. World Bank Publications.
[Seo and Mendelsohn, 2008a] Seo, S. N. and Mendelsohn, R. (2008a). An analysis of cropchoice: Adapting to climate change in South American farms. Ecological economics,67(1):109–116.
[Seo and Mendelsohn, 2008b] Seo, S. N. and Mendelsohn, R. (2008b). Measuring impactsand adaptations to climate change: a structural Ricardian model of African livestockmanagement1. Agricultural economics, 38(2):151–165.
[Seo et al., 2009] Seo, S. N., Mendelsohn, R., Dinar, A., Hassan, R., and Kurukulasuriya,P. (2009). A Ricardian analysis of the distribution of climate change impacts on agri-culture across agro-ecological zones in Africa. Environmental and Resource Economics,43(3):313–332.
[Seo and Mendelsohn, 2007a] Seo, S. N. and Mendelsohn, R. O. (2007a). Climate changeadaptation in Africa: a microeconomic analysis of livestock choice. World Bank PolicyResearch Working Paper, (4277).
[Seo and Mendelsohn, 2007b] Seo, S. N. and Mendelsohn, R. O. (2007b). Climate changeimpacts on animal husbandry in Africa: a Ricardian analysis. World Bank Policy Re-search Working Paper, (4261).
[Seo et al., 2008c] Seo, S. N., Mendelsohn, R. O., Dinar, A., Kurukulasuriya, P., and Has-san, R. M. (2008c). Long-term adaptation: Selecting farm types across agro-ecologicalzones in Africa. World Bank Policy Research Working Paper Series, Vol.
21
[Smit et al., 2000] Smit, B., Burton, I., Klein, R. J., and Wandel, J. (2000). An anatomyof adaptation to climate change and variability. Climatic change, 45(1):223–251.
[Smithers and Smit, 1997] Smithers, J. and Smit, B. (1997). Human adaptation to climaticvariability and change. Global Environmental Change, 7(2):129–146.
[Spalding-Fecher and Moodley, 2002] Spalding-Fecher, R. and Moodley, S. (2002). Eco-nomic valuation of increased malaria due to climate change: a South African case study.South African Journal of Economic and Management Sciences, 5(2):395–412.
[Stage, 2010] Stage, J. (2010). Economic valuation of climate change adaptation in devel-oping countries. Annals of the New York Academy of Sciences, 1185(1):150–163.
[Timmins, 2006] Timmins, C. (2006). Endogenous land use and the Ricardian valuationof climate change. Environmental and Resource Economics, 33(1):119–142.
[Tol, 2005] Tol, R. S. (2005). Emission abatement versus development as strategies toreduce vulnerability to climate change: an application of FUND. Environment andDevelopment Economics, 10(05):615–629.
[Velarde et al., 2005] Velarde, S. J., Malhi, Y., Moran, D., Wright, J., and Hussain, S.(2005). Valuing the impacts of climate change on protected areas in Africa. EcologicalEconomics, 53(1):21–33.
22
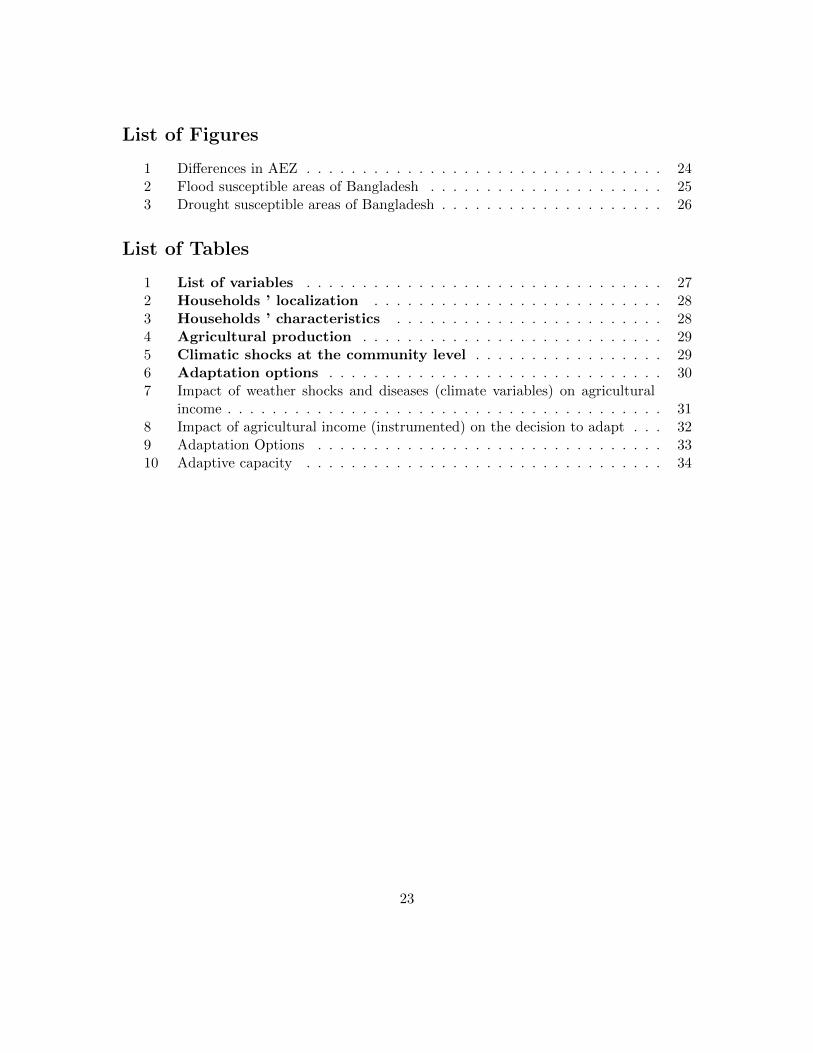
List of Figures
1 Differences in AEZ . . . . . . . . . . . . . . . . . . . . . . . . . . . . . . . . 242 Flood susceptible areas of Bangladesh . . . . . . . . . . . . . . . . . . . . . 253 Drought susceptible areas of Bangladesh . . . . . . . . . . . . . . . . . . . . 26
List of Tables
1 List of variables . . . . . . . . . . . . . . . . . . . . . . . . . . . . . . . . 272 Households ’ localization . . . . . . . . . . . . . . . . . . . . . . . . . . 283 Households ’ characteristics . . . . . . . . . . . . . . . . . . . . . . . . 284 Agricultural production . . . . . . . . . . . . . . . . . . . . . . . . . . . 295 Climatic shocks at the community level . . . . . . . . . . . . . . . . . 296 Adaptation options . . . . . . . . . . . . . . . . . . . . . . . . . . . . . . 307 Impact of weather shocks and diseases (climate variables) on agricultural
income . . . . . . . . . . . . . . . . . . . . . . . . . . . . . . . . . . . . . . . 318 Impact of agricultural income (instrumented) on the decision to adapt . . . 329 Adaptation Options . . . . . . . . . . . . . . . . . . . . . . . . . . . . . . . 3310 Adaptive capacity . . . . . . . . . . . . . . . . . . . . . . . . . . . . . . . . 34
23
in AEZ.png
Figure 1: Differences in AEZ
24
susceptible areas of Bangladesh.png
Figure 2: Flood susceptible areas of Bangladesh25
susceptible areas of Bangladesh.png
Figure 3: Drought susceptible areas of Bangladesh
26
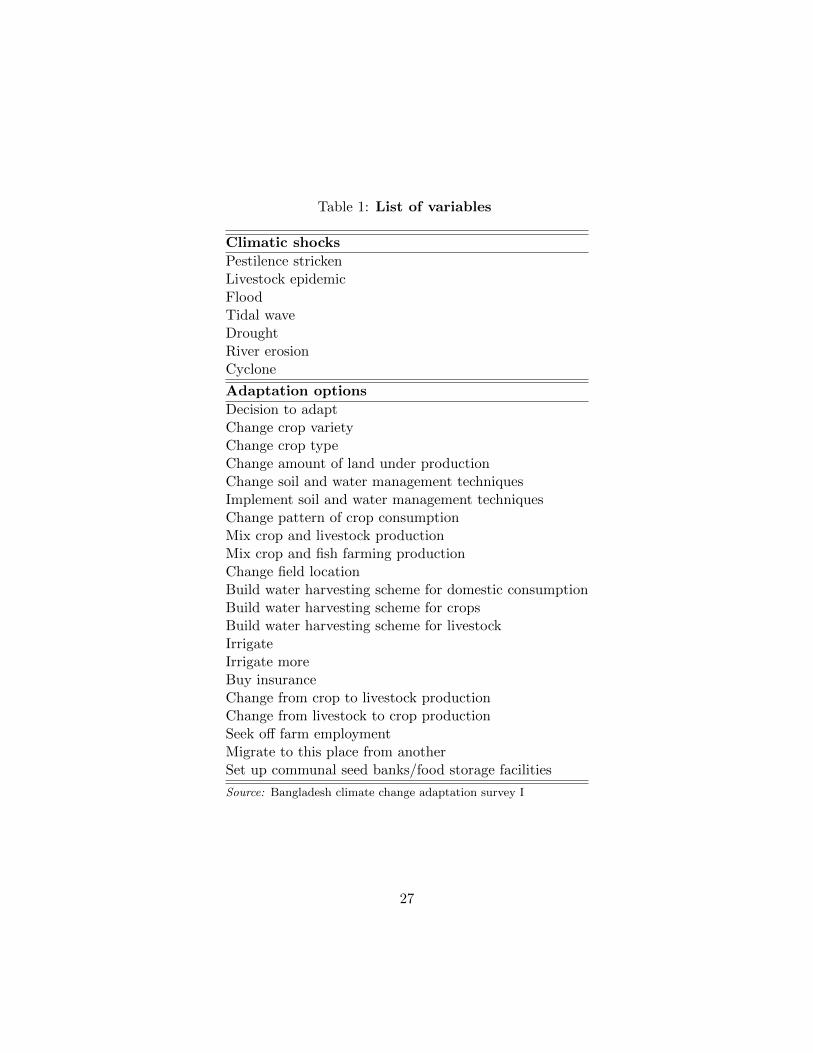
Table 1: List of variables
Climatic shocks
Pestilence strickenLivestock epidemicFloodTidal waveDroughtRiver erosionCyclone
Adaptation options
Decision to adaptChange crop varietyChange crop typeChange amount of land under productionChange soil and water management techniquesImplement soil and water management techniquesChange pattern of crop consumptionMix crop and livestock productionMix crop and fish farming productionChange field locationBuild water harvesting scheme for domestic consumptionBuild water harvesting scheme for cropsBuild water harvesting scheme for livestockIrrigateIrrigate moreBuy insuranceChange from crop to livestock productionChange from livestock to crop productionSeek off farm employmentMigrate to this place from anotherSet up communal seed banks/food storage facilities
Source: Bangladesh climate change adaptation survey I
27
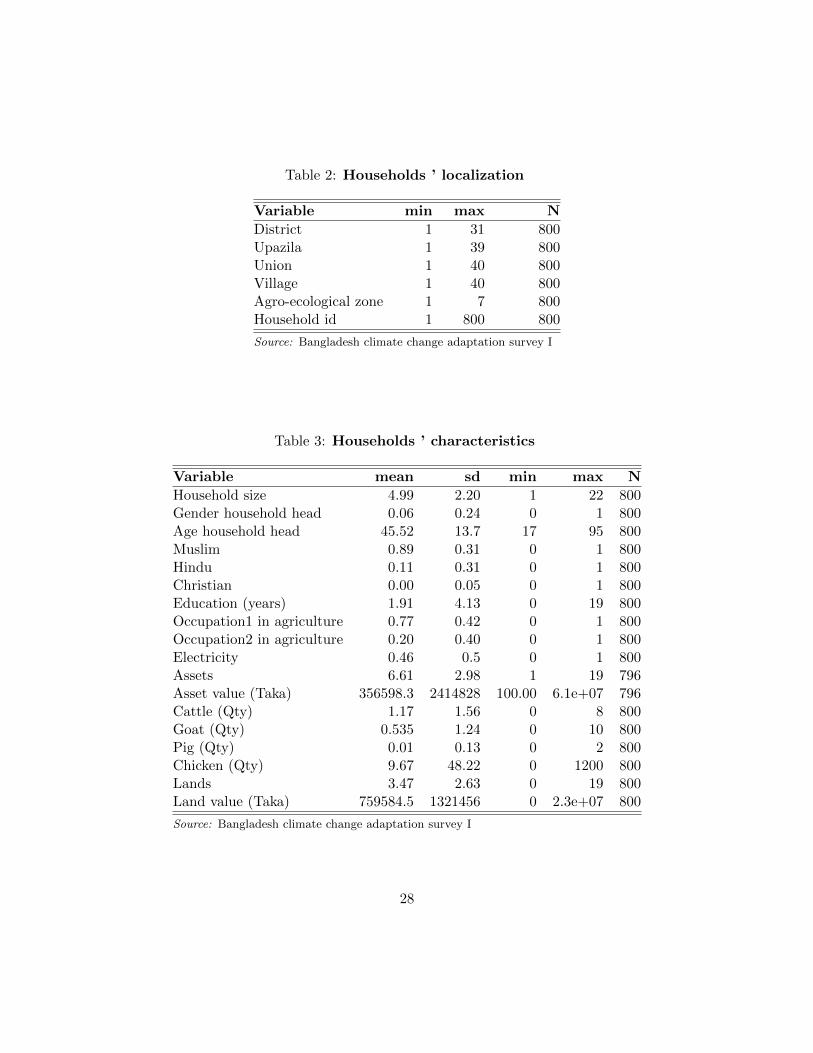
Table 2: Households ’ localization
Variable min max N
District 1 31 800Upazila 1 39 800Union 1 40 800Village 1 40 800Agro-ecological zone 1 7 800Household id 1 800 800
Source: Bangladesh climate change adaptation survey I
Table 3: Households ’ characteristics
Variable mean sd min max N
Household size 4.99 2.20 1 22 800Gender household head 0.06 0.24 0 1 800Age household head 45.52 13.7 17 95 800Muslim 0.89 0.31 0 1 800Hindu 0.11 0.31 0 1 800Christian 0.00 0.05 0 1 800Education (years) 1.91 4.13 0 19 800Occupation1 in agriculture 0.77 0.42 0 1 800Occupation2 in agriculture 0.20 0.40 0 1 800Electricity 0.46 0.5 0 1 800Assets 6.61 2.98 1 19 796Asset value (Taka) 356598.3 2414828 100.00 6.1e+07 796Cattle (Qty) 1.17 1.56 0 8 800Goat (Qty) 0.535 1.24 0 10 800Pig (Qty) 0.01 0.13 0 2 800Chicken (Qty) 9.67 48.22 0 1200 800Lands 3.47 2.63 0 19 800Land value (Taka) 759584.5 1321456 0 2.3e+07 800
Source: Bangladesh climate change adaptation survey I
28
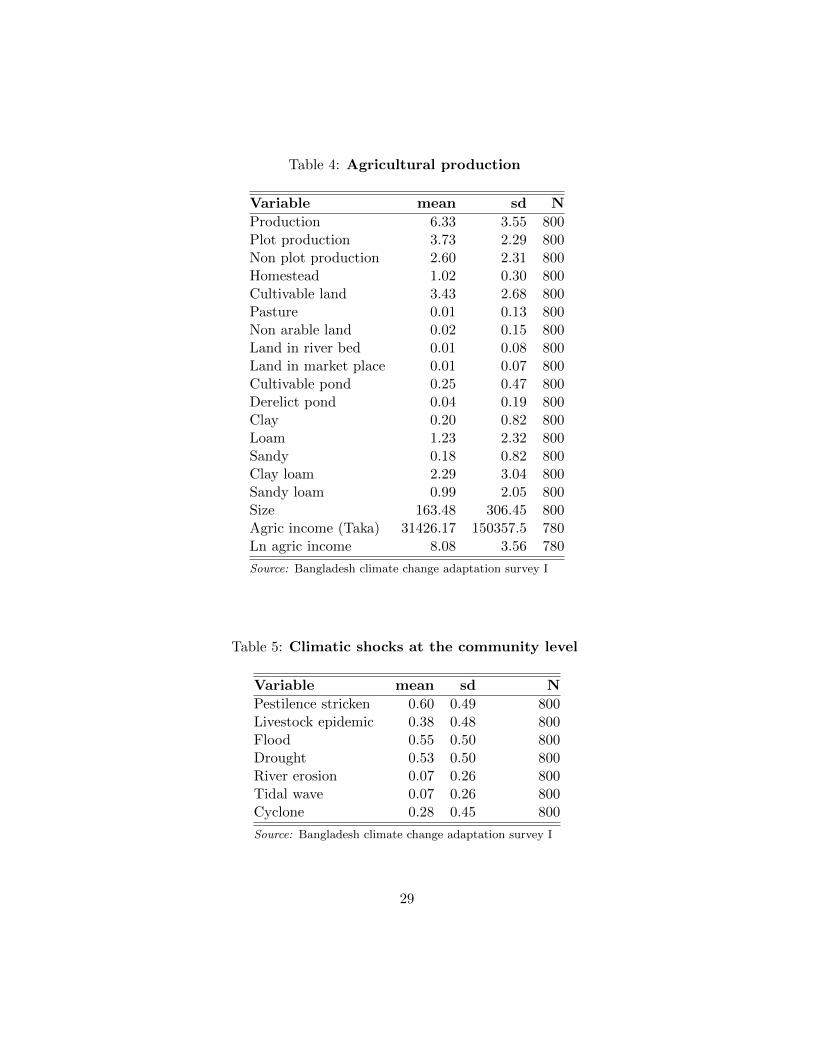
Table 4: Agricultural production
Variable mean sd N
Production 6.33 3.55 800Plot production 3.73 2.29 800Non plot production 2.60 2.31 800Homestead 1.02 0.30 800Cultivable land 3.43 2.68 800Pasture 0.01 0.13 800Non arable land 0.02 0.15 800Land in river bed 0.01 0.08 800Land in market place 0.01 0.07 800Cultivable pond 0.25 0.47 800Derelict pond 0.04 0.19 800Clay 0.20 0.82 800Loam 1.23 2.32 800Sandy 0.18 0.82 800Clay loam 2.29 3.04 800Sandy loam 0.99 2.05 800Size 163.48 306.45 800Agric income (Taka) 31426.17 150357.5 780Ln agric income 8.08 3.56 780
Source: Bangladesh climate change adaptation survey I
Table 5: Climatic shocks at the community level
Variable mean sd N
Pestilence stricken 0.60 0.49 800Livestock epidemic 0.38 0.48 800Flood 0.55 0.50 800Drought 0.53 0.50 800River erosion 0.07 0.26 800Tidal wave 0.07 0.26 800Cyclone 0.28 0.45 800
Source: Bangladesh climate change adaptation survey I
29
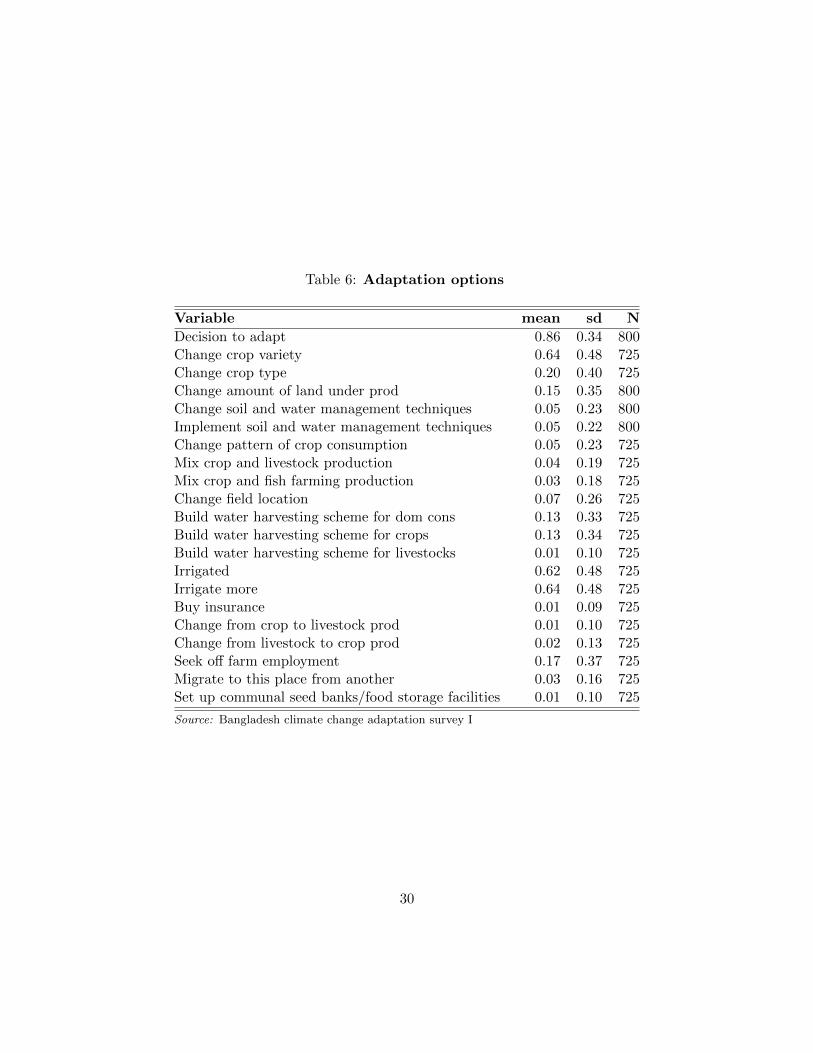
Table 6: Adaptation options
Variable mean sd N
Decision to adapt 0.86 0.34 800Change crop variety 0.64 0.48 725Change crop type 0.20 0.40 725Change amount of land under prod 0.15 0.35 800Change soil and water management techniques 0.05 0.23 800Implement soil and water management techniques 0.05 0.22 800Change pattern of crop consumption 0.05 0.23 725Mix crop and livestock production 0.04 0.19 725Mix crop and fish farming production 0.03 0.18 725Change field location 0.07 0.26 725Build water harvesting scheme for dom cons 0.13 0.33 725Build water harvesting scheme for crops 0.13 0.34 725Build water harvesting scheme for livestocks 0.01 0.10 725Irrigated 0.62 0.48 725Irrigate more 0.64 0.48 725Buy insurance 0.01 0.09 725Change from crop to livestock prod 0.01 0.10 725Change from livestock to crop prod 0.02 0.13 725Seek off farm employment 0.17 0.37 725Migrate to this place from another 0.03 0.16 725Set up communal seed banks/food storage facilities 0.01 0.10 725
Source: Bangladesh climate change adaptation survey I
30
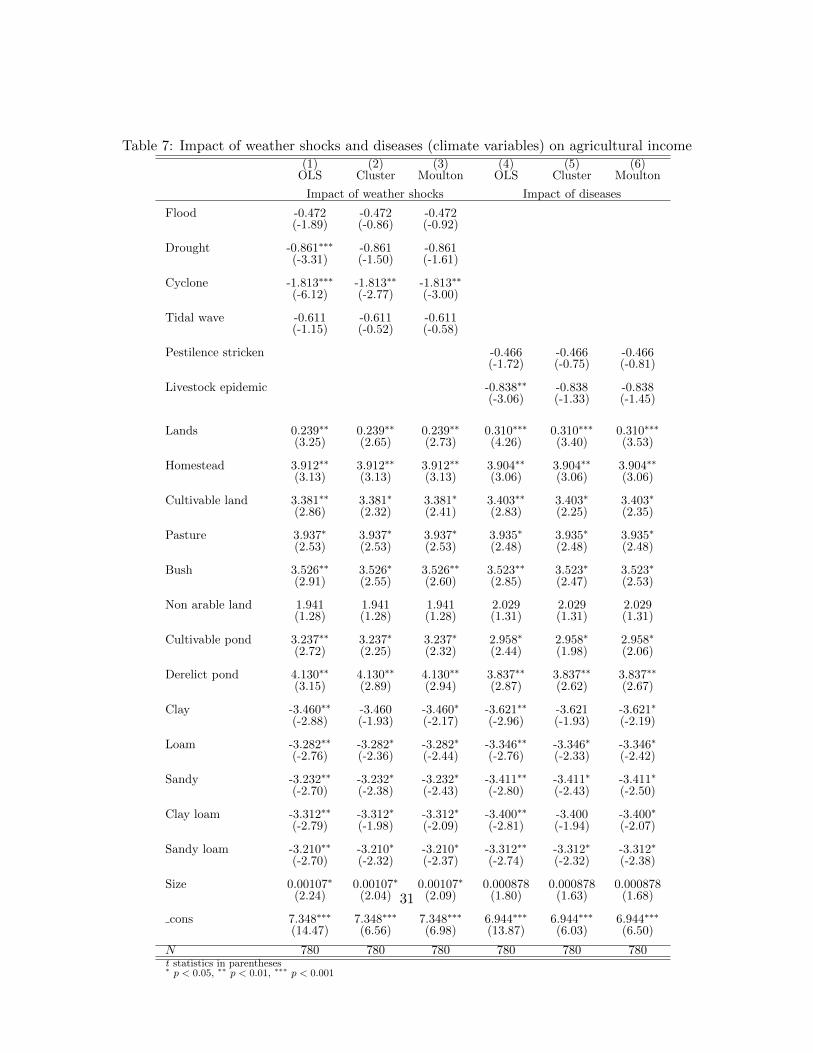
Table 7: Impact of weather shocks and diseases (climate variables) on agricultural income(1) (2) (3) (4) (5) (6)
OLS Cluster Moulton OLS Cluster Moulton
Impact of weather shocks Impact of diseases
Flood -0.472 -0.472 -0.472(-1.89) (-0.86) (-0.92)
Drought -0.861∗∗∗ -0.861 -0.861(-3.31) (-1.50) (-1.61)
Cyclone -1.813∗∗∗ -1.813∗∗ -1.813∗∗
(-6.12) (-2.77) (-3.00)
Tidal wave -0.611 -0.611 -0.611(-1.15) (-0.52) (-0.58)
Pestilence stricken -0.466 -0.466 -0.466(-1.72) (-0.75) (-0.81)
Livestock epidemic -0.838∗∗ -0.838 -0.838(-3.06) (-1.33) (-1.45)
Lands 0.239∗∗ 0.239∗∗ 0.239∗∗ 0.310∗∗∗ 0.310∗∗∗ 0.310∗∗∗
(3.25) (2.65) (2.73) (4.26) (3.40) (3.53)
Homestead 3.912∗∗ 3.912∗∗ 3.912∗∗ 3.904∗∗ 3.904∗∗ 3.904∗∗
(3.13) (3.13) (3.13) (3.06) (3.06) (3.06)
Cultivable land 3.381∗∗ 3.381∗ 3.381∗ 3.403∗∗ 3.403∗ 3.403∗
(2.86) (2.32) (2.41) (2.83) (2.25) (2.35)
Pasture 3.937∗ 3.937∗ 3.937∗ 3.935∗ 3.935∗ 3.935∗
(2.53) (2.53) (2.53) (2.48) (2.48) (2.48)
Bush 3.526∗∗ 3.526∗ 3.526∗∗ 3.523∗∗ 3.523∗ 3.523∗
(2.91) (2.55) (2.60) (2.85) (2.47) (2.53)
Non arable land 1.941 1.941 1.941 2.029 2.029 2.029(1.28) (1.28) (1.28) (1.31) (1.31) (1.31)
Cultivable pond 3.237∗∗ 3.237∗ 3.237∗ 2.958∗ 2.958∗ 2.958∗
(2.72) (2.25) (2.32) (2.44) (1.98) (2.06)
Derelict pond 4.130∗∗ 4.130∗∗ 4.130∗∗ 3.837∗∗ 3.837∗∗ 3.837∗∗
(3.15) (2.89) (2.94) (2.87) (2.62) (2.67)
Clay -3.460∗∗ -3.460 -3.460∗ -3.621∗∗ -3.621 -3.621∗
(-2.88) (-1.93) (-2.17) (-2.96) (-1.93) (-2.19)
Loam -3.282∗∗ -3.282∗ -3.282∗ -3.346∗∗ -3.346∗ -3.346∗
(-2.76) (-2.36) (-2.44) (-2.76) (-2.33) (-2.42)
Sandy -3.232∗∗ -3.232∗ -3.232∗ -3.411∗∗ -3.411∗ -3.411∗
(-2.70) (-2.38) (-2.43) (-2.80) (-2.43) (-2.50)
Clay loam -3.312∗∗ -3.312∗ -3.312∗ -3.400∗∗ -3.400 -3.400∗
(-2.79) (-1.98) (-2.09) (-2.81) (-1.94) (-2.07)
Sandy loam -3.210∗∗ -3.210∗ -3.210∗ -3.312∗∗ -3.312∗ -3.312∗
(-2.70) (-2.32) (-2.37) (-2.74) (-2.32) (-2.38)
Size 0.00107∗ 0.00107∗ 0.00107∗ 0.000878 0.000878 0.000878(2.24) (2.04) (2.09) (1.80) (1.63) (1.68)
cons 7.348∗∗∗ 7.348∗∗∗ 7.348∗∗∗ 6.944∗∗∗ 6.944∗∗∗ 6.944∗∗∗
(14.47) (6.56) (6.98) (13.87) (6.03) (6.50)
N 780 780 780 780 780 780t statistics in parentheses∗ p < 0.05, ∗∗ p < 0.01, ∗∗∗ p < 0.001
31
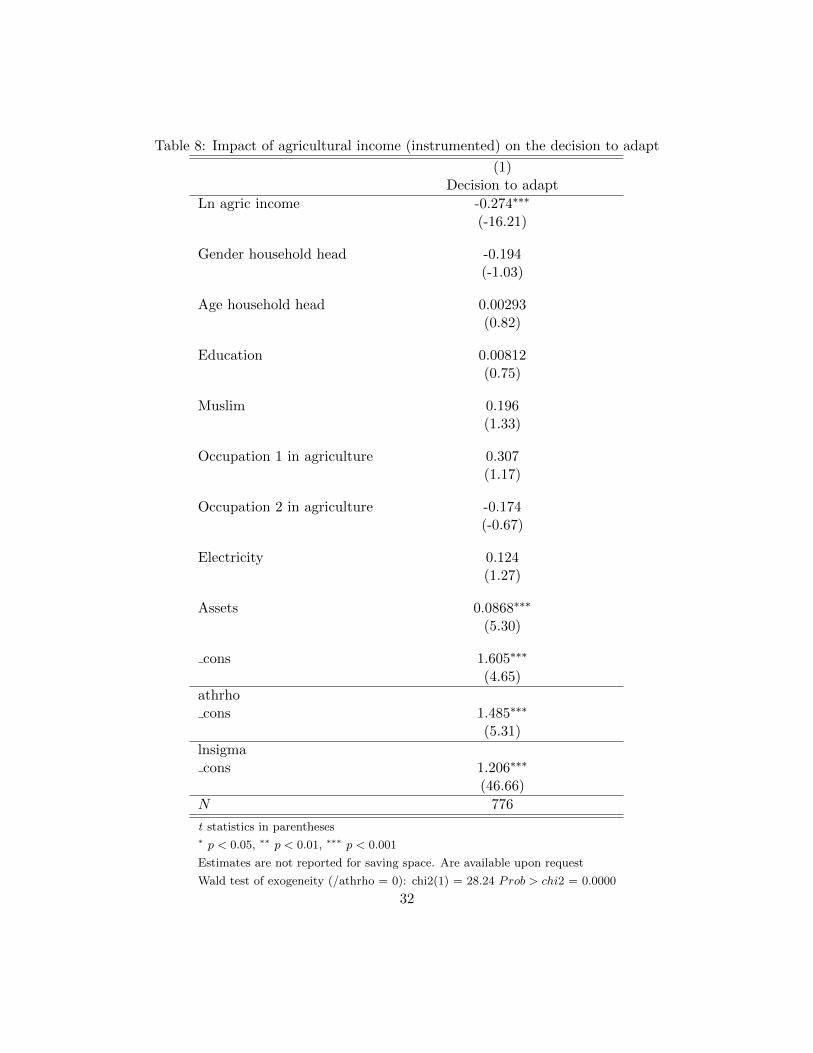
Table 8: Impact of agricultural income (instrumented) on the decision to adapt
(1)Decision to adapt
Ln agric income -0.274∗∗∗
(-16.21)
Gender household head -0.194(-1.03)
Age household head 0.00293(0.82)
Education 0.00812(0.75)
Muslim 0.196(1.33)
Occupation 1 in agriculture 0.307(1.17)
Occupation 2 in agriculture -0.174(-0.67)
Electricity 0.124(1.27)
Assets 0.0868∗∗∗
(5.30)
cons 1.605∗∗∗
(4.65)
athrhocons 1.485∗∗∗
(5.31)
lnsigmacons 1.206∗∗∗
(46.66)
N 776
t statistics in parentheses∗ p < 0.05, ∗∗ p < 0.01, ∗∗∗ p < 0.001
Estimates are not reported for saving space. Are available upon request
Wald test of exogeneity (/athrho = 0): chi2(1) = 28.24 Prob > chi2 = 0.0000
32
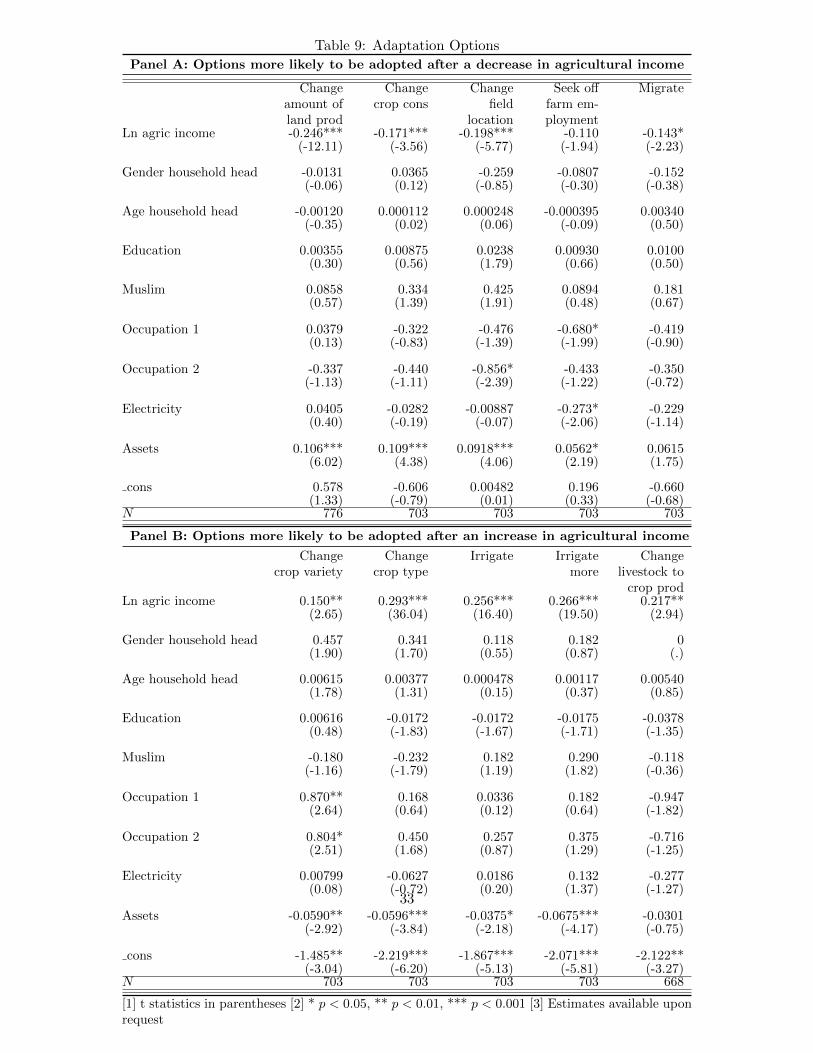
Table 9: Adaptation Options
Panel A: Options more likely to be adopted after a decrease in agricultural income
Changeamount ofland prod
Changecrop cons
Changefield
location
Seek offfarm em-ployment
Migrate
Ln agric income -0.246*** -0.171*** -0.198*** -0.110 -0.143*(-12.11) (-3.56) (-5.77) (-1.94) (-2.23)
Gender household head -0.0131 0.0365 -0.259 -0.0807 -0.152(-0.06) (0.12) (-0.85) (-0.30) (-0.38)
Age household head -0.00120 0.000112 0.000248 -0.000395 0.00340(-0.35) (0.02) (0.06) (-0.09) (0.50)
Education 0.00355 0.00875 0.0238 0.00930 0.0100(0.30) (0.56) (1.79) (0.66) (0.50)
Muslim 0.0858 0.334 0.425 0.0894 0.181(0.57) (1.39) (1.91) (0.48) (0.67)
Occupation 1 0.0379 -0.322 -0.476 -0.680* -0.419(0.13) (-0.83) (-1.39) (-1.99) (-0.90)
Occupation 2 -0.337 -0.440 -0.856* -0.433 -0.350(-1.13) (-1.11) (-2.39) (-1.22) (-0.72)
Electricity 0.0405 -0.0282 -0.00887 -0.273* -0.229(0.40) (-0.19) (-0.07) (-2.06) (-1.14)
Assets 0.106*** 0.109*** 0.0918*** 0.0562* 0.0615(6.02) (4.38) (4.06) (2.19) (1.75)
cons 0.578 -0.606 0.00482 0.196 -0.660(1.33) (-0.79) (0.01) (0.33) (-0.68)
N 776 703 703 703 703
Panel B: Options more likely to be adopted after an increase in agricultural income
Changecrop variety
Changecrop type
Irrigate Irrigatemore
Changelivestock to
crop prodLn agric income 0.150** 0.293*** 0.256*** 0.266*** 0.217**
(2.65) (36.04) (16.40) (19.50) (2.94)
Gender household head 0.457 0.341 0.118 0.182 0(1.90) (1.70) (0.55) (0.87) (.)
Age household head 0.00615 0.00377 0.000478 0.00117 0.00540(1.78) (1.31) (0.15) (0.37) (0.85)
Education 0.00616 -0.0172 -0.0172 -0.0175 -0.0378(0.48) (-1.83) (-1.67) (-1.71) (-1.35)
Muslim -0.180 -0.232 0.182 0.290 -0.118(-1.16) (-1.79) (1.19) (1.82) (-0.36)
Occupation 1 0.870** 0.168 0.0336 0.182 -0.947(2.64) (0.64) (0.12) (0.64) (-1.82)
Occupation 2 0.804* 0.450 0.257 0.375 -0.716(2.51) (1.68) (0.87) (1.29) (-1.25)
Electricity 0.00799 -0.0627 0.0186 0.132 -0.277(0.08) (-0.72) (0.20) (1.37) (-1.27)
Assets -0.0590** -0.0596*** -0.0375* -0.0675*** -0.0301(-2.92) (-3.84) (-2.18) (-4.17) (-0.75)
cons -1.485** -2.219*** -1.867*** -2.071*** -2.122**(-3.04) (-6.20) (-5.13) (-5.81) (-3.27)
N 703 703 703 703 668
[1] t statistics in parentheses [2] * p < 0.05, ** p < 0.01, *** p < 0.001 [3] Estimates available uponrequest
33
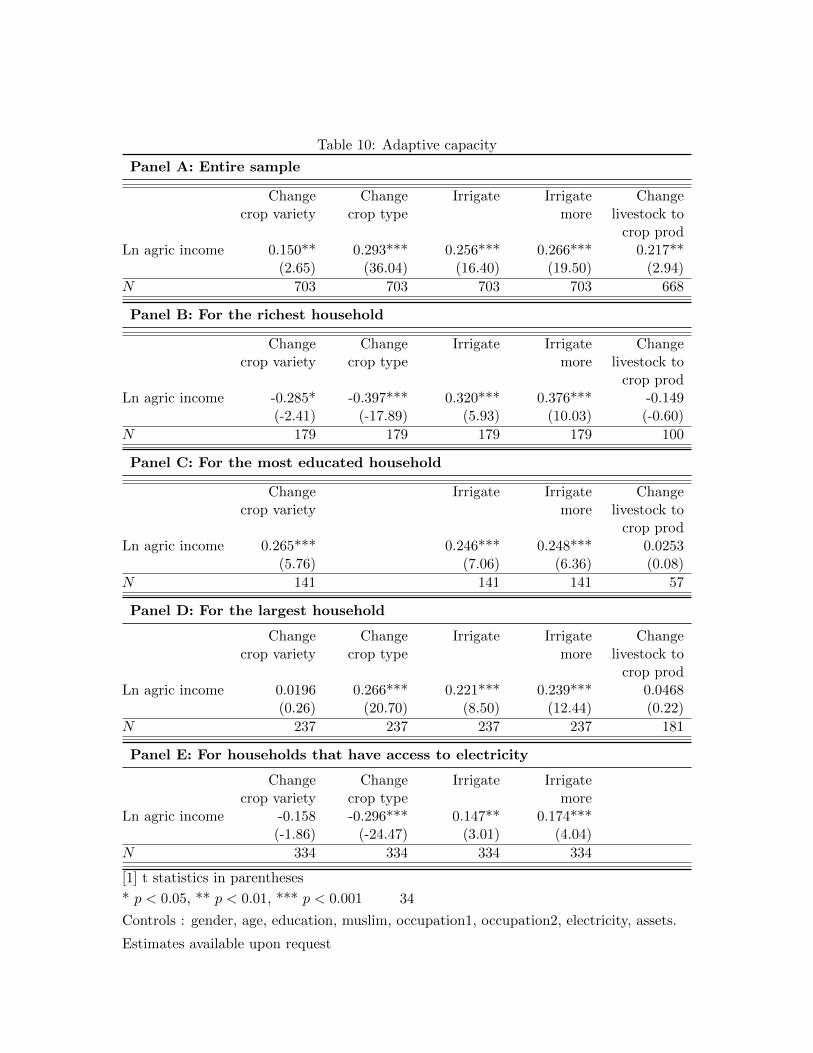
Table 10: Adaptive capacity
Panel A: Entire sample
Changecrop variety
Changecrop type
Irrigate Irrigatemore
Changelivestock to
crop prodLn agric income 0.150** 0.293*** 0.256*** 0.266*** 0.217**
(2.65) (36.04) (16.40) (19.50) (2.94)
N 703 703 703 703 668
Panel B: For the richest household
Changecrop variety
Changecrop type
Irrigate Irrigatemore
Changelivestock to
crop prodLn agric income -0.285* -0.397*** 0.320*** 0.376*** -0.149
(-2.41) (-17.89) (5.93) (10.03) (-0.60)
N 179 179 179 179 100
Panel C: For the most educated household
Changecrop variety
Irrigate Irrigatemore
Changelivestock to
crop prodLn agric income 0.265*** 0.246*** 0.248*** 0.0253
(5.76) (7.06) (6.36) (0.08)
N 141 141 141 57
Panel D: For the largest household
Changecrop variety
Changecrop type
Irrigate Irrigatemore
Changelivestock to
crop prodLn agric income 0.0196 0.266*** 0.221*** 0.239*** 0.0468
(0.26) (20.70) (8.50) (12.44) (0.22)
N 237 237 237 237 181
Panel E: For households that have access to electricity
Changecrop variety
Changecrop type
Irrigate Irrigatemore
Ln agric income -0.158 -0.296*** 0.147** 0.174***(-1.86) (-24.47) (3.01) (4.04)
N 334 334 334 334
[1] t statistics in parentheses
* p < 0.05, ** p < 0.01, *** p < 0.001
Controls : gender, age, education, muslim, occupation1, occupation2, electricity, assets.
Estimates available upon request
34
“Sur quoi la fondera-t-il l’économie du monde qu’il veut gouverner? Sera-ce sur le caprice de chaque particulier? Quelle confusion! Sera-ce sur la justice? Il l’ignore.”
Pascal
Created in 2003 , the Fondation pour les études et recherches sur le développement international aims to promote a fuller understanding of international economic development and the factors that influence it.
[email protected]+33 (0)4 73 17 75 30