a high transmission, 20-channel polychromatorfo r …
TRANSCRIPT

ASSOCIATIE EUPATOM-FOM
FOM-INSTITUUT VOOR PLASMAFYSICA
RIJNHUIZEN - NIEUWEGEIN - NEDERLAND
A HIGH TRANSMISSION, 20-CHANNEL POLYCHROMATOR FOR THE
THOMSON-SCATTERING DIAGNOSTIC OF TORTUR IN
by
C.J. Barth
Rijnhuizen Report 84-156
ASSOCIATE EURATOM-FOM June 1984
FOM-INSTITUUT VOOR PLASMAFYSICA
RIJNHUIZEN - NIEUWEGEIN - NEDERLAND
A HIGH TRANSMISSION, 20-CHANNEL POLYCHROMATOR FOR THE
THOMSON-SCATTERING DIAGNOSTIC OF TORTUR III
by
C.J. Barth
Rijnhuizen Report 84-156
This work was performed as part of the research programme of the association .agreement of Euratom
and the 'Stichting voor Fundamenteel Onderzoek der Materie (FOM)
with financial support from the Nederlandse Organisatie voor Zuiver-Weienschappelijk Onderzoek (ZWO) and Euratom

VOORWOORD
Het initiatief om een 20-kanaals spectrometer te construeren
werd genomen in het voorjaar van 1981. In juni 1982 werd het optische
ontwerp voltooid en was reeds een groot deel van het instrument gecon
strueerd op basis van het voorontwerp.
De beginfase van de constructie was geheel in hand van Ed de
Bruin, die helaas de voltooiing niet heeft meegemaakt. In september
1982 overleed hij nadat hij een half jaar in coma had gelegen. Zijn
creativiteit en inzet blijven zichtbaar in de vele onderdelen die hij
vervaardigde.
De voltooiing van de spectrometer vond plaats in het begin van
1983. De eerste metingen werden verricht in oktober 1983. Ontwerp en
constructie van de spectrometer namen ca 2H jaar in beslag waarbij on
dertussen de gehele intree-optiek vernieuwd werd en alvast toegepast
werd op de 10-kanaals polychromator.

CONTENTS
Abstract
1 Introduction
2 General lay-out
3. Design conditions and analysis of the design problems
4 Design procedure
5. Final design of the optical system
6. Suppression of stray-light, control of alignment and
sensitivity
6.1 Suppression of stray-light
6.2 Control of alignment
6 3 Control of sensitivity
1. Input optics
8 Tungsten filament calibration
8.1 Optical system
8 2 Determination of the calibration factor
9. Optical properties of the polychromator
9 1 Measured values of the central wavelength and the
bandwidth
9 2 Transmission
9. 3 Stray-1ight rat io
9.4 Rayleigh sca t te r ing
9.5 Detect ion l i m i t
10. Conclusion
Acknowledgement
References

-1-
A HI6H TRANSMISSION, 20 CHANNEL POLYCHROHATOR FOR THE
THOMSON-SCATTERING DIAGNOSTIC OF TORTUR III
by
C.J. Barth
Association Euratom-FOM
FOM-Instituut voor Plasmafysica
Rijnhuizen, Nieuwegein, The Netherlands
ABSTRACT
The Thomson-scattered spectra observed at the experiments
TORTUR II and III show systematic deviations with respect to a
gaussian profile.
In order to study these spectra in more detail a 20-channel
spectrometer has been designed and constructed to replace the present
10-channel apparatus. In the former instrument the analysed spectrum
was directed to the photomultiplier by means of a fibre-optic array.
The transmission of the new spectrometer has been increased by a fac
tor 2.5 up to 45% by using wavelength selection mirrors instead of
fibre optics.
Electron temperatures and densities can be determined with a 5%
error at values of 800 eV and 5*10 1 9 m"3. The detection limit of the
diagnostic has been improved to ne • 3xl0 1 8 m~3 at Te - 500 eV.

-2-
1 INTRODUCTION
At the TORTUR II and III experiments [1,2] Thomson scattering
was performed with a 500 MW ruby laser (X 0 = 694.3 nm) . The
scattered light was analysed by means of a polychromator with a
concave grating and registered with 9 RCA C31034 A and 1 EMI 9658 BM
photomultipliers.
focussing lens -»• -*»-
r = 6 0 mm-
torus axis
Fig. 1.
viewing I dump viewing lens
i swing out V ^ s~ s*. laser mirror
beam dump
4 T . J L ^ ' \ . ^ - ' | \ 2 position
M.X \ detection mirror
cross A-A \
Experimental set-up for Thomson scattering of ruby-laser light on TORTUR III. Electron temperature and densities can be measured on two selectable positions r = +5 and r = +60 mm. By swinging in or out mirror M4 the laser beam can be directed through the two different diagnostics ports. The detection branch can be connected with the two different radial positions by turning M7.
optical \compart'
ment
screen room

-3-
The electron temperature and density were measured at two selectable
radial positions r = +5 mm and r = +60 mm (limiter radius 05 mm).
A stray-light level equivalent to Rayleigh scattering by 0.5
torr N2 has been obtained by means of baffles in the entrance and exit
tube. A package of stainless steel knife edges serves as viewing dump
with excellent properties.
Figure 2 shows the observed spectra at two different plasma re
gimes. At large currents and low densities» distortions in the elec
tron distribution function are observed.
> «
* •
t (ms)
L (ros)
Fig. 2. Electron temperatures and corresponding spectral distributions versus time for a thermal (a) and a non-thermal discharge (b), (in the experiment TORTUR I I ) , without iron core.
This phenomenon exists for r e l a t i v e l y long times (1-2 ms) - far beyond
the electron-electron col l is ion time - so that the d ist r ibut ion func
t ion must be distorted continuously by some driving mechanism [ 3 ] .
To study these deviations of the electron velocity d is t r ibut ion
a new 20-channel polychromator was designed, which enables recording
of both the red and the blue wing of the scattered spectrum.
The most important modification with respect to the former in
strument is the coupling between the polychromator output and the
photomultiplier tubes. Instead of f ibres a series of 21 smal! mirrors
are used in order to achieve a 2.5 times larger transmission factor .

-4-
The transmission of several fibres was measured with an integrating
sphere. The FP 500 acrylic fibre, which was applied in the former in
strument, has a transmission of 35%, exclusive of the losses due to the
packing fraction, the core-cladding rati?, and the enlargement of the
etendue.
Use of quartz fibres would improve the transmission to SOX.
This report describes the design and construction of the poly-
chromator as follows:
1. general lay-out of the optical system;
2. optical design problems and design procedure;
3. final design of the polychromator;
4. stray-light reduction;
5. alignment control by means of a fibre-optic array;
6. sensitivity control of the photomultipliers;
7. input optics;
8. calibration optics;
9. optical properties of the complete instrument;
10. detection limit.

-5-
2. GENERAL LAY-OUT
In the plasma of TORTUR III, electron temperatures of 10
1000 eV may exist at electron densities of 10 1 8 to 10 2 0 nT 3. A set
wavelength channels with the following properties (Table 1) is sui
able for appropriate measurements:
TABLE 1
channel A .-A 1 0
BW* relative signal at different Tg-val ues
[nm] [nm] 10 eV 20 eV 100 eV 500 eV 1000 eV 2000 eV
+ and -1 6.5 4.75 0.14 0.176 0.124 0.061 0.043 0.031
2 11.0 4.75 0.017 0.062 0.100 0.058 0.042 0.030
3 16.5 6.0 0 0.010 0.085 0.068 0.052 0.038
4 22.5 6.3 0 0 0.048 0.063 0.051 0.038
5 30 9.5 0 0 0.025 0.077 0.069 0.055
6 40 9.5 0 0 0.004 0.053 0.057 0.050
7 50 9.5 0 0 0 0.033 0.045 0.044
8 60 13.0 0 0 0 0.025 0.046 0.052
9 75 13.0 0 0 0 0.008 0.027 0.040
10 90 13.0 0 0 0 0.002 0.014 0.029
Total amoi jnt of signals 0.32 0.50 0.77 0.90 0.89 0.81
* BW: bandwidth.
Figure 3 shows the basic set-up of the polychromator (see al
picture 1).

-6 -
wavelength channels
1 entrance slit
2 holographic grating
3 prism
4 Fresnel lens
5 field-shaping element
6 Mangin mirror
7 plane mirror
8 image surface with cone
9 lenses
10 photomultiplier tube
deflect
vertical cross-section
1 5 0 0 mm.
\ = 598 7 nm
^ * = 694.3
horizontal cross-section X = 7 8 2 4
nm
Fig. 3. Vertical and horizontal cross-section of the optical system. After dispersion by the grating (2) the intermediate image of the spectrum is formed between (3) and (4). This Image is five times magnified by means of a Mangin mirror (6). Twenty-one concave mirrors (8) each deflect a small spectral range into the photomultiplier (10),

- 7 -
wavelength selection mirrors
mangin mirror.
grating
11 f «
Photograph No.l,
Complete instrument. The grating is on the left side. The Mangin mirror is partly hidden behind the photomuHipl ier tubes of the channels +9 and +10.

-8-
The grating used to resolve the scattered spectrum is identical
to the one of the former instrument. This has the advantage that the
input optics can be left unmodified and that modifications to improve
the transmission factor of the input optics can be performed before
finishing the new polychromator.
The reciprocal dispersion of this grating '* nm/mm) and the
wavelength channels required make it necessary to magnify the spectrum
five times, thus avoiding too small mirror dimensions. A negative me
niscus lens, silvered on the second surface, a so-called Mangin mirror
[4], serves this aim with excellent optical properties: spherical
aberration is negligibly small and coma is reduced by a factor 2 with
respect to a spherical mirror at f/1.8.
To correct the tilt of the spectral image plane of the grating,
a prism is used to deviate the optical axis. A field-shaping element
is applied to correct the curvature of the intermediate image, thus
achieving an almost flat image field after passing through the Mangin
mirror.
Pupil imaging is performed by means of a Fresnel lens between
prism and field-shaping element, and by using spherical mirrors for
the selection of the wavelength channels. Each wavelength selection
mirror is imaged on the cathode of the corresponding photomultiplier
with a single or a doublet lens.

-9-
1800 l l /mm 1 1 5 . 5 mm 310 mm 130 mm
56x56 mm2
6 9 4 . 3 nm 80%
lO- . 1 0
3. DESIGN CONDITIONS AND ANALYSIS OF THE DESIGN PROBLEMS
The grating is an aberration-corrected, holographically ruled
concave one with the following properties:
TABLE 2
number of grooves
radi us
object distance (from slit to grating)
image distance for 694.3 nm
grating dimensions
blaze wavelength (*0)
efficiency for p-polarization at A 0
ghost
To obtain acceptable dimensions of the wavelength selecting mirrors
with the given grating, the total magnification should be five times.
The optical path from object to image of the Mangin mirror
should be 2450 mm because of the dimensions of the photomultiplier
tubes.
The image spot size should bo smaller than 0.5 mm at 694 nm and
1.? mm at the two extreme wavelengths (598 and 782 nm) . The radius of
the image field should be almost equal to the image distance of the
Mangin mirror (2050 mm) in order to obtain identical wavelength selec
tion mirrors. Only spherical and plane surfaces are permitted.
In Fig. 4, the design problems are schematically summarized.
The image surface of the the grating appears to be tilted by -13°. En
largement of this intermediate image by means of a Mangin mirror would
result in a steeply curved image surface (Fig. 4, item I ) . Therefore,
a prism is used to deviate the optical axis in such a way that the
tilt angle is corrected for (Fig. 4, item I I ) . However, the final
image is still a parabola.
To meet an almost flat image field, the negative curvature of
the intermediate image is corrected by means of a field-shaping ele
ment in combination with a Fresnel lens (Fig. 4, item III). This
Fresnel lens is necessary to obtain correct pupil imaging. The above
considerations are valid when the refractive index of the Mangin
mirror is taken independent of the wavelength.
However, the final image is tilted over -12° when the disper
sion is taken into account (Fig. 4, item I V ) . This tilt can be cor
rected for by setting the intermediate image to -2.6° by means of the
pr i sm (Fig. 4, i tern V ) .

-10-
Within these geometrical conditions the prism, Fresnel lens,
f ield-shaping element and Mangin mirror parameters should be optimized
to achieve minimum aberrations required.
Fig. 4. The design problems are illustrated in five steps: I Enlargement of the grating image. I I Use of a prism to correct the t i l t angle of the inter
mediate image; the final image is st i l l a parabola, I I I Field-shape correction with a Fresnel lens and a
field-shaping element. IV Shows the effect of the dispersion on the focal length
of the Mangin mirror. V By ti l t ing the intermediate image the object angle of
the final Image can be corrected.
-11-
4. DESIGN PROCEDURE
Although the Mangin mirror tilts the rays out of the meridional
plane (8.8 degrees) this tilt is not taken into account in the calcu
lations. The image spot si2e after a particular element is found by
means of ray-tracing with five pairs of rays in the meridional plane
[5]-At first the prism wedge angle is optimized achieving the cor
rect object angle and as small as possible spot sizes. The last-men
tioned condition is reached it the image points are as close to the
bisectrix of the prism as possible.
Acceptable pupil imaging is obtained if the combined focal
length of the Fresnel lens and the field-shaping element is about
110 mm. This can be deduced easily from the following data (see
Fig. 7):
- the distance between Fresnel lens and grating Spp - 140 mm;
- the required total magnification of five times and the total conju
gate distance (Spu» + S' M H = 2450 mm) results in a distance
between Fresnel lens and Mangin mirror of: S'JTR » 450 mm.
Field curvature is corrected by the Fresnel lens together with
the field-shaping element (FSE). The latter also partly corrects the
coma aberrations of the Mangin mirror. The most important parameters
to influence the field curvature are the location of the Fresnel lens
and the FSE, and the shape factor of the FSE:
R2+R1 q = R- h . (Rlt Rj are the radii of the first and the
2" l second lens surface respectively.)
On-axis spherical aberration of the Mangin mirror can be made
negligibly small if the ratio R2/R1 " 1.5. To meet the required magni
fication of about 5 times and an image distance of 2040 mm, the radii
need to be Ri = -326 mm R2 * -500 mm. This gives an on-axis image spot
size of 0.01 mm. The image spot size of the extreme wavelengths can be
minimized by tuning R2/R1 of the Mangin mirror while the focal length
is kept constant.
The dispersion of the optical elements is described with a
linear function;
n(A) = n(0) + $ U - A ) .

-12-
Prism, FSE and Mangin mirror are made out of 8K7. They have the
following properties:
n(0) = 1.513 (X = 694.3 nm) ^ = -2.75*10-5 nnr l.
For the acrylic Fresnel lens these parameters are:
n(0) = 1.487 |£ = -5.0-10-5 nnTl .
Only for the Mangin mirror, the dispersion appears to be of
significant influence.
Since prism, Fresnel lens and FSE introduce a small enlarge
ment, the magnification of the Mangin mirror should be smaller than 5.
To obtain the correct magnification (H) of the Mangin mirror,
a small change of the focal length is required. The total conjugate
distance (a = s + s') is kept constant, giving:
f = a»M
(M+l)2 '

-13-
5. FINAL DESIGN OF THE OPTICAL SYSTEM
Minimization of the image spot size and correction of the field
shape appear to be possible within the conditions of the design
(Fig. 5).
The spot size of the final image can be explained for the major
part by the aberrations of the grating and the Fresnel lens. Table 3
shows the aberrations of five wavelength channels for each element. &k
is the spot size in the image after passing through the successive
elements.
TABLE 3
X
(nm)
Ak spot size (mm) expected minimum value *
X
(nm) grating pr i sm Fresnel lens
FSE Mangin mirror
expected minimum value *
599
654
694.3
735
782
0.121
0.078
0.003
0.134
0.364
0.157
0.050
0.052
0.187
0.401
0.398
0.094
0.163
0.196
0.378
0.175
0.063
0.133
0.232
0.474
1.389
0.581
0.567
1.249
2.506
0.605
0.390
0.015
0.670
1.820
Expected minimum value: Ak(grating) * 5.
Aberrations of the Mangin mirror seem to be compensated by the pre
vious elements: at the maximum field angle, coma of the Mangin mirror
should already result in a spot size of 1.7 mm. Correction of the
field curvature is mainly performed with the Fresnel lens: the radius
is changed from R = -102 after the prism to R • +190 mm after the
Fresnel lens. Decreasing the spot size of the final image by means of
the FSE even demands an over-correction of the field curvature by the
Fresnel lens. The field radius after passing through the FSE is
304 mm.

G R A T I N G ! E n t r a n c e a n g l e ( d e g r . ) P a r a x i a l a n g l e ( d e g r . )
4 , 5 2 0 0 0 . 2 3 3 5
P R I S M P A R A M E T E R S Wedge a n g l e ( d e g r . ) T i l t a n g l e ( d e g r . ) T h i c k n e s s (mm) L o c a t i o n (mm) R e f r a c t i v e ind<:x D i s p e r s i o n ( / nm)
1 2 . 6 0 0 0 7 3 . 1 0 0 0
9 . 0 0 0 0 1 2 5 . 3 0 0 0
1 . 5 1 3 0 • . 2 7 5 0 E - 0 4
T R A N S F O R M A T I O N : T r a n s l a t i o n : xbM(l) » 1 3 3 . 6 7 2 1 7
YBM(l) » -0.89812 mm Rotation by deviation angle : -6.60392 degr.
F R E S N E L L E N S Focal length (mm) Number of grooves per mm Thickness (mm) Location (mm) Refractive index Dispersion (/ nm)
F I E L D S H A P I N G
E L E M E N T : Focal length (mm) Shape factor Thickness (mm) Location (mm) Refractive index Dispersion (/ nm)
N A N C I N M I R R O R Radius first surface Radius second surface Thickness (mm) Location (mm) Refractive index Dispersion (/ nm)
71.0000 3.5800 1.6000 IS.0000 1.4870
.5036E-04
-175.4400 0.2000 3.0000 21.0000 1.5130
.2750E-04
326.0000 S20.0000 3.5000
453,0000 1.5130
.2750E-04
(mm i 0 , 5
spo t o . 4
T 0 . 3
0 . 2
0 . 1
0 . 0
' e j
• O
• 0
• o •o •
9 m
(mm i 0 , 5
spo t o . 4
T 0 . 3
0 . 2
0 . 1
0 . 0
i i i i
® spo t o.-l
i 0 . 3
0 . 2
0 . 1
0 , 0 0
(mm) 2 , 5
spot j n
I I I i
®
iV 1 1 1 I
' e j
• O
• 0
• o •o •
9 m
(mm i 0 , 5
spo t o . 4
T 0 . 3
0 . 2
0 . 1
0 . 0 600 700 8C
spo t o.-l
i 0 . 3
0 . 2
0 . 1
0 , 0 0
(mm) 2 , 5
spot j n
600 700 8( )0
' e j
• O
• 0
• o •o •
9 m
( mm ) 0 , 5
spot a.i,
f ... 1
0 , 2
0 . 1
0 , 0
spo t o.-l
i 0 . 3
0 . 2
0 . 1
0 , 0 0
(mm) 2 , 5
spot j n
)0
' e j
• O
• 0
• o •o •
9 m
( mm ) 0 , 5
spot a.i,
f ... 1
0 , 2
0 . 1
0 , 0
i i i r
-® /-
spo t o.-l
i 0 . 3
0 . 2
0 . 1
0 , 0 0
(mm) 2 , 5
spot j n
r i r i ;
® /
i i i 4
' e j
• O
• 0
• o •o •
9 m
( mm ) 0 , 5
spot a.i,
f ... 1
0 , 2
0 . 1
0 , 0
i i i r
-® /-i
J . 5
1 . 0
0 . 5
r i r i ;
® /
i i i 4
^ from _^ M*n«ln OV mirror
0 *
a»
i SO m m , i
( mm ) 0 , 5
spot a.i,
f ... 1
0 , 2
0 . 1
0 , 0 600 700 800 600 700 800
^ from _^ M*n«ln OV mirror
0 *
a»
i SO m m , i
Fig . 5
Final design ; the Fresne over-correct ion of ~he £i compensated by the l i e l d -serves to reduce the coma Spot s i z e of the: a. prism image.Field radi b . Fresnel lensFie ld radi c . Field-shaping elemantF d. Mangin mlrrorField cur
1 lens even causes an old curvature which i s shaping element. The l a t t e r
of the Mangin mirror.
^ from _^ M*n«ln OV mirror
0 *
a»
i SO m m , i
Fig . 5
Final design ; the Fresne over-correct ion of ~he £i compensated by the l i e l d -serves to reduce the coma Spot s i z e of the: a. prism image.Field radi b . Fresnel lensFie ld radi c . Field-shaping elemantF d. Mangin mlrrorField cur
uss -102 mm us: +190 mm ie ld radius; +304 mm vature: see f i g . e
t 1
0 - p a r a x i a l inaye p o i n t
0 • m i n i m a l i p o t « I n

-15-
The position of the 21 wavelength channels desired as well as
the bandwidth (BU) can be deduced from Fig. 6 together with Table 1.
C mm 1
p o s i t i o n
150
100
50 -
-50 -
- 1 0 0 -
•150 5 5 0 800
Fig. 6. Spectral image surface of the Kangin mirror. The reciprocal dispersion is about 0.75 ran/mm.
The focal length of the wavelength selection mirrors and of the photo-
multiplier lenses is required by geometrical conditions of both the
complete instrument and the photomultiplier tubes.
The etendue of the photomultiplier (p.m.) is defined by the
sensitive area (4*10 mm 2) and the aperture plate (7.6x23 mm 2) at a
distance of 19 mm. The entrance angle of the p.m. and the exit angle
of the grating (see Section 3) then determine the total magnification:
24.8
with;
M „ M - exit angle grating _ c*.o _ n oo Ms * Mk " entrance angle p.mT " ?57T " ° "
M = magnification of the spectrometer
H. •i. - magnification of the p.m. lens
Since Ms - 5, the enlargement of the p.m. lens should be:
0.99 Mk >
1
To make sure that the entrance angle is not limited by toe p.m. aper
ture Mk is taken 1/4.75. The focal length is then determined by

-16-
the diameter of the photomultipiier housing and tls deflection angle
(see Fig. 3).
f. = 95 mm ; s. = 546 mm ; sj' = 115 mm : •. = 50 mm.
To achieve an acceptable temperature measurement in a wide
range (10-2000 eV), the bandwidth of the wavelength channels and thus
the widths of the selection mirrors are not of equal size (see
Table 1). For the smaller mirror dimensions up to 8.5 mm, imaging will
be done with a plano-convex lens (circle of least confusion 1.3 mm}
because image blur is not too important. The shape of the lenses for
the channels -7, -6, -5, +5, +6.. and +7 is chosen in such a way that
spherical aberration is minimized (rj = +60, r2 = -275, d = 8.1,
n * 1.E13, circle of least confusion: C.9 mm).
Image performance of the six extreme channels is realized with
a Brouwer doublet [6]:
surface radius thickness refractive index Abbe factor
1 + 61.5 13.5 1.522 59.2
2 - 47.9 6.8 1.717 29.5
3 -119.5
thus achieving a circle of least confusion of 0.13 mm.
The photomultipiier supports have a fine adjustment to position
the cathode exactly in the centre of the image of the corresponding
selection mirror. Scanning the cross-section of this image also indi
cates if the selection mirror is sharply imaged on the photocathode.
Together with the image distance of the Mangin mirror (2055 mm)
the object distance of the p.m. lens (s|< = 546 mm) defines the focal
length and radius of the selection mirrors:
fcM = 431 mm ; r = -862 mm.
Since the maximum deflection angle is 60 degrees, the pupil imaging by
means of these spherical mirrors will show a large astigmatism. T h e *
ratio between tangential and sagittal focal length for $ = 30°
(deflection 60 degrees) is as follows [7]:
I -2 x / [-2COS*»! . 1 _ , 7c
IrcösV ' l F-* - —J- J"75 • cos •
-17-
Entering with a circle-symmetric pupil adapted to the blank
width of the grating, the pupil size on the Mangin mirror becomes:
90*200 mm2 (height * width).
The radius of the selection mirrors is chosen r = -820 mm which
results in an acceptable sagittal and tangential image distance for
all channels.
This is demonstrated in Table 4, where • is the deflection
angle and S' and S', are the sagittal and tangential image distances
respectively.
TABLE 4
Channel
No. nm degr
s;(s«)
tun
Sf(SM)
mm
pupil l mage beam cross-section on the lens Channel
No. nm degr
s;(s«)
tun
Sf(SM)
mm s-direction
mm T-direction
mm width * height mm mm
+10 782 -1 512 512 40 22 41 x 26
+ 9 769 -6 516 509 38 22 39 x 27
+ B 756 -28 600 439 43 19 41 x 34
+ 6 735 -22 563 466 39 20 38 x 31
+ 4 717 -16 538 488 38 21 38 x 29
+ 2 705 -10 522 503 37 22 38 x 28
0 694.3 -31 623 424 44 19 39 x 37
- 2 684 9 520 504 38 22 39 < 28
- 4 672 15 535 491 40 21 41 x 28
- 6 554 21 558 470 44 21 43 x 32
- 8 631 27 593 444 50 19 47 x 33
- 9 615 30 615 429 57 19 53 x 36
-10 599 33 641 413 62 18 55 x 36
So, only for channels -9 and -10 the pupil will be slightly
vignetted, since the effective lens diameter is 48 mm.
-18-
6. SUPPRESSION OF STRAY-LIGHT, CONTROL OF ALIGNMENT AND SENSITIVITY
6.1 Suppression of stray-light
A black wire of diameter 1.8 mm stops the laser line in order to
decrease the stray-light ratio. This wire-filter is mounted in between
the prism and the Fresnel lens to avoid an increase of the stray-light
level by the grooves of the Fresnel lens (Fig. 7, item 15) (see also
picture 2 page 23).
horizontal cross-section
Fig. 7. Schematically set-up of the polychromator. (A11 dimensions in nan.)

-19-
Item Description Dimensions
h»b
f s S' Remarks Item Description
Dimensions
h»b H ir lens i ippr. Remarks
1 entrance slit with field lens
20*2.4 0 25 200 567 310
2 grating 56x56 1800 it/mm, r = 115.5, type III C-H-configuration m = 0.42; entrance angle 4.52°;
3 prism 40x80 wedge angle 12.6°
4 Fresnel lens 30x110 71
5 field-shaping element 30*70 -175
4+5 field lens 113 151.7 437 combined focal length
6 Mangin mirror 96*224 374 437 2060
7 flat mirror 90x225 internal silver
8 wavelength selection mirrors
60*Ay 410 2060 512 &y depends on the channel number: 6 - 8.5 - 13 -18 mm alumini zed.
9 p.m. lens t 50 95 546 115
10 photomultiplier RCA EMI
10x4 0 50
cathode dimensions
11 "jumping" mirror pneumatically driven
12x12 to mark the optical axis in backward direction by means of a HeNe-laser.
12 HeNe-laser
13 "jumping" mirror pneumatic-ally driven
30x50 aluminized
14 fibre optic array
8x1 9 channels; imaged on the wavelength selection mirrors if 13 is upward
15 wire-fiIter 10x01,8
1
stops the laser wavelength; pneu-matically movable out of the spectrum.

-20-
To enable cal ibrat ion by Rayleigh scattering and tungsten f i l a
ment c a l i b r a t i o n , the w i r e - f i l t e r can be translated out of the spec
t r a l f i e l d considered by means of a pneumatically driven s l ide .
6.2 Control of alignment
A fibre-optic array with nine channels monitors the cross-
section of the laser beam when a swing-in mirror is turned into the
optical path of the detection branch (see Fig. 8, item 12).
The exit face of the fibre array (Fig. 8. item 14) is imaged on
the wavelength selection mirrors by means of the Mangin mirror and a
"jumping" flat mirror (Fig. 7, item 13).
20 •£. 19
~A
18 17
5^6 , 1 2 *
Ql3 gi4
to photomultiplier tubes /
/
/ 1° 11
16 15 • - Q - — - ® -
-X /
/ /
Fig. 8. Input optics of the polychromator. (All dimensions in mm.)

-21-
Item Description 0 f s s' M Remarks
1 detection window 35 quartz
2 viewing lens (doublet)
50 200 252 969 3.85
3 silvered mirror* 100
4 two position si 1 vered mirror
100
5 field lens 50 500 969 1089 1.12
6 image stop 38.5x5 mm2
7 si 1 vered mirror* 100
8 lens 50 372 1089 567 0.52
9 entrance slit 20x2.4
10 field lens 25 200 567 310 0.55
11 grating
12 Swing-in mirror for alignment control
70x70 alumi-nized
13 filter box filters 50x50
14 fibre optic array for recording a cross-section of the laserbeam
9 channels of 8x1 mm
15
16
tungsten filament
doublet lens 50 120 155 528 3.4
used area 5.4x0.7
17 field lens 45 300 52C 444 0.84
18
19
shutter
lens 47 300 444 925 2.08
slit dimension: 18.5x x2.4
20 swing-in mirror for calibration with a tungsten filament
100 silvered
* note: all silvered mirrors have an anti-reflection coating on the first surface, while the second surface is silvered.

-22-
The beam position can be recorded in connection with the
Rayleigh scattering. Neutral density filters are used to obtain a
detectable signal. Figure 9 shows a recording of the beam cross-
section for Rayleigh scattering. It is inconvenient to fill the torus
with nitrogen during a series of "^-measurements. Therefore, a cold
plasma (Te - 10 eV) with a density of 1.5*10?0 m - 3 is produced for
alignment. An interference filter suppresses the . ray-light about one
hundred times while transmitting 25* of the Thomson-scattered light
(see Fig. 10).
4 . 0
( r . u . )
r e l . signal 3 Q
2 .0
1.0
0 .0 - 8 - 6 - 4 - 2 0 2 4 6 8
— *• p o s i t i o n i m m )
"~i—1—1—1—1—1—1—1—r~ locat ion of the 9 f i b r e channels
Fig. 9. Alignment control on nitrogen by recording o cross-section of the laser beam with a 9-channel fibre-optic array. After correction for the channel width the measured 10% beam width appears to be about 5 mn, which f i ts well with the size of the image stop, o Rayleigh-scattered light signal • stray-light signal.
n i r misalignment
- 0 . 5 mm
beam half width 3 . 1 mm
\10X beam width 5 .55 mm

-23-
680 S82 684 686 688 690 692 694 696
*• X (nm)
Fig. 10a. Transmission curve of an interference filter 688-8 nm, used for alignment control by means of Thomson scattering.
3Ü
(.XI 25 h
Thomson sc . light
* 20
15 -
10 -
5 -
0 ' ' L
10" 10 ' 10*
> T e (eV)
Fig. 10b. The relative amount of Thomson-scattered light transmitted through an interference filter 688-8 nm as a function of the electron temperature.

-24-
6.3 Control of sensitivity by means of a red LED
The short-tertn behaviour of the photomultipl ier overall sensi
tivity is controlled by a red LED (70 nanoseconds FWHM). The light of
this LED should illuminate each photomultiplier cathode homogeneously.
This condition is fulfilled by leading the light to a large fibre slit
mounted just above the Mangin mirror (see picture 3 ) .
black wire which stops the laser line
jumping mirror
prism
Photograph No. 2. Close-up of the prism, Fresnel lens and field-shaping element. The black thread-f i l ter can be seen clearly through the prism. The small mirror on the foreground can be l i f t ed up pneumatical ly in order to direct a HeNe-laser beam backward to mark the optical axis.
Mangin mirror
fibre array for sensitivity control
Photograph No. 3. The Mangin mirror with a fibre slit on top to guide the light from a LED to the photomultipliers, serving a sensitivity control.

-25-
7. INPUT OPTICS
The Thomson-scattered light can be sampled on two alternate
positions (r = +5 mm and r = +60 mm) (see Fig. 8 ) .
Object and pupil imaging is performed by a set of four lenses
(Fig. 8 ) .
TABLE 5
f S S' M
200 252 969 3.85
500 969 1089 1.12
372 1089 567 0.52
200 567 310 0.55
Since the total magnification from source to polychromator is:
M2 * M8 = 2.00,
and an entrance slit of 2.4 * 20 mm2 is applied, a scattering volume
of 1.2x10 mm2 can be observed.

-26-
8. TUNGSTEN FILAMENT CALIBRATION
8.1 Optical system {see Fig. 8)
The sensitivity of the p.m. tubes is calibrated with the aid of
a tungsten filament lamp.
A two-lens system is applied to obtain a large magnification of
the tungsten filament, which is necessary to use only the central part
of the tungsten filament. A mechanical shutter, positioned at the
intermediate image, transmits the light only during a couple of
milliseconds in order to protect the p.m. cathodes.
Since the photomultipliers are used in a gated mode, no optical
attenuators are necessary [8].
8.2 Determination of the relative calibration factors of the
channels
Photomultipiier signals YB and YD are recorded by using as a
source the tungsten filament and the red LED respectively. Together
with the zero-line signal (YN), a calibration factor CK can be
defined:
CK = BL(A,T) * {II I flj) ,
where BL(X,T) is the spectral radiance of the tungsten filament:
BL(A.T) • , E<X'T)-C1 , - J L _ , xb*[exp(c2/A,T)-l]*ir m3'sr
with
Ci = 2*hc and c = hc/k. e(X,T) is the spectral emissivity
of tungsten. Using the data of J.C. de Vos [9] e(x,T) is approximated
by
e{x,T) = aiT + a2 - A^a3+ai»T) .
The values of the parameters mentioned are:
ai = 0.877*10-5 ; a2 * 0.5125 ; a3 - 0.496*10-" ; a* = 0.4325xl0"7;
Ci* a 1.1911*l0llt ; c 2 • 0.14388*108 ,
giving BL(*,T) in W/mm2»sr'nm with \ in nm and T in K.

- 2 7 -
The c a l i b r a t i o n f a c t o r s are averaged in such a way t h a t CK " Y D - YN,
r e s u l t i n g i n a Thomson -sca t t e red spec t rum TH(X) d e r i v e d f rom the
s i g n a l s YT:
TH(A) = C y ^ I T . " Y ü N ) - YT - YN ,
whe.-e YD* i s the LEO-s igna l at the moment o f t he T e -measurement .

-28-
9. OPTICAL PROPERTIES OF THE POLYCHROMATOR
9.1 Measured values of the central wavelength and the bandwidth
The central wavelength (CWL) and the bandwidth (BW) for each
channel are calculated from the ray-tracing results: total magnifica
tion, image blur, and slit width. These properties were also measured
as follows: With a tungsten filament as a source, the light of the
wavelength channel considered is led to a 0.5 m Jarrell-Ash mono-
chromator by a set of quartz fibres. An acrylic light guide placed at
the p.m. position serves to mix the rays entering under different
angles and at different positions in such a way that the fibre bundle
samples a representative part of the amount of light.
In Table 6 the calculations and measurements are summarized,
showing a very good agreement between designed and measured values.
TABLE 6
Channel
No.
Design values (nm) Measured values (nm) Channel
No. CWL FWHM BW(10*) CWL FWHM BW(10X)
- 10
- 8
- 4
0
+ 4
+ 8
+ 10
601.8
631.3
670.7
694.3
716.1
754.0
777.0
14.40
14.79
6.33
4.53
6.10
11.05
11.55
17.66
17.68
8.84
7.00
8.56
15.10
14.29
600.6
630.9
670.9
694.3
716.9
754.8
777.9
14.05
15.27
6.23
4.68
6.41
11.91
11.43
18.34
18.38
9.07
6.93
8.84
14.73
13.17
9.2 Transmission
An optical sphere is used to measure the transmission.
The sampled light is again led to the 0,5 m Jarrell-Ash monochromator,
which is set at the CWL of the channel considered. The transmission is
found from the signal ratio sampled just behind the entrance slit and
at the photomultiplier position.
-29-
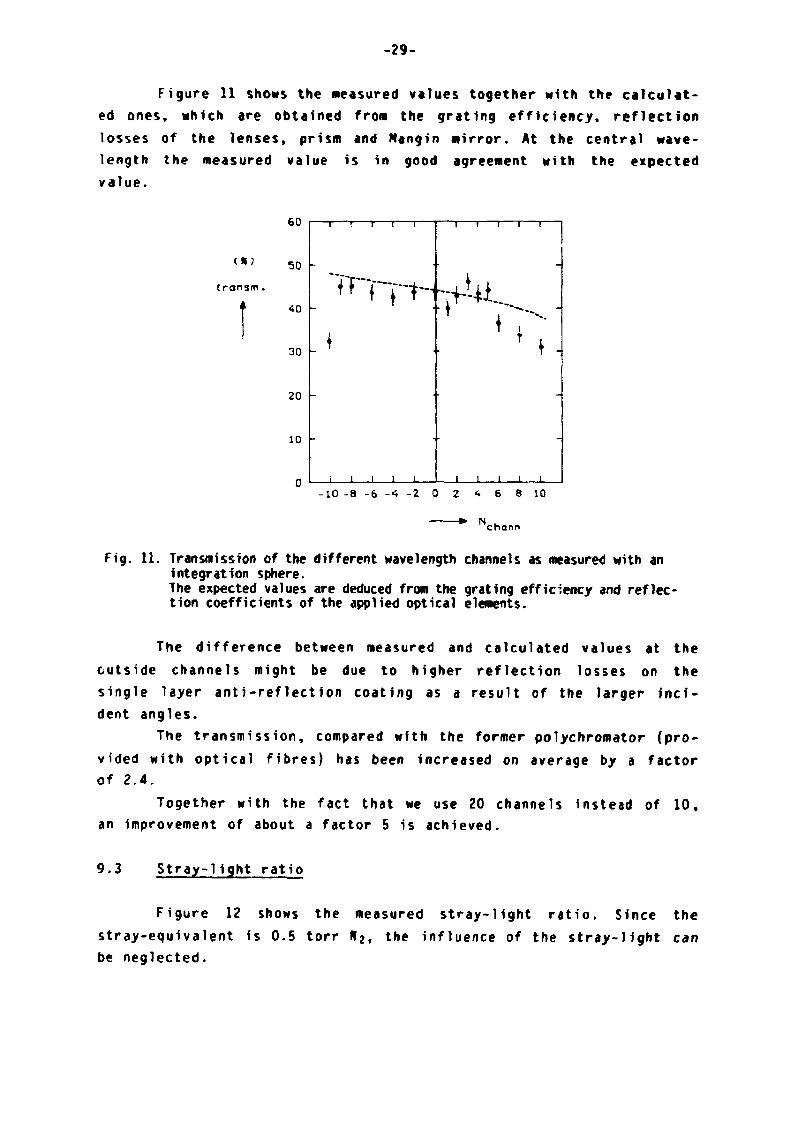
Figure 11 shows the measured values together with the calculat
ed ones, which are obtained from the grating efficiency, reflection
losses of the lenses, prism and Mangin mirror. At the central wave
length the measured value is in good agreement with the expected
value.
t r o n s m .
• 10 - 8 8 10
-+• N chann
Fig. 11. Transmission of the different wavelength channels as measured with an integration sphere. The expected values are deduced from the grating efficiency and reflection coefficients of the applied optical elements.
The difference between measured and calculated values at the
outside channels might be due to higher re f lec t ion losses on the
single layer an t i - re f l ec t ion coating as a result of the larger i n c i
dent angles.
The transmission, compared with the former polychromator (pro
vided with optical f ibres) has been increased on average by a factor
of 2.4.
Together with the fact that we use 20 channels instead of 10, an improvement of about a factor 5 is achieved.
9.3 S t ray - l igh t ra t io
Figure 12 shows the measured st ray- l ight r a t i o . Since the stray-equivalent is 0.5 torr N2 , the influence of the s t ray - l ight can be neglected.

30-
stray-lïght
ratio k
1 t 1 1 1 1 r
O" 4 -
" */ *̂ - +/ >^ -
0 - 5 ^S* "^ +
-
0-6
•
l i
laser wavelength
*
i i i i i
600 620 640 660 680 700 720 740 760
-*• X Cnm)
Fig. 12. Stray-light ratio of the polychromator. The laser wavelength is blocked with a black thread.
Suppose the electron density and temperature are:
n = 5 * 101 8 m-3 and T = 500 eV. e e
The two channels adjacent to the central channel then record a rela
tive signal (normalized to the total amount of Thomson-scattered
light).
+%6A 2
ƒ y ( 0 ) . exp{- (4J-) } dx TH(1) = •\f>\ AX
ƒ" y(0) • exp{- ( £ - H dx
exp{- (£p) } • «*
/? • AX
» 5.88xl0"2 ,
where AX « (Xj-A0) ; 6X = bandwidth ;
&XB = 1.936 /T~ e e
The relative stray-light signal can be written as:
STR(l) » P(str) * R(str) » 0.87 x lpzo

-31-
where P{str) : stray-light equivalent in torr N2; R(str) : stray-light ratio of the polychromator channel; 0.87*1020: conversion factor from torr N2 into eïectr/»3»
thus: STR(l) - 0.5 x 2x10-" x 0.87x10" = ^ ^ . 3
5xl0 1 8
The signal-to-stray-light ratio is therefore: 35 at ne * 5*10 1 8 nr 3. Appropriate measurements can be done with a signal-to-stray-light ratio of 10; so the detection limit will be ne » 1.4*1018 nr 3. Compared to the former instrument, the stray-light ratio has improved by a factor 10 over the entire spectral range.
9.4 Rayleigh scattering
The photomultiplier signals are recorded with integrating ADC's (LeCroy 2249 W, gate time 300 ns, 0.2S pC/count). From Rayleigh scattering on nitrogen (N2) the overall sensitivity is deduced:
970 counts/torr joule. (Note: starting with 5 «J from the laser, about 2.5 J reaches the scat
tering volume; the number of cts/torr.J mentioned is normalized on the energy measured behind the exit tube.)
This sensitivity is in good agreement with the number of photons expected:
do, fs = f \ ' L * Q tf£T x ne * T * 1 4 8 * 1 0 t
w i t h :
f number of scattered photons per torr N2 and per joule f, number of photons in the incident beam 3.5xl018/J. L length of the scattering volume 10*10"3 m. a solid angle 1.96*10-2 sr.
differential Thomson cross-section (for <* = 90°) 8*10-30 m2/sr.
n electron density, 1 torr is equivalent to 0.87x10
da j
do"
20 m-3 m transmission, composed of: polychromator transmission: 0.44 input optics : 0.70
0.31
The central channel is equipped with an EMI photomultiplier, which has a quantum efficiency (QE) of 5.IX at \0. According to the specifications, the gain G * 1.4*105 (operating voltage 0.66 times maximum voltage: 1120 V); thus we find a charge during the laser pulse:

-32-
q = fs«QE»G*e = 1.7»10-10 Coulomb.
So the recorded number of counts is expected to be:
YD = 3 a 680 cts/torr-joule . K 0.25xl0-12
The difference between measured and calculated sensitivity can be ex
plained by an inaccuracy of the gain and of the amount of energy in
the scattering volume.
9.5. Detection limit
The Thomson-scattered spectrum is recorded by means of 10 RCA
C31034 A, 6 RCA C31034 and 4 EHI 9658 BN photomultipl iers having a
quantum efficiency of 18Ï, 12% and 5.IX respectively. So the average
QE is 14X. The statistical fluctuation of the signals recorded will be
due mainly to the quantum noise, which is equal to:
</T~ , if f is the number of photo-electrons, e e
To achieve a relative error of 10%, we need 100 photo-electrons
per channel. Assuming that the scattered photons are equally spread
over the 20 channels, (20*45)/QE = 1.43*10'' photons are needed using
QE - 14%. The detection limit at a laser energy in the scattering
volume of 2.5 J is then:
L d i ^ o ! x 0.87xl020 = 3.3 x 10¹⁸ m'3 . 1.48*105 x 2.5
This limit agrees well with the one deduced from the stray-
light ratio.

-33-
10. CONCLUSION
The 20-channel polychromator for Thomson scattering described
here is suitable to detect electron temperatures in the range of 10 to
2000 eV at a minimum density of 3*1018 m~3. This low detection limit
has been achieved by the application of wavelength selection mirrors
instead of fibre optics, resulting in a 2.5 times higher transmission
and a 10 times lower stray-light ratio. These properties make the in
strument very suitable to study distortions in the velocity distribu
tion of the electrons. An example of an observed spectrum is shown in
Fig. 13.
Z 70
i 60
| 50 -CI
40 -
30
20
30
550
V 1 1 reiatiuistic shift "" f»8nm
700
—*• X
750
C nm 3
100 200 300 "400
*• t Cms)
Fig. 13. File: B301O10.O04 Determined values: Te = 833 t 11 eV, ne = (5.09 ± O.08) * 1019 nr3, total number of counts: 2270, laser energy in the scattering volume: 2.0 joule. Position: r = +5 mm. Time : t « 3.0 ms. o Thomson-scattered light signal. • Plasma light signal.

-34-
centraJ wavelength
A = 602 nm
A= 777 nm
Photograph No. 4. Wavelength selection mirrors.
pneumatic shutter (open)
p.m. lens
pneumatic shutter (closed)
Photograph No. 5. Photomultiplier tubes and lenses. Each photomultiplier is protected by means of a pneumatic shutter.
-35-
ACKNOWLEDGEMENT
The author wishes to thank G.M.D. Hogeweij for his assistance
in developing the computer program, A.H. Kragten for his great con
tribution in the construction of the spectrometer and 0. Oepts who
critically read the manuscript.
This work was performed as part of the research programme of
the association agreement of Euratom and the "Stichting voor Fundamen
teel Onderzoek der Materie" (FOH) with financial support from the
"Nederlandse Organisatie voor Zuiver-Wetenschappelijk Onderzoek" (ZWO)
and Euratom.
REFERENCES
[l] A.W. Kolfschoten and H. de Kluiver, Proc. 3rd Joint Grenoble-
Varenna Int. Symp. on Heating in Toroidal Plasmas, Grenoble 1982.
[2] N. Yousef and H. de Kluiver, 4th Int. Symp. on Heating in Toroidal
Plasmas, Rome, March 1984.
[3] A.W. Kolfschoten, Rijnhuizen Report 82-141 (1982).
[4] M.J. Riedl, Appl. Opt., Vol. 1^ (1974) 1690.
[5] C.J. Barth, A 20-channel spectrometer for Thomson-scattered light,
Design considerations of the optical system; Internal Report
I.R. 82/028 (1982).
[6] W. Brouwer "Matrix Methods in Optical Instrument Design",
Benjamin, New York (1964).
[7] F.A. Jenkins and H.E. White, "Fundamentals of Optics", 3rd Ed.
McGraw Hill, New York (1957) page 123.
[8] C.J. Barth and F.Th.M. Koenen, "The Application of gated RCA
C31034A Photornultipliers for Thomson Scattering, Internal Report
I.R. 82/065 (1982).
[9] J.C. de Vos, Physica 20 (1954) 690.