1.6 comparative assessment and decision support system …
TRANSCRIPT

48
1.6 Comparative Assessment and Decision Support System for Strategic Military Airlift Capability
Comparative Assessment and Decision Support System for Strategic Military Airlift Capability
John Salmon, Curtis Iwata, Dimitri MavriS and Neil Weston Georgia Institute of Technology
[email protected], [email protected], dimitri. [email protected], neil. [email protected]
Philip Fahringer Lockheed Martin Company
philip.fahringer@/mco.com
ABSTRACT
The Lockheed Martin Aeronautics Company has been awarded several programs to modernize the aging C-S mil itary transport fleet. In order to ensure its continuation amidst budget cuts, it was important to engage the decision makers by providing an environment to analyze the benefits of the modemization program. This paper describes an interlace that allows the user to changEl inputs such as the scenario airfields, take-off conditions, and reliability characteristics. The underlying logistics surrogate model was generated using data from a discrete-event simulation. Various visualizations. such as intercontinental flight paths illustrated in 30, have been created to aid the user in analyzing scenarios and pertorming comparative assessments for various output bgistics metrics. The capability to rapidly and dynamically evaluate and compare scenarios was developed enabling real·time strategy exploration and trade-oils.
NOMENCLATURE
AMP APOD APOE CDF CONUS DES MOG M&S NN PDF RERP
SAC SME
Avionics Modernization Program Aerial Port of Debarkation Aerial Port of Embarkation Cumulative Distribution Function Continental United States Discrete Event Simulation Maximum on Ground Modeling and Simulation Neural Network Probability Density Function Reliability Enhancement and Re-Engining Program Strategic Airlift Comparison Subject Matter Expert
1 INTRODUCTION
The C-5 Galaxy has been an integral logistics component of the US military since its introduction in 1970. The C-5 is the largest transport aircraft, and it is the only heavy-cargo aircraft capable of transporting the military's largest and heaviest combat equipment including tanks, helicopters, and scissor bridges [1] . Its unique configuration also allows for rapid loading and off-loading
of equipment and cargo [2 , 3J. The C-5 has served an important role in strategic airlift missions and force projection.
Two modernization programs were initiated to improve the performance of the C-5 aircraft. The Air Force's C-5 Avionics Modernization Program (AMP) modernizes the aircraft wilh a modern digital equipment or "glass cockpit" , an all-weather flight control system, and Global Air Traffic Management, navigation and safety equipment. The C-5 Reliability Enhancement and Re-engining Program (RERP) replaces the propulsion system and modifies the mechanical , hydraulic, avionics, fuel , and landing gear systems [4J. These two programs aim to improve the reliability and availability of the C-5 fleet in the coming years.
The two programs have faced scrutiny and changes due to delays and cost growth. After a legislative review, the new contract for the RERP allows for only 52 of the 111 C-5 aircraft to receive the modifications (5). Lockheed Martin Company, which has won both contracts, has made efforts to

49
emphasize the need to keep the programs in place and to promote the need to upgrade the remaining fleet.
One such effort described in this paper is the development of the Strategic Airlift Comparison (SAC) tool. The SAC tool shows the logistical advantage of having a C-5M fleet over a corresponding C-5A fleet. The tool leverages modeling and simulation (M&S) to present a convincing argument in support of the modifications in a format that can be easily understood by decision makers such as government officials and mititary officers who may need additional support for their decision making process.
The paper begins with the development of the M&S environment to support the evaluation and decision making process of the C-5 modernization programs. A discrete-event simulation (DES) was created to generate the data for metrics including time to close a specific mission scenario and fuel consumption. The second half of the paper describes the interface which allows the user to display and manipulate the data in order to make comparisons between the different platforms. Different types of visualizations are also presented and discussed. The paper concludes with several examples of how this tool can be used to make comparisons.
2 DECISION MAKING AND M&S
Trends in cost overruns in defense acquisition have put accountability as a priority. Acquisition decisions must be traceable and should be backed by sound technical analysis. Since, decision makers often require insight into the technical details of the problem, they typically consult subject matter experts (SME). However, even when the SMEs are included in the discussions, there are situations when the experience of the SMEs is not adequate to answer speculative questions and ''what if scenarios".
For these questions, M&S can provide valuable insight into the problem at affordable costs and within a limited time frame (6) .
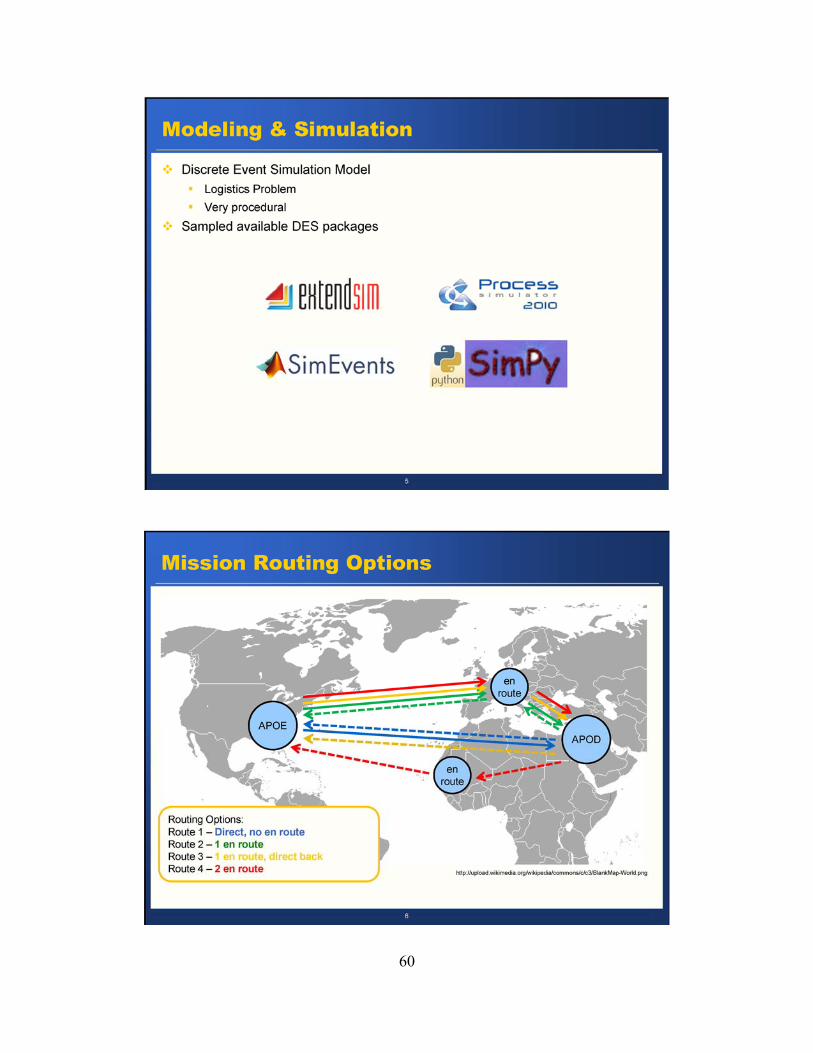
2.1 Discrete Event Simulation
A discrete-event simulation (DES) was created to simulate the pertormance of a C-5 fleet. The DES models a system as a series of events, and this is well-suited for a logistics problem. For example, an aircraft arriving at an airport is an event, and each of these actions can be modeled per aircraft. Then a group of aircraft can be simulated together to gain insight on how an entire fleet would periorm.
Several DES programs were examined including ExtendSim, Process Simulator, SimEvents and SimPy. ExtendSim and Process Simulator are commercial DES packages, and the users graphically arrange the process elements and the linkages [7, 8]. Process Simulator also requires Microsoft Visio to run. SimEvents is a DES package for MATLA8 and also uses a graphical interface [9] . Simulation in Python (SimPy) is an object-oriented DES package written in the Python programming language (10). It is open source and executes quickly; however, the set up and the outputs of the simulation are not graphical. For this project, SimPy was selected for its flexibility, fast run time, and availability.
The selection of SimPy proved to be prudent when the simulation runs had to be scaled up and distributed over several workstations. The open source nature allowed the team to run cases on different machines without worrying about licensing issues. Furthermore, multithreading was enabled using the Parallel Python package, allowing the program to use all processor cores.
2.2 Simluation Set Up
The simulation captures a simple logistics scenario of transporting cargo from the

50
Are there minions
tolly?
" utilization moM !h~n te~~?
f ly Misoion
for each ba .. : Bne RuQurce
Typeol Cps W~;tr ...... Bre~k Rate
MOO
" .. mssion dor.e?
'"'
I 'm I Operations
I ( S!~n )
• II ArmU! Bue I II WaH for S!~tion I II """"' ",. I II Cheeltlo< I
Failure
II Wd lor tunwar I (Smin per a le)
II Leave B.ase I I t '"' )
Figure 1. Simulation Flow Block Diagram
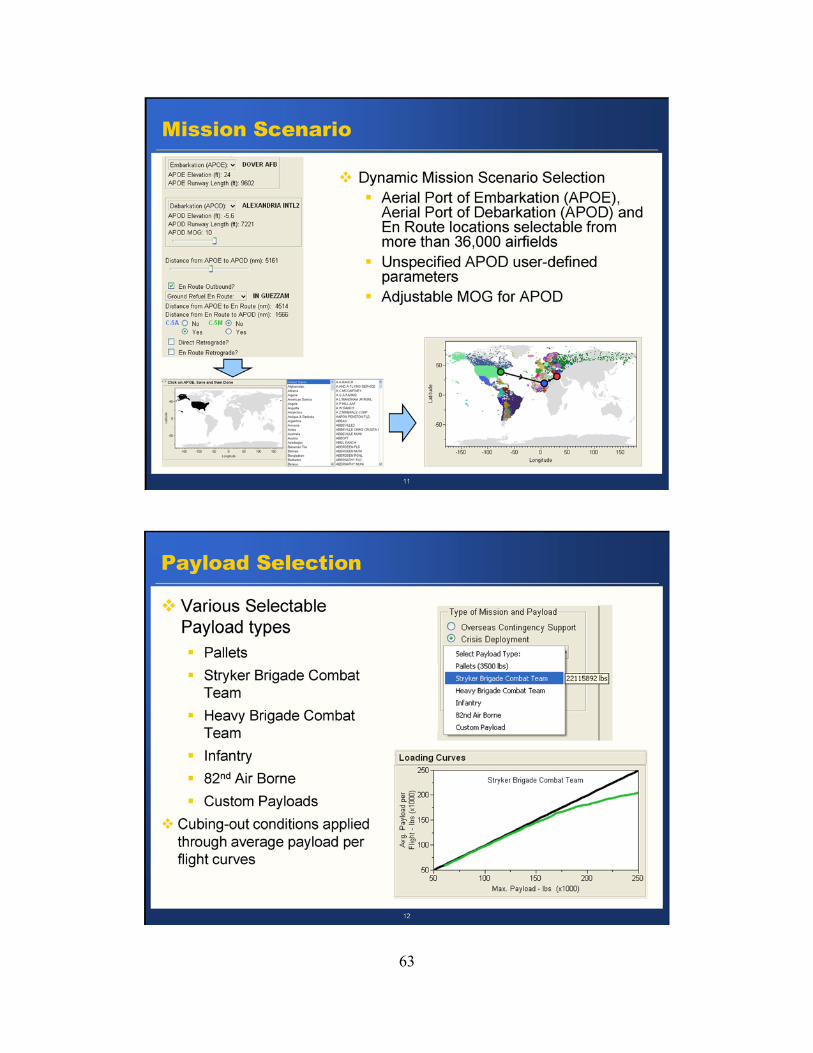
aerial port of embarkation (A POE) to the aerial port of disembarkation (APOD). The simulation flow is outlined in Fig. 1.
There are four different routing options available which are the following: 1) direct flighl belween APOE and APOO, 2) en roule location for forward flight with direct return flight, 3) same en route location for forward and return flights, and, 4) two different en route location for forward and return flights.
The simulation begins with all of the aircraft at the APOE, and it ends when the last aircraft returns back to the APOE. At each airfield, a maximum on ground (MOG) constraint limits the number of aircraft that can be serviced at any given time. Thus, if an airfield has a MOG of three and has five aircraft on site, two of the aircraft would have to wait on the side of the tarmac until a station opens up.
In the service station, the aircraft waits for a set amount of time for the scheduled activity at the airfield, such as loading cargo and refueling. Time is dependent on the type of aircraft and activity. The ground times listed in the AFPAM10-1403 were used [3] .
After the servicing is completed, a random probabilistic algorithm is used to determine if the aircraft had suffered any minor failures during its previous flight and how long it would take to repair it. All failures are assumed to take no more than 72 hours, and the repair time of each failure is determined based off of a pre-defined random distribution. The aircraft then prepares for take-off, and only one aircraft can occupy the runway. If there are multiple aircraft ready to take-off, they must wait for their turn.
The flight times are calculated based on the aircraft's block speed. Within the simulation , the same type of aircraft will fly the equivalent distance in the same amount of time. The distances have been calculated using the great circle distance formula, and the variability of flight times due to weather and other factors were not incorporated into this simulation.
Utilization is a metric of how hard the crew works, and this is typically calculated as an average amount of hours flown per day. For the simulation, the utilization was calculated as the ratio of the total flight time, from

51
leaving the APOE to returning back to the APOE, and the total amount of time spent since leaving the APOE. A cap of 16 hours was placed, and if any aircraft exceeded this at the end of its mission , it was grounded before returning to service at the APOE.
2.3 Model Inupts
The DES does not require the physics of the problem, such as the amount of cargo and the amount of fuel consumed. Much of this information was calculated beforehand, and the model was abstracted out, reducing the number of inputs and increasing its extensibility to other aircraft. The input variables into the DES are listed in Table 1.
Table 1. SimPy Model Input Var iables
SimPy Inputs Min Max
Type of Aircraft 0 Fleet Size 1 70
Number of Flights 1 1000 Routing 1 4
Flight Time: Leg 1 30 1200 Flight Time: Leg 2 30 1200 Flight Time: Leg 3 30 1200 Flight Time: Leg 4 30 1200
Repair Prob: a to 4 hrs 0 1 Repair Prob: 4 to 12 hrs 0 1
Repair Prob: 12 to 24 hrs 0 1 Break Rate 0.01 0.6
MOG: APOE 15 MOG: APOD 15
MOG: En Route 1 15 MOG: En Route 2 15
2.4 Model Limitations
The DES model currently supports the C-5 and the C-17. Adding other types of aircraft is possible as long as the ground servicing times are available. However, this only pertains to running the model itself, and the payload-range curve, block speed and fuel burn are needed to be useable with the interface.
Another current limitation is that the model has only four options for routes. In reality, there may be more airfields involved in each mission. For example, refueling usually does not occur at the APOD if it is in a hosti le location ; a recovery airfield close to and safer than the APOD would be involved. Including more airfields makes the routing more complicated and increases the number of variables.
There have also been discussions about extending capability to hybrid fleets where different types of aircraft would fly different legs of the mission. For example, the C-5 could fly transatlantic flights, while the C-17 could fly the shorter legs to different airfields in the region.
2.5 Simulation Runs
Over 50,000 cases were used to populate the design space. A combination of central composite and space filling designs were used to generate the cases to run . Each case was repeated 1000 times in order to generate the distribution due to the variability of failure events and repair times. The runs were allocated across several workstations.
Each case of a 1000 runs took anywhere from a few seconds to over 30 seconds depending on the input parameters, and the final set of data took a few days to run across several machines.
2.6 Surrogate Modeling
Surrogate models of the DES model were created to avoid carrying the large data set and to enable interactivity with the of the interface.
The design space was nonlinear, and the time to close increased dramatically as the fleet size decreased to one aircraft. A neural network (NN) model was fitted to the data, but the NN model outputs at the edges had poor fits due to the nonlinearity of the data. To resolve this issue, a separate NN was
52
'-----_ ... - '-- '-- ._.---,,-- _._ .. ---.... -------- :..:::::.--_._-_._- ~-~ -=..-=':.: .. - E.E? __ ----_ ... -. -. -_. __ .. I: I:
==:.."::- ----_. --.. -.---_ ... __ . --
.... __ _Oil.
-~- -,.-._--"-': .. ... ..
. _--'-- ..... iii _J. ............ . _._- --
I: J:-._ ...... ~ -- ~ '--. -_ ...... ... -.. _--_.---, - - ... .. .... .. - . •• "V---II ., .. ... ... ... ..
--~.-
'-. - - I .
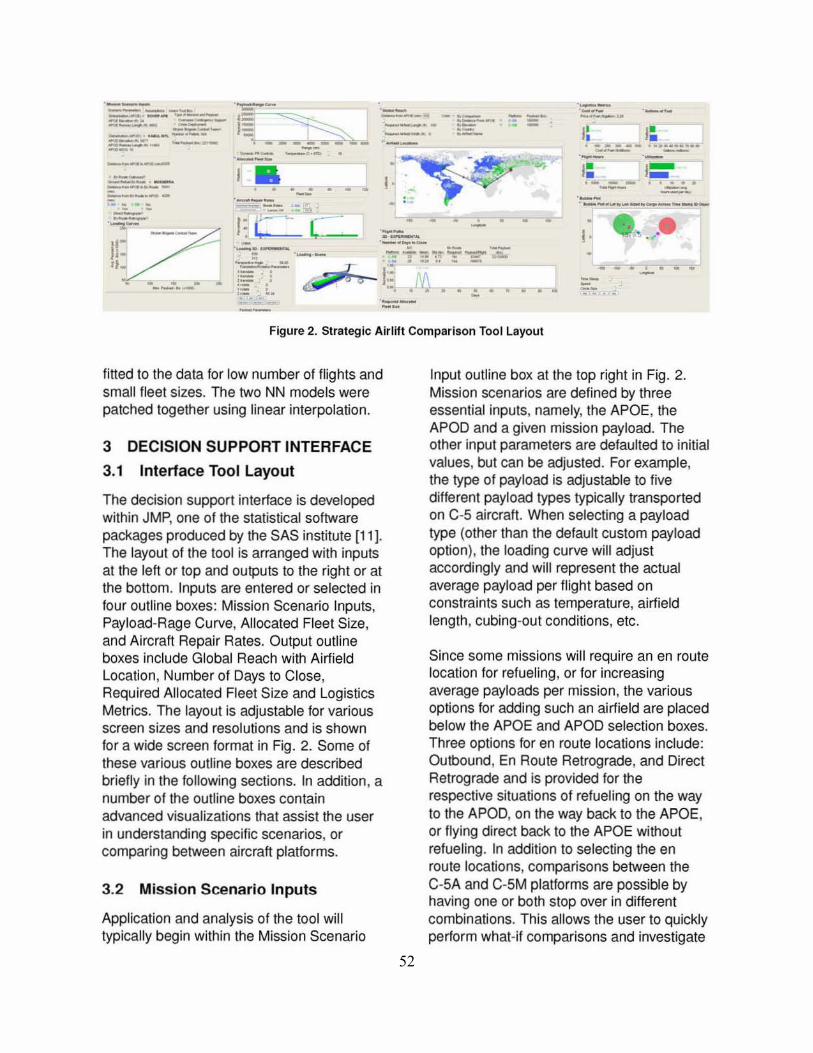
---Figure 2. Strategic Air lift Comparison Tool Layout
fitted to the data for low number of flights and small fleet sizes. The two NN models were patched together using linear interpolation.
3 DECISION SUPPORT INTERFACE
3.1 Interface Tool Layout
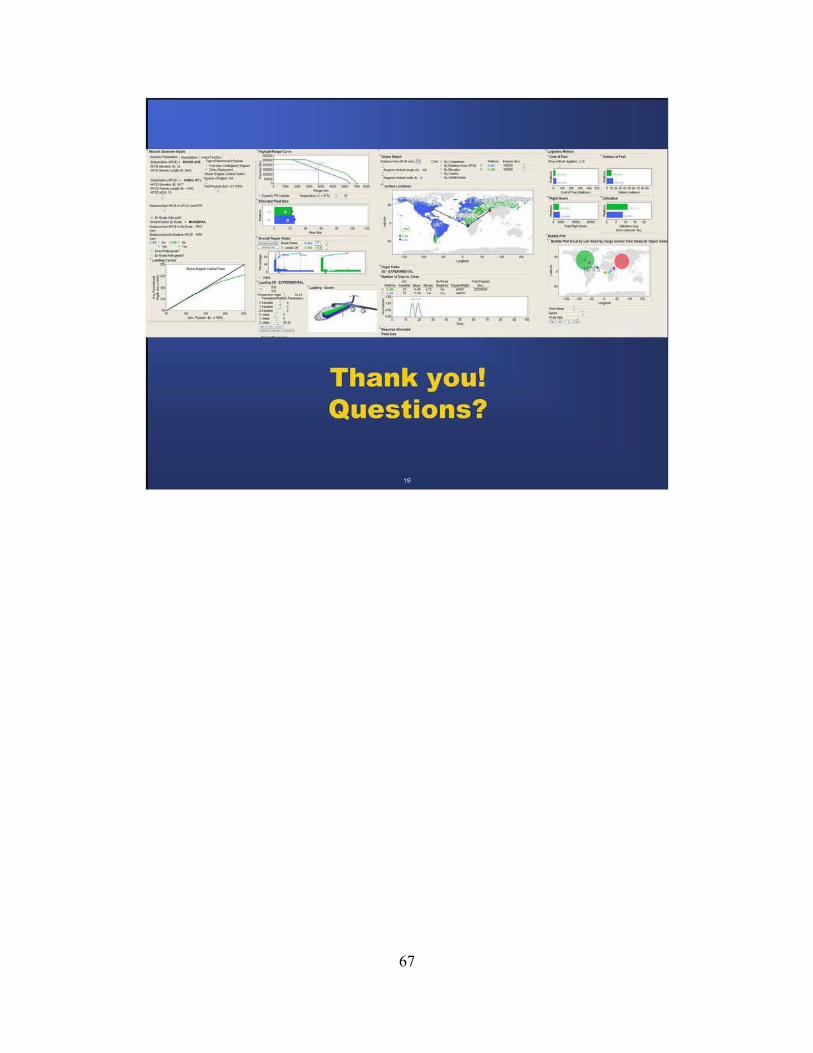
The decision support interface is developed within JMP, one of the statistical software packages produced by the SAS institute [111. The layout of the tool is arranged with inputs at the left or top and outputs to the right or at the bottom. Inputs are entered or selected in four outline boxes: Mission Scenario Inputs, Payload-Rage Curve, Allocated Fleet Size, and Aircraft Repair Rates. Output outline boxes include Global Reach with Airfield Location, Number of Days to Close, Required Allocated Fleet Size and Logistics Metrics. The layout is adjustable for various screen sizes and resolutions and is shown for a wide screen format in Fig. 2. Some of these various outline boxes are described briefly in the following sections. In addition, a number of the outline boxes contain advanced visualizations that assist the user in understanding specific scenarios, or comparing between aircraft platforms.
3.2 Mission Scenario Inputs
Application and analysis of the tool will typically begin within the Mission Scenario
Input outline box at the top right in Fig. 2. Mission scenarios are defined by three essential inputs, namely, the APOE, the APOD and a given mission payload. The other input parameters are defaulted to initial values, but can be adjusted. For example, the type of payload is adjustable to five different payload types typically transported on C-S aircraft. When selecting a payload type (other than the default custom payload option), the loading curve will adjust accordingly and will represent the actual average payload per flight based on constraints such as temperature, airfield length, cubing-out conditions, etc.
Since some missions will require an en route location for refueling, or for increasing average payloads per mission, the various options for adding such an airfield are placed below the APOE and APOD selection boxes. Three options for en route locations include: Outbound, En Route Retrograde, and Direct Retrograde and is provided for the respective situations of refueling on the way to tile APOD, on the way back to the APOE, or flying direct back to the APOE without refueling. In addition to selecting the en route locations, comparisons between the C-5A and C-5M platforms are possible by having one or both stop over in different combinations. This allows the user to quickly perform what-if comparisons and investigate

53
the advantages and disadvantages of stopping to refuel at different locations, for different distances, among the various constraints.
The two other tabs within this outline box, (Le. Assumptions and Users Tool Box) allow access to additional settings and constraints for the airfields and visualizations respectively. Within the Assumptions tab, users can modify the MOG for each airfield and within the Users Tools Box, the layout can be adjusted, colors can be changed and example Bubble Plots can be created which are described later.
3.3 Payload-Range Curve, Fleet Size and Repair Rates
The payload-range (PR) curve displayed corresponds with the selected APOE, by making use of the elevation and airfield length data at that particular location. Furthermore, in calcu lating the PR curve the ambient temperature at the APOE can be set from 5 to 40 °C making the curve dynamic for this temperature range. Other settings can account for variable reserve fuels and minimum payload per flight requirements set by toggling the Dynamic PR Controls check box.
The fleet size for each of the C-5 platforms is entered using an interactive bar chart within the Allocated Fleet Size outline box. The values themselves are both linked and constrained in that there are on ly 59 C-5As currently available, and only 111 C-5Ms possible for allocation if all 59 C-5As, and the other 52 C-5B and Cs were modified. This useful technique keeps scenarios and comparisons as defined by the user within the realm of possibility.
The Aircraft Repair Rates outli ne box allows the user to adjust reliability parameters for the aircraft. First, break rates, defined as the percentage of flights that require repair (and therefore a delay) for each leg of the mission are set for each platform in a range from 0 to
60%. Next the probability for each of the four categories of repair or delay times are set. The percentage of time that repai rs will fall into one of the fou r delay time categories, (i.e. 0-4hrs. 4· 12hrs. 12·24hrs. and 24-72hrs) are positioned by the user dragging the marker for each category's bar, or by adjusting the cumulative distribution function, which are internally linked.
The average repair time for the given distribution is indicated at the bottom and is used to generally compare a platform's recoverability. For example, a platform's lower average repair time, compared to the other will be more recoverable, characterized by low repair times, even with a higher break rate. The overall reliability is thus a function of the repair times for each category and the break rate which are used with in and surrogate model of the the discrete-event simulation.
3.4 Number of Days to Close and Logistic Metric Outputs
Although there are two types of missions selectable within the scenario inputs ou tline box, namely, "Overseas Contingency Support" and "Crisis Deployment", the user will be more often interested in the latter. Thus, the output metric of interest is the number of days to close a mission or the time required to deliver the specified total mission payload to the APOD. The mean, standard deviation and shape of the time to close distribution is presented in the table and graph within the Number of Days to Close outline box. These output metrics are updated in real-time by changing any of the other input parameters discussed previously. Any modification to the scenario, fleet size, or reliability parameters will automatically rerun a surrogate model to recreate the time to close distribu tion and other output logistic metrics.
Other logistic metrics, including cost and gallons of fuel, flight hours, and utilization
54
are traded against the time to close output metric. Clearly, closing the mission as soon as possible is desirable, but the cost of fuel and flight hours (Le. a representation of human resources required) may be too. Similarly, the total mission payload could be delivered in a very short amount of time by increasing the fleet size, but this too may be impractical or even impossible. Thus, the trade-ofts and sensitivities between output metrics, but also between inputs and outputs, becomes examinable.
3.5 Airfield Selection and Filtering _~R .... ---~~ -.-- _._-J 0._ .. __ I!I < .. , ... .. __ ,-.. _ 0 .. _ I!I , . , ... ..
J- 0 .. _ ___ .... 0 .. __
, .. _ .... -" ..
I
-
.. - - ~ .. ..;.. .. '. "
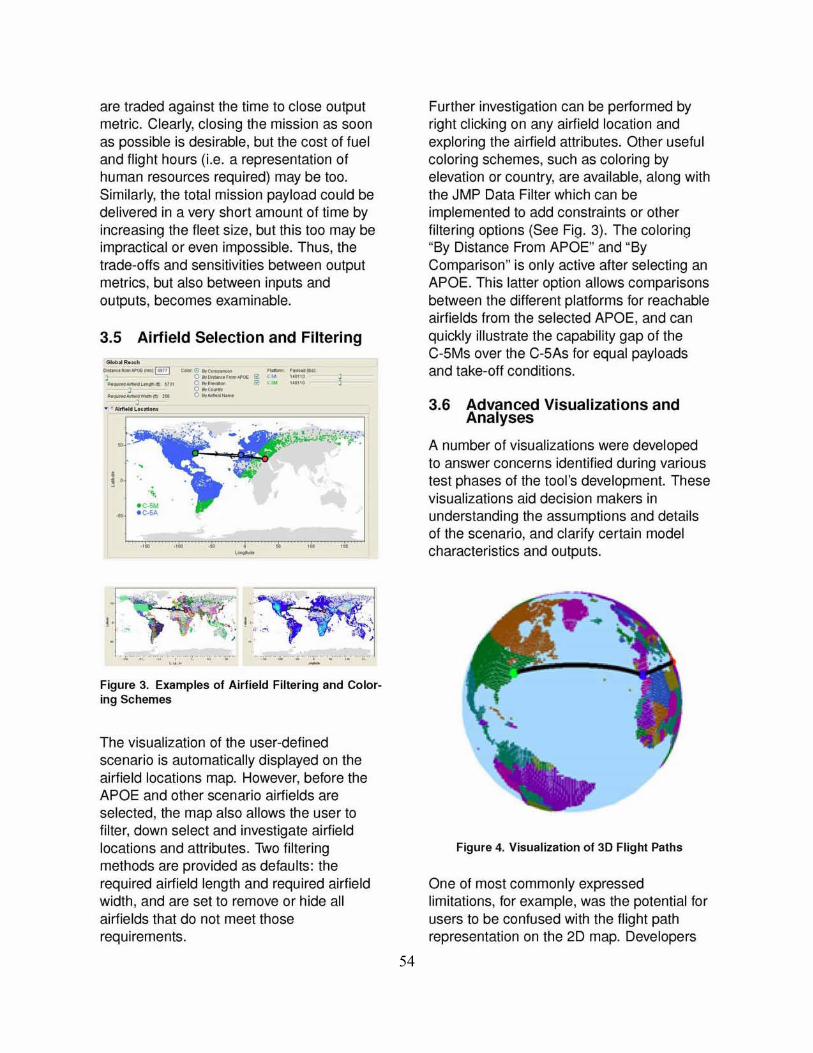
Figure 3. Examples of Airfield Filtering and Coloring Schemes
The visualization of the user-defined scenario is automatically displayed on the airfield locations map. However, before the APOE and other scenario airtields are selected, the map also allows the user to filter, down select and investigate airtield locations and attributes. Two fil tering methods are provided as defaults: the required airtield length and required airfield width , and are set to remove or hide all airfields that do not meet those requirements .
Further investigation can be pertormed by right clicking on any airtield location and exploring the airtield attributes. Other useful coloring schemes, such as coloring by elevation or country, are available, along with the JMP Data Filter which can be implemented to add constraints or other filtering options (See Fig. 3). The coloring "By Distance From APOE" and "By Comparison" is only active after selecting an APOE. This latter option allows comparisons between the different platforms for reachable airfields from the selected APOE, and can quickly illustrate the capability gap of the C-5Ms over the C-5As for equal payloads and take-off conditions.
3.6 Advanced Visualizations and Analyses
A number of visualizations were developed to answer concerns identified during various test phases of the tool's development. These visualizations aid decision makers in understanding the assumptions and details of the scenario, and clarify certain model characteristics and outputs.
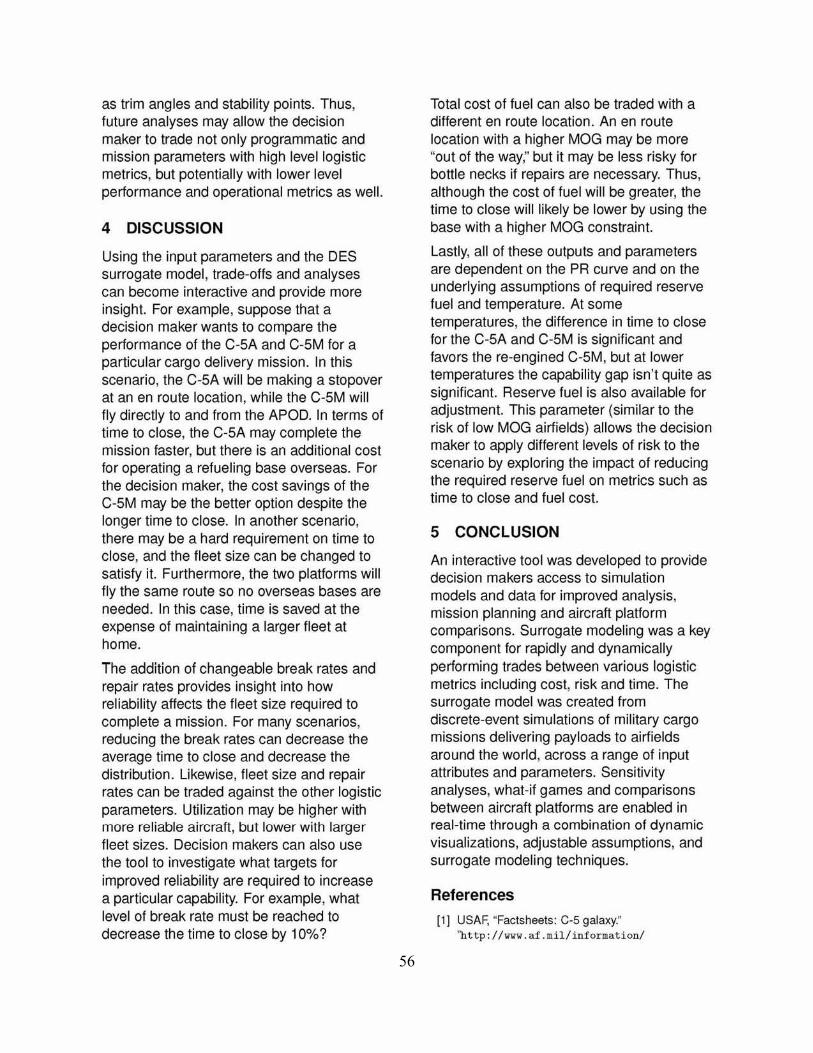
Figure 4. Visualization of 3D Flight Paths
One of most commonly expressed limitations, for example, was the potential for users to be confused with the flight path representation on the 2D map. Developers

55
of the tool decided that a simple node and edge diagram for the flight paths (with only straight edges) would be most clear in a graphical representation of the mission scenario. The disadvantage of such a decision is the possible confusion of the actual flight path taken by aircraft since the true path on a flat earth model will be curved along the great circle distance between two points. To avoid this possibility, the actual path taken between two airfields is redrawn onto a 3D earth model as shown in Fig. 4.
The advantages of this visualization include mission leg distances that are relatively consistent with each other (not always the case for projections onto a 20 map) and the rapid identification of airspace violations against countries or other political constraints. Enhancements to this visualization will include analysis of how the flight path will circle around a particular nation, which will not allow C-S aircraft from entering its airspace and the resultant impact on the output and logistic metriCS.
•
! . • ••• .,.. ·'11 '* • .. ,. ' .. -
Figure 5. Bubble Plot Animation Showing the Movement of Payload
To assist decision makers in understanding the delivery of the mission payload over time and how aircraft are delayed and interact with each other at the various airfields, a Bubble Plot representation of the mission can be executed from the Users Tool Box tab in the Mission Scenario Inputs outline box (See Fig. 5).
The location of all aircraft and the current location of the payload (i.e. at the APOE , in
flight or at the APOD), with relative time stamps can be explored at all times during the mission. Furthermore, comparisons in time of different scenarios, fleet sizes, etc. can be performed with more than one Bubble Plot. To enable this comparison, the Bubble Plot is simply executed again after a change in the mission scenario (such as a new en route location) , and then setting the speed and time stamp values within the plots consistently. Exploring the delivered payload over time can be helpful in assisting decision makers to identify the impact of parameter changes on time to close or other metrics when the scenario is changed at various times in the mission.
Figure 6. 3D Loading Volume Representation (blue: C-SA, green: C-SM)
Another visualization, currently in the experimental phase of development, is a 3D representation of the loading volume of the two platforms (See Fig. 6). When adjusting the temperature of the PR curve or changing the location of the APOE , the maximum possible payload weight will fluctuate in order to satisfy the constraint of the mission scenario and the platform itself. To compare the cargo transporting holding capabilities of the C-SM over the C-SA, a volume representing the percentage of the maximum payload weight is projected within the cargo bay of the aircraft. These volumes represent the weight percentage and currently not the actual space used by any particular payload type. Potential enhancements to this visualization include detailed cargo characterization and how loading schemes affect the logistic metrics and other performance and aerodynamic metrics such
56
as trim angles and stability points. Thus, future analyses may allow the decision maker to trade not only programmatic and mission parameters with high level logistic metrics, but potentially with lower level performance and operational metrics as well.
4 DISCUSSION
Using the input parameters and the DES surrogate model, trade-offs and analyses can become interactive and provide more insight. For example, suppose that a decision maker wants to compare the performance of the C-SA and C-SM for a particular cargo delivery mission. In this scenario, the C-SA will be making a stopover at an en route location, while the C-SM will fly directly to and from the APOD. In terms of time to close, the C-SA may complete the mission faster, but there is an additional cost for operating a refueling base overseas. For the decision maker, the cost savings of the C-SM may be the better option despite the longer time to close. In another scenario, there may be a hard requirement on time to close, and the fleet size can be changed to satisfy it. Furthermore, the two platforms will fly the same route so no overseas bases are needed. In this case, time is saved at the expense of maintaining a larger fleet at home.
The addition of changeable break rates and repair rates provides insight into how reliability affects the fleet size required to complete a mission. For many scenarios, reducing the break rates can decrease the average time to close and decrease the distribution. Likewise, fleet size and repair rates can be traded against the other logistic parameters. Utilization may be higher with more reliable aircraft, but lower with larger fleet sizes. Decision makers can also use the tool to investigate what targets for improved reliability are required to increase a particular capability. For example, what level of break rate must be reached to decrease the time to close by 10%?
Total cost of fuel can also be traded with a different en route location. An en route location with a higher MOG may be more "out of the way," but it may be less risky for bottle necks if repairs are necessary. Thus, although the cost of fuel will be greater, the time to close will likely be lower by using the base with a higher MOG constraint.
Lastly, all of these outputs and parameters are dependent on the PR curve and on the underlying assumptions of required reserve fuel and temperature. At some temperatures, the difference in time to close for the C-SA and C-SM is significant and favors the re-engined C-SM, but at lower temperatures the capability gap isn 't quite as significant. Reserve fuel is also available for adjustment. This parameter (similar to the risk of low MOG airfields) allows the decision maker to apply different levels of risk to the scenario by exploring the impact of reducing the required reserve fuel on metrics such as time to close and fuel cost.
5 CONCLUSION
An interactive tool was developed to provide decision makers access to simulation models and data for improved analysis, mission planning and aircraft platform comparisons. Surrogate modeling was a key component for rapidly and dynamically performing trades between various logistic metrics including cost, risk and time. The surrogate model was created from discrete-event simulations of military cargo missions delivering payloads to airfields around the world, across a range of input attributes and parameters. Sensitivity analyses, what-if games and comparisons between aircraft platforms are enabled in real-time through a combination of dynamic visualizations, adjustable assumptions, and surrogate modeling techniques.
References
[11 USAF, "Factsheets: C-S galaxy." 'bttp:/!vww.af.mil /information!
57
factsheets/factsheet. asp?id"S4", June 2009.
[2) GlobalSecurity, "CoS galaxy." lhttp://www.globalsGcurity.org/mil itary/ systems/aircraft /c-5 . htm", April 2006.
[3] USAF, ~Air force pamphlet 10-1403: Air mobility planning factors," 2003.
[4] GAO, ~Defense acquisitions. assessments of selected weapon programs," Tech. Rep. March, Government Accountability Office, 2009.
[S} C. Bolkcom and W. Knight, "Strategic airlift modernization: Analysis of C-S modernization and C-17 acquisition issues," tech. rep., Congressional Research Service, 2008.
[5} M. Semini, H. Fauske, and J. O. Strandhagen, "Applications of discrete-event simulation to support manufacturing logistics decision-making: a survey," in Proceedings of the 38th conference on Winter simulation, WSC '06, pp. 1946-1953, Winter Simulation Conference, 2006.
[7) ExtendSim, "Extendsim simulation software by imagine that inc .. " 'bttp:/ /www.extendsim.com/ ... June 2010.
(8] ProModel, "Process simulator." ''http://www . promodel. com/product s/processsimulatorl", June 2010.
(9] MathWorks, "Simevents - discrete event simulation software - simulink." "http: / /www.mathworks.com/products/simeventsl". June 2010.
[10] SimPy, "Simpy simulation package homepage." 'bttp://simpy.sourceforge.net/", June 2010.
[II] SAS, "JMP (John's Macintosh Program)," 2008.
ACKNOWLEDGMENTS
The authors would like to express appreciation for the contributions of Heather Miller, Chris Wyatt, and Walker Armistead for user testing, tool development and Lockheed Martin C-S performance data, respect ively.

58

59
60

61

62
63

64

65

66
67
._--.-.----.. --
::[2J: ---I', ,'-. .. ... . . --.--
• ~.
:; ~~ -- ; •
"&
• • . •
"_.-- '-'--;'-- .-
:_' /~·~r~~~?~~~
._-
I· • •• .,
• • c:::-• -.